the Creative Commons Attribution 4.0 License.
the Creative Commons Attribution 4.0 License.
Limited angle tomography of mesoscale gravity waves by the infrared limb-sounder GLORIA
Jörn Ungermann
Peter Preusse
Erik Kretschmer
Martin Riese
Three-dimensional measurements of gravity waves are required in order to quantify their direction-resolved momentum fluxes and obtain a better understanding of their propagation characteristics. Such 3-D measurements of gravity waves in the lowermost stratosphere have been provided by the airborne Gimballed Limb Observer for Radiance Imaging of the Atmosphere (GLORIA) using full angle tomography. Closed flight patterns of sufficient size are needed to acquire the full set of angular measurements for full angle tomography. These take about 2 h and are not feasible everywhere due to scientific reasons or air traffic control restrictions. Hence, this paper investigates the usability of limited angle tomography for gravity wave research based on synthetic observations. Limited angle tomography uses only a limited set of angles for tomographic reconstruction and can be applied to linear flight patterns. A synthetic end-to-end simulation has been performed to investigate the sensitivity of limited angle tomography to gravity waves with different wavelengths and orientations with respect to the flight path. For waves with wavefronts roughly perpendicular to the flight path, limited angle tomography and full angle tomography can derive wave parameters like wavelength, amplitude, and wave orientation with similar accuracy. For waves with a horizontal wavelength above 200 km and vertical wavelength above 3 km, the wavelengths can be retrieved with less than 10 % error, the amplitude with less than 20 % error, and the horizontal wave direction with an error below 10∘. This is confirmed by a comparison of results obtained from full angle tomography and limited angle tomography for real measurements taken on 25 January 2016 over Iceland. The reproduction quality of gravity wave parameters with limited angle tomography, however, depends strongly on the orientation of the waves with respect to the flight path. Thus, full angle tomography might be preferable in cases in which the orientation of the wave cannot be predicted or waves with different orientations exist in the same volume and thus the flight path cannot be adjusted accordingly. Also, for low-amplitude waves and short-scale waves full angle tomography has advantages due to its slightly higher resolution and accuracy.
- Article
(5543 KB) - Full-text XML
- BibTeX
- EndNote
Gravity waves (GWs) couple the atmosphere vertically by transporting energy and momentum from the surface to altitudes as far as the mesosphere. On this path through the atmosphere, GWs interact with the mean flow and, thus, are responsible for the wind reversal in the mesosphere and influence prominent circulation patterns such as the quasi-biennial oscillation (QBO) of stratospheric tropical winds and the meridional Brewer–Dobson circulation (BDC) in the stratosphere. These circulation patterns can then affect surface temperature and pressure patterns (Kidston et al., 2015; Sandu et al., 2016; Scaife et al., 2016; Sigmond and Scinocca, 2010).
Due to their small scales, GWs are implemented in many climate projection and weather prediction models in the form of simplified sub-models, so-called GW parameterisations. For practical reasons, these parameterisations assume solely vertical propagation of GWs. However, multiple studies highlight the importance of 3-D propagation (Kalisch et al., 2014; McLandress et al., 2012; Preusse et al., 2009; Ribstein and Achatz, 2016; Sato et al., 2009). To gain a better understanding of 3-D propagation and improve the GW parameterisations in models, 3-D measurements of GWs are required (Geller et al., 2013).
The Gimballed Limb Observer for Radiance Imaging of the Atmosphere (GLORIA) can provide such 3-D measurements of GWs (Krisch et al., 2017). GLORIA is an airborne infrared limb sounder, which can change its horizontal viewing direction from 45∘ (right forward) to 135∘ (right backward) with respect to the aircraft's heading (Friedl-Vallon et al., 2014; Riese et al., 2014). If a volume of air is measured from all surrounding angles, it may be reconstructed using tomographic methods (Natterer, 2001). Measuring emitted radiation from all 360∘ around the volume, for instance, by flying in a circle, is called full angle tomography (FAT). This technique improves the horizontal resolution of limb sounders by an order of magnitude (Ungermann et al., 2010b). In contrast to FAT, limited angle tomography (LAT) does not measure the volume from all sides but only from a limited set of angles. Due to the horizontal scanning capabilities of the GLORIA instrument, this is already possible on a linear flight path. However, LAT inversion problems are in general seriously ill-posed (Natterer, 2001).
Since flying in a circular pattern of sufficient size can take more than 2 h, FAT is only suitable for measurements in steady atmospheric states, in which the conditions do not change during the acquisition time. Accounting for the change of the atmosphere during acquisition is possible for trace-gas retrievals by including advection (Ungermann et al., 2011). The temperature structure, however, is governed by a multitude of waves with different spatial and temporal scales. Our a priori knowledge of the temporal development of these waves is not sufficient to retrieve a fast-changing temperature structure using FAT. Furthermore, air traffic control restrictions and trade-offs with other instruments can force linear flight patterns.
Using FAT, a cylindrical 3-D volume with a horizontal diameter of about 400 km and several kilometres in altitude can be reconstructed (Kaufmann et al., 2015; Krisch et al., 2017; Ungermann et al., 2011). In contrast, the 3-D volume, which is reconstructed using LAT, has a more complex structure with horizontal extent in the viewing direction of about 150 km (Ungermann et al., 2011). Is this smaller horizontal extent sufficient to derive the 3-D orientation of GWs? In this paper we will investigate how well the wave structures are retrieved using LAT and to which accuracy wave parameters can be derived from LAT temperature retrievals.
In order to quantitatively assess the differences between FAT and LAT using the GLORIA instrument, we will derive the observational filter of both methods. The observational filter is a measure for the sensitivity of an instrument to measuring different GWs and should be taken into account when comparing measurements from different instruments or measurements with model results (Alexander, 1998; Ern et al., 2006; Preusse et al., 2002; Trinh et al., 2016). In general, an observational filter tells by how much the amplitude or the momentum flux is underestimated by the measurement technique. As it is possible to reconstruct 3-D volumes with GLORIA and thus derive a 3-D wave vector, we extend the concept of the observational filter. In addition to the usual observational filter regarding the wave amplitude, we introduce an observational filter for the wave orientation. This observational filter for the wave orientation with respect to the flight direction is important for the planning of research flights: the wave orientation can often be predicted and the flight path adjusted.
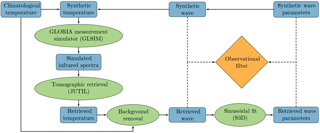
Figure 1Methodological concept of the performed simulation study. A detailed description can be found in Sect. 2.1.
This paper is structured as follows: in Sect. 2 a description of the methodological concept on how to derive an observational filter (Sect. 2.1) is followed by a short introduction to the concept of limb sounding and the GLORIA instrument (Sect. 2.2). Afterwards, the methods used for the estimation of the observational filter are described in detail: the GLORIA measurement simulator (Sect. 2.3), the tomographic retrieval concept (Sect. 2.4), the background removal algorithm (Sect. 2.5), and the three-dimensional wave fitting routine (Sect. 2.6). Finally, a definition of the observational filter is given in Sect. 2.7. Section 3 presents and discusses the results of the simulation study for FAT (Sect. 3.1) and LAT (Sect. 3.2) and compares the measurement quality of both methods for a real GLORIA measurement case on 25 January 2016 over Iceland (Sect. 3.3).
2.1 Methodological concept
The goal of this simulation study is to determine the capability of the GLORIA infrared limb imager to measure mesoscale GWs with LAT. The accuracy of reconstructing GW parameters, such as horizontal and vertical wavelength, amplitude, and wave orientation is studied. For this purpose, an end-to-end simulation was performed, which is described in this section. Figure 1 shows the concept of this end-to-end simulation.
To simulate a realistic atmosphere, a complete climatological field ac∈ℝn from Remedios et al. (2007) was used. The climatological temperature field Tc∈ℝm was perturbed at each point xi∈ℝ3 in space by a synthetically generated wave field
where is the temperature amplitude, k∈ℝ3 the 3-D wave vector, and ϕ the phase of the wave. In the present simulation study the temperature amplitude is arbitrarily chosen to be 3 K, the wave phase ϕ to be 0∘. For an improved conception, from now on, the 3-D wave vector will mainly be expressed in terms of vertical wavelength , horizontal wavelength , and horizontal wave direction . Thus, if a downward-pointing wave vector (λz>0, upward-propagating wave) is assumed, a wave with a wave direction of 0∘ has east–west oriented wavefronts and is tilted towards the north, a wave with a wave direction of 180∘ is tilted towards the south. These synthetic waves are added to the climatological temperature field to gain the synthetic temperature field Ts∈ℝm.
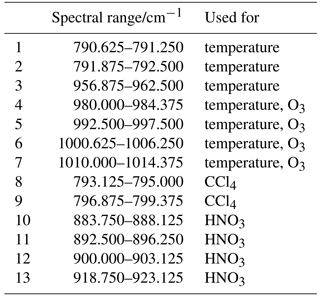
From this predetermined atmospheric state and with a given flight path, the GLORIA measurement simulator (Sect. 2.3) calculates a set of infrared spectra, as would be measured by the GLORIA instrument. A tomographic retrieval (Sect. 2.4) is then performed using these simulated infrared spectra. This retrieval uses only a well-defined set of infrared radiances (Table 3) and can reconstruct the atmosphere only in a reduced area, limited by the measurement geometry.
A background removal algorithm then subtracts the climatological temperature field Tc from the retrieved temperature field Tr∈ℝm to obtain the retrieved wave structure wr∈ℝm. In a real measurement case (Sect. 3.3) the background field is unknown and has to be identified by mathematical filtering methods (Sect. 2.5). To solely investigate the sensitivity of the measurement concept and exclude any additional effects, these filtering methods are not used for the simulation study.
Finally, the retrieved wave structure is compared to the synthetic wave structure. By repeating this process for different horizontal and vertical wavelengths, the observational filter of LAT is established (Sect. 2.7). To interpret the retrieved wave structure with respect to GWs, the wave parameters amplitude, phase, and wave vector have to be derived, using the small-volume few-wave decomposition method S3D (Sect. 2.6 and Lehmann et al., 2012). Comparing these retrieved wave parameters to the prescribed synthetic wave parameters gives detailed information on the usability of the different retrievals for GW research.
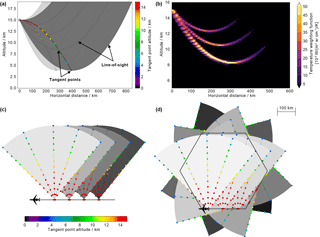
Figure 2In panel (a) a simple schematic of the limb-sounding geometry is given. The airplane is flying into the paper plane. Images taken under 90∘ azimuth cover the dark grey area with the LOS. The respective tangent points (bright coloured dots) increase in distance with decreasing altitude. The tangent points of forward- and rearward-looking images (light grey and pale coloured dots) are closer to the flight path. The LOS, which is a straight line in reality, has a parabolic shape in this plot due to the transformation into a Cartesian coordinate system with the x axis following the Earth surface. Panel (b) shows the weighting function along three different LOSs, indicating the contribution of the respective part of the atmosphere to the observed signal. In panels (c) and (d) the principles of limited angle tomography (LAT) and full angle tomography (FAT) with the GLORIA instrument are depicted, respectively. Shown are top views in bird perspective of the flight path. The dots again indicate the tangent points and are coloured according to their altitude. Each grey sector indicates one horizontal scan from 45 to 135∘. The lighter the grey, the later in time the measurements are that are taken.
2.2 The GLORIA infrared limb imager
GLORIA is an airborne Fourier transform spectrometer (FTS), which combines a classical Michelson interferometer with a 2-D detector array (Friedl-Vallon et al., 2014). GLORIA measures the infrared radiation in the spectral range from 780 to 1400 cm−1, which is emitted by molecules in the atmosphere along the line of sight (LOS). The interferometer spectrally resolves this radiation to reveal characteristic molecular emissions. Due to the exponentially declining density of the atmosphere with altitude, most radiation along the LOS is emitted at lower altitudes and thus around the tangent point. Moreover, for geometrical reasons, a comparatively long part of the LOS samples altitudes close to the tangent point, while higher atmospheric layers are passed only briefly (Fig. 2a). As a consequence, conventional limb sounders are more sensitive to changes in the atmosphere around the tangent point (Fig. 2b). The horizontal resolution of conventional limb sounders along the LOS is roughly 200–300 km (Ungermann et al., 2012; von Clarmann et al., 2009). In flight direction the horizontal resolution of 1-D retrievals, which mainly depends on the horizontal field of view, is on the order of several kilometres for the airborne limb imager GLORIA.
GLORIA operates in two different modes: the chemistry mode, which has a high spectral sampling of 0.0625 cm−1, and the dynamics mode with a coarser spectral sampling of only 0.625 cm−1. However, the coarser spectral sampling leads to a faster interferogram acquisition and accordingly an improved spatial sampling (0.45 km instead of 2.25 km). This improved spatial sampling is used to scan the atmosphere horizontally in steps of 4∘ from 45∘ (right forward) to 135∘ (right backward) with respect to the aircraft's heading. In this way, the same volume of air is measured under different angles, which allows for tomographic retrievals (Sect. 2.4). The tangent points of images looking forward (azimuth of 45∘) and rearward (azimuth of 135∘) are closer to the flight path then for images with 90∘ azimuth (Fig. 2). Thus, due to the panning ability, the tangent-point-covered area of GLORIA is a banana-shaped curtain with horizontal extent across the flight track around 100–200 km. Inside this banana-shaped curtain, the horizontal resolution across flight track is improved by a factor of 2 compared to conventional limb sounders. Thus, the panning ability of GLORIA improves both the horizontal sampling and the resolution across flight track.
Figure 2c and d show a top view of the measurement concepts for LAT and FAT used in this paper, respectively. In FAT (Fig. 2d), the full volume of the hexagon is covered by measurements from 360∘ around. The tangent points cover a cylindrical 3-D volume inside the hexagonal flight path. In LAT, however (Fig. 2c), the air is sampled by measurements from only one side. Thus the volume covered by tangent points has a banana shape in the vertical with horizontal extent across the flight track between 100 and 200 km depending on altitude. In the along-flight-track direction the shape is extended as far as the aircraft flies. A detailed description of the different GLORIA measurement concepts can be found in Riese et al. (2014).
2.3 GLORIA measurement simulator
The GLORIA measurement simulator can replicate an infrared spectrum which GLORIA would measure on a flight through a given atmospheric state. In the present paper, for the LAT cases, a linear flight along the zero meridian from 5∘ S to 5∘ N at a constant flight altitude of 15 km was arbitrarily chosen. For the FAT cases, a hexagonal flight pattern with 400 km diameter around 0∘ N and 0∘ E again at a constant flight altitude of 15 km is used. The synthetic atmospheric state as∈ℝm is composed of a temperature field, a pressure field, and the distributions of several trace gases. The climatological atmospheric state ac from Remedios et al. (2007) is transformed into the synthetic atmospheric state as by inserting the synthetic temperature field Ts (see Sect. 2.1). A radiative transfer model maps this synthetic atmospheric state onto a set of radiances F(as). This radiative transfer model also includes instrument and geometry effects such as increase in the field-of-view of single detector pixels along the LOS and the instrument line shape (Ungermann et al., 2015). As GLORIA can measure radiances only with finite precision, a measurement error ϵ∈ℝo is added to obtain the simulated radiances y∈ℝo:
This straightforward calculation is performed with the Jülich Rapid Spectral Simulation Code v2 (JURASSIC2) for each pixel of the GLORIA detector along the chosen flight path, leading to a set of thousands of simulated infrared spectra.
This model was developed to efficiently handle imager instruments and tomographic retrievals. It is based on JURASSIC (Hoffmann, 2006), which was previously used as a forward model for the evaluation of several satellite- and airborne remote-sensing experiments (Eckermann et al., 2006; Hoffmann et al., 2008; Kalicinsky et al., 2013; Ungermann et al., 2016; Weigel et al., 2010). It contains several approaches of varying computational complexity and accuracy for computing radiances, but in this work we employ the fast-table-based approach based on the emissivity growth approximation (EGA; e.g. Gordley and Russell, 1981; Weinreb and Neuendorffer, 1973).
2.4 Tomographic temperature retrieval
The JUelich Tomographic Inversion Library (JUTIL) software package is used for mapping the simulated infrared spectra back to the geophysical quantities, in our case the retrieved atmospheric state ar∈ℝn including the retrieved temperature Tr. This retrieval represents an ill-posed problem, which is solved by approximating it with a well-posed one using a Tikhonov regularisation scheme (Tikhonov and Arsenin, 1977). This leads to the minimisation problem
with the measurement error covariance matrix and the covariance matrix of the atmospheric state vector. As an a priori state aa the climatological field ac is used.
The first term of the cost function represents the inversion of the forward model, which can have many different mathematical solutions. To choose a physically meaningful solution, a regularisation term using a covariance matrix Sa is added. This covariance matrix is constructed as follows:
The standard deviations σ, weighting factors w0 and w1, and correlation lengths cz and ch used for the retrieval are given in Table 1. These factors are chosen ad hoc and cannot be interpreted directly as physically meaningful correlation lengths. A more physical regularisation scheme is currently under development and will be described by Krasauskas et al. (2018).
This minimisation problem is solved with a truncated conjugate gradient-based trust region scheme. More details on the retrieval algorithms used for GLORIA Level 2 processing are described by Ungermann et al. (2015).
Since the temperature perturbations due to the wave are small compared to the background temperature Tc, the retrieval can be linearised around this background temperature (Rodgers, 2000; Ungermann et al., 2010a):
is the Jacobian matrix of the forward model evaluated at aa and ya=F(aa) is the simulated radiances of the background state. With the retrieval gain matrix and the Jacobian matrix F′(aa), the averaging kernel matrix , which converts the synthetic temperature perturbation into the retrieved temperature perturbation , can be calculated:
For selected cases, the linear approximation has been validated by a comparison of linear and non-linear retrieval results. The retrievals of the real measurements in Sect. 3.3 are non-linear.
Table 1Standard deviations and vertical (cz) and horizontal (ch) correlation lengths used for the tomographic retrieval.
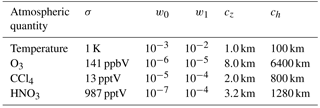
Table 2Systematic error sources included in the retrieval diagnostics with respective standard deviations and correlation lengths.

Further, the gain matrix G(aa) is used to calculate the influence of an arbitrary error source described by a covariance matrix Sϵ on the retrieval result G−1SϵG. Covariance matrices describing different systematic error sources are assembled using an autoregressive approach with reasonable standard deviations and correlation lengths (Tarantola, 2004). The standard deviations and correlation lengths used for the different systematic errors are summarised in Table 2. The effects of instrument errors on the GLORIA retrieval are discussed in detail by Kleinert et al. (2018). The covariance matrix for measurement noise is taken from theoretical estimates given by Friedl-Vallon et al. (2014) that agree well with estimates derived from real measurements (Kleinert et al., 2014).
As most systematic errors are fully correlated over all measurements of one flight and the noise terms are negligible in magnitude compared to the wave perturbation terms, the error term G(aa)ϵ is disregarded in the simulation study.
Conventional infrared temperature retrievals for limb-sounding instruments are based on optically thin spectral lines for example in the CO2 Q-branch region at 790.75 cm−1 (12.6 µm) (Riese et al., 1997; Ungermann et al., 2010a). Nadir sounders, in contrast, use spectral lines with different opacity to improve the vertical resolution (Hoffmann and Alexander, 2009). Transferring this concept to limb sounding and including additional lines with high opacity into limb-sounding retrievals increases the resolution along the LOS (Ungermann et al., 2011). Thus, including some ozone emission lines between 980 and 1014 cm−1 with different optical depths in our retrieval and applying LAT improved the horizontal resolution in the viewing direction at 10.5 km altitude to 70 km. The resolution is derived through fitting a 3-D ellipsoid around all points of the averaging kernel matrix A larger than half the maximum. The horizontal resolution along the flight path is 30 km and the vertical resolution 400 m. The FAT retrievals have a horizontal resolution of 20 km in both directions and a vertical resolution of 200 m. The precision (random error) of both methods within the tangent point area is below 0.05 K, the accuracy (sum over all systematic errors) of FAT below 0.5 K, and the accuracy of LAT below 0.7 K.
For the GW sensitivity study a retrieval setup with spectral ranges 1 to 7 in Table 3 is used. For the real measurement retrievals in Sect. 3.3, spectral ranges 8 and 9 in Table 3 are included in the retrieval to improve the knowledge about the CCl4 background radiation in the CO2 Q-branch region. Furthermore, spectral ranges 10 to 13 are used additionally to retrieve the trace gas HNO3.
To improve the convergence speed and the quality of the real measurement retrievals, a priori fields are taken from different models. The temperature a priori was constructed from European Centre for Medium-Range Weather Forecasts (ECMWF) operational analyses at resolution T1279/L137 by applying the background removal described in Sect. 2.5. This process is designed to remove all GW signatures from the a priori field. Thus, GW signatures in the retrieval originate almost entirely from measurement content. The pressure field was taken directly from ECMWF. The a priori fields of several trace gases (CH4, CO2, H2O, O3, etc.) are taken from the Whole Atmosphere Community Climate Model version 4 (WACCM4).
Table 3Spectral ranges used for the retrievals presented in this paper. The last column indicates the retrieved quantity for each spectral range. For the simulation study (Sect. 3.1 and 3.2), spectral ranges 1 to 7 are used. For the real measurement retrievals (Sect. 3.3), spectral ranges 8 to 13 are added.
2.5 Background removal
The atmospheric temperature distribution is mainly determined by the stratification and the balanced flow. However, GWs cause small-scale perturbations to this background temperature structure. Before identifying GWs with wave-fitting algorithms, a scale separation of large-scale background and small-scale perturbations has to be performed. This scale separation is called background removal.
For the simulation study in Sect. 3.1 and 3.2 the background temperature is known to be the climatological temperature field Tc. The background removal subtracts this temperature field Tc from the retrieved temperature field Tr and the temperature residual or so-called retrieved wave field wr remains.
For the retrievals of real measurements presented in Sect. 3.3, one-dimensional Savitzky–Golay filters (Savitzky and Golay, 1964) are applied in all three spatial directions with third-order polynomials over 25 and 60 neighbouring points in vertical and both horizontal directions, respectively. This corresponds to 750 km in both horizontal directions and 3 km in the vertical. In this way, a spatial separation into large-scale background and small-scale temperature residuals is achieved.
2.6 Three-dimensional sinusoidal fitting routine (S3D)
To compare the retrieval results with the original waves and interpret the structures with regard to GWs, wave parameters (horizontal and vertical wavelengths, wave amplitude and wave direction) have to be derived. This is carried out in overlapping sub-volumes of 5 km vertical and 400 km×400 km horizontal extent. In these sub-volumes a sinusoid is fitted to the retrieved wave field wr using a least-square method (Lehmann et al., 2012). In this process, the following equation is minimised:
with the sinusoidal function
and a weighting function σ2(x), which is chosen to be 1 if a tangent point exists in this grid cell and 105 if not. Systematic tests of this algorithm by superposition of two sinusoids show that even for wavelengths up to 2.5 times the cube size, the wave parameters of both waves are fitted with errors below 1 %.
Due to the fact that the wave structures of the real measurements vary strongly in space, a smaller cube size of is chosen for the S3D fits presented in Sect. 3.3. This cube size is sufficient to derive vertical wavelengths up to 9 km and horizontal wavelengths up to 400 km.
2.7 Observational filter
The relative error of the retrieval within an area A can be calculated as follows:
For a fair comparison, area A must be chosen in a way that it covers the measurement region, meaning a region covered with tangent points. In our case, area A was chosen to be between 9.5 and 11.5 km altitude, 1.75 and 2.25∘ longitude, and −1 and 1∘ latitude for LAT and between 9.5 and 11.5 km altitude, −1 and 1∘ longitude, and −1 and 1∘ latitude for FAT.
This relative error is a helpful measure for the reproducibility of GWs by the measurement setup and the retrieval concept. However, it does not give detailed information upon which wave parameters can be derived. Thus, we further define more specific relative errors for the important GW parameters, horizontal λh and vertical λz wavelengths, amplitude , and horizontal wave orientation φ:
These more specific relative errors help to define the quality of our measurement for GW analysis.
The observational filter is a measure of the sensitivity of an instrument and defines which GWs can be detected. The knowledge of the observational filter is necessary for meaningful comparisons of measurements from different instruments or measurement and model results (Alexander, 1998; Ern and Preusse, 2012; Ern et al., 2006; Preusse et al., 2002; Trinh et al., 2016).
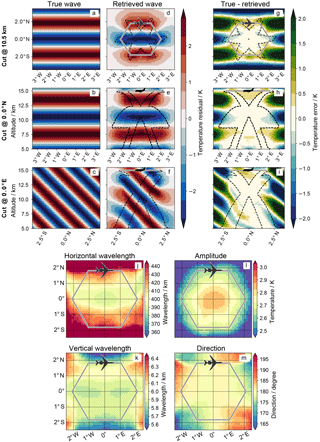
Figure 3FAT retrieval and S3D results for a wave with 400 km horizontal and 6 km vertical wavelengths and a horizontal wave direction . Panels (a)–(c) show the synthetic wave, panels (d)–(e) the retrieved wave, and panels (g)–(i) the difference between both. In the first row (a, d, g) horizontal cross sections at 10.5 km altitude are depicted. Rows 2 (b, e, h) and 3 (c, f, i) show vertical cross sections along 0∘ N and 0∘ E, respectively. The black dashed lines mark the area covered by tangent points. In panels (j)–(m) the S3D results for horizontal wavelength λh, vertical wavelength λz, horizontal wave direction φ, and temperature amplitude are pictured.
3.1 Full angle tomography (FAT)
Former studies demonstrated the feasibility of 2-D tomography of rearward-looking satellite instruments for the retrieval of 3-D atmospheric structures such as GWs (Degenstein et al., 2004; Hultgren et al., 2013; Ungermann et al., 2010a). However, the concept of 3-D tomography with sidewards-looking airborne instruments (Riese et al., 2014) or sub-limb instruments (Hart et al., 2018; Song et al., 2017) is quite different and, thus, may exhibit different characteristics. In 2-D tomography a volume is reconstructed from rearward-looking measurements on a moving platform that slice the volume into multiple 2-D images. In 3-D FAT, a volume is reconstructed from measurements at different sides all around the volume. Thus, with FAT the problem of wave orientation with respect to instrument and flight path (Ungermann et al., 2010a) does not appear.
Figure 3 shows a 3-D FAT of a GW with a horizontal wavelength of 400 km, vertical wavelength of 6 km, and horizontal wave direction φs=180∘. Pictured are three cross sections through the 3-D volume: at 10.5 km altitude (first row), at 0∘ N (second row), and at 0∘ E (third row). The first column shows the synthetic wave, the second column the retrieved wave, and the third column the difference of both. This synthetic wave has east–west-oriented phase fronts (Fig. 3a) and is tilted to the south (Fig. 3c).
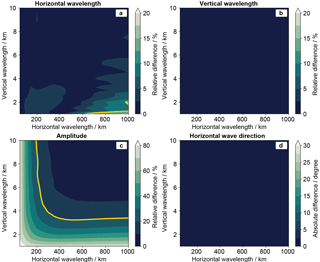
Figure 4Specific observational filters for (a) horizontal wavelength λh, (b) vertical wavelength λz, (c) temperature amplitude , and (d) horizontal wave direction φ for the FAT retrieval. The yellow lines mark errors of 10 % for the horizontal wavelength (a) and 20 % for the amplitude (c).
In general, the signal is well reproduced by the retrieval. Within the tangent point area (dotted lines) the temperature error is below 0.5 K. This is in good agreement with the determined accuracy of 0.5 K (Sect. 2.4). The retrieval can also reproduce some signal outside the area covered by tangent points. One reason is the path of the LOS, which goes through higher altitudes before and after the tangent point, thus collecting information there. Another reason is the horizontal and vertical correlation lengths of 100 and 1 km, which are used for the retrieval and smear out the signal.
A S3D fit (Sect. 2.6) was performed for this retrieval at 10.5 km altitude with a cube size of . The results of this fit can be seen in Fig. 3j–m. Within the hexagonal flight pattern the horizontal and vertical wavelength and the horizontal wave direction are well reproduced. The original amplitude of 3 K is underestimated by 0.1 K.
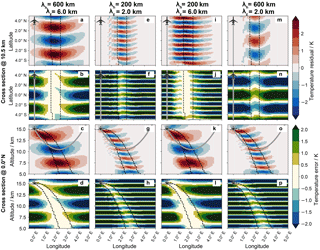
Figure 5Cross sections of retrieved waves (first and third rows) and differences between synthetic and retrieved waves (second and forth rows) of the LAT retrieval. The different columns show waves with different horizontal (λh) and vertical (λz) wavelengths. The synthetic horizontal wave orientation of all waves is and thus these waves have wavefronts perpendicular to the flight path. The black dashed lines mark the area covered by tangent points. The grey line in the vertical cross sections indicates a LOS for a measurement with a 90∘ azimuth angle and tangent point altitude of 10.5 km.
These S3D results are used to construct the specific observational filters in Fig. 4. A mean value of the S3D fit results among 1∘ S, 1∘ N, 1∘ W, and 1∘ E gives the specific observational filter of the respective wavelength pair. The horizontal wavelength, the vertical wavelength, and the horizontal wave direction are well reproduced for all tested waves. Further, there appears to be no phase shift in the FAT retrieval in contrast to conventional 1-D retrievals (Ungermann et al., 2010a). However, the amplitude of the waves is slightly reduced for waves with a horizontal wavelength below 200 km or a vertical wavelength below 3 km.
This simulation study shows that FAT is able to properly reconstruct the wave vectors of mesoscale GWs. However, the observational filter of the temperature amplitude has to be taken into account when comparing these measurements to different data sets.
3.2 Limited angle tomography (LAT)
3.2.1 Dependence of the retrieval results on horizontal and vertical wavelengths
Figure 5 shows a comparison of the LAT retrieval results for different wavelengths. The waves in columns 1 and 4 have a larger horizontal wavelength of 600 km compared to the waves in columns 2 and 3 with a 200 km horizontal wavelength. The vertical wavelength of 6 km of the waves in columns 1 and 3 is longer than the vertical wavelength of 2 km of the waves in columns 2 and 4. The waves with a large vertical wavelength in columns 1 and 3 are well reproduced by the LAT retrieval within the tangent-point-covered area with errors below 0.5 K . The waves with a short vertical wavelengths show larger temperature errors of up to 1.5 K within the tangent point area. This difference comes from the curved LOS through the straight wavefronts, which leads to an averaging over different wave phases. For the waves with short vertical wavelength the LOS crosses multiple opposite wave phases, which decreases the measurement signal. A similar dependence of the sensitivity on the alignment of phase fronts with LOS was observed for sub-limb viewers (McLandress et al., 2000; Wu and Waters, 1996).
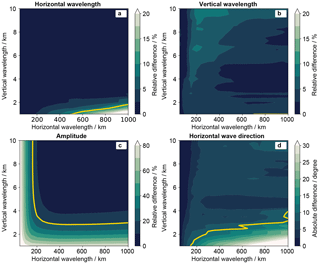
Figure 6Specific observational filters for (a) horizontal wavelength λh, (b) vertical wavelength λz, (c) temperature amplitude , and (d) horizontal wave direction φ for the LAT retrieval and synthetic horizontal wave orientation and thus these waves have wavefronts perpendicular to the flight path. The yellow lines mark errors of 10 %, 10 %, 20 %, and 10∘ in panels (a)–(d), respectively.
All retrieved waves show a slight V-shape pattern, which is more emphasized for the waves with a short vertical wavelength. This V shape is probably caused by the parabola shape of the LOS. The retrieval does not know, where along the LOS how much of the measured radiation was emitted, unless crossing measurements give sufficient information. As the LAT has fewer measurements at different angles, the temperature signal is redistributed according to the weighting function (Fig. 2b) along the LOS. This can be nicely seen in the vertical cross sections in Fig. 5g, o, in which the warm temperature follows the LOS upwards behind the tangent point. This vertical shift in temperature also causes the northward-oriented V shape in the horizontal cross sections.
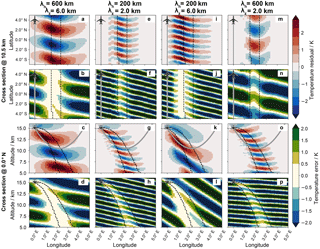
Figure 7Cross sections of retrieved waves (first and third rows) and differences between synthetic and retrieved waves (second and forth rows) of the LAT retrieval. The different columns show waves with different horizontal (λh) and vertical (λz) wavelengths. The synthetic horizontal wave orientation of all waves is and thus these waves are tilted towards the aircraft.
As already shown in the FAT case, the specific observational filters were calculated using the S3D fits of the LAT retrievals (Fig. 6). The deviations of horizontal and vertical wavelengths are mainly below 10 %. Only for very short vertical and very long horizontal wavelengths, do errors above 20 % appear. This is probably due to the above-mentioned V-shape deformation of the wave, which is more difficult to fit with one single sinusoidal wave. The same problem appears for the horizontal wave direction. For waves with short vertical and long horizontal wavelengths, and thus a strong V shape, the direction cannot be derived properly anymore. For the rest of the waves the direction error stays below 10∘ everywhere. The observational filter for the amplitude shows a pattern similar to the FAT case.
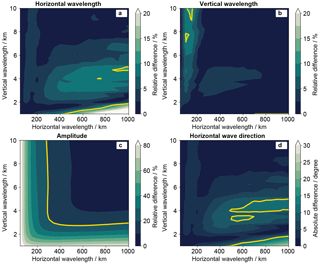
Figure 8Specific observational filters for (a) horizontal wavelength λh, (b) vertical wavelength λz, (c) temperature amplitude , and (d) horizontal wave direction φ for the LAT retrieval with synthetic horizontal wave orientation and thus waves which are tilted towards the aircraft. The yellow lines mark errors of 10 %, 10 %, 20 %, and 10∘ in panels (a)–(d), respectively.
3.2.2 Dependence of retrieval results on the wave orientation
Due to the limited measurement sector, the orientation of the wave with respect to the instrument position might be important for LAT. Figure 7 depicts the retrieval results for waves with horizontal wave directions turned by 30∘ (φs=210∘) compared to those in Fig. 5. The wavefronts are tilted southward and westward and thus the vertical tilt is towards the instrument. They decrease in height with increasing distance from the flight path.
Overall, the structures are reproduced reasonably well. As already shown for the perfectly perpendicularly aligned waves, waves with long vertical wavelengths (Fig. 7a–d and i–l) are reproduced better than waves with short vertical wavelengths (Fig. 7e–h and m–p).
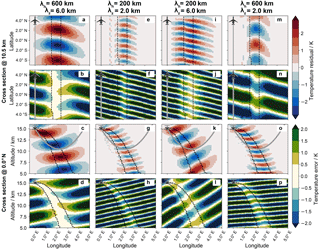
Figure 9Cross sections of retrieved waves (first and third rows) and differences between synthetic and retrieved waves (second and forth rows) of the LAT retrieval. The different columns show waves with different horizontal (λh) and vertical (λz) wavelengths. The synthetic horizontal wave orientation of all waves is and thus these waves are tilted away from the aircraft.
Due to the tilt of the waves towards the aircraft, the LOS is partly aligned with the wavefronts before the tangent point. This effect is stronger for steep waves such as in Fig. 7k than for relatively flat waves such as in Fig. 8c, g, and o. Due to this alignment the area of best sensitivity is shifted towards the aircraft for the steep wave. Spreading the signal now around this shifted sensitivity maximum just spreads the signal along the same wave phase, as the LOS has little curvature in this region. Therefore, no strong shape deviation is observed. For the flat waves a V shape similar to the waves in Fig. 5 can be observed, due to a spreading of signal along the LOS around the tangent point.
In the observational filter (Fig. 8) a small decrease in the quality of amplitude reproduction can be seen compared to the observational filter of perfectly east–west-aligned waves (Fig. 6). However, the wavelengths and wave direction are barely influenced and are reproduced at a similar high quality. The V shape of the waves only occurs outside the tangent point region; thus proper horizontal wave directions can be observed.
Figure 9 shows the retrieval results for waves turned by −210∘ (φs=30∘) compared to Fig. 5. These waves are tilted northward and eastward and thus the vertical tilt is away from the flight path. Only for the wave with large horizontal and large vertical wavelengths (Fig. 9a–d), is the temperature amplitude reproduced well within the tangent point region. However, the horizontal orientation in this area, which should be similar to Fig. 7a from northwest to southeast is not recovered. Within the tangent point region (longitude between 1.5 and 2.5∘) the horizontal wavefronts are oriented almost west to east. Behind the tangent point region (longitude above 2.5∘), the wavefronts slowly approach the expected west-northwest to east-southeast orientation. Thus, the orientation error ranges between 10 and 30∘ depending on the area of interest. The same happens for waves with short vertical wavelengths (Fig. 9e–h and m–p): the information about the horizontal wave direction is lost within the retrieval. Again a V shape appears for all these waves. Due to the inverse vertical tilt compared to Fig. 7, the opening of the V shape is to the south this time.
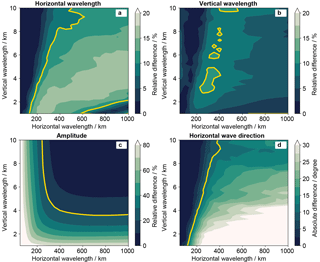
Figure 10Specific observational filters for (a) horizontal wavelength λh, (b) vertical wavelength λz, (c) temperature amplitude , (d) and horizontal wave direction φ for the LAT retrieval with synthetic horizontal wave orientation and thus waves which are tilted away from the aircraft. The yellow lines mark errors of 10 %, 10 %, 20 %, and 10∘ in panels (a)–(d), respectively.
For steep waves (Fig. 9k) the main signal is again shifted, this time behind the tangent point area, where the LOS and the wavefronts are well aligned. Thus the spreading of the signal does not influence these waves as strongly as the flat waves and the horizontal orientation does not get lost in the retrieval. The decreased amplitude compared to Fig. 7 can be explained by the fact that the maximum of the weighting function along the LOS is located slightly before the tangent point (Fig. 2b).
A similar picture is given from the observational filter in Fig. 10. Even though the amplitude is underestimated for very steep waves, the horizontal wave orientation can be derived accurately. However, the flatter the wave becomes, the worse the derived horizontal wave direction. For waves with a horizontal-to-vertical wavelength ratio of above 200, the direction error exceeds 30∘. Also, the horizontal wavelength reproduction is decreased somewhat compared to the two cases before (Figs. 6 and 8).
Further tests with horizontal wave directions and show a drastic decline in the amplitude sensitivity towards waves with short horizontal wavelengths. For waves tilted away from the flight path () the fit quality of the horizontal wave direction and the horizontal wavelength decreases drastically already at .
These studies show that LAT applied to GWs gives the best results for waves with wavefronts perpendicular to the flight path and thus a horizontal wave vector or . However, if the wave is slightly turned, the quality of the derived wave parameters is not affected strongly as long as the wave is tilted towards the instrument (). In general, waves are best retrieved when their aspect ratio of horizontal to vertical wavelengths, i.e. their steepness, is favourable for an alignment with the LOS. In these cases, tilts towards and away from the instrument may give reasonable results.
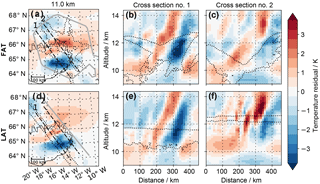
Figure 11Comparison of FAT (a–c) and LAT (d–f) retrieval results for a research flight over Iceland on 25 January 2016. Shown are the temperature residuals after background removal as described in Sect. 2.5. The grey line indicates the part of the flight path from which the measurements are used for the retrieval. The left column depicts horizontal cross sections at 11 km altitude; the two right columns present vertical cross sections along the dashed lines of the left column. The dotted lines mark the area covered by tangent points. Panels (a) to (c) are adapted from Krisch et al. (2017).
3.3 Comparison of LAT and FAT results for a real measurement case on 25 January 2016 over Iceland
From December 2015 to March 2016, GLORIA was deployed on-board the German research aircraft HALO for a research campaign covering several scientific targets such as demonstrating the use of infrared limb imaging for GW studies (GWEX), studying the full life cycle of a GW (GW-LCYCLE), investigating the Seasonality of Air mass transport and origin in the Lowermost Stratosphere (SALSA), and observing the Polar Stratosphere in a Changing Climate (POLSTRACC). On 25 January 2016, a research flight over Iceland investigated a GW excited at the Icelandic mountains (Krisch et al., 2017). A linear flight leg of 500 km in length crossing the wavefronts was followed by a hexagonal flight pattern with a diameter of 460 km around the wave structure.
Krisch et al. (2017) present the retrieval results of FAT using only measurements taken during the hexagonal flight. Figure 11 compares these FAT results with LAT results using only measurements taken on the 500 km linear flight leg through the middle of the volume. In general the LAT results (Fig. 11d–e) agree very well with the FAT results (Fig. 11a–c) within the volume covered by both. FAT as well as the LAT retrieval show a superposition of waves with longer and shorter horizontal wavelengths. Differences in strength and scale of the waves, for example in cross section 2, can be explained due to the different tangent point coverage of both methods. Especially higher altitudes in cross section 2 are not well covered with tangent points in the FAT retrieval (Fig. 11c). This is probably the reason why the temperature residual is slightly lower in the FAT retrieval compared to LAT. Also, the smaller-scale waves in this region (Fig. 11f) are less prominent in the FAT retrieval (Fig. 11c).
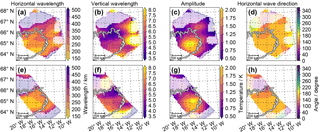
Figure 12Wave parameters as obtained from the S3D fit with fitting cubes of at a centre height of 11.5 km for FAT (a–d) and LAT (e–h). Non-significant fitting results with wavelengths above 2.5 times the cube size are shaded. Panels (a) to (d) are adapted from Krisch et al. (2017).
A more quantitative comparison of the similarities of both retrievals can be given by the Pearson correlation coefficient. Including only areas which are covered by tangent points gives a Pearson correlation coefficient of 0.91. Expanding this area to places with measurement content larger than 0.8 (includes areas crossed by a LOS before or after the tangent point) still leads to a Pearson correlation coefficient of 0.75. Thus, as expected the two retrievals are highly correlated.
A main advantage of 3-D tomographic measurement of GWs over conventional limb measurements is the ability to derive the horizontal wave direction. This is performed by applying the S3D fitting routine. Figure 12 shows the wave parameters obtained from these fits for both cases. Within the confidence area of our fits, all wave parameters agree very well for both methods. The observed GW has a horizontal wavelength of around 200 km, a vertical wavelength of around 5.5 km, amplitudes of up to 2 K, and a horizontal wave direction of 160∘. Thus, the wave vector is turned by 20∘ compared to the flight direction. The wavefronts are tilted southward and thus away from the flight path. Figure 10 predicted a wavelength reproduction of more than 90 % and an error in the estimation of the horizontal wave direction below 7.5∘ for such waves. This can be confirmed with the real measurement case.
This paper investigates the use of LAT applied to airborne limb imaging for GW research. In contrast to FAT, which allows the reconstruction of a large, cylindric, 3-D volume, LAT can only reconstruct a band of 200 km around a banana-shaped vertical curtain parallel to the flight path. The horizontal resolution is 30 km in the flight direction and 70 km perpendicular to flight direction. The vertical resolution is on the order of 400 m. This volume and resolution are sufficient to properly derive all important wave parameters such as the horizontal and vertical wavelengths, the amplitude, and the wave direction for waves with wavefronts perpendicular to the flight path. This is feasible due to the perfect alignment of wave phases and LOS and agrees well with earlier studies for other limb-sounding concepts (McLandress et al., 2000; Ungermann et al., 2010a; Wu and Waters, 1996).
The quality of the 3-D reconstruction strongly depends on the orientation of the wave with respect to the instrument. If the waves are slightly turned away from the perfect orientation, the quality of the derived wave parameters is not strongly affected as long as the wavefront is tilted towards the instrument. If the wavefronts are tilted away from the instrument, the retrieval will create artefacts in the form of V-shaped phase fronts, which reduce the quality of the derived horizontal wave directions and wavelengths. For waves with a horizontal wavelength under 300 km, the amplitude error is larger for waves with wavefronts tilted away from the instrument than for waves with wavefronts tilted towards the instrument. In general, the better the alignment of the wave phases and the LOS, the more information attained by the tomographic retrieval. Thus, steeper waves can be derived with better accuracy than flatter waves. For steep waves with a horizontal-to-vertical wavelength ratio below 200, correct wave directions can be derived independently of the tilt. However, for waves turned by more than 40∘ compared to the perfect perpendicular case, the reconstruction quality decreases drastically for all tested waves.
The capacity of LAT for GW research was demonstrated by comparing LAT and FAT for a real measurement case on 25 January 2016 above Iceland. The temperature residuals agree very well with each other. The wave parameters derived with a sinusoidal fitting routine yield similar results.
In summary, for many GW cases the observation in LAT mode can be recommended. However, for short-scale waves FAT is preferable due to the higher spatial resolution of . The slightly better accuracy of 0.5 K for FAT compared to 0.7 K for LAT also makes FAT favourable for low-amplitude waves. Furthermore, when the precise orientation of the wave cannot be predicted before the flight, FAT should be the method of choice. Nevertheless, for many other cases, LAT might be preferred due to its shorter acquisition time.
The authors declare that they have no conflict of interest.
This article is part of the special issue “Sources, propagation, dissipation and impact of gravity waves (ACP/AMT inter-journal SI)”. It is not associated with a conference.
This work was partly supported by the Bundesministerium für Bildung und
Forschung (BMBF) under project 01LG1206C (ROMIC/GW-LCYCLE), as well as by the
European Space Agency (ESA) under contract 4000115111/15/NL/FF/ah (GWEX) and
the Deutsche Forschungsgemeinschaft (DFG) project ER 474/4-2 (MS-GWaves/SV),
which is part of the DFG researchers group FOR 1898 (MS-GWaves). The
retrievals were performed on the JURECA supercomputer at the Jülich
Supercomputing Center (JSC) as part of the JIEK72 project. We sincerely thank
Anu Dudhia, Oxford University, for providing the Reference Forward Model
(RFM) used to calculate the optical path and extinction cross-section tables
required by our forward models. Douglas Kinnison, NCAR, is thanked for kindly
providing the WACCM4 model data used in the retrieval. The European Centre
for Medium-Range Weather Forecasts (ECMWF) is acknowledged for meteorological
data support. The results are based on the efforts of all members of the
GLORIA team, including the technology institutes ZEA-1 and ZEA-2 at
Forschungszentrum Jülich and the Institute for Data Processing and
Electronics at the Karlsruhe Institute of Technology. We would also like to
thank the pilots and ground-support team at the Flight Experiments facility
of the Deutsches Zentrum für Luft- und Raumfahrt (DLR-FX).
The article processing charges for this open-access
publication were covered by a Research
Centre
of the Helmholtz Association.
Edited by: Mike
Taylor
Reviewed by: Ole Martin Christensen and Vern Hart
Alexander, M. J.: Interpretations of observed climatological patterns in stratospheric gravity wave variance, Geophys. Res. Lett., 103, 8627–8640, https://doi.org/10.1029/97JD03325, 1998. a, b
Degenstein, D. A., Llewellyn, E. J., and Lloyd, N. D.: Tomographic retrieval of the oxygen infrared atmospheric band with the OSIRIS infrared imager, Can. J. Phys., 82, 501–515, 2004. a
Eckermann, S. D., Wu, D. L., Doyle, J. D., Burris, J. F., McGee, T. J., Hostetler, C. A., Coy, L., Lawrence, B. N., Stephens, A., McCormack, J. P., and Hogan, T. F.: Imaging gravity waves in lower stratospheric AMSU-A radiances, Part 2: Validation case study, Atmos. Chem. Phys., 6, 3343–3362, https://doi.org/10.5194/acp-6-3343-2006, 2006. a
Ern, M. and Preusse, P.: Gravity wave momentum flux spectra observed from satellite in the summertime subtropics: Implications for global modeling, Geophys. Res. Lett., 39, L15810, https://doi.org/10.1029/2012GL052659, 2012. a
Ern, M., Preusse, P., and Warner, C. D.: Some experimental constraints for spectral parameters used in the Warner and McIntyre gravity wave parameterization scheme, Atmos. Chem. Phys., 6, 4361–4381, https://doi.org/10.5194/acp-6-4361-2006, 2006. a, b
Friedl-Vallon, F., Gulde, T., Hase, F., Kleinert, A., Kulessa, T., Maucher, G., Neubert, T., Olschewski, F., Piesch, C., Preusse, P., Rongen, H., Sartorius, C., Schneider, H., Schönfeld, A., Tan, V., Bayer, N., Blank, J., Dapp, R., Ebersoldt, A., Fischer, H., Graf, F., Guggenmoser, T., Höpfner, M., Kaufmann, M., Kretschmer, E., Latzko, T., Nordmeyer, H., Oelhaf, H., Orphal, J., Riese, M., Schardt, G., Schillings, J., Sha, M. K., Suminska-Ebersoldt, O., and Ungermann, J.: Instrument concept of the imaging Fourier transform spectrometer GLORIA, Atmos. Meas. Tech., 7, 3565–3577, https://doi.org/10.5194/amt-7-3565-2014, 2014. a, b, c
Geller, M. A., Alexander, M. J., Love, P. T., Bacmeister, J., Ern, M., Hertzog, A., Manzini, E., Preusse, P., Sato, K., Scaife, A. A., and Zhou, T.: A comparison between gravity wave momentum fluxes in observations and climate models, J. Climate, 26, 6383–6405, https://doi.org/10.1175/JCLI-D-12-00545.1, 2013. a
Gordley, L. L. and Russell, J. M.: Rapid inversion of limb radiance data using an emissivity growth approximation, Appl. Optics, 20, 807–813, https://doi.org/10.1364/AO.20.000807, 1981. a
Hart, V. P., Taylor, M. J., Doyle, T. E., Zhao, Y., Pautet, P.-D., Carruth, B. L., Rusch, D. W., and Russell, J. M.: Investigating Gravity Waves in Polar Mesospheric Clouds Using Tomographic Reconstructions of AIM Satellite Imagery, J. Geophys. Res.-Space, 123, 955–973, https://doi.org/10.1002/2017JA024481, 2018. a
Hoffmann, L.: Schnelle Spurengasretrieval für das Satellitenexperiment Envisat MIPAS, Tech. Rep. JUEL-4207, Forschungszentrum Jülich, Jülich, Germany, 2006. a
Hoffmann, L. and Alexander, M. J.: Retrieval of stratospheric temperatures from Atmospheric Infrared Sounder radiance measurements for gravity wave studies, J. Geophys. Res., 114, D07105, https://doi.org/10.1029/2008JD011241, 2009. a
Hoffmann, L., Kaufmann, M., Spang, R., Müller, R., Remedios, J. J., Moore, D. P., Volk, C. M., von Clarmann, T., and Riese, M.: Envisat MIPAS measurements of CFC-11: retrieval, validation, and climatology, Atmos. Chem. Phys., 8, 3671–3688, https://doi.org/10.5194/acp-8-3671-2008, 2008. a
Hultgren, K., Gumbel, J., Degenstein, D., Bourassa, A., Lloyd, N., and Stegman, J.: First simultaneous retrievals of horizontal and vertical structures of Polar Mesospheric Clouds from Odin/OSIRIS tomography, J. Atmos. Sol.-Terr. Phy., 104, 213–223, https://doi.org/10.1016/j.jastp.2013.06.013, 2013. a
Kalicinsky, C., Grooß, J.-U., Günther, G., Ungermann, J., Blank, J., Höfer, S., Hoffmann, L., Knieling, P., Olschewski, F., Spang, R., Stroh, F., and Riese, M.: Observations of filamentary structures near the vortex edge in the Arctic winter lower stratosphere, Atmos. Chem. Phys., 13, 10859–10871, https://doi.org/10.5194/acp-13-10859-2013, 2013. a
Kalisch, S., Preusse, P., Ern, M., Eckermann, S. D., and Riese, M.: Differences in gravity wave drag between realistic oblique and assumed vertical propagation, J. Geophys. Res.-Atmos., 119, 10081–10099, https://doi.org/10.1002/2014JD021779, 2014. a
Kaufmann, M., Blank, J., Guggenmoser, T., Ungermann, J., Engel, A., Ern, M., Friedl-Vallon, F., Gerber, D., Grooß, J. U., Guenther, G., Höpfner, M., Kleinert, A., Kretschmer, E., Latzko, Th., Maucher, G., Neubert, T., Nordmeyer, H., Oelhaf, H., Olschewski, F., Orphal, J., Preusse, P., Schlager, H., Schneider, H., Schuettemeyer, D., Stroh, F., Suminska-Ebersoldt, O., Vogel, B., M. Volk, C., Woiwode, W., and Riese, M.: Retrieval of three-dimensional small-scale structures in upper-tropospheric/lower-stratospheric composition as measured by GLORIA, Atmos. Meas. Tech., 8, 81–95, https://doi.org/10.5194/amt-8-81-2015, 2015. a
Kidston, J., Scaife, A. A., Hardiman, S. C., Mitchell, D. M., Butchart, N., Baldwin, M. P., and Gray, L. J.: Stratospheric influence on tropospheric jet streams, storm tracks and surface weather, Nat. Geosci., 8, 433–440, https://doi.org/10.1038/ngeo2424, 2015. a
Kleinert, A., Friedl-Vallon, F., Guggenmoser, T., Höpfner, M., Neubert, T., Ribalda, R., Sha, M. K., Ungermann, J., Blank, J., Ebersoldt, A., Kretschmer, E., Latzko, T., Oelhaf, H., Olschewski, F., and Preusse, P.: Level 0 to 1 processing of the imaging Fourier transform spectrometer GLORIA: generation of radiometrically and spectrally calibrated spectra, Atmos. Meas. Tech., 7, 4167–4184, https://doi.org/10.5194/amt-7-4167-2014, 2014. a
Kleinert, A., Krisch, I., Ungermann, J., Adibekyan, A., Gutschwager, B., and Monte, C.: Characterization of blackbody inhomogeneity and its effect on the retrieval results of the GLORIA instrument, Atmos. Meas. Tech., 11, 3871–3882, https://doi.org/10.5194/amt-11-3871-2018, 2018. a
Krasauskas, L., Ungermann, J., Ensmann, S., Krisch, I., Kretschmer, E., Preusse, P., and Riese, M.: Tomographic airborne limb sounder retrievals on irregular grid with second order regularisation, Atmos. Meas. Tech. Discuss., https://doi.org/10.5194/amt-2018-199, in review, 2018. a
Krisch, I.: F10_20160125_GLORIA_dynamics_mode_tomography _FZJ.nc, available at: https://halo-db.pa.op.dlr.de/dataset/5079, last access: 10 July 2017. a
Krisch, I.: F10_20160125_GLORIA_dynamics_mode_linear_flight _tomography_FZJ.nc, available at: https://halo-db.pa.op.dlr.de/dataset/5445, last access: 27 February 2018. a
Krisch, I., Preusse, P., Ungermann, J., Dörnbrack, A., Eckermann, S. D., Ern, M., Friedl-Vallon, F., Kaufmann, M., Oelhaf, H., Rapp, M., Strube, C., and Riese, M.: First tomographic observations of gravity waves by the infrared limb imager GLORIA, Atmos. Chem. Phys., 17, 14937–14953, https://doi.org/10.5194/acp-17-14937-2017, 2017. a, b, c, d, e, f
Lehmann, C. I., Kim, Y.-H., Preusse, P., Chun, H.-Y., Ern, M., and Kim, S.-Y.: Consistency between Fourier transform and small-volume few-wave decomposition for spectral and spatial variability of gravity waves above a typhoon, Atmos. Meas. Tech., 5, 1637–1651, https://doi.org/10.5194/amt-5-1637-2012, 2012. a, b
McLandress, C., Alexander, M. J., and Wu, D. L.: Microwave Limb Sounder observations of gravity waves in the stratosphere: A climatology and interpretation, J. Geophys. Res., 105, 11947–11967, 2000. a, b
McLandress, C., Shepherd, T. G., Polavarapu, S., and Beagley, S. R.: Is Missing Orographic Gravity Wave Drag near 60 degrees S the Cause of the Stratospheric Zonal Wind Biases in Chemistry Climate Models?, J. Atmos. Sci., 69, 802–818, https://doi.org/10.1175/JAS-D-11-0159.1, 2012. a
Natterer, F.: The mathematics of computerized tomography, Society for Industrial and Applied Mathematics, Philadelphia, PA, USA, 2001. a, b
Preusse, P., Dörnbrack, A., Eckermann, S. D., Riese, M., Schaeler, B., Bacmeister, J. T., Broutman, D., and Grossmann, K. U.: Space-based measurements of stratospheric mountain waves by CRISTA, 1. Sensitivity, analysis method, and a case study, J. Geophys. Res., 107, 8178, https://doi.org/10.1029/2001JD000699, 2002. a, b
Preusse, P., Eckermann, S. D., Ern, M., Oberheide, J., Picard, R. H., Roble, R. G., Riese, M., Russell III, J. M., and Mlynczak, M. G.: Global ray tracing simulations of the SABER gravity wave climatology, J. Geophys. Res. Atmos., 114, D08126, https://doi.org/10.1029/2008JD011214, 2009. a
Remedios, J. J., Leigh, R. J., Waterfall, A. M., Moore, D. P., Sembhi, H., Parkes, I., Greenhough, J., Chipperfield, M. P., and Hauglustaine, D.: MIPAS reference atmospheres and comparisons to V4.61/V4.62 MIPAS level 2 geophysical data sets, Atmos. Chem. Phys. Discuss., 7, 9973–10017, https://doi.org/10.5194/acpd-7-9973-2007, 2007. a, b, c, d
Ribstein, B. and Achatz, U.: The interaction between gravity waves and solar tides in a linear tidal model with a 4-D ray-tracing gravity-wave parameterization, J. Geophys. Res.-Space, 121, 8936–8950, https://doi.org/10.1002/2016JA022478, 2016. a
Riese, M., Preusse, P., Spang, R., Ern, M., Jarisch, M., Grossmann, K.-U., and Offermann, D.: Measurements of trace gases by the Cryogenic Infrared Spectrometers and Telescopes for the Atmosphere (CRISTA) experiment, Adv. Space Res., 19, 563–566, https://doi.org/10.1016/S0273-1177(97)00172-5, 1997. a
Riese, M., Oelhaf, H., Preusse, P., Blank, J., Ern, M., Friedl-Vallon, F., Fischer, H., Guggenmoser, T., Höpfner, M., Hoor, P., Kaufmann, M., Orphal, J., Plöger, F., Spang, R., Suminska-Ebersoldt, O., Ungermann, J., Vogel, B., and Woiwode, W.: Gimballed Limb Observer for Radiance Imaging of the Atmosphere (GLORIA) scientific objectives, Atmos. Meas. Tech., 7, 1915–1928, https://doi.org/10.5194/amt-7-1915-2014, 2014. a, b, c
Rodgers, C. D.: Inverse Methods for Atmospheric Sounding: Theory and Practice, vol. 2 of Series on Atmospheric, Oceanic and Planetary Physics, World Scientific, Singapore, 2000. a
Sandu, I., Bechtold, P., Beljaars, A., Bozzo, A., Pithan, F., Shepherd, T. G., and Zadra, A.: Impacts of parameterized orographic drag on the Northern Hemisphere winter circulation, J. Adv. Model. Earth Syst., 8, 196–211, https://doi.org/10.1002/2015MS000564, 2016. a
Sato, K., Watanabe, S., Kawatani, Y., Tomikawa, Y., Miyazaki, K., and Takahashi, M.: On the origins of mesospheric gravity waves, Geophys. Res. Lett., 36, L19801, https://doi.org/10.1029/2009GL039908, 2009. a
Savitzky, A. and Golay, M. J. E.: Smoothing and Differentiation of Data by Simplified Least Squares Procedures, Anal. Chem., 36, 1627–1639, https://doi.org/10.1021/ac60214a047, 1964. a
Scaife, A. A., Karpechko, A. Y., Baldwin, M. P., Brookshaw, A., Butler, A. H., Eade, R., Gordon, M., MacLachlan, C., Martin, N., Dunstone, N., and Smith, D.: Seasonal winter forecasts and the stratosphere, Atmos. Sci. Lett., 17, 51–56, https://doi.org/10.1002/asl.598, 2016. a
Sigmond, M. and Scinocca, J. F.: The Influence of the Basic State on the Northern Hemisphere Circulation Response to Climate Change, J. Climate, 23, 1434–1446, https://doi.org/10.1175/2009JCLI3167.1, 2010. a
Song, R., Kaufmann, M., Ungermann, J., Ern, M., Liu, G., and Riese, M.: Tomographic reconstruction of atmospheric gravity wave parameters from airglow observations, Atmos. Meas. Tech., 10, 4601–4612, https://doi.org/10.5194/amt-10-4601-2017, 2017. a
Tarantola, A.: Inverse Problem Theory, Society for Industrial and Applied Mathematics, Philadelphia, USA, 2004. a
Tikhonov, A. N. and Arsenin, V. Y.: Solutions of ill-posed problems, Winston, Washington, D.C., USA, 1977. a
Trinh, Q. T., Kalisch, S., Preusse, P., Ern, M., Chun, H.-Y., Eckermann, S. D., Kang, M.-J., and Riese, M.: Tuning of a convective gravity wave source scheme based on HIRDLS observations, Atmos. Chem. Phys., 16, 7335–7356, https://doi.org/10.5194/acp-16-7335-2016, 2016. a, b
Ungermann, J., Hoffmann, L., Preusse, P., Kaufmann, M., and Riese, M.: Tomographic retrieval approach for mesoscale gravity wave observations by the PREMIER Infrared Limb-Sounder, Atmos. Meas. Tech., 3, 339–354, https://doi.org/10.5194/amt-3-339-2010, 2010a. a, b, c, d, e, f
Ungermann, J., Kaufmann, M., Hoffmann, L., Preusse, P., Oelhaf, H., Friedl-Vallon, F., and Riese, M.: Towards a 3-D tomographic retrieval for the air-borne limb-imager GLORIA, Atmos. Meas. Tech., 3, 1647–1665, https://doi.org/10.5194/amt-3-1647-2010, 2010b. a
Ungermann, J., Blank, J., Lotz, J., Leppkes, K., Hoffmann, L., Guggenmoser, T., Kaufmann, M., Preusse, P., Naumann, U., and Riese, M.: A 3-D tomographic retrieval approach with advection compensation for the air-borne limb-imager GLORIA, Atmos. Meas. Tech., 4, 2509–2529, https://doi.org/10.5194/amt-4-2509-2011, 2011. a, b, c, d
Ungermann, J., Kalicinsky, C., Olschewski, F., Knieling, P., Hoffmann, L., Blank, J., Woiwode, W., Oelhaf, H., Hösen, E., Volk, C. M., Ulanovsky, A., Ravegnani, F., Weigel, K., Stroh, F., and Riese, M.: CRISTA-NF measurements with unprecedented vertical resolution during the RECONCILE aircraft campaign, Atmos. Meas. Tech., 5, 1173–1191, https://doi.org/10.5194/amt-5-1173-2012, 2012. a
Ungermann, J., Blank, J., Dick, M., Ebersoldt, A., Friedl-Vallon, F., Giez, A., Guggenmoser, T., Höpfner, M., Jurkat, T., Kaufmann, M., Kaufmann, S., Kleinert, A., Krämer, M., Latzko, T., Oelhaf, H., Olchewski, F., Preusse, P., Rolf, C., Schillings, J., Suminska-Ebersoldt, O., Tan, V., Thomas, N., Voigt, C., Zahn, A., Zöger, M., and Riese, M.: Level 2 processing for the imaging Fourier transform spectrometer GLORIA: derivation and validation of temperature and trace gas volume mixing ratios from calibrated dynamics mode spectra, Atmos. Meas. Tech., 8, 2473–2489, https://doi.org/10.5194/amt-8-2473-2015, 2015. a, b
Ungermann, J., Ern, M., Kaufmann, M., Müller, R., Spang, R., Ploeger, F., Vogel, B., and Riese, M.: Observations of PAN and its confinement in the Asian summer monsoon anticyclone in high spatial resolution, Atmos. Chem. Phys., 16, 8389–8403, https://doi.org/10.5194/acp-16-8389-2016, 2016. a
von Clarmann, T., De Clercq, C., Ridolfi, M., Höpfner, M., and Lambert, J.-C.: The horizontal resolution of MIPAS, Atmos. Meas. Tech., 2, 47–54, https://doi.org/10.5194/amt-2-47-2009, 2009. a
Weigel, K., Riese, M., Hoffmann, L., Hoefer, S., Kalicinsky, C., Knieling, P., Olschewski, F., Preusse, P., Spang, R., Stroh, F., and Volk, C. M.: CRISTA-NF measurements during the AMMA-SCOUT-O3 aircraft campaign, Atmos. Meas. Tech., 3, 1437–1455, https://doi.org/10.5194/amt-3-1437-2010, 2010. a
Weinreb, M. P. and Neuendorffer, A. C.: Method to Apply Homogeneous-path Transmittance Models to Inhomogeneous Atmospheres, J. Atmos. Sci., 30, 662–666, https://doi.org/10.1175/1520-0469(1973)030<0662:MTAHPT>2.0.CO;2, 1973. a
Wu, D. L. and Waters, J. W.: Gravity-wave-scale temperature fluctuations seen by the UARS MLS, Geophys. Res. Lett., 23, 3289–3292, 1996. a, b


