the Creative Commons Attribution 4.0 License.
the Creative Commons Attribution 4.0 License.
Quantifying the single-scattering albedo for the January 2017 Chile wildfires from simulations of the OMI absorbing aerosol index
J. Pepijn Veefkind
Peter van Velthoven
Pieternel F. Levelt
The absorbing aerosol index (AAI) is a qualitative parameter directly calculated from satellite-measured reflectance. Its sensitivity to absorbing aerosols in combination with a long-term data record since 1978 makes it an important parameter for climate research. In this study, we attempt to quantify aerosol absorption by retrieving the single-scattering albedo (ω0) at 550 nm from the satellite-measured AAI. In the first part of this study, AAI sensitivity studies are presented exclusively for biomass-burning aerosols. Later on, we employ a radiative transfer model (DISAMAR) to simulate the AAI measured by the Ozone Monitoring Instrument (OMI) in order to derive ω0 at 550 nm. Inputs for the radiative transfer calculations include satellite measurement geometry and surface conditions from OMI, aerosol optical thickness (τ) from the Moderate Resolution Imaging Spectroradiometer (MODIS) and aerosol microphysical parameters from the AErosol RObotic NETwork (AERONET), respectively. This approach is applied to the Chile wildfires for the period from 26 to 30 January 2017, when the OMI-observed AAI of this event reached its peak. The Cloud-Aerosol Lidar with Orthogonal Polarization (CALIOP) overpasses missed the evolution of the smoke plume over the research region; therefore the aerosol profile is parameterized. The simulated plume is at an altitude of 4.5–4.9 km, which is in good agreement with available CALIOP backscatter coefficient measurements. The data may contain pixels outside the plume, so an outlier detection criterion is applied. The results show that the AAI simulated by DISAMAR is consistent with satellite observations. The correlation coefficients fall into the range between 0.85 and 0.95. The retrieved mean ω0 at 550 nm for the entire plume over the research period from 26 to 30 January 2017 varies from 0.81 to 0.87, whereas the nearest AERONET station reported ω0 between 0.89 and 0.92. The difference in geolocation between the AERONET site and the plume, the assumption of homogeneous plume properties, the lack of the aerosol profile information and the uncertainties in the inputs for radiative transfer calculation are primarily responsible for this discrepancy in ω0.
- Article
(10938 KB) - Full-text XML
- BibTeX
- EndNote
Biomass-burning aerosols are generated from combustion of carbon-containing fuels, either by natural or anthropogenic processes (Bond et al., 2004; IPCC, 2014). They are of great concern from the climate perspective (Kaufman et al., 2002; IPCC, 2007, 2014; Koch and Del Genio, 2010; Myhre et al., 2013). The reported radiative forcing of black carbon (BC) produced by fossil fuel and biofuel is around 0.4 W m−2 (0.05–0.80 W m−2) (Ramanathan and Carmichael, 2008; Bond et al., 2013; Huang et al., 2013), but this estimate is highly uncertain. Accurate measurements of the aerosol single-scattering albedo (ω0) on a global scale can reduce the uncertainty in aerosol radiative forcing assessments (Hu et al., 2007). ω0 is defined as the ratio of aerosol scattering over aerosol extinction. Currently ω0 is mainly measured by ground-based instruments (Dubovik et al., 1998; Eck et al., 2003; Petters et al., 2003; Kassianov et al., 2005; Corr et al., 2009; Yin et al., 2015). Satellite sensors, such as the POLarization and Directionality of the Earth's Reflectance (POLDER), can retrieve ω0 from a combination of multi-angular, multispectral observations of the polarized radiation. By measuring the anisotropy of the reflected radiance for each pixel, POLDER is expected to determine the reflected solar flux more accurately (Leroy et al., 1997). Unfortunately, there is no continuous record of ω0 because the first two POLDER missions ended prematurely due to technical problems, and the third POLDER mission only covered the period 2004–2014. Other satellite-derived ω0 is usually retrieved simultaneously with the aerosol optical thickness (τ) based on the predefined aerosol properties, such as the near-UV aerosol product (OMAERUV) of the Ozone Monitoring Instrument (OMI) on board Aura (Torres et al., 2005, 2007). However, this aerosol absorption over near-UV is highly sensitive to the assumption on aerosol layer height. Satheesh et al. (2009) therefore used the τ from Moderate Resolution Imaging Spectroradiometer (MODIS), which is independent of aerosol layer height, to constrain the OMAERUV retrieval. Their validation showed that compared with operational OMAERUV algorithm, the retrieved aerosol layer height using the hybrid method is in a better agreement with air-borne measurements, implying a potential improvement in aerosol absorption retrieval. This OMI–MODIS joint retrieval was also evaluated by Gassó and Torres (2016). They found that, under less absorbing conditions, the hybrid method is sensitive to the variation in the input τ, which is used to select the retrieved pair of aerosol layer height and ω0.
Herman et al. (1997) first defined the near ultra-violet (UV) absorbing aerosol index (AAI), which provides an alternative methodology to retrieve ω0 from satellite observations. The near-UV AAI, usually derived from the spectral range between 340 and 390 nm, is a qualitative measure of absorbing aerosols that was first provided by the Total Ozone Mapping Spectrometer (TOMS) on board Nimbus-7 in 1978. Since then several instruments have contributed to the AAI data record, which now spans over four decades. This long-term record is an important motivation for us to derive quantitative aerosol absorption information from the near-UV channel.
The most important advantage of the satellite-retrieved AAI is that it does not depend on a priori aerosol types, which are major uncertainties in aerosol parameter retrievals, such as τ. Ginoux et al. (2004) suggested that comparing model simulations with AAI from TOMS allows better control of discrepancies because the only error source is the models. Further advantages of AAI are the low reflectivity of the Earth's surface and the absence of significant molecular absorption over the near-UV range. Using this band can ensure that the aerosol absorption is one of the major contributors to the total signal. Moreover, the near-UV AAI is by definition highly sensitive to aerosol absorption. Previous studies have proven the potential of the near-UV AAI of TOMS in absorbing aerosol properties retrieval. Torres et al. (1998) provided the theoretical basis of an inversion method to derive τ and ω0 from backscattered radiation. This method was validated by ground-based observations during the Southern African Regional Science Initiative (SAFARI) 2000 measurement campaign. The agreement of τ and ω0 reaches ±30 % and ±0.03, respectively (Torres et al., 2005). Hu et al. (2007) retrieved global columnar ω0 based on the TOMS AAI with an average uncertainty of 15 %.
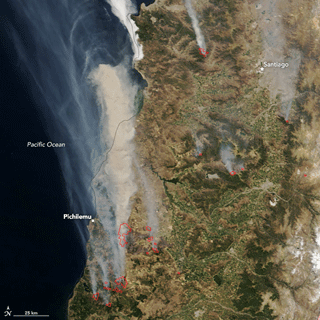
Figure 1Chile wildfires detected by Terra MODIS on 20 January 2017 (image source: NASA's Earth Observatory https://earthobservatory.nasa.gov/images/89496, last access: 11 September 2017).
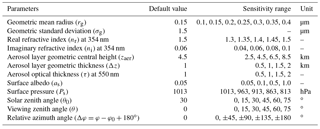
This study is inspired by previous research to quantify the aerosol absorption from AAI. We use the near-UV AAI provided by OMI, the successor of TOMS, to derive the aerosol properties of the central Chile (Pichilemu 34.39∘ S, 72.00∘ W and Consititución 35.33∘ S, 72.42∘ W) wildfires in January 2017. The series of fires was triggered by a combination of long-term drought and high temperature, and this wildfire season was regarded as the worst in national history (The Guardian, 2017). The fires led to massive losses of the local forestry industry (pine and eucalyptus forests) (NASA, 2017). The smoke plume was transported away from the source regions towards the tropical area of the Pacific Ocean by north-westward winds (Fig. 1). In this study, we quantitatively retrieve the ω0 of this smoke by simulating the near-UV AAI of OMI with the radiative transfer model Determining Instrument Specifications and Analysing Methods for Atmospheric Retrieval (DISAMAR). The aerosol inputs of DISAMAR include the τ retrieved from MODIS on board the NASA EOS Aqua satellite, the information on aerosol microphysical parameters provided by AERONET and parameterized aerosol profiles. In the next section, we provide a brief introduction to the near-UV AAI and its sensitivity to various parameters. The methodology and data sets are described in Sect. 3. In Sect. 4, retrieved results and uncertainty analysis of Chile 2017 wildfires are discussed, followed by the main conclusions in Sect. 5.
In this section, we first introduce the near-UV AAI. In the sensitivity analysis, we show that the AAI depends not only on aerosol parameters but also on the surface conditions and the observational geometry. The sensitivity analysis in this study is only designed for biomass-burning aerosols.
2.1 Near-UV AAI definition
The concept of the near-UV AAI was first conceived to detect UV-absorbing aerosols from the spectral contrast provided by TOMS observations, known as the residue method (Herman et al., 1997). The basic idea of the residue method is that in a pure Rayleigh atmosphere, the reflectance (or equivalently the radiance, Iλ) decreases strongly with wavelength. The presence of absorbing aerosols will reduce this spectral dependency of Iλ. The change in this wavelength dependency is summarized as the AAI, which is calculated from the Iλ at the wavelength pair λ1 and λ2 (λ1<λ2):
Superscript Obs and Ray refer to Iλ measured by satellite and calculated using a Rayleigh atmosphere, respectively. The longer wavelength λ2 is treated as the reference wavelength, where the surface albedo (as) is determined by fitting the observed radiance, i.e. . This is done using an atmosphere containing only molecular scattering bounded by a Lambertian surface. The spectral dependency of as is neglected; thus is calculated using the same value as λ2. Defining , Eq. (1) can be rewritten as follows:
It is advantageous to use Eq. (2) because the AAI can be simply interpreted as the ratio between the simulated and observed radiance at λ1.
2.2 Near-UV AAI sensitivity studies
In this section, we present results of sensitivity studies performed by the radiative transfer model DISAMAR. DISAMAR can perform simulations of the forward Iλ spectrum with a wide spectral coverage (270 nm to 2.4 µm) and model scattering and absorption by gases, aerosols and clouds as well as reflection by the surface (de Haan, 2011). It uses either the doubling–adding method or the Layer Based Orders of Scattering (LABOS) for the radiative transfer calculations. In this study the latter one is employed, because it is less computationally intensive (de Haan et al., 1987; de Haan, 2011).
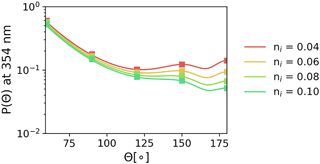
DISAMAR allows several aerosol-scattering approximations to be applied. Here we assume Mie-scattering aerosols. The parameters used to describe Mie particles and their corresponding values are listed in Table 1. Considering the Chile wildfire plumes, which were dominated by biomass-burning aerosols, these sensitivity studies are specifically performed for parameterized smoke aerosols, assuming only fine-mode particles and weak linear wavelength dependency of the complex refractive index (nr and ni). The default values refer to observations of the daily average of the AERONET station Santiago_Beauchef (33.46∘ S, 70.66∘ W) on 27 January. We obtain the size distribution function and complex refractive index at 440, 675, 880 and 1018 nm from AERONET and apply a linear interpolation/extrapolation to derive the complex refractive index over the spectrum from 340 to 675 nm, with spectral resolutions of 2 nm. Then DISAMAR uses the above information to calculate the aerosol phase function P(Θ) and ω0 over the full spectrum (340 to 675 nm). The corresponding P(Θ) at 354 nm for the default case (rg=0.15 µm, nr=1.5 and ni=0.06) is presented in Fig. 2. P(Θ) are provided for other cases in the Appendix A (Figs. A1, A2 and A3). DISAMAR requires τ to be defined at 550 nm. Surface parameters include a spectrally flat as and a surface pressure Ps. The aerosol profile is parameterized as a single-layer box shape, with its bottom at and top at , where zaer and Δz are the geometric central height and the geometric thickness of the aerosol layer, respectively. The whole sensitivity analysis is performed for the cloud-free condition. The wavelength pair of OMI (354 and 388 nm) is applied to compute the AAI. To make different sensitivity studies comparable, the AAI calculated in this section is normalized by the maximum value in each case. Note that sensitivity studies always use the default settings listed in Table 1 unless different values are explicitly mentioned.
Aerosol optical properties are determined by microphysics, such as the real and imaginary parts of the complex refractive index (nr and ni), and the particle size (rg). Figure 3 shows how the variation of the AAI, , as well as the optical properties (ω0 and the asymmetry factor g) are associated with the complex refractive index and the particle size. The asymmetry factor g is the averaged cosine of the scattering angle Θ, weighted by P(Θ). Figure 3 shows that the effect of the complex refractive index is dual. As shown in Fig. 3a, an increase in the real part of the refractive index nr directly enhances the magnitude of , whereas reduces. This results in low values of the AAI, which correspond to high ω0 (Fig. 3b). Under the condition that the measurement angle is Θ=150∘, the declining g implies that more light is scattered in the line-of-sight of the detector; thus is higher. Conversely, the imaginary part of the refractive index ni, which is directly associated with ω0, has an opposite influence; see Fig. 3c and d. The particle size distribution has a more complicated influence on the AAI. As shown in Fig. 3e, the AAI primarily follows the behaviour of , which decreases first and then increases when rg is varying from 0.1 to 0.4 µm, whereas ω0 is continuously decreasing and g is continuously increasing.
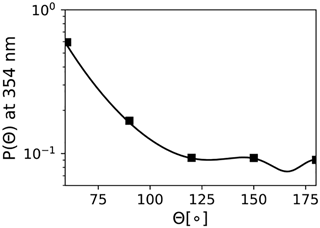
Figure 2Phase function P(Θ) at 354 nm of the parameterized Mie-scattering aerosol of default case (rg=0.15 µm, nr=1.5 and ni=0.06) in sensitivity analysis. The markers in the plot correspond to the value when Θ=60, 90, 120, 150, 180∘.
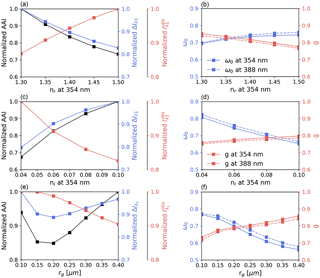
Figure 3AAI sensitivity to microphysical parameters ni (a, b), nr (c, d) and rg (e, f). The left panels (a, c, e) show the sensitivity of the normalized AAI (black), the normalized (blue) and the normalized (red). The right panels (b, d, f) show ω0 (blue) and g (red) at wavelengths 354 (solid line) and 388 nm (dashed line), respectively.

Figure 5AAI sensitivity to surface parameters Ps (a) and as (b). The solid line and dashed line in panel (b) indicate terrain height at sea level (Ps=1013 hPa) and elevated terrain height (Ps=813 hPa), respectively.
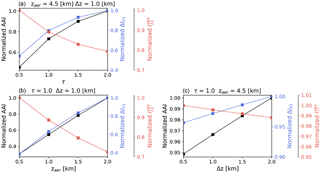
In addition to the microphysics, the aerosol amount and distribution also have strong influences on the AAI. As shown in Fig. 4a, the AAI is positively correlated with τ. The AAI is highly sensitive to the aerosol vertical distribution (Herman et al., 1997; Torres et al., 1998; de Graaf et al., 2005). As the aerosol layer ascends (Fig. 4b), more molecular scattering beneath the aerosol layer is shielded, which reduces while increasing . The relation between the AAI and zaer is almost linear. Figure 4c shows that, at the same altitude, the AAI slightly increases with the geometrical thickness of the aerosol layer. The reason could be that a larger Δz indicates that the sunlight has a higher probability of being absorbed by aerosols, slightly enhancing the aerosol absorption. Although the sensitivity exists, the impact is only up to 5 %, which is negligible for practical purposes.
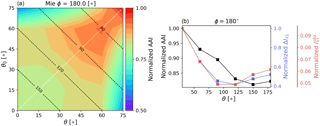
Figure 6AAI sensitivity to θ and θ0 at φ=180∘. The black dashed contour in panel (a) indicates Θ=60, 90, 120, 150∘. The white dashed line in panel (a) indicates the cross section along viewing angles, with its corresponding normalized AAI, and presented in panel (b).
The calculated AAI does not only depend on aerosols themselves but also on ambient conditions such as surface and clouds. Although the near-UV AAI is capable of distinguishing absorbing and non-absorbing agents (Herman et al., 1997) and even retrieving aerosol information over clouds (Torres et al., 2012), the uncertainty triggered by clouds is relatively high and therefore cloudy conditions are excluded from this study. Surface conditions are parameterized by Ps and as. It can be seen from Fig. 5a that a decrease in Ps, or equivalently an elevated terrain height, leads to less Rayleigh scattering shielded between the surface and the aerosol layer. As a result, the AAI decreases significantly due to smaller , in agreement with previous studies (de Graaf et al., 2005; Colarco et al., 2017). According to de Graaf et al. (2005), increasing as has two counteracting effects. On the one hand, it increases the amount of directly reflected radiation at the top of the atmosphere, namely a larger , and on the other hand it enhances the role of absorption by the aerosol layer rather than the surface, namely a larger . The dominant effect of as also depends on Ps (Fig. 5b). When the aerosol layer is relative to the sea level (Ps=1013 hPa), the first effect dominates. However, a brighter surface compensates the loss of molecular scattering shielded by the aerosols when the terrain height rises (Ps=813 hPa), which makes the absorbing layer more detectable.
The AAI also depends on the sun-satellite geometry. Here we provide the AAI as a function of the measurement geometry for the default case with the relative azimuth angle Δφ=180∘. As presented in Fig. 6a, the AAI becomes very sensitive to the geometries with zenith angles is larger than 60∘, which confirms previous research (Herman et al., 1997; Torres et al., 1998; de Graaf et al., 2005). This is mainly due to the significant growth of P(Θ) when Θ becomes smaller (Fig. 2). Thus, it is suggested that the OMI measurement with θ0 larger than this value should be removed due to large variations in the AAI. To analyse the radiance behaviour as previously, we plotted the and as a function of Θ along the cross section, respectively (Fig. 6b). It is noted that increases when Θ is larger than 90∘, whereas the P(Θ) decreases at this range Θ (Fig. 2). The reason could be that the Rayleigh scattering has an increasing contribution to the total radiance at those measurement angles (backscattering).
In this section, we first present the data sets and their pre-processing in this study, followed by the strategy used to retrieve the aerosol ω0 by constraining the simulated near-UV AAI with the observed one.
3.1 Data sets
3.1.1 OMI and GOME-2 absorbing aerosol index
The TOMS near-UV AAI retrieval has been proven to be a robust algorithm and applied to successive sensors, such as OMI on board Aura and GOME-2 on board MetOp-A/B. GOME-2 has higher spectral resolution (0.2–0.4 nm) than TOMS, but the spatial resolution is rather coarse (80×40 km2). In this study, GOME-2-measured AAI at wavelength pair 340 and 380 nm (http://archive.eumetsat.int, last access: 14 July 2017) is only an independent data set used to assess the potential bias of the OMI measurements.
OMI combines advantages of both TOMS and GOME-2. It covers wavelengths from 264 to 504 nm with a spectral resolution of approximately 0.5 nm and has a much higher spatial resolution than GOME-2 of 13×24 km2 (Levelt et al., 2006). Note that GOME-2 and OMI have different equator crossing times (09:30 LT descending node for GOME-2 and 13:45 LT ascending node for OMI) that may affect the intercomparison of the two satellite measurements.
Since the launch of OMI in 2004, the AAI retrieved from this instrument has been widely used in various applications. Kaskaoutis et al. (2010) employed the OMI-measured AAI for regional research on the aerosol temporal and spatial distributions in Greece. Torres et al. (2012) utilized the advantage of near-UV AAI to detect aerosols over clouds. The OMI-observed AAI was even used to evaluate the impact of surface dust loading on human health (Deroubaix et al., 2013). Buchard et al. (2015) also validated the NASA MERRA aerosol reanalysis product with the AAI retrieved from OMI.
In this study, the OMI level 2 product OMAERO (https://disc.gsfc.nasa.gov, last access: 31 December 2017) is used to provide the AAI retrieved at the wavelength pair of 354 and 388 nm, and the corresponding viewing geometry and the surface condition when the measurements took place. The samples are included in the radiative transfer simulation only if θ0 is smaller than 60∘ and if satellite pixels are not contaminated by sun glint, clouds, row anomalies or other errors of the instrument. The simulation is only applied to pixels inside the biomass-burning plume, which is defined as AAI values larger than 1 for both OMI and GOME-2.
3.1.2 MODIS and OMI aerosol optical thickness
MODIS on board Aqua/Terra is a sensor that was specifically designed for atmosphere and climate research. The combination of two satellites ensures a daily global coverage. The spatial resolution ranges from 250 m to 1 km and it has 36 spectral bands from 400 nm to 14.4 µm (Remer et al., 2005). MODIS employs separated algorithms for aerosol retrieval over oceans and land (Tanré et al., 1997; Kaufman and Tanré, 1998; Hsu et al., 2004; Remer et al., 2005). Currently the τ provided by MODIS is one of the most reliable data sets (Lee et al., 2009), with an estimated uncertainty of only 3 %–5 % over ocean and 5 %–15 % over land (Remer et al., 2005). Besides, the MODIS-retrieved τ is free from the uncertainty triggered by assumed aerosol profile (Satheesh et al., 2009). As mentioned before, DISAMAR requires τ at 550 nm. This study uses cloud-filtered τ at 550 nm from the Collection 6 level 2 product MYD04 as the input for radiative transfer calculation (https://ladsweb.modaps.eosdis.nasa.gov, last access: 27 February 2017).
In addition, the τ measured by OMI and AERONET are compared with MODIS. The OMAERO τ retrieval uses multispectral fitting techniques. The retrieved τ is reported in good accordance with AERONET and is highly correlated with MODIS (Torres et al., 2007), with a correlation of 0.66 over land and 0.79 over oceans (Curier et al., 2008), although it suffers from cloud contamination due to the relatively coarse spatial resolution of OMI. Considering the wavelength difference, the τ measured by OMI at 442 nm has to be transferred to 550 nm using the Ångström exponent (ÅE) 440–675 nm taken from AERONET near the time at which OMI flies over the selected site. The AERONET data set used in this study is introduced in the next section.
3.1.3 AERONET aerosol properties
AERONET is an aerosol monitoring network of ground-based sun photometers. With standardized instruments, calibration, processing and distribution, AERONET provides a long-term global database for aerosol research and air-borne and space-borne measurement validation. The system takes two basic measurements. The τ and ÅE are retrieved from the direct solar irradiance measurements; the rg, P(Θ) (Nakajima et al., 1983, 1996), ω0 (Dubovik et al., 1998), nr and ni (Dubovik and King, 2000) are derived from multi-angular measurements of sky radiance.
The AERONET site nearest to the fire sources of 2017 Chile wildfires is the Santiago_Beauchef (33.46∘ S, 70.66∘ W) (https://aeronet.gsfc.nasa.gov, last access: 11 August 2017). The data set in use is the version 2 level 1.5 product. To minimize the influence of temporal difference, the parameters of AERONET measured closest to the time of the OMI overpasses are used to simulate the optical properties of Mie-scattering aerosols in DISAMAR. Note that the AERONET level 1.5 data set is not quality assured. In addition, the location of this AERONET site is in downtown of Santiago City and close to major roads, where the presence of scattering urban aerosols may bias the measurements of the plume.
The AERONET-retrieved τ and ω0 are used to evaluate the MODIS τ and retrieved ω0, respectively. The AERONET-measured τ is transferred to 550 nm using the ÅE in the range 440–675 nm, while the ω0 at 550 nm is linearly interpolated by values at 440 and 675 nm.
The AERONET inversion product needs to be processed into the inputs required by DISAMAR. Firstly, a conversion from the volume size distribution V(rv,σv) provided by AERONET to the number size distribution N(rg,σg) used in DISAMAR is required:
The following relation between the geometric and volumetric mean radii (rg and rv) and standard deviations (σg and σv) is assumed:
The fine- and coarse-mode particle sizes are derived by finding the two peaks of the log-normal distribution function provided by AERONET. The complex refractive index is assumed the same for both modes. Since bimodal aerosol is not yet applicable in DISAMAR, we first calculate the optical properties of two modes individually, then we externally combine the optical properties of two modes into a bimodal aerosol with a fraction:
Then the weights for calculating the total ω0 of the mixed aerosol are as follows:
where the σf and σc are the extinction cross section of the fine and coarse aerosols. The expansion coefficients of the mixed aerosol are weighed by the ω0 of the fine and coarse aerosols (ω0,f and ω0,c):
The AERONET instrument at this site only covers the visible and infrared bands (440 to 1018 nm) for sky radiance measurements, i.e. no aerosol inversion products at the UV band. Due to the absence of observations, assumptions have to be made on the spectral dependency of aerosol properties to obtain their values in the near-UV range. The properties of biomass-burning aerosols depend on the type of fuel, the procedure producing the smoke, the age of the smoke and also the atmospheric conditions (Reid et al., 2005). Using measurements to constrain the input aerosol refractive index may reduce the uncertainties due to a priori knowledge. Our treatment of the complex refractive index is as follows: (1) take the complex refractive index at the visible band (440 to 675 nm) from AERONET measurements; (2) linearly extrapolate the complex refractive index to the near-UV band. The real part nr for radiative transfer calculation is obtained in this step. A slight wavelength dependency of nr is found (Fig. 9a); (3) for the imaginary part ni, we multiply it (for the entire wavelength from UV to visible) with a scaling factor as we set it as a free parameter. By varying the value of the scaling factor, both the magnitude and the wavelength dependency of ni can change to meet the requirement of the retrieval (Fig. 9b).
3.1.4 CALIOP backscattering coefficient
The CALIOP on board CALIPSO, which was launched in 2006, provides high-resolution profiles of aerosols and clouds. It has three channels with one measuring the backscattering intensity at 1064 nm and the rest measuring orthogonally polarized components at 532 nm backscattering intensity (Winker et al., 2009). Due to the limited spatial coverage, CALIOP did not observe the Chile wildfires plume for all the cases in which the OMI observations available. We only use the total attenuated backscatter at 532 nm from level 1B version 4.10 standard data to evaluate the parameterized aerosol profiles (https://eosweb.larc.nasa.gov/project/calipso/calipso_table, last access: 12 July 2017).
3.2 Methodology
In this study, we employ the radiative transfer model DISAMAR to simulate the near-UV AAI from OMI and to derive the ω0 for a specific case, i.e. the Chile wildfires in January 2017. We select the period from 26 to 30 January 2017 (28 January is excluded due to a lack of data) when the AAI value reached its peak during the wildfire period.
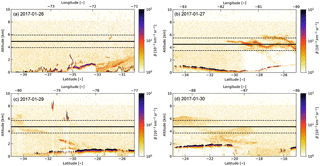
Figure 7CALIOP backscatter coefficient β at 532 nm. The solid and dashed lines indicate the retrieved zaer and Δz. The red and black dots indicate clouds, and the orange dots indicate aerosol layers.
The forward simulation consists of two major steps. First, DISAMAR calculates the Mie aerosol optical properties with aerosol microphysical information taken from AERONET measurements (rg, nr and ni). As mentioned in Sect. 3.1.3, we set the spectral-dependent imaginary refractive index ni as a free parameter to vary ω0. Then, DISAMAR operates radiative transfer calculation with the input aerosol properties and environmental conditions of OMI.
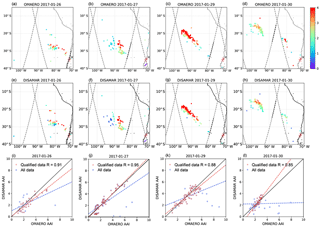
Figure 8AAI from OMI observations (a–d) and DISAMAR simulations (e–h) of the Chile wildfires on 26, 27, 29 and 30 January 2017. The black and red cross symbols are the AERONET station and the main fire sources (Pichilemu 34.39∘ W, 72.00∘ S and Consititución 35.33∘ S, 72.42∘ W). The grey dashed line indicates the CALIOP overpasses in the region of interest, where the overpasses used to validate the plume height are marked by black dashed lines. The scatter plots (i–l) present the OMI observations against DISAMAR simulations for only qualified data (red dot) and all data (blue dot), respectively.
It is noted that the observed aerosol vertical distribution is limited for the Chile wildfires. Previous research suggested the AAI cannot be quantitatively used without τ or zaer information (Gassó and Torres, 2016). Instead, we implement the same parameterization on the aerosol profile as in the sensitivity studies. Since the AAI dependency on Δz is minor (Fig. 4c), and to reduce the computational cost, Δz is set to a constant of 2 km based on the information from the CALIOP measurements of the backscattering coefficient (β) at 532 nm (Fig. 7). The zaer to which the AAI is highly sensitive is treated as an unknown variable to be retrieved together with ω0.
Consequently, with various combinations of zaer and ω0 a look-up table (LUT) of the calculated AAI is constructed by radiative transfer calculations. It should be noted that for all pixels in the plume we assume the same aerosol microphysical properties as well as the same aerosol layer height. Pixels outside the plume (even they have AAI values larger than 1) may have significantly different properties and this will affect the results. As shown in Fig. 8, the distribution of OMI measurements is sparse in space. These geographical outliers may cause the heterogeneous properties of the plume. Consequently, we apply a data quality control procedure before retrieving ω0. First, we manually remove the pixels that are geographically isolated from the main plume. Furthermore, we remove potential outliers based on statistical tool. We filter the data set using an outlier detection criterion based on the interquartile range (IQR) of the AAI difference between DISAMAR simulations and OMI measurements. According to Tukey's fences (Tukey, 1977), an AAI difference falling outside the range between Q1 − 1.5 IQR and Q3 + 1.5 IQR may be regarded as an outlier and removed, where Q1 and Q3 are the first and third quartiles of the AAI difference, and the IQR is the range between Q1 and Q3. Only the pixels passing the outlier detection criterion are used to calculate the cost function (Eq. 12):
Here AAIi indicates the AAI for the ith satellite pixel of the selected OMI data; subscript DSM and OMI indicate the DISAMAR simulation and the OMI observation. The combination of zaer and ω0 that leads to the minimum AAI residue is used as the retrieval results.
Finally, the simulated AAI is compared with OMI observations. We also employ the independent data from GOME-2 as a reference for identifying the potential bias of OMI. Similarly, the τ retrieved from OMI and AERONET serve as a reference for MODIS. The estimated aerosol layer height and ω0 at 550 nm are evaluated with independent observations from CALIOP and AERONET, respectively.
By applying the methodology described in the previous section, we quantitatively retrieved the aerosol layer height and ω0 at 550 nm of the Chile 2017 wildfires by AAI simulation. The OMI measurements of the plume are displayed in Fig. 8a–d. The presented satellite pixels are larger than 1 with AAI values and free of cloud contamination, sun glint and row anomaly of the instrument. Fortunately, the remaining data are still able to capture the main plume features. It can be clearly seen that, from 26 to 30 January, the plume produced by wildfires in the central Chile was transported by the south-easterly trade wind from the continent towards the lower-latitude region of the Pacific Ocean. The plume travelled over a distance of 3000 km during the period.
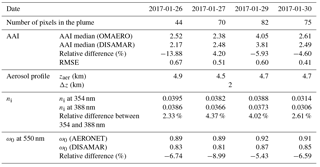
Table 2Summary of retrieved results (after applying IQR outlier detection). The date format is yyyy-mm-dd.
The vertical movement of the plume is given by CALIOP backscattering coefficient measurements (β) at 532 nm (Fig. 7). The CALIOP overpasses closest to the plume are marked by a black dashed line in Fig. 7. It is noted that due to the spatial coverage and the measuring time difference, CALIOP are not able to represent the entire plume detected by OMI. The aerosol layer captured by CALIOP is distributed from 2 to 6 km, with an average height at approximately 4–5 km. The ascent of the plume was driven by the heat generated by the fires and aerosol sunlight absorption, as well as the atmospheric vertical motions.
Figure 8e–h show the AAI simulation selected by the data quality control mentioned in Sect. 3.2. The spatial distribution of the simulated AAI shows similar patterns to the OMI observations. Some data points that are geographically isolated from the plume may differ strongly from observations inside the plume, although their AAI values are larger than 1, e.g. on 26 and 30 January. Including these outliers in the optimization could bias the retrieved aerosol properties. This can also be seen in Fig. 8i–l, where the points passing the data quality control described in Sect. 3.2 are highlighted in red. By removing the outliers, the average spatial correlation coefficient reaches 0.90.
Table 2 lists the statistics of the qualified AAI data, in terms of the median, relative difference and RMSE. The median of measured AAI ranges from 2 to 4 during the research period. Except for 26 January, the median of the simulated AAI in other cases is in good agreement with the measurements, with relative differences within ±6 %. The RMSE is only acceptable and reflects that part of the plume cannot be fit with the assumed homogeneous aerosol properties in the forward simulation. The majority of the simulated AAI for 26 January is negatively biased, which is reflected by the small slope without an intercept correction in Fig. 8i. A systematic bias in the inputs might cause this result. In terms of ω0, both the AERONET-measured and the AAI-retrieved aerosol absorption become weaker with time (Table 2). Although the simulated and observed AAI are in good agreement, the difference in ω0 is significant. The mean of the retrieved ω0 at 550 nm for the whole period is 0.84, in contrast to the AERONET measurements with a mean value of 0.90.
There are many sources contributing to the discrepancy in ω0. First of all, the nearest site Santiago_Beauchef is not exactly in the primary biomass-burning regions as mentioned in Sect. 3.1.3. The AERONET site is located in the centre, where reflective urban or industrial aerosols may have been mixed with the smoke and enhanced the ω0. This would also affect the spectral dependency of the complex refractive index used to constrain the radiative transfer calculation. According to Table 2, the retrieved ni reveals that the difference between 354 and 388 nm is less than 5 %. This small spectral dependency of ni is mainly determined by AERONET measurements in the visible band (dashed lines in Fig. 9b), whereas the effect of the scaling factor is minor in this case. We thus find a much weaker wavelength dependency than the value in the Jethva and Torres (2011) study, where a 20 % difference between the two UV wavelengths was applied to OMAERUV algorithm to achieve the result that 70 % of the retrieved ω0 differ less than ±0.03 from the ω0 from the AERONET measurements. This 20 % spectral dependency adopted in their work is associated with findings by Kirchstetter et al. (2004). According to them, the absorbing Ångström exponent (AÅE) of urban pollution is a near unit root and that of the biomass-burning aerosol ranges is approximately 2 between 300 nm and 1 µm. In terms of ni, a 20 % increase at 354 nm with respect to the value at 388 nm is equivalent to an AÅE value between 2.5 and 3, depending on the aerosol models of OMAERUV (Jethva and Torres, 2011). Hoffer et al. (2006) also found similar results. They conducted in situ measurements on humic-like substances (HULIS) of Amazonia biomass-burning aerosols and found that around 35 %–50 % of light absorption occurred at 300 nm, whereas only around 15 % occurred at 400 nm. Bergstrom et al. (2007) also confirmed this conclusion from several field programs (SAFARI 2000, ACE Asia, PRIDE, TARFOX, INTEX-A). From the sensitivity study by Jethva and Torres (2011), a stronger spectral dependency of ni between 354 and 388 nm would allow simulations to reach the same AAI with ni at a relatively low level. In our study, this means retrieving a lower ω0 at 550 nm. The presence of non-absorbing aerosols may enhance the measured ni in the visible band and the linear extension would weaken the spectral dependency, particularly in the UV spectral range. Furthermore, the AERONET inversion product is not error-free. The uncertainty of size distribution retrieval is minor for biomass-burning aerosols (Dubovik et al., 2000), but under optically thick circumstances, even when retrievals are quality assured (i.e. level 2 data), the reported accuracies of the complex refractive index are 0.04 for nr and 30 %–50 % for ni (Dubovik et al., 2002). It is also reported that AERONET tends to underestimate the absorption of biomass-burning aerosols compared with in situ measurements (Dubovik et al., 2002; Reid et al., 2005). The uncertainty of ω0 is 0.03 under high aerosol loading (τ440>0.5) and 0.05–0.07 under low aerosol loading (Dubovik et al., 2002; Holben et al., 2006). Last but not least, the spatial representation of the in situ instrument is also a concern. Santese et al. (2007) showed that the selected AERONET aerosol parameters can be representative of a 300×300 km2 south-eastern Italy area. For the Chile wildfires with the most remote pixels over 3000 km away from the continent, the measurements at AERONET cannot fully represent the plume detected by the satellite.
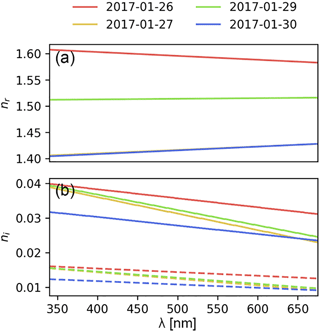
Figure 9Retrieved complex refractive index for each case: (a) nr and (b) ni. The dashed line in panel (b) is the wavelength-dependent ni measured by AERONET.
Apart from AERONET itself, information from other data sets could also bias the estimation of aerosol absorption. Among all the inputs, the parameterization of the one-layer box-shaped aerosol profile could be the largest error source. Although the influence of Δz on the AAI is limited (Fig. 4c), the AAI calculation highly depends on zaer (Fig. 4b). As shown in Table 2, the estimated plume altitude varies from 4.5 to 4.9 km. As the black solid line indicated in Fig. 7, the retrieved zaer can approximately capture the measured plume height. The zaer on 26 January seems overestimated because of the temporal and spatial difference. Concretely, CALIOP sampled the plume near the sources and close to the surface, while the plume observed by OMI had been already elevated and transported to the open ocean. The lack of information on the real plume height makes it challenging to determine whether the plume height is responsible for the systematic bias in Fig. 8i. Except for 26 January, zaer in other cases is in good agreement with what CALIOP observed. Although the retrieved aerosol layer heights are convincing to some extent, one should keep in mind that CALIOP and OMI observations are not exactly co-located. Besides, the parameterized aerosol profiles may fail to represent the spatial variation of the plume. Therefore, the uncertainty cannot be directly determined due to the lack of validation data.
Among the 4 days for which we retrieved ω0, the value for 27 January is significantly lower than others. For this day the agreement in terms of zaer with CALIOP is reasonable. We therefore explore the effect of observational biases of the AAI and τ on the retrieved ω0. We investigate the potential bias of these two data sets by plotting the histogram of the AAI measurement difference between GOME-2 and OMI (Fig. 10a), against the τ measurement difference between MODIS and OMI (Fig. 10b, both are converted into 550 nm). It is clear that on 27 January, the AAI from OMI seems to be overestimated compared to GOME-2. Although the difference in instrumental design and wavelength pair choice for AAI retrieval, measurement conditions, etc. could contribute to the AAI discrepancy between GOME-2 and OMI, exploring the difference between the two data sets is beyond the scope of this study. In terms of input aerosol concentration, the τ from MODIS could be potentially underestimated. Fitting a higher AAI with a lower input τ leads to an overestimation in aerosol absorption. Here, we analytically quantify the impact of τ for this specific case by systematically enhancing the τ of MODIS with a constant variation (Δτ) added to all pixels, with the AAI level and the aerosol layer height unchanged. Figure 10c presents how the AAI RMSE and the estimated ω0 respond to the enhanced τ. It can be clearly seen that an increase in overall τ level by 0.07 raises ω0 to 0.84 and optimizes the AAI simulation to a RMSE less than 0.45. If we apply this τ adaption, the retrieved ω0 of 27 January becomes more consistent with the other days.
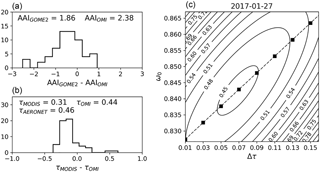
Figure 10Histogram of (a) the AAI difference between GOME-2 and OMI, compared to (b) the τ difference at 550 nm between MODIS and OMI for 27 January. Contour of (c) the AAI RMSE as a function of variation in τ and ω0 for 27 January. The dashed line is the best estimation for each pair of Δτ and ω0.
Apart from the observational errors in AERONET, OMI and MODIS data, the assumption that the plume features are homogeneous could also result in the discrepancy between the AAI-retrieved and the AERONET-measured ω0. In reality, the plume altitude, the optical properties and even the chemical compositions could vary from pixel to pixel, while our simulations cannot consider those effects.
Biomass burning is a major source of absorbing aerosols making a significant contribution to climate warming. Quantitatively characterizing the absorption of biomass-burning aerosols is therefore important to reduce the uncertainty in assessments of global aerosol radiative forcing. Facing the lack of a long-term ω0 record, this study explores an approach to retrieve ω0 based on reflectivity in the near-UV channel measured by OMI. Although AAI is not a geophysical parameter and depends on many factors, its independency from predefined aerosol types, its high sensitivity to aerosol absorption and its long-term data record make it an attractive for aerosol research.
We test the retrieval of ω0 for the wildfires in central Chile in January 2017. After filtering the data from the outliers, high spatial correlation coefficients (0.85 to 0.95) are between the simulated and observed AAI. The retrieved aerosol layer heights indicate that the plume was elevated to a height of 4.5–4.9 km during the research period. These results are in agreement with CALIOP measurements. This plume average of the retrieved ω0 at 550 nm is approximately 0.84, which is 0.06 lower than that of AERONET retrieval. The sources for discrepancy include the location of the AERONET site that may bias the measured ω0 and complex refractive index; the simplified parameterization of the aerosol profile; the insufficient spatial representativeness of a single AERONET site; the observational errors in the input aerosol microphysics, τ, as well as AAI; and the assumption of homogeneous plume properties. We quantitatively analyse the uncertainty of τ for a specific case (27 January) when the estimated aerosol layer height is in good agreement with the CALIOP measurements. An improvement in retrieved ω0 can be seen by adapting the magnitude of the aerosol concentration.
This study proves the potential of utilizing OMI-measured AAI to quantitatively characterize aerosol absorption such as ω0. Currently, it is challenging to retrieve and validate results without reliable aerosol profile information. In the future, the availability of daily global aerosol layer height data (e.g. the L2 aerosol layer height product of TROPOspheric Monitoring Instrument on board Sentinel-5 Precursor, TROPOMI, that is under development; Sanders and de Haan, 2016) are expected to provide a stronger constraint on the forward calculation and to reduce the uncertainty in the retrieved aerosol properties. It is also reliable to retrieve aerosol absorption for each individual pixel with a constraint on the aerosol layer height information. The problem due to the poor spatial representativeness of in situ measurements can then be eased by comparing with the satellite pixels near the ground-based instruments. Perhaps, more sophisticated assumptions of spectral-dependent aerosol absorption (e.g. steeper gradient of ni in UV than visible band) have to be made and evaluated by other observational aerosol properties in UV spectral range, e.g. measuring AERONET τ in the UV band instead of only depending on measured refractive index in the visible band.
All the data used in this study can be freely accessed. The OMAERO can be accessed via https://disc.gsfc.nasa.gov (last access: 31 December 2017, Stammes, P. and Noordhoek, 2002). The GOME-2 data can be accessed via http://archive.eumetsat.int (last access: 14 July 2017, Tilstra et al., 2002). The MYD04 can be accessed via https://ladsweb.modaps.eosdis.nasa.gov (last access: 27 February 2017; Levy et al., 2013). The Santiago_Beauchef AERONET data can be accessed via https://aeronet.gsfc.nasa.gov (last access: 11 August 2017, Dubovik and King, 2000; Dubovik et al., 2000). The CALIOP level 1B data can be accessed via https://eosweb.larc.nasa.gov/project/calipso/calipso_table (last access: 17 July 2017, Winker et al., 2009).
The radiative transfer model used in this study (DISAMAR) is proprietary thus is not shared with public.
All the results created in this study are available with the permission of authors. If you are interested, please send an email to jiyunting.sun@knmi.nl.
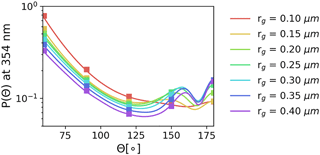
Figure A1Phase function P(Θ) at 354 nm of the parameterized Mie-scattering aerosol in sensitivity studies as a function of rg (with nr=1.5 and ni=0.06). The markers in the plot correspond to values when Θ=60, 90, 120, 150, 180∘.
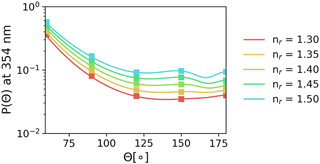
Figure A2Phase function P(Θ) at 354 nm of the parameterized Mie-scattering aerosol in sensitivity studies as a function of nr (with rg=0.15 µm and ni=0.06). The markers in the plot correspond to values when Θ=60, 90, 120, 150, 180∘.
JS, PPV and PvV together conceived the study. PPV and PvV helped to designed the study. JS performed the experiments with guidance of PPV and PvV. JS prepared the manuscript with contributions from all authors. PFL reviewed and edited the manuscript.
The authors declare that they have no conflict of interest.
This work was performed in the framework of the KNMI Multi-Annual Strategic
Research (MSO). The authors thank NASA's GES-DISC, LAADS DAAC and ASDC
for free online access of OMI, MODIS and CALIOP data. The authors also thank
the Centre for Climate Resilience Research (CR)2 at the University of Chile
(CONICYT/FONDAP/15110009) for providing the data from the Santiago_Beauchef AERONET station.
Edited by: Hiren Jethva
Reviewed by: three anonymous referees
Bergstrom, R. W., Pilewskie, P., Russell, P. B., Redemann, J., Bond, T. C., Quinn, P. K., and Sierau, B.: Spectral absorption properties of atmospheric aerosols, Atmos. Chem. Phys., 7, 5937–5943, https://doi.org/10.5194/acp-7-5937-2007, 2007.
Bond, T. C., Streets, D. G., Yarber, K. F., Nelson, S. M., Woo, J. H., and Klimont, Z.: A technology-based global inventory of black and organic carbon emissions from combustion, J. Geophys. Res.-Atmos., 109, D14203, https://doi.org/10.1029/2003JD003697, 2004.
Bond, T. C., Doherty, S. J., Fahey, D. W., Forster, P. M., Berntsen, T., Deangelo, B. J., Flanner, M. G., Ghan, S., Karcher, B., Koch, D., Kinne, S., Kondo, Y., Quinn, P. K., Sarofim, M. C., Schultz, M. G., Schulz, M., Venkataraman, C., Zhang, H., Zhang, S., Bellouin, N., Guttikunda, S. K., Hopke, P. K., Jacobson, M. Z., Kaiser, J. W., Klimont, Z., Lohmann, U., Schwarz, J. P., Shindell, D., Storelvmo, T., Warren, S. G., and Zender, C. S.: Bounding the role of black carbon in the climate system: A scientific assessment, J. Geophys. Res.-Atmos., 118, 5380–5552, https://doi.org/10.1002/jgrd.50171, 2013.
Buchard, V., da Silva, A. M., Colarco, P. R., Darmenov, A., Randles, C. A., Govindaraju, R., Torres, O., Campbell, J., and Spurr, R.: Using the OMI aerosol index and absorption aerosol optical depth to evaluate the NASA MERRA Aerosol Reanalysis, Atmos. Chem. Phys., 15, 5743–5760, https://doi.org/10.5194/acp-15-5743-2015, 2015.
Colarco, P. R., Gassó, S., Ahn, C., Buchard, V., da Silva, A. M., and Torres, O.: Simulation of the Ozone Monitoring Instrument aerosol index using the NASA Goddard Earth Observing System aerosol reanalysis products, Atmos. Meas. Tech., 10, 4121–4134, https://doi.org/10.5194/amt-10-4121-2017, 2017.
Corr, C. A., Krotkov, N., Madronich, S., Slusser, J. R., Holben, B., Gao, W., Flynn, J., Lefer, B., and Kreidenweis, S. M.: Retrieval of aerosol single scattering albedo at ultraviolet wavelengths at the T1 site during MILAGRO, Atmos. Chem. Phys., 9, 5813–5827, https://doi.org/10.5194/acp-9-5813-2009, 2009.
Curier, R. L., Veefkind, J. P., Braak, R., Veihelmann, B., Torres, O., and de Leeuw, G.: Retrieval of aerosol optical properties from OMI radiances using a multiwavelength algorithm: Application to western Europe, J. Geophys. Res.-Atmos., 113, D17S90, https://doi.org/10.1029/2007JD008738, 2008.
de Graaf, M., Stammes, P., Torres, O., and Koelemeijer, R. B. A.: Absorbing Aerosol Index: Sensitivity analysis, application to GOME and comparison with TOMS, J. Geophys. Res.-Atmos., 110, D01201, https://doi.org/10.1029/2004JD005178, 2005.
de Haan, J. F.: DISAMAR Algorithm description and background information, De Bilt, the Netherlands, 2011.
de Haan, J. F., Bosma, P.B., and Hovenier, J. W.: The adding method for multiple scattering of polarized light, Astron. Astrophys., 183, 371–391, 1987.
Deroubaix, A., Martiny, N., Chiapello, I., and Marticorena, B.: Remote Sensing of Environment Suitability of OMI aerosol index to re fl ect mineral dust surface conditions?: Preliminary application for studying the link with meningitis epidemics in the Sahel, Remote Sens. Environ., 133, 116–127, https://doi.org/10.1016/j.rse.2013.02.009, 2013.
Dubovik, O. and King, M. D.: A flexible inversion algorithm for retrieval of aerosol optical properties from Sun and sky radiance measurements, J. Geophys. Res., 105, 20637–20969, https://doi.org/10.1029/2000JD900282, 2000 (data available at: https://aeronet.gsfc.nasa.gov, last access: 11 August 2017).
Dubovik, O., Holben, B. N., Kaufman, Y. J., Yamasoe, M., Smirnov, A., Tanré, D., and Slutsker, I.: Single-scattering albedo of smoke retrieved from the sky radiance and solar transmittance measured from ground, J. Geophys. Res., 103, 31903–31923, https://doi.org/10.1029/98JD02276, 1998.
Dubovik, O., Smirnov, A., Holben, B. N., King, M. D., Kaufman, Y. J., Eck, T. F., and Slutsker, I.: Accuracy assessments of aerosol optical properties retrieved from Aerosol Robotic Network (AERONET) Sun and sky radiance measurements, J. Geophys. Res., 105, 9791–9806, https://doi.org/10.1029/2000JD900040, 2000.
Dubovik, O., Holben, B., Eck, T. F., Smirnov, A., Kaufman, Y. J., King, M. D., Tanré, D., Slutsker, I., Sciences, G. E., and Directorate, E. S.: Variability of Absorption and Optical Properties of Key Aerosol Types Observed in Worldwide Locations, J. Atmos. Sci., 59, 590–608, https://doi.org/10.1175/1520-0469(2002)059<0590:VOAAOP>2.0.CO;2, 2002.
Eck, T. F., Holben, B. N., Ward, D. E., Mukelabai, M. M., Dubovik, O., Smirnov, A., Schafer, J. S., Hsu, N. C., Piketh, S. J., Queface, A., Roux, J. Le, Swap, R. J., and Slutsker, I.: Variability of biomass burning aerosol optical characteristics in southern Africa during the SAFARI 2000 dry season campaign and a comparison of single scattering albedo estimates from radiometric measurements, J. Geophys. Res., 108, 8477, https://doi.org/10.1029/2002JD002321, 2003.
Gassó, S. and Torres, O.: The role of cloud contamination, aerosol layer height and aerosol model in the assessment of the OMI near-UV retrievals over the ocean, Atmos. Meas. Tech., 9, 3031–3052, https://doi.org/10.5194/amt-9-3031-2016, 2016.
Ginoux, P., Prospero, J. M., Torres, O., and Chin, M.: Long-term simulation of global dust distribution with the GOCART model: Correlation with North Atlantic Oscillation, Environ. Model. Softw., 19, 113–128, https://doi.org/10.1016/S1364-8152(03)00114-2, 2004.
Herman, J. R., Bhartia, P. K., Torres, O., Hsu, C., Seftor, C., and Celarier, E.: Global distribution of UV-absorbing aerosols from Nimbus 7/TOMS data, J. Geophys. Res., 102, 16911–16992, https://doi.org/10.1029/96JD03680, 1997.
Hoffer, A., Gelencsér, A., Guyon, P., Kiss, G., Schmid, O., Frank, G. P., Artaxo, P., and Andreae, M. O.: Optical properties of humic-like substances (HULIS) in biomass-burning aerosols, Atmos. Chem. Phys., 6, 3563–3570, https://doi.org/10.5194/acp-6-3563-2006, 2006.
Holben, B. N., Eck, T. F., Slutsker, I., Smirnov, A., Sinyuk, A., Schafer, J., Giles, D., Dubovik, O., and Lille, U. S. T. De: AERONET's Version 2.0 quality assurance criteria, Int. Soc. Opt. Photonics, 6408, 64080Q, https://doi.org/10.1117/12.706524, 2006.
Hsu, N. C., Tsay, S. C., King, M. D., and Herman, J. R.: Aerosol properties over bright-reflecting source regions, IEEE T. Geosci. Remote, 42, 557–569, https://doi.org/10.1109/TGRS.2004.824067, 2004.
Hu, R. M., Martin, R. V., and Fairlie, T. D.: Global retrieval of columnar aerosol single scattering albedo from space-based observations, J. Geophys. Res.-Atmos., 112, D02204, https://doi.org/10.1029/2005JD006832, 2007.
IPCC: Climate Change 2007: Synthesis Report. Contribution of Working Groups I, II and III to the Fourth Assessment Report of the Intergovernmental Panel on Climate Change, edited by: Core Writing Team, Pachauri, R. K., and Reisinger, A., IPCC, Geneva, Switzerland, 104 pp., 2007.
IPCC: Climate Change 2014: Synthesis Report. Contribution of Working Groups I, II and III to the Fifth Assessment Report of the Intergovernmental Panel on Climate Change, edited by: Core Writing Team, Pachauri, R. K., and Meyer, L. A., IPCC, Geneva, Switzerland, 151 pp., 2014.
Jethva, H. and Torres, O.: Satellite-based evidence of wavelength-dependent aerosol absorption in biomass burning smoke inferred from Ozone Monitoring Instrument, Atmos. Chem. Phys., 11, 10541–10551, https://doi.org/10.5194/acp-11-10541-2011, 2011.
Kaskaoutis, D. G., Nastos, P. T., Kosmopoulos, P. G., Kambezidis, H. D., Kharol, S. K., and Badarinath, K. V. S.: The Aura – OMI Aerosol Index distribution over Greece, Atmos. Res. J., 98, 28–39, https://doi.org/10.1016/j.atmosres.2010.03.018, 2010.
Kassianov, E. I., Barnard, J. C., and Ackerman, T. P.: Retrieval of aerosol microphysical properties using surface MultiFilter Rotating Shadowband Radiometer (MFRSR) data?: Modeling and observations, J. Geophys. Res., 110, D09201, https://doi.org/10.1029/2004JD005337, 2005.
Kaufman, Y. J. and Tanré, D.: Algorithm for remote sensing of tropospheric aerosol from MODIS. NASA MODIS Algorithm Theoretical Basis Document, Goddard Space Flight Center, 85, 3–68, 1998.
Kaufman, Y. J., Tanré, D., and Boucher, O.: A Satellite View of Aerosols in the Climate System, Nature, 419, 215–223, 2002.
Kirchstetter, T. W., Novakov, T., and Hobbs, P. V.: Evidence that the spectral dependency of light absorption by aerosols is affected by organic carbon, J. Geophys. Res.-Atmos., 109, 1–12, https://doi.org/10.1029/2004JD004999, 2004.
Koch, D. and Del Genio, A. D.: Black carbon semi-direct effects on cloud cover: review and synthesis, Atmos. Chem. Phys., 10, 7685–7696, https://doi.org/10.5194/acp-10-7685-2010, 2010.
Lee, K. H., Li, Z., Kim, Y. J., and Kokhanovsky, A.: Atmospheric Aerosol Monitoring fromSatellite Observations: A History of Three Decades, in: Atmospheric and Biological Environmental Monitoring, 13–38, Springer, Dordrecht, 2009.
Leroy, M., Deuzé, J. L., Bréon, F. M., Hautecoeur, O., Herman, M., Buriez, J. C., Tanré, D., Bouffiès, S., Chazette, P., and Roujean, J. L.: Retrieval of atmospheric properties and surface bidirectional reflectances over land from POLDER/ADEOS, J. Geophys. Res., 102, 17023–17037, https://doi.org/10.1029/96JD02662, 1997.
Levelt, P. F., Oord, G. H. J. Van Den, Dobber, M. R., Mälkki, A., Visser, H., Vries, J. De, Stammes, P., Lundell, J. O. V., and Saari, H.: The Ozone Monitoring Instrument, IEEE T. Geosci. Remote, 44, 1093–1101, 2006.
Levy, R. C., Mattoo, S., Munchak, L. A., Remer, L. A., Sayer, A. M., Patadia, F., and Hsu, N. C.: The Collection 6 MODIS aerosol products over land and ocean, Atmos. Meas. Tech., 6, 2989–3034, https://doi.org/10.5194/amt-6-2989-2013, 2013 (data available at: https://ladsweb.modaps.eosdis.nasa.gov, last access: 27 February 2017).
Myhre, G., Shindell, D., Bréon, F. M., Collins, W., Fuglestvedt, J., Huang, J., Koch, D., Lamarque, J.-F., Lee, D., Mendoza, B., Nakajima, T., Robock, A., Stephens, G., Takemura, T., and Zhang, H.: Anthropogenic and Natural Radiative Forcing, Climatic Change, 432, 658–740, 2013.
Nakajima, T., Tanaka, M., and Yamauchi, T.: Retrieval of the optical properties of aerosols from aureole and extinction data, Appl. Optics, 22, 2951–2959, 1983.
Nakajima, T., Tonna, G., Rao, R., Boi, P., Kaufman, Y., and Holben, B.: Use of sky brightness measurements from ground for remote sensing of particulate polydispersions, Appl. Optics, 35, 2672–2686, https://doi.org/10.1364/AO.35.002672, 1996.
NASA: NASA's Terra Catches Fires in Central Chile, available at: https://www.nasa.gov/image-feature/goddard/2017/nasas-terra-catches-fires-in-central-chile, last access: 1 May 2017.
Petters, J. L., Saxena, V. K., Slusser, J. R., Wenny, B. N., and Madronich, S.: Aerosol single scattering albedo retrieved from measurements of surface UV irradiance and a radiative transfer model, J. Geophys. Res., 108, 4288, https://doi.org/10.1029/2002JD002360, 2003.
Ramanathan, V. and Carmichael, G.: Global and regional climate changes due to black carbon, Nat. Geosci., 1, 221–227, https://doi.org/10.1038/ngeo156, 2008.
Reid, J. S., Eck, T. F., Christopher, S. A., Koppmann, R., Dubovik, O., Eleuterio, D. P., Holben, B. N., Reid, E. A., and Zhang, J.: A review of biomass burning emissions part III: intensive optical properties of biomass burning particles, Atmos. Chem. Phys., 5, 827–849, https://doi.org/10.5194/acp-5-827-2005, 2005.
Remer, L. A., Kaufman, Y. J., Tanré, D., Mattoo, S., Chu, D. A., Martins, J. V., Li, R. R., Ichiku, C., Levy, R. C., Kleidman, R. G., Eck, T. K., Vermote, E., and Holben, B. N.: The MODIS Aerosol Algorithm, Products, and Validation, J. Atmos. Sci., 62, 947–973, 2005.
Sanders, A. F. J. and De Haan, J. F.: TROPOMI ATBD of the Aerosol Layer Height product, S5P-KNMI-L2-0006-RP, issue 0.11.0, KNMI, De Bilt, the Netherlands, 2014.
Santese, M., De Tomasi, F., and Perrone, M. R.: AERONET versus MODIS aerosol parameters at different spatial resolutions over southeast Italy, J. Geophys. Res.-Atmos., 112, 1–12, https://doi.org/10.1029/2006JD007742, 2007.
Satheesh, S. K., Torres, O., Remer, L. A., Babu, S. S., Vinoj, V., Eck, T. F., Kleidman, R. G., and Holben, B. N.: Improved assessment of aerosol absorption using OMI-MODIS joint retrieval, J. Geophys. Res.-Atmos., 114, 1–10, https://doi.org/10.1029/2008JD011024, 2009.
Stammes, P. and Noordhoek, R.: OMI Algorithm Theoretical Basis Document Volume III: Clouds, Aerosols, and Surface UV Irradiance, Tech. Rep. ATBD-OMI-03, Version 2.0, 2002 (data available at: https://disc.gsfc.nasa.gov, last access: 31 December 2017).
Tanré, D., Kaufman, Y. J., Herman, M., and Mattoo, S.: Remote sensing of aerosol properties over oceans using the MODIS/EOS spectral radiances, J. Geophys. Res., 102, 16971–16988, https://doi.org/10.1029/96JD03437, 1997.
The Guardian: Chile battles devastating wildfires: “We have never seen anything on this scale”, available at: https://www.theguardian.com/world/2017/jan/25/chile-fire-firefighting-international-help?utm_source=Climate+News+Network&utm_campaign=afdf3cf10c-EMAIL_CAMPAIGN_2017_02_03&utm_medium=email&utm_term=0_1198ea8936-afdf3cf10c-38798061, last access: 25 January 2017.
Tilstra, L. G., Tuinder, O. N., and Stammes, P.: GOME-2 Absorbing Aerosol Index: Statistical analysis, comparison to GOME-1 and impact of instrument degradation, in: Proceedings of the 2010 EUMETSAT Meteorological Satellite Conference, EUMETSAT, p. 57, 2010 (data available at: http://archive.eumetsat.int, last access: 14 July 2017).
Torres, O., Bhartia, P. K., Herman, J. R., Ahmad, Z., and Gleason, J.: Derivation of aerosol properties from satellite measurements of backscattered ultraviolet radiation: Theoretical basis, J. Geophys. Res.-Atmos., 103, 17099–17110, https://doi.org/10.1029/98JD00900, 1998.
Torres, O., Bhartia, P. K., Sinyuk, A., Welton, E. J., and Holben, B.: Total Ozone Mapping Spectrometer measurements of aerosol absorption from space: Comparison to SAFARI 2000 ground-based observations, J. Geophys. Res.-Atmos., 110, D10S18, https://doi.org/10.1029/2004JD004611, 2005.
Torres, O., Tanskanen, A., Veihelmann, B., Ahn, C., Braak, R., Bhartia, P. K., Veefkind, P., and Levelt, P.: Aerosols and surface UV products from Ozone Monitoring Instrument observations?: An overview, J. Geophys. Res., 112, D24S47, https://doi.org/10.1029/2007JD008809, 2007.
Torres, O., Jethva, H., and Bhartia, P. K.: Retrieval of Aerosol Optical Depth above Clouds from OMI Observations: Sensitivity Analysis and Case Studies, J. Atmos. Sci., 69, 1037–1053, https://doi.org/10.1175/JAS-D-11-0130.1, 2012.
Tukey, J. W.: Exploratory data analysis, Addison-Wesley Publishing Company, Reading, Massachuetts, USA, 1977.
Winker, D. M., Vaughan, M. A., Omar, A., Hu, Y., Powell, K. A., Liu, Z., Hunt, W. H., and Young, S. A.: Overview of the CALIPSO Mission and CALIOP Data Processing Algorithms, J. Atmos. Ocean. Tech., 26, 2310–2323, https://doi.org/10.1175/2009JTECHA1281.1, 2009 (data available at: https://eosweb.larc.nasa.gov/project/calipso/calipso_table, last access: 17 July 2017).
Yin, B., Min, Q., and Joseph, E.: Retrievals and uncertainty analysis of aerosol single scattering albedo from MFRSR measurements, J. Quant. Spectrosc. Ra., 150, 95–106, https://doi.org/10.1016/j.jqsrt.2014.08.012, 2015.


