the Creative Commons Attribution 4.0 License.
the Creative Commons Attribution 4.0 License.
Evaluation of the IAGOS-Core GHG package H2O measurements during the DENCHAR airborne inter-comparison campaign in 2011
Annette Filges
Christoph Gerbig
Chris W. Rella
John Hoffnagle
Herman Smit
Martina Krämer
Nicole Spelten
Christian Rolf
Zoltán Bozóki
Bernhard Buchholz
Volker Ebert
As part of the DENCHAR (Development and Evaluation of Novel Compact Hygrometer for Airborne Research) inter-comparison campaign in northern Germany in 2011, a commercial cavity ring-down spectroscopy (CRDS) based gas analyzer (G2401-m, Picarro Inc., US) was installed on a Learjet to measure atmospheric water vapor, CO2, CH4, and CO. The CRDS components were identical to those chosen for integration aboard commercial airliners within the IAGOS (In-service Aircraft for a Global Observing System) project. Since the quantitative capabilities of the CRDS water vapor measurements were never evaluated and reviewed in detail in a publication before, the campaign allowed for an initial assessment of the long-term IAGOS water vapor measurements by CRDS against reference instruments with a long performance record (Fast In-situ Stratospheric Hygrometer (FISH) and CR-2 frost point hygrometer (Buck Research Instruments L.L.C., US), both operated by Research Centre Jülich).
For the initial water calibration of the instrument it was compared against a dew point mirror (Dewmet TDH, Michell Instruments Ltd., UK) in the range from 70 000 to 25 000 ppm water vapor mole fraction. During the inter-comparison campaign the analyzer was compared on the ground over the range from 2 to 600 ppm against the dew point hygrometer used for calibration of the FISH reference instrument. A new, independent calibration method based on the dilution effect of water vapor on CO2 was evaluated.
Comparison of the in-flight data against the reference instruments showed that the analyzer is reliable and has a good long-term stability. The flight data suggest a conservative precision estimate for measurements made at 0.4 Hz (2.5 s measurement interval) of 4 ppm for H2O < 10 ppm, 20 % or 10 ppm (whichever is smaller) for 10 ppm < H2O < 100 ppm, and 5 % or 30 ppm (whichever is smaller) for H2O > 100 ppm. Accuracy of the CRDS instrument was estimated, based on laboratory calibrations, as 1 % for the water vapor range from 25 000 ppm down to 7000 ppm, increasing to 5 % at 50 ppm water vapor. Accuracy at water vapor mole fractions below 50 ppm was difficult to assess, as the reference systems suffered from lack of data availability.
- Article
(5853 KB) - Full-text XML
- BibTeX
- EndNote
Water vapor is a crucial factor for various atmospheric processes, weather, and climate. It is the most important greenhouse gas (Kiehl and Trenberth, 1997) and shows strong feedback to changes in the climate system (Dessler et al., 2008). Especially in the upper troposphere and lower stratosphere (UTLS) the amount of water vapor has a large impact on the radiative balance of the atmosphere (e.g., Smith et al., 2001; Forster and Shine, 2002; Solomon et al., 2010). However, due to only a few existing measurement data in the UTLS, and limitations in prognostic model simulations of this region (Solomon et al., 2010), uncertainties in chemistry, transport processes, and trace gas composition are relatively large. This influences significantly the estimation of, e.g., radiative effects (Riese et al., 2012; Kunz et al., 2013).
Water vapor observations covering the whole troposphere and at least lower parts of the stratosphere are achieved mainly by instruments based on balloons, aircraft or satellites, and from ground-based remote sensing techniques. The longest measurement time series was started in 1980 in Boulder (Colorado, US) with balloon-borne frost point hygrometers (Oltmans et al., 2000; Hurst et al., 2011). First long-term global satellite data were obtained in the mid-1980s as part of the Stratospheric Aerosol and Gas Experiment II (SAGE II) (Rind et al., 1993). Recent observations have been made by, e.g., the Michelson Interferometer for Passive Atmospheric Sounding (MIPAS) (Milz et al., 2005; von Clarmann et al., 2009) and the Scanning Imaging Absorption Spectrometer for Atmospheric Chartography (SCIAMACHY) (Rozanov et al., 2011; Weigel et al., 2016), both aboard ENVISAT (Environmental Satellite). The main drawbacks of satellite data and remote sensing observations from ground (e.g., Schneider et al., 2006) are their insufficient vertical resolution in the troposphere and lower stratosphere and disturbances of the measurements by clouds. As shown by Hoareau et al. (2013), vertical resolutions < 500 m are needed for the simulation of cirrus clouds. To represent the very sharp gradient of 40 to 6 ppm water vapor within 0–2 km at the tropopause (Zahn et al., 2014), resolutions of even 400 m and higher have to be achieved (Poshyvailo et al., 2018). On the other hand reliable radiosonde water vapor data up to stratospheric heights, e.g., from the GCOS (Global Climate Observing System) Reference Upper-Air Network (GRUAN) (Dirksen et al., 2014), as well as data sets from research aircraft, are quite limited in time and space.
The use of commercial aircraft as cost-efficient platforms for dedicated instruments can at least partially bridge this gap, providing regular measurements in the UTLS along major flight routes. For example, five Airbus A340 passenger aircraft were equipped with capacitive humidity sensors from 1994 to 2014 as part of the MOZAIC (Measurement of Ozone and Water Vapor by Airbus In-Service Aircraft) project (Marenco et al., 1998). The acquired data set is crucial for the study of chemical and dynamic processes in the upper troposphere and lower stratosphere (e.g., Gierens et al., 1999).
However, accurate and reliable airborne measurements of atmospheric water vapor are still a challenge. The large range from mole fractions of several percent at the ground to only a few parts per million (ppm = µmol mol−1) in the stratosphere and the highly variable structures of water vapor in the atmosphere are demanding for analyzers regarding accuracy and time response.
Kley et al. (2000) give a detailed summary of the most important water vapor instruments used onboard aircraft. Besides frost point hygrometers (e.g., Vömel et al., 2007, 2016; Hurst et al., 2011; Hall et al., 2016) these are mainly Lyman-α hygrometers, based on fluorescence techniques, for example the Harvard Water Vapor instrument (HWV) (Weinstock et al., 2009) and the Fast In-situ Stratospheric Hygrometer (FISH) (Zöger et al., 1999; Meyer et al., 2015). More recently infrared absorption spectrometers like the Jet Propulsion Laboratory Laser Hygrometer (JLH) (May, 1998), the Integrated Cavity output Spectrometer (ICOS) (Sayres et al., 2009), or the Hygrometer for Atmospheric Investigations (HAI) (Buchholz et al., 2017), and the Atmospheric Ionization Mass Spectrometer (AIMS) (Kaufmann et al., 2016) have been deployed. The central problems of all these different types of analyzers are the unexplained discrepancies between water vapor measurements in the range below 10 ppm (e.g., Kley et al., 2000; Vömel et al., 2007; Weinstock et al., 2009). While the instruments compare well during static experiments (Fahey et al., 2014), they disagree significantly during airborne inter-comparisons in the UTLS. For the recent Mid-latitude Airborne Cirrus Properties Experiment (MACPEX) in 2011 Rollins et al. (2014) estimated the differences to be on the order of 20 % at water vapor mixing ratios of 3–4 ppm, whereas the measurement uncertainties of the instruments account only for 5 %–10 %. Thus, possibilities, e.g., to identify long-term trends in stratospheric water vapor or to study ice microphysical processes, are limited (Rollins et al., 2014).
In this context the DENCHAR (Development and Evaluation of Novel Compact Hygrometer for Airborne Research) project was initiated by the European Facility for Airborne Research (EUFAR) to support the development and characterization of novel or improved compact airborne hygrometers for different airborne applications within EUFAR, including investigation of the sampling characteristics of different gas/ice inlets (cf. Tátrai et al., 2015). As part of the DENCHAR inter-comparison flight campaign in Hohn (Germany) in May–June 2011, a commercial cavity ring-down spectroscopy (CRDS) gas analyzer (G2401-m, Picarro Inc., US), measuring CO2, CH4, CO and water vapor, was tested and compared against well-established reference hygrometers and newly developed water vapor instruments. The former were the Learjet version of the Fast In-situ Stratospheric Hygrometer (FISH) (Meyer et al., 2015) and a CR-2 Cryogenic Aircraft hygrometer (Buck Research Instruments L.L.C., Boulder, US, http://www.hygrometers.com, last access date: 1 September 2018), both operated by Research Centre Jülich.
The same CRDS analyzer and corresponding inlet system components are scheduled for deployment onboard passenger aircraft within the IAGOS (In-service Aircraft for a Global observing System) project (Filges et al., 2015). IAGOS was launched in 2005 as the successor program of MOZAIC, but with modernized instrumentation and enhanced measurement capabilities (Volz-Thomas et al., 2009; Petzold et al., 2015). The current fleet of IAGOS-equipped aircraft as well as the spatial coverage of all flights can be found at the IAGOS database (http://www.iagos.org, last access: 1 September 2018). There are plans to equip five IAGOS aircraft with the CRDS system, named the “IAGOS-core Greenhouse Gas (GHG) package”, in the next 4 years. In contrast to the CO2 measurements from the CRDS, which have been studied thoroughly and have shown good performances, the quantitative capabilities of the CRDS water vapor measurements have never been evaluated and reviewed in detail before. Precision in the laboratory is known from previous studies to be around 6 ppm for a 2.3 s integration time, but is related to white noise (Filges et al., 2015). Thus, sample averaging over 30 min can result in a precision of down to 0.3 ppm, which in principle can result in numerous scientific applications of the data. Each IAGOS aircraft is also equipped with the MOZAIC humidity device (Helten et al., 1998; Smit et al., 2008, 2013), which provides the unique opportunity to compare both instrument types under the same conditions over a long-time period. IAGOS water vapor measurements include regular in situ data in the sensible UTLS region and vertical profiles of H2O in the troposphere and lower stratosphere for major parts of the globe. They are essential for validation of remote-sensing-based observations from satellites and ground, are needed for improving the performance of climate models and weather forecasts, and can be used for climate trend studies.
This paper presents the water vapor measurements made with the CRDS system during the DENCHAR inter-comparison flight campaign in 2011. The flight data are validated against reference instruments with a long performance record to evaluate the water vapor measurements made by the CRDS instrument. Furthermore, the analyzer was calibrated with the help of different hygrometers, and a novel independent calibration method was tested. The corresponding results are analyzed and discussed regarding the feasibility of the different methods for the long-term operation of the analyzer within the IAGOS project.
The measurement system is introduced in Sect. 2, followed by an overview of the water vapor calibration approaches in Sect. 3. Results from the flight tests are presented in Sect. 4. Section 5 concludes the paper.
The measurements were conducted by a G2401-m wavelength scanned cavity ring-down spectroscopy analyzer from Picarro Inc. (US) (CFKB2004), which simultaneously measures CO2, CH4, CO and water vapor (Crosson, 2008; Chen et al., 2010).
The CRDS technique determines the mole fraction of a gas using the decay time of light intensity (“ring-down time”) due to absorption by the gas. Laser light of a specific set of wavelengths is injected into a mirrored sample cell (the “cavity”, 35 cm3, effective optical path length 15–20 km), which is flushed with the sample gas. When the light intensity reaches a predetermined threshold, the laser is turned off, after which the optical energy in the cavity decays with a characteristic exponential time constant of the light intensity in the cavity (the ring-down). The total absorption of the cavity (including both the absorption of the gas and the loss of the mirrors) is calculated directly from the exponential time constant. By tuning the wavelength of the laser, a specific spectral line of a species is scanned and analysis of the obtained spectrogram provides the peak height, which at constant pressure and temperature is proportional to the mole fraction of the species.
The analyzer uses selected spectral lines in the infrared for the measurements: at 1603 nm for 12C16O2, at 1651 nm for 12CH4 and , and at 1567 nm for 12C16O.
To minimize the impact of pressure and temperature on gas density and spectroscopy, both are kept constant in the sample cell. Pressure in the sample cell is controlled to 186.65 ± 0.04 hPa (140 Torr) using a proportional valve (“inlet valve”) upstream of the cell, and the temperature is kept at 45 ± 0.02 ∘C. Gas flow through the sample cell was controlled at 100 sccm with the help of a fixed needle valve, acting as a flow-restricting orifice, downstream of the sample cell and upstream of the pump. Thus, the flow rate was independent of ambient and, respectively, cabin pressure.
To protect the sample cell from contamination, two filters (Wafergard II F Micro In-Line Gas Filters, Entegris Inc.) are located in the sample line upstream of the sample cell. They also ensure thermal equilibration of the sample gas, as they are kept at the same temperature as the sample cell.
Each species was measured once every 2.5 s. The physical exchange time of the sample cell is 3.6 s (volume = 35 cm3, sample flow = 100 sccm, pressure = 186.65 hPa, sample temperature = 45 ∘C), ensuring that the ambient air was continuously sampled given the shorter measurement interval of 2.5 s.
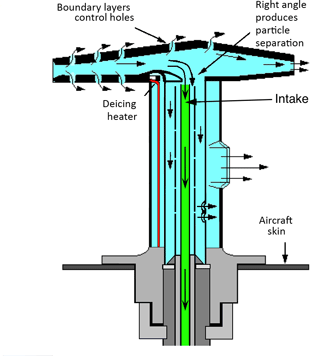
Figure 1Cross section of the inlet line (green) mounted into a Rosemount Total Air Temperature housing (model 102B, adapted from Stickney et al., 1994). The inlet line is pointed orthogonal to the airflow through the housing to prevent sampling of larger aerosols, ice particles, and water droplets.
The instrument was equipped with a 50 cm long inlet line (3.18 mm () OD, 1.58 mm () ID, fluorinated ethylene propylene (FEP) tube), which was connected to a Rosemount Total Air Temperature (TAT) housing (model 102B; Stickney et al., 1994) mounted on a window plate of the Learjet. The Rosemount probe acts as a virtual impactor since the inlet line is pointed orthogonal to the airflow through the housing (see Fig. 1), and thus prevents sampling of larger aerosols (larger than about 2 µm), ice particles, and water droplets (Volz-Thomas et al., 2005; Fahey et al., 2001; Smit et al., 2013). Furthermore, it provides positive ram pressure due to the reduction of the air velocity. This additional positive ram pressure, together with the low sample gas flow of 100 sccm and the relatively short inlet line, ensured operation of the instrument with a controlled pressure in the sample cell of 186.65 hPa (140 Torr) throughout the aircraft altitude operating range up to 12.5 km without an upstream sampling pump. Diffusion effects of water vapor in the inlet line are minimal, given the short residence time of the sample gas, the small inner surface area, the small differences in humidity between the air-conditioned cabin and the ambient air, and the low permeability of FEP. The sample flow was exhausted into the cabin of the aircraft. The CRDS analyzer and the inlet system components are identical to those chosen for integration aboard commercial airliners within the IAGOS (In-service Aircraft for a Global observing System) project. This setup ensures full comparability with the deployment of the IAGOS-core Greenhouse Gas package (Filges et al., 2015).
In contrast to calibration of the CO2, CH4 and CO measurements, for which traceability to the World Meteorological Organization (WMO) primary scales is ensured by measurement of gas standards traceable to the primary scale, calibration of the water vapor measurements of the instrument is not as straightforward. There is no globally valid primary scale, but several national standards exist (WMO, 2012; see Part I, chap. 4). Calibration of an instrument is done by means of other hygrometers that are traceable to one of the national standards, often gravimetric hygrometers. In the following different calibration methods for the CRDS analyzer are presented and compared.
3.1 Methods
3.1.1 Offset correction
Prior to calibration of the CRDS analyzer against, e.g., a dew point mirror, an offset correction is required once to improve measurements at low water levels (< 1000 ppm). This offset correction can be estimated by measuring dried ambient air from a high-pressure tank. At the MPI-BGC GasLab the tanks (volume: 50 L) were filled with air, which was dried using magnesium perchlorate (Mg[ClO4]2). The dew point of the air is around −75 ∘C, corresponding to 2.4 ppm water vapor. The offset stability of different CRDS instruments was checked regularly over a time period of up to 10 years and no significant drift was observed.
3.1.2 Dew point mirror
The factory calibration of the Picarro Inc. CRDS analyzer consists of two parts: a self-broadening correction and a comparison with a dew point mirror.
Water vapor mole fraction is calculated using the peak height of the selected water absorption line. In this process self-broadening effects must be taken into account, which broaden the line shape and hence decrease the peak height as the water vapor level increases. To avoid an underestimation of the water vapor mole fraction, a quadratic correction is implemented in the Picarro analyzer (Rella, 2010):
Here, H2O is water vapor mole fraction in %. In 2009 a G1301-m CRDS instrument from Picarro, measuring CO2, CH4 and H2O, was calibrated at MPI-BGC Jena against a dew point mirror (Dewmet TDH, Cooled Mirror Dewpointmeter, Michell Instruments Ltd., UK, referenced to the National Institute of Standards and Technology (NIST) primary scale) in the range from 7000 to 30 000 ppm water vapor mole fraction (Winderlich et al., 2010). The calibration constant obtained in this experiment was transferred to all greenhouse gas CRDS instruments manufactured by Picarro Inc. (Rella, 2010):
This calibration transfer from one to all other instruments is possible since their water vapor measurements agree within a sufficient range and are stable over time as shown by Rella et al. (2013). Here, three different analyzers (models G2401-m and Envirosense 3000) were compared at different times against one selected standard instrument (CFADS37, model G1301-m). One of the comparisons was repeated after more than 3 years. All results (H2Oanalyzer–H2OCFADS−37) lie within a range of ±125 ppm for water vapor mole fractions ranging from around 5000 to 30 000 ppm. Hence, a good transferability and long-term stability of the analyzers' water vapor measurements can be assumed.
In order to examine the robustness of the 2009 calibration it was repeated in 2013 using a G2401-m analyzer (CFKBDS2003) in comparison to the identical dew point mirror (Dewmet TDH, Michell Instruments Ltd.) that was used for the calibration in 2009. Both instruments measured simultaneously dried ambient air from a high-pressure tank, which was humidified by a dew point generator (Li-610 from Li-Cor) to specific water levels between 2 and 20 ∘C dew point. Higher and lower water vapor levels could not be reached due to the environmental conditions in the laboratory.
During the 2009 calibration the dew point mirror measurement was based on its original calibration, conducted by the manufacturer against test equipment traceable to the NIST primary standard at the end of 2000. In 2010 the dew point mirror was recalibrated by the manufacturer; however, no information was given on how the calibration factors changed. Another calibration by the manufacturer in 2014, shortly after the 2013 comparison of the CRDS instrument and the dew point mirror, showed no drift beyond the uncertainty range of the dew point mirror (given by the manufacturer: 0.2 ∘C at +20 ∘C dew point, increasing linearly to 0.4 at −60 ∘C dew point (2σ)) compared to the calibration in 2010.
3.1.3 Calibration bench for the FISH instrument
During the DENCHAR inter-comparison campaign in 2011 CRDS analyzer CFKB2004 was compared against the laboratory calibration bench used regularly for calibration of the FISH reference instrument. This calibration bench consists of a humidifier, a mixing unit to mix dry and humid air, and a reference water vapor instrument, the MBW Dew Point instrument (model K-1806/DP30-SHSX-III, MBW Elektronik AG, Switzerland, http://www.mbw.ch, last access: 1 September 2018) (Meyer et al., 2015). For the comparison the CRDS instrument was connected to the calibration bench via a 3 m long OD FEP line. Since the calibration bench provided a flow of about 3500 sccm an open split was installed in front of the FEP line to allow the CRDS analyzer to sample at its low flow rate of 100 sccm. During the comparison four humidity steps covering the range of 2 to around 600 ppm were measured. This corresponds to the standard calibration range of the FISH calibration bench and is a good addition to the dew point mirror calibration range. Maximum uncertainty of the calibration bench is given as ± 4 % (1σ) by Meyer et al. (2015).
Due to the low sample flow (100 sccm) through the analyzer and the large difference in water vapor mole fraction between the measured air and the outside air during the comparison, permeation of water vapor through the FEP tube (3 m length in the calibration setup) has to be considered. To provide information from which a correction factor for the permeation effect could be determined, a dry tank air stream (∼ 2 ppm water vapor mole fraction) at different flow rates (100 and 3500 sccm) was provided through the FEP tube. Assuming that for a flow of 3500 sccm the contribution of the permeation to the water vapor mole fraction in the flow is negligible, the correction factor was computed as the difference in the calibrated CRDS H2O mole fraction between these two measurements.
3.1.4 Calibration by the CO2 dilution effect
In addition to the standard calibrations by different hygrometers, a novel and completely independent calibration method was tested, which takes advantage of the high-precision CO2 measurements by the CRDS analyzer. Specifically, the dilution effect of water vapor on the CO2 mole fraction is used: if water vapor is added to dry air, while total pressure and temperature of the gas remain unchanged, the mole fractions of the residual air components decrease. The mole fraction of CO2 in dry air is
whereas the CO2 mole fraction in wet air is given as
Together with the wet air mole fraction of water,
Equations (3) and (4) yield
Thus, the amount of water vapor in air is directly linked to the ratio of the CO2 wet and dry air mole fractions of the air. However, the measured CO2 mole fraction from the CRDS instruments in wet air is not only influenced by the dilution effect, but also by pressure-broadening effects of the water vapor. To separate both effects the measurement software of the analyzer was modified to allow for a fine scan of the CO2 and water vapor absorption line. While the peak height, which is normally used for the measurement, is influenced by both effects, the peak area only changes due to the dilution effect. The fine scan, combined with spectral models and fitting procedures optimized for this purpose, provides the peak areas with sufficient precision.
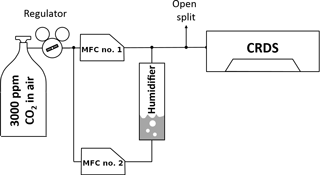
Figure 2Experimental setup for the water vapor calibration by the CO2 dilution effect. MFC nos. 1 and 2 are mass flow controllers.
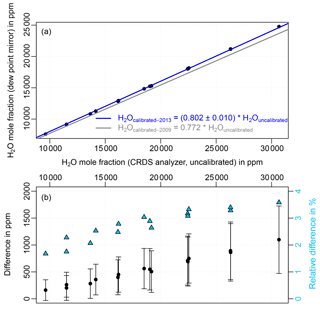
Figure 3(a) Uncalibrated water vapor measurements from the Picarro CRDS analyzer (CFKBDS2003) against the measurements from the dew point mirror (Dewmet TDH) during the 2013 calibration. The corresponding fit is shown as a blue line, the calibration curve of the 2009 comparison as a grey line. The uncertainty of the fitted slope is composed of the fitting error and the uncertainty of the dew point mirror. (b) Water vapor difference between the 2009 and 2013 experiments. The error bars indicate the uncertainty range, which results from the combination of the dew point mirror uncertainties during the 2009 and 2013 calibrations. The relative differences are plotted on the right axis as light blue triangles.
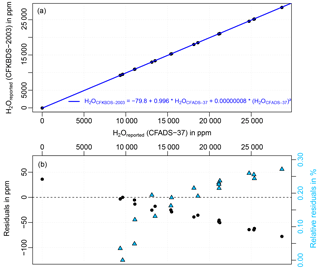
Figure 4(a) Uncalibrated water vapor mole fractions from the two Picarro CRDS analyzers CFADS37 and CFKBDS2003 during a comparison experiment in 2014 (black points). The blue line indicates the quadratic fit of an earlier comparison between the same instruments in 2011. The differences between the two comparisons, i.e., the drift of the two analyzers over the 3 years from 2011 to 2014, are shown in plot (b). The relative residuals are plotted on the right axis as light blue triangles. Since the analyzers were not offset corrected before the experiment, the relative difference of 800 % of the data point at 4.5 ppm is less meaningful and is therefore not shown in order to improve the clarity of the plot.
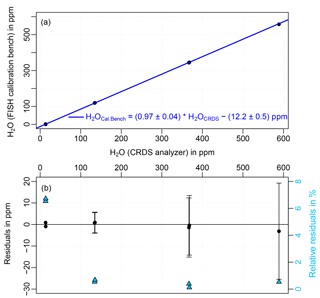
Figure 5(a) Dry air water vapor mole fractions measured by the CFKB2004 CRDS analyzer and the FISH calibration bench during a comparison in 2011. The CRDS data are offset corrected and calibrated according to the 2013 comparison against a dew point mirror. The corresponding fit is shown in blue. Residuals (difference between water vapor mole fractions measured by the FISH calibration bench and the linear fit) can be seen in the plot (b). Error bars indicate the uncertainty range of the calibration bench of 4 %. The relative residuals are plotted on the right axis as light blue triangles.
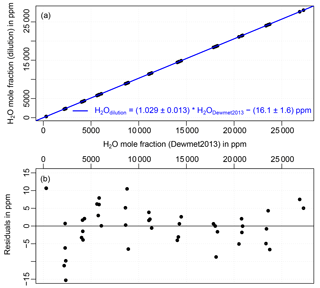
Figure 6(a) Water vapor mole fraction based on the CO2 dilution method plotted against the water vapor mole fraction measurement from the CRDS analyzer (offset corrected and calibrated according to the comparison against a dew point mirror in 2013) during the fine scan experiment. The corresponding fit is shown in blue. Residuals (difference between water vapor mole fraction based on dilution method and the linear fit) can be seen in plot (b).
To test the concept, pressurized zero air with 3000 ppm CO2 from a high-pressure tank was split into two paths, as can be seen in Fig. 2. The air in one path was humidified in a bubbler. Afterwards the dry and wet gas streams were recombined and then measured by a CRDS analyzer (CFADS2196, model G2301) in fine scan mode. With the help of mass flow controllers in both paths the water concentration of the combined stream could be varied without changing the CO2 dry mole fraction by changing the flow of each path while the total flow was kept constant. The adjustable water vapor levels were limited by the remaining humidity in the pressurized air on the one hand and the environmental conditions in the laboratory on the other. The measurements alternated between the water line and the CO2 line, requiring about 1.3 s to make one pair of measurements. Since the pressure and temperature in the sample cell were kept constant, the measured peak areas were proportional to the mole fractions:
where A is the peak area and C the proportionality or “calibration” factor. With Eq. (6) this yields
If the measured area of the CO2 line is plotted as a function of the measured area of the water line, the calibration factor for water vapor is just the ratio of the slope and the intercept. The scan of the water line also provided the conventional water vapor measurement using the peak height of the absorption line, which allowed for comparison of the two water vapor estimates.
3.2 Results and discussion
3.2.1 Dew point mirror
Plot a in Fig. 3 shows the self-broadening and offset corrected, but uncalibrated, water vapor mole fraction measured by the Picarro CRDS instrument (in the following referred to as “H2Ouncalibrated”) against the measurements from the dew point mirror (using its factory calibration from 2010, which was confirmed in 2014) during the comparison in 2013. The Dewmet measurements were converted from dew point to wet air mole fraction based on the Goff–Gratch equation (Goff, 1957). The corresponding fit can be seen as a blue line; the grey line indicates the calibration curve of the 2009 experiment (Eq. 2). The uncertainty of the fitted slope is composed of the fitting error and the uncertainty of the dew point mirror. Uncertainty of the Dewmet is given by the manufacturer as 0.2 ∘C at +20 ∘C dew point, increasing linearly to 0.4 ∘C at −60 ∘C dew point (2σ), which corresponds to a relative uncertainty of 1.3 %. In order to check the linearity of the CRDS instrument the CRDS and Dewmet data were also fitted using a quadratic fit. The slope of the quadratic fit was determined as 0.807 ± 0.011, which agrees well with the slope of the linear fit (0.802) taking account of the uncertainty range. The impact of the quadratic term (determined as 0.0024 ± 0.0021) on the result is small compared to the overall uncertainty range. Thus, the CRDS analyzer can be considered linear.
Figure 3b shows the difference between the 2009 and 2013 calibrations. The error bars demonstrate the uncertainty range, which comprises the dew point mirror uncertainty during the 2009 and 2013 experiments. The relative difference of the two calibrations, shown on the right axis, increases from 1.7 % at 9800 ppm CRDS water vapor mole fraction (2.2 % with regard to the measured mole fraction from the dew point mirror) up to 3.6 % at 30 600 ppm (4.4 %), indicating significant differences for water vapor mole fractions above about 10 000 ppm.
This difference between the 2009 and 2013 calibrations is much larger than the uncertainties of the instruments and the calibration transfer give reason to expect. The largest source of uncertainty is the dew point mirror with 1.3 % uncertainty. Precision of the CRDS analyzer is given as < 14 ppm by the manufacturer. Uncertainty of the calibration transfer between different Picarro analyzers, which has to be considered since the two calibrations were done with different CRDS instruments, is < 125 ppm (or 0.5 % relative at 25 000 ppm water vapor mole fraction) (Rella et al., 2013). Since the difference between the two calibrations is up to 3.6 % (4.4 %), the dew point mirror, the Picarro analyzer, or both instruments must have been drifting.
In order to test the stability of the water vapor measurements of the CRDS analyzer, the CFKBDS2003 instrument was compared to another Picarro CRDS analyzer (CFADS37, model G3101-m) once in 2011 and again in 2014. During the experiments both instruments measured in parallel pressurized, dried ambient air from a high-pressure tank, which was humidified by a dew point generator (Li-610 from Li-Cor) to specific water levels between 2 and 20 ∘C dew point. Plot a in Fig. 4 shows the result of the 2014 comparison. The blue line is the quadratic fit of the 2011 comparison. The relative difference (right axis in plot b) between the two experiments is < 0.3 % for water vapors < 8000 ppm. Since it is unlikely that both instruments drifted in the same way, this strongly suggests that the CFKBDS2003 analyzer did not drift significantly in the 3 years between the two comparisons against the dew point mirror.
This conclusion together with the calibration history of the dew point mirror (see Sect. 3.1) suggests that the large differences between the two calibrations of the CRDS instrument in 2009 and 2013 are caused by drift of the dew point mirror calibration. The dew point mirror had not been calibrated for nearly 9 years when it was used for the 2009 experiment, but was calibrated well during the 2013 experiment. Thus, only the results of the 2013 experiment, corresponding to a calibration factor of 0.802 for the CRDS water vapor measurements, are considered reliable. Accuracy of the calibration is limited by the uncertainty range of the dew point mirror (1.3 %, 2σ). For water vapor levels < 7000 ppm the calibration is only extrapolated based on the measurements between 7000 and 25 000 ppm, which has to be accounted for in the uncertainty estimate.
3.2.2 Calibration bench for the FISH instrument
Plot a in Fig. 5 shows the result of the comparison between the CRDS analyzer and the FISH calibration bench, during which four different water levels in the range 2–600 ppm were measured. The water vapor measurements from the CRDS analyzer are offset corrected and calibrated according to the 2013 dew point mirror comparison, and additionally corrected for another 3.5 ppm resulting from permeation of water vapor from air surrounding the 3 m FEP inlet line. Subsequently, the CRDS measurements were converted from wet to dry air mole fractions according to
A linear fit of the data shows that the dew point mirror calibration of the CRDS was within 3 % of the FISH calibration bench and showed an offset of 12.2 ppm. Uncertainties of the fit coefficients (slope: ±0.04, offset: ±0.5 ppm) were estimated assuming a worst-case scenario by including 4 % bias of the FISH calibration bench and 1.3 % uncertainty of the dew point mirror calibration. The residuals (difference between the FISH calibration bench and the fit) for water vapors > 100 ppm, which can be seen in plot b, are small compared to the uncertainty range of the FISH calibration bench of 4 % indicated by the error bars. For the measurement point at 2 ppm water vapor the relative residuals are larger (6.2 %), due to the influence of the 12.2 ppm offset.
The CRDS analyzer and the FISH calibration bench agree within 3 % in the water vapor range up to 600 ppm after correcting for an offset of 12 ppm. This confirms that extrapolation of the dew point mirror calibration to water vapor levels below 7000 ppm is appropriate, at least within the uncertainty of 4 % assumed for the calibration bench. Regarding the offset of 12.2 ppm it has to be considered that the measured air at the lowest water level, which has the largest effect on the estimation of the offset, was perhaps not completely in equilibrium with the inner surface of the connection line between the CRDS instrument and the calibration bench and the tubing inside the analyzer. If the water vapor mole fraction in the gas stream decreases, water molecules adsorbed at the surface are released until a new equilibrium with the air is reached. Due to the large length of the connection line (3 m) the inner surface is relatively large and, thus, the equilibration process takes a relatively long time. For the higher measured water levels the equilibrium is reached faster. Furthermore, except for the highest measured level, memory effects were canceled out by measuring the water level twice: once from low to high, and once going from high to low mole fractions. The differences in the two measurement sequences are smaller than 1 ppm. Another possibility would be that the offset was caused by either an outgassing or a very small leak.
3.2.3 Calibration by CO2 dilution effect
Figure 6a shows the comparison of the water vapor mole fraction determined with the help of the CO2 dilution method and the conventional water vapor measurements, which are offset corrected and calibrated according to the 2013 dew point mirror comparison, during the fine scan experiment. A linear fit of the data indicates a bias of 2.9 % of the dilution-based water vapor compared to the dew point mirror calibration and an offset of 16.1 ppm. The uncertainty estimates (slope: ± 0.013, offset: ±1.6 ppm) are based on the uncertainty of the dew point mirror calibration (1.3 %, 2σ). Residuals can be seen in plot b of Fig. 6.
The water vapor mole fraction calculated with the CO2 dilution method and the conventional water vapor measurements calibrated according to the 2013 dew point mirror comparison agree within 2.9 % in the water vapor range from 300 to 27 000 ppm. The residuals (difference between water vapor mole fraction based on dilution method and the linear fit) are small, but show a slight systematic shape depending on the water vapor level. An offset was determined as 16.1 ppm; however, the lowest measurement was made at around 300 ppm and, thus, the offset is based on extrapolation. Higher scatter in the residuals at low water vapor (< 2500 ppm) might indicate a different behavior for this range. Hence, the estimated error of 1.6 ppm for the offset is likely a significant underestimate.
Estimating the uncertainty of the CO2 dilution method is not straightforward. The repeatability of the peak area measurements accounts only for less than 0.1 % uncertainty (1σ), whereas systematic errors can have a larger influence on the accuracy. One potential error is the direct spectroscopic interference of either water on CO2 or vice versa, which we tried to avoid by careful selection of the used absorption lines and detailed spectral models. To check for remaining influences an additional test was conducted: since a direct spectroscopic interference would affect the measurements differently for different CO2 concentrations, the fine scan experiment was repeated with 400 ppm CO2 instead of the original 3000 ppm CO2. Unfortunately, the pressurized air with 400 ppm CO2 also contained 2 ppm of methane, whereas the 3000 ppm CO2 air was pure CO2 in zero air. Thus, a neighboring methane absorption line had to be considered, which added another variable to the analysis. In future experiments this should be excluded by preparing a set of high-pressure tanks of exactly the same air composition but different CO2 concentrations. The calibration constant C of the water measurements (see Eqs. 7 and 8) measured for 400 ppm CO2 was 0.6 % larger than the calibration constant measured for 3000 ppm CO2. Another systematic error can arise if the spectroscopic models and fitting procedures do not perfectly account for the changes in the absorption line shapes during varying water vapor mole fractions. For this experiment the absorption line shape model was carefully tested over the range of conditions in the analyzer, and it was found that the corresponding error can be neglected compared to the other sources of uncertainty.
Recently, a potentially serious source of systematic error regarding the pressure control in the sample cell was discovered: observations suggest that the pressure sensor has a nonlinear dependence on water vapor and, thus, the pressure in the sample cell is stabilized to a humidity-dependent value instead of the fixed 186.65 hPa (= 140 Torr) (Reum et al., 2017). A possible reason could be adsorption of water molecules on the sensor. While this error in the CRDS water vapor measurements is corrected by the calibration of the instrument with another hygrometer, it has to be considered for the dilution calibration, since the used CO2 measurements are affected as well. To assess the quantitative effect of such an incorrect pressure adjustment we assume the pressure in the measurement cell to be
where p0 is the actual set point at 186.65 hPa (140 Torr) and Δp is a pressure difference depending on the water vapor mole fraction. Experiments with an additional independent pressure measurement presented by Reum et al. (2017), as well as analysis of the behavior of the proportional valve, which controls the pressure in the sample cell, show that Δp changes linearly with water vapor for mole fractions > 2500 ppm (see Fig. 2 in Reum et al., 2017). Therefore, the peak areas of the absorption lines follow
Substituting (p0) and (p0) according to Eq. (11) in Eq. (8) yields
Thus, the bias in the sample cell pressure introduces an error to the calibration constant C(p0), which is proportional to the relative pressure change Δp ∕ p0. Reum et al. (2017) determine Δp as about 0.7 mbar (0.5 Torr) for a water vapor mole fraction of 30 000 ppm. Hence, the pressure bias causes an error of < 0.4 % to the CO2 dilution calibration method. Note however that the change in cell pressure with humidity is not linear for water vapor mole fractions < 2500 ppm, which could be the reason for the slightly systematic shape in the residuals at this low water vapor levels (Fig. 6b).
In summary it can be said that an uncertainty at percent or even sub-percent level is achievable for the dilution method in future experiments. Using a conservative estimate of 1 % uncertainty (1σ) for assessing water vapor from the CO2 dilution experiment presented here, added to the 1.3 % uncertainty of the dew point mirror calibration, comparison of the dilution-based estimate (H2Odilution = (1.029 ± 0.023) ⋅ H2Odewmet2013) with the FISH calibration bench (H2OCalBench = (0.97 ± 0.04) ⋅ H2Odewmet2013) (neglecting the offsets) shows an overlap within their combined uncertainty. Note that this also means that the H2O calibration via dilution of CO2 is statistically consistent with the classical calibration using dew point or frost point hygrometers. This is a promising result for this experiment, especially when considering that different CRDS instruments were used and the comparisons took place 2 years apart.
Follow-on experiments can achieve better and more reliable results for the water calibration by CO2 dilution if low water vapor levels (< 300 ppm) are also measured, the sample cell pressure is corrected for deviations due to different water vapor levels, optimized spectral models and fitting procedures are applied, and sample air with a CO2 mole fraction in the atmospheric range is used. To determine a calibration factor for the water vapor estimates based on peak height measurements, which is the standard measurement method of the CRDS analyzers at the moment, since it provides better short-term precision than the peak area measurements, the experiment can be simplified. As can be seen in Eq. (8) the water vapor mole fraction (C ⋅ A) can be calculated if the dry and wet peak areas of the CO2 absorption line are known. Thus, the measurement of the water vapor peak area can be skipped, which reduces the overall uncertainty. On the other hand, for low water vapor mole fractions (< 10 ppm) a wrong pressure reading (as described above) has a higher impact since it affects the wet peak area, but not the dry peak area measurement. By looking at the deviation of the ratio between wet and dry peak areas to one the error gets enhanced even more.
Obviously the dilution method can be applied to other species, too, and is not limited to CO2 and water vapor. The same principle can be used for any species measurable by a CRDS analyzer, provided that the corresponding dilution effect is large enough to be detectable with sufficient precision.
3.2.4 Calibration summary
Table 1 shows in summary the results of the different calibration experiments. The water vapor ranges used in the comparison were determined by the experimental setups of the experiments and the standard calibration ranges of the instruments. The uncertainties of the coefficients for the FISH calibration bench comparison result from the dew point mirror calibration uncertainty and the uncertainty of the calibration bench. For the CO2 dilution effect it is the dew point mirror calibration uncertainty plus a conservative estimate of the dilution method uncertainty. Note that both offset uncertainties are likely not reliable.
Based on these experiments the calibration constant of 0.802 ± 0.010 from the dew point mirror comparison in 2013 is recommended for the water vapor measurements from the CRDS instrument.
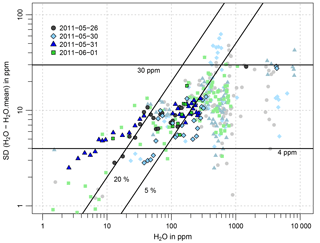
Figure 7Standard deviation of the difference between the 0.4 Hz CRDS flight data and the 60 s averages, averaged for intervals of 1, 5, 10, and 100 ppm water vapor in the corresponding water vapor ranges of 0–10, 10–100, 100–1000, and 1000–10 000 ppm, respectively. Different colors and symbols indicate different flights. Results with higher priority are highlighted. The horizontal and diagonal black lines indicate standard deviations of 4 and 30 ppm, and 5 % and 20 %, respectively.
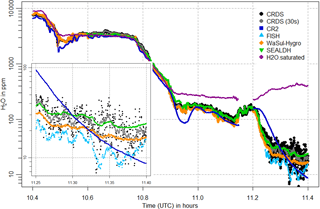
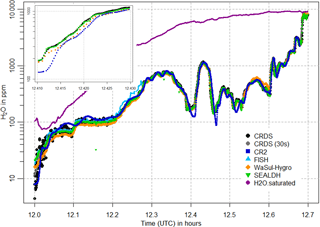
Figure 8Water vapor mole fractions measured by the CRDS analyzer (black points, 30 s mean as grey points), the CR-2 (dark blue squares) and FISH (light blue triangles) instruments, as well as the WaSul-Hygro (orange diamonds) and SEALDH-I (green triangles) analyzers, for a time period during the flight on 31 May 2011. An enlarged section for the time period from 11:15 to 11:24 is shown in the lower left part of the plot.
During the DENCHAR flight campaign between 23 May and 1 June 2011 four inter-comparison flights with a total flight time of about 14 h were conducted with a Learjet 35A. Starting from an airbase in Hohn, Germany, the flights covered a region ranging from northern Germany and Poland to southern Norway and the North and Baltic seas, and altitudes up to 12.5 km, so that the lower stratosphere was also reached. Two instruments served as reference instruments for the water vapor measurements. The first was CR-2, a frost point hygrometer with an accuracy of ± 0.1 ∘C (1σ) dew point (manufacturer data, Buck Research Instruments L.L.C., US, http://www.hygrometers.com, last access: 1 September 2018). The second reference instrument was FISH, which is based on the Lyman-α photofragment fluorescence technique and has an accuracy of 6 % to 8 % (1σ) in the range from 4 to 1000 ppm and 0.3 ppm for lower mixing ratios down to 1 ppm (Meyer et al., 2015). The CR-2 was connected to a backward-facing inlet to avoid sampling of cloud and ice particles. In contrast, FISH measured total water instead of only water vapor during the campaign, since its forward-oriented inlet resulted in sampling of cloud droplets and ice crystals when present.
4.1 Results and discussion
4.1.1 Measurement precision
To assess the measurement precision of the CRDS analyzer, water vapor measurements during the periods with stable atmospheric conditions, such as pressure and temperature, were selected. Of course, there are still natural variations left in the data; therefore, only upper limits of the precision can be estimated. After correcting for offset and calibration (according to the 2013 dew point mirror comparison, in the following simply referred to as CRDS measured water vapor), the standard deviation of the difference between the 0.4 Hz data and the 60 s moving average is calculated as a measure of short-term fluctuations. In order to avoid additional noise from variations in sample cell pressure, periods with unstable sample cell pressure were neglected. Deviations of the sample cell pressure from its set point of 186.65 hPa can occur during sudden, fast changes in altitude for which the pressure adjustment is too slow to adapt. Figure 7 shows the resulting short-term fluctuations (i.e., the standard deviations of the difference between the 0.4 Hz data and the 60 s moving average) for different water vapor ranges. The significance of the results certainly depends strongly on the number of data, which were available to calculate the standard deviations in each water vapor interval. Thus, in order to find a reliable estimate for the measurements, results based on a larger number of data are highlighted. Although high scatter of the data between 30 and 100 ppm makes it difficult to find a reliable estimate, the flight data suggest an upper limit for the measurement precision (1σ) of 4 ppm for H2O < 10 ppm, 20 % or 10 ppm (whichever is smaller) for 10 ppm < H2O < 100 ppm, and 5 % or 30 ppm (whichever is smaller) for water vapor > 100 ppm.
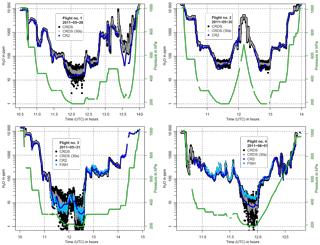
Figure 10In-flight water vapor data from the CRDS analyzer (in black, 30 s mean in grey) and the reference instruments CR-2 (in dark blue) and FISH (in light blue) for the four flights on 26, 30, and 31 May, and 1 June 2011. The corresponding atmospheric pressure levels are shown in green. The CRDS data are offset corrected and calibrated according to the 2013 dew point mirror comparison.
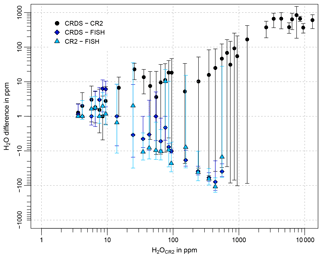
Figure 11Differences of the 30 s mean CRDS and CR-2 in-flight data (black points), CRDS and FISH data (dark blue diamonds), and CR-2 and FISH data (light blue triangles) averaged over intervals of 1, 10, 100, 1000, and 10 000 ppm water vapor in the corresponding water vapor ranges of 0–10, 10–100, 100–1000, 1000–10 000, and > 10 000 ppm, respectively, against the CR-2 water vapor flight data. Error bars indicate the standard deviations of the average differences. The water vapor measurements of CR-2 are chosen as the x axis, because they cover all flights, in contrast to the FISH data. For plotting reasons all differences < 1 ppm are set to 1 ppm.
Table 2Precision estimates (1σ) of the CRDS water vapor measurements derived from laboratory experiments.
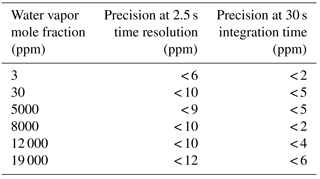
For comparison precision estimates of the CRDS water vapor measurements determined under laboratory conditions, at 2.5 s time resolution and for an integration time of 30 s, are shown in Table 2. They were derived from experiments during which the CRDS analyzer measured pressurized, dried ambient air from a high-pressure tank, which was humidified by a dew point generator (Li-610 from Li-Cor) to specific water levels. For water vapor < 100 ppm the results of the flight and laboratory data are in good agreement. For water vapor > 1000 ppm the laboratory data indicate that a precision of 30 ppm for the flight data is a very conservative estimate, which is most likely due to natural variations in the atmosphere.
Compared to the reference instruments the precision of the CRDS analyzer is worse at low water vapor levels (< 100 ppm), but comparable at higher levels.
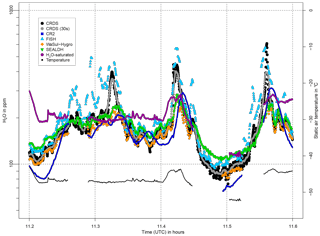
Figure 12Water vapor mole fractions from the CRDS analyzer (black points, 30 s mean as grey points), the CR-2 (dark blue squares) and FISH (light blue triangles) instruments, as well as the WaSul-Hygro (orange diamonds) and SEALDH-I (green triangles) analyzers, during the flight on 1 June 2011, in the presence of clouds. Also shown are the water vapor mole fraction corresponding to saturation (violet points) and the static air temperature (black line).
4.1.2 Response time
Figures 8 and 9 show selected time periods of the third flight on 31 May and the fourth flight on 1 June, respectively. CRDS measured water vapor is shown along with the flight data from reference instruments CR-2 and FISH. Water vapor measurements from two additional analyzers that participated in the inter-comparison campaign are also presented: flight data of WaSul-Hygro, a tunable diode laser-based dual-channel photoacoustic humidity measuring system (Tátrai et al., 2015) and flight data of the Selective Extractive Airborne Laser Diode Hygrometer (SEALDH-1), which is based on tunable diode laser absorption spectroscopy (Buchholz et al., 2012) (please note: not to be confused with the currently used new instrument SEALDH-II, which has a much better performance and smaller uncertainties). Furthermore, the saturated water vapor is added to point out that the measurements were taken outside of clouds.
The flight data of all analyzers in Figs. 8 and 9 indicate that the response time of the CRDS is similar to that of the other instruments. This applies for the whole water vapor range and for both transition directions: from wet to dry conditions as well as from dry to wet. For water vapors < 100 ppm the response time is comparable to the FISH instrument, as shown in the enlarged section of Fig. 8. During the increase in water vapor from 200 to 1200 ppm in about 1 min, shown in the enlarged section in Fig. 9, no significant delay can be detected. Thus, the low sample gas flow of 100 sccm and the 50 cm long inlet line cause no disadvantages. As expected, the slowest response is shown by the CR-2, whose measurement signal tends to overshoot and oscillate after fast changes in water vapor.
Results of a simple laboratory test, where a three-way valve was used to switch between wet (around 23 000 ppm) and dry (around 10 ppm) air, allowed us to estimate the 10 % to 90 % rise and 90 % to 10 % fall times as 6–7 s and the recovery time to 99 % of the final water vapor level as 25 s. For a step from 23 000 to 10 ppm water vapor mole fraction the measurement takes about 200 s to get down. The times are pretty much identical regardless of whether or not the 50 cm long inlet line is included.
4.1.3 Comparison to reference instruments
Figure 10 shows the in-flight CRDS measured water vapor and the CR-2 and FISH reference instruments, as well as the corresponding atmospheric pressure levels, for all four flights. Due to an internal leak FISH could not deliver reliable data for the first two flights. CRDS data from the first flight after around 13:00 were compromised by icing of the inlet, since the deicing of the Rosemount inlet was accidentally not switched on during that flight.
The water vapor differences between the three instruments for different water vapor intervals are plotted in Fig. 11. CRDS data influenced by icing during the first flight are omitted. Likewise, measurement data of all instruments in the presence of clouds are excluded, since FISH measured total water. Based on observations during the flights, which are recorded in the flight logs, this concerns in particular all measurements made between 11:13 and 11:40 on flight 4 (1 June).
A reliable evaluation is hard to make as the FISH reference instrument operated successfully for only two of the four flights, and for flight 4 the measurements diverge significantly from the CR-2 data to a large extent. Moreover, the slow response of the CR-2 and the oscillations of the signal after sudden changes in water vapor are problematic for the comparison. Furthermore, flight data between 11:13 and 11:40 for flight 4 could not be used, due to the occurrence of clouds. However, it is interesting that the CRDS water vapor measurements deviate from the CR-2 during that period, as can be seen in Fig. 10. Figure 12 shows a closer look at this cloud-affected flight section. The CRDS measured water vapor is plotted together with flight data of CR-2, FISH, Wasul-Hygro and SEALDH-I. The latter two show approximately the same behavior as the CR-2. This is in line with expectation, since all three shared the same backward-faced inlet, which prevented from sampling cloud droplets. However, the CRDS shows a behavior similar to that of FISH (measuring total water) with H2O mole fractions within clouds larger than that corresponding to saturated water vapor. This indicates that the CRDS sampling was likely also affected by cloud particles; i.e., the separation in the Rosemount air inlet of ice particles and water droplets from the sample air is not fully efficient. In fact relative humidity measurements from the MOZAIC humidity device, which uses the same type of Rosemount Inlet housing, occasionally show similar artifacts, when measuring within clouds, containing liquid water (air temperature > −40 ∘C) (Smit et al., 2013). Most likely some small ice particles and water droplets are able to follow the sharp right angle turn of the minor air flow into the inner part of the Rosemount housing, instead of flying straight through the main channel of the housing (see Fig. 2.6 in Smit et al., 2013). Such small enough particles could be produced, e.g., by the shattering of water droplets or ice crystals in the Rosemount housing. However, due to the very short time period the sample air stays inside the housing until it passes the sensor elements and leaves again through a small outlet, only the liquid water droplets can evaporate fast enough to be observed by the humidity device. In contrast, as can be seen in Fig. 12, the CRDS measurements do show cloud artifacts also at air temperatures below −40 ∘C, i.e., in pure ice clouds. Most likely the reason for this is that water droplets and ice particles enter the inlet line of the CRDS and are evaporated within the inlet line or at the heated inlet filter of the CRDS. Meaningful statistics about how often droplets and ice particles are measured in clouds can be obtained as soon as more flight data from the CRDS analyzer are available within the IAGOS project, since every IAGOS aircraft equipped with the GHG package is also equipped with the MOZAIC humidity device and a cloud probe.
The absolute differences in Fig. 11 indicate a positive difference between the CRDS and CR-2 of < 10 % or 10 ppm (whichever is greater) for water vapor ranges > 10 ppm. FISH has a negative deviation to both instruments in that range. For water vapor > 100 ppm the data imply a difference of 10 % to 20 %. For the interval of 10–100 ppm water vapor the difference to the CRDS is around 10 %, to CR-2 about 10 ppm. At very low water vapor (< 10 ppm) the reference instruments show a good agreement during flight 3, but disagree strongly during flight 4. On average the CR-2 has a positive bias < 2 ppm against FISH. For the CRDS the water vapor data suggest a positive bias < 2–3 ppm to the CR-2, but the measurements are highly affected by the slow response of the CR-2. Comparison to FISH likewise indicates a positive difference < 2–3 ppm. During comparison against the FISH calibration bench the CRDS analyzer showed a positive bias of 12.2 ppm (see Sect. 3.2), which strengthens the presumption that the air has not been in equilibrium for the lowest water vapor level measured during the experiment.
Meyer et al. (2015) report an agreement of FISH with other in situ and remote sensing hygrometers under field conditions of about ± 5 % to 20% at < 10 ppm and ± 0 % to 15 % at > 10 ppm. Thus, results of the comparison between CRDS and FISH during the DENCHAR inter-comparison campaign are at the upper end of that range.
During the DENCHAR inter-comparison flight campaign in Hohn (Germany) in May–June 2011 a commercial cavity ring-down spectroscopy (CRDS) based gas analyzer (G2401-m, Picarro Inc., US) was installed on a Learjet to measure atmospheric water vapor, CO2, CH4 and CO. The components of the instrument and the inlet system are identical to those chosen for the IAGOS-core Greenhouse Gas package.
For the calibration of the water vapor measurements three different methods were tested. The standard calibration of the CRDS analyzer is the comparison against a dew point mirror (Dewmet TDH, Cooled Mirror Dewpointmeter, Michell Instruments Ltd., UK) in the range from about 8000 to 30 000 ppm water vapor mole fraction. If the dew point mirror is calibrated regularly by the manufacturer, the accuracy of this calibration method is limited by the uncertainty range of the dew point mirror (1.3 %, 2σ). A comparison against the FISH calibration bench, during the DENCHAR flight campaign, in the range from 2 to 600 ppm water vapor, confirmed that the extrapolation of the dew point mirror calibration down to low water vapor levels is possible, and that the standard calibration of the CRDS analyzer is in agreement with the FISH calibration within the 4 % uncertainty range (1σ) of the FISH calibration bench. Furthermore, a new and completely independent calibration method, which is based on measurement of the dilution effect of water vapor on the CO2 mole fraction, was presented. This new method was found to agree with the dew point mirror calibration within 2.9 % in the water vapor range from 300 to 27 000 ppm. Assuming a conservative 1 % uncertainty (1σ) for the CO2 dilution method, comparison of the dilution-based estimate with the FISH calibration bench showed an overlap within their combined uncertainty. Thus, the water vapor calibration via dilution of CO2 is statistically consistent with the classical calibration using dew point or frost point hygrometers. The dilution method can be used for the calibration of other species, too, provided they and the corresponding diluted species are measurable by a CRDS analyzer and the dilution effect is large enough to be within the detection limits.
An upper limit of the precision (1σ) of the water vapor measurements by the CRDS was determined from flight data of the DENCHAR inter-comparison campaign, as 4 ppm for H2O < 10 ppm, 20 % or 10 ppm (whichever is smaller) for 10 ppm < H2O < 100 ppm, and 5 % or 30 ppm (whichever is smaller) for water vapor > 100 ppm. A more reliable estimate will be possible as soon as more H2O flight data are available. During the four DENCHAR flights the CRDS analyzer showed a good time response (10 % to 90 % rise and 90 % to 10 % fall times: 6–7 s, recovery time to 99 % of the final water vapor level: 25 s) and long-term stability for the water vapor measurements. Comparison against the reference instruments was difficult, due to lack of data availability of FISH, the slow response of CR-2, the exclusion of data, which were affected by clouds, and the partly poor agreement between FISH and CR-2. However, for water vapor levels > 10 ppm the flight data imply a negative difference between the CRDS and FISH from about 10 % to 20 % and a positive difference between the CRDS and CR-2 of < 10 % or 10 ppm (whichever is greater). For water vapor < 10 ppm the flight data suggest a positive bias of < 2–3 ppm to both FISH and CR-2.
Accuracy (1σ) of the CRDS instrument was estimated, based on the laboratory calibrations, as 1 % for the water vapor range from 25 000 ppm down to 7000 ppm, then increasing to 5 % at 50 ppm water vapor. Accuracy at water vapor mole fractions below 50 ppm was difficult to assess, as the reference systems suffered from lack of data availability.
Future deployment of the CRDS system within IAGOS will help to further evaluate the performance, via better statistics and long-term comparison to the MOZAIC humidity device, which is deployed on each IAGOS aircraft. Thus, essential water vapor measurements, including regular in situ data in the sensible UTLS region and vertical profiles of H2O in the troposphere and lower stratosphere for major parts of the globe, are expected to be delivered for validation of remote-sensing-based observations from satellites and ground, for the improvement of the performance of climate models and weather forecasts, or for climate trend studies.
All data from laboratory and flight tests are available upon request (annette.filges@bgc-jena.mpg.de).
The authors declare that they have no conflict of interest.
This work was supported by the European Commission through the FP6 project
IAGOS Design Study (contract number 011902-DS) and IAGOS-ERI, an FP7 project
(grant agreement no. 212128). The DENCHAR flight campaign was funded by the
European Commission's FP7 EUFAR project. Funding for IAGOS Deutschland was
provided by the Bundesministerium für Bildung und Forschung (BMBF),
Germany. Additional funding from the German Max Planck Society to support the
instrument development is greatly acknowledged. Development and operation of
Wasul-Hygro were supported by the Hungarian Research and Technology
Innovation Fund (OTKA), project no. NN109679. The
article processing charges for this open-access
publication
were covered by the Max Planck Society. Edited by:
Szymon Malinowski
Reviewed by: two anonymous referees
Buchholz, B., Kühnreich, B., Smit, H. G. J., and Ebert, V.: Validation of an extractive, airborne, compact TDL spectrometer for atmospheric humidity sensing by blind intercomparison, Appl. Phys. B, 110, 249–262, https://doi.org/10.1007/s00340-012-5143-1, 2012.
Buchholz, B., Afchine, A., Klein, A., Schiller, C., Krämer, M., and Ebert, V.: HAI, a new airborne, absolute, twin dual-channel, multi-phase TDLAS-hygrometer: background, design, setup, and first flight data, Atmos. Meas. Tech., 10, 35–57, https://doi.org/10.5194/amt-10-35-2017, 2017.
Chen, H., Winderlich, J., Gerbig, C., Hoefer, A., Rella, C. W., Crosson, E. R., Van Pelt, A. D., Steinbach, J., Kolle, O., Beck, V., Daube, B. C., Gottlieb, E. W., Chow, V. Y., Santoni, G. W., and Wofsy, S. C.: High-accuracy continuous airborne measurements of greenhouse gases (CO2 and CH4) using the cavity ringdown spectroscopy (CRDS) technique, Atmos. Meas. Tech., 3, 375–386, https://doi.org/10.5194/amt-3-375-2010, 2010.
Crosson, E. R.: A cavity ring-down analyzer for measuring atmospheric levels of methane, carbon dioxide, and water vapor, Appl. Phys. B, 92, 403–408, https://doi.org/10.1007/s00340-008-3135-y, 2008.
Dessler, A. E., Zhang, Z., and Yang, P.: Water-vapor climate feedback inferred from climate fluctuations, 2003–2008, Geophys. Res. Lett., 35, L20704, https://doi.org/10.1029/2008GL035333, 2008.
Dirksen, R. J., Sommer, M., Immler, F. J., Hurst, D. F., Kivi, R., and Vömel, H.: Reference quality upper-air measurements: GRUAN data processing for the Vaisala RS92 radiosonde, Atmos. Meas. Tech., 7, 4463–4490, https://doi.org/10.5194/amt-7-4463-2014, 2014.
Fahey, D. W., Gao, R.S., Carslaw, K. S. , Kettleborough, J., Popp, P. J., Northway, M. J., Holecek, J. C., Ciciora, S. C., McLaughlin, R. J., Thompson, T. L., Winkler, R. H., Baumgardner, D. G., Gandrud, B., Wennberg, P. O., Dhaniyala, S., Mckinney, K., Peter, Th., Salawitch, R. J., Bui, T. P., Elkins, J. W., Webster, C. R., Atlas, E. L., Jost, H., Wilson, J. C., Herman, R. L., Kleinböhl, A., and von König, M.: The Detection of Large HNO3-Containing Particles in the Winter Arctic Stratosphere, Science, 291, 1026–1031, 2001.
Fahey, D. W., Gao, R.-S., Möhler, O., Saathoff, H., Schiller, C., Ebert, V., Krämer, M., Peter, T., Amarouche, N., Avallone, L. M., Bauer, R., Bozóki, Z., Christensen, L. E., Davis, S. M., Durry, G., Dyroff, C., Herman, R. L., Hunsmann, S., Khaykin, S. M., Mackrodt, P., Meyer, J., Smith, J. B., Spelten, N., Troy, R. F., Vömel, H., Wagner, S., and Wienhold, F. G.: The AquaVIT-1 Intercomparison of Atmospheric Water Vapor Measurement Techniques, Atmos. Meas. Tech., 7, 3177–3213, https://doi.org/10.5194/amt-7-3177-2014, 2014.
Filges, A., Gerbig, C., Chen, H., Franke, H., Klaus, C., and Jordan, A.: The IAGOS-core greenhouse gas package: a measurement system for continuous airborne observations of CO2, CH4, H2O and CO, Tellus B, 67, 27989, https://doi.org/10.3402/tellusb.v67.27989, 2015.
Forster, P. M. de F. and Shine, K. P.: Assessing the climate impact of trends in stratospheric water vapor, Geophys. Res. Lett., 29, 1086, https://doi.org/10.1029/2001GL013909, 2002.
Gierens, K., Schumann, U., Helten, M., Smit, H., and Marenco, A.: A distribution law for relative humidity in the upper troposphere and lower stratosphere derived from three years of MOZAIC measurements, Ann. Geophys., 17, 1218–1226, https://doi.org/10.1007/s00585-999-1218-7, 1999.
Goff, J. A.: Saturation pressure of water on the new Kelvin temperature scale, Transactions of the American society of heating and ventilating engineers, presented at the semi-annual meeting of the American society of heating and ventilating engineers, 347–354, Murray Bay, Que. Canada, 1957.
Hall, E. G., Jordan, A. F., Hurst, D. F., Oltmans, S. J., Vömel, H., Kühnreich, B., and Ebert, V.: Advancements, measurement uncertainties, and recent comparisons of the NOAA frostpoint hygrometer, Atmos. Meas. Tech., 9, 4295–4310, https://doi.org/10.5194/amt-9-4295-2016, 2016.
Helten, M., Smit, H. G. J., Straeter, W., Kley, D., Nedelec, P., Zöger, M., and Busen, R.: Calibration and performance of automatic compact instrumentation for the measurement of relative humidity from passenger aircraft, J. Geophys. Res., 103, 25643–25652, 1998.
Hoareau, C., Keckhut, P., Noel, V., Chepfer, H., and Baray, J.-L.: A decadal cirrus clouds climatology from ground-based and spaceborne lidars above the south of France (43.9∘ N–5.7∘ E), Atmos. Chem. Phys., 13, 6951–6963, https://doi.org/10.5194/acp-13-6951-2013, 2013.
Hurst, D. F., Oltmans, S. J., Vömel, H., Rosenlof, K. H., Davis, S. M., Ray, E. A., Hall, E. G., and Jordan, A. F.: Stratospheric water vapor trends over Boulder, Colorado: Analysis of the 30 year Boulder record, J. Geophys. Res., 116, D02306, https://doi.org/10.1029/2010JD015065, 2011.
Kaufmann, S., Voigt, C., Jurkat, T., Thornberry, T., Fahey, D. W., Gao, R.-S., Schlage, R., Schäuble, D., and Zöger, M.: The airborne mass spectrometer AIMS – Part 1: AIMS-H2O for UTLS water vapor measurements, Atmos. Meas. Tech., 9, 939–953, https://doi.org/10.5194/amt-9-939-2016, 2016.
Kiehl, J. T. and Trenberth, K. E.: Earth's annual global mean energy budget, B. Am. Meteor. Soc., 78, 197–208, https://doi.org/10.1175/1520-0477(1997)078<0197:EAGMEB>2.0.CO;2, 1997.
Kley, D., Russell III, J. M., and Phillips, C.: SPARC assessment of upper tropospheric and stratospheric water vapour, World Climate Research Programme Rep. 113, WMO/TD No. 1043, SPARC Rep. No. 2, 324 pp., Geneva, Switzerland, 2000.
Kunz, A., Mueller, R., Homonnai, V., Janosi, I. M., Hurst, D., Rap, A., Forster, P. M., Rohrer, F., Spelten, N., and Riese, M.: Extending water vapor trend observations over Boulder into the tropopause region: trend uncertainties and resulting radiative forcing, J. Geophys. Res.-Atmos., 118, 11269–11284, https://doi.org/10.1002/jgrd.50831, 2013.
Marenco, A., Thouret, V., Nédélec, P., Smit, H., Helten, M., Kley, D., Karcher, F., Simon, P., Law, K., Pyle, J., Poschmann, G., Von Wrede, R., Hume, C., and Cook, T.: Measurement of ozone and water vapor by Airbus in-service aircraft: The MOZAIC airborne program, An overview, J. Geophys. Res., 103, 25631–25642, 1998.
May, R. D.: Open-path, near-infrared tunable diode laser spectrometer for atmospheric measurements of H2O, J. Geophys. Res., 103, 19161–19172, 1998.
Meyer, J., Rolf, C., Schiller, C., Rohs, S., Spelten, N., Afchine, A., Zöger, M., Sitnikov, N., Thornberry, T. D., Rollins, A. W., Bozóki, Z., Tátrai, D., Ebert, V., Kühnreich, B., Mackrodt, P., Möhler, O., Saathoff, H., Rosenlof, K. H., and Krämer, M.: Two decades of water vapor measurements with the FISH fluorescence hygrometer: a review, Atmos. Chem. Phys., 15, 8521–8538, https://doi.org/10.5194/acp-15-8521-2015, 2015.
Milz, M., von Clarmann, T., Fischer, H., Glatthor, N., Grabowski, U., Höpfner, M., Kellmann, S., Kiefer, M., Linden, A., Mengistu Tsidu, G., Steck, T., Stiller, G. P., Funke, B., López-Puertas, M., and Koukouli, M. E.: Water vapor distributions measured with the Michelson Interferometer for Passive Atmospheric Sounding on board Envisat (MIPAS/Envisat), J. Geophys. Res., 110, D24307, https://doi.org/10.1029/2005JD005973, 2005.
Oltmans, S. J., Vömel, H., Hofmann, D. J., Rosenlof, K. H., and Kley, D.: The increase in stratospheric water vapor from balloonborne, frostpoint hygrometer measurements at Washington, D.C., and Boulder, Colorado, Geophys. Res. Lett., 27, 3453–3456, https://doi.org/10.1029/2000GL012133, 2000.
Petzold, A., Thouret, V., Gerbig, C., Zahn, A., Brenninkmeijer, C. A. M., Gallagher, M., Hermann, M., Pontaud, M., Ziereis, H., Boulanger, D., Marshall, J., Nédélec, P., Smit, H. G. J., Friess, U., Flaud, J.-M., Wahner, A., Cammas, J.-P., and Volz-Thomas, A.: Global-scale atmosphere monitoring by in-service aircraft – current achievements and future prospects of the European Research Infrastructure IAGOS, Tellus B, 67, 28452, https://doi.org/10.3402/tellusb.v67.28452, 2015.
Poshyvailo, L., Müller, R., Konopka, P., Günther, G., Riese, M., Podglajen, A., and Ploeger, F.: Sensitivities of modelled water vapour in the lower stratosphere: temperature uncertainty, effects of horizontal transport and small-scale mixing, Atmos. Chem. Phys., 18, 8505–8527, https://doi.org/10.5194/acp-18-8505-2018, 2018.
Rella, C. W.: Accurate Greenhouse Gas Measurements in Humid Gas Streams Using the Picarro G1301 Carbon Dioxide/Methane/Water Vapor Gas Analyzer, Picarro, Inc., Santa Clara, CA, USA, available at: http://www.picarro.com/resources/whitepapers (last access: 1 September 2018), 2010.
Rella, C. W., Chen, H., Andrews, A. E., Filges, A., Gerbig, C., Hatakka, J., Karion, A., Miles, N. L., Richardson, S. J., Steinbacher, M., Sweeney, C., Wastine, B., and Zellweger, C.: High accuracy measurements of dry mole fractions of carbon dioxide and methane in humid air, Atmos. Meas. Tech., 6, 837–860, https://doi.org/10.5194/amt-6-837-2013, 2013.
Reum, F., Gerbig, C., Lavric, J. V., Rella, C. W., and Göckede, M.: An improved water correction function for Picarro greenhouse gas analyzers, Atmos. Meas. Tech. Discuss., https://doi.org/10.5194/amt-2017-174, 2017.
Riese, M., Ploeger, F., Rap, A., Vogel, B., Konopka, P., Dameris, M., and Forster, P.: Impact of uncertainties in atmospheric mixing on simulated UTLS composition and related radiative effects, J. Geophys. Res., 117, D16305, https://doi.org/10.1029/2012JD017751, 2012.
Rind, D., Chiou, E. W., Chu, W., Oltmans, S., Lerner, J., Larsen, J., McCormick, M. P., and McMaster, L.: Overview of the Stratospheric Aerosol and Gase Experiment II water vapour observations: Method, validation, and data characteristics, J. Geophys. Res., 98, 4835–4856, 1993.
Rollins, A. W., Thornberry, T. D., Gao, R. S., Smith, J. B., Sayres, D. S., Sargent, M. R., Schiller, C., Krämer, M., Spelten, N., Hurst, D. F., Jordan, A. F., Hall, E. G., Vömel, H., Diskin, G. S., Podolske, J. R., Christensen, L. E., Rosenlof, K. H., Jensen, E. J., and Fahey, D. W.: Evaluation of UT/LS hygrometer accuracy by intercomparison during the NASA MACPEX mission, J. Geophys. Res., 119, 1915–1935, https://doi.org/10.1002/2013JD020817, 2014.
Rozanov, A., Weigel, K., Bovensmann, H., Dhomse, S., Eichmann, K.-U., Kivi, R., Rozanov, V., Vömel, H., Weber, M., and Burrows, J. P.: Retrieval of water vapor vertical distributions in the upper troposphere and the lower stratosphere from SCIAMACHY limb measurements, Atmos. Meas. Tech., 4, 933–954, https://doi.org/10.5194/amt-4-933-2011, 2011.
Sayres, D. S., Moyer, E. J., Hanisco, T. F., St. Clair, J. M., Keutsch, F. N., O'Brien, A., Allen, N. T., Lapson, L., Demusz, J. N., Rivero, M., Martin, T., Greenberg, M., Tuozzolo, C., Engel, G. S., Kroll, J. H., Paul, J. B., and Anderson, J. G.: A new cavity based absorption instrument for detection of water isotopologues in the upper troposphere and lower stratosphere, Rev. Sci. Instrum., 80, 044102, https://doi.org/10.1063/1.3117349, 2009.
Schneider, M., Hase, F., and Blumenstock, T.: Water vapour profiles by ground-based FTIR spectroscopy: study for an optimised retrieval and its validation, Atmos. Chem. Phys., 6, 811–830, https://doi.org/10.5194/acp-6-811-2006, 2006.
Smit, H. G. J., Volz-Thomas, A., Helten, M., Pätz, H.-W., and Kley, D.: An in-flight Calibration Method for Near-Real-Time Humidity Measurements with the Airborne MOZAIC sensor, J. Atmos. Ocean. Technol., 25, 656–666, https://doi.org/10.1175/2007JTECHA975.1, 2008.
Smit, H. G. J., Kivi, R., Vömel, H., and Paukkunen, A.: Thin Film Capacitive Sensors, in: Monitoring Atmospheric Water Vapour: Ground-Based Remote Sensing and In-situ Methods, edited by: Kämpfer, N., ISSI Scientific Report Series 10, 11–38, Springer Science+Buisness Media, New York, https://doi.org/10.1007/978-1-4614-3909-7, 2013.
Smith, C. A., Haigh, J. D., and Toumi, R.: Radiative forcing due to trends in stratospheric water vapour, Geophys. Res. Lett., 28, 179–182, 2001.
Solomon, S., Rosenlof, K. H., Portmann, R. W., Daniel, J. S., Davis, S. M., Sanford, T. J., and Plattner, G.-K.: Contributions of stratospheric water vapor to decadal changes in the rate of global warming, Science, 327, 1219–1223, https://doi.org/10.1126/science.1182488, 2010.
Tátrai, D., Bozóki, Z., Smit, H., Rolf, C., Spelten, N., Krämer, M., Filges, A., Gerbig, C., Gulyás, G., and Szabó, G.: Dual-channel photoacoustic hygrometer for airborne measurements: background, calibration, laboratory and in-flight intercomparison tests, Atmos. Meas. Tech., 8, 33–42, https://doi.org/10.5194/amt-8-33-2015, 2015.
Volz-Thomas, A., Berg, M., Heil, T., Houben, N., Lerner, A., Petrick, W., Raak, D., and Pätz, H.-W.: Measurements of total odd nitrogen (NOy) aboard MOZAIC in-service aircraft: instrument design, operation and performance, Atmos. Chem. Phys., 5, 583–595, https://doi.org/10.5194/amt-5-583-2005, 2005.
Volz-Thomas, A., Cammas, J.-P., Brenninkmeijer, C. A. M., Machida, T., Cooper, O., Sweeney, C., and Waibel, A.: Civil Aviation Monitors Air Quality and Climate, J. Air Waste Manage. Assoc., 16–19 October 2009, 2009.
von Clarmann, T., Höpfner, M., Kellmann, S., Linden, A., Chauhan, S., Funke, B., Grabowski, U., Glatthor, N., Kiefer, M., Schieferdecker, T., Stiller, G. P., and Versick, S.: Retrieval of temperature, H2O, O3, HNO3, CH4, N2O, ClONO2 and ClO from MIPAS reduced resolution nominal mode limb emission measurements, Atmos. Meas. Tech., 2, 159–175, https://doi.org/10.5194/amt-2-159-2009, 2009.
Vömel, H., David, D. E., and Smith, K.: Accuracy of tropospheric and stratospheric water vapor measurements by the cryogenic frost point hygrometer: Instrumental details and observations, J. Geophys. Res., 112, D08305, https://doi.org/10.1029/2006JD007224, 2007.
Vömel, H., Naebert, T., Dirksen, R., and Sommer, M.: An update on the uncertainties of water vapor measurements using cryogenic frost point hygrometers, Atmos. Meas. Tech., 9, 3755-3768, https://doi.org/10.5194/amt-9-3755-2016, 2016.
Weigel, K., Rozanov, A., Azam, F., Bramstedt, K., Damadeo, R., Eichmann, K.-U., Gebhardt, C., Hurst, D., Kraemer, M., Lossow, S., Read, W., Spelten, N., Stiller, G. P., Walker, K. A., Weber, M., Bovensmann, H., and Burrows, J. P.: UTLS water vapour from SCIAMACHY limb measurements V3.01 (2002–2012), Atmos. Meas. Tech., 9, 133–158, https://doi.org/10.5194/amt-9-133-2016, 2016.
Weinstock, E. M., Smith, J. B., Sayres, D. S., Pittman, J. V., Spackman, J. R., Hintsa, E. J., Hanisco, T. F., Moyer, E. J., St. Clair, J. M., Sargent, M. R., and Anderson, J. G.: Validation of the Harvard Lyman-a in situ water vapor instrument: Implications for the mechanisms that control stratospheric water vapor, J. Geophys. Res., 114, D23301, https://doi.org/10.1029/2009JD012427, 2009.
Winderlich, J., Chen, H., Gerbig, C., Seifert, T., Kolle, O., Lavrič, J. V., Kaiser, C., Höfer, A., and Heimann, M.: Continuous low maintenance CO2∕CH4∕H2O measurements at the Zotino Tall Tower Observatory (ZOTTO) in Central Siberia, Atmos. Meas. Tech., 3, 1113–1128, https://doi.org/10.5194/amt-3-1113-2010, 2010.
World Meteorological Organization (WMO): Guide to Meteorological Instruments and Methods of Observation, 2008 edition, updated in 2010, WMO-No. 8, Geneva, I.4-1–I.4-30, 2012.
Zahn, A., Christner, E., van Velthoven, P. F. J., Rauthe-Schöch, A., and Brenninkmeijer, C. A. M.: Processes controlling water vapor in the upper troposphere/lowermost stratosphere: An analysis of 8?years of monthly measurements by the IAGOS-CARIBIC observatory, J. Geophys. Res.-Atmos., 119, 11505–11525, https://doi.org/10.1002/2014JD021687, 2014.
Zöger, M., Afchine, A., Eicke, N., Gerhards, M.-T., Klein, E., McKenna, D. S., Mörschel, U., Schmidt, U., Tan, V., Tuitjer, F., Woyke, T., and Schiller, C.: A new family of balloon-borne and airborne Lyman-α photofragment fluorescence hygrometers, J. Geophys. Res., 104, 1807–1816, https://doi.org/10.1029/1998JD100025, 1999.


