the Creative Commons Attribution 4.0 License.
the Creative Commons Attribution 4.0 License.
Preflight calibration of the Chinese Environmental Trace Gases Monitoring Instrument (EMI)
Min Jie Zhao
Hai Jin Zhou
Shi Mei Wang
Yu Jiang
Wen Qing Liu
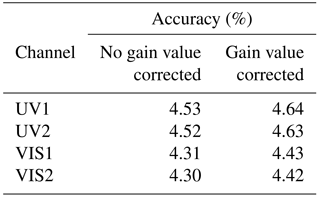
An environmental trace gases monitoring instrument (EMI) is a nadir-viewing wide-field imaging spectrometer, which aims to quantify the global distribution of tropospheric and stratospheric trace gases, and is planned to be launched on 9 May 2018. The selected wavelength bands for EMI are ultraviolet channels: UV1 (240–315 nm), UV2 (311–403 nm) and visible channels: VIS1 (401–550 nm), and VIS2 (545–710 nm). The spectral resolution is 0.3–0.5 nm, and the swath is approximately 114∘ wide to achieve a one-day global coverage. The preflight calibration of the EMI is discussed in this paper. A tunable laser and rotating platform are adopted for an EMI wavelength calibration of the entire field of view. The accuracy of the wavelength calibration is less than 0.05 nm. In addition, the solar calibration mode shows the same results compared with Earth observation mode. A thermal vacuum test is performed to investigate the influence of in-orbit thermal vacuum conditions on the EMI, and EMI spectral response changes with pressure, optical bench temperature, and charge-coupled device (CCD) detector temperature are obtained. For a radiometric calibration of UV1, a diffuser plate with a 1000 W xenon lamp, which produces sufficient UV output, is selected. An integrating sphere system with tungsten halogen lamp is selected for the UV2, VIS1, and VIS2. The accuracies of radiance calibration are 4.53 % (UV1), 4.52 % (UV2), 4.31 % (VIS1), and 4.30 % (VIS2). The goniometry correction factor and irradiance response coefficient of the EMI are also calibrated on the ground for an in-orbit calibration of the solar. A signal-to-noise ratio (SNR) model of the EMI is introduced, and the EMI in-orbit SNR is estimated using the SNR and MODTRAN radiance models.
- Article
(7795 KB) - Full-text XML
- BibTeX
- EndNote
Numerous space-borne spectrometers, such as GOME (Burrows et al., 1999), SCIAMACHY (Bovensmann et al., 1999), GOME-2 (Munro et al., 2016), and OMI (Levelt et al., 2006), have been successfully applied to the global monitoring of atmospheric trace gas distributions. These instruments measure sun radiance backscattered from the Earth's atmosphere in the UV–VIS wavelength range. TROPOMI builds upon the heritages of SCIAMACHY and OMI instruments, which were launched in 2017 on ESA's Sentinel 5 precursor satellite (Voors et al., 2012).
An environmental trace gases monitoring instrument (EMI) is a space-borne nadir-viewing wide-field imaging spectrometer, which is used to obtain global distributions of tropospheric and stratospheric trace gases (e.g., NO2, O3, HCHO, and SO2) at high spatial and spectral resolution. The EMI is planned to be launched on 9 May 2018.
1.1 Performance requirements
-
Spectral range – UV1: 240–315 nm; UV2: 311–403 nm; VIS1: 401–550 nm; VIS2: 545–710 nm;
-
Spectral resolution – < 0.5 nm;
-
Accuracy of the on-ground wavelength calibration – < 0.05 nm;
-
Accuracy of the on-ground radiometric calibration – < 5 %;
-
SNR – UV channel: > 200
(@1.27 µW cm−2 sr−1 nm−1); VIS channel: > 1300 (@10.89 µW cm−2 sr−1 nm−1).
1.2 Instrument description
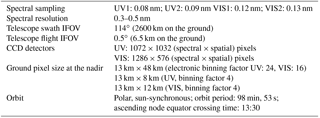
The EMI has four spectral channels (i.e., UV1, UV2, VIS1, and VIS2) that range from 240 to 710 nm. Each channel adopts an Offner imaging spectrometer and 2-D charge-coupled device detectors. The EMI enables an instantaneous field of view (IFOV) of 114∘ (corresponding to a 2600 km broad swath on the Earth's surface), and the space resolution is either 8 km or 12 km (UV or VIS channel) or 48 km (UV and VIS channels) at its nadir, depending on an electronic binning factor (Table 1). Moreover, a one-day global coverage can be realized. The anticipated lifetime of the EMI is 8 years, and its properties are listed in Table 1.
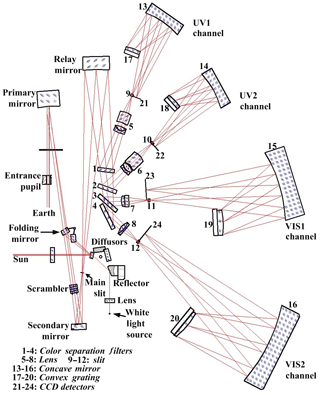
The optical layout of the EMI is illustrated in Fig. 1. The EMI consists of a telescope and four spectrometers.
The telescope provides an IFOV of 114∘ in the swath direction and 0.5∘ in the flight direction, thereby yielding an overall ground coverage of approximately 2600 km × 6.5 km at an altitude of 705 km. The spatial resolution in the swath and flight directions depend on the electronic binning factor and CCD integration time, respectively. Four Offner imaging spectrometers are adopted by the EMI, where each spectrometer has a convex grating and a 2-D charged-coupled device (CCD) detectors. The Offner imaging spectrometer can be easily miniaturized and is lightweight and suitable for the development of space technology. This spectrometer is also suitable for high spatial and spectral resolution detection systems. The EMI covers a 240–710 nm range with a spectral resolution of 0.3–0.5 nm.
One observation mode and two calibration modes are included in the EMI. The observation mode is used to detect atmospheric scattering light, and the two calibration modes are utilized for in-orbit calibration.
In the observation mode, the Earth radiance enters the telescope through the entrance pupil and is imaged on the main slit after reflection by the primary and secondary mirrors. A polarization scrambler is located before the secondary mirror, which is used to enable the EMI to be insensitive to the polarization state of the incident light. Furthermore, a relay mirror behind the main slit reflects the incident light on color separation filters 1–4. Color separation filter 1 reflects the 240–315 nm range of the spectrum to the UV1 channel and transmits the rest of the spectra to color separation filter 2. Consequently, 311–403, 401–550, and 545–710 nm ranges of the spectra are reflected to the UV2, VIS1, and VIS2 channels by Filters 2–4. The spectrum from the filters is imaged on spectrometer slits 9–12 (10 mm × 60 µm) through lenses 5–8. Final dispersion is achieved by convex grating 17–20 after reflection by concave mirrors 13–16, which are used in the first order. The spectrum is imaged onto 2-D (spectral and spatial dimensions) CCD detectors 21–24.
The first calibration mode is solar calibration. The solar spectrum that is observed by this mode is used to perform accurate wavelength calibrations and normalize the Earth spectra to obtain absolute Earth reflectance spectra. Solar radiation enters the instrument through a mesh (transmission 10 %) by opening the solar aperture mechanism and is diffused by a selected diffuser. Light from the diffusers illuminates the folding mirror and is then reflected on a telescope optical path. The folding mirror in this position blocks the Earth radiance from the primary mirror. The EMI equipped with one surface reflectance aluminum diffuser (40 mm × 16 mm) and one quartz volume diffuser (QVD; 40 mm × 16 mm × 6 mm), which consists of a 6 mm thick quartz ground on both sides and is coated with aluminum on the backside. In addition to its use for radiometric calibration, the QVD is used once per day to provide a solar reference spectrum because considerably fewer structures are introduced by the QVD than the aluminum diffuser (Dirksen et al., 2004; de Vries et al., 2005). The aluminum diffuser is mainly used for monitoring optical degradation behavior in space. This monitoring is performed monthly.
The second calibration mode is the white light source (WLS) calibration. A quartz tungsten halogen WLS (6 V, 10 W) is used to monitor CCD detector properties. The light from the WLS travels through the transmission diffuser and is reflected to the telescope optical path.
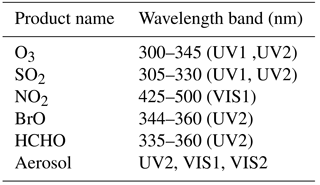
Large spectral range from 240 to 710 nm combined with the high spectral resolution (0.3 to 0.5 nm) of the EMI enables the measurement of several trace gases (e.g., NO2, O3, SO2, BrO, HCHO) as well as aerosol, see Table 2. To achieve a high retrieval precision, a high SNR is required for the scattered radiance from the UV to the VIS.
The EMI detection capability must match changes in the Earth radiance. Thus, the instrument can obtain enhanced measurements from in-orbit. High-accuracy spectral and radiometric calibrations are required on the ground to obtain the response performance of the instrument (Albinana and Munro, 2002; Dobber et al., 2006; Ording et al., 2016; Kleipool et al., 2018).
2.1 Spectral calibration
A spectral calibration is performed in Earth observation mode (EOM) during laboratory calibration. The calibration results of the EOM can be applied to solar calibration mode (SCM) (see Sect. 2.3). The utilized tunable laser (OPOTEK: RADIANT) exhibits output spectrum ranges of 193–410 and 410–2500 nm, which can cover 240–710 nm of the EMI with wavelength accuracy of 10 pm. In addition, the spectral calibration is performed in a clean room, thereby reducing the influence of temperature and humidity.
The spectral calibration is required in the spectral and spatial dimensions. The tunable laser output wavelength space is 5 nm for the UV2 channel and 10 nm for the UV1, VIS1, and VIS2 channels in the spectral dimension. The spectral lines have full widths at half maximum (FWHM) that are typically 1 order of magnitude lower than the EMI spectral resolution, thus providing delta inputs to the EMI in the wavelength dimension. Therefore, the influence of the slit function of the laser is removed. In the spatial dimension, the instrument must be rotated for 21 steps in accordance with the 5.5∘ interval to cover the full FOV. The spectral calibration and dark background are recoded.
The wavelength calibration of the EMI instrument is expressed as follows:
where λ is the wavelength of a pixel, i is the column number, j is the row number, and cm,j is the wavelength calibration polynomial coefficient. N is the order of the polynomial, which is 3 for the EMI wavelength calibration. The spectral lines of a laser distribute uniformly in the spectral dimension, thereby ensuring a polynomial fitting precision. The four channel wavelength calibrations of a center FOV (CFOV) in the spectral dimension are depicted in Fig. 2.
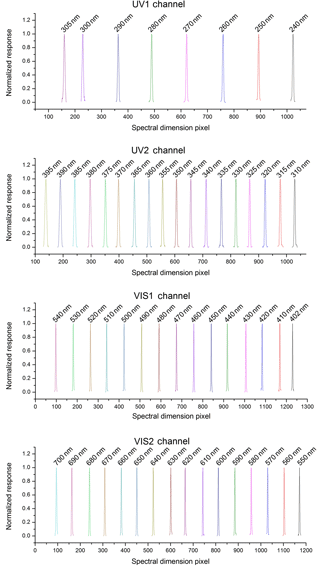
Figure 2EMI CFOV wavelength calibration for each channel. The upper panels present the UV channel, whereas the lower panels display the VIS channel. The spectral responses are normalized.
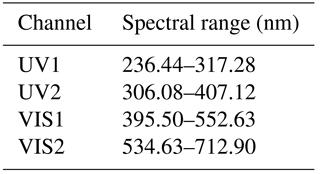
The CFOV spectral ranges of each channel are summarized in Table 3. The spectral range in other FOVs is subsequently discussed.
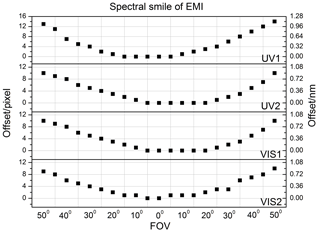
The spectral calibration in the spatial dimension is demonstrated in Fig. 3. A smile effect in the spatial dimension exists in each channel, and the wavelength position on a detector array varies with different FOVs (Barry et al., 2002; Neville et al., 2003; Luis Guanter et al., 2006). The wavelength in a marginal FOV shifts to a long wave for the UV channel and to a short wave for the VIS channel. Figure 3 exhibits the wavelength (pixel) shifts between the CFOV and the other FOVs.
The wavelength (pixel) shift enlarges from the CFOV to the edge FOV. The UV1, UV2, VIS1, and VIS2 wavelength (pixel) shifts of the edge FOV are 1.12 nm (14 pixels), 0.9 nm (10 pixels), 1.2 nm (10 pixels), and 1.3 nm (10 pixels), correspondingly. For the L1b processor of the EMI, the spectral smile effect will be calibrated using a spectrum-matching technique.
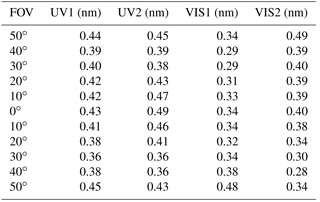
The spectral response of the EMI can be considered as a Gaussian-type function. The FWHM of an instrumental line shape (ILS) function is known as the spectral resolution of the spectrometer channels. The FWHM of the ILS by Gaussian fitting is displayed in Table 4.
The overall accuracy of the spectral calibration is determined by three major factors as follows: (1) the accuracy of a laser output wavelength, which is less than 0.01 nm; (2) the accuracy of the EMI spectral response, which is determined by 20 spectral response measurements from the same laser output line (< 0.014 nm); (3) a fitting method (using least squares method). The accuracy of the polynomial fitting is approximately 0.040 nm, and the Gaussian fitting is approximately 0.020 nm. The final accuracy of the wavelength calibration is less than 0.05 nm, and the accuracy FWHM of the ILS is less than 0.03 nm.
2.2 Thermal vacuum test
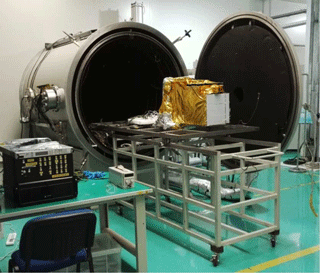
The spectral calibration discussed previously is performed in an atmospheric environment, which can provide detailed spectral response characteristics. A thermal vacuum test is performed (Fig. 4) to determine the difference between the atmospheric and vacuum environments and obtain the spectral response characteristics under thermal vacuum conditions (EMI in-flight conditions). A mercury argon lamp is used as a light source for EMI. The EMI views a mercury argon lamp through a thermal vacuum chamber window. Owing to the limitations of the rotational device and window size, the EMI CFOV is measured in the thermal vacuum chamber.
The thermal vacuum conditions include pressure, optical bench temperature, and CCD temperature.
Pressure:
AE – atmospheric environment
PV – pumping vacuum
NFP – nitrogen filling process
Optical bench temperature
LT – low temperature (276 K)
HT1 – high temperature 1 (290 K)
HT2 – high temperature 2 (288 K)
HT3 – high temperature 3 (299 K)
MT1 – middle temperature 1 (284 K)
MT2 – middle temperature 2 (283 K)
MT3 – middle temperature 3 (285 K)
NTC – no temperature control
CCD temperature:
UV1, UV2 – 254 K
VIS1, VIS2 – the temperature is the same as that of the optical bench.
The wavelength shift and FWHM of the ILS are analyzed in different conditions.
The pixel position that corresponds to the emission peak of the mercury argon lamp is obtained by Gaussian fitting. The wavelength shifts of the four channels are displayed in Fig. 5.
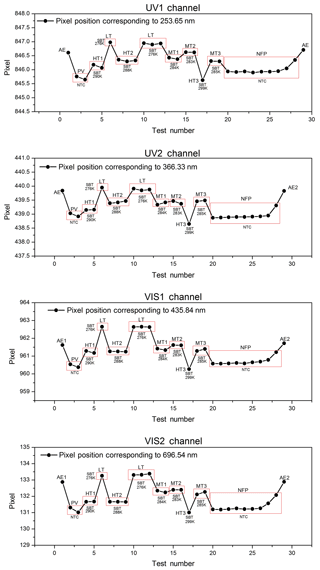
Figure 5Wavelength shifts from the atmospheric environment to vacuum: UV1/0.8 pixel (approximately 0.06 nm), UV2/0.8 pixel (approximately 0.07 nm), VIS1/1 pixel (approximately 0.1 nm), VIS2/1.5 pixel (approximately 0.2 nm); Wavelength shifts from HT1 to LT in vacuum: UV1/1 pixel (approximately 0.1 nm), UV2/1 pixel (approximately 0.1 nm), VIS1/1.5 pixel (approximately 0.2 nm), VIS2/1.5 pixel (approximately 0.2 nm).
The wavelength shifts Δλ are determined by
where λVac and λAt are the wavelengths in the thermal vacuum chamber and atmospheric environment. The atmospheric refractivity n>1 because the thermal vacuum chamber pressure is lower than the atmospheric pressure. The wavelength shifts to a long wave with the decrease in pressure (n becomes large) and to short wave with the increase in pressure (n becomes small) in the thermal vacuum chamber (see PV and NFP results). Furthermore, the wavelength shifts enlarge with the increase in λVac. The results show that the shifts are 0.06 nm for 253.625 nm and 0.2 nm for 696.54 nm.
These results also indicate that the wavelength shifts change with the optical bench temperature under a vacuum condition. The wavelength shifts to a long wave with the increase in the optical bench temperature and to a short wave with the decrease in the optical bench temperature. The wavelength shift is approximately 0.1 nm for UV1 and UV2 and is approximately 0.2 nm for VIS1 and VIS2.
The FWHM of the ILS of four channels are presented in Fig. 6.
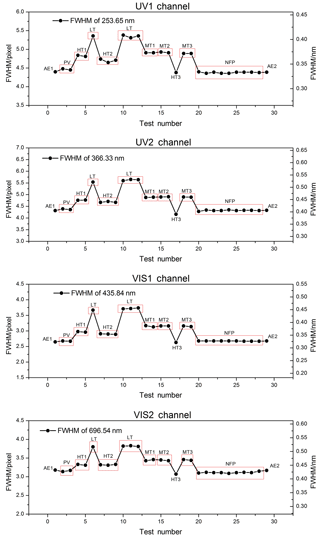
Figure 6Results of the thermal vacuum test on the FWHM of the ILS. The results show that (1) the FWHM of the ILS is essentially the same in different pressures in the thermal vacuum chamber (see AE, PV, and NFP results) and that (2) the FWHM of the ILS shrinks with the increase in the optical bench temperature under a vacuum condition.
The FWHM of the ILS changes with the optical bench temperature (Table 5).
In Table 5, the optical bench temperature significantly influences the spectral resolution of the EMI. For example, the relative deviation of the spectral resolution between the optical bench temperatures of 276 and 299 K is up to 25 %. Therefore, the in-orbit optical bench temperature of the EMI can be set up in accordance with the FWHM of the ILS results of the thermal vacuum test.
2.3 Spectral calibration in the solar calibration mode
The spectral calibration in the EOM has been introduced previously. The calibration in the SCM shows that the same results are obtained compared with the EOM. We also obtain the solar spectrum from both modes on the ground. An optical fiber and a small telescope are used to introduce direct sunlight to the Earth and solar ports. The solar spectrum at the CFOV of the EMI (except UV1 because the wavelength range in this channel is not visible on the ground) is illustrated in Fig. 7.
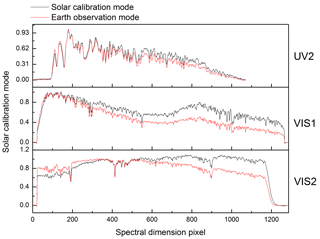
Figure 7Solar spectrum obtained by the EMI on the ground. The aluminum diffuser is used to observe the solar spectrum in the SCM (Fig. 1).
In Fig. 7, the pixel corresponds to the same wavelength in the two modes. The difference between the spectral shapes is due to the aluminum diffuser's spectral characteristics, such as hemispheric reflectance and bidirectional reflectance distribution function (Nicodemus et al., 1977; Voss et al., 2000; Jin and Levine, 2009). In addition, the spectral features of the aluminum diffuser are introduced to the solar spectrum. The irradiance calibration of the sun through a space-borne diffuser is discussed subsequently.
Radiometric calibration is performed in the EOM and SCM on the ground. Several operating parameters, such as three integration times (i.e., 0.5, 1, and 2 s) and 64 gain steps (i.e., 0–63 with an interval of 1), are designed for the EMI to fulfill the requirements of an in-orbit observation. The radiometric calibration is performed at different integration times, and the relationship between gain steps and gain values is measured.
3.1 Radiometric calibration system
Integrating sphere and diffuser plate radiometric calibration systems are used for the EMI. The integrating sphere system with a tungsten halogen lamp is for the radiometric calibration of the UV2, VIS1, and VIS2 channels. Furthermore, the diffuser plate with a 1000 W xenon lamp (Newport Xenon-6269) is for the UV1 channel (240–315 nm), which produces a sufficient UV output. The radiance of the radiometric calibration system is monitored by a spectral radiometer, that is, Ocean Optics MAYP11868 (200–650 nm) for the diffuser plate system and USB2000 (200–800 nm) for the integrating sphere system. The EMI must rotate to complete the radiometric calibration because illuminating the entire 114∘ instantaneously by the calibration system is infeasible.
The accuracy of the radiance directly determines the EMI radiometric calibration results. Therefore, the spectral radiometers must also be calibrated. Thus, an NIST-calibrated deuterium lamp (Newport) and a 1000 W FEL quartz tungsten halogen lamp (OSRAM) are selected to calibrate MAYP11868 and USB2000, separately. The lamps illuminate a stand diffuser plate, which converts the lamp irradiance to radiance to calibrate the spectral radiometer, during calibration. The calibrated accuracy of the spectral radiometer is determined by three factors as follows: (1) accuracy of the lamp irradiance standard, (2) accuracy of converting irradiance to radiance, and (3) response accuracy of the spectral radiometer. These factors are discussed in detail below.
The accuracy of the lamp irradiance is traced to the NIST: the deuterium lamp irradiance at 50 cm is 3.16 % in 210–350 nm, and the FEL quartz tungsten halogen lamp irradiances at 50 cm are 3.00 %–2.40 % in 250–400 nm and 2.40 %–1.60 % in 400–800 nm.
The method for converting irradiance to radiance is expressed as
where Lrad is the radiance that is converted from the lamp irradiance Elamp-irrad at llamp-plate, which is 50 cm for the spectral radiometer calibration, that is, l50 cm=50 cm; and the stand diffuser plate BRDFstd−plate is close to , with the accuracy of 1.25 %. The distance between the stand diffuser plate and the lamp is 500±1 mm.
An optical fiber and a small telescope are used by the spectral radiometer to observe the stand diffuser plate at an angle of 40∘. A total of 100 measurements were obtained by the spectral radiometer. The accuracy of MAYP11868 response is less than 0.80 %. The accuracy of USB2000 response is less than 0.50 %. In practice, the radiance monitored by the spectral radiometer is usually different from the radiance of the diffuser plate. Therefore, the spectral radiometer needs to work in the linear response region. Five different radiance levels are observed by the spectral radiometer to determine the accuracy of the response linearity. The accuracy of MAYP11868 response linearity is less than 1.20 %, and the accuracy of USB2000 response linearity is less than 1.10 %.
For the diffuser plate radiometric calibration system, 1000W xenon lamp illuminates the same stand diffuser plate discussed above to produce a near-uniform surface light source, which is also produced at the integrating sphere opening by introducing the halogen tungsten lamp light to the sphere through a round pipe. The two radiometric calibration systems have their own highly stabilized power supply. The radiometric accuracy of the calibration system is shown in Table 7.
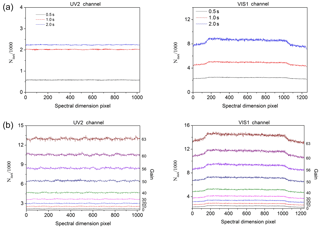
Figure 8(a) Dark signal for different integration time. (b) Dark signal under different gain steps. The gain steps are set to 0, 10, 20, 30, 40, 50, 56, 60, and 63. The pixels in the readout register cannot be used to accomplish the binning due to the full well limitation. In this case, the pixel binning is accomplished in the Field Programming Gate Array. Fast readout frequency is needed for the process. The fast readout frequency leads to signal distortion. Therefore, the difference between the measurements with 0.5 and 1.0 s integration times is not half of the difference between the measurements with 1.0 and 2.0 s integration times. Based on the signal distortion, we have obtained absolute radiance calibration key data at different integration time on the ground. The calibration key data are used for the L1b data processor.
3.2 Radiance calibration
The data Nsignal collected by EMI including dark signal Ndark and light signal Nlight is given by the following:
where , the integration time Ttime can be set to 0.5, 1, and 2 s, the gain steps Ggain can be set from 0 to 63 with the interval of 1.
To obtain an approximate dark correction and to widely remove the dark-current-induced spectral structures, the mean dark spectra is subtracted (Bohn and Lohse, 2017). The dark and light signals are discussed separately below.
3.2.1 Dark signal
The e2v-CCD4720 and e2v-CCD5530 are adopted for the UV and VIS channel separately. As the weak UV band of the atmospheric light, the two UV channel CCDs are cooled to −20 ∘C to reduce the dark signal. The CCDs for the visible channels do not have independent temperature control, but they work in a constant temperature environment. The temperature is similar to that in the spectrometer, which has temperature control. An investigation done after launch shows that the temperature stability is better than 0.1K over one orbit. This temperature variation over the orbit leads to a very small change of the background signal.
Dark signal is obtained when no photons enter the instrument to add the bias value (electronic offset) Nbias and the dark-current Ncurrent multiplied by the integration time tinte.
The read-out register within the CCD has an excess of 16 blank pixels, which can be used to measure the electronic offset on the ground. The measurements show that the offset is not constant but drifts with time (about 0.5 % min−1). Therefore, the electronic offset is obtained per measurement frame in-orbit, and the electronic offset correction is implemented in the L1b data processor. The dark-current signal is a thermally induced dark-current that increases with temperature and integration time (Jakel and Wendisch, 2007). Therefore, a dark signal measurement should be conducted frequently to update the dark data. The dark signal under different integration times is shown in Fig. 8 with UV2 and VIS1 channels as examples.
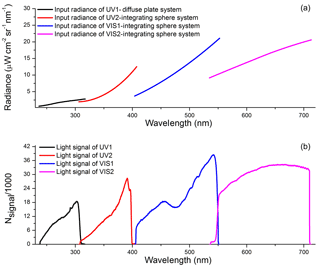
Figure 9Panel (a) presents one radiance level of the diffuser plate and integrating sphere system. Panel (b) presents the EMI response to the radiance at integration times 2 s (UV1), 1 s ( UV2, VIS1, VIS2), and at gain step 0. The dark signal is subtracted from the response.
In Fig. 8, the small spectral structure in dark signal is caused by dark noise, which could influence the measured data, especially under weak-light conditions. The dark noise can be obtained by deriving standard deviations of repeated dark measurements and can be reduced by averaging the repeated dark. The dark spectra are recorded for each orbit when EMI is in orbit, and then, the dark spectra under the same working conditions are averaged to correct the observation spectra.
3.2.2 Light signal
The radiometric calibration systems can provide different output-radiance levels. For the UV1 channel, the EMI instrument views the standard diffuser plate at an angle of 45.0∘ and at a distance of 50.0 cm. The approximately 13∘ viewing angle of EMI can be illuminated once. Thus, the instrument has to be rotated in nine steps to complete the entire 114∘. For the UV2, VIS1, and VIS2 channels, EMI views the integrating sphere opening at a distance of 40.0 cm, and approximately 11∘ can be illuminated once. A total of 11 steps are required to complete the radiance calibration.
The dark signal is firstly deducted from the radiance calibration data. One radiance level of the radiance calibration systems and the corresponding response of the EMI instrument are shown in Fig. 9.
Figure 9 illustrates an overlap band at each end of the channels, which is due to the optical features of the color separation filters. In addition, the response in the wavelength range 460–480 nm of VIS1 channel lowered, because a filter of this range is placed in front of Slit 11 to ensure that the detectors are unsaturated in the case of clouds.
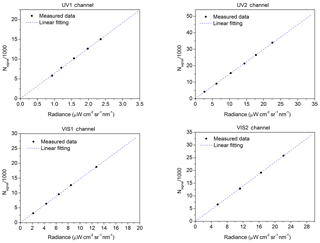
Figure 10Linear response of the EMI, the signal is corrected by the dark signal. A non-linear response region exists under very low light signal (equal to the dark signal) condition and high light signal (saturation light signal) condition. The integration time, CCD readout, and gain steps are set up to ensure that the EMI works in the linear response region.
The base of the linear response of the EMI, the radiance calibration model is as follows:
where Lradiance is the radiance at the EMI entrance pupil and α is the radiance response coefficient.
The theoretical relation between gain steps fgain and gain value fmagn is determined using the following equation:
The light signal under different gain steps is exhibited in Fig. 11, which uses the UV2 and VIS1 channels as examples.
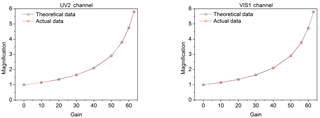
Figure 11Relation between gain steps and gain value are presented. The relative deviation between theoretical and actual data is less than 1.0 %. In application, the gain value can be obtained from the theoretical relation.
The overall accuracy of the radiance calibration is mainly determined by the accuracy of the radiance calibration system, by the response non-linearity, and by the accuracy of response of the EMI. The accuracy of the diffuser plate system and integrating system is shown in the Table 7. The response non-linearity can be calculated by the data in Fig. 8, and the results are as follows: 1.13 % (UV1), 1.04 % (UV2), 1.07 % (VIS1), and 1.00 % (VIS2). The response accuracy is obtained by 1000 repeated spectra of the EMI, and the results are 1.21 % (UV1), 1.26 % (UV2), 1.12 % (VIS1), and 1.14 % (VIS2). The accuracy of the conversion of different gain steps should be considered in the case of the light signal corrected by the gain value. The final accuracy of the radiance calibration is summarized in Table 8.
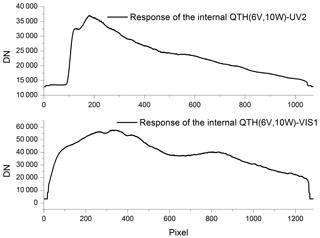
The pre-flight, radiometric calibration of EMI was not conducted under flight-like vacuum and possibly under thermal conditions due to the limitation of the calibration facility. The EMI on-ground response to the quartz tungsten halogen WLS (6 V, 10 W) is displayed in Fig. 12, which uses UV2 and VIS1 as examples.
The EMI in-orbit response to the quartz tungsten halogen will be obtained after the launch. The change between the on-ground and in-orbit responses is used to correct the preflight radiometric calibration, which in turn is used to accomplish the in-flight absolute radiometric calibration of the flight data.
3.3 Irradiance calibration
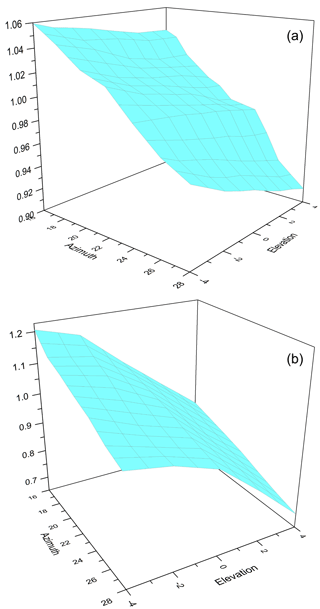
The solar irradiance is calibrated mostly through the onboard diffusers (Noel et al., 2006; Xiong et al., 2009). The irradiance calibration depends on the incident angles on the onboard diffusers of the EMI. The azimuth angle varies slowly throughout the year from about 16 to 28∘ around the nominal value of 22∘. The elevation angle varies from +4 to −4∘ around the nominal value of 11∘. The elevation angle change originates from the satellite orbital movement. Approximately 75 images are obtained during a solar observation sequence of 150 s, and each individual image must be corrected for radiometric goniometry.
where DN is the image at the nominal azimuth angle α0 and elevation angle β0, which is corrected from the DNα,β with the goniometry correction factor fα,β. The corrected images are averaged to improve the SNR. The irradiance calibration model of the EMI is as follows:
where n=75, is the irradiance response coefficient. The goniometry correction factor and irradiance response coefficient of the EMI are calibrated on the ground. A light source has a beam divergence comparable to that of the sun. This light source is rotated to cover the azimuth and elevation angle ranges. The goniometry correction factors are shown in Fig. 13, which are by definition 1.00 for the nominal azimuth and elevation angles.
The NIST-calibrated 1000W FEL quartz tungsten halogen lamp is used for the absolute irradiance calibration at the nominal azimuth and elevation angles. The irradiance response coefficient is obtained for the irradiance calibration model of the EMI.
Aluminum diffusers adopted by the SCIAMACHY project introduce spectral structures in the sun reference spectrum (Sioris et al., 2004). These structures are comparable to trace gas absorption features. They may interfere with DOAS-based retrieval of trace gases, thereby affecting the accuracy of the retrieved column densities (Richter and Wagner, 2001; Richter and Wittrock, 2002; Courreges-Lacoste et al., 2004). As the QVD introduces considerably less structure than the aluminum diffuser, the EMI used it to provide the solar reference spectrum once per day. The aluminum diffuser is mainly used for radiometric calibration purpose, which is performed once a month.
The EMI works in low Earth orbit (LEO) at an orbit altitude of 708 km. The critical space environment will affect the performance of materials and components in LEO (Pellicori et al., 2014), such as atomic oxygen (AO) (Banks et al., 2008), solar UV, and the energetic protons trapped in the inner Van Allen belt. Space radiation exposure effects on onboard diffusers have been tested and discussed in a previous study (Zhao et al., 2015).
The EMI is needed to meet the SNR requirements for dark scenes, especially in the UV bands (de Vries et al., 2009), to ensure the accuracy of retrieved results. An SNR model is introduced, and it is in good agreement with the experimental result. The EMI in-orbit SNR is estimated by using the SNR model and MODTRAN (Berk et al., 1989). The SNR estimation for advanced hyperspectral space instruments have been discussed elsewhere (Eckardt et al., 2005; Lang et al., 2013).
The electrons generated by a signal pixel can be calculated by the following equation:
where D∕f is the relative aperture of optics, h is the Plank constant, c is the light speed,τ(λ) is the transmission of optics, L(λ) is the sensor input radiance in µW cm−2 sr−1 nm−1, Δλ is the spectral bandwidth of a single spectral line, Ad is the pixel area, tint is the integration time, and η(λ) is the quantum efficiency of CCD.
The main part of the total noise is the shot or photon noise generated by the incident radiation. The shot or photon noise can be described by the Poisson distribution, and can be calculated as follows:
The other noises include a dark noise δdark and a readout noise of the CCD δread. Generally, the SNR can be calculated using the following equation:
The SNR can be improved by pixel binning,
where M is the binning factor (Table 1).
The output digital number of a signal pixel is obtained by the conversion factor f of the CCD:
For the SNR model of the EMI, it is impossible to measure the signal and noise separately. One way to do this in practice is to adopt the mean value of the repeat DNs as the signal and to adopt the standard deviation of the repeat DNs as the noise. In this case, N repeated measured spectra of EMI are recorded by observing the uniform-stable light source of the calibration system. The measured SNR is calculated by the following equation:
The offset is deducted from the DNs. Figure 14 shows the simulation and measured SNR results of VIS1 at the input sensor radiance.
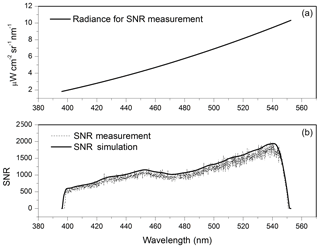
Figure 14Panel (a) presents the radiance of the integrating sphere system for SNR measurement of VIS1 in the laboratory. Panel (b) presents the results of measured SNR (solid line) and simulation result (dotted line) for the radiance of panel (a) with an integration time of 2 s and a binning factor of 4. The measured SNR in the wavelength range 460–500 nm lowers because a filter of this range is placed in front of the slit 11 to make sure that the detectors are not saturated in the case of clouds. There is an overlap band at the end of the channel, which is due to the optical features of the color separation filter. In addition, there are 24 dark pixels at the end of the channel when the measured SNR is approximately zero.
For the measured SNR, 100 repeated measured spectra of EMI are recorded by observing the integrating sphere system with an integration time of 2 s. For the simulation SNR, the F-number of EMI optics F#=3.2, the spectral width of VIS1 Δλ=0.12 nm, the area of a single pixel (µm2), the integration time tint=2 s, and the binning factor M=4. Figure 14 demonstrates that the measured SNR is lower than the simulation SNR. However, SNR is a good choice for estimating the EMI in-orbit SNR using the SNR model.
The simulation of the EMI in-orbit SNR in the UV2, VIS1, and VIS2 channels are displayed in Fig. 15. The in-orbit SNR of this channel is not estimated as the solar light in the band of channel UV1 (240–310 nm) is absorbed by the atmosphere.
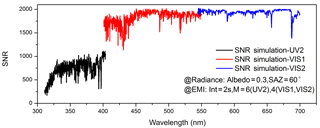
Figure 15Simulation EMI in-orbit SNR of UV2, VIS1, and VIS2. The input radiance for the SNR model is obtained by MODTRAN with an albedo of 0.3 and with the sun zenith at 60∘. The EMI simulation SNR has an integration time of 2 s; it has binning factors of 6 for UV 2 channels and 4 for VIS channels. The spectral bandwidth of a pixel was 0.09 nm for UV2, 0.12 nm for VIS1, and 0.13 nm for VIS2.
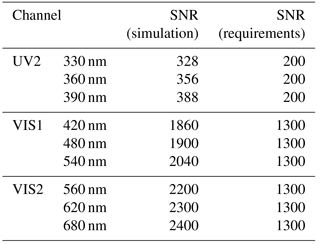
The EMI in-orbit simulation SNRsimulationis obtained by the radiance Rsimulation at an albedo of 0.3 and solar zenith of 60∘. The in-orbit simulation SNR at the radiance of 1.27/10.89 µW cm−2 sr−1 nm−1 can be achieved by the following equation:
where R is 1.27 for UV channels and 10.89 µW cm−2 sr−1 nm−1 for VIS channels.
For the in-orbit simulation SNR at the radiance of 1.27/10.89 µW cm−2 sr−1 nm−1, the results are presented in Table 9.
The spectral and radiometric response performance of the EMI is obtained by preflight calibration. The on-ground calibration results are shown as follows.
Spectral calibration results –
UV1: 236.44–317.28 nm with the spectral resolution ≤0.45 nm;
UV2: 306.08–407.12 nm with the spectral resolution ≤0.49 nm;
VIS1: 395.50–552.63 nm with the spectral resolution ≤0.48 nm;
VIS2: 534.63–712.90 nm with the spectral resolution ≤0.49 nm;
The final accuracy of the wavelength calibration is < 0.05 nm.
Radiometric calibration results –
UV1: 4.64 %, UV2: 4.63 %, VIS1: 4.43 %, VIS2: 4.42 %.
The on-ground calibration results meet the performance requirements of the EMI.
Simultaneously, the obtained calibration key data are used for the L1b processor. The EMI in-orbit performance after the launch may change given the vibration of the launching and changes in the environmental conditions. Therefore, the EMI in-orbit calibration is performed to verify preflight calibration and ensure calibration accuracy. For the EMI, the in-orbit wavelength calibration is performed by using the Fraunhofer lines in the solar and Earth spectra. The in-orbit radiometric calibration is performed by observing the sun through the onboard diffusers. During the EMI flight, the LEO space environment factors including AO, solar UV, and energetic protons will affect the EMI response performance. Aluminum diffuser and quartz tungsten halogen WLS are used to monitor the degradation of the EMI.
Data used in this paper can be provided upon request by email to Min Jie Zhao (mjzhao@aiofm.ac.cn).
WQL and FQS led this work. MJZ completed experiments and data analysis. HJZ and YJ helped to designed the spectral calibration. SMW helped to conduct the radiometric calibration. MJZ wrote the paper, with input from all co-authors.
The authors declare that they have no conflict of interest.
This research was supported by the National Natural Science Foundation of
China (grant no. 41705016).
Edited by: Hendrik Fuchs
Reviewed by: two anonymous referees
Albinana, A. P. and Munro R.: The calibration of GOME-2 data, Infrared Spaceborne Remote Sensing X, Proc. SPIE, 4818, 185–192, 2002.
Banks, B. A., Groh, K. K., Miller, S. K., and Watters, D. L.: Lessons Learned From Atomic Oxygen Interaction With Spacecraft Materials in Low Earth Orbit, ASA/TM-2008-215264, 2008.
Barry, P. S., Shepanski, J., and Segal, C.: Hyperion On-Orbit Validation of Spectral Calibration using Atmospheric Lines and an On-board System, Proc. SPIE, 4480, 231–235, 2002.
Berk, A., Bernstein, L. S., and Robertson, D. C.: MODTRAN: A Moderate Resolution Model for LOWTRAN7, Rpt. No. GL-TR-89-0122, Air Force Geophys. Lab., Bedford, MA 01731, 1–38, 1989.
Bohn, B. and Lohse, I.: Calibration and evaluation of CCD spectroradiometers for ground-based and airborne measurements of spectral actinic flux densities, Atmos. Meas. Tech., 10, 3151–3174, https://doi.org/10.5194/amt-10-3151-2017, 2017.
Bovensmann, H., Burrows, J. P., Buchwitz, M., Frerick, J., Noël, S., and Rozanov, V. V.: Sciamachy: Mission Objectives and Measurement Modes, J. Atmos. Sci., 56, 127-150, 1999.
Burrows, J. P., Weber, M., Buchwitz, M., Rozanov, V., Ladstätter-Weißenmayer, A., Richter, A., Debeek, R., Hoogen, R., Bramstedt, K., Eichmann, K. U., and Eisinger, M.: The Global Ozone Monitoring Experiment(GOME): Mission Concept and First Scientific Results, J. Atmos. Sci., 56, 151–175, 1999.
Courrèges-Lacoste, G. B., Brug, H. V., Schaarsberg, J. G., Snijders, B., Sprik, R., Vink, R., and Winter, D. D.: Spectral Features on reference diffusers: measurements and analysis, SPIE, 5234, 304–313, 2004.
de Vries, J., Voors, R., Dirksen, R., and Dobber, M.: In-orbit Performance of the Ozone Monitoring Instrument, Sensors, Systems, and Next-Generation Satellites IX, Proc. SPIE, 5978, 59780T-1–59780T-12, 2005.
de Vries, J., Voors, R., Mika, A., Otter, G., Valk, N. V. D., Aben, Il., Hoogeveen, R., Gloudemans, A., Doober, M., Veefkind, P., and Levelt, P.: TROPOMI, the solar backscatter satellite instrument for air quality and climate, heads towards detailed design, SPIE, 7474, 747409-1–747409-9, 2009.
Dirksen, R., Dobber, M., Levelt, P., Oord, G. V. D., Jaross, G., Kowalewski, M., Mount, G. H., Heath, D., Hilsenrath, E., and Vries, J. D.: The on-ground calibration of the Ozone Monitoring Instrument from a scientific point of view, SPIE, 5234, 400–410, 2004.
Dobber, M., Dirksen, R., Levelt, P., Oord, G. B. D., and Kleipool, Q.: EOS-Aura Ozone Monitoring Instrument in-flight performance and calibration, SPIE, 6296, 62960R-1–62960R-12, 2006.
Eckardt, A., Hofer, S., Neumann, C., and Skrbek W.: SNR estimation for advanced hyperspectral space instrument, Infrared Spaceborne Remote Sensing, Proc. SPIE, 5883, 588303-1–588303-7, 2005.
Guanter, L., Rudolf, and Moreno, J.: Spectral calibration of hyperspectral imagery using atmospheric absorption features, Appl. Opt., 5, 2360–2370, 2006.
Jakel, E. and Wendisch, M.: A CCD spectroradiometer for ultraviolet actinic radiation measurements, J. Atmos. Ocean. Tech., 24, 449–462, 2007.
Jin, X. M. and Levine, R. Y.: Bidirectional reflectance distribution function effects in ladar-based reflection tomography, Appl. Opt., 48, 4191–4200, 2009.
Kleipool, Q., Ludewig, A., Babic, L., Bartstra, R., Braak, R., Dierssen, W., Dewitte, P.-J., Kenter, P., Landzaat, R., Leloux, J., Loots, E., Meijering, P., van der Plas, E., Rozemeijer, N., Schepers, D., Schiavini, D., Smeets, J., Vacanti, G., Vonk, F., and Veefkind, P.: Pre-launch calibration results of the TROPOMI payload on-board the Sentinel 5 Precursor satellite, Atmos. Meas. Tech. Discuss., https://doi.org/10.5194/amt-2018-25, in review, 2018.
Lang J. W., Wang Y. M., and Wang J. Y.: A new SNR Model for Space-borne Hyperspectral Imagers Including Atmospheric Scattering Influence, International Symposium on Photoelectronic Detection and Imaging 2013: Imaging Spectrometer Technologies and Applications, Proc. SPIE, 8910, 89101I-1–89101I-10, 2013.
Levelt, P. F., Oord, G. H. J., Dobber, M. R., Mälkki, A., Visser, H., Vries, J. D., Stammes, P., Lundell, J. O. V., and Sarri, H.: The Ozone Monitoring Instrument, IEEE T. Geosci. Remote, 44, 1093–1101, 2006.
Munro, R., Lang, R., Klaes, D., Poli, G., Retscher, C., Lindstrot, R., Huckle, R., Lacan, A., Grzegorski, M., Holdak, A., Kokhanovsky, A., Livschitz, J., and Eisinger, M.: The GOME-2 instrument on the Metop series of satellites: instrument design, calibration, and level 1 data processing – an overview, Atmos. Meas. Tech., 9, 1279–1301, https://doi.org/10.5194/amt-9-1279-2016, 2016.
Neville, R. A., Sun, L., and Staenz, K.: Detection of spectral line curvature in imaging spectrometer data, SPIE, 5093, 144–154, 2003.
Nicodemus, F. E., Richmond, J.C., Hsia, J. J., Ginsberg, I. W., and Limperis T.: Geometric Consideration and Nomenclature for Reflectance, National Bureau of Standards, NBS monograph 160 Oct, 1977.
Noël, S., Kokhanovsky, A.A., Jourdan, O., Gerilowski, K., Pfeilsticker, K., Weber, M., Bovensmann, H., and Burrows, J. P.: Sciamachy reflectance and solar irradiance validation, Proceedings of the Third Workshop on the Atmospheric Chemistry Validation of Envisat, 2006.
Ording, B., Ludewig, A., Hoogeveen, R., Bloemendal, D. T., Dingjan, J., Voors, R., and Vries, J. D.: Results of the tropomi calibration campaign, International Conference on Space Optics-ICSO 2016, Proc SPIE, 10562, 105623B-1–105623B-9, 2016.
Pellicori, S. F., Martinez, C. L., Hausgen, P., and Wilt, D.: Development and testing of coatings for orbital space radiation environments, Appl. Opt., 53, A339–A350, 2014.
Richter, A. and Wagner T.: Diffuser plate spectral structures and their influence on GOME slant columns, Technical note, January, available at: http://101.96.10.63/www.iup.uni-bremen.de/gome/data/diffuser_gome.pdf (last access: 25 September 2018), 2001.
Richter, A. and Wittrock F.: Gome measurements of stratospheric and tropospheric BrO, Adv. Space Res., 29, 1667–1672, 2002.
Sioris, C. E., Kurosu, T. P., Martin, R. V., and Chance, K.: Stratospheric and tropospheric NO2 observed by SCIAMACHY: first results, Adv. Space Res., 34, 780–785, 2004.
Voors, R., Vries, J. D., Bhatti, I. S., and Lobb, D.: TROPOMI, the Sentinel 5 precursor instrument for air quality and climate observations: status of the current design, International Conference on Space Optics-ICSO, 2012.
Voss, K. J., Chapin, A., Monti, M., and Zhang, H.: Instrument to measure the bidirectional reflectance distribution function of surface, Appl. Opt., 39, 6197–6206, 2000.
Xiong, X. X., Sun, J. Q., Xie, X. B., Barnes, W. L., and Salomonson, V. V.: On-orbit Calibration and Performance of Aqua MODIS Reflective Solar Bands, IEEE T. Geosci. Remote, 48, 535–546, 2009.
Zhao, M. J, Si, F. Q., Liu, C., Lu, Y. H., Wang,Y., Wang, S. M., Zeng,Y., Jiang, Y., Zhou, H. J., and Liu W. Q.: The effect of AO/UV/RD exposure on space-borne diffusers: A comparative experiment, Appl. Opt., 54, 9157–9166, 2015.


