the Creative Commons Attribution 4.0 License.
the Creative Commons Attribution 4.0 License.
The Mainz profile algorithm (MAPA)
Steffen Dörner
Sebastian Donner
Julia Remmers
Yang Wang
Thomas Wagner
The Mainz profile algorithm (MAPA) derives vertical profiles of aerosol extinction and trace gas concentrations from MAX-DOAS measurements of slant column densities under multiple elevation angles. This paper presents (a) a detailed description of the MAPA (v0.98), (b) results for the CINDI-2 campaign, and (c) sensitivity studies on the impact of a priori assumptions such as flag thresholds.
Like previous profile retrieval schemes developed at MPIC, MAPA is based on a profile parameterization combining box profiles, which also might be lifted, and exponential profiles. But in contrast to previous inversion schemes based on least-square fits, MAPA follows a Monte Carlo approach for deriving those profile parameters yielding best match to the MAX-DOAS observations. This is much faster and directly provides physically meaningful distributions of profile parameters. In addition, MAPA includes an elaborated flagging scheme for the identification of questionable or dubious results.
The AODs derived with MAPA for the CINDI-2 campaign show good agreement with AERONET if a scaling factor of 0.8 is applied for O4, and the respective NO2 and HCHO surface mixing ratios match those derived from coincident long-path DOAS measurements. MAPA results are robust with respect to modifications of the a priori MAPA settings within plausible limits.
- Article
(2628 KB) - Full-text XML
- BibTeX
- EndNote
Multi-axis differential optical absorption spectroscopy (MAX-DOAS), i.e., spectral measurements of scattered sunlight under different viewing elevation angles, has become a useful tool for the determination of vertical profiles of aerosols and various trace gases within the lower troposphere (e.g., Hönninger and Platt, 2002; Hönninger et al., 2004; Wagner et al., 2004; Wittrock et al., 2004; Frieß et al., 2006; Clémer et al., 2010), which is key for the validation of trace gas columns derived from satellite measurements.
MAX-DOAS is based on the elevation angle dependency of spectral absorption, i.e., the differential slant column density (dSCD) determined by DOAS (Platt and Stutz, 2008). The profile retrieval is performed in two steps: first, aerosol extinction profiles are derived based on dSCDs of the oxygen dimer O4. In a second step, the concentration profiles of various trace gases detectable in the UV–vis range (such as nitrogen dioxide, NO2, and formaldehyde, HCHO) can be determined.
For given aerosol and trace gas profiles, dSCDs of O4 and atmospheric trace gases can be modeled by radiative transfer models (RTMs) for a sequence of elevation angles. The “profile inversion” consists of inverting this forward model, i.e., finding the extinction and concentration profile where forward modeled and measured dSCD elevation sequences agree.
Profile inversion can be carried out based on a regularized matrix inversion method denoted as optimal estimation (Rodgers, 2000). It provides an elaborated mathematical framework yielding the best extinction and concentration profile estimate and the corresponding averaging kernels for a given measurement and a priori error (e.g., Frieß et al., 2006; Clémer et al., 2010). However, results depend on the a priori settings, in particular the a priori profile and its uncertainty, which are generally not known.
An alternative approach involves parameterized profiles (Irie et al., 2008; Li et al., 2010; Wagner et al., 2011; Vlemmix et al., 2011, 2015). The basic idea is to represent vertical profiles with a few parameters, typically representing total column, height, and shape. The profile inversion then corresponds to finding the best matching parameters. Due to the limited number of parameters, a regularization as used in optimal estimation is not required, and the method makes no a priori assumptions on the actual profile (except that its shape can be represented by the chosen parameterization).
So far, parameter-based inversion has used nonlinear least-squares algorithms like the Levenberg–Marquardt algorithm (LMA). This is an established method. However, it has some drawbacks: first, the LMA is based on local linearization, while the forward model is typically highly nonlinear in the parameters. As a consequence, the confidence intervals (CIs) resulting from the LMA are symmetric by definition and often result in unphysical values of the fitted parameter ± CI, like a negative layer height. Second, the profile parameters are often strongly correlated, i.e., different parameter combinations can result in similar profile shapes. This implies the existence of local minima in the minimization task, making the LMA challenging and slowing down the inversion.
Here we present an alternative parameter-based inversion method using a Monte Carlo (MC) approach: the (finite) space of parameter combinations is covered by random numbers, and those best matching the measurement are kept. This approach directly yields distributions rather than single estimates for each parameter, thereby accounting for the correlation of parameters. In addition, the distributions do not contain unphysical parameters (as occur for the LMA best estimates ± CI).
The MC approach used in MAPA v0.98 is much faster than the previous LMA implementation. In addition, the information on a distribution of the best matching parameters allows for a straightforward determination of the vertical concentration profiles and their uncertainties. The algorithm can also be easily adopted to additional or different profile parameterizations.
MAPA is included as representative of parameter-based algorithms in the processing chain of Fiducial Reference Measurements for Ground-Based DOAS Air-Quality Observations (FRM4DOAS), a 2-year ESA project which started in July 2016 (http://frm4doas.aeronomie.be/, last access: 18 February 2019).
In this paper, the MAPA v0.98 is described in Sect. 2. Exemplary results for the CINDI-2 campaign are shown in Sect. 3. The dependency of MAPA results on a priori settings as well as clouds is investigated in Sect. 4. The limitations of profile inversions from MAX-DOAS measurements in general and MAPA in particular are discussed in Sect. 5, followed by conclusions.
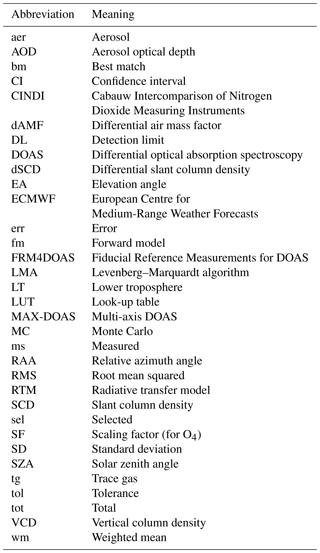
Appendix A lists the abbreviations used within this study (Table A1) and the mathematical symbols used for variables and parameters (Table A2).
In this section, we describe the MAPA profile inversion algorithm. First, the similarities and differences to existing parameter-based inversion schemes are outlined in Sect. 2.1. The measurement principle is shortly described in Sect. 2.2. In Sect. 2.3, the required input to the MAPA is specified. Section 2.4 describes the profile parameterization. In Sect. 2.5, the forward model, linking profile parameters to elevation sequences of dSCDs, is provided. The profile inversion algorithm is described in Sect. 2.6. Section 2.7 deals with the O4 scaling factor (SF). Finally, the flagging procedure, in order to identify questionable results and outliers, is explained in Sect. 2.8.
2.1 Heritage and advancements
MAPA is founded on the parameterized profile inversion approach described in Li et al. (2010) or Wagner et al. (2011). It uses profile parameter definitions similar to those of Wagner et al. (2011) and forward models linking those parameters to dSCD sequences.
The main advancements of MAPA compared to Wagner et al. (2011) are that
-
MAPA is completely rewritten from scratch in Python.
-
all settings are easily adjustable by separate configuration files.
-
MAPA provides the option of a variable scaling factor for O4 (see Sect. 2.7).
-
MAPA uses a Monte Carlo approach for the profile inversion (see Sect. 2.6.2), while Wagner et al. (2011) used the LMA. The MC approach is faster and provides physically meaningful uncertainty information.
-
MAPA provides an elaborated flagging scheme for the identification of questionable results (Sect. 2.8).
In the sections below we provide a full description of the MAPA profile inversion algorithm, also including parts which have been described before (like the profile parameterization) for sake of clarity and completeness.
2.2 MAX-DOAS
With DOAS, the slant column density (SCD), i.e., the integrated column along the effective light path, can be determined from spectral measurements of scattered sunlight for molecules with absorption structures in the UV–vis spectral range (Platt and Stutz, 2008). The SCD can be converted into a vertical column density (VCD), i.e., vertically integrated column, by division with the so-called air mass factor.
MAX-DOAS measurements are performed from ground-based spectrometers with different elevation angles (EAs) α, including zenith sky measurements, in order to derive profile information from the EA dependency of slant column densities.
By using the zenith measurements before and/or after a sequence of different EAs as reference spectrum within the DOAS analysis, the so-called dSCD S, representing the SCD excess compared to zenith viewing geometry, is derived. Analogously, the differential air mass factor (dAMF) A relates the dSCD S to the VCD V:
Note that the DOAS spectral analysis is not part of MAPA but has to be carried out beforehand.
2.3 Input
Here we list the basic quantities needed as input for MAPA. A detailed description of the MAPA input file format is provided at ftp://ftp.mpic.de/MAPA/.
2.3.1 Viewing and solar angles
The geometry has to be specified in the MAPA input data, defined by the EA α, the solar zenith angle (SZA) ϑ, and the relative azimuth angle (RAA) φ between viewing direction and direction of the sun. Absolute (solar and viewing) azimuth angles are not needed.
2.3.2 Elevation sequence
A sequence of i=1…M EAs with corresponding dSCDs Si=S(αi) is required for one profile to be retrieved. Below, a dSCD sequence is noted as vector S, where the ith component corresponds to αi. Note that the dependency on α is implicit in all vectors below and not written explicitly any more.
In addition, the corresponding sequence of the DOAS fit error Serr is required. We define the typical dSCD error Serr as the sequence median DOAS fit errors.
As aerosol profiles have to be retrieved first as a prerequisite for trace gas inversions, each MAPA input file must contain at least one dataset of O4 dSCDs. In addition, trace gas dSCD sequences can be included as needed.
2.3.3 O4 VCD
For the MAPA aerosol retrieval, an a priori O4 VCD is required for each sequence in order to relate the measured O4 dSCDs to O4 dAMFs (see Eq. 1 and Sect. 2.5). can be provided explicitly in the input data. If missing, it is calculated from temperature and pressure profiles. If full profile measurements are provided in the input, they are used. If only ground measurements at the station are available, they are used to construct extrapolated profiles based on a constant lapse rate of up to 12 km and a constant temperature above (see Wagner et al., 2018, Sect. 4.1.1, for details). If no temperature and pressure information is provided in the MAPA input, ERA-Interim data (Dee et al., 2011) from the European Centre for Medium-Range Weather Forecasts (ECMWF) is used for the calculation of .
2.4 Profile parameterization
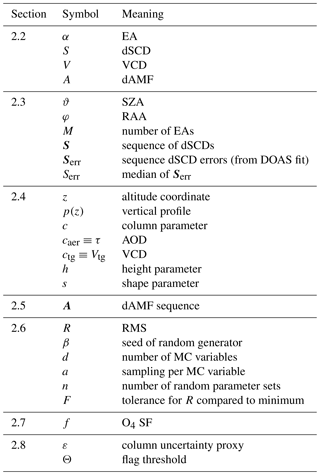
Within MAPA, vertical profiles p(z) of aerosol extinction and trace gas concentration are parameterized by three parameters, similar to Wagner et al. (2011):
-
the integrated column c (i.e., AOD for aerosols, VCD for trace gases),
-
the layer height h, and
-
the shape parameter .
A shape parameter of s=1 represents a simple box profile:
For a shape parameter of , the fraction s of the total column c is placed within a box. The remaining fraction (1−s) exponentially declines with altitude:
A shape parameter of represents an elevated layer from h1 to h of thickness h2:
with
Equations (3) and (4) converge to a box profile for s→1; thus Eqs. (2) to (4) describe a set of parameterized profiles which are continuous in s. Figure 1 exemplarily displays extinction profiles for c=1 and different heights h and shape parameters s.
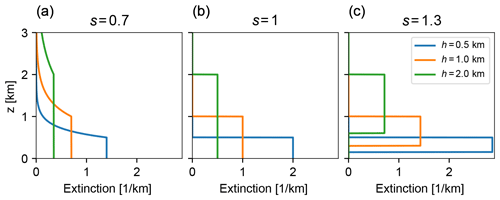
Figure 1Illustration of the profile parameterization. Aerosol extinction profiles are shown for , different heights h (color coded), and shape parameters s=0.7 (a), 1.0 (b), and 1.3 (c).
Alternative parameterizations (like a linear increase from the ground to h (compare Wagner et al., 2011) or even completely different profile shapes) might be used instead or in addition in future MAPA versions. This would require the calculation of corresponding look-up tables (LUTs) for dAMFs (see below).
2.5 Forward model
In this section the forward model (fm) is specified, which connects the profile parameters c, h, and s, with dSCDs for the given solar and viewing geometry.
Essentially, the forward model is given by Eq. (1): , where the dAMF depends on profile parameters and solar and viewing geometry. Within MAPA, dAMFs have been calculated offline with the radiative transfer model McArtim (Deutschmann et al., 2011) for fixed nodes for each parameter and stored as a LUT. Within MAPA profile inversion, these multidimensional LUTs are interpolated linearly for the given parameter values. For details on the dAMF LUT properties see Appendix B.
Note that the profile parameterization (Sect. 2.4) is the same for aerosols and trace gases. The forward models for aerosols and trace gases, however, are similar (and the profile retrieval is based on the same code as far as possible) but not identical. This is due to the fact that the column parameters caer and ctg have different meanings in the context of S and V: for aerosols, c equals the AOD τ, which is completely independent of the O4 VCD. For trace gases, c equals the VCD Vtg.
Below, the forward models will be described for both O4 (which is the basis for retrieving aerosol profiles) and trace gases.
2.5.1 Forward model for aerosols
For aerosols, the O4 dAMF is a direct function of the profile parameters and viewing geometry ϑ, φ:
The corresponding dSCD is
The respective VCD of O4 (or vertical profiles of pressure and temperature, which allow for the calculation of ) has to be provided in the MAPA input or is calculated from ECMWF profiles.
2.5.2 Forward model for trace gases
For trace gases, the dAMFs also depend on the aerosol profile parameters as determined from the analysis of O4 dSCDs1 but not on the trace gas VCD ctg, as long as optical depths are low (which is a prerequisite for DOAS analysis):
The corresponding dSCD is
The trace gas VCD Vtg is identical to the column parameter ctg.
2.6 Profile inversion
The forward model as defined above translates the aerosol and trace gas profile parameters c, h, and s into dSCD sequences Sfm. Within profile inversion, the task is now to find those model parameters yielding the “best match” (bm) between Sfm and the measured dSCD sequence Sms. Typically, best match is defined in terms of least squares of the residue; i.e., the root mean square (RMS)
is minimized, with M being the number of EAs (i.e., the length of S).
In previous parameter-based inversion schemes, the best matching parameters have been determined by nonlinear least-squares algorithms like the Levenberg–Marquardt algorithm (Li et al., 2010; Wagner et al., 2011; Vlemmix et al., 2015). This approach, however, has some drawbacks, in particular
-
as the parameters are highly correlated and local minima can exist, high computational effort, i.e., multiple minimization calls with different initial values, is needed in order to soundly determine the absolute minimum.
-
as the least-squares algorithms are based on local linearization, the resulting parameter uncertainties are per construction symmetric; the resulting parameter range spanned by the fitted parameter ± CI is often unphysical (e.g. h<0 or s>2) and thus meaningless.
Within MAPA (from v0.6 onwards), a different approach based on the Monte Carlo (MC) method is chosen. The idea is to (a) generate multiple random sets of profile parameters, (b) calculate the respective dSCD and RMS, and (c) keep those yielding the best agreement. This approach results in a best matching set of parameters, plus an ensemble of parameter sets with similar low R, which reflects the uncertainty range of the estimated profile parameters, which per construction only contains physically valid values.
Section 2.6.2 describes the details of the MC inversion approach, which is used for the determination of h, s, and caer. Before that, in Sect. 2.6.1 the determination of ctg is described, which is implemented differently by a simple linear fit.
2.6.1 VCD: linear fit
The dSCD forward model is highly nonlinear in h and s and also in AOD caer. These parameters are derived by a MC approach as described in detail in the next section.
The trace gas VCD ctg, however, is just a scaling factor of A (Eq. 9). Thus, for a given set of profile parameters, and a given sequence of measured dSCDs, the best matching trace gas VCD ctg=Vbm can just be determined by a linear fit (forced through origin) of V:
(Note that S and A are vectors, and the multiplications are scalar products.)
In other words, the best matching V equals the mean of Vi for individual elevation angles, weighted by the respective dAMF (i.e., sensitivity). This is different from Wagner et al. (2004), in which V was calculated as the simple mean of Vi for the individual elevation angles without weighting.
The same formalism is used to define a VCD uncertainty Verr as the weighted mean of dSCD errors (from DOAS analysis) for individual EAs. Verr is used as a column error proxy within the flagging algorithm in order to decide if the found variability of column parameters is within expectation or not (see Sect. 2.8 for details).
2.6.2 Other profile parameters: Monte Carlo
Within MAPA, profile parameters are determined by just covering the parameter space by random numbers2 and keeping the matches. In detail, the following steps are performed:
-
limits are defined for each parameter3,
-
the RMS R is calculated for each random parameter set,
-
the lowest RMS is identified as best match (bm) Rbm, and
-
an ensemble of up to nsel parameter sets with is kept.
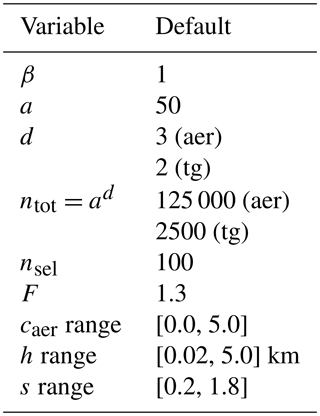
Table 1 lists the default values for parameter limits, number of random samples, and thresholds for MAPA v0.98. The impact of variations of these settings is discussed in Sect. 4.1.
The steps listed above are iterated three times, for which the resulting ensemble is used to narrow down the parameter limits for the next iteration. That is, if the lowest RMS values are always found for low s, the limits for s will be narrowed for the next iteration. As the total number of random samples stays the same, this procedure results in increasingly finer spacing of random numbers.
The procedure results in a best matching parameter set, plus an ensemble of acceptable parameter sets. For each parameter set, the corresponding VCD Vbm is also determined by Eq. (11).
2.6.3 Best match and ensemble statistics
MAPA yields the best matching parameter combination. The corresponding vertical profile is given by Eqs. (2)–(4). In addition, MAPA yields an ensemble of parameter sets with , i.e., similar (slightly worse) agreement between measurement and forward model. From this ensemble, the following statistics are derived for both the profile parameters and the corresponding vertical profiles:
-
weighted mean (wm) and standard deviation, with 1∕R2 as weights;
-
25 and 75 percentiles; and
-
absolute minimum and maximum.
The mean profiles are often smeared out; in particular strong vertical gradients (occurring for s≥1) are smeared. The degree of smearing depends on the variability of parameters within the ensemble, which is determined by Rbm and the a priori threshold for accepted RMS values F.
Note that mean ± standard deviation might exceed physical limits for parameters and profiles, similar to LMA fit results ± CI. The 25th and 75th percentiles avoid this. Only for ctg, which is not determined by a MC approach but by a linear fit, can unphysical (negative) VCDs and concentrations occur. These can be understood as noise for quasi-zero VCDs and must not be set to 0 or skipped in order to keep unbiased means.
Below we mainly focus on the best match and weighted mean of parameters and profiles.
Within trace gas retrievals, aerosol profile parameters are required for accessing the dAMF LUT. For this, the best matching parameters are taken. Due to nonlinearities (the mean of ensemble profiles does not equal the profile corresponding to the mean parameters), it is not possible to use mean parameters for this. If one is interested in the actual aerosol profile and its uncertainty, however, the mean profile and the percentiles might still yield valuable information.
Figure 2 exemplarily displays O4 dSCDs (top) and the retrieved aerosol extinction profiles (bottom) for an afternoon sequence on 15 (left) and 23 (right) September 2016. The best match, weighted mean, and 25th and 75th percentiles are shown. For these examples, a scaling factor of 0.8 has been applied for O4 (see the next section). This choice will be justified in Sect. 3.
Figure 3 displays the respective dSCDs and profiles for NO2.
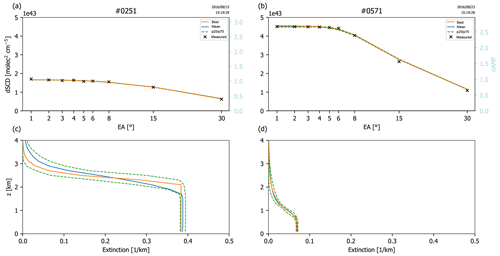
Figure 2Illustration of the profile inversion for dSCD sequences of O4 from 15 September (a, c) and 23 September (b, d) 2016. A scaling factor of 0.8 has been applied (see Sect. 2.7). (a, b) Measured and modeled dSCDs. The parameter ensembles are represented by statistical key quantities. The right axis (light blue) refers to the corresponding dAMFs. (c, d) Corresponding vertical profiles. Note that the percentiles of vertical profiles are calculated independently for each height level. That is, they do not correspond to an actual profile from the ensemble but indicate the general level of uncertainty of vertical profiles.
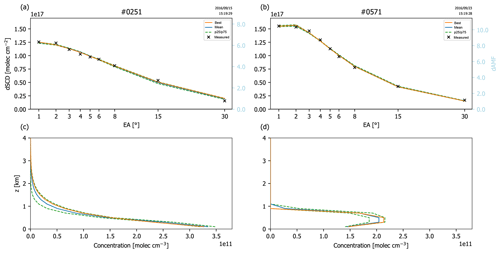
Figure 3Illustration of the profile inversion for dSCD sequences of NO2 from 15 September (a, c) and 23 September (b, d) 2016, based on the aerosol retrievals shown in Fig. 2. (a, b) Measured and modeled dSCDs. The parameter ensembles are represented by statistical key quantities. (c, d) Corresponding vertical profiles.
2.7 Scaling of O4 dSCDs
Some previous studies have reported on a significant mismatch between modeled and measured dSCDs of O4, which is usually accounted for by applying an empirical SF f of about 0.8 to the O4 dSCDs for reasons still not understood, while other studies (e.g. Ortega et al., 2016) do not see a need for a SF. An in-depth discussion of the O4 SF is provided in Wagner et al. (2018).
MAPA provides the option for defining a fixed a priori scaling factor f of 0.8, for example. Note that within MAPA, the measured dSCD is unchanged (in order to have the same measured dSCD in plots and result files for comparison), but the modeled dSCD is divided by f instead.
Another option arises from the profile inversion procedure: the linear fit of the best matching VCD (Eq. 11), used for the determination of ctg, can likewise be used to determine the best matching VCD of O4. This defines the best matching SF as
Note that extreme deviations of f from 1 are flagged later (see Sect. 2.8).
As the issue of the O4 SF is still not understood and its value or even its need is highly debated within the community, it was decided to always run MAPA with three different settings for f within the FRM4DOAS project:
-
no scaling of O4 dSCDs, i.e., f≡1,
-
a SF of f=0.8,
-
a variable (best matching) SF fbm.
This setup has also been adopted as default in MAPA v0.98. The comparison of the MAPA results for the different settings for f for different campaigns, instruments, and conditions will hopefully help to clarify the SF issue in the future.
2.8 Flags
The profile inversion scheme as described in Sect. 2.6 just searches for the parameter combinations yielding best agreement in terms of the lowest R. Thus, it will always result in a best match, even if the agreement between measured and modeled dSCDs is actually poor, or the resulting parameter ensembles are inconsistent. Therefore, additional information is needed in order to evaluate whether the resulting profile is trustable or not.
Within MAPA, flags raising warnings or errors are provided based on the performance of the profile inversion. Note that output is generated for each elevation sequence, also for those flagged by an error, and the final decision on which profiles are considered to be meaningful is the user's. Nevertheless, we strongly recommend considering the raised warnings and errors; error flags should generally lead to a rejection of the affected profiles.
In this section we describe the warning and error flag criteria and thresholds for MAPA v0.98. The thresholds, denoted by Θ below, are defined in the flag configuration file and can easily be modified. However, any change should only be made for good reasons and has to be tested carefully.
Within the FRM4DOAS processing chain, MAPA has to provide reasonable output for a wide variety of instruments and measurement conditions, which could not all be tested beforehand. Thus, the general strategy is to have low thresholds for warnings (conservative approach) and higher thresholds for errors, indicating cases which do not make sense at all.
The flags defined in MAPA v0.98 can be grouped into four categories:
-
flags based on the agreement between forward-modeled and measured S,
-
flags based on consistency of the ensemble of derived MC parameters,
-
flags based on the profile shape, and
-
miscellaneous.
The different flag criteria are explained in detail below. The default warning and error thresholds for MAPA v0.98 are listed in Table 2.
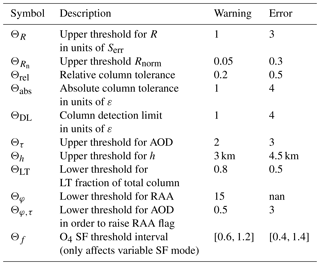
Table 2Warning and error threshold default values for MAPA v0.98. The meaning of the thresholds is explained in the text. The default column uncertainty ε is 0.05 for aerosols and Verr for trace gases.
2.8.1 RMS
The RMS R as defined in Eq. (10) reflects the agreement between measured and best matching S. Thus R might directly be used for flagging, as high RMS values generally indicate that the forward model is not capable of reproducing the measurement. In order to account for the instrument-dependent uncertainty of the measured dSCDs, the flag threshold ΘR is given in units of the typical (sequence median) DOAS fit error Serr.
Since S scales with the actual VCD V and the dAMF A, R is generally large for high trace gas columns and/or high dAMFs. The first corresponds to polluted episodes, while the second represents conditions under which the MAX-DOAS technique is particularly sensitive. Both cases are of particular interest, but would often be flagged if just a threshold for R based on typical values is defined.
Thus we also consider the RMS normalized by the maximum dSCD Smax:
Due to the normalization, Rn removes the scaling of R with V and A. However, for very low V or A, i.e., dSCDs of about 0, Rn can become quite large and the intrinsic noise of the dAMF LUT (if calculated by a MC RTM such as McArtim) matters.
Warning and errors thus only arise if the values for R and Rn both exceed the thresholds given in Table 2.
2.8.2 Consistency
In addition to the best matching parameters, MAPA derives an ensemble of parameter sets yielding similar agreement in terms of R. But this does not mean that the ensemble parameters are consistent. While different height and shape parameters might be acceptable (and just result in a larger profile uncertainty), the column parameter is an important integrated property of the profile. Thus a consistency flag is defined based on the spread of the column parameter within the ensemble.
In order to evaluate if the spread is acceptable or not, we define ε as a proxy of the column uncertainty. For aerosols, ε is defined in absolute terms in the MAPA flag configuration (default: 0.05). For trace gases, ε is set to Verr, which is derived from the SCD error Serr provided in the input data according to Eq. (11).
Based on ε, we define the tolerated deviation for c as
consisting of an absolute term and a relative term. That is, for low columns, the tolerance is dominated by ε scaled with the absolute threshold defined in the flag settings, whereas for high columns, the relative term Θrel×cbm dominates.
Flags are raised if the ensemble standard deviation of c or the difference between cbm and cwm exceeds the column tolerance.
The consistency flag indicates that the observations have been reproduced with comparable RMS by parameter sets with considerably different column parameters. That is, the dSCD sequence shows no strong dependency on c, and MAX-DOAS measurements are thus not sensitive for c under these conditions.
2.8.3 Profile shape
MAX-DOAS measurements are sensitive to the lower troposphere up to about 2–3 km (Frieß et al., 2006). Profiles reaching up in the free troposphere thus have to be treated with care. Within MAPA v0.98, these cases are identified and flagged based on two quantities:
-
the fitted height parameter h, and
-
the integrated profile within the lower troposphere cLT (default: below 4 km).
A flag is raised if h>Θh or only if the column cbm also exceeds the column detection limit
since for very low columns, the profile shape cannot be specified anyhow. Note that per default Θabs equals ΘDL; thus cDL is the same as the absolute tolerance term in Eq. (14), but MAPA also allows us to have different thresholds for both.
2.8.4 Miscellaneous
In addition, the following flags are defined.
-
Missing elevation angles. In the case of incomplete elevation sequences, an error is raised during the MAPA preprocessing. As profile inversion determines two to three parameters for about 2–4 degrees of freedom (Frieß et al., 2006), the number M of available EAs must not be too small; otherwise (default: M<5) an error is raised. Note that for the results for CINDI-2 shown in the following sections, all incomplete sequences are removed first, as this is related to missing input data, not to the MAPA performance.
-
NaNs. Best match, mean, and standard deviation (SD) of c are checked for NaNs. These might occur if NaNs are present in the input data. NaN values automatically raise an error.
-
AOD. High AOD likely indicates the presence of clouds. But even in the case of cloud-free conditions, high AOD indicates complex radiative transfer conditions. Thus flags are raised if .
-
RAA. If the relative azimuth angle is too low (φ<Θφ), i.e., the instrument is directed towards the sun, and the AOD is high enough (), a warning flag is raised. For this scenario, the forward peak of aerosol scattering matters, which is only roughly captured by the Henyey–Greenstein parameterization used in RTM.
-
O4 scaling factor. MAPA provides the option to derive a best matching SF for O4 (see Sect. 2.7). Large deviations of the SF from 1 are flagged according to the thresholds defined in Table 2.
2.8.5 Cloud flag
Several studies have characterized cloud conditions based on MAX-DOAS elevation sequences, making use of radiance and color index and their (inter- and intra-sequence) variability (Gielen et al., 2014; Wagner et al., 2014, 2016; Wang et al., 2015). While dedicated algorithms have been optimized for specific instruments, it is difficult to automatize these algorithms as MAX-DOAS instruments are usually not radiometrically calibrated; i.e., the thresholds for cloud classification have to be adjusted for each instrument.
Therefore, no automatized cloud flagging algorithm has been included within MAPA so far. However, MAPA provides the option to add external cloud flags to the MAPA input. A priori flags in input data are treated like the other flags during MAPA processing, included in the calculation of the total flag (see below), and written to the MAPA output. Similarly, other external flags (like an “instrument failure flag” etc.) can also easily be added to the MAPA flagging scheme.
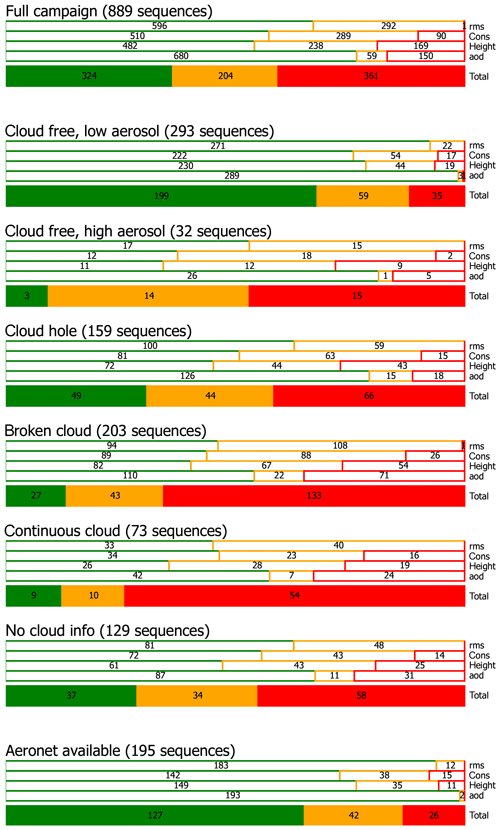
We have derived a cloud classification based on the scheme described in Wagner et al. (2016), with thresholds adjusted for CINDI-2. Note that cloud information is missing for some elevation sequences due to missing O4 dSCDs for single elevation angles. Figure 4 displays the classification of clouds during CINDI-2 for all elevation sequences as well as for those sequences in which AERONET AOD measurements are available. During the campaign, 33 % of the sequences are categorized as cloud free. If only sequences with coincident AERONET measurements are considered, 72 % are cloud free, and the remaining cases are equal parts cloud hole conditions or missing cloud information. Only 2 % are characterized as broken cloud, and no sequence is characterized as continuous cloud. Thus, a comparison of MAPA results to AERONET to a large extent implies a cloud filtering even if no dedicated cloud flag is available.
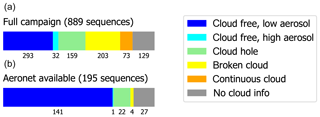
Figure 4Frequency of cloud conditions as classified based on the procedure described in Wagner et al. (2016) with adjusted thresholds for CINDI-2. Missing cloud information is related to missing O4 dSCDs for single elevation angles. (a) All available elevation sequences. (b) Only sequences in which AERONET measurements are available.
In this study, we do not include the cloud classification in the MAPA flagging scheme, as it is not part of the MAPA. Instead, we use the external cloud classification in order to investigate how far MAPA flags and results for aerosol retrieval depend on cloud conditions and how far the current MAPA flags are able to catch clouded conditions in Sect. 4.5.
2.8.6 Total flag
As a final step in the flagging procedure, a total warning or error flag is raised if any of the flags defined above indicate a warning or an error, respectively.
In this section we present MAPA results exemplarily for dSCD sequences of O4, NO2, and HCHO measured during the Second Cabauw Intercomparison of Nitrogen Dioxide Measuring Instruments (CINDI-2) during September 2016 (Kreher et al., 2019). We focus on two days, 15 and 23 September, which are mostly cloud free and have also been selected as reference days within CINDI-2 intercomparisons (Tirpitz et al., 2019). The required O4 VCD is derived from ECMWF interim temperature and pressure profiles, interpolated in space and time.
For details on the MPIC MAX-DOAS instrument and DOAS fit settings see Kreher et al. (2019).
3.1 Aerosols
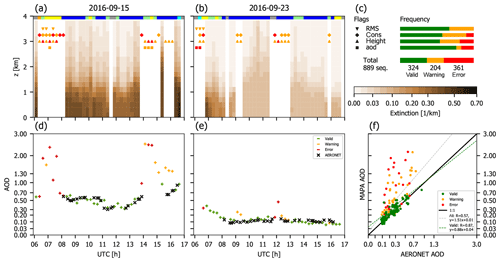
O4 dSCDs have been analyzed according to the DOAS settings specified in Table A3 in Kreher et al. (2019) but with sequential instead of noon reference spectra. Figure 5 displays the MAPA results based on the original O4 dSCD sequences. In Fig. 5a and b, the valid vertical extinction profiles are displayed for the two selected days. The invalid sequences are marked by the respective flags (symbols as in Fig. 5c). In Fig. 5d and e, the respective time series of AOD are shown and compared to AERONET measurements (Dubovik and King, 2000)6. In Fig. 5c, flag statistics are provided for all available measurements during the campaign, covering the period from 9 September to 2 October 2016. Figure 5f displays a scatter plot of MAPA AOD compared to 15 min AERONET means where available for the full campaign. Note that the scales are not linear in order to cover the different order of magnitude in AOD for the two selected days.
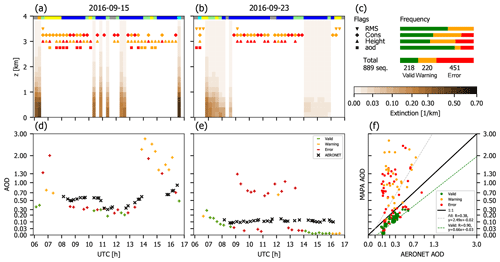
Figure 5MAPA results for aerosols during CINDI-2. (a) Vertical extinction profile on 15 September. Gaps are flagged as warning (orange) or error (red), indicated by different symbols for the different flag criteria. Results of the cloud classification are provided at the top (for details see Sect. 2.8.5; colors as in Fig. 4). Panel (b) is as (a) but for 23 September. (c) Flag statistics for the whole CINDI-2 campaign. (d) AOD from MAPA compared to AERONET for 15 September. Panel (e) is as (d) but for 23 September. (f) MAPA AOD compared to AERONET for the whole CINDI-2 campaign.
A large fraction of sequences are flagged (overall, less than one-fourth of all sequences are valid). On 23 September, not a single valid sequence was found from 09:00 to 14:00 UTC. Even worse, the remaining AODs do not match AERONET (e.g. afternoon of 23 September).
This poor performance is related to a general mismatch between modeled and measured dSCDs, as has also been found for other campaigns in the past (see Wagner et al., 2018, and references therein). We thus perform another MAPA retrieval with an O4 SF of f=0.8 (Fig. 6).
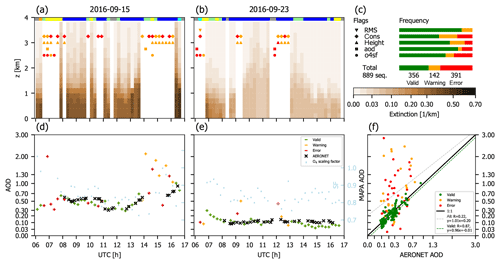
Figure 7As Fig. 5 but for a variable (best matching) SF. The resulting SFs are shown in light blue in panels (d) and (e) (for scale see right axis of e).
The application of a SF largely improves MAPA performance and the agreement with AERONET. A far higher number of sequences is now categorized as valid. The temporal pattern of AOD generally matches well between MAPA and AERONET: correlation is as good as r=0.874 with a mean deviation of 0.012±0.067.
Figure 7 displays MAPA results based on a variable SF. They are overall similar to the results for a fixed SF of 0.8. For the complete campaign, mean and SD of the best matching SF in variable mode are 0.85±0.08.
Having the option of a variable (best matching) scaling factor is a new feature of MAPA, to our knowledge not provided by any other MAX-DOAS inversion scheme. However, this additional degree of freedom adds complexity, and different effects (like aerosol properties being different from the RTM a priori, or cloud effects) might be “tuned” to an acceptable match via the scaling factor. As the variable scaling factor has not yet been tested extensively, we focus on the results for a fixed SF of 0.8 as a more “familiar” and transparent setup below, but we plan to systematically investigate the results of best matching SFs for various locations and measurement conditions in the near future.
3.2 Nitrogen dioxide (NO2)
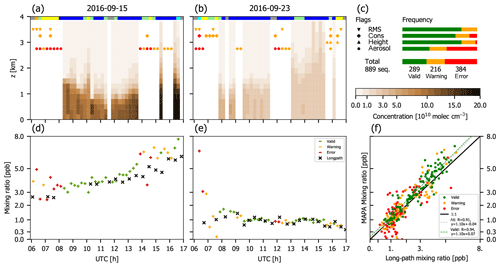
The MPIC DOAS retrieval for NO2 has been performed in a fit window slightly different from that of O4, i.e., 352 to 387 nm. Figure 8 displays MAPA results for NO2. The bottom row now displays the mixing ratio in the lowest 200 m layer instead of the total column. For comparison, mixing ratios derived from long-path (LP) DOAS measurements are shown. The LP measurements have been provided by Stefan Schmitt (IUP Heidelberg). Details on LP instruments and retrieval are given in Pöhler et al. (2010) and Nasse et al. (2019).
NO2 profiles are generally far closer to the ground compared to aerosol profiles, which is expected, as sources are located at the ground and the NOx lifetime of some hours is far shorter than that of aerosols.
Comparison of the NO2 mixing ratio in the lowest 200 m layer to LP measurements yields a correlation of r=0.887. The mean difference between MAPA and LP mixing ratios for valid sequences is 0.84±2.26 ppb.
The flagging is strongly dominated by the aerosol flag inherited from the aerosol analysis.
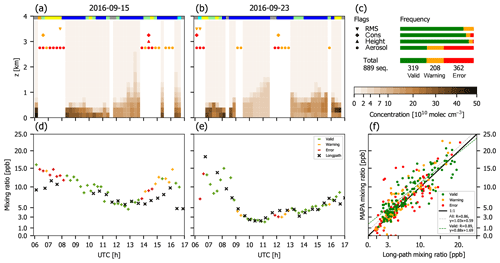
Figure 8MAPA results for NO2 during CINDI-2, based on aerosol profiles retrieved with a SF of 0.8. (a) Vertical concentration profile on 15 September. Panel (b) is as (a) but for 23 September. (c) Flag statistics for the whole CINDI-2 campaign. (d) Mixing ratio in the lowest layer (0–200 m above ground) from MAPA compared to long-path (LP) DOAS results for 15 September. Panel (e) is as (d) but for 23 September. (f) MAPA lowest layer mixing ratio compared to LP for the whole CINDI-2 campaign.
3.3 Formaldehyde (HCHO)
HCHO dSCDs have been analyzed according to the DOAS settings specified in Table A4 in Kreher et al. (2019) but with a sequential instead of a noon reference spectrum.
Figure 9 displays MAPA results for HCHO. Profiles reach up higher than for NO2 as expected due to HCHO being a secondary product in VOC oxidation.
As for NO2, the flagging is dominated by the aerosol flag. But in addition, several more sequences are flagged, with contributions from all RMS, consistency, and profile shape flags.
Comparison of the HCHO mixing ratio in the lowest 200 m layer to LP measurements yields a correlation of r=0.937. The mean difference between MAPA and LP mixing ratios for valid sequences is 0.35±0.56 ppb.
The MAPA profile inversion and flagging algorithms are controlled by a priori parameters. These have been defined by plausible assumptions. In this section we investigate how sensitive the MAPA results are for different a priori settings, based on the aerosol retrieval for CINDI-2 applying a fixed SF of 0.8 and its comparison to AERONET.
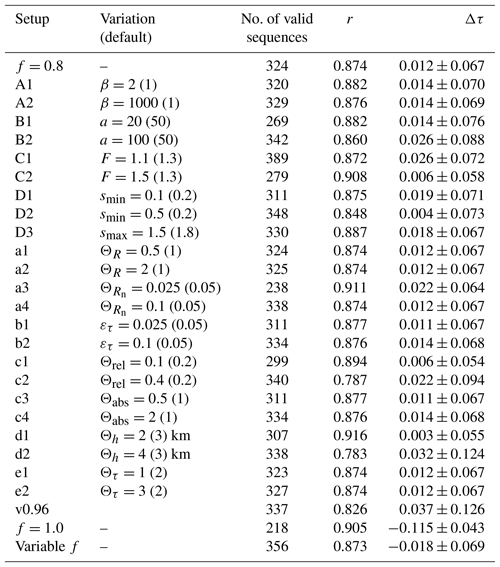
In Sect. 4.1, the sensitivity to MC settings is investigated. The impact of flagging thresholds is analyzed in Sect. 4.2. Note that flag settings can easily be modified a posteriori, while different MC settings require a complete reanalysis. Table 3 lists the investigated variations for both MC and flag settings and the impact on the number of valid sequences and the resulting AOD, compared to AERONET. It also includes results for a previous MAPA version as well as for different O4 SFs, as discussed in Sect. 4.3 and 4.4.
Finally, Sect. 4.5 investigates the dependency of MAPA flag statistics on cloud conditions.
Table 3Variations of a priori settings (compared to the default) and their impact on the MAPA aerosol retrieval, quantified by the number of valid sequences and the AOD comparison between MAPA and AERONET (correlation coefficient r and difference Δτ). The default settings of MAPA v0.98 with a SF of f=0.8 are considered baseline. Variations A–D refer to settings of the MC algorithm (Sect. 4.1). Variations a–e refer to flag thresholds (Sect. 4.2). Results for a previous MAPA release and results for different SFs are included as well. For details and discussion see the text.
4.1 MC settings
In this section, the MC settings as defined in the MAPA MC configuration file are modified one by one.
- A.
Random seed. The random generator can be initialized by the seed β provided in MAPA MC configuration. This allows us to generate reproducible results even though the method is based on random numbers. We have tested two alternative seed values just to check how strong the impact of usage of random numbers is. The number of valid sequences and the results for AOD only change slightly for different random sets.
- B.
Number of random samples. As default, each profile parameter is sampled by a=50 values per variable. That is, for the height parameter, which is within 0.02 and 5 km, the average spacing of the raster in the h dimension is about 0.01 km (note that the average spacing becomes smaller in the second and third iterations of the narrowed parameter intervals; see Sect. 2.6.2). The total number of random parameter sets ntot is a to the power of MC variables, i.e., 503=125 000 for aerosols. This corresponds to a duration of about 3 s per elevation sequence on a normal PC.
If a is lowered to 20 (ntot=8000), the profile inversion is much faster. But only 269 instead of 324 sequences are identified as valid. However, the remaining profiles show good agreement with AERONET. If a number of a=100 (ntot=106) is chosen, about 20 more sequences are labeled as valid compared to the baseline. But the agreement with AERONET becomes slightly worse, and the required time is more than 10-fold.
The impact of a on the number of valid sequences can be understood as for higher a, the parameter space is sampled at a finer resolution. Thus the RMS of the best match, Rbm, generally becomes lower. Consequently, the parameter ensemble defined by is more homogeneous, and fewer sequences are flagged as inconsistent.
We found a=50 to be a good compromise between computation time and the number of valid sequences.
- C.
Ensemble threshold for RMS. MAPA determines the best matching parameter combination by the lowest RMS R. In addition, an ensemble of parameter sets is kept with . The resulting ensemble allows us to estimate the uncertainty of the derived parameters and profiles. Per default, F is set to 1.3. We have tested smaller and higher values for F in scenarios C1 and C2.
For a low value of F=1.1, a far higher number of sequences is characterized as valid. This is due to the variety of parameters in the ensemble being lowered, and consequently the consistency thresholds are less often exceeded. Another side effect is that the profile uncertainty estimate, which is derived from the variability of profile parameters, is also lowered. For the extreme scenario FR→1, only the best matching parameter set would be left, which would be close to the result from the LMA if the number of randoms is high enough. Interestingly, the agreement to AERONET is slightly worse for a low F.
Conversely, a higher value for F results in fewer valid sequences (as more sequences are characterized as inconsistent), but the remaining ones show better agreement with AERONET.
For MAPA v0.98 default settings, we stick to the choice of F=1.3. But we recommend also testing smaller values for F like 1.2 or 1.1, in particular if a large fraction of sequences is flagged by the consistency flag.
- D.
Shape parameter limits. The shape parameter s determines the profile shape according to Sect. 2.4. Modifying the allowed parameter range thus changes the basic population of possible profile shapes within the random ensemble.
By default, the shape parameter almost covers the nodes of the dAMF LUT, except for smin, which is set to 0.2. Changing this to 0.1 means allowing for boxes with long exponential tails, which are likely flagged later by the profile shape flag due to the LT criterium. Setting smin=0.1 worsens the performance (fewer valid sequences as expected; slightly poorer agreement to AERONET), while a value of 0.5 improves the difference but not the correlation to AERONET.
Setting smax to 1.5 (i.e., removing very thin elevated layers from the basic population) has almost no effect on the CINDI-2 aerosol results.
4.2 Flag settings
Here we modify the flag settings and thresholds as defined in the MAPA flag configuration file one by one. Except for the thresholds for height parameter and AOD, the default values are halved and doubled.
- a.
RMS. We have changed the RMS thresholds for R and Rn in both directions. A change in the threshold of R has hardly any effect in the case of our CINDI-2 results. This might of course be different for other instruments or measurement conditions.
Lowering the threshold for Rn has a tremendous effect: 86 more sequences would be flagged compared to the default. The remaining sequences show a better correlation, but slightly worse agreement with AERONET AOD. Increasing has only a small effect, as most sequences with high Rn values are already flagged by one of the other criteria.
- b.
Column uncertainty proxy. For trace gases, εtg can be determined from the dSCD sequence (see Sect. 2.6.1). This is not possible for the aerosol retrieval. Instead, ετ has to be defined by the user.
Per default, ετ is set to 0.05. A lower or higher value for ετ slightly decreases or increases the number of valid sequences, respectively, but the agreement with AERONET hardly changes.
- c.
Consistency. The variations of the thresholds related to the consistency flag can be summarized as follows. More strict criteria (c1 and c3) result in fewer valid sequences but a slightly better agreement with AERONET. Vice versa, less strict criteria (c2 and c4) result in more valid sequences with poorer agreement with AERONET. We consider the current default settings to be plausible and a good compromise.
- d.
Profile shape. Here we focus on variations of Θh. The impact of modifications of ΘLT (not shown) is similar.
If Θh is set to 4 km, which was the default value in previous MAPA versions (compare Sect. 4.3), more sequences are labeled as valid, but the agreement to AERONET becomes worse. For instance, for the measurements around 16:00 UTC on 15 September, when MAPA AOD is far higher than AERONET, a warning was raised by the height parameter (see Fig. 6a and d). For Θh=4 km, these sequences are labeled as valid.
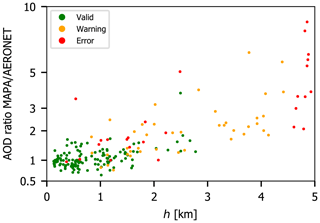
If the threshold Θh is lowered to 2 km, fewer valid sequences remain, but those show significantly better agreement with AERONET, for both correlation and difference. This reflects that MAX-DOAS measurements are mainly sensitive for profiles close to the ground (Frieß et al., 2006). Consequently, inversion results for profiles reaching up to higher altitudes have higher uncertainties.
This is also illustrated in Fig. 10, showing the agreement between MAPA and AERONET AOD as a function of the height parameter h.
- e.
AOD. Modifications of the AOD threshold have almost no effect. This might however be different for measurements under a higher aerosol load.
4.3 MAPA version 0.96
In Table 3, the results for previous MAPA version 0.96 are also included. This version was used for the FRM4DOAS verification study (Richter and Tirpitz, 2019).
Version 0.96 was based on the same MC algorithm with the same MC settings as v0.98. However, the flag definitions and thresholds differ slightly. The main difference is that the height threshold for the profile shape flag was set to 4 km in v0.96. Consequently, v0.96 results in more valid sequences but with slightly poorer agreement with AERONET AOD, similar to variation d2.
4.4 Different scaling factors
The results presented above are based on an O4 SF of 0.8. If instead no scaling factor is applied, a far higher number of sequences is flagged, and only 218 sequences remain. These show a good correlation to AERONET but a systematic bias of −0.115 (compare Fig. 5). The ratio of the mean AOD from MAPA vs. AERONET is 0.53; i.e., MAPA results are too low by a factor of 2 on average if no SF is applied.
If the SF is considered to be variable, about 30 more sequences are valid, with similar agreement to AERONET as for a fixed SF of 0.8.
4.5 Clouds
Figure 11 displays the MAPA flag statistics in dependency of cloud conditions (Sect. 2.8.5) during CINDI-2. For the full campaign, 36 % of all sequences are valid. If only cloud-free scenes with low aerosol are considered, 68 % are valid, while for clouded scenes (broken + continuous clouds), only 13 % are valid. Note that the flags for RMS, consistency, height, and AOD all contribute significantly to the flagging of clouded scenes.
For the selection of sequences in which AERONET is available, 65 % sequences are valid.
For CINDI-2, most clouded cases are successfully flagged in MAPA. But a significant number of cloud hole/broken cloud scenes still remain. We thus recommend that the user applies an additional cloud classification according to Wagner et al. (2016), for example, and flag cloud holes with a warning and continuous and broken cloud scenes with an error.
In this section we discuss challenges and limitations of MAX-DOAS profile inversion, which have to be kept in mind when interpreting the results and comparing them to other datasets. We start with issues generally affecting MAX-DOAS inversions, followed by MAPA-specific issues.
5.1 General limitations of MAX-DOAS profile inversions
In this section we discuss general MAX-DOAS limitations, which also account for optimal estimation algorithms. Still, the issues are discussed from a MAPA perspective.
5.1.1 RTM assumptions
Within forward models, RTM calculations are required, which need a priori information such as aerosol properties. If this information is not available and wrong assumptions are made, resulting profiles are biased.
For MAPA, the dAMF LUT used in the forward model has been calculated based on a priori assumptions as specified in Appendix B. Currently, additional LUTs for different a priori settings are calculated, allowing for a better quantification of the impact of a priori RTM assumptions on MAPA results in the future.
5.1.2 Horizontal gradients
Current MAX-DOAS inversion schemes are based on the assumption of horizontally homogeneous layering. In reality, however, aerosol and trace gas distributions reveal horizontal gradients, as can be clearly demonstrated by comparing the results for different azimuthal viewing directions (e.g. Wagner et al., 2011).
It is very challenging to account for horizontal gradients in trace gas inversion algorithms, as (a) the degrees of freedom are numerous (and have to be limited by some simplifications) and (b) fully 3-D radiative transfer modeling has to be performed, which is only supported by a few RTMs (e.g. McArtim), and far more time-consuming.
Currently, a MAX-DOAS inversion scheme accounting for horizontal gradients is developed at MPIC (Remmers et al., 2018) based on simultaneous measurements in four azimuth directions. For MAPA, horizontal gradients have so far been ignored, but corrections might possibly be added in future versions based on the lessons learned in Remmers et al. (2018).
5.1.3 Clouds
Clouds are usually ignored in the RTM underlying the MAX-DOAS inversion. Thus, elevation sequences affected by clouds have to be flagged. Several algorithms have been proposed for the classification of cloud conditions from MAX-DOAS measurements (Gielen et al., 2014; Wagner et al., 2014, 2016; Wang et al., 2015), using the zenith values as well as EA dependency of radiances and color indices. However, as MAX-DOAS radiances are usually not calibrated, it is not straightforward to define a universal standardized cloud classification for all kinds of instruments. Instead, thresholds have to be adjusted for each instrument.
For CINDI-2, the MAPA flagging scheme raises a warning or error in 87 % of all clouded scenes.
5.1.4 O4 scaling factor
The issue of the O4 scaling factor is still an unresolved conundrum. MAPA results strongly depend on the choice of the SF. For CINDI-2, a SF of about 0.8 results in much better agreement with AERONET, while the unscaled O4 dSCDs result in low-biased AODs by a factor of 2, and a far higher number of sequences are flagged.
Thus the SF is a general limitation of MAX-DOAS analysis. As shown in Wagner et al. (2018), the discrepancies between modeled and measured S can in some cases not be explained by the involved uncertainties of temperature and pressure profiles, O4 cross-section uncertainty, etc.
The MAPA option of determining the best matching SF (see Sect. 2.7), allowing the analysis of the dependency of the SF on various observation conditions, might help to investigate and hopefully clarify this issue in the future.
5.1.5 Flags
Profile inversions yield a best estimate for aerosol and trace gas profiles but no direct clue on whether this profile is realistic or not. Thus, within MAPA flags have been defined based on plausibility criteria and basic uncertainty information such as the RMS of the forward model and the DOAS fit error of input dSCDs. The thresholds have been defined carefully and the sensitivity of the a priori settings has been investigated in the previous section. But still, it cannot be ruled out that “good” profiles are flagged and “bad” profiles are not yet flagged.
So far, flags have been investigated based on CINDI-2 measurements and synthetic dSCDs (see Frieß et al., 2018). Further investigations for different instruments and measurement conditions will be made possible by the automatized processing within the FRM4DOAS project. Further extensive validation is desirable, preferably to actual profile measurements from sondes or drones, for example.
5.2 Specific limitations of MAPA
5.2.1 Profile parameterization
The simple profile parameterization can only represent a limited set of profile shapes. In particular, multilayer profiles (like a near-surface pollution plus an elevated layer) are not covered by the parameterization.
But pure exponential profile shapes, which are often assumed in synthetic data and might be considered “simple” cases, are also not directly included in the current MAPA parameterization. They would result from the limit of h→0 and s→0, but this limit is not covered by the dAMF LUT.
Thus, for synthetic dSCDs based on exponential profiles, the MAPA results try to mimic the exponential shape by a low height parameter and low shape parameter, but performance (in terms of number of valid profiles as well as the agreement of the resulting column parameter) is worse than for box profiles (see Figs. 12 and 16 in Frieß et al., 2018).
5.2.2 dAMF LUT
The dAMF LUT has been calculated with the MC RTM McArtim (Deutschmann et al., 2011). Thus the calculated dAMFs are affected by MC noise. This might become relevant in the case of low dAMFs and/or low VCDs.
In addition, the dAMFs for given geometry and profile parameters are derived from the multidimensional dAMF LUT by linear interpolation, though the dependencies are generally nonlinear.
Based on the MAPA results for synthetic dSCDs (Frieß et al., 2018), both effects can be considered noncritical.
5.2.3 Averaging kernels
Averaging kernels are not provided by MAPA. But still, the information on the sensitivity of MAPA for different vertical layers is inwoven in the dAMF LUTs. Further investigations will be made in the future into how far the dAMF LUTs used for aerosol and trace gas inversion by MAPA might be used to construct an averaging kernel proxy.
The Mainz profile algorithm (MAPA) retrieves lower tropospheric profiles of aerosol extinction and trace gas concentrations from dSCD sequences derived from MAX-DOAS measurements. MAPA is based on a simple profile parameterization. In contrast to previous parameter-based profile inversion schemes, MAPA uses a MC approach to derive a distribution of best matching parameter sets (and associated profiles) rather than just one best solution. This is much faster, can deal with correlation of parameters and multiple minima, and also allows derivation of an estimate of profile uncertainties. In addition, a two-stage scheme is provided for flagging probably dubious and erroneous results by warning and error, respectively, based on several criteria.
MAPA aerosol results during CINDI-2 agree well with AERONET AOD only if a scaling factor of 0.8 is applied for O4, for reasons still not understood. In this context, the option of having a variable SF in MAPA might help to solve this issue in the future. Trace gas results for NO2 and HCHO agree well with LP measurements. The results are robust with respect to modifications of the a priori settings for MC and flagging.
MAPA flagging removes a large fraction but not all scenes affected by clouds. It is thus recommended to generally apply an additional cloud flagging. The MAPA flagging scheme generally succeeds in identifying dubious results, but a considerable fraction of elevation sequences are flagged. For trace gas profiles, the flagging scheme is dominated by the aerosol flag, which seems to be too strict. Under which circumstances an aerosol warning might be acceptable within the trace gas retrievals has to be checked in a future study.
MAPA performance is affected by general MAX-DOAS limitations like RTM a priori assumptions (such as aerosol scattering properties or the usually made assumption of horizontal homogeneity), clouds, and the uncertainty caused by the basic lack of understanding of the O4 SF.
In addition, complex profiles like multiple layers, which are not adequately reflected by the chosen parameterization, cannot be retrieved.
Within the FRM4DOAS project, different parameter-based as well as OE-based profile inversion algorithms have been compared extensively for synthetic dSCDs (Frieß et al., 2018) as well as real measurements (Tirpitz et al., 2019; Richter and Tirpitz, 2019). MAPA has been included in the FRM4DOAS operational processing chain. This will allow for extensive comparisons to profiles from optimal estimation inversion, as well as detailed studies on the O4 SF, for a variety of instruments and measurement conditions in the future.
Documentation on MAPA code, data formats, LUTs, and future changes can be found at ftp://ftp.mpic.de/MAPA.
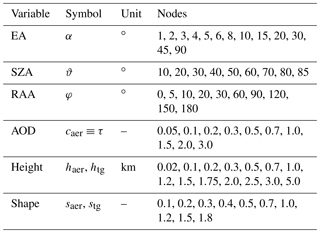
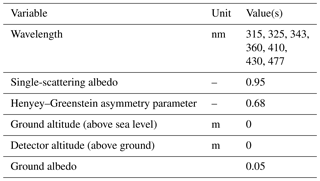
The dAMFs for O4 and trace gases are derived from RTM calculations using McArtim (Deutschmann et al., 2011) for a set of viewing geometries and profile parameters. The results are stored in a multidimensional LUT in netCDF format, which is interpolated linearly within the MAPA forward model. Table B1 lists the nodes of the parameters in the LUT. Table B2 provides additional settings and a priori assumptions made for the RTM calculation. Currently, additional LUTs with other settings are calculated (starting with elevated ground altitude, which will be automatically be used for elevated stations in future MAPA versions). Future LUT calculations will also provide additional nodes, like or s=1.1.
Table B1Nodes of the LUT for dAMFs. Note that other variables like wavelength, detector altitude, or aerosol settings are not included as nodes, but one LUT is determined for each combination of these additional parameters. Compare Table B2.
Note that the LUT approach used within MAPA allows for any combination of SZA and RAA, while parameter-based profile retrievals shown in previous studies (Wagner et al., 2011; Frieß et al., 2016) were based on LUTs calculated only for the actual SZA–RAA combinations matching the time and place of the measurements.
So far, LUTs are calculated for a set of wavelengths covering the UV and blue spectral range. For a given MAX-DOAS retrieval, MAPA v0.98 just takes the LUT with the closest match in wavelength (per default: center of DOAS fit window, can be modified in configuration). In the future, interpolation in wavelength will also be possible.
Table B2RTM settings for LUT calculation. Every combination (so far different wavelengths) is stored as a separate LUT. Further LUTs for other wavelengths, ground altitudes, and aerosol settings are currently calculated and will be provided at ftp://ftp.mpic.de/MAPA/ when ready.
SB implemented MAPA in Python, wrote most of the code, introduced the MC approach, defined the flagging scheme, performed the sensitivity study, and prepared the paper, with contributions from all co-authors. SDÖ wrote parts of the code and calculated the O4 VCDs. SDO performed the MAX-DOAS measurements during CINDI-2 and carried out the DOAS analysis. JR provided valuable input on MAX-DOAS inversion and algorithm design. YW performed the cloud classification. TW performed the RTM calculations and supervised the study.
The authors declare that they have no conflict of interest.
This study has received funding from the FRM4DOAS project under the ESA
contract no. 4000118181/16/I-EF.
We would like to thank the CINDI-2 and FRM4DOAS communities for valuable
discussions and feedback, in particular Martina Friedrich from BIRA
(Brussels, Belgium), Jan-Lukas Tirpitz and Udo Frieß from IUP
(Heidelberg, Germany), and Andreas Richter from IUP (Bremen, Germany).
Christian Borger from MPIC (Mainz, Germany) is acknowledged for valuable
comments on coding and support in bug fixing. We thank Stefan Schmitt from
IUP Heidelberg for providing long-path DOAS measurements for NO2 and
HCHO. We thank Bas Henzing for his effort in establishing and maintaining
AERONET measurements at Cabauw.
The article processing charges for this open-access
publication were covered by the Max Planck Society.
Edited by: Keding Lu
Reviewed by: two anonymous referees
Clémer, K., Van Roozendael, M., Fayt, C., Hendrick, F., Hermans, C., Pinardi, G., Spurr, R., Wang, P., and De Mazière, M.: Multiple wavelength retrieval of tropospheric aerosol optical properties from MAXDOAS measurements in Beijing, Atmos. Meas. Tech., 3, 863–878, https://doi.org/10.5194/amt-3-863-2010, 2010. a, b
Dee, D. P., Uppala, S. M., Simmons, A. J., Berrisford, P., Poli, P., Kobayashi, S., Andrae, U., Balmaseda, M. A., Balsamo, G., Bauer, P., Bechtold, P., Beljaars, A. C. M., van de Berg, L., Bidlot, J., Bormann, N., Delsol, C., Dragani, R., Fuentes, M., Geer, A. J., Haimberger, L., Healy, S. B., Hersbach, H., Hólm, E. V., Isaksen, L., Kållberg, P., Köhler, M., Matricardi, M., McNally, A. P., Monge-Sanz, B. M., Morcrette, J.-J., Park, B.-K., Peubey, C., de Rosnay, P., Tavolato, C., Thépaut, J.-N., and Vitart, F.: The ERA-Interim reanalysis: configuration and performance of the data assimilation system, Q. J. Roy. Meteor. Soc., 137, 553–597, doi:10.1002/qj.828, 2011. a
Deutschmann, T., Beirle, S., Frieß, U., Grzegorski, M., Kern, C., Kritten, L., Platt, U., Prados-Roman, C., Pukite, J., Wagner, T., Werner, B., and Pfeilsticker, K.: The Monte Carlo atmospheric radiative transfer model McArtim: Introduction and validation of Jacobians and 3-D features, J. Quant. Spectrosc. Ra., 112, 1119–1137, doi:10.1016/j.jqsrt.2010.12.009, 2011. a, b, c
Dubovik, O. and King, M. D.: A flexible inversion algorithm for retrieval of aerosol optical properties from Sun and sky radiance measurements, J. Geophys. Res., 105, 20673–20696, 2000. a
Frieß, U., Monks, P., Remedios, J., Rozanov, A., Sinreich, R., Wagner, T., and Platt, U.: MAX-DOAS O4 measurements: A new technique to derive information on atmospheric aerosols: 2. Modeling studies, J. Geophys. Res., 111, D14203, doi:10.1029/2005JD006618, 2006. a, b, c, d, e
Frieß, U., Klein Baltink, H., Beirle, S., Clémer, K., Hendrick, F., Henzing, B., Irie, H., de Leeuw, G., Li, A., Moerman, M. M., van Roozendael, M., Shaiganfar, R., Wagner, T., Wang, Y., Xie, P., Yilmaz, S., and Zieger, P.: Intercomparison of aerosol extinction profiles retrieved from MAX-DOAS measurements, Atmos. Meas. Tech., 9, 3205–3222, https://doi.org/10.5194/amt-9-3205-2016, 2016. a
Frieß, U., Beirle, S., Alvarado Bonilla, L., Bösch, T., Friedrich, M. M., Hendrick, F., Piters, A., Richter, A., van Roozendael, M., Rozanov, V. V., Spinei, E., Tirpitz, J.-L., Vlemmix, T., Wagner, T., and Wang, Y.: Intercomparison of MAX-DOAS Vertical Profile Retrieval Algorithms: Studies using Synthetic Data, Atmos. Meas. Tech. Discuss., https://doi.org/10.5194/amt-2018-423, in review, 2018. a, b, c, d
Gielen, C., Van Roozendael, M., Hendrick, F., Pinardi, G., Vlemmix, T., De Bock, V., De Backer, H., Fayt, C., Hermans, C., Gillotay, D., and Wang, P.: A simple and versatile cloud-screening method for MAX-DOAS retrievals, Atmos. Meas. Tech., 7, 3509–3527, https://doi.org/10.5194/amt-7-3509-2014, 2014. a, b
Hönninger, G. and Platt, U.: Observations of BrO and its vertical distribution during surface ozone depletion at Alert, Atmos. Environ., 36, 2481–2489, 2002. a
Hönninger, G., von Friedeburg, C., and Platt, U.: Multi axis differential optical absorption spectroscopy (MAX-DOAS), Atmos. Chem. Phys., 4, 231–254, https://doi.org/10.5194/acp-4-231-2004, 2004. a
Irie, H., Kanaya, Y., Akimoto, H., Iwabuchi, H., Shimizu, A., and Aoki, K.: First retrieval of tropospheric aerosol profiles using MAX-DOAS and comparison with lidar and sky radiometer measurements, Atmos. Chem. Phys., 8, 341–350, https://doi.org/10.5194/acp-8-341-2008, 2008. a
Kreher, K., van Roozendael, M., Hendrick, F., Apituley, A., Dimitropoulou, E., Friess, U., Richter, A., Wagner, T., Abuhassan, N., Ang, L., Anguas, M., Bais, A., Benavent, N., Bösch, T., Bognar, K., Borovski, A., Bruchkovsky, I., Cede, A., Chan, K. L., Donner, S., Drosoglou, T., Fayt, C., Finkenzeller, H., Garcia-Nieto, D., van Gent, J., Gielen, C., Gómez-Martín, L., Hao, N., Hermans, C., Hoque, S., Irie, H., Jin, J., Johnston, P., Khayyam Butt, J., Khokhar, F., Koenig, T., Kuhn, J., Kumar, V., Lampel, J., Liu, C., Ma, J., Merlaud, A., Mishra, A. K., Müller, M., Navarro-Comas, M., Ostendorf, M., Pazmino, A., Peters, E., Pinardi, G., Pinharanda, M., Piters, A, Platt, U., Postylyakov, O., Prados-Roman, C., Puentedura, O., Querel, R., Saiz-Lopez, A., Schönhardt, A., Schreier, S., Seyler, A., Sinha, V., Spinei, E., Strong, K., Tack, F., Tiefengraber, M., Tirpitz, J. L., Volkamer, R., Vrekoussis, M., Wang, S., Wang, Z., Wenig, M., Wittrock, F., Xie, P., Xu, J., Yela, M., Zhang, C., and Zhao, X.: Intercomparison of NO2, O4, O3 and HCHO slant column measurements by MAX-DOAS and zenith-sky UV-Visible spectrometers, Atmos. Meas. Tech. Discuss., submitted, 2019. a, b, c, d
Li, X., Brauers, T., Shao, M., Garland, R. M., Wagner, T., Deutschmann, T., and Wahner, A.: MAX-DOAS measurements in southern China: retrieval of aerosol extinctions and validation using ground-based in-situ data, Atmos. Chem. Phys., 10, 2079–2089, https://doi.org/10.5194/acp-10-2079-2010, 2010. a, b, c
Nasse, J. M., Eger, P. G., Pöhler, D., Schmitt, S., Frieß, U., and Platt, U.: Recent improvements of Long-Path DOAS measurements: impact on accuracy and stability of short-term and automated long-term observations Atmos. Meas. Tech. Discuss., submitted, 2019. a
Ortega, I., Berg, L. K., Ferrare, R. A., Hair, J. W., Hostetler, C. A., and Volkamer, R.: Elevated aerosol layers modify the O2–O2 absorption measured by ground-based MAX-DOAS, J. Quant. Spectrosc. Ra., 176, 34–49, doi:10.1016/j.jqsrt.2016.02.021, 2016. a
Platt, U. and Stutz, J.: Differential Optical Absorption Spectroscopy, Springer-Verlag Berlin Heidelberg, Germany, 2008. a, b
Pöhler, D., Vogel, L., Frieß, U., and Platt, U.: Observation of halogen species in the Amundsen Gulf, Arctic, by active long-path differential optical absorption spectroscopy, P. Natl. Acad. Sci. USA, 107, 6582–6587, doi:10.1073/pnas.0912231107, 2010. a
Richter, A. and Tirpitz, L.: FRM4DOAS verification report, will be made publically available on http://frm4doas.aeronomie.be/, 2019. a, b
Remmers, J., Beirle, S., and Wagner, T.: Determining spatial distributions of aerosols and trace gases within a satellite ground pixel with 4 azimuth MAX-DOAS measurements, Presentation at EGU General Assembly, available at: ftp://ftp.mpic.de/MAPA/presentations/, last access: 20 February 2019, 13 April 2018. a, b
Rodgers, C.: Inverse Methods for Atmospheric Sounding: Theory and Practice, World Scientific, 238 pp., 2000. a
Tirpitz, J. L., Frieß, U., Hendrick, F., Alberti, C., Allaart, M., Apituley, A., Bais, A., Beirle, S., Benavent, N., Berkhout, S., Bösch, T., Bognar, K., Bruchkouski, I., Chan, K. L., Chengxin, Z., den Hoed, M., Donner, S., Drosoglou, T., Friedrich, M. M., Frumau, A., Gast, L., Gomez, L., Gielen, C., Hao, N., Hensen, A., Henzing, B., Hoque, S., Irie, H., Jin, J., Koenig, T. K., Kreher, K., Kuhn, J., Kumar, V., Lampel, J., Li, A., Liu, C., Ma, J., Merlaud, A., Mishra, A., Nieto, D., Peters, E., Pinardi, G., Piters, A., Pöhler, D., Postylyakov, O., Richter, A., van Roozendael, M., Schmitt, S., Sinha, V., Spinei, E., Stein, D., Swart, D., Tack, F., Vlemmix, T., van der Hoff, R., Vonk, J, Wagner, T., Wang, S., Wang, Y., Wang, Z., Wenig, M., Wiegner, M., Wittrock, F., Xie, P., Xing, C., Xu, J., and Zhao, X.: Intercomparison of MAX-DOAS Vertical Profile Retrieval Algorithms: Studies on Field Data from the CINDI-2 Campaign, Atmos. Meas. Tech. Discuss., to be submitted, 2019. a, b
Vlemmix, T., Piters, A. J. M., Berkhout, A. J. C., Gast, L. F. L., Wang, P., and Levelt, P. F.: Ability of the MAX-DOAS method to derive profile information for NO2: can the boundary layer and free troposphere be separated?, Atmos. Meas. Tech., 4, 2659–2684, https://doi.org/10.5194/amt-4-2659-2011, 2011. a
Vlemmix, T., Hendrick, F., Pinardi, G., De Smedt, I., Fayt, C., Hermans, C., Piters, A., Wang, P., Levelt, P., and Van Roozendael, M.: MAX-DOAS observations of aerosols, formaldehyde and nitrogen dioxide in the Beijing area: comparison of two profile retrieval approaches, Atmos. Meas. Tech., 8, 941–963, https://doi.org/10.5194/amt-8-941-2015, 2015. a, b
Wagner, T., Dix, B., Friedeburg, V. C., Frieß, U., Sanghavi, S., Sinreich, R., and Platt, U.: MAX-DOAS O4 measurements – a new technique to derive information on atmospheric aerosols, Principles and information content, J. Geophys. Res., 109, D22205, doi:10.1029/2004JD004904, 2004. a, b
Wagner, T., Beirle, S., Brauers, T., Deutschmann, T., Frieß, U., Hak, C., Halla, J. D., Heue, K. P., Junkermann, W., Li, X., Platt, U., and Pundt-Gruber, I.: Inversion of tropospheric profiles of aerosol extinction and HCHO and NO2 mixing ratios from MAX-DOAS observations in Milano during the summer of 2003 and comparison with independent data sets, Atmos. Meas. Tech., 4, 2685–2715, https://doi.org/10.5194/amt-4-2685-2011, 2011. a, b, c, d, e, f, g, h, i, j
Wagner, T., Apituley, A., Beirle, S., Dörner, S., Friess, U., Remmers, J., and Shaiganfar, R.: Cloud detection and classification based on MAX-DOAS observations, Atmos. Meas. Tech., 7, 1289–1320, https://doi.org/10.5194/amt-7-1289-2014, 2014. a, b
Wagner, T., Beirle, S., Remmers, J., Shaiganfar, R., and Wang, Y.: Absolute calibration of the colour index and O4 absorption derived from Multi AXis (MAX-)DOAS measurements and their application to a standardised cloud classification algorithm, Atmos. Meas. Tech., 9, 4803–4823, https://doi.org/10.5194/amt-9-4803-2016, 2016. a, b, c, d, e
Wagner, T., Beirle, S., Benavent, N., Bösch, T., Chan, K. L., Donner, S., Dörner, S., Fayt, C., Frieß, U., García-Nieto, D., Gielen, C., González-Bartolome, D., Gomez, L., Hendrick, F., Henzing, B., Jin, J. L., Lampel, J., Ma, J., Mies, K., Navarro, M., Peters, E., Pinardi, G., Puentedura, O., Pukite, J., Remmers, J., Richter, A., Saiz-Lopez, A., Shaiganfar, R., Sihler, H., Van Roozendael, M., Wang, Y., and Yela, M.: Is a scaling factor required to obtain closure between measured and modelled atmospheric O4 absorptions? – A case study for two days during the MADCAT campaign, Atmos. Meas. Tech. Discuss., https://doi.org/10.5194/amt-2018-238, in review, 2018. a, b, c, d
Wang, Y., Penning de Vries, M., Xie, P. H., Beirle, S., Dörner, S., Remmers, J., Li, A., and Wagner, T.: Cloud and aerosol classification for 2.5 years of MAX-DOAS observations in Wuxi (China) and comparison to independent data sets, Atmos. Meas. Tech., 8, 5133–5156, https://doi.org/10.5194/amt-8-5133-2015, 2015. a, b
Wittrock, F., Oetjen, H., Richter, A., Fietkau, S., Medeke, T., Rozanov, A., and Burrows, J. P.: MAX-DOAS measurements of atmospheric trace gases in Ny-Ålesund – Radiative transfer studies and their application, Atmos. Chem. Phys., 4, 955–966, https://doi.org/10.5194/acp-4-955-2004, 2004. a
Note that it is not possible to directly use an a priori vertical aerosol extinction profile within MAPA trace gas inversion.
MAPA also provides the option to fix each of the parameters to a predefined value.
This approach (as well as the implementation of the dAMF as a LUT) is only possible since the (physical or plausible) parameter ranges are limited.
By default the random number generator is initialized with a seed β in order to generate reproducible results.
Parameter combinations yielding thin elevated layers (less than 50 m thick), which correspond to high s and low h, are excluded, as the respective profiles might not be vertically resolved within the RTM calculation of the dAMF LUT.
The original level 2 AERONET AOD determined at 440 nm has been transferred to 360 nm by assuming an Ångström exponent of 1.


