the Creative Commons Attribution 4.0 License.
the Creative Commons Attribution 4.0 License.
Laboratory and field evaluation of the Aerosol Dynamics Inc. concentrator (ADIc) for aerosol mass spectrometry
Sanna Saarikoski
Leah R. Williams
Steven R. Spielman
Gregory S. Lewis
Arantzazu Eiguren-Fernandez
Minna Aurela
Susanne V. Hering
Kimmo Teinilä
Philip Croteau
John T. Jayne
Thorsten Hohaus
Douglas R. Worsnop
Hilkka Timonen
An air-to-air ultrafine particle concentrator (Aerosol Dynamics Inc. concentrator; ADIc) has been designed to enhance online chemical characterization of ambient aerosols using aerosol mass spectrometry. The ADIc employs a three-stage, moderated water-based condensation growth tube coupled to an aerodynamic focusing nozzle to concentrate fine particles into a portion of the flow. The system can be configured to sample between 1.0 and 1.7 L min−1, with an output concentrated flow between 0.08 and 0.12 L min−1, resulting in a theoretical concentration factor (sample flow / output flow) ranging from 8 to 21. Laboratory tests with monodisperse particles show that the ADIc is effective for particles as small as 10 nm. Laboratory experiments conducted with the Aerosol Mass Spectrometer (AMS) showed no shift in the particle size with the ADIc, as measured by the AMS particle time-of-flight operation. The ADIc-AMS system was operated unattended over a 1-month period near Boston, Massachusetts. Comparison to a parallel AMS without the concentrator showed concentration factors of 9.7±0.15 and 9.1±0.1 for sulfate and nitrate, respectively, when operated with a theoretical concentration factor of 10.5±0.3. The concentration factor of organics was lower, possibly due to the presence of large particles from nearby road-paving operations and a difference in aerodynamic lens cutoff between the two AMS instruments. Another field deployment was carried out in Helsinki, Finland. Two ∼10 d measurement periods showed good correlation for the concentrations of organics, sulfate, nitrate and ammonium measured with an Aerosol Chemical Speciation Monitor (ACSM) with the ADIc and a parallel AMS without the concentrator. Additional experiments with an AMS alternating between the ADIc and a bypass line demonstrated that the concentrator did not significantly change the size distribution or the chemistry of the ambient aerosol particles.
- Article
(2256 KB) - Full-text XML
-
Supplement
(474 KB) - BibTeX
- EndNote
Particles in the ambient atmosphere are of concern for human health, air quality and climate change (Pope and Dockery, 2006; Lelieveld et al., 2015; IPCC, 2014). Measurement of the chemical characteristics of particles, and the health effects associated with their inhalation, often benefits from higher sample load, which can be achieved by increasing sample flow rate, extending sampling time or using a particle concentrator. Enrichment of particle number or mass concentration is particularly important for measurements in regions where particle concentrations are low, such as in Arctic or Antarctic background areas (10–1000 particles cm−3; Asmi et al., 2010; Tunved et al., 2006). An increase in particle mass can also benefit the measurement of trace aerosol components such as metals or improve the determination of chemically resolved size distributions.
Several air-to-air concentrators have been designed to increase the concentration of particles with respect to the suspending gas volume and to thereby provide enhanced aerosol detection. To be beneficial, the concentrator should be small, easy to maintain and capable of operating several days or even weeks unattended. Even more importantly, the concentrator should provide stable enrichment of particles and maintain aerosol chemical and physical and properties such as composition and size distribution. Virtual impactors are a well-known type of air-to-air particle concentrators that use a low-velocity sampling probe to sample a particle flow exiting from a nozzle, but they are typically ineffective for the submicrometer (< 1 µm) and ultrafine (< 100 nm) particle size ranges that are of most interest in atmospheric and health-related particle studies. Current air-to-air concentrators for small particles couple condensational growth with traditional virtual impactors, e.g., the Versatile Aerosol Concentration Enrichment System (VACES; Kim et al., 2001), the miniature VACES (Geller et al., 2005; Saarikoski et al., 2014) or the Harvard Ultrafine Concentrated Ambient Particle System (HUCAPS; Gupta et al., 2004). However, these systems are ineffective for particles below ∼30 nm in diameter. Moreover, with long condensational growth times, these approaches have been shown to feature the undesirable effect of changing the particle chemical composition (e.g., Saarikoski et al., 2014).
Here we present a new air-to-air particle concentrator, the Aerosol Dynamics Inc. concentrator (ADIc), that is based on the three-stage, laminar-flow, water-based condensational growth approach used in the Sequential Spot Sampler (Eiguren Fernandez et al., 2014; Pan et al., 2016) and in some water condensation particle counters (CPCs; Hering et al., 2017, 2018). This system is designed specifically for instruments with low sampling flow rates on the order of 0.1 L min−1. It offers concentration factors (CFs) of 8 to 21 for particles as small as 10 nm diameter in an output flow that is non-condensing at typical room temperatures (i.e., with dew points below 16 ∘C). Previously, a preliminary version of this concentration approach that used a two-stage growth tube was coupled to an Aerosol Time-of-Flight Mass Spectrometer (ATOFMS; Zauscher et al., 2011) and showed both concentration enhancement and a lack of chemical artifacts. However, this preliminary system was not stable enough for long-term operation.
The three-stage growth column version of the ADIc described here eliminates excess water vapor in the output flow and decreases the residence time for the particle in the droplet phase, with the objective of minimizing chemical artifacts as well as providing long-term stability. The ADIc is a smaller-scale version of the approach used in the nanoparticle charger reported by Kreisberg et al. (2018), for which chemical artifacts, evaluated using thermal desorption chemical ionization mass spectrometry, were found to be mostly insignificant. The ADIc is tailored for use with an aerosol mass spectrometer, such as the Aerodyne Aerosol Mass Spectrometer (AMS), the Aerodyne Aerosol Chemical Speciation Monitor (ACSM) or the ATOFMS. In this paper, the ADIc was evaluated in laboratory experiments that explored its influence on particle size and chemical composition. The ADIc was also evaluated in field measurements conducted in two different environments (urban background and suburban) and with different commonly used types of aerosol mass spectrometers. Moreover, long-term (weeks to months) unattended operation of the ADIc was demonstrated.
2.1 System description of the ADIc
The ADIc uses a laminar flow, water-based condensation growth tube coupled to an aerodynamic focusing nozzle to provide concentration of particles from a 1–1.7 L min−1 sample flow into a 0.08–0.12 L min−1 concentrated output flow. This system uses a three-stage moderated aerosol condensation approach (Hering et al., 2014), whereby the aerosol flow passes through a wet-walled tube with three distinct temperature regions (Fig. 1). In the first stage, the conditioner has cold walls and brings the flow to known conditions of cool temperature and high relative humidity (RH). The second, the initiator stage, has warm walls and provides the water vapor that creates the supersaturation for particle activation, while the last, cool-walled moderator stage provides time for particle growth while simultaneously removing water vapor from the flow. The water vapor saturation level reaches a value of 1.4 in the initiator while maintaining temperatures below 30 ∘C in the majority of the sample flow and simultaneously providing for output flow dew points below 16 ∘C. Thus, the water vapor content of the output flow is reduced to typical ambient conditions, making it easier to handle and minimizing the amount of water reaching the detection system. The wetted walls are maintained by a single wick formed from rolled membrane filter media, and the flow is laminar throughout the ADIc system.
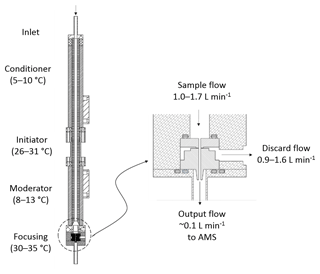
Figure 1Schematic of the Aerosol Dynamics Inc. concentrator (ADIc) with enlargement of the focusing nozzle.
Within the growth tube, particles with diameters above 5–10 nm are activated and grow by condensation to form droplets of approximately 1.5–4 µm in diameter. The cooled, droplet-laden flow passes through a 1 mm diameter nozzle wherein the droplets are aerodynamically focused along the central core of the flow, much as described by Fuerstenau et al. (1994). The ADIc contains an annular slit in the side wall of this nozzle, through which the majority (85 %–95 %) of the flow (discard flow) is extracted. The remaining 5 %–15 % of the flow contains the droplets which have been focused aerodynamically. Water evaporates from the droplets once the flow regains ambient (20–25 ∘C) temperature to provide a concentrated aerosol flow (output flow). The system is designed to minimize the time the particle is a droplet, with the objective of minimizing chemical artifacts, similar to the nanoparticle charging system (Kreisberg et al., 2018).
The exact design of the focusing and flow extraction nozzle is based on numerical modeling done using the Comsol Multiphysics package. Numerical modeling results, presented in Fig. S1 in the Supplement for the final design, show that particles smaller than 1 µm follow the gas flow trajectories and are extracted through the annular slit, while those above 6 µm over-focus and collide with the opposite wall. However, intermediately sized particles, corresponding to a Stokes number (St) of 0.5 to 3.5, are aerodynamically focused in the region near the centerline of the flow. These particles follow the remaining flow, the output flow, which continues straight, thus providing a concentrated flow for sampling with aerosol instrumentation. The theoretical concentration factor is determined by the ratio of the sample flow rate to the output flow rate and can be varied between 8 and 21.
Two prototype concentrators (Prototype 1 and 2) were used in this study, both having the same dimensions for the growth tube and nozzle. The conditioner, initiator and moderator are 140, 51 and 102 mm long, respectively, separated by 7.5 mm thick insulator sections. In both prototypes the growth tube was lined with a 9 mm ID, ∼1.5 mm thick wick formed from rolled membrane filter. For particles along the centerline of the flow, the calculated residence time from the point of activation to the inlet of the focusing nozzle is 200–300 ms, depending on the point of activation. Along the flow trajectory that encompasses 50 % of the flow, the residence time is as long as 400 ms.
The conditioner and moderator were cooled using Peltier heat pumps, and the initiator and focusing nozzle were heated resistively. All three regions used proportional–integral–derivative (PID) control to maintain set-point temperatures. Distilled water was injected into the initiator stage at a rate of 5 µL min−1, and excess water was removed from the base of the wick carried by a small flow of ∼0.05 L min−1 of air into a waste bottle. Other than packaging, the only difference between the prototypes was that Prototype 1 had a mass flow meter to measure the discard flow, while Prototype 2 did not have this option. The theoretical CF for Prototype 1 was determined continuously from the measured flows, while for Prototype 2 the theoretical CF was determined from the sample and concentrated flow rates measured before and after each experiment. The size of the ADIc is approximately 30 cm × 30 cm × 50 cm (), and the weight is ∼11 kg.
2.2 Evaluation in the laboratory
2.2.1 Particle number measurements at ADI
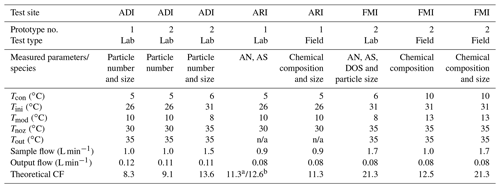
The performance of the ADIc for particle counting was evaluated in the laboratory at Aerosol Dynamics Inc. (ADI) using monodisperse particles generated by atomization, followed by drying and charge conditioning (soft X-ray, Model 3087, TSI Inc., Shoreview, US). Particles were size-selected using a nano-differential mobility analyzer (DMA; Model 3085, TSI Inc., Shoreview, US) for sizes between 5 and 60 nm and using the Aerosol Dynamics Inc. high-flow DMA (Stolzenburg et al., 1998) for sizes between 20 and 400 nm. Particle concentrations were measured in the sample flow and in the concentrated output flow using water-based CPCs. Prototype 1 was evaluated with mono-mobility ammonium sulfate (AS) particles with a pair of prototype Model 3785 (TSI Inc., Shoreview, US) water-based CPCs and a Model 3783 CPC (TSI Inc., Shoreview, US) to simultaneously measure particle concentrations in the sample flow, in the discard flow and in the concentrated output flow, respectively. The sample flow was fixed at 1.0 L min−1, and the output flow was 0.12 L min−1 (theoretical CF = 8.3). The operating temperatures for conditioner (Tcon), initiator (Tini), moderator (Tmod) and focusing nozzle (Tnoz) were 5, 26, 10 and 30 ∘C, respectively (see Table 1).
Table 1Approximate temperature and flow settings for the ADIc experiments presented in this study. ADI represents Aerosol Dynamics Inc., ARI Aerodyne Research, Inc. and FMI the Finnish Meteorological Institute. Tcon, Tini, Tmod and Tnoz are the operating temperatures for the conditioner, initiator, moderator and focusing nozzle, respectively. AN, AS and DOS are abbreviations for ammonium nitrate, ammonium sulfate and dioctyl sebacate, respectively. n/a denotes measurements that are not available.
a AN. b AS.
Similar evaluation experiments were carried out on Prototype 2, but its operation was tested under two flow regimes. First, experiments were done at 1.0 L min−1 sample flow and 0.11 L min−1 output flow (theoretical CF = 9.1), with similar operating temperatures to Prototype 1. To test higher CFs, experiments were also done at a sample flow rate of 1.5 L min−1 and an output flow of 0.11 L min−1 for a theoretical CF of 13.6. The growth tube is sized for low-flow operation, such that the centerline supersaturation reaches its maximum at the end of the warm initiator section. At the higher flow rate, the residence time is shorter, and thus for the same operating temperatures, the peak supersaturation is lower. To compensate, the initiator was operated at a warmer wall temperature, thereby providing a similar value for the calculated peak supersaturation. The operating temperatures for the higher flow rate were Tcon=6 ∘C, Tini=31 ∘C, Tmod=8 ∘C and Tnoz=35 ∘C (Table 1).
In addition to laboratory-generated AS particles, both prototypes were tested with laboratory air using a pair of water-based CPCs, one sampling upstream of the ADIc and one sampling downstream.
2.2.2 Particle chemistry at ARI and FMI
The performance of the ADIc in terms of particle chemistry was evaluated at Aerodyne Research, Inc. (ARI) and at the Finnish Meteorological Institute (FMI). Laboratory experiments were carried out using particles generated with a constant output atomizer (Model 3076, TSI Inc., Shoreview, US) from AS or ammonium nitrate (AN) in deionized water or from dioctyl sebacate (DOS) in 2-propanol. Generated particles were dried with a silica gel dryer, and the desired monodisperse particle size fraction was selected using a DMA (Model 3080, TSI Inc., Shoreview, US). A valve system was used to alternate between passing the particles through the ADIc and bypassing it. Temperature and flow settings used in the ADIc during the ARI and FMI experiments are given in Table 1.
Particle size and chemical composition were measured with several different versions of the AMS, including a high-resolution time-of-flight aerosol mass spectrometer (HR-AMS; Aerodyne Research Inc., Billerica, US; DeCarlo et al., 2006), a soot-particle aerosol mass spectrometer (SP-AMS; Aerodyne Research Inc., Billerica, US; Onasch et al., 2012), a quadrupole aerosol mass spectrometer (Q-AMS; Aerodyne Research Inc., Billerica, US; Canagaratna et al., 2007) and a quadrupole aerosol chemical speciation monitor (ACSM; Aerodyne Research Inc., Billerica, US; Ng et al., 2011). These instruments all operate on the same principle. Aerosol particles are sampled through an aerodynamic lens, forming a narrow particle beam that is transmitted into the detection chamber where the non-refractory species are flash-vaporized upon impact on a hot surface (600 ∘C). The particle vapor is ionized using electron impact ionization (70 eV) and detected by the mass spectrometer. Particle size (particle time-of-flight, PtoF, data) is determined from particle flight time in the vacuum chamber after passing through a chopper. The typical size range of particles detected with an AMS is 70 to 700 nm (Liu et al., 2007). In addition to the thermal vaporizer, the SP-AMS incorporates an intracavity Nd-YAG (1064 nm) laser that enables the detection of refractory black carbon (rBC) and metal-containing particles (Onasch et al., 2012; Carbone et al., 2015). The ACSM does not include particle size measurement capability.
HR- and SP-AMS data were analyzed with the Squirrel (v1.57H)/Pika (v1.16H) and Squirrel (v1.60P)/Pika (v1.20P) analysis package, respectively. Additionally, high-resolution (HR) size distribution data from the SP-AMS were analyzed with the Squirrel (v1.62A)/Pika (v1.22A) package. Both the HR-AMS and SP-AMS instruments were equipped with a multiple slit chopper (efficient Particle Time-of-Flight, ePToF, chopper) with 50 % particle throughput. The measured size distributions were normalized to the mass concentrations measured in the mass spectrum mode. Q-AMS data were analyzed with AMS Analysis Toolkit 1.43. ACSM data were analyzed with ACSM Local (v1.6.1.1). All of the analysis software runs in the Igor 6 (WaveMetrics, Inc.) programming environment. The three AMS instruments and the ACSM were calibrated for ionization efficiency (IE) of nitrate and relative ionization efficiency (RIE) of both ammonium and sulfate, using size-selected single-component particles of AN or AS (Budisulistiorini et al., 2014).
2.3 Field testing
The ADIc was tested for ambient aerosol at two different locations. At ARI, particles were sampled from a rooftop sampling station on the ARI building at 45 Manning St., Billerica, MA (42.53, −71.27; 60 m a.s.l.), located in a suburban office park about 30 km NW of Boston, MA, and about 60 m NE of six-lane freeway. Ambient air was sampled at 3 L min−1 through a 2.5 µm cut cyclone and split between two paths. The first path went to an HR-AMS and a CPC (Model 3776, TSI Inc., Shoreview, US). The second path went to the ADIc followed by a Q-AMS and a CPC (Model mCPC, Brechtel, Hayward, US). Two valves allowed the ambient air to bypass the ADIc and directly enter the Q-AMS. Both AMSs recorded data at 2 min time resolution. Ambient sampling was conducted from 1 to 26 August 2014. The default collection efficiency (CE) of 0.5 for ambient particles was applied to data from both AMS instruments. Local ambient temperature was downloaded from Weather Underground for station KMABILLE10, and ambient RH data were downloaded from NOAA for Hanscom.
The second ambient sampling location was at an urban background station (SMEAR III; Station for Measuring Ecosystem-Atmosphere Relationships, 60.20, 24.95; 30 m a.s.l., described by Järvi et al., 2009) located at the Kumpula campus near the FMI building, about 5 km NE of the city center of Helsinki, Finland. The station is surrounded by office buildings on one side and a small forest and botanical garden on the other side. Ambient particles were sampled through a 2.5 µm cyclone with a flow rate of 3 L min−1. Sample flow was split into two sampling lines; the first line went to the SP-AMS (with an additional bypass flow of 1.3–2 L min−1) and the second line to the ADIc followed by an ACSM. The ACSM data were averaged approximately to 10 min time resolution (10 times open + close, m∕z range: 10–150, scan rate 200 ms amu−1) and the SP-AMS measured with a time resolution of 1.5 min. Two sample flow regimes were tested with the ACSM+ADIc system; the sample flow was set to either 1.7 or 1.0 L min−1, while the output flow of the ADIc was determined by the ACSM inlet flow of 0.08 L min−1, giving a theoretical CF of 21.3 and 12.5 for high and low sample flow, respectively. Additionally, in a separate set of experiments, the ADIc was installed upstream of the SP-AMS in order to investigate the influence of the ADIc on high-resolution mass spectra and size distributions. Those tests were carried out in the high-flow regime (theoretical CF of 21.3) in order to maximize the increase in HR organic and rBC mass spectral and PToF signals with the ADIc. The SP-AMS measurements were conducted by switching the laser on and off every 1.5 min. Laser-off data were utilized when the SP-AMS was compared with the ACSM+ADIc, and laser-on data were used for the period when the ADIc was installed in front of the SP-AMS. The default CE of 0.5 for ambient particles was applied to both ACSM and SP-AMS data. An RH sensor was installed in the ACSM line with the ADIc. Ambient meteorological parameters were recorded at the Kumpula weather station. Field measurements at SMEAR III were conducted between 13 July and 22 October 2018, with sampling on about 27 different days. Temperature settings of the ADIc during the field campaigns at ARI and FMI are given in Table 1. Instrumental setups used in the laboratory and field tests at ADI, ARI and FMI are shown in Fig. S2.
3.1 Laboratory evaluation
3.1.1 Concentration factor
Figure 2 shows laboratory results for monodisperse AS particles for two flow regimes. The measured concentration factor, defined as the ratio of particle number concentration in the output flow of the ADIc to that in the sample flow, is plotted as a function of particle mobility diameter. Data for the lower flow regime are from Prototype 1, which was subsequently tested at ARI for aerosol chemical species. For the lower flow, the average measured CF was 7.7±0.3 for the particles larger than 15 nm, compared to a theoretical CF of 8.3. Data shown for the higher flow regime were obtained with Prototype 2, which was later tested at FMI for particle chemistry and size distributions. For the higher flow, the measured CF was 11.9±0.2, compared to a theoretical CF of 13.6, for 50–305 nm particles. When operated in the lower flow regime, Prototype 2 data are similar to that for Prototype 1, with a measured CF of 7.0±0.5 (data not shown). The influence of ADIc on particle size was investigated in more detail with aerosol mass spectrometers (Sect. 3.1.2.).
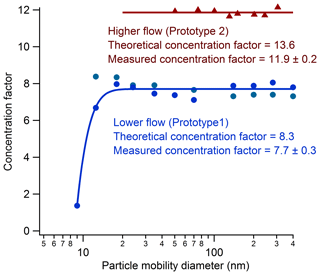
Figure 2Size-dependent concentration factor for the ADIc for higher (triangles) and lower (circles) flow regimes as a function of particle size. The red line indicates the average of the higher flow data. The blue line is a guide for the eye. Data are from two different prototype instruments, as indicated.
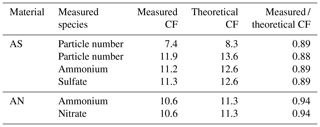
The ratio of measured / theoretical CF was ∼0.9 (see Table 2), suggesting that 90 % of the particles in the sample flow were focused into the output concentrated flow. In the experiments conducted on Prototype 1, the particle concentration was also measured in the discard flow, and it accounted for 9±2 % of the sampled particle concentration at sizes above 20 nm, on average. The fraction of particles in the discard flow showed a small, but systematic, dependence on particle size, with the fraction decreasing from 12 % at 18 nm to 6 % at 600 nm. The unaccounted for particles (2 % on average) were presumably lost in the transport lines or in the focusing nozzle itself.
Table 2Measured and theoretical concentration factors (CFs) for ammonium nitrate (AN) and ammonium sulfate (AS) obtained in the laboratory tests.
To evaluate the stability of the ADIc, both prototypes were operated for several days while sampling laboratory air. Particle number concentrations were measured in the sample flow and in the output flow. Particle concentration varied between 900 and 15 000 particles cm−3. For the lower flow regime data (Fig. S3a–b), the average CF, calculated as the ratio of the number concentration in the output flow to that in the sample flow, was 5.7±0.4, with a theoretical CF of 7.5. Linear regression of that data yielded a correlation coefficient (R2) of 0.984. In the higher flow regime (Fig. S3c–d), the measured CF was 9.0±0.7, with a theoretical CF of 13.6. For that data the correlation coefficient (R2) was 0.940. It is important to note that particle concentrations were measured using CPCs with a 5 nm activation threshold, while the ADIc threshold is closer to 10 nm. Thus, particles below 10 nm in the ambient size distribution would not be concentrated, leading to a lower measured CF and a lower ratio of measured / theoretical CF than in Table 2. In addition, changes in the ambient size distribution can lead to some variability in the measured CF. Importantly, no systematic change was observed throughout the experiments.
3.1.2 Chemical composition and particle size
The dependence of the CF on particle chemical composition was evaluated in the laboratory with size-selected 300 nm AS and AN particles, sampling with the Q-AMS with and without the ADIc in front. The theoretical and the measured CF for ammonium and sulfate from AS and for ammonium and nitrate from AN are given in Table 2. Compared to the CF obtained for particle number concentration, the ratio of measured / theoretical CF was the same for AS, while for AN the measured CF was slightly closer to the theoretical CF.
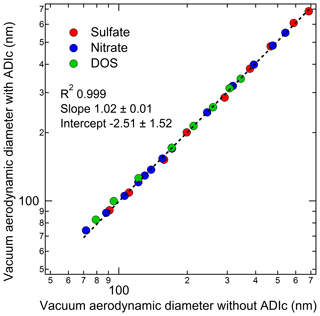
The influence of the ADIc on particle size was investigated by using monodisperse AS, AN and DOS particles in the size range of 30 to 340 nm (mobility diameter). Size and chemical composition of particles with and without the ADIc were analyzed by an SP-AMS. Measurements were carried out in the high-flow regime (theoretical CF of 21.3). Figure 3 shows the vacuum aerodynamic diameter (dva) for sulfate (from AS), nitrate (from AN) and organics (from DOS) as measured for concentrated versus unconcentrated aerosol. The regression slope was 1.02, the intercept was −2.51 and the correlation coefficient (R2) was 0.999, showing that the particle diameter was not changed by passing through the ADIc for any of the measured particle sizes or chemical species.
3.2 Field evaluation
3.2.1 Ambient organics and rBC
The performance of the ADIc for ambient aerosol was examined at two locations: at a rooftop sampling station on the ARI building and at SMEAR III in Helsinki. In order to investigate the impact of the ADIc on aerosol organic and rBC chemistry, the SP-AMS was installed behind the ADIc at SMEAR III and alternated every 30 min between measuring the output flow of the ADIc and a bypass line. Measurements were performed on 11 different days in June, July and August 2018, with a total sampling time of ∼7 h behind the ADIc and ∼7 h in bypass. Average high-resolution mass spectra for organics and rBC with and without the ADIc are presented in Fig. 4. In general, organics at SMEAR III were highly oxygenated with large oxygen to carbon ratio (O:C) and large organic carbon to organic matter ratio (OC:OM). The elemental composition of organics did not change noticeably when the sample was passed through the ADIc.
The correlations between the mass spectral ions with and without the ADIc for each fragment family are presented in Fig. 4c–f. The correlation was uniformly high (R2 > 0.987), and the slope describing the measured CF was smaller than the theoretical CF (21.3) for all the families except the Cx (rBC) family. A smaller measured than theoretical CF is in agreement with the results obtained in the laboratory tests (see Table 2), while the reason for a larger measured than theoretical CF for Cx is still unclear. One possible explanation is that the ADIc altered the shape of the rBC-containing particles. The effect of the condensation–evaporation process on particle shape was not explored in this study; however, others have found changes in the shape of aggregates. In a study using a condensation system similar to that employed here, Ma et al. (2013) reported collapse of the aggregate structure of laboratory-generated soot in the evaporation process. Regarding the SP-AMS, the morphology of the particles had been demonstrated to affect the collection efficiency since it affects the overlap of the particle beam and the laser beam (Willis et al., 2014).
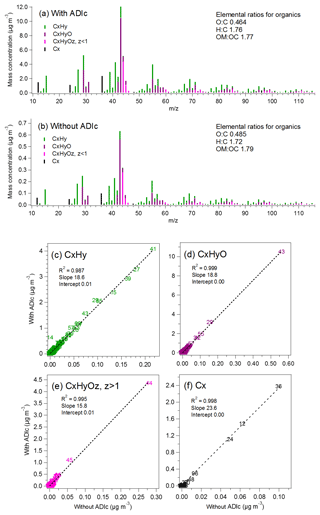
Figure 4Mass spectra for ambient organics and rBC measured with and without ADIc (a–b) and the correlation of AMS fragment families (c–f) at SMEAR III, Helsinki. The theoretical concentration factor was 21.3.
Overall, based on these tests, it can be concluded that passing through the ADIc does not significantly change the fragmentation or the elemental composition of organics or rBC in the ambient particles. However, due to the larger CF for rBC than for organics, the mass fraction of rBC in ambient particles increased slightly with the ADIc (Fig. S4).
3.2.2 Mass size distributions
The SP-AMS data with and without the ADIc were also used to investigate the impact of the ADIc on particle mass size distributions. Figure 5 compares the mass size distribution for organics, sulfate, nitrate and ammonium sampling through the ADIc and sampling from the bypass line. The PToF data were collected and analyzed in unit mass resolution (UMR) mode. Figure 5 demonstrates that the size distribution of ambient aerosol particles was not affected by passing through the ADIc. In addition, Fig. 5d shows significant improvement in the signal-to-noise ratio for ammonium when concentrating the sample flow.
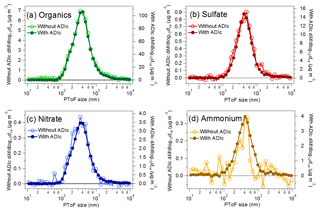
Figure 5Mass size distributions measured without (left axis) and with (right axis) the ADIc for organics (a), sulfate (b), nitrate (c) and ammonium (d) in UMR mode at SMEAR III. Sampling time for each size distribution was 70 min with the ADIc and 70 min without the ADIc. The theoretical concentration factor was 21.3.
Additional SP-AMS size distribution data were collected and analyzed in HR mode on one day, with a total sampling time of 70 min in bypass and 70 min through the ADIc. HR size distributions are shown in Fig. 6 for major chemical species and for several specific fragment ions. The much higher signal-to-noise ratio in the concentrated PToF traces gives better chemical resolution of the size distribution. The bimodal size distribution for organics is clear in the ADIc data in Fig. 6a, with hydrocarbon-like fragments (e.g., C3H7 and C4H9 in Fig. 6h and k) contributing to the mode at dva=160 nm and more oxygenated fragments (e.g., C2H3O, CO2, C2H4O2 and C3H5O in Fig. 6g, i, j and l) contributing to the mode at dva=400 nm. In addition, the higher signal-to-noise ratio in the concentrated sample enables PToF measurement for very small signals such as chloride (Fig. 6e) or CO2 (Fig. 6i) and improves the PToF measurement for smaller signals such as rBC (Fig. 6f).
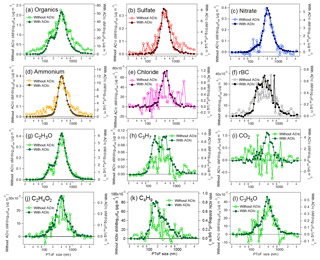
Figure 6Mass size distributions measured without (left axis) and with the ADIc (right axis) for organics (a), sulfate (b), nitrate (c), ammonium (d), chloride (e), rBC (f), C2H3O (g), C3H7 (h), CO2 (i), C2H4O2 (j), C4H9 (k) and C3H5O (l) in HR mode at SMEAR III. Sampling time for each size distribution was 70 min without and 70 min with the ADIc. The theoretical concentration factor was 21.3.
3.2.3 Long-term stability
The long-term operation of the ADIc was tested at ARI where it ran for more than 3 weeks without user maintenance or intervention. The measured CFs from comparing the Q-AMS mass loading to the HR-AMS mass loading are presented in Fig. 7. Average values of CF are presented in Table 3, along with the ratio of the mass loadings during bypass periods. The theoretical CF was calculated from the ADIc discard flow rate and the Q-AMS inlet flow rate (equal to ADIc outlet flow) as the theoretical CF = (discard flow + Q-AMS inlet flow)/Q-AMS inlet flow. Discard and Q-AMS flows were logged in real time. The slight variation in the theoretical CF was due to variations in the Q-AMS inlet flow rate, not variations in the discard flow. The gap in the data between 21 and 23 August 2014 was due to an issue with the HR-AMS, not with the ADIc.
Table 3Measured and theoretical concentration factors in ambient measurements at ARI. The measured CF was calculated from the ratio of Q-AMS+ADIc to HR-AMS mass loadings. In the bypass line the sample was not concentrated. The theoretical CF was calculated from the ADIc discard flow rate and the Q-AMS inlet flow rate (see text for details).
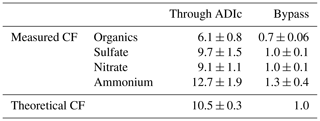
The measured CFs for nitrate and sulfate were 85 % to 90 % of theoretical CFs, consistent with the laboratory measurements presented in Table 2. The agreement between the two instruments during bypass periods was excellent for nitrate and sulfate (Table 3). The measured CF for ammonium was higher than the theoretical value, which may indicate that the aqueous droplets in the ADIc initiator and moderator stages absorbed gas-phase ammonia that remained in the particles after drying. This effect has been observed for acidic particles in the miniature VACES (Saarikoski et al., 2014). The ambient aerosol in this study was possibly slightly acidic, with an average ratio of measured to predicted ammonia of 0.9±0.15 in the HR-AMS data. Another possibility is that the RIE for ammonium was incorrect for one or both of the instruments, even though it was measured before and after the ambient sampling period with pure AN particles. The CF during bypass periods was 1.3±0.4 (Table 3), indicating that the two instruments did not agree well for ammonium, even when the Q-AMS was bypassing the ADIc. However, the ammonium mass loading was low (< 0.4 µg m−3) and often close to the detection limit for the Q-AMS during the bypass periods, leading to a large uncertainty in the bypass CF.
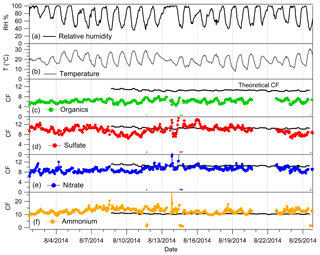
Figure 7Ambient measurements at ARI showing ambient relative humidity (a), ambient temperature (b) and measured CFs for organics (c), sulfate (d), nitrate (e) and ammonium (f). The theoretical CF is shown with the black line in (c)–(f).
The measured concentration factor (6.1±0.8) for organics was much lower than the theoretical value (10.5±0.3). This could be partly caused by a difference in the cutoff of the aerodynamic lenses in the two AMS instruments. During this time period, organics were dominated by emissions from road paving activities which generate large, hydrocarbon-like particles. Figure S5 shows the size distributions for organics, mass-to-charge ratio (m∕z) 44 and m∕z 57 for the HR-AMS and the Q-AMS+ADIc. The size distributions for organics and m∕z 57 from the Q-AMS were missing mass above dva∼700 nm that was measured by the HR-AMS, leading to a lower measured CF for organics. The m∕z 44 size distributions, representative of accumulation-mode aerosol particles, were similar in the two instruments because the size distribution of these particles was below the lens cutoff. The measured CF for m∕z 44 in Fig. S5b was 9.2, while the measured CF for m∕z 57 in Fig. S5c was only 3.9. The measured CF for organics also showed a larger diurnal variation than the measured CFs for the other species (Fig. 7), likely because road paving activities took place at night, leading to a lower measured CF at nighttime. Besides the lens cutoff, it is possible that the CF was smaller for hydrocarbon-like organics than for oxygenated organics during the measurements at ARI. However, that is just the opposite of what was found at SMEAR III in Helsinki where hydrocarbon-like fragment ions had a higher CF than highly oxygenated fragment ions (Fig. 4).
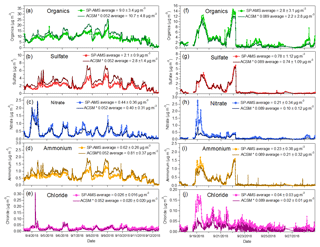
Figure 8Ambient measurements at SMEAR III showing the mass loadings for organics (a, f), sulfate (b, g), nitrate (c, h), ammonium (d, i) and chloride (e, j) measured with the SP-AMS and the ACSM+ADIc in high-flow (a–e) and low-flow (f–j) regimes. ACSM+ADIc data were corrected for the CF as described in the text. Spikes in the time series of ammonium in the ACSM are likely related to the detection of small air bubbles in the ACSM that affect the measured ammonium concentration.
3.2.4 Concentrating under high- and low-flow regimes
The performance of the ADIc with ambient aerosol was also tested systematically under two flow regimes. Although the growth tube in the ADIc is sized for low-flow operation, in some cases it can be beneficial to operate the ADIc with the largest possible CF, for example, when very small signals (e.g,. metals, PToF) are of interest or the ambient concentrations are extremely low. High (1.7 L min−1) and low (1.0 L min−1) sample flows, resulting in theoretical CFs of 21.3 and 12.5, respectively, were investigated at SMEAR III with the ADIc installed in front of an ACSM, while the SP-AMS was sampling from the bypass line. The data from the ACSM+ADIc were corrected for the CF by dividing the concentrations by 0.9 multiplied by the theoretical CF since the laboratory tests and the field campaign at ARI suggest that the measured CF is likely to be 90 % of the theoretical CF.
The time series of all chemical species measured with the ACSM+ADIc and SP-AMS track each other well, and the average mass loadings agreed within 20 %–30 % (Fig. 8), within the estimated uncertainty of 34 %–38 % for AMS measurements (Bahreini et al., 2009). In the high-flow regime, the corrected ACSM+ADIc mass loadings were systematically higher for organics, sulfate and ammonium compared to the SP-AMS. This might be caused by the lack of simultaneous measurement of the sample flow rate, so that any error in the sample flow rate before or after the experiment could propagate into the theoretical CF and thus into the correction factor. For nitrate, the corrected ACMS+ADIc mass loading varied above the SP-AMS during the afternoon and below during the night. Under low-flow conditions, there was a time period of about 12 h on 18 and 19 September when the corrected ACSM+ADIc mass loadings for nitrate and chloride were much lower than corresponding mass loadings from the SP-AMS. During this period, the aerosol particles were also not neutralized (i.e., measured ammonium was lower than ammonium predicted from the measured anions). Based on the ratio of m∕z 46 to m∕z 30, nitrate was in the form of inorganic nitrate (e.g., NH4NO3) rather than organic nitrate. The reason for the lower concentrations of nitrate and chloride with the ACSM+ADIc during this 12 h period is not clear.
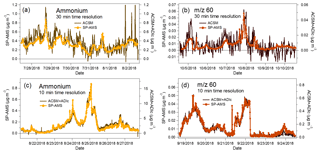
Figure 9Time series of ammonium and m∕z 60 with 30 min time resolution with ACSM and SP-AMS (a–b) and 10 min time resolution with SP-AMS and ACSM+ADIc (c)–(d) at SMEAR III.
The relative humidity was measured with the ADIc near the Q-ACSM inlet. RH was relatively constant at 63±6 %, consistent with a dew point of 16 ∘C at the outlet of the ADIc and a room temperature of about 25 ∘C. This was somewhat higher than the recommended operating RH of 20 %–40 % for AMS and ACSM instruments but not high enough to cause an increase in the collection efficiency (Middlebrook et al., 2012). However, using a dryer between the ADIc and the AMS/ACSM would reduce any potential uncertainty due to RH affecting CE.
In terms of Q-ACSM measurement, a particularly important improvement in the signal-to-noise ratio was achieved with the ADIc. Fig. 9a and b show 30 min time resolution data collected with the Q-ACSM without the ADIc, and Fig. 9b and d display 10 min time resolution data collected with the Q-ACSM+ADIc for ammonium and m∕z 60, a tracer m∕z for biomass burning. Compared to the SP-AMS data averaged to the same time resolution, it is evident that the signal-to-noise ratio for the concentrated Q-ACSM data is similar to the SP-AMS. As a consequence, use of the ADIc with the ACSM will improve determination of ammonium and thus provide better estimates of particle neutralization and CE for ambient aerosol. In addition, a better signal-to-noise ratio for tracer m∕zs will improve source apportionment with statistical methods such as positive matrix factorization (PMF).
The ADIc is tailored for the low (∼0.08 L min−1) inlet flow of aerosol mass spectrometers such as the AMS and ACSM and provides a factor of 8–21 enrichment in the concentration of particles. This concentration factor depends primarily on the ratio between the sample flow and the output flow and is found to be independent of particle size above about 10 nm. The system is relatively small and easily interfaced with the AMS.
Particle chemical composition and particle size measured with an SP-AMS were not affected by the condensational growth and evaporation process in the ADIc. Moreover, the ADIc ran unattended for a period of almost 1 month at a field site. Measured concentration factors for ambient aerosol particles in two different locations showed some variation that is not fully understood. However, the ADIc provides improved detection of low signals that outweighs a slight increase in uncertainty in the mass loadings. Improved detection limits will be important, especially in remote areas where particle concentrations are low and for measuring size distributions that typically need longer averaging periods. Additionally, use of the ADIc will be important for improving source apportionment with Q-ACSM data by gaining better time resolution and/or signal-to-noise ratio.
Data presented in this article are available upon request.
The supplement related to this article is available online at: https://doi.org/10.5194/amt-12-3907-2019-supplement.
SS, HT, SVH, AEF and LRW designed the experiments. MA, KT, LRW, PC, TH, AEF, SRS and GSL conducted measurements in laboratory and field. Data analysis and interpretation of the measurement data was done by SS, LRW, AEF and SVH. Working environment and financial support was provided by HT at FMI, JTJ and DRW at Aerodyne and SVH at Aerosol Dynamics. SS, LRW and SVH prepared the manuscript with contributions from all co-authors.
Aerosol Dynamics Inc. holds a patent on the particle focusing technology.
Funding is gratefully acknowledged from the US Department of Energy, Small Business Research Program (grant no. DESC0004698), the Cityzer (Business Finland project Dnro:3021/31/2015), TAQIITA (Business Finland project Dnro:2634/31/2015) and the Launching Regional Innovations and Experimentations Funds (AIKO), governed by the Helsinki Regional Council (project HAQT, AIKO014).
This research has been supported by the US Department of Energy (grant no. DESC0004698), Business Finland (grant nos. 3021/31/2015 and 2634/31/2015) and AIKO (grant no. AIKO014).
This paper was edited by Charles Brock and reviewed by two anonymous referees.
Asmi, E., Frey, A., Virkkula, A., Ehn, M., Manninen, H. E., Timonen, H., Tolonen-Kivimäki, O., Aurela, M., Hillamo, R., and Kulmala, M.: Hygroscopicity and chemical composition of Antarctic sub-micrometre aerosol particles and observations of new particle formation, Atmos. Chem. Phys., 10, 4253–4271, https://doi.org/10.5194/acp-10-4253-2010, 2010.
Bahreini, R., Ervens, B., Middlebrook, A., Warneke, C., De Gouw, J., DeCarlo, P., Jimenez, J., Brock, C., Neuman, J., Ryerson, T., Stark, H., Atlas, E., Brioude, J., Fried, A., Holloway, J. S., Peischl, J., Richter, D., Walega, J., Weibring, P., Wollny, A. G., and Fehsenfeld, F. C.: Organic aerosol formation in urban and industrial plumes near Houston and Dallas, Texas, J. Geophys. Res., 114, D00F16, https://doi.org/10.1029/2008JD011493, 2009.
Budisulistiorini, S. H., Canagaratna, M. R., Croteau, P. L., Baumann, K., Edgerton, E. S., Kollman, M. S., Ng, N. L., Verma, V., Shaw, S. L., Knipping, E. M., Worsnop, D. R., Jayne, J. T., Weber, R. J., and Surratt, J. D.: Intercomparison of an Aerosol Chemical Speciation Monitor (ACSM) with ambient fine aerosol measurements in downtown Atlanta, Georgia, Atmos. Meas. Tech., 7, 1929–1941, https://doi.org/10.5194/amt-7-1929-2014, 2014.
Canagaratna, M. R., Jayne, J. T., Jimenez, J. L., Allan, J. D., Alfarra, M. R., Zhang, Q., Onasch, T. B., Drewnick, F., Coe, H., Middlebrook, A., Delia, A., Williams, L. R., Trimborn, A. M., Northway, M. J., DeCarlo, P. F., Kolb, C. E., Davidovits, P., and Worsnop, D. R.: Chemical and Microphysical Characterization of Ambient Aerosols with the Aerodyne Aerosol Mass Spectrometer, Mass Spectrom. Rev., 26, 185–222, 2007.
Carbone, S., Onasch, T., Saarikoski, S., Timonen, H., Saarnio, K., Sueper, D., Rönkkö, T., Pirjola, L., Häyrinen, A., Worsnop, D., and Hillamo, R.: Characterization of trace metals on soot aerosol particles with the SP-AMS: detection and quantification, Atmos. Meas. Tech., 8, 4803–4815, https://doi.org/10.5194/amt-8-4803-2015, 2015.
DeCarlo, P. F., Kimmel, J. R., Trimborn, A., Northway, M. J., Jayne, J. T., Aiken, A. C., Gonin, M., Fuhrer, K., Horvath, T., Docherty, K. S., Worsnop, D. R., and Jimenez, J. L.: Field-deployable, high-resolution, time-of-flight aerosol mass spectrometer, Anal. Chem., 78, 8281–8289, https://doi.org/10.1021/ac061249n, 2006.
Eiguren Fernandez, A., Lewis, G. S., and Hering, S. V.: Design and Laboratory Evaluation of a Sequential Spot Sampler for Time-Resolved Measurement of Airborne Particle Composition, Aerosol Sci. Technol., 48, 655–663, 2014.
Fuerstenau, S., Gomez, A., and Fernandez de la Mora, J.: Visualization of aerodynamically focused subsonic aerosol jets, J. Aerosol Sci., 25, 165–173, 1994.
Geller, G. D., Biswas, S., Fine, P. M., and Sioutas, C.: A new compact aerosol concentrator for use in conjunction with low flow-rate continuous aerosol instrumentation, J. Aerosol Sci., 36, 1006–1022, 2005.
Gupta, T., Demokritou, P., and Koutrakis, P.: Development and Performance Evaluation of a High Volume Ultrafine Particle Concentrator for Inhalation Toxicological Studies, Inhal. Toxicol., 16, 1–12, 2004.
Hering, S. V., Spielman, S. R., and Lewis, G. S.: Moderated, water-based, condensational particle growth in a laminar flow, Aerosol Sci. Technol., 48, 401–408, 2014.
Hering, S. V., Lewis, G. S., Spielman, S. R., Eiguren-Fernandez, A., Kreisberg, N. M., Kuang, C., and Attoui, M.: Detection near 1-nm with a laminar-flow, water-based condensation particle counter, Aerosol Sci. Technol., 51, 354–362, 2017.
Hering, S. V., Lewis, G. S., Spielman, S. R., and Eiguren-Fernandez, A.: A MAGIC Concept for Self-Sustained, Water based, Ultrafine Particle Counting, Aerosol Sci. Technol., 53, 63–72, 2018.
IPCC: Climate Change Synthesis Report, Contribution of Working Groups I, II and III to the Fifth Assessment Report of the Intergovernmental Panel on Climate Change [Core Writing Team, edited by: Pachauri, R. K. and Meyer, L. A.], IPCC, Geneva, Switzerland, 151 pp, 2014.
Järvi, L., Hannuniemi, H., Hussein, T., Junninen, H., Aalto, P. P., Hillamo, R., Mäkelä, T., Keronen, P., Siivola, E., Vesala, T., and Kulmala, M.: The urban measurement station SMEAR III: Continuous monitoring of air pollution and surface-atmosphere interactions in Helsinki, Finland, Boreal. Environ. Res., 14, 86–109, 2009.
Kim, S., Jaques, P. A., Chang, M. C., Barone, T., Xiong, C., Friedlander, S. K., and Sioutas, C.: Versatile aerosol concentration enrichment system (VACES) for simultaneous in vivo and in vitro evaluation of toxic effects of ultrafine, fine and coarse ambient particles – Part II: field evaluation, J. Aerosol Sci., 32, 1299–1314, 2001.
Kreisberg, N. M., Spielman, S. R., Eiguren-Fernandez, A., Hering, S. V., Lawler, M. J., Draper, D. C., and Smith, J. N.: Water condensation-based nanoparticle charging system: Physical and chemical characterization, Aerosol Sci. Technol., 52, 1167–1177, 2018.
Lelieveld, J., Evans, J. S., Fnais, M., Giannadaki, D., and Pozzer, A.: The contribution of outdoor air pollution sources to premature mortality on a global scale, Nature, 525, 367–371, 2015.
Liu, P. S. K., Deng, R., Smith, K. A., Jayne, J. T., Williams, L. R., Canagaratna, M. R., Moore, K., Onasch, T. B., Worsnop, D. R., and Deshler, T.: Transmission Efficiency of an Aerodynamic Focusing Lens System: Comparison of Model Calculations and Laboratory Measurements for the Aerodyne Aerosol Mass Spectrometer, Aerosol Sci. Technol., 41, 721–733, 2007.
Ma, X., Zangmeister, C. D., Gigault, J., Mulholland, G. W., and Zachariah, M. R.: Soot aggregate restructuring during water processing, J. Aerosol Sci., 66, 209–219, 2013.
Middlebrook, A. M., Bahreini, R., Jiménez, J. L., and Canagaratna, M. R.: Evaluation of composition-dependent collection efficiencies for the Aerodyne aerosol mass spectrometer using field data, Aerosol Sci. Technol. 46, 258–271, 2012.
Ng, N. L., Herndon, S. C., Trimborn, A., Canagaratna, M. R., Croteau, P. L., Onasch, T. B., Sueper, D., Worsnop, D. R., Zhang, Q., Sun, Y. L., and Jayne, J. T.: An Aerosol Chemical Speciation Monitor (ACSM) for Routine Monitoring of the Composition and Mass Concentrations of Ambient Aerosol, Aerosol Sci. Technol., 45, 780–794, 2011.
Onasch, T. B., Trimborn, A., Fortner, E. C., Jayne, J. T., Kok, G. L., Williams, L. R., Davidovits, P., and Worsnop, D. R.: Soot Particle Aerosol Mass Spectrometer: Development, Validation, and Initial Application, Aerosol Sci. Technol., 46, 804–817, 2012.
Pan, M., Eiguren-Fernandez, A., Hsieh, H., Afshar-Mohajer, N., Hering, S. V., Lednicky, J., Hung Fan, Z., and Wu, C. Y.: Efficient collection of viable virus aerosol through laminar-flow, water-based condensational particle growth, J. Appl. Microbiol., 120, 805–815, 2016.
Pope, C. A. and Dockery, D. W.: Health Effects of Fine Particulate Air Pollution: Lines that Connect, J. Air Waste Manage. Assoc., 56, 709–742, 2006.
Saarikoski, S., Carbone, S., Cubison, M. J., Hillamo, R., Keronen, P., Sioutas, C., Worsnop, D. R., and Jimenez, J. L.: Evaluation of the performance of a particle concentrator for online instrumentation, Atmos. Meas. Tech., 7, 2121–2135, https://doi.org/10.5194/amt-7-2121-2014, 2014.
Stolzenburg, M., Kreisberg, N., and Hering, S.: Atmospheric size distributions measured by differential mobility optical particle size spectrometry, Aerosol Sci. Technol., 29, 402–418, 1998.
Tunved, P., Hansson, H. C., Kerminen, V. M., Strom, J., Maso, M. D., Lihavainen, H., Viisanen, Y., Aalto, P. P., Komppula, M., and Kulmala, M.: High natural aerosol loading over boreal forests, Science, 312, 261–263, 2006.
Willis, M. D., Lee, A. K. Y., Onasch, T. B., Fortner, E. C., Williams, L. R., Lambe, A. T., Worsnop, D. R., and Abbatt, J. P. D.: Collection efficiency of the soot-particle aerosol mass spectrometer (SP-AMS) for internally mixed particulate black carbon, Atmos. Meas. Tech., 7, 4507–4516, https://doi.org/10.5194/amt-7-4507-2014, 2014.
Zauscher, M. D., Moore, M. J., Lewis, G. S., Hering, S. V., and Prather, K. A.: Approach for measuring the chemistry of individual particles in the size range critical for cloud formation, Anal. Chem., 83, 2271–2278, 2011.


