the Creative Commons Attribution 4.0 License.
the Creative Commons Attribution 4.0 License.
A robust automated technique for operational calibration of ceilometers using the integrated backscatter from totally attenuating liquid clouds
Anthony J. Illingworth
Cristina Charlton-Perez
Chris D. Westbrook
Sue Ballard
A simple and robust method for calibrating ceilometers has been tested in an operational environment, demonstrating that the calibrations are stable to better than ±5 % over a period of a year. The method relies on using the integrated backscatter (B) from liquid clouds that totally extinguish the ceilometer signal; B is inversely proportional to the lidar ratio (S) of the backscatter to the extinction for cloud droplets. The calibration technique involves scaling the observed backscatter so that B matches the predicted value for S of 18.8±0.8 sr for cloud droplets, at ceilometer wavelengths. For accurate calibration, care must be taken to only use profiles where the range correction is implemented and to exclude any profiles having targets with different values of S, such as drizzle drops and aerosol particles, profiles that do not totally extinguish the ceilometer signal, profiles with low cloud bases that saturate the receiver, and any profiles for which the window transmission or the lidar pulse energy falls below 90 %. A range-dependent multiple-scattering correction that depends on the ceilometer optics should also be applied to the profile. For ceilometers operating at around 910 nm wavelength, a simple correction for water vapour attenuation is applied to the signal using the vapour profiles from a forecast analysis. For a generic ceilometer in the UK the 90 d running mean of the calibration coefficient over a period of 20 months is constant to within 3 % with no detectable annual cycle, thus confirming the validity of the humidity and multiple-scattering correction. For Gibraltar, where cloud cover is less prevalent than in the UK, the 90 d running mean calibration coefficient was constant to within 4 %. The more sensitive ceilometer model operating at 1064 nm is unaffected by water vapour attenuation but is more prone to saturation in liquid clouds; such profiles can be recognised and rejected and, despite the more restricted sample of cloud profiles, a robust calibration is readily achieved. In the UK, the running mean 90 d calibration coefficients varied by about 4 % over a period of 1 year. The consistency of profiles observed by nine pairs of co-located ceilometers in the UK Met Office network operating at around 910 and 1064 nm provided independent validation of the calibration technique. In all cases, if quantitative and reliable backscatter observations are to be obtained it is essential to keep the window clean. This may be a challenge in dusty locations. EUMETNET is currently networking 700 European ceilometers so they can provide ceilometer profiles in near real time to European weather forecast centres and has adopted the cloud calibration technique described in this paper for ceilometers with a wavelength of around 910 nm.
- Article
(3182 KB) - Full-text XML
- BibTeX
- EndNote
Ceilometers are simple, relatively inexpensive vertically pointing lidars that typically operate at wavelengths of 905–910 or 1064 nm. They can be left unattended for long periods and, as the name suggests, have mainly been used for detecting cloud base height at airports where they are valuable for air safety issues. Recent studies have shown that, in addition to detecting the large backscattered return signal from the cloud base, they can also provide vertical profiles of backscatter from both clouds and aerosols every 5–30 s with a range resolution as low as 5 m. Ceilometer profiles have been used in many research contexts; some examples are the Cloudnet scheme for validation of the representation of clouds in operational numerical weather prediction (NWP) forecast models (Illingworth et al., 2015), for aerosol profiling (Markowicz et al., 2008; Madonna et al., 2015), fog observations (Dupont et al., 2012) and the retrieval of mixing height levels (Münkel et al., 2007).
Operational weather forecasting models such as those operated by the ECMWF and MeteoFrance now represent both clouds and aerosols by prognostic variables. Remote-sensing observations are needed to show that these models are providing unbiased estimates of aerosol and cloud properties and ultimately for data assimilation into such models to improve forecasts of hazardous weather such as pollution episodes and severe convective storms producing flash floods. The European Ground-Based Observations of Essential Variables for Climate and Operational Meteorology (EG-CLIMET), which was a recent Cooperation in Science and Technology (COST) action financed by the European Union, noted that there are hundreds of ceilometers deployed over Europe which are currently underexploited. EG-CLIMET recommended that the ceilometers be networked to provide users easy access to calibrated backscatter data (Illingworth et al., 2015). At the time of writing, profiles from 200 ceilometers from 17 countries are being distributed in near real time by the E-Profile programme of European Meteorological Services Network (EUMETNET) with the number expected to rise to about 700. The data formats, calibration techniques and retrieval algorithms are being developed by COST action 1303: Towards operational ground based profiling with ceilometers, Doppler lidars and microwave radiometers for improving weather forecasts (http://www.toprof.imaa.cnr.it, last access: 15 October 2018).
If ceilometer data are to be used in an operational context, and potentially for data assimilation, accurate calibration is essential when verifying model performance by forward modelling the attenuated backscatter; for example, Illingworth et al. (2019) show that a calibration accuracy of 10 % is needed when deriving O-B statistics obtained by comparing the observed ceilometer backscatter (O) from Saharan dust with the forward modelled backscatter (B) from the ECMWF CAMS model. The World Meteorological Organisation requirements (OSCAR, 2018) suggest the goal for ice water content (IWC) observations is to have an accuracy of 10 % and for aerosol optical extinction to have an absolute accuracy of 0.01 km−1, but no fractional accuracy is quoted. In most models the ice particle density is assumed to be inversely proportional to particles size (e.g. Brown and Francis, 1995), so IWC is proportional to extinction and for a given lidar ratio and small amounts of attenuation, the requirement is for a ceilometer calibration to be accurate to 10 %.
The use of theoretical calibrations for lidars and radars based on an accurate budget of the losses and gains in the transmission and reception optics and in the electronics together with atmospheric attenuation can cause large errors (Protat et al., 2011). Accordingly, it is preferable to find some natural target that has a known backscatter value. There are two such candidates for ceilometers: firstly, the backscatter from the molecules in the atmosphere and, secondly, the integrated backscatter profile from water clouds that totally extinguish the lidar beam. In this paper, we will focus on the second method. This method, using the attenuated backscatter signal from liquid water clouds, relies on the fact that the backscatter to extinction ratio (S) is a known value of 18.8 sr for wavelengths of relevance to ceilometers (O'Connor et al., 2004). The advantage of this method is that the backscatter values from liquid water clouds are very high (typically peaking at 0.3 ) so the signal-to-noise ratio of water cloud returns is very large. By contrast, the molecular signal close to the ground is over one hundred times lower than the cloud returns and of the order 10−3 , falling off exponentially with height. For an accurate estimate of the molecular return it is necessary to average the ceilometer profiles over several hours on selected cloudless nights when there is negligible backscatter from thin cirrus clouds or aerosols (e.g. Tsaknakis et al., 2011; Wiegner et al., 2014).
In this paper, we present a development of the calibration technique using liquid clouds that can be implemented operationally and which avoids the aforementioned potential problems. We report on the values of the calibration for the Met Office network of ceilometers and show the calibration stability in time. In Sect. 2, we review the specifications and performance of the two ceilometer models in widespread use in Europe. The calibration algorithm is described in Sect. 3 and the instrument model-dependent corrections and calibration results are addressed in Sects. 4 and 5. Finally, in Sect. 6, we report on collocated ceilometer comparisons and statistics of the stability and accuracy of the calibration.
2.1 The Met Office ceilometer network
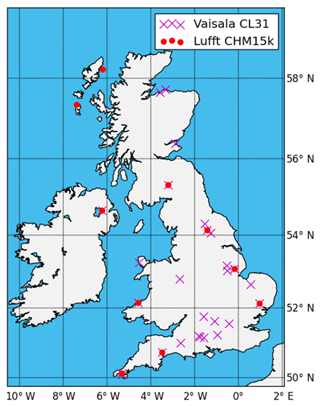
Figure 1 shows the locations of the 40 ceilometers in the UK that are presently reporting the full vertical profiles of the attenuated atmospheric backscatter and are referred to in this paper as the “Met Office ceilometer network.” The purple crosses show the locations of the 29 Vaisala CL31 ceilometers and the red circles show the 11 Jenoptik CHM15k Nimbus ceilometers that have been used to test the ceilometer calibration technique. Nine sites have collocated Vaisala and Jenoptik ceilometers. Other Met Office ceilometers, many of which are the Vaisala CT25K model, report only cloud base height and are not discussed here, although the calibration technique can be applied to both the CT25K and the newer CL51 models. Note that Jenoptik no longer produces ceilometers; the manufacturing of them has been taken over by Lufft. From here on, we refer to these ceilometers as Lufft ceilometers, including those manufactured before production passed from Jenoptik to Lufft.
2.2 Vaisala CL31 ceilometers
The key technical properties of the ceilometers used by the Met Office are summarised in Table 1. In brief, the Vaisala CL31 ceilometers use an InGaAs diode laser which emits pulses with an energy of 1.2 µJ at a pulse repetition frequency (prf) of 10 kHz with a central wavelength of 910±10 nm, though the typical spectral width is more often 4 nm (Kotthaus et al., 2016; Markowicz et al., 2008). At these wavelengths, attenuation by water vapour is significant, a fact overlooked by O'Connor et al. (2004). Ceilometers generally operate at low power, so, to increase the signal-to-noise ratio, they tend to have higher pulse repetition rates compared to high-power lidars; the returns from distant signals are generally very low so “second trip” echoes are not usually a problem. The CL31s have a single-lens design, with the centre of the lens collimating the laser beam and the outer part of the lens used for focussing the backscattered light onto the receiver, which uses an avalanche photodiode (APD) detector to process the signal (Münkel et al., 2007). Complete overlap of the transmitted beam at the receiver sample is achieved at a height of approximately 70 m (Martuccci et al., 2010) and the maximum range is 7.7 km.
Table 1Summary of some technical characteristics and parameters of the Vaisala CL31 and Lufft CHM15k, as operated in the Met Office network.
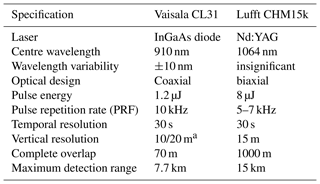
a The Met Office CL31 ceilometers have a vertical resolution of 20 m, apart from at Exeter CL31, where the vertical resolution is 10 m.
There are currently several different versions of the firmware in use by the Met Office ceilometer network. The various versions process the signal in different ways, applying “cosmetic” shifts to the data to avoid unphysical negative backscatter values. The original users for ceilometer data were aviation forecasters and air traffic control and these cosmetic shifts were applied so that it was easier for non-experts to interpret the displays. Full details of the shifts and methods for correcting can be found in Kotthaus et al. (2016). These effects should certainly be corrected for in the study of smaller particles such as aerosols and ash; however, for the stronger signal from cloud particles the effect of these shifts on the calibration method shown here is negligible.
2.3 Lufft CHM15k Nimbus ceilometers
The Lufft ceilometers use a Nd:YAG laser and operate at a slightly longer wavelength of 1064 nm where the attenuation by water vapour is negligible. The APD detector employs a photon-counting method. Due to the biaxial design of the Lufft ceilometers, full overlap is not reached until 1 km rather than 70 m for the CL31. The pulse repetition frequency is in the range 5–7 kHz and the pulse energy is 8 µJ, which is six times higher than the Vaisala CL31 ceilometers. This higher pulse energy, combined with the different overlap configuration, results in a much higher sensitivity of the CHM15k ceilometer, for detection of elevated aerosols such as volcanic ash plumes.
Autocalibration of ceilometers using liquid water cloud was proposed by O'Connor et al. (2004) as a simple method that requires no additional instruments to compute a calibration coefficient. The technique relies on the use of the lidar ratio (ratio of extinction to backscatter, denoted S), which is a constant for the droplets in liquid water cloud. Several studies have derived S from Mie theory: Pinnick et al. (1983) found that, for a wavelength of 1064 nm, S=18.2 sr; Wu et al. (2011) calculated an S of 18.5±0.47 sr for a wavelength of 1064 nm. O'Connor et al. (2004) calculated an S of 18.8±0.8 sr for a wavelength of 905 nm and showed that this was essentially constant for the observed cloud droplet size distribution for a mean droplet size ranging from 10 to 50 µm, but S values were lower for drizzle having larger droplets. Since S is very similar at 905 and 1064 nm, we follow O'Connor et al. (2004) and use S=18.8 sr for both wavelengths.
The method compares this theoretical S to a calculated apparent S. When the ceilometer signal is completely extinguished by the cloud, the total path integrated attenuated backscatter B is equal to the reciprocal of twice the lidar ratio:
where B is the total integrated attenuated backscatter, τ is the optical thickness, S is the theoretical lidar ratio, and η is a multiple-scattering correction which is dependent on laser wavelength, beam divergence, telescope field of view and altitude (z). The multiple-scattering corrections are height dependent and calculated for each gate using the fast method and code described by Hogan (2006; code available to download at http://www.met.reading.ac.uk/clouds/multiscatter/, last access: 15 October 2018). η is usually between 0.7 and 0.85 for wavelengths between 905 and 1064 nm in liquid water clouds. The calibration technique involves multiplying the observed backscatter signal βobserved by a calibration coefficient, C, until Bη=0.0266 m−1, which is the value for water drops when S=18.8 sr. Note that C is a scaling factor and is the reciprocal of the widely used calibration constant, CL, which is often used for photon-counting receivers and is the factor by which the count should be divided to obtain a calibrated value (e.g. Wiegner et al., 2014).
The calibration technique will fail if there are targets contributing to B that have an S that is not equal to 18.8 sr. At ceilometer wavelengths, aerosols generally have S values above those for cloud droplets; marine aerosols have an S close to 20 sr, but most aerosols have values that are much higher and in the range 40 to 100 sr for dust, smoke and ash (e.g. Omar et al., 2009). If aerosols with S higher than 18.8 sr are included in profiles leading to total attenuation of the signal, then the value of B will be less than for cloud alone, and the apparent value of the calibration coefficient, C, will be too high. Conversely, drizzle has S values below those for cloud droplets, so if drizzle is included in the profile, the value of B will be higher than for cloud alone, and the value of C would be too low. The magnitude of the error due to aerosol depends on its optical depth beneath the cloud layer; therefore, we can circumvent this uncertainty by not selecting profiles which have large backscatter from aerosol. The inclusion of profiles that do not totally extinguish the ceilometer return will also lead to values of C that are too high, as will occasions when the window transmission is reduced or the pulse energy falls.
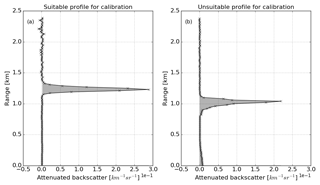
Figure 2Profiles of attenuated backscatter through stratocumulus cloud. Panel (a) shows an example of a suitable profile for calibration. The integral of the profile (grey shaded area) is equal to and, when calibrated, should give an S of 18.8±0.8 sr. Panel (b) shows an example of a profile unsuitable for calibration due to the high levels of aerosol in the first 200 m, indicated by the grey shading up to 200 m, and due to the drizzle below the stratocumulus cloud, indicated by the slight increase in attenuated backscatter underneath the peak.
Figure 2a shows an example of an uncalibrated attenuating backscatter profile typical of those from stratocumulus clouds that is ideal for use in the liquid cloud calibration algorithm. Cloud is observed as the sharp peak in attenuated backscatter just above the cloud base, rising to a maximum value of 0.28 within a few range gates and clearly dominating the observed ceilometer return. The shaded area indicates the area of integration used in computing the total attenuated backscatter of the profile. The profile in Fig. 2b is for a stratocumulus cloud that completely attenuates the ceilometer return. However, in this case, it is unsuitable for calibration because there is a significant return from aerosol in the lowest 200 m of the profile and a more gradual increase in attenuated backscatter below the peak at the cloud base, indicating the presence of drizzle below the cloud.
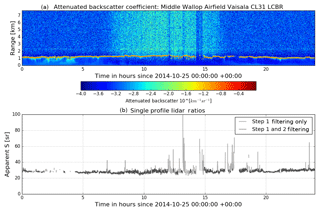
Figure 3(a) Uncalibrated attenuated backscatter vertical profiles (colours shown on a log scale) for 25 October 2014 from a CL31 ceilometer at Middle Wallop airfield (51.1489∘ N, 1.5700∘ W) and (b) the apparent lidar ratio for the same day. In (b), the grey line shows the apparent S for profiles that pass the step 1 filtering of the calibration algorithm and the black line shows the profiles that pass the step 2 filtering and are used to calculate the calibration coefficient.
A new algorithm has been designed to automatically sift through all profiles of attenuated backscatter, selecting only those suitable for the cloud calibration according to a strict set of criteria. The method is fairly simple, ensuring that it can be applied operationally with minimal impact on processing time. No absolute values of βatt are required by the algorithm to evaluate the criteria below, so the instrument can be completely uncalibrated, or the calibration currently applied can have a large error. The algorithm only requires a minimum of 10 suitable profiles in a day for a calibration coefficient to be calculated. This means the calibration algorithm is suitable for ceilometers at sites where liquid water cloud can be sparse and infrequent. There are two main sets of criteria that must be met by the profile of attenuated backscatter for it to be used to calculate a calibration coefficient:
-
Unsuitable individual profiles.
- a.
Aerosol filter. In any single profile, if the aerosol under the cloud contributes more than 5 % to the total integrated backscatter (as shown in Fig. 2b), then this profile is removed from the calibration. The transmission through the aerosol below the cloud attenuates the ceilometer beam and this attenuation increases with greater concentrations of aerosol. If the aerosol has a lidar ratio value twice the value assumed for cloud droplets, then this filter should limit the calibration error to a maximum of 5 %.
- b.
Peak sharpness filter. The peak backscatter magnitude must be a factor of 20 greater than the value 300 m above and below that peak. A liquid water cloud suitable for calibration must fully attenuate the ceilometer beam; therefore, the backscatter values should decrease rapidly in the gates immediately above the peak value. Additionally, drizzle or rain below the cloud may give a large backscatter signal and, like the aerosol, will distort the apparent lidar ratio. Hogan et al. (2003) report that individual liquid-water layers do not tend to occupy more than 300 m of the ceilometer profile due to their strong attenuation. Our own observations of the data lead to the same conclusion. This filter should therefore remove profiles that do not fully attenuate the beam and those that contain drizzle or rain.
- c.
Window transmission and pulse energy check. A check is made on the recorded instrument transmission (given as a percentage of how much of the instrument window is clear) and on the reported pulse energy (given as a percentage of a nominal amount). Both of these conditions can affect the true value of attenuated backscatter. For considering instrument and calibration stability, periods affected by reduced window transmission and/or reduced pulse energy are filtered out at a threshold of 90 %. For quantitative calibrations and observations of backscatter it is essential that the window be kept clean. It may be possible to correct the observed backscatter for low pulse energy but seems most unlikely that corrections can be made for the low window transmission because any dust or dirt covering on the window is probably not homogenous. It may be difficult to keep the window clean in locations where dust is common.
- a.
-
Consistency of neighbouring profiles.
- a.
Lidar ratio stability. This filter traps errors due to patchy cloud cover or drizzle that may not have been identified by the first filter by checking that the apparent lidar ratio is the same as its nearest neighbours. The recommendation is to compare to three profiles on either side; however, if the ceilometer is at a site where liquid water cloud is infrequent, this could be reduced to one or two profiles either side, with consequent degradation of the accuracy of the calibration coefficient. There must be at least 10 acceptable profiles for a calibration coefficient to be recorded for that day.
- a.
The operation of these filtering procedures in removing unsuitable profiles is illustrated in Fig. 3a, where a stratocumulus cloud layer located at about 1 km for the whole day is ideal for calibration. The liquid cloud backscatter signal, which has values greater than 10−0.5 (in the red region of the colour scale), appears as a thin layer above which there is only noise. Within the noise, the diurnal cycle of the skylight is visible. The noise in the data is visible as speckling and is of the magnitude of less than 10−3 . There are also limited periods of broken, patchy cloud, which are identifiable by breaks in the layer of high backscatter, and limited periods of drizzle, which are identifiable by the fall streaks (cyan colours of the order 10−2.5 ) below the cloud.
Figure 3b illustrates the two main filtering steps of the new calibration algorithm. The thick, light grey line shows the apparent S values for each individual profile that is acceptable and has removed those profiles between 3.30 and 4.30 h where there is drizzle and aerosol below the cloud base, but this still leaves some large apparent S values from 12.00 to 15.00 h that are due to broken cloud that does not totally extinguish the ceilometer return. The second filter checks for consistency between neighbouring profiles and successfully identifies and removes these spurious profiles where there is broken cloud.
The remaining profiles (i.e. those in black in Fig. 3b) give the values of apparent S which would be used to calculate C using Eq. (1). It is evident that these values remain very constant over the course of the day, implying that the calibration of the instrument is very stable on this time scale. This is important, since our method can only be applied during cloudy conditions, which may be separated by intervals of several days. The stability of C implies we can interpolate between calibration events.
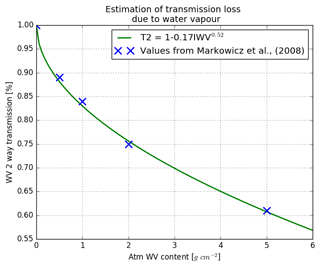
Figure 4Estimated transmission loss due to the atmospheric water vapour content. The blue crosses are the values calculated by Markowicz et al. (2008) for a ceilometer with a wavelength of 910 nm.
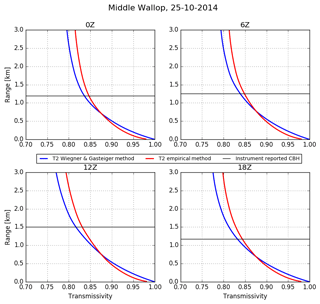
Figure 5Comparison of water vapour transmission correction methods using ECMWF water vapour density profiles for 25 October 2014 at Middle Wallop, England. In blue, the transmissivity is calculated using WAPL (Wiegner and Gasteiger, 2015) and in red the transmissivity has been calculated using the empirical function shown in Fig. 4. The black lines show the instrument-reported cloud base height at that time.
4.1 Water vapour attenuation
To complete the calibration of the Vaisala CL31 ceilometers (and others of similar wavelength – e.g. Vaisala CL51, CT25k, CT75k, Campbell Scientific CS135), the effect of atmospheric water vapour below the cloud on the laser signal must be considered. This is because the wavelength of these ceilometers (910 nm) is in a weak water vapour absorption band. Note that, because the Lufft CHM15k ceilometers operate at 1064 nm, where there is a water vapour absorption window, those ceilometers do not require a correction; however, the Lufft CHM8k operates at 905 nm and so would require a water vapour absorption correction.
A recent paper by Wiegner and Gasteiger (2015) describes a method of correcting for water vapour attenuation for ceilometers at wavelengths around 910 nm by performing detailed line-by-line radiation transfer calculations and investigating the impact of the instrument emission spectrum (e.g. Vaisala states that for a CL31 the wavelength is 910±10 nm at 25 ∘C and with a drift of 0.3 nm K−1). As the housing of the ceilometer lasers and detectors are temperature-controlled environments, the effect of laser wavelength drift due to temperature can be considered insignificant. However, even if the potential for drift is ignored, Wiegner and Gasteiger's method still requires the use of a radiative transfer model or access to their WAPL database of absorption coefficients. Because the liquid cloud calibration method presented in this paper is intended for operational, real-time use, a simple, robust and computationally cheap method was required.
A simplified technique for correcting for the two-way water vapour attenuation has therefore been devised based on Markowicz et al. (2008), who show that the normalised spectrum of laser emission is wide enough to smooth out the individual water absorption lines so that, for a water vapour path of 2 cm, a typical summer value in the UK, the change in water vapour transmission varies from about 0.77 to 0.75 (about 3 %) as the peak laser emissivity increases from 900 to 916 nm. The typical water vapour path in winter is 1 cm leading to a transmission of about 0.85, so if no water vapour correction was made, one would expect an apparent annual cycle of the calibration coefficient of about 12 %. The water vapour could be estimated using a microwave radiometer. Alternatively, it can be obtained from a numerical weather prediction (NWP) model. In this paper we take the latter approach. Cossu et al. (2015) have compared NWP output with the water vapour path derived from microwave radiometers and find that the mean bias of the NWP water vapour path is only 0.7 mm.
A simple monotonic function has been fitted to data from Markowicz et al. (2008) in order to parameterise the two-way attenuation by water vapour as a function of integrated water vapour (IWV) up to 2 cm at wavelengths of ∼910 nm depicted in Fig. 4:
where Twv is the two-way transmission as a percentage of the transmission without water vapour attenuation and IWV(z) is the atmospheric water vapour content from the surface to height z in g cm−2. The attenuated backscatter is then corrected using the following:
where . The transmission calculation for each range gate requires the water vapour content obtained by integrating the water vapour density from the ground to each specific range gate, resulting in a transmission profile. For the automatic operational calibration of the Met Office ceilometers, water vapour density would be calculated from the Met Office UKV model, a convection-permitting variable-resolution regional NWP model run operationally over the UK (Tang et al., 2013), using pressure, temperature and specific humidity. A comparison of the detailed line-by-line Wiegner and Gasteiger method with the simpler approach using the water vapour density profiles obtained from the ECMWF operational forecast model provided by Maxime Hervo (MeteoSwiss, personal communication, 2016) is shown in Fig. 5. The WAPL method is depicted in blue and the new, simple method is in red. The transmissivity profiles differ by a maximum of 2 % for a total transmissivity of 0.85.
4.2 Region of integration
For the Vaisala ceilometers in the Met Office network, a cosmetic feature in the firmware suppresses the range correction to the received power for heights above 2.4 km, except when there are clouds present. This is done to avoid the background noise signal leading to apparent clouds at high altitudes that might confuse the non-expert, so for the calibration procedure, profiles above 2.4 km are not suitable as the return signal may not have been range corrected. In addition, Kotthaus et al. (2016) found that the attenuated backscatter in the lowest 200 m may be subject to artefacts so, in this calibration study of the Met Office's Vaisala ceilometers, the cloud returns above 2.4 km and below 200 m are not used.
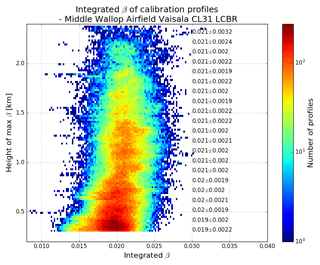
Figure 62-D histogram of integrated attenuated backscatter with range, with height-dependent multiple-scattering correction applied. Darker colours (towards red) indicate a higher density of profiles. The values shown along the right-hand side give the mean±SD of the integrated attenuated backscatter (units sr−1) at 100 m intervals.
Figure 6 shows a histogram of the integrated attenuated backscatter, B, from liquid cloud as a function of the height of the maximum attenuated backscatter (used as an indicator of the height of the cloud), for profiles from an uncalibrated Met Office Vaisala CL31 situated at Middle Wallop (51.15∘ N, 1.57∘ W). Multiple scattering and water vapour attenuation below the cloud have been accounted for. Over 100 000 profiles were used from the period September 2014 to December 2015. The numbers superimposed on the right side of the plot show the mean and standard deviation (SD) at 100 m intervals of the range. For 16 of the 21 heights shown, the mean value is 0.021 sr−1. The other five gates differ by a maximum of only 0.002 sr−1. This provides confirmation, both of the validity of the range-dependent multiple-scattering correction and the assumption of constant S for different water clouds.
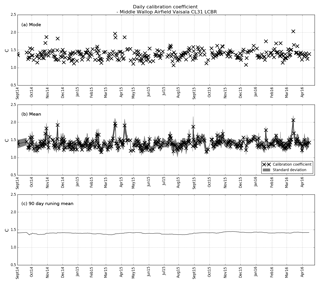
Figure 7Calibration coefficient (C) for Middle Wallop CL31 from September 2014 to April 2016. Each black cross represents a single day, calculated from profiles deemed suitable by the calibration algorithm. Panel (a) shows the mode of C for each individual day, (b) shows the mean of C for each day, with the standard deviation shaded in grey and (c) shows a 90 d running mean for the 20-month period. The average of the daily modes is 1.38±0.14, the average of the daily means is 1.41±0.13 and the average of the 90 d running means is 1.40±0.021. The water vapour absorption correction has been applied, without which there would be an annual cycle in the calibration of about 12 %.
Below 500 m there is, however, a slight change. The distribution of the integrated attenuated backscatter is still concentrated in a similar region to other heights, but it also has a slight tail to the left. For profiles in this tail region below 500 m, the attenuated backscatter is smaller, which will result in a larger apparent lidar ratio. The mean value of the integrated attenuated backscatter at heights below 500 m decreases by 9.5 %, with the standard deviation increasing by 17 %. We suspect that this is a result of the instrument detector saturating or maybe range-dependent multiple scattering not being calculated correctly at close ranges because of imperfect telescope alignment. When the cloud is very low, the cloud signal may be so strong at its peak that the true magnitude of the backscattered signal is not fully detected and, therefore, the integrated attenuated backscatter appears smaller when compared to other heights. It is also possible that this may, occasionally, be due to microphysical processes within the cloud. Nicholls (1984) showed that there is a reduction in droplet number concentration below 450–500 m (Powlowska et al., 2000). This may, in some cases, be significant enough to affect the backscatter at this height. Therefore, we also reject profiles where the cloud is between 200 and 500 m.
4.3 Calibration results for Middle Wallop
Figure 7 shows a time series of the calibration results for the CL31 at Middle Wallop in southern England over a period of 20 months. The top panel shows the mode of the calibration coefficient, C, for each day with sufficient (minimum 10) attenuated backscatter profiles deemed suitable by the calibration algorithm. For example, the black cross on 25 October 2014 is the mode of the calibration coefficients calculated from the filtered S values (per profile) shown (in black) in Fig. 3b.
The results are for almost 2 years of data and establish that the calibration remains stable over time. The number of profiles used for the calculation of the daily value is different depending on the occurrence of cloud on each day. As the calibration algorithm requires only a minimum of 10 profiles to be included in the daily value of the mode, even a short period of cloud will be included for calibration purposes. This ensures that the technique can be applied to ceilometers in locations with climates that have relatively little cloud occurrence. For this site, the algorithm found a minimum of 8 d every month with profiles suitable for calibration, with slightly more suitable days during autumn and winter. The water vapour correction profiles are calculated from the Met Office UKV model at the grid point over the Chilbolton Observatory, which is approximately 15 km from Middle Wallop. The variables needed to calculate the transmission profiles were available every hour and have been interpolated to the observational time.
The middle panel of Fig. 7 shows the daily mean and standard deviation for the same station and data. For the 20-month (574 d of data available) period, a calibration was possible on 320 d, or 56 % of the days, and the average number of profiles per day was 292. There were just 7 d out of the 320 when the calibration coefficient, C, was approaching 2.0 rather than the median value of 1.4, so a 90 d running mean was calculated and is displayed in the lower panel of Fig. 7. This running mean had a value of C of 1.40 with a standard deviation of 0.021; this is less than 2 % of the mean. The 2 % of outliers all have high lidar ratios: they are probably from occasional profiles that do not completely attenuate the lidar signal. As both the mean height of the cloud base (and therefore the amount of multiple scattering) and the water vapour attenuation have a pronounced annual cycle, this low value of standard deviation is evidence of the appropriateness of the algorithms that correct for these two effects. Accordingly, it is recommended that for automatic, operational use for a ceilometer, without window transmission or pulse energy issues, a 3-month running average of the calibration coefficient be used.
4.4 Calibration results for the Met Office network
The calibration of all the Vaisala CL31 ceilometers in the Met Office network has been collated and is summarised in Fig. 8, where box and whisker plots are shown of the calibration coefficient for each of the CL31s, calculated from data for the period January–March 2015. All instruments have a calibration coefficient larger than 1.0, with the majority of the instruments having a coefficient of around 1.5. The range of coefficients for each station is small, with 50 % of the data (contained within the box) being within 10 % of the mean value. The anomalously high-calibration coefficients for Benson and Exeter are probably due to some unknown instrument malfunction as the window transmission and transmit power are recorded as normal. The large value of the calibration coefficient is correcting for this effect but also flags that there is a malfunction in the instrument. The colour code in Fig. 8 indicates the different firmware versions installed on the instruments within the Met Office ceilometer network. Stations using the 202 firmware, which are shaded pink (for example, Aberporth, Coningsby, Middle Wallop), tend to have an even smaller range of C values, with 50 % of the data being within 8 % or less of the mean. The network includes stations from Lerwick (60.16∘ N, 1.15∘ W) down to Gibraltar (36.14∘ N, 5.35∘ W), demonstrating that the calibration method has been successfully applied to a range of different climates, from the North Sea down to the Mediterranean Sea and from both coast and inland sites.
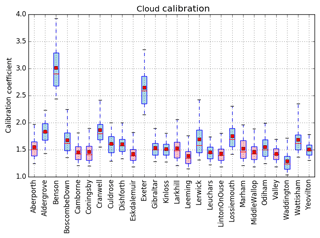
Figure 8Calibration coefficient for each of the CL31 ceilometers in the UK Met Office network: 3 months of data (January–March 2015) have been used for each instrument. The number of suitable calibration profiles will be dependent on occurrences of cloud and, therefore, will vary for each instrument. The box outline represents 50 % of the calibration profiles and the whiskers extend to include 95 % of the profiles (outliers have been excluded from plot). The horizontal red line in the box shows the median calibration coefficient and the smaller, filled box shows the mean. The box plot is shaded by firmware version as given by the ceilometer files on 1 January 2015: pink for version 202 and blue for versions 170 and 172.
The water vapour correction of the data has been applied for the calibrations depicted in Fig. 8, as described in Sect. 4.2. Ideally, the water vapour profiles for each specific site should be used to calculate the transmission correction. Due to data availability, only the model data for Chilbolton were available at this time. As the calibration specifically requires a cloud base below 2.4 km and the air is generally well-mixed below the cloud base, the water vapour path mixing is generally fairly constant and depends on the temperature and height of the cloud base. Therefore, it is assumed that the season is more important than the location and so the same water vapour profiles are used for all the ceilometers. In future, for operational implementation, the site-specific vapour profile would be used.
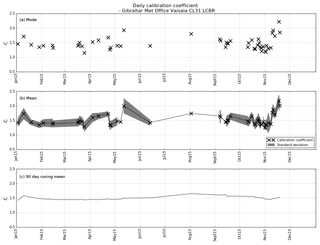
Figure 9Calibration coefficient (C) for Gibraltar CL31 from January to December 2015. Each black cross represents a single day, calculated from profiles deemed suitable by the calibration algorithm. Panel (a) shows the mode of C for each individual day, (b) shows the mean of C for each day, with the standard deviation shaded in grey and (c) shows a 90 d running mean for the 12-month period. The average of the daily modes is 1.48±0.21, the average of the daily means is 1.51±0.19 and the average of the 90 d running means is 1.50±0.053.
Figure 9 shows the calibration of the Gibraltar CL31 ceilometer in more detail and has the same format as Fig. 7, for 12 months at Gibraltar rather than the 20 months at Middle Wallop. As the UKV does not cover Gibraltar, the water vapour correction was calculated using data from the Met Office Global Unified Model. Due to the climate, the number of occasions when there are suitable clouds for calibration is reduced at the Gibraltar site. In 1 year there were 51 d of suitable clouds, with each day having on average 128 profiles. However, from mid-May to mid-September there were only 2 days on which calibration was possible and in December there were none. While this is in part due to a lower amount of stratocumulus compared to the UK, it was also caused by the window transmission. The Gibraltar ceilometer requires regular cleaning as the dust tends to build up on the window, reducing the transmission. Therefore, several days on which the window transmission dropped below 90 % have been filtered out by the algorithm. The four crosses in Fig. 9a and b which show a calibration coefficient closer to 2.0 correspond to days on which the profiles only just pass the 90 % window transmission check. Nevertheless, Fig. 9c confirms that the 90 d running mean calibration coefficient over the 12-month period was 1.5 with a standard deviation of 0.05, or about 3 %, and, as with the data in Fig. 7, there is no sign of an annual cycle in the calibration coefficient.
We now address the issue of cloud calibration for the Lufft CHM15k ceilometers, which operate at a wavelength of 1064 nm. It should be noted that many high-power lidars have a channel at 1064 nm and can also be calibrated with the liquid cloud method. However, as they do not have the same firmware and hardware issues as ceilometers, high-power lidars are not directly discussed here.
5.1 Saturation issue
Before the cloud calibration can be applied to the Lufft ceilometers, the issue of saturation must be addressed. Due to the greater pulse energy (compared to Vaisala ceilometers) and the receiver type (photon counting), the Lufft ceilometers are much more prone to saturation (Whiteman, 2003). When saturation occurs, the backscatter reported for this profile is false – it is too low. Hence, these profiles that saturate need to be avoided. The exact magnitude of power at which the Lufft power saturates is unknown. However, it is possible to detect the majority of saturated profiles, because the saturation of the receiver usually causes the output to overshoot to an unphysical negative value just above the cloud echo (Holger Wille, Lufft, personal communication, 2017).
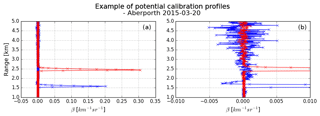
Figure 10Two profiles of attenuated backscatter that detect liquid cloud from the Lufft CHM15k ceilometer at Aberporth on 20 March 2015 (b shows same plot on different scale). The profile in blue has a negative overshoot above the cloud, whereas the red profile does not.
The first panel of Fig. 10 demonstrates the impact of saturation and the subsequent negative overshoot: the blue profile, from the lower cloud base where saturation has occurred, has a smaller magnitude than the red profile of the higher cloud that has not saturated. If a saturated profile were to be used for calibration, then the total attenuated backscatter recorded by the ceilometer would appear lower than an unsaturated profile and would, therefore, systematically skew the calibration coefficient to be larger than it should be.
Because the profiles that saturate have this apparent layer of negative attenuated backscatter, this can be used to check if these profiles should be used in the calibration algorithm. There is a correlation between the negative backscatter and the magnitude of saturation: the larger the negative backscatter value, the greater the magnitude of saturation, but this relationship is not linear and so the saturation cannot be easily corrected (Holger Wille, Lufft, personal communication, 2017). Hence, in what follows, we simply filter out such profiles completely. To ensure it is the negative attenuated backscatter of a saturated profile that is detected and not just the random noise in the profile above the cloud (which appears as small positive and negative values varying randomly from gate to gate), any profiles which have a layer of negative backscatter greater than 100 m are removed from the calibration. To increase confidence that only unsaturated profiles are used, a cloud height threshold was also imposed, as demonstrated in Fig. 11; this shows a histogram of the uncalibrated integrated attenuated backscatter for profiles in liquid water cloud at Aberporth. The multiple-scattering correction has been applied, but profiles where the instrument saturates have not been filtered out. Therefore, one can see clearly the impact of saturation.
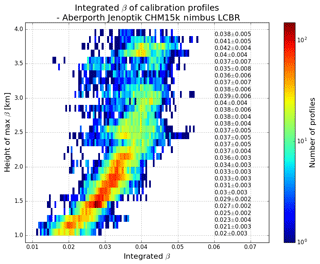
Figure 11As for Fig. 6 but illustrating the saturation of the CHM15k ceilometer for most clouds with bases below 2 km. 2-D histogram of the value of the integrated attenuated backscatter in profiles used for calibration with range. A height-dependent multiple-scattering correction has been applied. Darker colours (towards red) indicate a higher density of profiles. The values shown along the right-hand side give the mean±SD of the integrated attenuated backscatter (units sr−1) at 100 m intervals.
As shown for the Vaisala ceilometer calibration (Fig. 4), the integrated attenuated backscatter should be a constant, independent of the height. This is not the case for the Lufft ceilometer. This is because when the instrument saturates, the received power becomes limited to some (unknown) maximum power. Backscatter is proportional to received power × range2, which means the integrated backscatter measured will appear to be a function of range. This is in contrast to the Vaisala ceilometer in Fig. 6, where saturation is not occurring. Therefore, Fig. 11 shows that saturation is occurring below a height of 2.2 km because of the systematic change in backscatter with range. Above 2.2 km, the integrated backscatter does not change systematically with height, showing that these higher-level clouds are not saturating the ceilometer receiver – since they are further away, the received power is weaker and below the level at which saturation occurs. The exact height at which the integrated attenuated backscatter becomes constant will be instrument-specific as it will be dependent on instrument power and on the individual receiver. However, with this simple test, the height threshold required can be easily found, thus allowing for the saturated profiles to be removed and calibration to be correctly calculated.
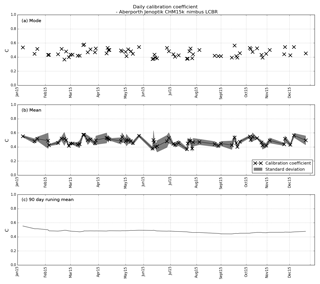
Figure 12Calibration coefficients for the Lufft CHM15k nimbus ceilometer at Aberporth (52.06∘ N, 4.33∘ W). Each black cross represents a single day, calculated from profiles deemed suitable by the calibration algorithm. Panel (a) shows the mode of C for each individual day, (b) shows the mean of C for each day, with the standard deviation shaded in grey and (c) shows a 90 d running mean for the 12-month period. The average of the daily modes is 0.46±0.05, the average of the daily means is 0.48±0.05 and the average of the 90 d running means is 0.48±0.02.
5.2 Calibrated results of the Lufft CHM15k ceilometers
The calibration algorithm can now be applied to the Lufft ceilometers in a way similar to the calibration of the Vaisala ceilometers. A couple of changes are included. The Lufft ceilometers have a range correction applied to the full attenuated backscatter profile; therefore they are not restricted by a change in processing at 2.4 km. The upper range limit of integration to compute B is increased to 4 km, which incorporates the vast majority of liquid clouds in the UK. Additionally, the higher cloud range means the ceilometer beam must travel through a larger portion of the atmosphere, so the ratio filter (criterion 1a) is increased from 5 % to 10 %. Note that this may lead to a slightly larger uncertainty in C, but we choose to make this compromise in order to obtain a reasonable number of calibration estimates per month. The lower height limit is also changed, so that clouds below 1 km are not used. This is to avoid using profiles in the region where an overlap correction is applied as there is a potential temperature dependency in the overlap function that has not been accounted for (Hervo et al., 2016). The lower height limit is often higher than 1 km, however, due to the instrument-specific region of saturation.
At the 1064 nm wavelength there is no absorption by the water vapour molecules, so no water vapour correction is required. Figure 12 shows an example of the cloud calibration applied to a Lufft CHM15k ceilometer situated at Aberporth, west Wales, for the 12 months of 2015. Because of the requirement to remove the low-level clouds that resulted in saturation, calibration was only possible on 70 d or about 20 % of the days. Each day had an average of 58 profiles; nevertheless, the 90 d running mean calibration coefficient over the year was 0.48 with a standard deviation of 0.02 % or 4 %, with no sign of any annual cycle. This standard deviation of 4 % over the year is slightly higher than for the Vaisala ceilometers, probably because of the relaxation of the threshold required for aerosol to be considered negligible, but is well within the specified requirement of 10 %.
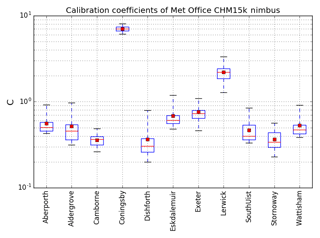
Figure 13Calibration coefficient for each of the CHM15k Nimbus ceilometers in the UK Met Office network: 3 months of data (January–March 2016) have been used for each instrument. The number of suitable calibration profiles will be dependent on occurrences of cloud and therefore will vary for each instrument. The box outline represents 50 % of the calibration profiles and the whiskers extend to include 95 % of the profiles (outliers have been excluded from plot). The horizontal red line in the box shows the median calibration coefficient and the filled box shows the mean.
The calibration has been applied to the rest of the Lufft ceilometers in the Met Office ceilometer network, as shown in Fig. 13. Most of the sites have a relative calibration of less than 1.0; however, Coningsby has a particularly large calibration coefficient. This highlights the importance and need for a calibration of each instrument. For each site, the relative standard deviation is small.
The majority (9 out of 11) of the Lufft ceilometers are collocated with a Vaisala ceilometer, allowing comparisons between the two types. Figure 14 compares the observations of attenuated backscatter from the two ceilometers at Aberporth, which have both been calibrated using the cloud method. To make a fair comparison between the two instruments, it is necessary to choose the meteorological situation carefully. Aerosols are problematic, because the ceilometers operate at different power, different detector sensitivities and different wavelengths, and the backscatter from aerosols is wavelength-dependent in a way that we do not know a priori. We could analyse profiles in liquid clouds; however, we have already used these for calibration (so it would not be a truly independent test). In addition, the backscatter profile in liquid clouds contains very large gradients which make any comparison extremely sensitive to small offsets in range and/or differences in range-gating between the two instruments. Rain profiles could potentially be used for the comparison: however, rain which reaches the ground may wet the telescope optics and affect the data.
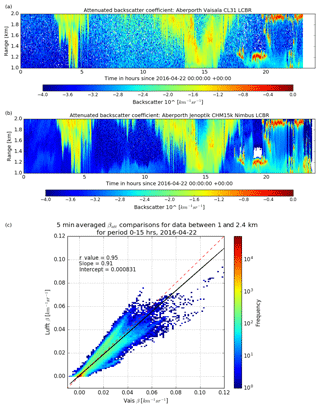
Figure 14Quicklooks for the observed attenuated backscatter between 1 and 2 km are shown for the (a) Vaisala ceilometer and the (b) Lufft ceilometer. Panel (c) shows 5 min averaged attenuated backscatter comparison for the Lufft and Vaisala ceilometers situated at Aberporth for 22 April 2016 between 00:00 and 15:00 GMT. The colour scale indicates the number of data points. Vaisala data have been corrected for water vapour attenuation and difference in wavelength and have been interpolated to match the resolution of the Lufft ceilometer. The black line shows the linear fit of the data and the dashed red line is the 1:1 line.
Better targets for such comparisons are drizzle drops and ice particles. Drizzle drops are large compared to the wavelength of the lidar and hence the scattering is almost wavelength-independent for 1064 and 910 nm lidars (since we are close to the geometric optics regime), as shown by Westbrook et al. (2010a). At the same time, the extinction of the lidar beam is much more gradual than in liquid cloud, providing smoothly varying backscatter profiles, which can be interpolated onto a common grid with little error. If we use an ice case, we would need to account for the influence of specular reflections from oriented ice crystals (e.g. Westbrook et al., 2010b). Therefore, in this example, a drizzle scene has been chosen. The code of Hogan (2006) confirms that for drizzle, multiple scattering is negligible.
To establish quantitatively whether the backscatter for drizzle drops at 1064 and 910 nm are actually equal, Mie calculations were performed, assuming Gamma drop size distributions (Westbrook et al., 2010a). The results show that the backscatter at 1064 nm is very similar to that at 910 nm but systematically smaller. The differences are very modest: between 5 % and 8 % for median drop diameter in the range 0.1–0.6 mm, with most of the calculated values in this range close to 7 %. Meanwhile the extinction is essentially identical for both wavelengths. Thus, if the calibration has been successful it would be expected that the backscatter profiles in drizzle would match very closely. However, the Lufft is systematically 7 % smaller than the Vaisala if no adjustment to account for the different wavelengths is made. Therefore, for this comparison, the Vaisala attenuated backscatter data have been reduced by 7 %.
It is also necessary to consider the various technical issues already discussed earlier in the article when selecting profiles, in particular the need for the drizzle to be high enough to be in the fully overlapped region for the Lufft instrument, and below the 2.4 km height, above which the Vaisala ceilometer data range correction is variable. Therefore, the data used cover the period 00:00 to 15:00 GMT on 22 April 2016, during which time there is drizzling cloud. The data are 10 min averages of attenuated backscatter between 1.0 and 2.4 km and the Vaisala data have been regridded from 20 m resolution to 15 m resolution using linear interpolation. The quicklooks of the attenuated backscatter for the Vaisala and Lufft ceilometers are shown in Fig. 14a and b.
Figure 14c shows a joint histogram of the attenuated backscatter measured by the two instruments. If the calibration of both instruments has been successful, we expect the data to lie around the 1:1 line (dashed red line), and indeed our data do lie close to this line. Performing a linear regression of the backscatter values from the two instruments, we find an intercept very close to zero, a slope of 0.91 and a high correlation coefficient of 0.95. This indicates that our calibration process has been successful and that the combined errors in the calibrations from both instruments together are less than 10 %. The spread of the individual data points is rather larger than 10 % and can be accounted for by the different resolutions and interpolation errors. This comparison of the two different types of ceilometers confirms the reliability of this calibration method – the two independently calibrated ceilometers, each with their own challenges (e.g. water vapour, saturation), are consistent with each other. This result is important for an operational network such as the Met Office ceilometer network because it helps maintain a reliable, comparable stream of calibrated data, with water vapour and saturation successfully accounted for, from each instrument at each site.
In this paper, we have presented a robust algorithm to calibrate ceilometers based on the cloud calibration technique that relies on the fact that the lidar ratio of liquid water clouds is a known constant. This new method can be run operationally, removing unsuitable profiles where the cloud does not fully attenuate the ceilometer beam or where there is significant backscatter from aerosols. By excluding profiles when the low cloud leads to instrument saturation (particularly in the Lufft instruments) or when the window transmission is low, and by accounting for the attenuation of the ceilometer beam by water vapour (in the Vaisala instruments), we show that ceilometers from different manufacturers can be successfully calibrated using this method. Instrument malfunction can be identified by sudden changes in calibration. If either the window transmission or the pulse energy falls below 90 % of normal values, then clearly the instrument sensitivity and the calibration will be different. When the window transmission falls below 90 % the backscatter becomes noisy, probably due to the inhomogeneous nature of the layer of dust or dirt on the window. Consequently it is essential that the window is kept clean if reliable data are to be obtained. If the pulse energy falls below 90 %, then it should be possible to correct the backscatter signal, but the precise accuracy of this technique remains to be determined.
It has been demonstrated that the running 90 d mean calibration coefficient for each instrument over a year is constant to better than 5 % with no detectable annual cycle. At the time of writing, profiles from 200 ceilometers from 17 countries are being distributed in near real time by the E-Profile programme of European Meteorological Services Network (EUMETNET) with the number expected to rise to about 700. E-Profile has decided to calibrate the Vaisala ceilometers using the cloud calibration technique described in this paper.
The Met Office data are available via BADC CEDA at http://data.ceda.ac.uk/badc/ukmo-nwp/data/ukv-grib (last access: 20 November 2018) and
http://www.ceda.ac.uk/blog/new-dataset-met-office-lidarnet-ceilometers (last access: 20 November 2018).
EH wrote the paper. All authors contributed to the scientific ideas in the paper EH and CCP wrote the code to perform the calibration. CCP and SB provided EH with access to observational data. All authors discussed the results and edited the manuscript.
The authors declare that they have no conflict of interest.
The authors would like to acknowledge the contribution of the COST Action ES1303 (TOPROF) and in particular Ewan O'Connor and Maxime Hervo for many helpful discussions. We would also like to thank Mariana Adam, Joelle Buxmann and Jacqueline Sugier (Met Office) for their help and support during this PhD project.
This research has been supported by the NERC Industrial CASE (grant no. F4027100).
This paper was edited by Andrew Sayer and reviewed by two anonymous referees.
Brown, P. R. and Francis, P. N.: Improved measurements of the ice water content in cirrus using a total-water probe, J. Atmos. Ocean. Tech., 12, 410–414, 1995.
Cossu, F., Hocke, K., Martynov, A., Martius, O., and Mätzler, C.: Atmospheric water parameters measured by a ground-based microwave radiometer and compared with the WRF model, Atmos. Sci. Lett., 16, 465–472, 2015.
Dupont, J. C., Haeffelin, M., Protat, A., Bouniol, D., Boyouk, N., and Morille, Y.: Stratus–Fog Formation and Dissipation: A 6-Day Case Study, Bound.-Lay. Meteorol., 143, 207–225, 2012.
Hervo, M., Poltera, Y., and Haefele, A.: An empirical method to correct for temperature-dependent variations in the overlap function of CHM15k ceilometers, Atmos. Meas. Tech., 9, 2947–2959, https://doi.org/10.5194/amt-9-2947-2016, 2016.
Hogan, R. J.: Fast, approximate calculation of multiply scattered lidar returns, Appl. Optics, 45, 5984–5992, 2006.
Hogan, R. J., Illingworth, A. J., O'Connor, E. J., and Baptista, J. P. V. P.: Characteristics of mixed-phase clouds. II: A climatology from ground-based lidar, Q. J. Roy. Meteor. Soc., 129, 2117–2134, 2003.
Illingworth, A. J., Cimini, D., Gaffard, C., Haeffelin, M., Lehmann, V., Löhnert, U., O'Connor E. J., and Ruffieux, D.: Exploiting Existing Ground-Based Remote Sensing Networks to Improve High-Resolution Weather Forecasts, B. Am. Meteorol. Soc., 96, 2107–2125, 2015.
Illingworth, A. J., Cimini, D., Haefele, A., Haeffelin, M., Hervo, M., Kotthaus, S., Löhnert, U., Martinet, P., Mattis, I., O’Connor, E. J., and Potthast, R.: How can Existing Ground-Based Profiling Instruments Improve European Weather Forecasts?, B. Am. Meteorol. Soc., 100, 605–619, https://doi.org/10.1175/BAMS-D-17-0231.1, 2019
Kotthaus, S., O'Connor, E., Münkel, C., Charlton-Perez, C., Haeffelin, M., Gabey, A. M., and Grimmond, C. S. B.: Recommendations for processing atmospheric attenuated backscatter profiles from Vaisala CL31 ceilometers, Atmos. Meas. Tech., 9, 3769–3791, https://doi.org/10.5194/amt-9-3769-2016, 2016.
Madonna, F., Amato, F., Vande Hey, J., and Pappalardo, G.: Ceilometer aerosol profiling versus Raman lidar in the frame of the INTERACT campaign of ACTRIS, Atmos. Meas. Tech., 8, 2207–2223, https://doi.org/10.5194/amt-8-2207-2015, 2015.
Markowicz, K. M., Flatau, P. J., Kardas, A. E., Remiszewska, J., Stelmaszczyk, K., and Woeste, L.: Ceilometer Retrieval of the Boundary Layer Vertical Aerosol Extinction Structure, J. Atmos. Ocean. Tech., 25, 928–944, 2008.
Martucci, G., Milroy, C., and O'Dowd, C. D.: Detection of Cloud-Base Height Using Jenoptik CHM15K and Vaisala CL31 Ceilometers, J. Atmos. Ocean. Tech., 27, 305–318, https://doi.org/10.1175/2009JTECHA1326.1, 2010.
Münkel, C., Eresmaa, N., Räsänen, J., and Karppinen, A.: Retrieval of mixing height and dust concentration with lidar ceilometer, Bound.-Lay. Meteorol., 124, 117, https://doi.org/10.1007/s10546-006-9103-3, 2007.
Nicholls, S.: The dynamics of stratocumulus: Aircraft observations and comparisons with a mixed layer model, Q. J. Roy. Meteor. Soc., 110, 783–820, 1984.
O'Connor, E. J., Illingworth, A. J., and Hogan, R. J.: A Technique for Autocalibration of Cloud Lidar, J. Atmos. Ocean. Tech., 21, 777–786, 2004.
Omar, A. H., Winker, D. M., Vaughan, M. A., Hu, Y., Trepte, C. R., Ferrare, R. A., Lee, K., Hostetler, C. A., Kittaka, C., Rogers, R. R., Kuehn, R. E., and Liu, Z.: The CALIPSO Automated Aerosol Classification and Lidar Ratio Selection Algorithm, J. Atmos. Ocean. Tech., 26, 1994–2014, https://doi.org/10.1175/2009JTECHA1231.1, 2009.
OSCAR: Observing Systems Capability Analysis and Review Tool, available at: https://www.wmo-sat.info/oscar, last access: 27 June 2018.
Pawlowska, H., Brenguier, J. L., and Burnet, F.: Microphysical properties of stratocumulus clouds, Atmos. Res., 55, 15–33, 2000.
Pinnick, R. G., Jennings, S. J., Chýlek, P., Ham, C., and Grandy, W. T.: Backscatter and extinction in water clouds, J. Geophys. Res.-Oceans, 88, 6787–6796, 1983.
Protat, A., Bouniol, D., O'Connor, E. J., Klein Baltink, H., Verlinde, J., and Widener, K.: CloudSat as a Global Radar Calibrator, J. Atmos. Ocean. Tech., 28, 445–452, https://doi.org/10.1175/2010JTECHA1443.1, 2011.
Tang, Y., Lean, H. W., and Bornemann, J.: The benefits of the Met Office variable resolution NWP model for forecasting convection, Met. Apps., 20, 417–426, https://doi.org/10.1002/met.1300, 2013.
Tsaknakis, G., Papayannis, A., Kokkalis, P., Amiridis, V., Kambezidis, H. D., Mamouri, R. E., Georgoussis, G., and Avdikos, G.: Inter-comparison of lidar and ceilometer retrievals for aerosol and Planetary Boundary Layer profiling over Athens, Greece, Atmos. Meas. Tech., 4, 1261–1273, https://doi.org/10.5194/amt-4-1261-2011, 2011.
Westbrook, C. D., Hogan, R. J., O'Connor, E. J., and Illingworth, A. J.: Estimating drizzle drop size and precipitation rate using two-colour lidar measurements, Atmos. Meas. Tech., 3, 671–681, https://doi.org/10.5194/amt-3-671-2010, 2010a.
Westbrook, C. D., Illingworth, A. J., O'Connor, E. J., and Hogan, R. J.: Doppler lidar measurements of oriented planar ice crystals falling from supercooled and glaciated layer clouds, Q. J. Roy. Meteor. Soc., 136, 260–276, https://doi.org/10.1002/qj.528, 2010b.
Whiteman, D. N.: Examination of the traditional Raman lidar technique. I. Evaluating the temperature-dependent lidar equations, Appl. Optics, 42, 2571–2592, 2003.
Wiegner, M., Madonna, F., Binietoglou, I., Forkel, R., Gasteiger, J., Geiß, A., Pappalardo, G., Schäfer, K., and Thomas, W.: What is the benefit of ceilometers for aerosol remote sensing? An answer from EARLINET, Atmos. Meas. Tech., 7, 1979–1997, https://doi.org/10.5194/amt-7-1979-2014, 2014.
Wiegner, M. and Gasteiger, J.: Correction of water vapor absorption for aerosol remote sensing with ceilometers, Atmos. Meas. Tech., 8, 3971–3984, https://doi.org/10.5194/amt-8-3971-2015, 2015.
Wu, Y., Gan, C. M., Cordero, L., Gross, B., Moshary, F., and Ahmed, S.: Calibration of the 1064 nm lidar channel using water phase and cirrus clouds, Appl. Optics, 50, 3987–3999, 2011.


