the Creative Commons Attribution 4.0 License.
the Creative Commons Attribution 4.0 License.
The effect of rapid relative humidity changes on fast filter-based aerosol-particle light-absorption measurements: uncertainties and correction schemes
Sebastian Düsing
Birgit Wehner
Thomas Müller
Almond Stöcker
Alfred Wiedensohler
Measuring vertical profiles of the particle light-absorption coefficient by using absorption photometers may face the challenge of fast changes in relative humidity (RH). These absorption photometers determine the particle light-absorption coefficient due to a change in light attenuation through a particle-loaded filter. The filter material, however, takes up or releases water with changing relative humidity (RH in %), thus influencing the light attenuation.
A sophisticated set of laboratory experiments was therefore conducted to investigate the effect of fast RH changes (dRH ∕ dt) on the particle light-absorption coefficient (σabs in Mm−1) derived with two absorption photometers. The RH dependence was examined based on different filter types and filter loadings with respect to loading material and areal loading density. The Single Channel Tricolor Absorption Photometer (STAP) relies on quartz-fiber filter, and the microAeth® MA200 is based on a polytetrafluoroethylene (PTFE) filter band. Furthermore, three cases were investigated: clean filters, filters loaded with black carbon (BC), and filters loaded with ammonium sulfate. The filter areal loading densities (ρ*) ranged from 3.1 to 99.6 mg m−2 in the case of the STAP and ammonium sulfate and 1.2 to 37.6 mg m−2 in the case the MA200. Investigating BC-loaded cases, was in the range of 2.9 to 43.0 and 1.1 to 16.3 mg m−2 for the STAP and MA200, respectively.
Both instruments revealed opposing responses to relative humidity changes (ΔRH) with different magnitudes. The STAP shows a linear dependence on relative humidity changes. The MA200 is characterized by a distinct exponential recovery after its filter was exposed to relative humidity changes. At a wavelength of 624 nm and for the default 60 s running average output, the STAP reveals an absolute change in σabs per absolute change of RH (Δσabs∕ΔRH) of 0.14 Mm−1 %−1 in the clean case, 0.29 Mm−1 %−1 in the case of BC-loaded filters, and 0.21 Mm−1 %−1 in the case filters loaded with ammonium sulfate. The 60 s running average of the particle light-absorption coefficient at 625 nm measured with the MA200 revealed a response of around −0.4 Mm−1 %−1 for all three cases. Whereas the response of the STAP varies over the different loading materials, in contrast, the MA200 was quite stable. The response was, for the STAP, in the range of 0.17 to 0.24 Mm−1 %−1 and, in the case of ammonium sulfate loading and in the BC-loaded case, 0.17 to 0.62 Mm−1 %−1. In the ammonium sulfate case, the minimum response shown by the MA200 was −0.42 with a maximum of −0.36 Mm−1 %−1 and a minimum of −0.42 and maximum −0.37 Mm−1 %−1 in the case of BC.
A linear correction function for the STAP was developed here. It is provided by correlating 1 Hz resolved recalculated particle light-absorption coefficients and RH change rates. The linear response is estimated at 10.08 Mm−1 s−1 %−1. A correction approach for the MA200 is also provided; however, the behavior of the MA200 is more complex. Further research and multi-instrument measurements have to be conducted to fully understand the underlying processes, since the correction approach resulted in different correction parameters across various experiments. However, the exponential recovery after the filter of the MA200 experienced a RH change could be reproduced. However, the given correction approach has to be estimated with other RH sensors as well, since each sensor has a different response time. And, for the given correction approaches, the uncertainties could not be estimated, which was mainly due to the response time of the RH sensor. Therefore, we do not recommend using the given approaches. But they point in the right direction, and despite the imperfections, they are useful for at least estimating the measurement uncertainties due to relative humidity changes.
Due to our findings, we recommend using an aerosol dryer upstream of absorption photometers to reduce the RH effect significantly. Furthermore, when absorption photometers are used in vertical measurements, the ascending or descending speed through layers of large relative humidity gradients has to be low to minimize the observed RH effect. But this is simply not possible in some scenarios, especially in unmixed layers or clouds. Additionally, recording the RH of the sample stream allows correcting for the bias during post-processing of the data. This data correction leads to reasonable results, according to the given example in this study.
- Article
(2532 KB) - Full-text XML
- BibTeX
- EndNote
Black carbon (BC) and its light-absorbing properties has significant influence on the Earth's climate, and its contribution is associated with major uncertainties, in particular due to its vertical distribution (Zarzycki and Bond, 2010). In addition, it is suspected to affect human health (WHO, 2012). Absorption photometers are instruments capable of measuring the light-absorbing properties of aerosol particles. These photometers measure the aerosol-particle light-absorption coefficient (σabs) by detecting the change of attenuation of light due to deposited aerosol-particle mass on sample filter. They have been installed on airship platforms (Rosati et al., 2016), tethered balloon platforms (Ran et al., 2016; Ferrero et al., 2014, 2016), or unmanned aircraft systems (UASs; Markowicz et al., 2017; Telg et al., 2017; Bärfuss et al., 2018) to address the vertical BC distribution. To investigate human exposure to health-harming BC-containing aerosol particles from combustion sources, they have been used for mobile measurements (Cepeda et al., 2017, and references therein; Alas et al., 2018).
Subramanian et al. (2007), Vecchi et al. (2013), and Lack et al. (2008) have shown that liquid-like brown carbon can significantly bias filter-based absorption measurements, since this organic carbon wraps around filter fibers and alters their structural properties. Aerosol samples contain water vapor represented by its relative humidity (RH). Similar to liquid-like brown carbons, water vapor can be adsorbed through the filter material or bound to the binding material within the filter during the sampling process. A variety of filter materials are used in absorption photometers, and the water uptake is different across various materials. Hence, changes in the aerosol RH can affect the aerosol-particle light-absorption measurements differently. Nessler et al. (2006) have shown the extent to which sudden changes in relative humidity (RH) can influence measurements of a Particle Soot Absorption Photometer (PSAP; Radiance Research, Seattle, WA) and an aethalometer for clean filter material and that loaded with BC, whereas Cai et al. (2014) have shown the effect for the microAeth® AE51, although they did not quantify it. However, hygroscopic aerosol-particle species such as ammonium sulfate can take up water depending on the relative humidity. The RH effect for filters loaded with such aerosol species was never quantified. Furthermore, not all filter materials have been covered within these studies. In summary, both the filter material and loading material may influence the light attenuation of the filter.
The RH effect might not be relevant for averaging periods longer than 5 min, as usually done at stationary measurements on the ground (e.g., to address human exposure to BC-containing aerosol particles). However, to address vertical profiling of BC with fast RH changes, particle light-absorption measurements require a high temporal resolution of seconds.
Telg et al. (2017) presented a study using an unmanned aircraft system (UAS) for vertical profiling of aerosol physical properties, including the aerosol-particle light-absorption coefficient measured by an absorption photometer. In their study, a significant decrease in σabs at around 1000 m altitude is visible. Considering the other simultaneously measured microphysical aerosol parameters, this decrease is not to be expected. In the WMO/GAW Report No. 227 (WMO/GMO, 2016), it is recommended to conduct aerosol sampling below 40 % relative humidity to prevent measurement artifacts due to high relative humidity. Although the measurements of Telg et al. (2017) have been conducted following these recommendations, this is a published example for the bias in σabs measurements due to fast RH changes even for a RH below the 40 % threshold.
In our study, the RH effect is investigated for the small-sized photometers, namely the Single Channel Tricolor Absorption Photometer (STAP), using a quartz-fiber glass filter, and MA200®, which relies on a polytetrafluoroethylene (PTFE) filter. We show results of a set of laboratory experiments and address the effect of sudden changes in relative humidity for both absorption photometers. Herein, we consider three different scenarios: (a) clean filters, different filter loading densities of (b) hydrophobic BC, and (c) hydrophilic ammonium sulfate ((NH4)2SO4). The following scientific questions are addressed: to what extent are STAP and MA200 sensitive to RH changes, and does different loading with respect to material and areal density contribute to this effect? Can the observed effect be corrected, and which recommendations can be given for the usage of such an absorption photometer? This is important because recent developments indicate that lightweight absorption-measuring instruments will be used more frequently for airborne applications in the near future.
2.1 Theory of absorption measurements
Filter-based absorption photometer measuring the decrease in intensity of light which passes through the filter medium with a specific optical thickness. The decrease in intensity can be described quantitatively according to the law of Beer–Lambert:
where I is the attenuated intensity of light with a wavelength λ with a raw intensity I0, attenuated along a path l through a medium with a light attenuation coefficient σATN. The path length l can also be interpreted as the length of a column of aerosol passing through the sample area of the filter spot Ai of the instrument (subscript i), whereas the particles are collected and accumulated in the filter. However, a reinterpretation of the path length does not mean that the result is the particle light-absorption coefficient but still the light attenuation coefficient. The path length l can be calculated by the volume, which flows at a certain rate (volume flow rate; Qi) for a time Δt through the sample area Ai. Based on Eq. (1), this results in
While aerosol particles deposit on the filter, the incoming light gets additionally scattered by those particles. Hence the effective pathway of the light through the filter increases due to the multiple scattering. To account for this, Eq. (2) needs f(τ), a transmission-dependent (τ-dependent) filter loading correction factor, with
where I0 is the light intensity measured for a white, clean filter. For instance, Ogren (2010) reported an updated loading correction function for the PSAP introduced and updated by Bond et al. (1999), defined as
which is also used for the STAP.
Rearranging and applying the filter loading correction to the attenuation coefficient Eq. (2) will give the particle light-absorption coefficient:
Water has a refractive index of at the 532 nm wavelength. Hence it interacts with incoming electromagnetic radiation. If the filter is exposed to relative humidity changes, the light attenuation of the filter changes, since the water binds to the filter itself (Caroll, 1976, 1986). Since a variety of filter materials with different physical properties exist, we suspect that the magnitude and sign of the light attenuation coefficient can vary with the filter material. The hypothesis is that the change rate of the RH (dRH ∕ dt) directly determines the magnitude of the particle light-absorption coefficient, which depends on the difference of two subsequent attenuation measurements.
The effect of changes in the relative humidity on particle light-absorption measurements contains two parts. First, the filter interacts with the RH on its own. Second, hygroscopic particles change their optical properties with the water uptake and loss due to growing and shrinking. Hence, aerosol particles under varying relative humidity conditions will also have an effect on the reported particle light-absorption coefficient.
Some absorption photometers such as the STAP directly report measurements of the aerosol-particle light-absorption coefficient σabs; some, for instance the MA200, report measurements of the equivalent black-carbon (eBC; Petzold et al., 2013) mass concentration (MeBC). eBC mass concentrations can be converted to σabs with
in which MAC is the mass absorption cross section (in m2 g−1).
Lab comparison of the eBC mass concentration between a MAAP (Multi Angle Absorption Photometer; Thermo Fisher Scientific, 27 Forge Parkway, 02038 Franklin, MA, USA; Petzold and Schönlinner, 2004) at the 637 nm wavelength and a MA200 at the 625 nm wavelength and the STAP at the 624 nm wavelength before the experiment revealed a good agreement, within 3 % and within 6 %, respectively. For the STAP, a MAC of 6.6 m2 g−1 was assumed. Since a MAC of 6.6 m2 g−1 is used for the MAAP at 637 nm, in this study we used the σabs directly provided by the STAP and derived with the mentioned MAC in the case of the MA200, which already accounts for multiple scattering and filter loading corrections.
2.2 Instrument description
As mentioned before, we investigated two filter-based absorption photometers, which are described in the upcoming sections. The STAP (Brechtel Manufacturing Inc, 1789 Addison Way, Hayward, CA 94544, USA) and the MA200 (AethLabs, 1640 Valencia St, Suite 2C, San Francisco, CA 94110, USA) use different filter materials. The STAP relies on a quartz-fiber glass filter, whereas the MA200 is based on a PTFE filter. Since their behavior under fast changes of the relative humidity is not described yet, we investigate both instruments in this study.
2.2.1 Single Channel Tricolor Absorption Photometer (STAP)
This photometer detects light intensities behind two quartz-fiber glass filter (Pall Life Sciences, Pallflex membrane filters, type E70-2075W) at three wavelengths (450, 525, and 624 nm). On the first filter, the sample filter, the light attenuates due to deposited particulate matter. The second filter, the reference filter, is located downstream of the sample filter and allows blank filter reference light-intensity measurements.
By default, the particle light-absorption coefficient is determined internally using 60 s averages of the raw intensity measurements for both filter spots. Therefore, in Eq. (5), I(t) is defined as
where Ismp and Iref are the intensity of light at the certain wavelength λ behind the sample (smp) and blank reference (ref) filter, respectively. Nevertheless, all raw measurements are recorded with a time resolution of 1 Hz, allowing a recalculation of σabs at this time resolution. The volumetric flow is set to one liter per minute (L min−1). According to the manual, at an internal averaging interval of 60 s, the measurement uncertainty is specified to 0.2 Mm−1. The spot diameter is ∼ 4.8 mm, which leads to a sample area of Aspot m2.
2.2.2 MA200
The second instrument used here, the microAeth® MA200, is a small-sized (13.7 cm×8.5 cm×3.6 cm; 420 g) absorption photometer measuring the attenuation of light at five wavelengths (375, 470, 528, 625, and 880 nm; 625 nm wavelength is investigated in this study) due to deposited particulate matter on a PTFE filter band.
Similar to the STAP, the MA200 detects light intensities behind a sample and reference spot. The particulate matter samples on a sample spot with a 3 mm diameter, leading to a sample area of m2. The reference spot of the same area allows for blank filter measurements. MeBC is determined under the assumption that the change of attenuation is proportional to the deposited eBC mass. The measurements were recorded with a 1 Hz time resolution. With DualSpot® technology, the instrument is able to reduce uncertainties related to loading effects of up to 60 % (Holder et al., 2018) but was not functioning at the time of the experiment.
Holder et al. (2018) reported that the measurements slightly depend on RH and T of the aerosol sample. However, they observed concentrations of up to 7 mg m−3, at which the observed dependence on humidity and temperature did not influence the measured values significantly. Furthermore, they used another version of the instrument (MA350), which may react differently to changes in humidity and temperature.
2.3 Experimental setup
The experimental setup is designed to examine the instrument filters in different states. Unloaded filters and differently loaded filters with black carbon (BC) and ammonium sulfate were investigated. The extent to which fast changes in the relative humidity of the air passing through the filter affect absorption measurements was investigated for these conditions.
A miniCAST burner (model 5200, Jing Ltd.) was used to generate soot (BC) aerosol particles due to combustion of propane. The produced BC particle stream can be diluted according the needs of the customer. A detailed description of the miniCAST is supplied by Jing (1999). Additionally, a solution of ammonium sulfate ((NH4)2SO4; solution concentration of 0.05 g ∕ 80 mL) was nebulized to an aerosol and dried afterwards. Either the ammonium sulfate or the BC aerosol was fed into a 0.5 m3 stainless-steel mixing chamber. A fan within the chamber ensures a well-mixed aerosol.
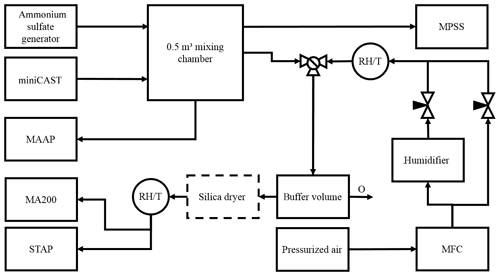
Figure 1Scheme of the experimental setup. The volumetric flow rates of two air streams were controlled with two needle valves to produce humidified particle-free air via mixing of wet and dry particle-free air. It was ensured that the sum of both flows was larger than the volumetric flow of both absorption photometers investigated here. Any exceeding airflow was directed to a buffer volume with an overflow outlet (O). The relative humidity and the temperature of the air were recorded directly after the humidifier and shortly before the photometers with the RH and T sensors.
The scheme of the experimental setup is described in Fig. 1. First, two particle-free, dry (RH = 0 %) air flows were produced. One of the flows was humidified by passing through two glass tubes containing distilled water at room temperature with an inlet and outlet for compressed particle-free air. A maximum relative humidity of ∼ 96 % was reached. Both the dry and humidified air flows were mixed together with a Swagelok brass T-shaped flow splitter, and it was ensured that the sum of both mass flows exceeded 1 L min−1 (controlled by a mass-flow controller). Different RH values were produced according to the ratios of the dry and humidified air. For this, valves with markings indicating the opening state of the valves were used to reproduce a consistent mixing RH. The RH and T of the airflow sampled with the photometer were detected with a temperature and relative humidity sensor (model HYT939, B+B Thermo-Technik GmbH, 78166 Donaueschingen, Germany) within an accuracy of ±1.8 % (between 0 % and 90 % RH) and ±0.2 ∘C (between 0 and 60 ∘C). Furthermore, this sensor has a response time t63 of < 10 s. Additionally, this setup could be used with or without a silica-bead-based dryer before the photometers to examine the extent to which a dryer dampens the effect of relative humidity changes on the photometer absorption measurements.
Two main setups were used to investigate the effect of changes in relative humidity. In the first, the filters of the devices were unloaded and the instruments collected a particle-free airflow with adjustable relative humidity to examine the pure filter effect. In the second, the filters of the devices are loaded to a certain degree, and afterwards they sample particle-free humidified air, which accounts for the combination of both effects, the pure filter effect and the effect induced by the hygroscopic behavior of the particles.
The loading aerosol was split into two streams; the absorption photometers sampled simultaneously from one of these. The other one was sampled with a mobility particle sizer spectrometer (MPSS; working principle explained in, for example, Wiedensohler et al., 2012) to measure the aerosol-particle number size distribution from which the loading mass was estimated. An example of a generated ammonium sulfate aerosol is shown in Fig. 2. Furthermore, to examine the loading mass concentration of the generated eBC (soot), the generated BC aerosol was also measured with a MAAP.
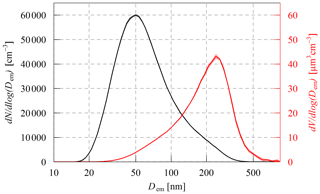
Figure 2Average particle number (black) and volume size distributions (red) of the ammonium sulfate aerosol loaded on the filters in the MA200 and STAP during experiment no. 2 of the ammonium sulfate loading experiments. The average volume of 20.6 µm3 cm−3 is calculated from four scans. The shaded area indicates the standard deviation of the mean. Dem refers herein to the electrical mobility diameter of the aerosol particles.
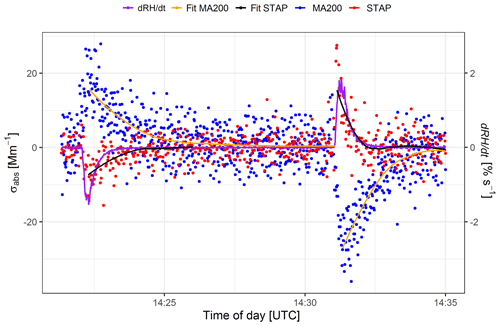
This chapter gives an overview of the measurement results. The overall behavior of both instruments is shown for wavelengths of 624 nm in the case of the STAP and 625 nm in the case of the MA200. A closer look at the behavior of both devices at the 1 Hz time resolution shows that both devices differ greatly in quality (see Fig. 3). The STAP (red dots and the smooth fit shown as black line) reacts very fast to relative humidity changes (dRH ∕ dt as purple line) and then returns relatively fast to the zero line. The MA200, on the other hand, also shows a fast response to relative humidity changes but then shows a distinct exponential recovery (see Fig. 3; blue dots and smooth fit shown as orange line) and reports absorption coefficients different from zero, although there is no RH change.
Therefore, we use an averaging on a 60 s basis to describe the qualitative behavior of both devices. In the case of the STAP, the internal 60 s averaging is used. For the MA200, on the other hand, a 60 s “running average” is applied to the 1 Hz measurements.
The qualitative behavior of both devices is shown as follows. The corresponding maximum of the excursion of the averaged absorption coefficient (Δσabs) has been assigned to each absolute change in the relative humidity (ΔRH), where the absolute change of the relative humidity is the difference between the relative humidity at the time of the largest excursion in the absorption coefficient and the relative humidity at the start of the excursion. This approach also excludes the response time of the RH sensor.
First, the results for the pure filter effect are shown. Afterwards, we present the results of the combined behavior of filter and aerosol particles on the filters. For loaded filters, the combined effect is shown separated into BC and ammonium sulfate loading.
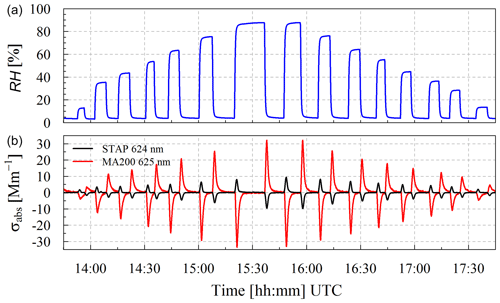
Figure 4Time series of RH (a) and absorption coefficient (b) measured with STAP (624 nm; black) and MA200 (625 nm; red) with clean filters.
3.1 Clean filters
In Fig. 4, the time series of the measured RH upstream of the two photometers (Fig. 4a) and of σabs measured by the STAP (624 nm) and MA200 (625 nm; in Fig. 4b) are shown. The air sampled by the photometers was entirely particle-free. Relative humidity was changed in this time series between 3.1 % and 87.7 %. The change rate of RH (dRH ∕ dt) was in the range of around −3.0 % s−1 to 2.9 % s−1. Whereas the measurements of the STAP ranged between −9.8 and 9.5 Mm−1, the running 60 s mean of the MA200 readouts ranged from to 32.2 to −33.6 Mm−1. Furthermore, Fig. 4 shows the opposing behavior of both instruments. Whereas the STAP reacts to positive change rates of the RH with positive particle light-absorption coefficients, the MA200 measures negative particle light-absorption coefficient and vice versa. In summary, this indicates that the different filter materials react oppositely to each other.
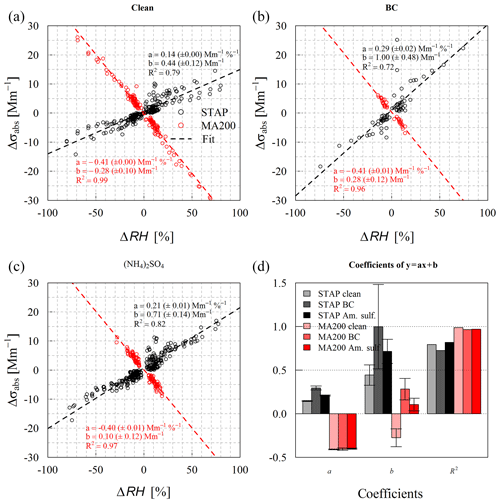
Figure 5Scatterplot (dots) of all observations of the absolute excursion of σabs (Δσabs) dependence on the absolute change in RH (ΔRH), its linear regression fit, and the summarizing boxplot of the linear regression fit are shown for the three investigated states (clean, loaded with BC, and ammonium sulfate) at 624 nm (STAP; black colors) and 625 nm (MA200; red colors). Descriptive coefficients are given in Table A1.
Subramanian et al. (2007) observed that organic matter produced during low-temperature biomass burning has a liquid, bead-shaped appearance when collected on a fibrous filter. Also, these organics can appear as translucent coatings on the filter fibers and therefore change significantly the interaction with incident light. Accordingly, for this study this means that the water in the collection stream can wrap itself around the filter fibers, analogous to the organic materials. Lack et al. (2008) has estimated the bias on filter-based absorption measurement due to loading with organic material. Under conditions with low mass concentrations of organic matter, the agreement with photoacoustic-based aerosol light-absorption measurements was 12 %. Whereas under conditions where the mass concentration of organic material was 15 to 20 times larger than that of light-absorbing carbon, the difference was 50 %–80 %. Therefore, the effect of coating with liquid matter around the fibers is not negligible. In the case of the STAP, the water beads and coating can lead to a higher net reflectance of the filter, which appears darker for the photodiode behind the filter. The instrument interprets this as increased attenuation and hence as increased absorption. In addition, the backing material consists of hydrophilic cellulose, which may absorb water under increased relative humidity and thus change its optical properties (Ogren et al., 2017). Compared to the fibrous structure of the quartz-fiber filter, the PTFE filter of the MA200 is a porous, hydrophobic filter. We speculate that these properties result more into a collection of a thin film of water, which could act as a refractive index matching layer. An additional film with an intermediate refractive index reduces the reflectance and thus increases the transmittance, leading to a decreased attenuation. Hence, the instrument interprets decreases in the attenuation as negative absorption.
Since the filter in the STAP reveals a positive and the filter in the MA200 a negative correlation to relative humidity changes, a combination of both filters within one instrument could account for the observed effect. A new developed instrument could use these two different filter materials on two sampling spots to cancel out the effect of each other. However, more investigations have to be conducted, especially to understand the different recovery behaviors and effect magnitudes of the PTFE and quartz-fiber filter.
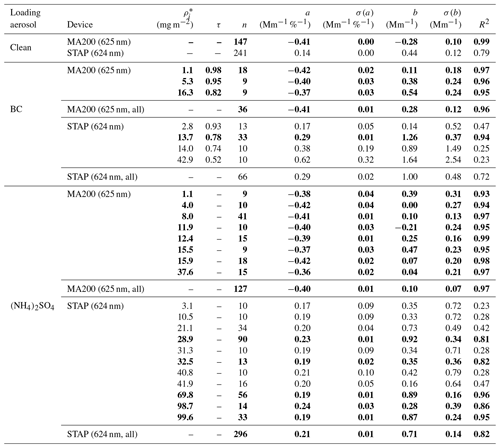
The overall behavior of both instruments in the case of clean filters is shown in Fig. 5a. For all investigated ΔRH values, the response behavior of the MA200 (R2=0.99) is more stable than the STAP (R2=0.78). However, the response is stronger than the average response of the STAP at the presented wavelength. Whereas the STAP shows a dependence of 0.14 Mm−1 %−1, which means an increase in absorption with increasing RH, the MA200 shows an opposing behavior, with a larger absolute value in the slope of −0.41 Mm−1 %−1 (Table A1). As shown in Fig. 4, for each device the magnitude of the deviation due to positive or negative changes in humidity is approximately the same.
3.2 Loaded filters
Different aerosol types deposit on the filter within the instruments while measuring σabs. These aerosol types are either hydrophilic or hydrophobic and hence experience water uptake or not under conditions of elevated RH. Thus, the more particle material is deposited on the filter, the more water deposits on the filter. Therefore, this section shows the influence of different filter loading materials on the RH effect and also points out the effect of different filter loading mass. The observed effect includes both the effect for clean filters (the pure filter effect) and the effect of the hygroscopic behavior of the particles loaded onto the filter. But investigating the effect of the loading material alone is simply not possible, since no filter material exists which is not affected by RH changes. Therefore, the presented results are always a combination of the filter effect and the material effect. For both considered loading materials, the mass loaded onto the filters was calculated by multiplying the prevalent loading mass concentration within the mixing chamber with the volume flow rate of the instrument and the loading duration. The filters were loaded to a certain extent with different materials, and afterwards the absorption photometer was sampling particle-free air with adjustable humidity. The different sample spot areas of the absorption photometers is considered herein by normalizing the loaded mass with the respective sample spot area. This is referred to throughout as filter areal loading density ρ*.
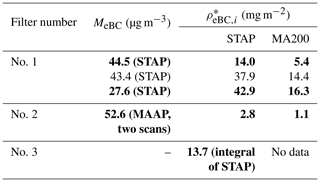
Table 1Filter loading mass concentration (MeBC) of the black-carbon particles and filter areal loading density (deposited mass per spot area) . MeBC values were determined by dividing the average σabs of the STAP with an assumed MAC of 6.6 m2 g−1 or based on the MAAP measurements. Usage of same filter is indicated by separation with thick horizontal lines. Bold written entries were used for the investigation of the RH effect.
3.2.1 Black carbon
During the experiment the eBC loading mass concentration was estimated with different methods depending on the stability of the mass concentration and loading duration and ranged between 27.6 and 52.6 µg m−3. In Table 1, the ρ* of eBC per spot area () of both instruments is shown. During experiment no. 1 (see Table 1) the mean absorption coefficient of the STAP was divided by a MAC of 6.6 m2 g−1, since the absorption was stable during the loading period, and it is a direct measure from the sampling instrument. For the experiment no. 2 the loading mass concentration was taken from the average of two consecutive MAAP measurements, since the loading period was shorter than 2 min, which is shorter than the internal averaging period of the STAP so that no stable absorption coefficient readouts could be provided by the STAP. During experiment no. 3 no MAAP was available and the absorption coefficient measured by the STAP was unstable. We therefore decided to estimate the loaded eBC mass by integrating the absorption coefficient during the loading period and dividing it by the MAC. Four different values were considered in the case of the STAP, and three were considered for the MA200. Due to the smaller volume flow rate of the MA200, is in each corresponding case smaller than for the STAP, and therefore, if any effects of different loadings are observed, these might not be as distinct as for the STAP.
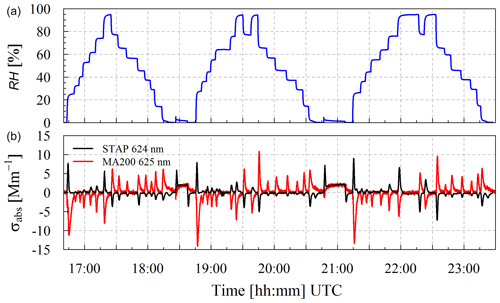
Figure 6RH of the air stream sampled by the MA200 and the STAP (a) and σabs measured by MA200 and STAP at 625 nm (624 nm) (b). First up and down ramp of RH conducted with clean filter, and second and third conducted under conditions with filter loaded with ammonium sulfate. Loading periods around 18:30 and 21:00 UTC.
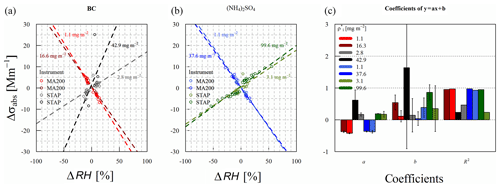
Figure 7Scatterplot of change in absorption (Δσabs) dependent on the absolute change in RH (ΔRH) separated into the different loading states (loaded with BC and ammonium sulfate) and minimum and maximum areal loading density on the filter. Dashed and colored lines represent the linear regression fit. Red and blue colors indicate MA200 at 625 nm, and black and green colors indicate STAP at 624 nm. In (a) BC loading is shown, whereas in (b) the ammonium sulfate case is displayed. Coefficients of the linear regression fit are displayed in (c). Colored shading in the linear fits and of the points are same as in (c).
For all considered BC loading cases the averaged response of STAP and MA200 to relative humidity changes is shown in Fig. 5b, and corresponding linear fitting and correlation parameters are given in Table A1. The STAP shows a dependence of 0.29 Mm−1 %−1 in this case. This means the absolute changes in RH affecting the BC-loaded filter lead to stronger σabs deviations than in the clean case. For the MA200, the response of the instrument to rapid changes in RH does not depend on the loading material for the filter with BC, since the regression slope is the same as in the clean case. However, the y intersects deviate from each other but within 0.6 Mm−1. We assume that this could be due to the lower absolute loading on the filter (15 % of the STAP loading because of 0.15 L min−1 flow rate compared to 1 L min−1 of the STAP) or to the MA200 response being in general independent of the filter loading material.
Considering different areal loading densities, the MA200 shows more or less the same behavior (see Table A1 and Fig. 7). The slope of the linear correlation fit ranges from −0.42 to −0.37 Mm−1 %−1 for corresponding areal loading densities of 1.1 to 16.3 mg m−2. The STAP shows a larger variability (Fig. 7a; black and gray colors). For a ρ* of 2.8 to 42.9 mg m−2, the STAP response ranges from 0.17 to 0.62 Mm−1 %−1. However, these results may not be entirely representative, since R2 is only larger than 0.9 (0.94) for a loading density of 13.7 mg m−2. Maybe the smaller amount of data points in the other cases explains this. However, the number of data points observed with the MA200 was also small, but R2 is in each case larger than 0.9. Similar to the clean case, for both instruments, drying and humidifying the sample stream to the same extent resulted in a deviation of σabs with the similar magnitude.
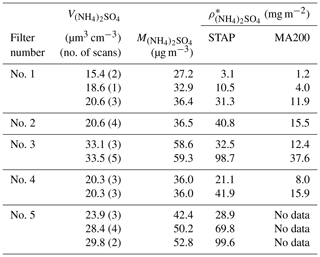
Table 2Average volume and mass concentration (, ) of the loading (NH4)2SO4 aerosol derived from the used MPSS (number of used scans in brackets) and areal loading density of the filters are given. Usage of same filter is indicated by a separation with thick horizontal lines, which means that the filter loading mass was adding up during the experiments.
3.2.2 Ammonium sulfate
The loading mass concentration of the (NH4)2SO4 aerosol depositing on the filters was estimated by integrating the mean ammonium sulfate aerosol-particle volume size distribution of the loading period and multiplying this volume concentration (see Table 2) with an assumed ammonium sulfate density of 1.77 g cm−3 (Haynes, 2014). The loading mass concentrations were in the range of 27.2 to 59.3 µg m−3 (see Table 2). The very narrow standard deviation around the mean particle number and volume size distribution in Fig. 2 indicate clearly that the loading mass concentrations were very stable during the loading periods.
In the experiments, ammonium sulfate filter areal loading densities were 3.1 to 99.6 mg m−2 in the case of the STAP and 1.2 to 15.9 mg m−2 in the case of the MA200. Exemplarily, particle number size distribution and particle volume size distribution of the ammonium sulfate aerosol of the loading on 23 February are shown in Fig. 2. It is clearly visibly that the maximum in the particle volume size distribution peaked around a mobility diameter of 260 nm.
Figure 6 shows exemplarily the time series of the sample air RH and of the σabs measured with STAP and MA200 operated with clean filters. A RH of 0.0 % to 96.2 % with humidity change rates of −1.42 % s−1 to 1.09 % s−1 was measured. Compared to the case in Fig. 4, here a stepwise change of RH is shown. These steps resulted in a smaller absolute excursion of σabs which ranges from −7.2 to 9.0 Mm−1 (STAP; 624 nm, 60 s measurement resolution) and −14.1 to 10.9 Mm−1 (MA200; 625 nm, 60 s running mean). Furthermore, Fig. 6 shows the response of the σabs to RH changes at three different states of filter loading. During the first ramp, the filters were clean, during the second period the filters had a filter areal loading density of 32.5 mg m−2 (STAP) and 12.4 mg m−2 (MA200), and during the third ramp the filter in the STAP had a areal loading density of 98.7 mg m−2, and the MA200 filter was loaded with an areal loading density of 37.6 mg m−2. The response of the instruments during these periods is shown in Table A1.
In Fig. 5c, the overall (mean) response of both instruments to RH changes is shown in the case of loading with ammonium sulfate. The MA200 behaves similarly to the clean and BC case (slope of −0.40 Mm−1 %−1). The σabs measured by the STAP responses opposingly, with a positive slope of 0.21±0.01 Mm−1 %−1, which is roughly half of the amplitude shown by the MA200 and around two-thirds of the BC-loaded case.
As shown in Fig. 6, both absorption photometers measure an “apparent” absorption coefficient of approximately 2 Mm−1 during loading with ammonium sulfate (18:30 and 21:00 UTC). This shows that absorption photometers react sensitively to scattering aerosols such as ammonium sulfate. The scattering ability of any material can be described with the real part of its refractive index. It seems that for the STAP the slope of the correlation increases with increasing scattering of the loading material (0.15 Mm−1 %−1 for a clean filter, 0.21 Mm−1 %−1 for ammonium sulfate, and 0.30 Mm−1 %−1 for BC). Ammonium sulfate has a real part of 1.521±0.002 (at 532 nm; Dinar et al., 2007), and BC from combustion processes has a real part of 1.96 at 530 nm (Kim et al., 2015, following Ackerman and Toon, 1981). Hence, the quartz-fiber glass filters loaded with “artificially” absorbing aerosol inside the STAP could lead to a variation in the response to relative humidity changes. But the MA200 was loaded with ammonium sulfate as well, and its response to relative humidity changes is almost constant for all considered loading materials. Therefore the observation is caused by the interaction of quartz-fiber glass filters with the loading material and the PTFE filters inside the MA200 do not cause this behavior, the filter loading of the MA200 was too low or there are other mechanisms explaining this. Furthermore, since only three different cases (clean, ammonium sulfate, and BC) were observed in this study, more materials should be considered to investigate this phenomenon. No correlation of linear regression slope and filter areal loading density ρ* was observed in either case, for the STAP and the MA200, respectively. The slope (a) of STAP ranges from 0.17 to 0.24 Mm−1 %−1, and the slope of the MA200 ranges from −0.36 to −0.42 Mm−1 %−1. With a relative difference from the minimum to maximum slope of 15.2 %, the response of the MA200 is less variable than that of the STAP, with a relative variability of 28.6 % (slopes with R2<0.8 excluded, all points included 36.8 %). In Fig. 7b, the spread of the slopes within the shown cases is exemplarily shown for the investigated minimum and maximum load of the filters. Overall, the magnitude of the deviation of σabs was independent of the sign of humidity change for both instruments.
3.3 Correction approach
The above chapters describe the general response behavior of both devices to RH changes on the basis of 60 s averages of the aerosol-particle light-absorption coefficient. To correct for the described effect, a 1 Hz time resolution is needed to resolve the instantaneous response of the instruments to relative humidity changes. For this purpose, a further laboratory experiment was conducted in which the inlets of both instruments could be flexibly exposed to humidified air. In our particular case, we hold the inlet in a beaker with a moistened tissue. In order to avoid any dampening bias, all measurements were conducted without a particle filter in front of the inlet. But during this experiment a background of about σabs of 1.2 Mm−1 was measured so that the filter loading was very low. First, we consider the STAP, and afterwards the MA200 is investigated.
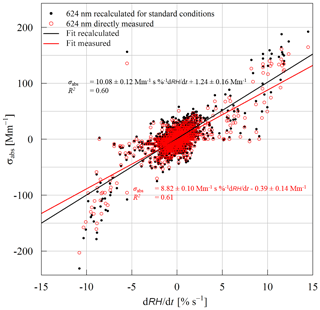
Figure 8Scatterplot of σabs and change rate of RH (dRH ∕ dt) at 624 nm derived directly from STAP without any corrections (red) and recalculated σabs at 624 nm, including corrections to standard conditions (black). Linear fit equations and correlation coefficient are given in the corresponding colors.
3.3.1 STAP
In Fig. 8 the correlation of the RH change rate (dRH ∕ dt) and the measured σabs at 624 nm measured by the STAP (red circles) and recalculated with respect to standard conditions (pressure of 1013.25 hPa and temperature 273.15 K) is shown. The STAP-based background eBC mass concentration during the experiment was ∼ 190 ng m3 (at standard conditions, σabs at 624 nm converted with a MAC of 6.6 m2 g−1), which corresponds to offset (standard conditions corrected values) in the shown scatterplot of Fig. 8 and which has no influence on the response to RH changes as shown previously.
The RH change rate ranged from −10.8 % s−1 to 14.5 % s−1. These rates correspond to a σabs of −231 to 192 Mm−1 for recalculated values at standard conditions and −203 to 164 Mm−1 directly measured by the instrument. But these measurements are biased by the response time of the relative humidity sensor so that the “real” RH change rate cannot be fully represented by these measurements. On average the slope (correction factor CRH in Eq. 8) of the linear fit is 10.08 (± 0.12) Mm−1 s %−1 for standard conditions and 8.82 (± 0.10) Mm−1 s %−1 for direct instrument output. Calculating the particle light-absorption coefficient introduced by RH changes with
and for different RH change rates in both the recalculated and direct instrument correcting for the observed effect as follows:
and after replacing σabs,RH in Eq. (8) with Eq. (9),
The y intersect of the linear fit in Fig. 8 must not be considered for correction, as mentioned before. Disadvantageously, with this correction the noise of the RH sensor will propagate in the corrected σabs. Furthermore, the linear fit in Fig. 8 under- or overestimates the behavior in regimes of very high rates of relative humidity change, most likely due to the response time of the RH sensor, so that the correction function cannot entirely correct the bias. Therefore, the given correction factor CRH consists of uncertainties which cannot be entirely addressed. Hence, it is only a first guess and needs further refinement, and we do not recommend using the correction approach as long the uncertainties are not fully addressed. Furthermore, since only one STAP was tested, other STAPs may have other correction factors due to a unit-to-unit variability. Additionally, other filter materials used in the STAP can also lead to another behavior. In any case, the upper function was applied to STAP measurements conducted with the same RH sensor under atmospheric conditions.
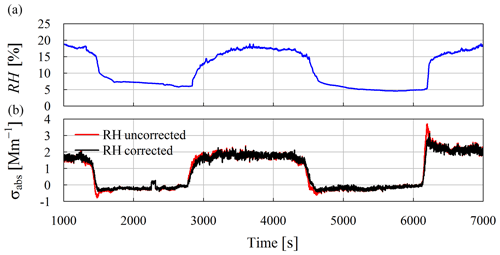
Figure 9Time series of RH before the inlet of the STAP (blue; a) and recalculated σabs (running 60 s mean of 1 Hz calculations) at standard conditions corrected (black) and uncorrected (red) for RH changes (b).
Exemplarily, Fig. 9 shows this application. The figure shows airborne measurements of σabs at 624 nm derived with the STAP derived during a campaign conducted in March 2017 in eastern Germany. Figure 9a displays the RH of a dried aerosol sample stream measured upstream of the STAP. Figure 9b shows the recalculated σabs at the 624 nm wavelength corrected for RH changes (black) and biased by RH changes (red). In the periods where the RH changes relatively fast (dRH ∕ dt of −0.55 % s−1 to 0.56 % s−1, for example, at around 6200 s), the uncorrected σabs overshoots. The correction significantly reduces this bias and smooths out the measurements during the periods of RH changes. At the peaks of dRH ∕ dt, the difference of the corrected and uncorrected values is up to 1.5 Mm−1, which is significant with respect to the measured σabs. The periods with negative σabs are not introduced by the RH effect. We moreover think that a small offset is introduced in the initialization process of the instrument. Despite the imperfection of the correction scheme, this linear approach can be useful for deriving a rough estimate of the accuracy of the measurements. For instance, if we let x be the required accuracy for the measurements (in %) and σabs the measured particle light-absorption coefficient, we can express the minimum ambient particle light-absorption coefficient which is needed to fulfill the accuracy criterion dependent on the RH-change rate dRH ∕ dt:
Exemplarily, if a change rate of 0.1 % s−1 is measured and an accuracy of 25 % is needed, a measured particle light-absorption coefficient of at least around 4 Mm−1 is needed to fulfill the accuracy criterion.
3.3.2 MA200
The exponential recovery behavior of the MA200 (see Fig. 3) requires a more complex approach to correct for relative humidity changes. Therefore, the apparent particle light-absorption coefficient can be described as a function of dRH ∕ dt at a given time t(σabs,RH(t)):
where a is a linear factor describing the dependence of σabs,RH on dRH ∕ dt and b is an exponential decay parameter between 0 and 1. The Eq. (12) corresponds to an autoregressive moving average model with an exogenous variable (ARMA-X).
The function marima of the R package marima (v2.2) is capable of deriving such an ARMA-X model (details in Appendix A). From this, the coefficients a and b can be derived. These can be furthermore used as initial parameters for an optimization by minimizing the sum of the squared residual errors. The derived ARMA-X model describes σabs(dRH ∕ dt) as follows:
and with the applied optimization,
Figure 10 shows time series of RH (Fig. 10a) and 60 s running average σabs derived with the MA200 at 625 nm with the 1 Hz time resolution derived during the laboratory experiment mentioned in Sect. 3.4. Under the influence of dRH ∕ dt in the range of −11.2 % s−1 to 17.1 % s−1, the 60 s running average of σabs is between −6.5 and 7.7 Mm−1 (MeBC equivalent of −0.99 to 1.20 µg m−3). Subtracting the calculated apparent particle light-absorption coefficient dependent on RH changes following Eqs. (13) and (14) from this dataset, σabs shrinks to −3.2 from 4.7 Mm−1 or −1.0 from 3.7 Mm−1 in the non-optimized and optimized case, respectively. This corresponds to an MeBC of around −0.5 to 0.7 µg m−3 or −0.2 to 0.6 µg m−3 in the optimized case. This indicates that the presented approach can significantly reduce the RH bias in the presented case. But RH-change-induced fluctuations in σabs are still visible, which indicates that the correction scheme cannot account entirely for all the bias introduced by a change in RH. Here, the response time of the sensor could account at least for a part of the imperfection of the correction approach and cannot be fully quantified yet.
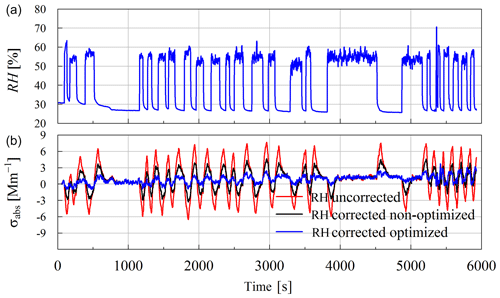
Figure 10Time series of a laboratory measurement of σabs conducted with the MA200 without a particle filter in front of the instrument. (a) shows the RH of the aerosol sample, and (b) displays the 60 s running average of measured σabs at 1 Hz time resolution and 625 nm uncorrected and biased by RH changes (red) and corrected with the modeled σabs derived with the ARMA-X model (black).
Unfortunately, the application of the same correction approach to other similar experiments resulted in different correction function a and b. Applying the approach to two clean case experiments from Sect. 3.1 resulted in optimized parameters of and −1.03 and b=0.974 and 0.971. Hence, it is just a first step in trying to account for relative humidity changes, and further research with more MA200 photometers simultaneously has to be done to fully understand the underlying processes and to fully quantify the uncertainties of the correction scheme. Nevertheless, the presented approach significantly reduces the amplitude of the bias in the shown dataset (see Fig. 10). However up until now we cannot recommend using the given parameters to correct for RH effects. At most it can be used to make a rough estimate of how measurements of the particle light-absorption coefficient derived from the MA200 could be biased by RH changes.
Here we presented a unique set of laboratory studies to investigate the response of two different types of filter-based absorption photometers (STAP and MA200) with different filter materials (quartz-fiber glass and PTFE) to relatively fast changes in relative humidity of sampled aerosol. Different filter loading densities with different loading material (clean, black carbon, and ammonium sulfate) were considered in this study. Both instruments revealed that they react to fast humidity changes but in opposite ways, induced by the different filter material. This opposing behavior could be a chance to design an instrument on the basis of both filter materials so that the effects cancel out each other. No significant differences between the loading aerosol types were observed in the case of the MA200, whereas the STAP revealed the strongest response in the BC case.
The MA200 revealed a very robust response of −0.42 to −0.36 Mm−1 %−1 (negative excursion of σabs with increasing RH), whereas the STAP fluctuated more across areal loading density and loading aerosol type, with a positive excursion of σabs in the range of 0.17 to 0.62 Mm−1 %−1. We assume that in the case of the MA200, it is more of a filter effect or that the filter loadings were too low to have a significant effect due to the lower volume flow rate. For the STAP, more parameters could also have an effect, and further investigation is needed. For areal loading density on the filter, no correlation was found, although we expected that the hygroscopic ammonium sulfate would affect the transmissivity of the filter-aerosol layer. Hence, we think that excursions of σabs due to relative humidity changes are mainly caused by water vapor filter-material interactions and are independent of the filter areal loading density or they were too low to observe significant effects.
Furthermore, we developed some correction approaches for both instruments to account for fast RH changes. For the STAP a linear correction function was derived. This correction follows a linear approach, including a correction factor of Mm−1 s %−1 for standard conditions and 8.82±0.10 Mm−1 s %−1 for direct instrument output without any corrections. But this correction was created with a RH sensor with a response time which introduces a bias in the correction approach and cannot be quantified yet. Also, other RH sensors might result in a different correction formula. Exemplarily, this correction was applied to an airborne dataset and has shown promising results. For the MA200 no linear correction function can be provided, since after an excursion of σabs the MA200 shows a distinct exponentially behaving recovery function. Therefore, an ARMA-X model was developed to account for this exponential decay and to describe the σabs dependence on dRH ∕ dt. Applying this to the presented dataset, this significantly reduced the excursion introduced by RH changes. We do not recommend using the presented approaches, since the uncertainties cannot be fully quantified yet and a refinement is needed on the basis of more experiments to fully understand the underlying processes and to quantify the uncertainties. The findings summarized above lead to the following recommendations on how to use this type of instrument.
-
When used for vertical profiling, prevalent sharp gradients in RH during the profile have to be considered.
-
The ascending speed of the profiling platform should be reduced, if possible, to decrease the temporal change of RH, but in some scenarios this is simply not possible.
-
Therefore, when fast relative humidity changes cannot be avoided, such periods have to be removed from the dataset or the uncertainties of the measurements based on the presented correction functions must at least be estimated.
-
-
We thus recommend recording the RH of the sampled aerosol. This allows determining RH-change rates and to roughly estimate the bias of RH changes on filter-based absorption measurements with these two instruments.
-
The usage of a dryer is highly recommended because it reduces the amplitude of the excursion in the measurements during fast RH changes.
-
For both instruments we recommend conducting more similar experiments to address the flaws of our study in order to refine the presented correction approaches.
-
Since the response is different in magnitude and sign for both filter materials, we recommend examining the effect for other filter materials as well.
Any used code and the data can be requested via the given corresponding e-mail address.
The multivariate autoregressive integrated moving average model with an exogenous variable (MARIMA-X()) can model the behavior of an observation driven by an exogenous variable. It consists of three parts, namely the autoregressive (AR) part of order p, the moving average (MA) part of order q, and the integrating (I) part, which describes how often (d times) a time series has to be differentiated to be stationary. An MARIMA-X model can be described as
with Yt being the predicted value of the model at the time t. b1Yt−1 to bnYt−n are part of the autoregressive module of the model, with the corresponding coefficients b1 to bn, describing the contribution of each Yt−n to Yt.Xt represents the corresponding independent exogenous variable at time t, whereas the ϵt values are part of the moving average of the model, which accounts for lagged error terms, ϵt, introduced by the model itself. c1 to cn indicate the contribution of ϵt to ϵt−n to Yt. For predictions of a variable, the error term is unknown. A special case of the MARIMA-X model is the MARMA-X model or ARMA-X, in which the integrating part has an order of zero. Detailed information about MARIMA models can be found in Durbin and Koopman (2012) and Lütkepohl (2005). A tutorial for estimating MARIMA models in R is provided by Spliid (2016).
Table B1Coefficients of the linear regression of the instrument response to RH changes (a is slope, b is y intersect, and R2 is the correlation coefficient) for the clean, ammonium sulfate, and BC case for different areal loading densities . The number of data points is represented by n. Bold written entries represent cases with a R2 larger than 0.8. σ indicates the standard deviation of the fitting parameters. For ammonium sulfate, τ not considered.
The authors SD and TM were responsible for the conceptualization of the study. Data curation, investigation, and the development of the methodology was done by SD. Any software for processing and evaluating the data was written by SD and AS. The study was supervised by TM, BW, AS, and AW. All figures were produced by SD. The original draft of the paper was written by SD. The review and editing of the paper was done by SD, TM, BW, AS, and AW.
The authors declare that they have no conflict of interest.
We would like to thank Sascha Pfeiffer very much for his guidance in setting up the experiment and for the introduction to the particle generators. We would also like to express our sincere thanks to Ralf Käthner for his valuable support with data acquisition troubleshooting.
The publication of this article was funded by the
Open Access Fund of the Leibniz Association.
This paper was edited by Pierre Herckes and reviewed by four anonymous referees.
Ackerman, T. P. and Toon, O. B.: Absorption of Visible Radiation in Atmosphere Containing Mixtures of Absorbing and Non-Absorbing Particles, Appl. Opt., 20, 3661–3668, 1981.
Alas, H. D., Müller, T., Birmili, W., Kecorius, S., Cambaliza, M. O., Simpas, J. B. B., Cayetano, M., Weinhold, K., Vallar, E., Galvez, M. C., and Wiedensohler, A.: Spatial characterization of black carbon mass concentration in the atmosphere of a Southeast Asian megacity: An air quality case study for Metro Manila, Philippines, Aerosol Air Qual. Res., 18, 2301–2317, 2018.
Bärfuss, K., Pätzold, F., Altstädter, B., Kathe, E., Nowak, S., Bretschneider, L., Bestmann, U., and Lampert, A.: New Setup of the UAS ALADINA for Measuring Boundary Layer Properties, Atmospheric Particles and Solar Radiation, Atmosphere, 9, 28, https://doi.org/10.3390/atmos9010028, 2018.
B+B Thermo-Technik GmbH, HYT-939 data-sheet, available at: https://shop.bb-sensors.com/out/media/Datasheet_digital_humidity_sensor_HYT939.pdf (last access: 22 October 2019), 2015.
Bond, T. C., Anderson, T. L., and Campbell, D.: Calibration and Intercomparison of Filter-Based Measurements of Visible Light Absorption by Aerosols, Aerosol Sci. Technol., 30, 582–600, https://doi.org/10.1080/027868299304435, 1999.
Cai, J., Yan, B., Ross, J., Zhang, D., Kinney, P. L., Perzanowski, M. S., and Chillrud, S. N.: Validation of microAeth® as a black carbon monitor for fixed-site measurement and optimization for personal exposure characterization, Aerosol Air Quality Res., 14, 1–9, https://doi.org/10.4209/aaqr.2013.03.0088, 2014.
Caroll, B. J.: The accurate measurement of contact angle, phase contact areas, drop volume, and Laplace excess pressure in drop-on-fiber systems, J. Coll. Interface Sci., 57, 488–495, 1976.
Caroll, B. J.: Equilibrium conformations of liquid drops on thin cylinders under forces of capillarity, A theory for the roll-up process, Langmuir, 2, 248–250, 1986.
Cepeda, M., Schoufour, J., Freak-Poli, R., Koolhaas, C., Dhana, K., Bramer, W., and Franco, O.: Levels of ambient air pollution according to mode of transport: a systematic review, The Lancet Public Health, 2, e23–e34, 2017.
Dinar, E., Abo Riziq, A., Spindler, C., Erlick, C., Kiss, G., and Rudich, Y.: The complex refractive index of atmospheric and model humic-like substances (HULIS) retrieved by a cavity ring down aerosol spectrometer (CRD-AS), Faraday Discuss., 137, 275–295, https://doi.org/10.1039/b703111d, 2007.
Durbin, J. and Koopman, S.: Time series analysis by state space methods, Oxford University Press, Oxford, 2012.
Ferrero, L., Castelli, M., Ferrini, B. S., Moscatelli, M., Perrone, M. G., Sangiorgi, G., D'Angelo, L., Rovelli, G., Moroni, B., Scardazza, F., Močnik, G., Bolzacchini, E., Petitta, M., and Cappelletti, D.: Impact of black carbon aerosol over Italian basin valleys: high-resolution measurements along vertical profiles, radiative forcing and heating rate, Atmos. Chem. Phys., 14, 9641–9664, https://doi.org/10.5194/acp-14-9641-2014, 2014.
Ferrero, L., Cappelletti, D., Busetto, M., Mazzola, M., Lupi, A., Lanconelli, C., Becagli, S., Traversi, R., Caiazzo, L., Giardi, F., Moroni, B., Crocchianti, S., Fierz, M., Močnik, G., Sangiorgi, G., Perrone, M. G., Maturilli, M., Vitale, V., Udisti, R., and Bolzacchini, E.: Vertical profiles of aerosol and black carbon in the Arctic: a seasonal phenomenology along 2 years (2011–2012) of field campaigns, Atmos. Chem. Phys., 16, 12601–12629, https://doi.org/10.5194/acp-16-12601-2016, 2016.
Haynes, W. M. (Ed.): CRC Handbook of Chemistry and Physics, 95th Edn., CRC Press LLC, Boca Raton, FL, 2014.
Holder, A., Seay, B., Brashear, A., Yelverton, T., Blair, J., and Blair, S.: Evaluation of a multi-wavelength black carbon sensor, Poster, 10th International Aerosol Conference, St. Louis, MO, 2–7 September, 2018.
Jing, L.: Standard Combustion Aerosol Generator for Calibration Purposes, 3rd ETH Conference on Combustion Generated Nanoparticles, Zurich, Switzerland, 9–10 August, 1999.
Kim, J., Bauer, H., Dobovičnik, T., Hitzenberger, R., Lottin, D., Ferry, D., and Petzold, A.: Assessing optical properties and refractive index of combustion aerosol par ticles through combined experimental and modeling studies, Aerosol Sci. Technol., 49, 340–350, https://doi.org/10.1080/02786826.2015.1020996, 2015.
Lack, D. A., Cappa, C. D., Covert, D. S., Baynard, T., Massoli, P., Sierau, B., Bates, T. S., Quinn, P. K., Lovejoy, E. R., and Ravishankara, A. R.: Bias in Filter-Based Aerosol Light Absorption Measurements Due to Organic Aerosol Loading: Evidence from Ambient Measurements, Aerosol Sci. Technol., 42, 1033–1041, https://doi.org/10.1080/02786820802389277, 2008.
Lütkepohl, H.: Introduction To Multiple Time Series Analysis, Springer-Verlag, Berlin, 2005.
Markowicz, K. M., Ritter, C., Lisok, J., Makuch, P., Stachlewska, I. S., Cappelletti, D., and Chilinski, M. T.: Vertical variability of aerosol single-scattering albedo and equivalent black carbon concentration based on in-situ and remote sensing techniques during the iAREA campaigns in Ny-Ålesund, Atmos. Environ., 164, 431–447, https://doi.org/10.1016/j.atmosenv.2017.06.014, 2017.
Nessler, R., Sheridan, P. J., Ogren, J. A., Weingartner, E., and Hannemann, A.: Effect of humidity on filter-based measurements of the aerosol light absorption, NOAA ESRL Global Monitoring Annual Conference, Boulder, CO, USA, 26–27 April, 2006.
Ogren, J. A.: Comment on “Calibration and Intercomparison of Filter-Based Measurements of Visible Light Absorption by Aerosols”, Aerosol Sci. Technol., 44, 589–591, https://doi.org/10.1080/02786826.2010.482111, 2010.
Ogren, J. A., Wendell, J., Andrews, E., and Sheridan, P. J.: Continuous light absorption photometer for long-term studies, Atmos. Meas. Tech., 10, 4805–4818, https://doi.org/10.5194/amt-10-4805-2017, 2017.
Petzold, A. and Schönlinner, M.: Multi-angle absorption photometry – a new method for the measurement of aerosol light absorption and atmospheric black carbon, J. Aerosol Sci., 35, 421–441, 2004.
Petzold, A., Ogren, J. A., Fiebig, M., Laj, P., Li, S.-M., Baltensperger, U., Holzer-Popp, T., Kinne, S., Pappalardo, G., Sugimoto, N., Wehrli, C., Wiedensohler, A., and Zhang, X.-Y.: Recommendations for reporting ”black carbon” measurements, Atmos. Chem. Phys., 13, 8365–8379, https://doi.org/10.5194/acp-13-8365-2013, 2013.
Ran, L., Deng, Z., Xu, X., Yan, P., Lin, W., Wang, Y., Tian, P., Wang, P., Pan, W., and Lu, D.: Vertical profiles of black carbon measured by a micro-aethalometer in summer in the North China Plain, Atmos. Chem. Phys., 16, 10441–10454, https://doi.org/10.5194/acp-16-10441-2016, 2016.
Rosati, B., Herrmann, E., Bucci, S., Fierli, F., Cairo, F., Gysel, M., Tillmann, R., Größ, J., Gobbi, G. P., Di Liberto, L., Di Donfrancesco, G., Wiedensohler, A., Weingartner, E., Virtanen, A., Mentel, T. F., and Baltensperger, U.: Studying the vertical aerosol extinction coefficient by comparing in situ airborne data and elastic backscatter lidar, Atmos. Chem. Phys., 16, 4539–4554, https://doi.org/10.5194/acp-16-4539-2016, 2016.
Spliid, H.: Multivariate Time Series Estimation using marima, in: Symposium i anvendt statistik 2016, edited by: Linde, P., Danmarks Statistik, 108–123, 2016.
Subramanian, R., Roden, C. A., Boparai, P., and Bond, T. C.: Yellow Beads and Missing Particles: Trouble Ahead for Filter-Based Absorption Measurements, Aerosol Sci. Technol., 41, 630–637, https://doi.org/10.1080/02786820701344589, 2007.
Telg, H., Murphy, D. M., Bates, T. S., Johnson, J. E., Quinn, P. K., Giardi, F., and Gao, R.: A practical set of miniaturized instruments for vertical profiling of aerosol physical properties, Aerosol Sci. Technol., 51, 715–723, https://doi.org/10.1080/02786826.2017.1296103, 2017.
Vecchi, R., Bernardoni, V., Paganelli, C., and Valli, G..: A filter-based light-absorption measurement with polar photometer: Effects of sampling artefacts from organic carbon, J. Aerosol Sci., 70, 4805–4818, https://doi.org/10.1016/j.jaerosci.2013.12.012, 2013.
Wiedensohler, A., Birmili, W., Nowak, A., Sonntag, A., Weinhold, K., Merkel, M., Wehner, B., Tuch, T., Pfeifer, S., Fiebig, M., Fjäraa, A. M., Asmi, E., Sellegri, K., Depuy, R., Venzac, H., Villani, P., Laj, P., Aalto, P., Ogren, J. A., Swietlicki, E., Williams, P., Roldin, P., Quincey, P., Hüglin, C., Fierz-Schmidhauser, R., Gysel, M., Weingartner, E., Riccobono, F., Santos, S., Grüning, C., Faloon, K., Beddows, D., Harrison, R., Monahan, C., Jennings, S. G., O'Dowd, C. D., Marinoni, A., Horn, H.-G., Keck, L., Jiang, J., Scheckman, J., McMurry, P. H., Deng, Z., Zhao, C. S., Moerman, M., Henzing, B., de Leeuw, G., Löschau, G., and Bastian, S.: Mobility particle size spectrometers: harmonization of technical standards and data structure to facilitate high quality long-term observations of atmospheric particle number size distributions, Atmos. Meas. Tech., 5, 657–685, https://doi.org/10.5194/amt-5-657-2012, 2012.
World Health Organization (European Office): Health Effects of Black Carbon, WHO, Copenhagen, Denmark, ISBN: 9789289002653, 2012.
WMO/GAW: Aerosol measurement procedures guidelines and recommendations 2nd edition, GAW Rep. 227, World Meteorological Organisation, Geneva, Switzerland, available at: https://library.wmo.int/doc_num.php?explnum_id=3073 (last access: 22 October 2019), 2016.
Zarzycki, C. and Bond, T. C.: How much can the vertical distribution of black carbon affect its global direct radiative forcing?, Geophys. Res. Lett., 37, L20807, https://doi.org/10.1029/2010GL044555, 2010.
- Abstract
- Introduction
- Experiment
- Results
- Summary and conclusion
- Code and data availability
- Appendix A: Multivariate autoregressive integrated moving average model with an exogenous variable – MARIMA-X
- Appendix B: Table with overview of all investigated cases
- Author contributions
- Competing interests
- Acknowledgements
- Financial support
- Review statement
- References


