the Creative Commons Attribution 4.0 License.
the Creative Commons Attribution 4.0 License.
Tropospheric water vapor profiles obtained with FTIR: comparison with balloon-borne frost point hygrometers and influence on trace gas retrievals
Rebecca R. Buchholz
Emrys G. Hall
Dale F. Hurst
Allen F. Jordan
Retrievals of vertical profiles of key atmospheric gases provide a critical long-term record from ground-based Fourier transform infrared (FTIR) solar absorption measurements. However, the characterization of the retrieved vertical profile structure can be difficult to validate, especially for gases with large vertical gradients and spatial–temporal variability such as water vapor. In this work, we evaluate the accuracy of the most common water vapor isotope (, hereafter WV) FTIR retrievals in the lower and upper troposphere–lower stratosphere. Coincident high-quality vertically resolved WV profile measurements obtained from 2010 to 2016 with balloon-borne NOAA frost point hygrometers (FPHs) are used as reference to evaluate the performance of the retrieved profiles at two sites: Boulder (BLD), Colorado, and at the mountaintop observatory of Mauna Loa (MLO), Hawaii. For a meaningful comparison, the spatial–temporal variability has been investigated. We present results of comparisons among FTIR retrievals with unsmoothed and smoothed FPH profiles to assess WV vertical gradients. Additionally, we evaluate the quantitative impact of different a priori profiles in the retrieval of WV. An orthogonal linear regression analysis shows the best correlation among tropospheric layers using ERA-Interim (ERA-I) a priori profiles and biases are lower for unsmoothed comparisons. In Boulder, we found a negative bias of 0.02±1.9 % (r=0.95) for the 1.5–3 km layer. A larger negative bias of 11.1±3.5 % (r=0.97) was found in the lower free troposphere layer of 3–5 km attributed to rapid vertical change of WV, which is not always captured by the retrievals. The bias improves in the 5–7.5 km layer (1.0±5.3 %, r=0.94). The bias remains at about 13 % for layers above 7.5 km but below 13.5 km. At MLO the spatial mismatch is significantly larger due to the launch of the sonde being farther from the FTIR location. Nevertheless, we estimate a negative bias of 5.9±4.6 % (r=0.93) for the 3.5–5.5 km layer and 9.9±3.7 % (r=0.93) for the 5.5–7.5 km layer, and we measure positive biases of 6.2±3.6 % (r=0.95) for the 7.5–10 km layer and 12.6 % and greater values above 10 km. The agreement for the first layer is significantly better at BLD because the air masses are similar for both FTIR and FPH. Furthermore, for the first time we study the influence of different WV a priori profiles in the retrieval of selected gas profiles. Using NDACC standard retrievals we present results for hydrogen cyanide (HCN), carbon monoxide (CO), and ethane (C2H6) by taking NOAA FPH profiles as the ground truth and evaluating the impact of other WV profiles. We show that the effect is minor for C2H6 (bias <0.5 % for all WV sources) among all vertical layers. However, for HCN we found significant biases between 6 % for layers close to the surface and 2 % for the upper troposphere depending on the WV profile source. The best results (reduced bias and precision and r values closer to unity) are always found for pre-retrieved WV. Therefore, we recommend first retrieving WV to use in subsequent retrieval of gases.
- Article
(7039 KB) - Full-text XML
-
Supplement
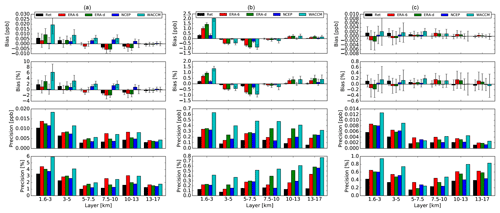
(295 KB) - BibTeX
- EndNote
Water vapor is a ubiquitous atmospheric constituent with an extremely important role in the lower and middle troposphere and stratosphere: it is the most variable and critical greenhouse gas (Kiehl and Trenberth, 1997); it plays a key role in atmospheric chemistry, e.g., heterogeneous chemistry, aerosol formation, and wet deposition (Seinfeld and Pandis, 2006); it affects global radiation through cloud formation (Dessler, 2011); and it acts as the main source for precipitation in the lower atmosphere (Trenberth and Asrar, 2014). Middle and upper tropospheric and lower stratosphere stable water vapor isotopes are key to understanding the water cycle feedbacks such as mixing of air masses, dehydration pathways, and free-tropospheric moisture (Noone, 2012; Galewsky and Rabanus, 2016).
Obtaining consistent long-term observations of vertical distributions of water vapor is challenging but highly desirable in order to understand climate evolution and feedback effects (Held and Soden, 2000). There is a need to measure water vapor vertical distribution for long-term monitoring but there are only a few datasets, e.g., in situ balloon observations in Boulder, Colorado, USA, are the longest dataset of water vapor with information from the lower to middle stratosphere (Oltmans et al., 2000; Hurst et al., 2011b). It has been shown that ground-based Fourier transform infrared (FTIR) measurements provide reliable long-term and continuous observations of the most common water vapor isotope (, hereafter H2O or WV) (Sussmann et al., 2009; Schneider et al., 2010). FTIR measurements have focused mostly on integrated WV analysis among the Network for Detection of Atmospheric Composition Change (NDACC, see http://ndacc.org, last access: 20 January 2019). For integrated WV (IWV, i.e., total columns) FTIR measurements have been shown to be very precise with about 2.2 % using FTIR side-by-side intercomparisons (Sussmann et al., 2009).
MUSICA (Multi-platform remote sensing of isotopologues for investigating the cycle of atmospheric water) is a project within the NDACC FTIR that uses standard spectra from a subset of NDACC sites in order to generate a long-term dataset of tropospheric water vapor profiles with degrees of freedom (DOF) of about 2.8 and of about 1.6 for the ratio between the most abundant isotopologue and the heavy isotopologue HD16O (Schneider et al., 2012, 2016; Barthlott et al., 2017). Comparisons of FTIR and operational radiosondes have been used to validate optimized WV profile retrieval strategies (Schneider et al., 2006; Schneider and Hase, 2009). Vogelmann et al. (2015) studied the spatial–temporal variability in WV in the free troposphere (Zugspitze, Germany) by exploiting the geometry of measurements of differential absorption lidar (DIAL) and FTIR. In particular, they assessed the variability under small space scales and timescales, i.e., a few kilometers and minutes.
In this work, we evaluate the accuracy and precision of WV profiles using a standard retrieval inversion with ground-based FTIR measurements. For the first time, the retrieval validation uses coincident and well-characterized balloon-borne in situ NOAA frost point hygrometer (FPH) measurements (Hall et al., 2016). The FPH measurement technique has been used as a reference to assess the accuracy of radiosonde relative humidity measurements due to their high vertical time resolution and low uncertainties (Suortti et al., 2008; Hurst et al., 2011a). With the goal of assessing WV vertical gradients, we studied both the influence of different WV a priori profiles and the smoothing of highly resolved FPH profiles. Finally, ubiquitous strong WV absorption signatures interfere in the retrieval of other gases. However, there is a lack of knowledge of the quantitative effects of WV at different altitudes. A second major part of this work seeks to use FPH profiles as the ground-truth WV and quantitatively assess the impacts of other typical WV profiles in the retrieval of selected tropospheric gases, hydrogen cyanide (HCN), carbon monoxide (CO), and ethane (C2H6), using NDACC standard retrievals.
2.1 Free tropospheric and boundary layer FTIR sites
FTIR direct solar IR absorption spectra are measured under clear-sky conditions in two different locations: (1) Boulder, Colorado (hereafter BLD; 40.40∘ N, 105.24∘ W, 1600 m a.s.l.) and (2) Mauna Loa, Hawaii (hereafter MLO; 19.40∘ N, 155.57∘ W, 3400 m a.s.l.). The spectra at BLD have been recorded using a Bruker 120 HR spectrometer operated since 2010 following standard measurement protocols of the Infrared Working Group (IRWG)/NDACC (http://ndacc.org). The instrument is located in the foothills laboratory of the National Center for Atmospheric Research (NCAR) situated in the front range of the Rocky Mountains. Previous studies have used the BLD dataset for satellite validation of NH3 (Dammers et al., 2017), mobile low-resolution FTIR validation of NH3 and C2H6 (Kille et al., 2017), and analysis of gases emitted by oil and natural gas development (Franco et al., 2016; Tzompa-Sosa et al., 2016). The MLO instrument has been part of the long-term activities of the IRWG/NDACC. First IR solar absorption spectra were recorded at MLO in 1991 using a Bomem DA02. In 1995 a Bruker 120 HR began operating, which was upgraded in 2011 to a Bruker 125 HR. The high-altitude site at MLO is normally above the boundary layer and the measurements are sensitive mainly to free tropospheric and stratospheric air masses. At both sites the spectra are recorded using optical band pass filters maximizing the signal-to-noise ratio (SNR) over the near- and mid-infrared spectral domain with a nominal spectral resolution of 0.004 cm−1 (optical path difference of 250 cm) using liquid-nitrogen-cooled InSb and mercury cadmium telluride (MCT) detectors and a KBr beam splitter (Hannigan et al., 2009).
2.2 Balloon-borne NOAA frost point hygrometer
Highly precise and accurate in situ measurements of tropospheric and stratospheric WV over Boulder, Colorado, and Hilo, Hawaii, are performed with balloon-borne FPHs by the Global Monitoring Division of NOAA's Earth System Research Laboratory (ESRL). These measurements are also part of the GCOS Reference Upper Air Network (GUAN) and the NDACC. At both sites, balloon-borne FPHs are launched once per month, preferably during conditions of low winds and clear skies. The Boulder measurements started in 1980 and are launched at the Marshall Field Site (1743 m a.s.l.), 10.5 km south of the BLD FTIR measurement site (Oltmans et al., 2000; Scherer et al., 2008; Hurst et al., 2011b). Monthly NOAA FPH soundings at Hilo started in 2010 and the balloons are launched from the National Weather Service facility at Hilo International Airport (10 m a.s.l.), 58.0 km east of MLO. In this paper we emphasize the comparisons at BLD due to the shorter distance between the FTIR and balloon launch site, although we perform identical comparisons and present results from MLO as well.
A thorough description of the FPH measurement technique is available in Hurst et al. (2011b) and Hall et al. (2016). Briefly, the principle is to condense WV from a stream of air onto a small, gold-plated mirror using a cryogenic liquid to continually cool the mirror. Once a thin condensed layer is deposited on the mirror, pulses of heat are applied as needed to maintain a stable layer of condensate. Changes in frost (ice) coverage are detected by measuring the mirror reflectivity using a small LED-based infrared beam and a photodiode. The amount of heat applied is rapidly adjusted to produce a stable frost layer, at which point the temperature of the mirror (frost point temperature) is a direct measure of the partial pressure of WV in the air stream above it via the Goff–Gratch equation (Goff, 1957). The water vapor mixing ratio is calculated by dividing the WV partial pressure by the dry atmospheric pressure. Since a FPH fundamentally makes temperature measurements, only the thermistor embedded in each mirror requires calibration. Each thermistor is calibrated using NIST traceable standards (see Hall et al., 2016). A recent detailed analysis of WV mixing ratios measured by the NOAA FPH shows the uncertainties (2σ) are <12 % for the 0–5 km altitude layer, <8 % for 5–13 km, and <6 % for 13–28 km (Hall et al., 2016). The NOAA FPH vertical profile data employed here are 0.25 km vertical averages and their standard deviations are calculated from the measurements made at 5–10 m vertical resolution during balloon ascent.
Prior to the retrieval of WV from the solar absorption spectra, a quality control of each measurement is carried out, i.e., visual inspection of spectra and assessment of the SNR. As mentioned in Sect. 2.1, we only use spectra taken during cloud-free conditions. The spectra are analyzed using the retrieval code SFIT4 0.9.4, which has been improved from its predecessor SFIT2 (Pougatchev et al., 1995; Rinsland et al., 1998; Hase et al., 2004). SFIT4 derives vertical profiles and the corresponding total vertical columns by exploiting pressure broadening and temperature dependency of specific absorption lines. The overall retrieval follows the optimal estimation method applied to several micro-windows. The inverse problem is ill-posed and the solution is constrained by an a priori profile (xa) and its covariance matrix (Sa), which ideally should represent the natural variability in the WV profile from climatological records (Rodgers, 2000; Rodgers and Connor, 2003). Section 4.3 describes, in more detail, the different a priori profiles used in this study. In many cases Sa is not well-known and an ad hoc constraint is used (e.g., Vigouroux et al., 2015). Constraining is important to select the solution which, among the possible solutions of the ill-posed inversion, is the most likely given prior knowledge. The forward model is nonlinear and the following Gauss–Newton iteration is applied:
where xi+1 is the retrieved state vector for the (i+1)th iteration, K is the weighting function or Jacobian of the forward model (F) calculated at each iteration, Se is the measurement noise covariance matrix, and y is the measurement state vector (Rodgers, 2000).
Many of the spectral windows used to retrieve NDACC standard gases contain WV absorption signatures. Accurate WV profiles are required for the retrieval of other gases because accurate quantification of the interfering WV reduces retrieval uncertainty. WV can be retrieved using a range of absorption features since it absorbs from the near- to far-infrared wavelengths. With the goal of best characterizing this WV, we use retrieval settings that are commonly used among NDACC sites. We use the 2600–2840 cm−1 spectral region to simultaneously retrieve H2O and the isotopologue HDO. In this study, we focus only on H2O. We use spectral micro-windows that are different to those of the current MUSICA version (Barthlott et al., 2017) and perform the inversion on a linear scale (instead of a logarithmic scale used by MUSICA). A short summary of the four micro-windows and interfering species included in the analysis is given in Table 1. These micro-windows have been chosen to maximize the information content and minimize total error. The spectroscopic data used here are based on the line-by-line portion of the HITRAN 2008 (Rothman et al., 2013). The errors in the reported line parameters are described in Sect. 3.1 and are used to estimate the systematic uncertainty in the retrieval. Most of the interfering species are fitted as a scaling of the a priori vertical profile (CO2, N2O, and HCl) with the exception of CH4, which is fit as a profile in micro-windows two, three, and four. The Sa matrix is specified at each layer as a fraction of the a priori profile, which allows for a linear scaled retrieval. We adopted a maximum variability of 50 % in the diagonal covariance, which exponentially decreased with increasing altitude. In order to prevent sporadic vertical profile oscillations, we include a Gaussian correlation length of 25 km in the off-diagonal elements of Sa. This Sa has been optimized in order to obtain similar information content for all a priori profiles presented in Sect. 4.3, a requirement for efficient processing of decades of NDACC spectra. The instrumental line shape (ILS) has been fixed with a unity modulation efficiency and no phase error. The ILS does not play an important role in the WV error budget and is of lower importance for tropospheric WV retrievals (Schneider et al., 2012).
Table 1Micro-windows for H2O retrieval including interfering gases retrieved within those micro-windows. Column gases are those retrieved by profile scaling of the initial profile while profile retrieval is performed for the profile gases column.

Inputs into SFIT4 include vertical profiles of pressure, temperature, and the volume mixing ratios (VMRs) of the atmospheric gases included in the fit. Preceding the retrieval, SFIT4 employs the Air Mass Computer Program for Atmospheric Transmittance/Radiance Calculation (FSCATM) ray tracing module to calculate the atmospheric path (Hannigan et al., 2009). The input pressure and temperature vertical profiles are obtained from the National Center for Environmental Prediction (NCEP) reanalysis based on the NCEP/NCAR analysis and forecast system to perform data assimilation using past data from 1948 to the present (Finger et al., 1993; Wild et al., 1995; Kalnay et al., 1996). These profiles are obtained directly from NDACC (http://ndacc.org). These are daily average profiles that extend to up to 0.4 mb (approximately 50 km). Above 0.4 mb we use the monthly mean pressure and temperature profile from an average of a 40-year simulation (1980–2020) of the Whole Atmosphere Community Climate Model (WACCM) (Garcia et al., 2007). These profiles are merged using a cubic spline interpolation for pressure and a quadratic spline interpolation for temperature.
We examined the effect of using more temporally refined temperature profiles. In general, the 6-hourly temperature profile from the ERA-I reanalysis model, produced by the European Center for Medium-Range Weather Forecasts (ECMWF) (Dee et al., 2011), follows the daily average temperature profile shape very well for both sites. The root-mean-square error (RMSE) between the 6-hourly data of ERA-I and daily average temperature profiles is less than 0.5 % using 2013 data for both BLD and MLO and the biases are less than 0.25 % for BLD and less than 0.1 % for MLO. These results suggest daily mean temperature should be adequate for retrievals but we further investigated the sensitivity of water vapor to this variability and found that water vapor agrees within 1 % if using the daily average profile. The temperature profile uncertainty is considered in the error analysis in Sect. 3.1. With the exception of WV (see Sect. 4.3), VMR input mean profiles of all other gases are taken from the mean of a 40-year run of WACCM.
Characterization and error budget
The mean retrieval fit of the four micro-windows between 2010 and 2016 at BLD is shown in Fig. 1. The small systematic residual structures (black lines) are likely caused by spectroscopic parameter error but in general the magnitude of residuals is low and within noise level (<0.1 %).
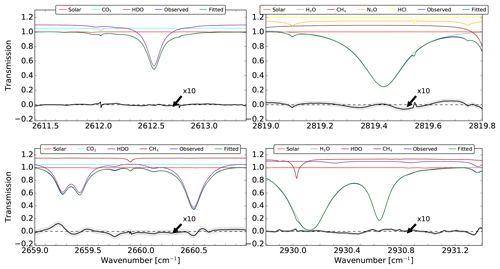
Figure 1Mean retrieval fit between 2010 and 2016 for the spectral intervals of WV. The observed and fitted lines are blue and green, respectively. The absorption contribution for the different species is also shown in each micro-window. The bottom black lines represent the mean residual and the gray shadow is the standard deviation. Note that for visibility the residuals have been multiplied by 10.
The information content of the retrieved WV vertical profile is characterized within the averaging kernel matrix, A:
The rows of the mean A, known as averaging kernels (AKs), obtained between 2010 and 2016 and color coded by altitude below 20 km are shown in Fig. 2a for BLD. The maximum values are located at the surface; then they decrease and remain steady to about 8 km and eventually decrease to zero above 12 km. This indicates that most of the information content is derived from the lower troposphere. The mean total column averaging kernel (TAK) is shown in Fig. 2b. Typically, a unity TAK indicates that the retrieval is not biased, while values of the TAK lower than unity indicate underestimation and larger values than unity indicate overestimation with respect to the a priori state vector. Hence, below 3 km the retrieval may underestimate, between 3 and 8 km overestimate, and between 8 and 12 km underestimate the real WV magnitude. The mean number of DOFs, given by the trace of the A, is 2.4 and indicates the total number of independent pieces of information in the retrieval. The vertical profile of the cumulative sum of DOF is shown in Fig. 2c and shows that the first DOF is given in the layers below 3 km, the second DOF is given between 3 and 6 km, and the rest are given above. Further optimization of the retrieval strategy might improve the A but as explained before, one of the goals is to assess the current retrieval strategy; therefore we do not investigate retrieval constraints further. At MLO the vertical sensitivity is similar but starting at 3.5 km.
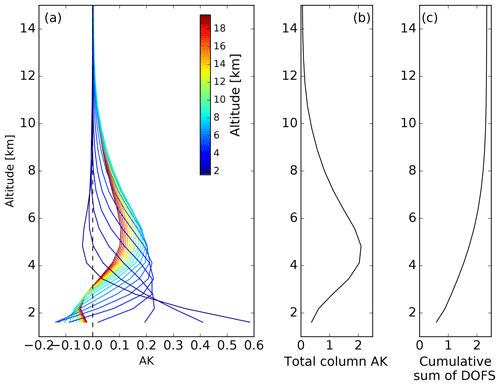
Figure 2(a) FTIR mean row averaging kernels, (b) mean total column averaging kernel, and (c) cumulative sum of DOF of WV obtained in BLD from 2010 to 2016.
SFIT4 estimates an uncertainty budget that combines random, systematic, and smoothing sources following the formalism given in Rodgers (2000). The most important random error is normally the retrieval noise characterized by the SNR in the spectral region of interest. The error covariance matrix (Sn) is calculated with the following equation:
where the gain matrix Gy represents the sensitivity of the retrieval to the measurement and is related with the averaging kernel as A=GyK. Currently, the diagonals of the Se matrix are constructed using the square of the inverse of the SNR obtained from the noise in the spectra of interest, and off-diagonal elements are not considered. The retrieval of WV is actually an estimate of a state smoothed by the averaging kernel. The difference between these two states is given by the smoothing error (Ss):
where I is a unit matrix. The smoothing error is treated separately and not included in the total error analysis because Sa is normally not well-known and consequently is often simplified. The model parameter error represents the errors in the forward model parameters such as temperature, solar zenith angle (SZA), and spectroscopic parameters. These errors can contain both systematic and random components. We obtain the model parameter covariance matrix as
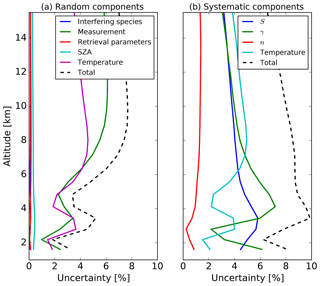
where Sb is the error covariance and Kb the weighting function matrices of the forward model parameters. The largest contributors considered here are the absorption line parameters, temperature profiles, and SZA. The uncertainty of the absorption line parameters, i.e., line intensity (S), air-broadened half width (γ), and temperature dependence of γ (n), are taken from the lower limit reported in HITRAN 2008 (Rothman et al., 2013). These uncertainties are only considered systematic and the errors reported in HITRAN for WV are 5 %, 1 %, and 10 % for S, γ, and n, respectively. Furthermore, uncertainties due to the retrieved interfering species are also considered. The error in the temperature profile is considered to have both systematic and random components.
These errors have been quantified with the mean (systematic) and standard deviation (random) of the difference of long-term comparisons among NCEP profiles with radiosondes launched near the sites and/or ERA-I reanalysis. The measurement noise error is estimated with the square of the inverse of the SNR as diagonal elements in the covariance matrix. The pointing accuracy in the SZA is considered random and has been characterized with an error of 0.15∘. Figure 3 shows the random and systematic vertical profile uncertainties as percentages with respect to the mean mixing ratio. The major systematic components in the lower troposphere are the absorption line parameters S and γ but in the upper troposphere the temperature contributes equally. The temperature and measurement noise are the main components of the random uncertainty. The final uncertainty is estimated from the error propagation of all components and is lower than 10 % below 4 km and about 10 % above. The instrumental line shape uncertainty plays a minor role in the total error budget.
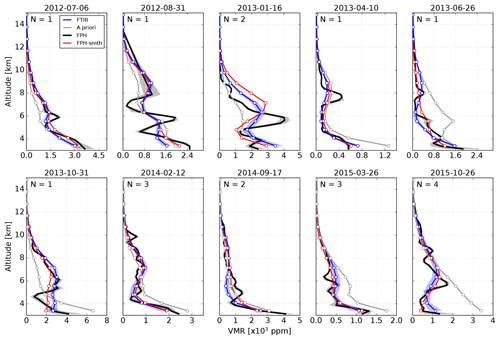
The total number of sonde observations is 90 at Boulder and 70 at Hilo from 2010 to 2016. The overall number of coincident dates of measurements under ideal conditions is 56 and 36 for BLD and MLO, respectively. Figure 4 presents a rough qualitative comparison of selected WV profiles obtained with NOAA FPH measurements and FTIR retrievals in BLD. To retain high vertical variability the FPH profiles are shown in 0.25 km vertical averages of the sonde's ascent measurements (continuous black lines). The FTIR profiles (in blue) represent the average profile weighted by the error and the blue shading depicts the uncertainties propagated using the individual profiles within 2 h of the FPH launch. The daily mean ERA-I (henceforth ERA-d) a priori profiles used in the retrievals are also shown in gray.
To quantitatively compare both measurements the high-vertical-resolution balloon-borne profiles are re-gridded onto the altitude grid of the FTIR retrieval by means of a linear interpolation. For BLD the nearest FPH point to the surface is typically a few hundred meters above the first grid point of the FTIR. In this case, we assume homogeneous WV close to the surface and use the nearest-neighbor point. A proper comparison between FTIR and in situ sonde profiles requires smoothing the in situ measurements using the FTIR AKs and a priori profiles to account for its lower-vertical-resolution capability (see Eq. 4 in Rodgers and Connor, 2003). Red profiles in Fig. 4 represent smoothed FPH profiles. As pointed out by Schneider et al. (2006) the information of the WV AK is limited due to its high variability through the troposphere. A goal of the present study is to determine the extent of vertical structure gradients of retrieved WV profiles; hence the comparison with in situ sonde measurements is carried out mainly without smoothing. However, results are also presented for smoothed comparisons following the formalism given in Rodgers and Connor (2003).
The temporal variability and its effect are studied in Sect. 4.1. To some extent the retrieved WV profiles capture the vertical structure gradients identified with the in situ NOAA FPH even though the a priori profile may be biased and smooth (see for example 14 September 2010 and 5 November 2010). Figure 5 shows the same but for selected vertical profiles at MLO. The near-surface mixing ratios at this high-altitude site are significantly lower and the profiles show steeper vertical gradients than at BLD. Note that the FTIR (MLO) and FPH (Hilo) are about 60 km apart and, on some days, may have measured different air masses, especially at the lowest FTIR retrieval levels. In BLD the launch site of the FPH is only 10 km south of the ground-based FTIR.
Due to the limited number of DOF we combine grid points to assess several layers, maximizing the number of points characterizing the boundary layer, free troposphere, and upper troposphere–lower stratosphere. The following layers have been chosen for BLD: 1.5–3.0, 3.0–5.0, 5.0–7.5, 7.5–10, 10–13, and 13–17 km above sea level (a.s.l.) and 3–5.5, 5.5–7.5, 7.5–10, 10–13, 13–16, and 16–20 km a.s.l. for MLO. These layers have been chosen so that they include three standard IRWG FTIR grid points. Comparison of ground-based remote sensing with balloon-borne in situ measurements is challenging due to spatial–temporal variability. The temporal and spatial variability are characterized in the next two sections followed by the quantitative comparison between FTIR and NOAA FPH.
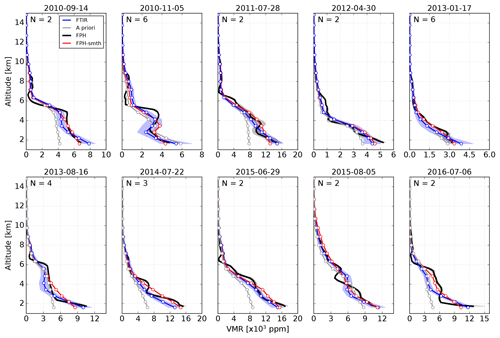
Figure 4WV vertical profiles for selected dates obtained with unsmoothed in situ NOAA FPH measurements (black) and FTIR retrievals (blue) in BLD. The ERA-d WV used as the a priori profile is shown in gray. The dates are shown at the top of each plot. The FTIR profiles represent weighted mean profiles using retrievals within 2 h of the radiosonde launch. The filled blue shadow area represents the standard error propagation using the uncertainty in individual retrievals. The gray shaded areas are FPH profiles of the 1-sigma standard deviation of each mixing ratio. The number of retrieved profiles within 2 h is shown in the upper left of each panel.
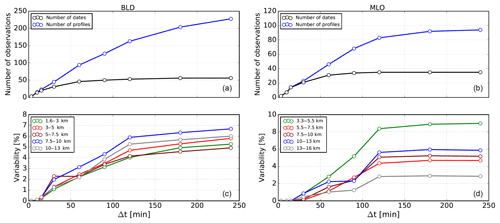
Figure 6Panels (a, b) show the number of dates (black) and profiles (blue) measured by the FTIR at BLD (a, c) and MLO (b, d) as a function of the length of the time interval in minutes. The bottom panels show the temporal variability in percent estimated with the ratio of the standard deviation to the mean values for several layers as a function of the length of the time interval. The length of the time intervals are defined as an increasing temporal window, e.g., 0–30, 0–60, 0–120 min, and the number of retrievals in each window is used to calculate the variability.
4.1 Temporal variability
Due to the lack of independent time-resolved WV vertical profiles we use daily FTIR observations to assess the temporal variability. Figure 6 shows the number of dates and profiles and the variability in WV as a percentage for several layers as a function of the length of time interval starting from 0 to 3 min and gradually increasing, 0 to 10, 0 to 30, 0 to 60 min, etc. The retrievals produced during these time intervals are used to calculate the temporal variability using the ratio of the standard deviation to the mean values at several altitude layers. This approach is sensitive only to the variability observed by the FTIR; however the real variability might be greater because of potential lost variability during retrieval smoothing. This proxy for variability has been estimated using dates during coincident measurements between sondes and FTIR. The number of dates and profiles is roughly the same below 10 min, indicating the time that the FTIR takes to start a new measurement using the same band-pass filter for a standard set of observations. The variability in BLD among different layers does not vary substantially and they remain within 1 %–2 % of each other, indicating similar relative variability within all the different tropospheric layers. In BLD the variability starts to increase from about 1 % in 30 min to 6 % in 240 min. In contrast, at MLO the variability is different among layers. A variability of up to 9 % is found for the layer close to the instrument altitude (3–5.5 km); however the variability is below 5 % for the layer between 5.5 and 7.5 km and about 3 % for the 13–16 km layer, indicating vigorous fluctuations and strong convection near the MLO site. In general, these findings suggest that the coincidence time interval to avoid variability larger than 2 % is 30 min at BLD and 60 min at MLO. The air mass probed by the FTIR is changing during the day due to the line of sight to the sun moving constantly such that after some time the spatial variability may play an important role. Vogelmann et al. (2015) estimated that the spatial mismatch may play a role for intervals longer than 30 min. The spatial mismatch is described in the next section.
4.2 Spatial mismatch
If the spatial mismatch between the FTIR and sonde is considerably large, each might probe distinctive air masses. Hence, natural WV variability would affect a meaningful comparison (Sussmann et al., 2009; Vogelmann et al., 2015). A thorough assessment of the error component due to spatial difference between the sonde and FTIR would require measurements of an extensive area simultaneously and at different altitudes. However, this is hard to derive due to lack of such observations. In this section, we aim to estimate the spatial mismatch between the sonde location at various altitudes and FTIR maximum sensitivity. We calculate the horizontal distance between the sonde location and the line of sight of the FTIR. The effective horizontal position sensitivity of the FTIR depends on the sun-pointing geometry and the vertical WV profile distribution. We adopted a methodology applied by Vogelmann et al. (2015) to estimate this effective horizontal position. This method assumes that the FTIR sensitivity is located at the point at which the viewing direction of the instrument meets the altitude level of the mass-weighted WV profile. Using the mass-weighted WV of all sonde profiles we roughly estimate an altitude of 3.8±0.9 km in BLD. Using this altitude and the SZA the horizontal distance from the ground-based site is calculated for every measurement. Then, using the solar azimuth angle the latitude and longitude are calculated after having traveled the given distance on the given bearing. Once the location is found the haversine formula is applied to determine the great-circle distance between two locations (Korn and Korn, 2000). At BLD the mean distance with respect to the FTIR site location is 6.0±4.0 km south, making the initial spatial mismatch with the sonde launch about 6.5 km. At MLO the mass-weighted WV profile is 6.0±0.6 km and the initial spatial horizontal mismatch is 47.0 km (see Fig. S1 in the Supplement). Consequently, even co-located sonde launches may not exactly probe the same air mass.
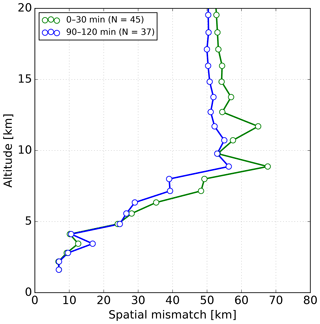
The spatial mismatch at different altitudes depends on the sonde trajectory and the location of the FTIR sensitivity. At BLD the GPS location of the sonde at every altitude is available for almost all profiles; hence the distance between the FTIR and the sonde location can be calculated. Figure 7 shows the mean spatial mismatch between the FTIR and the sonde profiles for the coincident time intervals of 0–30 and 90–120 min. As mentioned above, the initial spatial difference close to the surface is about 6 km. For the 0–30 min interval the horizontal difference is below 10 km below 4.5 km in altitude, similarly for the 90–120 min coincident time interval, except for one altitude, which is greater than 15 km. Above 5 km in altitude the spatial mismatch starts to increase. A rapid significant increase in the spatial mismatch is identified above 5 km for both 0–30 and 90–120 min coincident time intervals. Interestingly, the greatest horizontal difference is found for the 0–30 min interval with maximum values of about 70 km. This analysis shows that the spatial mismatch depends on the complex convective dynamics and not only in the coincidence time interval. Nevertheless, only short temporal coincidence differences are encouraged to avoid temporal WV fluctuations as shown above.
4.3 Influence of a priori profiles
The optimal estimation method is influenced by the a priori profile because it may bias the solution of Eq. (1). Since WV is highly variable, even on the timescale of hours, using the most accurate a priori profile might improve the retrieval results. In general, the retrieval of WV can be seen as an update of the a priori information. In order to study the effect of the a priori, four different a priori profiles are used to retrieve WV, which are then compared with balloon-borne NOAA FPH measurements: (1) a 40-year simulation (1980–2020) of the WACCM mean profiles (WACCM is a global model with 66 vertical levels from the ground to approximately 140 km in geometric height, and the horizontal resolution is 1.9∘ by 2.5∘ (latitude by longitude) and is part of the NCAR Community Earth System Model (for further details see Garcia et al., 2007; Marsh et al., 2013; Kinnison et al., 2007)); (2) daily varying (ERA-d) profiles; and (3) 6-hourly varying WV vertical profiles (00:00, 06:00, 12:00, and 18:00 UTC) obtained from ERA-I (ERA-6). In this case, the closest in time to the measurements is used. ERA-I profiles extend to 1 mb and then are merged with WACCM monthly mean profiles of WV using a spline interpolation. We take the closest ERA-I grid point to represent the a priori at each station, and we use (4) daily varying NCEP/NCAR (NCEP-d) reanalysis WV profiles (Kalnay et al., 1996). Since the spatial resolution of NCEP is lower than ERA-I, about ∘, we interpolate WV spatially to obtain the best WV profile. We have chosen the above four a priori profiles since they are readily available and commonly used. With the aim being to capture vertical gradients, the comparisons are carried out with unsmoothed and smoothed in situ profiles.
An optimization of the dataset is carried out before the quantitative assessment of vertical profiles. The difference between WV retrievals and sonde profiles () shows a normal distribution centered around zero for the layers defined in Sect. 4. Figure S2 in the Supplement shows an example of the Δx distribution using ERA-d for the different layers. Extreme outliers are identified for each distribution using the 95th percentile and values above that are filtered out in order to avoid skewed results. Figure S3 shows the 95th percentile of the Δx as a function of the different a priori sources and for different layers. The lowest values are found for both ERA-d and ERA-6, and about 25 % larger values are found for both NCEP and WACCM. Additionally, the difference between WV retrievals and a priori profiles (xr−xa) provides further evidence in the measured signal and to some extent the variability prescribed by the a priori profile (Rodgers and Connor, 2003). For example, this difference is about 11±38 % using ERA-6 while for WACCM it is about 29±32 % for the first layer. As we expected, from these observations it can be seen that the 40-year WACCM climatology as an a priori profile results in greater deviations compared to ERA-6.
A quantitative impact of the different a priori profiles in the retrieval of WV vertical profiles is characterized by means of linear regression and statistical analyses using the layers defined earlier. Since both NOAA FPH and FTIR have altitude-dependent uncertainties, we adopted a weighted orthogonal distance regression (ODR) analysis. For a thorough description of weighted ODR applied in atmospheric sciences see Wu and Yu (2018). In order to avoid temporal variability larger than 2 % according to conclusions in Sect. 4.1, a mean WV profile () is obtained within a coincidence time interval of 0–30 min at BLD and 0–60 min for MLO. The NOAA FPH WV mixing ratios are used in the abscissa axis and the ODR accounts for uncertainties in both sets of measurements. In this case we use the standard deviation of the NOAA FPH and FTIR uncertainty propagated using the individual profiles within the coincident time interval. The final number of vertical profiles used in the comparison is 31 and 30 in BLD and MLO, respectively. Figure 8 shows the slope, intercept, and correlation coefficient (r value) obtained with the comparison of retrievals using each of the a priori profiles with the unsmoothed NOAA FPH at different layers at both sites. The error bars in the estimated parameters are the standard errors. For layers below 10 km the best results are seen with both ERA-I a priori profiles. In particular, we found that ERA-6 yields the best comparison with a slope close to unity, the lowest intercept, and a correlation coefficient of 0.95 for the layer of 1.5–3 km in BLD. For both sites, the second layer, i.e., 3–5 and 5.5–7.5 km for BLD and MLO, respectively, shows lower slopes likely due to gradients between the top of the planetary boundary layer and free troposphere that are not captured by the retrievals due to coarse vertical resolution and lower sensitivity (e.g., see Figs. 4 and 5).
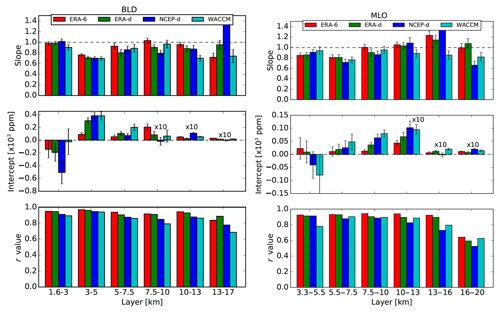
Figure 8Results of the ODR analysis between the NOAA FPH and FTIR using different a priori profiles at different altitude layers. Error bars represent the standard errors of the estimated parameters. Note that for visibility the intercept obtained in the upper three layers has been multiplied by a factor of 10.
For each coincidence profile the bias is characterized with the sum of differences between and the sonde (xs) profiles divided by the number of points (N) in each layer. As described before the number of points in each layer is three. This definition indicates whether the retrievals under- or overestimate the sonde values. The precision is calculated as , where σ is the standard deviation. The bar plot in Fig. 9 shows the median bias and precision in parts per million and percentage with respect to the mean values of the NOAA FPH for the different layers and a priori profile. The error bars in the bias are estimated using the standard error of the distribution. The bias shows the dependency on the a priori profile. At both sites the first two layers show a negative bias for all a priori profile. At BLD the smallest bias is found for the 1.5–3 km layer with ppm ( %) for ERA-6 and the highest bias of ppm ( %) for WACCM climatology. The layer between 3 and 5 km shows a negative bias of between 5.56 % and 11.14 %. Interestingly, NCEP-d yields less biased results in this layer. The layer of 13–17 km shows significantly larger values for almost all a priori profiles (>15 %). The precision does not change significantly among different a priori profiles. The best precision result as a percentage is below 5 %, found in the lowest layer of 1.5–3 km, and the highest values of up to 15 % are found for layers between 5 and 10 km. As expected based on the ODR analysis higher biases are found at MLO. Negative biases of about 5 % for the 3.5–5 km layer and 10 % for the 5.5–7.5 layer are found and a positive bias of 5 % is found for the 7.5–10 km layer. Surprisingly, at both sites WACCM yields a lower bias for the layers above 13 km. In general among all layers, the lowest biases are found using ERA-6 and ERA-d for both sites.
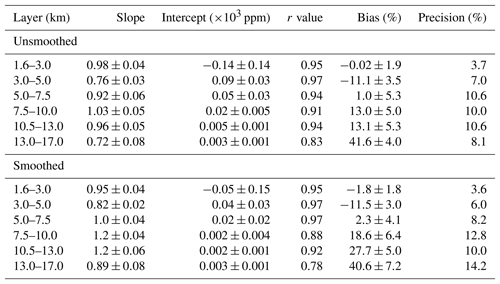
The approach described above has been applied in the comparison of FTIR with smoothed FPH profiles. Table 2 presents a summary of the ODR and statistical analysis using ERA-6 for unsmoothed and smoothed FPH profiles at BLD where the spatial mismatch is known and the launch of the sonde is in close proximity to the FTIR location. Among all layers the ODR analysis shows similar results between unsmoothed and smoothed FPH comparisons; however biases are significantly lower for unsmoothed comparisons, indicating the limitation of the AK WV.
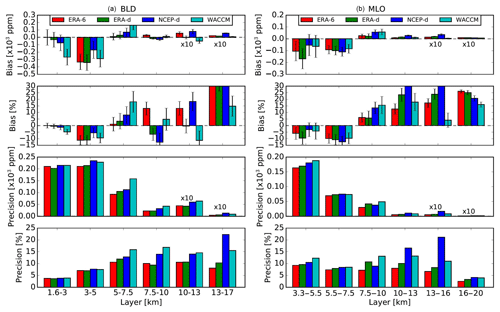
Figure 9Statistical analysis results (bias and precision) of the FTIR WV retrieved at different altitudes and using different a priori profiles for BLD (a) and MLO (b). Bias and precision are given in mixing ratios and as percentages with respect to the mean values at each layer. The error bars in the bias represent the standard error of the distribution. Note that for visibility the bias and precision in mixing ratio from the two upper layers have been multiplied by a factor of 10.
Table 2Summary of the ODR and statistical analysis using ERA-6 at BLD. Results for unsmoothed (upper level) and smoothed (lower level) FPH comparisons are shown.
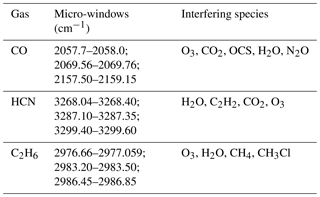
Absorption of WV is normally present in the analysis of gases using FTIR measurements. Even optimized micro-windows of gases include the WV and/or isotopologue absorption lines in order to minimize its interference. In this context, WV profiles are included in the retrieval process of other atmospheric gases. Usually, the most accurate WV profile is recommended. However, highly accurate and co-located WV profile measurements are rare and typically reanalysis based or pre-retrieved WV profiles are used as reference in the retrieval of other gases. In the latest case, WV is retrieved in dedicated micro-windows and then the retrieved WV profile is used in the retrieval of other gases (Vigouroux et al., 2012; García et al., 2014; Sepúlveda et al., 2014). Sussmann and Borsdorff (2007) studied the impact of WV interference in the retrieval of carbon monoxide (CO) and further apply a joint retrieval strategy to remove interference errors. There are few published data on the quantitative impact of the WV profile using independent co-located WV profiles. Findings from previous sections provide important insights into how well the retrieved WV, and other WV priors, compare with the real WV profile, in this case the NOAA FPH. In this section, we further exploit the FPH measurements in order to study the influences of different WV profiles typically used in the retrieval of selected tropospheric gases, i.e., hydrogen cyanide (HCN), carbon monoxide (CO), and ethane (C2H6). The WV sources tested are ERA-6, ERA-d, NCEP, WACCM, and the retrieved WV profiles. Note that we do not aim to study retrieval strategies of gases or the validation of profile retrievals but rather to show the relative difference with respect to the higher-precision WV profile (FPH measurements). Table 3 presents the interfering species with strong and/or weak absorption signatures within each micro-window for all target gases. In all cases, the selected settings have been chosen in order to maximize the information content and minimize the total error in the retrieval. The settings we follow are IRWG/NDACC standard operational retrieval parameters with respect to micro-windows and interfering species. The WACCM climatology is used for a priori profiles of interfering species. Spectroscopic line parameters are adopted from HITRAN 2008 (Rothman et al., 2009, 2013). For the retrieval of HCN we followed a similar approach to that applied in Paton-Walsh et al. (2010), Vigouroux et al. (2012), and Viatte et al. (2014). The settings applied in the CO retrieval are part of an ongoing project in the IRWG/NDACC (Bavo Langerock, personal communication, 2017), and for C2H6 we applied an improved version applied in Franco et al. (2015) (Emmanuel Mahieu, personal communication, 2017). Pressure and temperature profiles are from NCEP. For the retrieval of WV we use ERA-d to imitate our typical retrieval strategy. As for WV, full error analysis is performed, i.e., mainly considering measurement noise error and forward model parameter errors (see Sect. 3.1).

Figure 10Example on 22 July 2014 of retrieval profiles of HCN, CO, and C2H6 using the different WV a priori sources shown in (a). The retrieval profiles in (b) and (c) represent the relative difference as a percentage with respect to the retrieval, which uses NOAA FPH WV.
The retrieval of HCN, CO, and C2H6 was performed only during dates with NOAA FPH sonde measurements. Since the FPH profiles are used as the reference we have limited spectra taken only within 1 h of the sonde launch based on findings presented earlier. In all cases, the standard settings remain the same and only the WV profile reference is changed. An example of the effect of the WV profile in the retrieval of the different gases is shown in Fig. 10. The different WV profiles used on this day (22 July 2014) are shown on top. The retrieved WV (black) is the closest in shape and magnitude to the NOAA FPH profile (purple). All the other WV profiles show significant differences with respect to the FPH. The gas profile retrievals are shown in the left panels using a color scheme similar to that in the WV profile panel. The relative difference at every retrieval level, defined as , is shown in the right panels. The lowest relative difference in all grid points and for all gases always occurs when using the retrieved WV profile (black). All other WV sources present significant differences. For example, for HCN differences of up to −20 % are found at 6–10 km if using ERA-I. CO and C2H6 also show important differences but always below 10 %. This example suggests that the current retrieval strategy of WV is suitable to avoid WV interference in the retrievals of other trace gases.
In order to determine the general impact of the different WV sources for all spectra recorded within 1 h of sonde launch for 6 years, we have performed an ODR and statistical analysis similar to the one presented in Sect. 4.3. In this case, the retrieval using NOAA FPH WV is used as the reference. Figure 11 shows the main results of the ODR analysis for the three gases using the different WV sources and at different layers. The best correlations (r value) and the lowest intercepts are found using the pre-retrieved WV profiles for all three gases, in agreement with the example given in Fig. 10. The slope values are close to unity and within the uncertainty values for CO (middle) and C2H6 (right) using the pre-retrieved WV. However, HCN on the left shows the most notable difference with respect to unity. The intercept is normally negligible for pre-retrieved WV for all gases. The bias and precision results are shown in Fig. 12. Biases larger than 6 % and 1 % are found for HCN and CO, respectively, using WACCM WV in the layer closest to the surface. C2H6 does not show a significant bias among different layers and WV sources. Overall, these results suggest that incorporating the pre-retrieved WV in the forward model improves the quality of other retrieved gases.
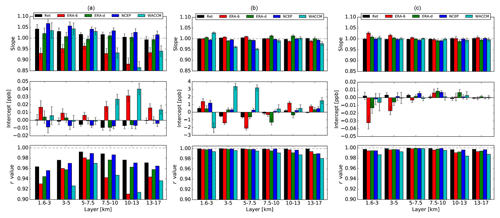
Figure 11Results of the ODR analysis in which the mixing ratios using different WV sources at different layers are compared with the “truth” retrieved values using the NOAA FPH WV for HCN (a), CO (b), and C2H6 (c). Error bars represent the standard errors of the estimated parameters.
The aim of the present research was to determine the limitations in retrieving real WV structural variability from the boundary layer to the upper troposphere using a standard FTIR inversion, i.e., the current retrieval strategy is not modified to correlate well with reference vertical profiles. Highly precise and accurate vertical profiles of WV from NOAA balloon FPH in situ sondes are used for the first time as reference to evaluate FTIR WV profiles in BLD and MLO, allowing the characterization of the retrievals in midlatitude boundary layer and subtropical free troposphere locations.
The spatial–temporal variability in WV is inferred prior to a quantitative comparison. By using daily continuous FTIR measurements we derive a temporal variability for different altitudes and find that at BLD the different layers are highly correlated and show comparable variability. In contrast, at MLO the variability among layers is quite different, indicating vigorous inhomogeneity due to local convection or long-range transport. The ideal coincidence time between sonde launch and FTIR measurements is 0–30 and 0–60 min in BLD and MLO, respectively, to avoid variability larger than 2 % for all altitudes. The horizontal position with maximal sensitivity of WV distribution is derived for each FTIR measurement. Then, based on the sonde location at each altitude the horizontal spatial mismatch is characterized. The insight gained from this evaluation is that the boundary layer (about 1.5 to 3 km in Boulder) is the only layer in which the air mass probed by the FTIR and NOAA FPH in situ is likely unchanged since the horizontal difference remains below 10 km. We show that above 5 km the spatial mismatch increased significantly up to 60 km horizontal distance at about 10 km in altitude. This feature does not depend on the coincidence time between measurements but rather on the local to synoptic meteorological scales. More broadly, even co-located FTIR and sonde launch measurements would have significant horizontal mismatches at different altitudes. Further work is needed to establish the best methodology to validate FTIR profile retrievals while avoiding a difference in measurement geometries.
This work offers a new assessment of the accuracy and precision of FTIR retrievals at different altitudes. The analysis consists of the comparison of WV for several atmospheric layers using ODR and statistical analysis, i.e., estimation of accuracy and precision. Furthermore, we study the effect of different WV a priori profiles commonly used among NDACC stations (ERA-I, NCEP, and WACCM profiles) and the limitations of the FTIR WV averaging kernels by comparing unsmoothed and smoothed FPH profiles with FTIR retrievals. The following overall conclusions can be drawn from the unsmoothed comparison of WV using several layers: (1) using 6-hourly and daily ERA-I a priori profiles shows the best correlation and comparison at both sites; (2) the lowest bias and precision are found in the closest layer to the instrument (1.5–3 km at BLD and 3–5 km at MLO). At BLD, we report a negligible negative bias of ppm ( %) and precision of 0.21×10³ ppm (3.7 %) for the 1.5–3 km layer while at MLO the bias is ppm ( %) and the precision is 0.16×10³ ppm (9.2 %) for the 3–5.5 km layer, which are larger likely due to the significant spatial mismatch difference between the locations of measurements; (3) high vertical variability probed by the sonde in the second layer is not fully captured by the retrievals, although it is considerably better than a priori profiles; (4) and one significant finding to emerge is that the retrievals show encouraging results in the 10.5–13.5 km layer at BLD and at 13–16 km at MLO (roughly the UTLS layer) with 13.1±5.3 % (BLD) bias and a precision of 10.6 % (BLD) but the bias increases to about 40 % above this layer. Table 2 was constructed to show a representative analysis when the spatial mismatch is known and when the location of the FTIR and the launch of the sonde are near each other. In this table results are shown for unsmoothed and smoothed FPH profiles. According to these results we infer that the interpretation of the averaging kernels and degrees of freedom are quite conservative and WV retrievals contain more information than expected. Among all layers, the biases are lower for unsmoothed FPH profiles, indicating limitations of WV averaging kernels. The findings of this study show that FTIR profiles can be used to evaluate long-term records of WV in several unique partial columns in the troposphere. Further research would explore the additional WV absorption features in order to improve the information content, e.g., micro-windows employed in the latest MUSICA version. Also, as we show, the ERA-I WV profiles yield lower biases; hence we would construct a priori covariance matrices for these that maximize accuracy and vertical structure.
The second goal of this study was to investigate the influence of WV in the retrieval of other tropospheric gas profiles with DOF larger than 2. Here we present results for three important gases, i.e., HCN, CO, and C2H6, using the WV NOAA FPH profile as reference and comparing to other WV profiles, including the retrieved WV, ERA-I, NCEP, and WACCM profiles. In general, our results recommend retrieving WV profiles first then using them as input to the retrievals of other gases in order to reduce bias due to an imperfect WV vertical profile. As an example (Fig. 10) we show relative differences of up to 25 % at 8 km, 8 % at 4 km, and 10 % at 3 km for HCN, CO, and C2H6 if WV is not retrieved beforehand and used as the input WV profile. Overall, a statistical comparison of all profiles in the 1.5–3.0 km layer shows a significant impact on HCN (about 6 % bias), moderate impact on CO (about 1.2 % bias), and low impact on C2H6 (<0.5 % bias). This sensitivity study is the first comprehensive quantitative investigation in this topic and provides a basis for future error budget assessment. In principle we hypothesize that the effect of WV profiles might be larger in humid regions within the boundary layer but further research should be carried out to establish its quantitative importance.
The NCAR FTIR water vapor retrievals can be obtained from the authors upon request. Vertical Profile of Water Vapor from Balloon flight NOAA can be accessed through the websites ftp://aftp.cmdl.noaa.gov/data/ozwv/WaterVapor/Boulder_New/ and ftp://aftp.cmdl.noaa.gov/data/ozwv/WaterVapor/Hilo_New/ (last access: 4 February 2019).
The supplement related to this article is available online at: https://doi.org/10.5194/amt-12-873-2019-supplement.
JWH installed the FTIRs. EGH, DFH, and AFJ implemented and evaluated the FPH measurements. IO, RRB, and JWH performed FTIR measurements. IO and JWH evaluated the FTIR measurements and designed the analysis. IO prepared the paper with contributions from all co-authors.
The authors declare that they have no conflict of interest.
The National Center for Atmospheric Research is sponsored by the National Science Foundation. Any opinions, findings, and conclusions or recommendations expressed in this publication are those of the author(s) and do not necessarily reflect the views of the National Science Foundation.
This study has been supported under contract by the National Aeronautics and
Space Administration (NASA). We are grateful to the NOAA staff at MLO for
technical support and maintenance of the NCAR FTIR. Especially, we wish to
thank Paul Fukumura. We would like to thank David Nardini and Darryl Kuniyuki
for diligently preparing and launching the NOAA FPH instruments monthly from
Hilo, Hawaii. We thank Helen Worden for her valuable suggestions during the
NCAR internal review.
Edited by: Martin Riese
Reviewed by: Matthias Schneider and one anonymous referee
Barthlott, S., Schneider, M., Hase, F., Blumenstock, T., Kiel, M., Dubravica, D., García, O. E., Sepúlveda, E., Mengistu Tsidu, G., Takele Kenea, S., Grutter, M., Plaza-Medina, E. F., Stremme, W., Strong, K., Weaver, D., Palm, M., Warneke, T., Notholt, J., Mahieu, E., Servais, C., Jones, N., Griffith, D. W. T., Smale, D., and Robinson, J.: Tropospheric water vapour isotopologue data (, , and HD16O) as obtained from NDACC/FTIR solar absorption spectra, Earth Syst. Sci. Data, 9, 15–29, https://doi.org/10.5194/essd-9-15-2017, 2017. a, b
Dammers, E., Shephard, M. W., Palm, M., Cady-Pereira, K., Capps, S., Lutsch, E., Strong, K., Hannigan, J. W., Ortega, I., Toon, G. C., Stremme, W., Grutter, M., Jones, N., Smale, D., Siemons, J., Hrpcek, K., Tremblay, D., Schaap, M., Notholt, J., and Erisman, J. W.: Validation of the CrIS fast physical NH3 retrieval with ground-based FTIR, Atmos. Meas. Tech., 10, 2645–2667, https://doi.org/10.5194/amt-10-2645-2017, 2017. a
Dee, D. P., Uppala, S. M., Simmons, A. J., Berrisford, P., Poli, P., Kobayashi, S., Andrae, U., Balmaseda, M. A., Balsamo, G., Bauer, P., Bechtold, P., Beljaars, A. C. M., van de Berg, L., Bidlot, J., Bormann, N., Delsol, C., Dragani, R., Fuentes, M., Geer, A. J., Haimberger, L., Healy, S. B., Hersbach, H., Hólm, E. V., Isaksen, L., Kållberg, P., Köhler, M., Matricardi, M., McNally, A. P., Monge-Sanz, B. M., Morcrette, J.-J., Park, B.-K., Peubey, C., de Rosnay, P., Tavolato, C., Thépaut, J.-N., and Vitart, F.: The ERA-Interim reanalysis: configuration and performance of the data assimilation system, Q. J. Roy. Meteor. Soc., 137, 553–597, https://doi.org/10.1002/qj.828, 2011. a
Dessler, A. E.: Cloud variations and the Earth's energy budget, Geophys. Res. Lett., 38, l19701, https://doi.org/10.1029/2011GL049236, 2011. a
Finger, F. G., Gelman, M. E., Wild, J. D., Chanin, M. L., Hauchecorne, A., and Miller, A. J.: Evaluation of NMC Upper-Stratospheric Temperature Analyses Using Rocketsonde and Lidar Data, B. Am. Meteorol. Soc., 74, 789–800, https://doi.org/10.1175/1520-0477(1993)074<0789:EONUST>2.0.CO;2, 1993. a
Franco, B., Bader, W., Toon, G., Bray, C., Perrin, A., Fischer, E., Sudo, K., Boone, C., Bovy, B., Lejeune, B., Servais, C., and Mahieu, E.: Retrieval of ethane from ground-based FTIR solar spectra using improved spectroscopy: Recent burden increase above Jungfraujoch, J. Quant. Spectros. Ra., 160, 36–49, https://doi.org/10.1016/j.jqsrt.2015.03.017, 2015. a
Franco, B., Mahieu, E., Emmons, L. K., Tzompa-Sosa, Z. A., Fischer, E. V., Sudo, K., Bovy, B., Conway, S., Griffin, D., Hannigan, J. W., Strong, K., and Walker, K. A.: Evaluating ethane and methane emissions associated with the development of oil and natural gas extraction in North America, Environ. Res. Let., 11, 044010, https://doi.org/10.1088/1748-9326/11/4/044010, 2016. a
Galewsky, J. and Rabanus, D.: A Stochastic Model for Diagnosing Subtropical Humidity Dynamics with Stable Isotopologues of Water Vapor, J. Atmos. Sci., 73, 1741–1753, https://doi.org/10.1175/JAS-D-15-0160.1, 2016. a
García, O. E., Schneider, M., Hase, F., Blumenstock, T., Sepúlveda, E., and González, Y.: Quality assessment of ozone total column amounts as monitored by ground-based solar absorption spectrometry in the near infrared (>3000 cm−1), Atmos. Meas. Tech., 7, 3071–3084, https://doi.org/10.5194/amt-7-3071-2014, 2014. a
Garcia, R. R., Marsh, D. R., Kinnison, D. E., Boville, B. A., and Sassi, F.: Simulation of secular trends in the middle atmosphere, 1950–2003, J.f Geophys. Res.-Atmos., 112, d09301, https://doi.org/10.1029/2006JD007485, 2007. a, b
Goff, J.: Saturation pressure of water on the new Kelvin temperature scale, Transactions of the American society of heating and ventilating engineers, 63, 347–354, 1957. a
Hall, E. G., Jordan, A. F., Hurst, D. F., Oltmans, S. J., Vömel, H., Kühnreich, B., and Ebert, V.: Advancements, measurement uncertainties, and recent comparisons of the NOAA frost point hygrometer, Atmos. Meas. Tech., 9, 4295–4310, https://doi.org/10.5194/amt-9-4295-2016, 2016. a, b, c, d
Hannigan, J. W., Coffey, M. T., and Goldman, A.: Semiautonomous FTS observation system for remote sensing of stratospheric and tropospheric gases, J. Atmos. Ocean. Tech., 26, 1814–1828, https://doi.org/10.1175/2009JTECHA1230.1, 2009. a, b
Hase, F., Hannigan, J. W., Coffey, M. T., Goldman, A., Höpfner, M., Jones, N. B., Rinsland, C. P., and Wood, S. W.: Intercomparison of retrieval codes used for the analysis of high-resolution, ground-based FTIR measurements, J. Quant. Spectrosc. Ra., 87, 25–52, https://doi.org/10.1016/j.jqsrt.2003.12.008, 2004. a
Held, I. M. and Soden, B. J.: Water vapor feedback and global warming, Annu. Rev. Energ. Env., 25, 441–475, https://doi.org/10.1146/annurev.energy.25.1.441, 2000. a
Hurst, D. F., Hall, E. G., Jordan, A. F., Miloshevich, L. M., Whiteman, D. N., Leblanc, T., Walsh, D., Vömel, H., and Oltmans, S. J.: Comparisons of temperature, pressure and humidity measurements by balloon-borne radiosondes and frost point hygrometers during MOHAVE-2009, Atmos. Meas. Tech., 4, 2777–2793, https://doi.org/10.5194/amt-4-2777-2011, 2011a. a
Hurst, D. F., Oltmans, S. J., Vömel, H., Rosenlof, K. H., Davis, S. M., Ray, E. A., Hall, E. G., and Jordan, A. F.: Stratospheric water vapor trends over Boulder, Colorado: Analysis of the 30 year Boulder record, J. Geophys. Res.-Atmos., 116, 1–12, https://doi.org/10.1029/2010JD015065, 2011b. a, b, c
Kalnay, E., Kanamitsu, M., Kistler, R., Collins, W., Deaven, D., Gandin, L., Iredell, M., Saha, S., White, G., Woollen, J., Zhu, Y., Chelliah, M., Ebisuzaki, W., Higgins, W., Janowiak, J., Mo, K. C., Ropelewski, C., Wang, J., Leetmaa, A., Reynolds, R., Jenne, R., and Joseph, D.: The NCEP/NCAR 40-Year Reanalysis Project, B. Am. Meteorol. Soc., 77, 437–472, https://doi.org/10.1175/1520-0477(1996)077<0437:TNYRP>2.0.CO;2, 1996. a, b
Kiehl, J. T. and Trenberth, K. E.: Earth's Annual Global Mean Energy Budget, B. Am. Meteorol. Soc., 78, 197–208, https://doi.org/10.1175/1520-0477(1997)078<0197:EAGMEB>2.0.CO;2, 1997. a
Kille, N., Baidar, S., Handley, P., Ortega, I., Sinreich, R., Cooper, O. R., Hase, F., Hannigan, J. W., Pfister, G., and Volkamer, R.: The CU mobile Solar Occultation Flux instrument: structure functions and emission rates of NH3, NO2 and C2H6, Atmos. Meas. Tech., 10, 373–392, https://doi.org/10.5194/amt-10-373-2017, 2017. a
Kinnison, D. E., Brasseur, G. P., Walters, S., Garcia, R. R., Marsh, D. R., Sassi, F., Harvey, V. L., Randall, C. E., Emmons, L., Lamarque, J. F., Hess, P., Orlando, J. J., Tie, X. X., Randel, W., Pan, L. L., Gettelman, A., Granier, C., Diehl, T., Niemeier, U., and Simmons, A. J.: Sensitivity of chemical tracers to meteorological parameters in the MOZART-3 chemical transport model, J. Geophys. Res.-Atmos., 112, d20302, https://doi.org/10.1029/2006JD007879, 2007. a
Korn, G. and Korn, T.: Mathematical Handbook for Scientists and Engineers: Definitions, Theorems, and Formulas for Reference and Review, Dover Civil and Mechanical Engineering Series, Dover Publications, available at: https://books.google.com/books?id=xHNd5zCXt-EC (last access: 25 January 2019), 2000. a
Marsh, D. R., Mills, M. J., Kinnison, D. E., Lamarque, J.-F., Calvo, N., and Polvani, L. M.: Climate Change from 1850 to 2005 Simulated in CESM1(WACCM), J. Climate, 26, 7372–7391, https://doi.org/10.1175/JCLI-D-12-00558.1, 2013. a
Noone, D.: Pairing Measurements of the Water Vapor Isotope Ratio with Humidity to Deduce Atmospheric Moistening and Dehydration in the Tropical Midtroposphere, J. Climate, 25, 4476–4494, https://doi.org/10.1175/JCLI-D-11-00582.1, 2012. a
Oltmans, S. J., Vomel, H., Hofmann, D. J., Rosenlof, K. H., and Kley, D.: The increase in stratospheric water vapor from balloonborne, frostpoint hygrometer measurements at Washington, D.C., and Boulder, Colorado, Geophys. Res. Lett., 27, 3453–3456, https://doi.org/10.1029/2000GL012133, 2000. a, b
Paton-Walsh, C., Deutscher, N. M., Griffith, D. W. T., Forgan, B. W., Wilson, S. R., Jones, N. B., and Edwards, D. P.: Trace gas emissions from savanna fires in northern Australia, J. Geophys. Res.-Atmos., 115, d16314, https://doi.org/10.1029/2009JD013309, 2010. a
Pougatchev, N. S., Connor, B. J., and Rinsland, C. P.: Infrared measurements of the ozone vertical distribution above Kitt Peak, J. Geophys. Res.-Atmos., 100, 16689–16697, https://doi.org/10.1029/95JD01296, 1995. a
Rinsland, C. P., Jones, N. B., Connor, B. J., Logan, J. A., Pougatchev, N. S., Goldman, A., Murcray, F. J., Stephen, T. M., Pine, A. S., Zander, R., Mahieu, E., and Demoulin, P.: Northern and southern hemisphere ground-based infrared spectroscopic measurements of tropospheric carbon monoxide and ethane, J. Geophys. Res.-Atmos., 103, 28197–28217, https://doi.org/10.1029/98JD02515, 1998. a
Rodgers, C. D.: Inverse Methods for Atmospheric Sounding: Theory and Practice, World Scientific, Singapore, 2000. a, b, c
Rodgers, C. D. and Connor, B. J.: Intercomparison of remote sounding instruments, J. Geophys. Res.-Atmos., 108, 4116, https://doi.org/10.1029/2002JD002299, 2003. a, b, c, d
Rothman, L., Gordon, I., Barbe, A., Benner, D., Bernath, P., Birk, M., Boudon, V., Brown, L., Campargue, A., Champion, J.-P., Chance, K., Coudert, L., Dana, V., Devi, V., Fally, S., Flaud, J.-M., Gamache, R., Goldman, A., Jacquemart, D., Kleiner, I., Lacome, N., Lafferty, W., Mandin, J.-Y., Massie, S., Mikhailenko, S., Miller, C., Moazzen-Ahmadi, N., Naumenko, O., Nikitin, A., Orphal, J., Perevalov, V., Perrin, A., Predoi-Cross, A., Rinsland, C., Rotger, M., Šimečková, M., Smith, M., Sung, K., Tashkun, S., Tennyson, J., Toth, R., Vandaele, A., and Auwera, J. V.: The HITRAN 2008 molecular spectroscopic database, J. Quant. Spectrosc. Ra., 110, 533–572, https://doi.org/10.1016/j.jqsrt.2009.02.013, hITRAN, 2009. a
Rothman, L. S., Gordon, I. E., Babikov, Y., Barbe, A., Benner, D. C., Bernath, P. F., Birk, M., Bizzocchi, L., Boudon, V., Brown, L. R., Campargue, A., Chance, K., Cohen, E. A., Coudert, L. H., Devi, V. M., Drouin, B. J., Fayt, A., Flaud, J., Gamache, R. R., Harrison, J. J., Hartmann, J., Hill, C., Hodges, J. T., Jacquemart, D., Jolly, A., Lamouroux, J., Le Roy, R. J., Li, G., Long, D. A., Lyulin, O. M., Mackie, C. J., Massie, S. T., Mikhailenko, S., Mueller, H. S. P., Naumenko, O. V., Nikitin, A. V., Orphal, J., Perevalov, V., Perrin, A., Polovtseva, E. R., Richard, C., Smith, M. A. H., Starikova, E., Sung, K., Tashkun, S., Tennyson, J., Toon, G. C., Tyuterev, V. G., and Wagner, G.: The HITRAN 2012 molecular spectroscopic database, J. Quant. Spectrosc. Ra., 130, 4–50, https://doi.org/10.1016/j.jqsrt.2013.07.002, 2013. a, b, c
Scherer, M., Vömel, H., Fueglistaler, S., Oltmans, S. J., and Staehelin, J.: Trends and variability of midlatitude stratospheric water vapour deduced from the re-evaluated Boulder balloon series and HALOE, Atmos. Chem. Phys., 8, 1391–1402, https://doi.org/10.5194/acp-8-1391-2008, 2008. a
Schneider, M. and Hase, F.: Ground-based FTIR water vapour profile analyses, Atmos. Meas. Tech., 2, 609–619, https://doi.org/10.5194/amt-2-609-2009, 2009. a
Schneider, M., Hase, F., and Blumenstock, T.: Water vapour profiles by ground-based FTIR spectroscopy: study for an optimised retrieval and its validation, Atmos. Chem. Phys., 6, 811–830, https://doi.org/10.5194/acp-6-811-2006, 2006. a, b
Schneider, M., Yoshimura, K., Hase, F., and Blumenstock, T.: The ground-based FTIR network's potential for investigating the atmospheric water cycle, Atmos. Chem. Phys., 10, 3427–3442, https://doi.org/10.5194/acp-10-3427-2010, 2010. a
Schneider, M., Barthlott, S., Hase, F., González, Y., Yoshimura, K., García, O. E., Sepúlveda, E., Gomez-Pelaez, A., Gisi, M., Kohlhepp, R., Dohe, S., Blumenstock, T., Wiegele, A., Christner, E., Strong, K., Weaver, D., Palm, M., Deutscher, N. M., Warneke, T., Notholt, J., Lejeune, B., Demoulin, P., Jones, N., Griffith, D. W. T., Smale, D., and Robinson, J.: Ground-based remote sensing of tropospheric water vapour isotopologues within the project MUSICA, Atmos. Meas. Tech., 5, 3007–3027, https://doi.org/10.5194/amt-5-3007-2012, 2012. a, b
Schneider, M., Wiegele, A., Barthlott, S., González, Y., Christner, E., Dyroff, C., García, O. E., Hase, F., Blumenstock, T., Sepúlveda, E., Mengistu Tsidu, G., Takele Kenea, S., Rodríguez, S., and Andrey, J.: Accomplishments of the MUSICA project to provide accurate, long-term, global and high-resolution observations of tropospheric H2O,dD pairs – a review, Atmos. Meas. Tech., 9, 2845–2875, https://doi.org/10.5194/amt-9-2845-2016, 2016. a
Seinfeld, J. H. and Pandis, S. N.: Atmospheric Chemisty and Physics: from air pollution to climate change, Wiley-Interscience, Hoboken, New Jersey, 2 edn., 2006. a
Sepúlveda, E., Schneider, M., Hase, F., Barthlott, S., Dubravica, D., García, O. E., Gomez-Pelaez, A., González, Y., Guerra, J. C., Gisi, M., Kohlhepp, R., Dohe, S., Blumenstock, T., Strong, K., Weaver, D., Palm, M., Sadeghi, A., Deutscher, N. M., Warneke, T., Notholt, J., Jones, N., Griffith, D. W. T., Smale, D., Brailsford, G. W., Robinson, J., Meinhardt, F., Steinbacher, M., Aalto, T., and Worthy, D.: Tropospheric CH4 signals as observed by NDACC FTIR at globally distributed sites and comparison to GAW surface in situ measurements, Atmos. Meas. Tech., 7, 2337–2360, https://doi.org/10.5194/amt-7-2337-2014, 2014. a
Suortti, T. M., Kats, A., Rivi, R., Kämpfer, N., Leiterer, U., Miloshevich, L. M., Neuber, R., Paukkunen, A., Ruppert, P., Vömel, H., and Yushkov, V.: Tropospheric comparisons of Vaisala radiosondes and balloon-borne frost-Point and Lyman-α hygrometers during the LAUTLOS-WAVVAP experiment, J. Atmos. Ocean. Tech., 25, 149–166, https://doi.org/10.1175/2007JTECHA887.1, 2008. a
Sussmann, R. and Borsdorff, T.: Technical Note: Interference errors in infrared remote sounding of the atmosphere, Atmos. Chem. Phys., 7, 3537–3557, https://doi.org/10.5194/acp-7-3537-2007, 2007. a
Sussmann, R., Borsdorff, T., Rettinger, M., Camy-Peyret, C., Demoulin, P., Duchatelet, P., Mahieu, E., and Servais, C.: Technical Note: Harmonized retrieval of column-integrated atmospheric water vapor from the FTIR network – first examples for long-term records and station trends, Atmos. Chem. Phys., 9, 8987–8999, https://doi.org/10.5194/acp-9-8987-2009, 2009. a, b, c
Trenberth, K. E. and Asrar, G. R.: Challenges and Opportunities in Water Cycle Research: WCRP Contributions, Surv. Geophys., 35, 515–532, https://doi.org/10.1007/s10712-012-9214-y, 2014. a
Tzompa-Sosa, Z. A., Mahieu, E., Franco, B., Keller, C. A., Turner, A. J., Helmig, D., Fried, A., Richter, D., Weibring, P., Walega, J., Yacovitch, T. I., Herndon, S. C., Blake, D. R., Hase, F., Hannigan, J. W., Conway, S., Strong, K., Schneider, M., and Fischer, E. V.: Revisiting global fossil fuel and biofuel emissions of ethane, J. Geophys. Res.-Atmos., 122, 2493–2512, https://doi.org/10.1002/2016JD025767, 2016. a
Viatte, C., Strong, K., Walker, K. A., and Drummond, J. R.: Five years of CO, HCN, C2H6, C2H2, CH3OH, HCOOH and H2CO total columns measured in the Canadian high Arctic, Atmos. Meas. Tech., 7, 1547–1570, https://doi.org/10.5194/amt-7-1547-2014, 2014. a
Vigouroux, C., Stavrakou, T., Whaley, C., Dils, B., Duflot, V., Hermans, C., Kumps, N., Metzger, J.-M., Scolas, F., Vanhaelewyn, G., Müller, J.-F., Jones, D. B. A., Li, Q., and De Mazière, M.: FTIR time-series of biomass burning products (HCN, C2H6, C2H2, CH3OH, and HCOOH) at Reunion Island (21∘ S, 55∘ E) and comparisons with model data, Atmos. Chem. Phys., 12, 10367–10385, https://doi.org/10.5194/acp-12-10367-2012, 2012. a, b
Vigouroux, C., Blumenstock, T., Coffey, M., Errera, Q., García, O., Jones, N. B., Hannigan, J. W., Hase, F., Liley, B., Mahieu, E., Mellqvist, J., Notholt, J., Palm, M., Persson, G., Schneider, M., Servais, C., Smale, D., Thölix, L., and De Mazière, M.: Trends of ozone total columns and vertical distribution from FTIR observations at eight NDACC stations around the globe, Atmos. Chem. Phys., 15, 2915–2933, https://doi.org/10.5194/acp-15-2915-2015, 2015. a
Vogelmann, H., Sussmann, R., Trickl, T., and Reichert, A.: Spatiotemporal variability of water vapor investigated using lidar and FTIR vertical soundings above the Zugspitze, Atmos. Chem. Phys., 15, 3135–3148, https://doi.org/10.5194/acp-15-3135-2015, 2015. a, b, c, d
Wild, J. D., Gelman, M. E., Miller, A. J., Chanin, M. L., Hauchecorne, A., Keckhut, P., Farley, R., Dao, P. D., Meriwether, J. W., Gobbi, G. P., Congeduti, F., Adriani, A., McDermid, I. S., McGee, T. J., and Fishbein, E. F.: Comparison of stratospheric temperatures from several lidars, using National Meteorological Center and microwave limb sounder data as transfer references, J. Geophys. Res.-Atmos., 100, 11105–11111, https://doi.org/10.1029/95JD00631, 1995. a
Wu, C. and Yu, J. Z.: Evaluation of linear regression techniques for atmospheric applications: the importance of appropriate weighting, Atmos. Meas. Tech., 11, 1233–1250, https://doi.org/10.5194/amt-11-1233-2018, 2018. a


