the Creative Commons Attribution 4.0 License.
the Creative Commons Attribution 4.0 License.
Development of on-site self-calibration and retrieval methods for sky-radiometer observations of precipitable water vapor
Rei Kudo
Kazuma Aoki
Tatsuhiro Mori
Kazuhiko Miura
Hiroshi Okamoto
Hitoshi Irie
Yoshinori Shoji
Akihiro Uchiyama
Osamu Ijima
Matsumi Takano
Teruyuki Nakajima
The Prede sky radiometer measures direct solar irradiance and the angular distribution of diffuse radiances at the ultraviolet, visible, and near-infrared wavelengths. These data are utilized for the remote sensing of aerosols, water vapor, ozone, and clouds, but the calibration constant, which is the sensor output current of the extraterrestrial solar irradiance at the mean distance between Earth and the Sun, is needed. The aerosol channels, which are the weak gas absorption wavelengths of 340, 380, 400, 500, 675, 870, and 1020 nm, can be calibrated by an on-site self-calibration method, the Improved Langley method. This on-site self-calibration method is useful for the continuous long-term observation of aerosol properties. However, the continuous long-term observation of precipitable water vapor (PWV) by the sky radiometer remains challenging because calibrating the water vapor absorption channel of 940 nm generally relies on the standard Langley (SL) method at limited observation sites (e.g., the Mauna Loa Observatory) and the transfer of the calibration constant by a side-by-side comparison with the reference sky radiometer calibrated by the SL method. In this study, we developed the SKYMAP algorithm, a new on-site method of self-calibrating the water vapor channel of the sky radiometer using diffuse radiances normalized by direct solar irradiance (normalized radiances). Because the sky radiometer measures direct solar irradiance and diffuse radiance using the same sensor, the normalization cancels the calibration constant included in the measurements. The SKYMAP algorithm consists of three steps. First, aerosol optical and microphysical properties are retrieved using direct solar irradiances and normalized radiances at aerosol channels. The aerosol optical properties at the water vapor channel are interpolated from those at aerosol channels. Second, PWV is retrieved using the angular distribution of the normalized radiances at the water vapor channel. Third, the calibration constant at the water vapor channel is estimated from the transmittance of PWV and aerosol optical properties. Intensive sensitivity tests of the SKYMAP algorithm using simulated data of the sky radiometer showed that the calibration constant is retrieved reasonably well for PWV<2 cm, which indicates that the SKYMAP algorithm can calibrate the water vapor channel on-site in dry conditions. Next, the SKYMAP algorithm was applied to actual measurements under the clear-sky and low-PWV (<2 cm) conditions at two sites, Tsukuba and Chiba, Japan, and the annual mean calibration constants at the two sites were determined. The SKYMAP-derived calibration constants were 10.1 % and 3.2 % lower, respectively, than those determined by a side-by-side comparison with the reference sky radiometer. After determining the calibration constant, we obtained PWV from the direct solar irradiances in both the dry and wet seasons. The retrieved PWV values corresponded well to those derived from a global-navigation-satellite-system–global-positioning-system receiver, a microwave radiometer, and an AERONET (Aerosol Robotic Network) sun–sky radiometer at both sites. The correlation coefficients were greater than 0.96. We calculated the bias errors and the root mean square errors by comparing PWV between the DSRAD (direct solar irradiance) algorithm and other instruments. The magnitude of the bias error and the root mean square error were <0.163 and <0.251 cm for PWV<3 cm, respectively. However, our method tended to underestimate PWV in the wet conditions, and the magnitude of the bias error and the root mean square error became large, <0.594 and <0.722 cm for PWV>3 cm, respectively. This problem was mainly due to the overestimation of the aerosol optical thickness before the retrieval of PWV. These results show that the SKYMAP algorithm enables us to observe PWV over the long term, based on its unique on-site self-calibration method.
- Article
(4911 KB) - Full-text XML
- BibTeX
- EndNote
The highly variable spatiotemporal distributions of aerosols, clouds, and gases (e.g., water vapor and ozone) still include large uncertainties for the quantitative understanding of the earth's radiation budget at various spatial and temporal scales. Water vapor is specified as an essential climate variable (ECV) by the World Meteorological Organization (WMO), a critical key parameter that contributes to characterizing the earth's climate and changes in atmospheric temperature (Schmidt et al., 2010). Water vapor absorbs visible radiation and absorbs and emits infrared radiation to heat and cool the earth and its atmosphere. Atmospheric heating drives the evaporation of sea water, causing an increase in temperature as positive feedback (IPCC, 2013). In addition, the distribution of water vapor controls precipitation amounts and aerosol–cloud interactions (Twomey, 1990). To understand these effects quantitatively, many previous studies have measured precipitable water vapor using a radiosonde, global-navigation-satellite-system–global-positioning-system (GNSS–GPS) receiver (Bevis et al., 1992), or spectroradiometer (e.g., Fowle, 1912, 1915).
Precipitable water vapor (PWV), which is the total atmospheric water vapor contained in a vertical column, has been estimated from the measurement of direct solar irradiance at the water vapor absorption bands. One of the strong water vapor absorption bands is around 940 nm and can be measured by a sun photometer (Fowle, 1912, 1915; Bruegge et al., 1992; Schmid et al., 1996, 2001; Halthore et al., 1997), SKYNET sky radiometer (Campanelli et al., 2014, 2018; Uchiyama et al., 2014, 2018a), and AERONET (Aerosol Robotic Network) sun–sky photometer (Holben et al., 1998). Previous studies of SKYNET and AERONET derived PWV from the observed transmittance of water vapor (), assuming (Bruegge et al., 1992), where a and b are adjustment parameters, m is the optical air mass, and w is PWV. However, there is a known noticeable uncertainty in the estimate of PWV because the adjustment parameters depend on the spectral sensitivity of the spectroradiometer as well as the vertical profiles of water vapor and temperature. Therefore, the adjustment parameters should be determined for each observation site. Campanelli et al. (2014, 2018) developed a practical method for determining the adjustment parameters based on PWV retrieved by a GNSS–GPS receiver or by surface humidity observations.
To estimate PWV using a spectroradiometer, it is necessary to calibrate the water vapor channel. The calibration constant, which is the sensor output current of the extraterrestrial solar irradiance at the mean distance between Earth and the Sun, at the water vapor channel can be determined by the Langley method. For example, Uchiyama et al. (2014) calibrated the water vapor channel of a sky radiometer with high accuracy using observations from the Mauna Loa Observatory (3400 m a.s.l.). In the AERONET led by NASA, the field instrument of the AERONET sun–sky radiometer is calibrated every year by lamp calibration and a side-by-side comparison with a reference spectroradiometer (Holben et al., 1998). Dedicated effort and expenses are required to maintain accurate long-term calibrations using these methods.
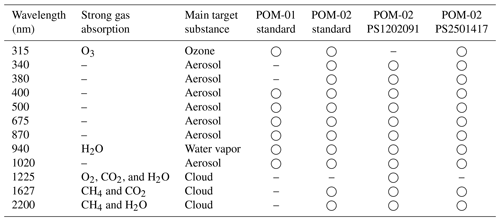
The sky-radiometer models POM-01 and POM-02 (Prede, Tokyo, Japan), which are deployed in the international radiation observation network SKYNET, measure solar direct irradiances and diffuse irradiances at the ultraviolet, visible, and near-infrared wavelengths. These measurements are used for the remote sensing of aerosol, cloud, water vapor, and ozone (Table 1; Takamura and Nakajima, 2004; Nakajima et al., 2007). Table 1 shows the relationship between the wavelengths and the main target of the remote sensing. The aerosol channels are 340, 380, 400, 500, 675, 870, and 1020 nm; the water vapor channel is 940 nm; the ozone channel is 315 nm; and the cloud channels are 1225, 1627, and 2200 nm. Through on-site self-calibration of the aerosol channels by the Improved Langley (IL) method (Tanaka et al., 1986; Nakajima et al., 1996; Campanelli et al., 2004, 2007), the SKYNET system is capable of long-term and continuous aerosol observation. The IL method works not only in clean atmospheric conditions but also in turbid atmospheric conditions. However, no improved calibration method has replaced the standard (Uchiyama et al., 2014) or modified (Campanelli et al., 2014, 2018) Langley methods for the water vapor channel. In this study, we developed a new method of retrieving PWV using the PWV dependency of the normalized radiance, defined as the ratio of diffuse radiance to direct solar irradiance at the water vapor channel. This method enables us to estimate PWV without the calibration constant and to perform on-site self-calibration of the water vapor channel. We developed two algorithms, SKYMAP and DSRAD. The SKYMAP algorithm is a new on-site method for self-calibrating the water vapor channel. It retrieves PWV (PWVSKYMAP) from the angular distribution of the normalized radiance at the water vapor channel and calibrates the water vapor channel. The DSRAD algorithm estimates PWV (PWVDSRAD) from the calibrated direct solar irradiance at the water vapor channel. This method does not require adjustment parameters and explicitly uses the filter response function and the vertical profiles of water vapor, temperature, and pressure. The SKYMAP and DSRAD algorithms are described in Sect. 2. We discuss the results of sensitivity tests of the SKYMAP algorithm using simulation data in Sect. 3 and apply two algorithms to observational data at two SKYNET sites in Sect. 4. At these two sites, PWV is observed by the GNSS–GPS receiver, microwave radiometer (MWR), or an AERONET sun–sky radiometer other than the sky radiometer. The retrieval accuracy of our method is evaluated by comparison to these established methods.
In this study, PWV is retrieved using angular distributions of the normalized radiance, which does not require the calibration constant of the sky radiometer. Section 2.1 shows the normalized radiances and dependencies of the normalized radiance on PWV. Next, we describe two algorithms, the flow and relationships of which are shown in Fig. 1. The SKYMAP algorithm retrieves aerosol optical and microphysical properties and calibrates the water vapor channel by retrieving PWV from the angular distribution of the normalized radiance (Sect. 2.2). The DSRAD algorithm retrieves PWV from the transmittance derived from the direct solar irradiance at the water vapor channel (Sect. 2.3).
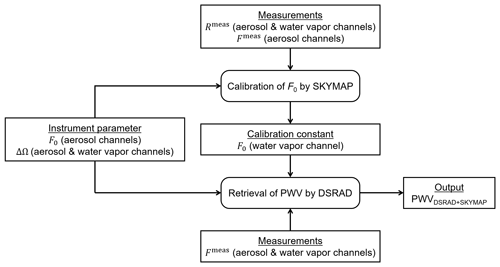
Figure 1Diagram of the on-site self-calibration method (SKYMAP) and retrieval of PWV from direct solar irradiances (DSRAD). Square boxes show the operation of the calculation and input–output parameters, and rounded boxes show the operation of the algorithm.
2.1 Sky-radiometer measurements and the relationship between normalized radiances and PWV
We explain the normalized radiance (Nakajima et al., 1996) in Sect. 2.1.1 and the theoretical relationship between the normalized radiance and PWV in Sect. 2.1.2.
2.1.1 Sky-radiometer measurements
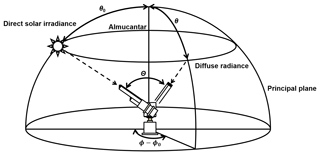
The direct solar irradiance (F) and angular distribution of the diffuse irradiance (V) are measured at 7 wavelengths by the model POM-01 or 11 wavelengths by the model POM-02 (Table 1). V is measured in the almucantar and principal planes (Fig. 2). The angular distribution of V is measured at scattering angles Θ=2, 3, 4, 5, 7, 10, 15, 20, 25, 30, 40, 50, 60, 70, 80, 90, 100, 110, 120, 130, 140, 150, and 160∘ in the almucantar and principal planes every 10 min. The aerosol channels are calibrated with the IL method using the normalized radiance at Θ<30∘. F and at the aerosol and water vapor channels are used in this study.
In the plane-parallel non-refractive atmosphere, F at the bottom of the atmosphere (BOA) at the solar zenith angle (SZA) θ0 and the solar azimuth angle ϕ0 is derived from
where F0 is the calibration constant; d is the distance between Earth and the Sun (astronomical unit; AU); λ is the wavelength; τ is the total optical thickness; and m0 is optical air mass, represented as . In clear-sky conditions, the total optical thickness is the integrated value of aerosol scattering + absorption, Rayleigh scattering, and gas absorption coefficients in the column. Assuming a narrow-spectral-band filter response function, the normalized radiance (R), which is the ratio of V to F at the zenith angle (θ) and the azimuth angle (ϕ), is obtained from the radiative-transfer equation
where and are the total phase function and the total single-scattering albedo, respectively, at the altitude ; ΔΩ is the solid view angle (or field of view; SVA); Q is the multiple scattering contribution; and
Note that F0 is canceled by the normalization. In the second term of Eq. (2), the SVA of each wavelength can be retrieved from the angular distribution around the solar disk (Nakajima et al., 1996; Boi et al., 1999; Uchiyama et al., 2018b). Equation (2) can be simplified in the almucantar plane due to θ=θ0:
where P(Θ,λ) and ω are the total phase function and the total single-scattering albedo, respectively. In contrast, R in the principal plane can be described simply, similar to Eq. (4), if we assume that the atmosphere is a single layer:
2.1.2 The relationship between normalized radiances at the water vapor channel and PWV
We examined the sensitivity of R at 940 nm in the two observation planes to PWV, aerosol optical properties, and aerosol vertical profiles by simulating R using the radiative-transfer model RSTAR (System for Transfer of Atmospheric Radiation for Radiance calculations; Nakajima and Tanaka, 1986, 1988). The simulation was conducted with two aerosol types based on those used by Kudo et al. (2016): the continental average, and the continental average + transported dust in the upper atmosphere (Table 2). The continental average consisted of water-soluble particles, soot particles, and insoluble particles (Hess et al., 1999). Transported dust was defined as the mineral-transported component from Hess et al. (1999). Figure 3 shows the dependencies of R in the almucantar plane on PWV for continental-average aerosol with aerosol optical thicknesses of 0.02 and 0.20 at 940 nm. The simulations were conducted for SZA of 70∘. R decreases with increasing PWV regardless of the aerosol optical thickness. This suggests that PWV can be estimated from the normalized angular distribution, which is the angular distribution of R, without the calibration constant. The dependencies of R on PWV cannot be observed in the radiative transfer using the single-scattering approximation in the almucantar plane. The first term of Eq. (4) is the normalized single-scattering contribution and includes only the influences of aerosol and Rayleigh scattering. Note that this is true only for R and not for V because total optical thickness contributes to the single-scattering approximation of V. However, the second term for the multiple scattering includes the influence of water vapor absorption and creates the dependencies of R on PWV. Figure 3 shows that the dependency of R on PWV at the forward-scattering angles is not strong, but R at the backward-scattering angles between 90 and 120∘ changes with PWV. The range of the scattering angle for R is an important factor.
Table 2Microphysical and optical properties and vertical profiles of aerosol used in sensitivity tests.
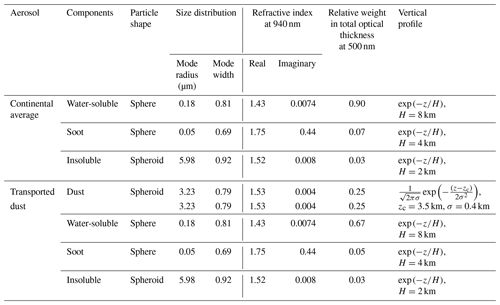
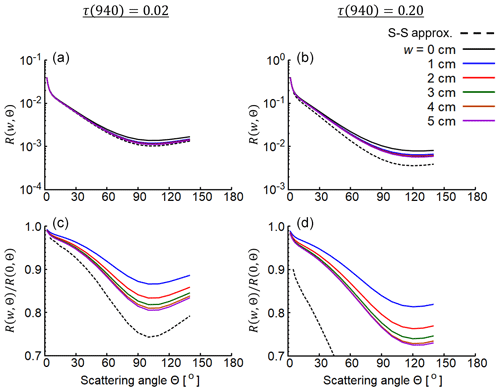
Figure 3Normalized angular distributions simulated for continental-average aerosol (Table 2) in the almucantar plane with aerosol optical thicknesses of 0.02 and 0.20 at 940 nm. Simulations were conducted for SZA=70∘ and PWV(w)=0, 1, 2, 3, 4, and 5 cm. The top row is the normalized radiance R(w,Θ), and the bottom row is the ratio of R(w,Θ) to R(0,Θ). “S-S approx.” is the single-scattering approximation.
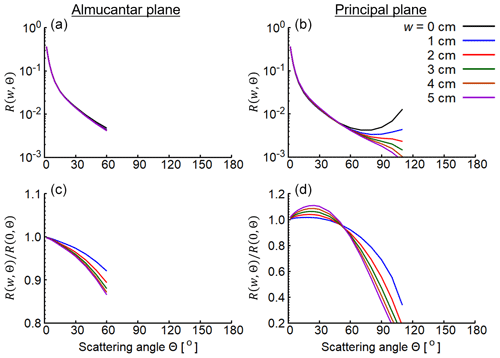
Figure 4 illustrates the dependency of R on PWV for different observation planes. The simulation was conducted for transported-dust aerosol (Table 2) with an aerosol optical thickness of 0.06 at 940 nm at SZA of 70∘ in the almucantar and principal planes. The transported-dust aerosol is composed of coarse particles, which have larger impacts on the angular distribution of R at the near-infrared wavelength than fine particles. The dependency of R in the almucantar plane on PWV is the same as in Fig. 3. The dependency of R on PWV is also found in the principal plane. R increases with increasing PWV at θ≪θ0 and decreases with increasing PWV at θ≫θ0. Although the dependency of R on PWV in the almucantar plane is strong at the backward-scattering angles, that in the principal plane is strong at scattering angles between 60 and 90∘. R in the principal plane is more sensitive to PWV than R in the almucantar plane because the normalized single-scattering contribution in Eq. (5) includes not only Rayleigh and aerosol scattering but also gas absorption.
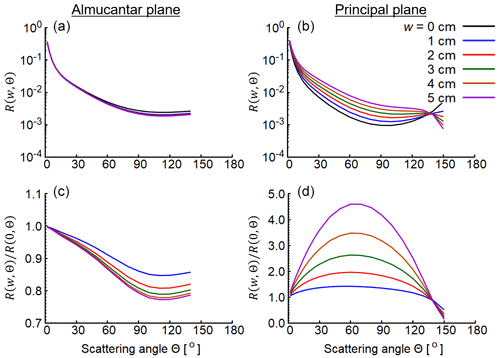
Figure 4Normalized angular distributions simulated for transported-dust aerosol (Table 2) in the almucantar and principal planes with an aerosol optical thickness of 0.06 at 940 nm. Simulations were conducted for SZA=70∘ and PWV(w)=0, 1, 2, 3, 4, and 5 cm. The top row is the normalized radiance R(w,Θ), and the bottom row is the ratio of R(w,Θ) to R(0,Θ).
In theory, the maximum scattering angle of the principal plane is θ0+90∘, and that of the almucantar plane is 2θ0. When SZA is small, the principal plane has a broader scattering angle range than the almucantar plane. Therefore, the principal plane is more advantageous for the PWV retrieval. Figure 5 is the same as Fig. 4 but for SZA of 30∘. Because the maximum scattering angle of the principal plane is obviously larger than that of the almucantar plane, PWV retrieval using the principal plane is more effective compared to that using the almucantar plane.
R in the principal plane is affected by the aerosol vertical profile, but this influence can be ignored for R in the almucantar plane (Torres et al., 2014). Figure 6 shows the normalized angular distribution in the two observation planes for the different heights of the transported-dust layer. It is obvious that the normalized angular distribution in the principal plane is sensitive to the aerosol vertical profile. Consequently, the principal plane is useful for retrieving PWV when the aerosol vertical profile is known, but the almucantar plane is better when the aerosol vertical profile is not known. In this study, we used the normalized angular distribution in the almucantar plane because the aerosol vertical profile was not known. The influence of SZA on the retrieval of PWV is examined in Sect. 3.
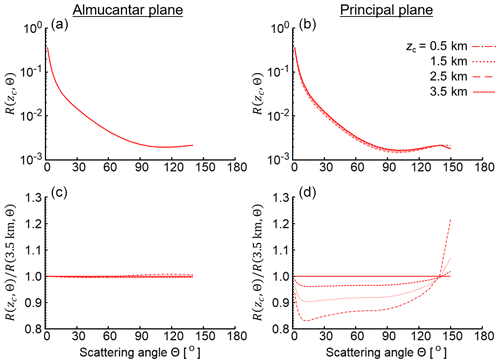
Figure 6Normalized angular distributions simulated for transported-dust aerosol (Table 2) in the almucantar and principal planes with an aerosol optical thickness of 0.06 at 940 nm. Simulations were conducted for SZA=70∘ and PWV=2 cm. The height of the dust layer (zc) is changed to 0.5, 1.5, 2.5, and 3.5 km. The top row is the normalized radiance R(zc,Θ), and the bottom row is the ratio of R(zc,Θ) to R(3.5 km,Θ).
2.2 SKYMAP algorithm
The SKYMAP algorithm consists of three steps (Fig. 7). First, aerosol optical and microphysical properties are retrieved from F and normalized angular distributions at aerosol channels. Second, aerosol optical properties at the water vapor channel are interpolated from those at aerosol channels. PWV is retrieved from the normalized angular distribution at the water vapor channel. Third, the calibration constant at the water vapor channel is estimated from PWV and the aerosol optical properties.
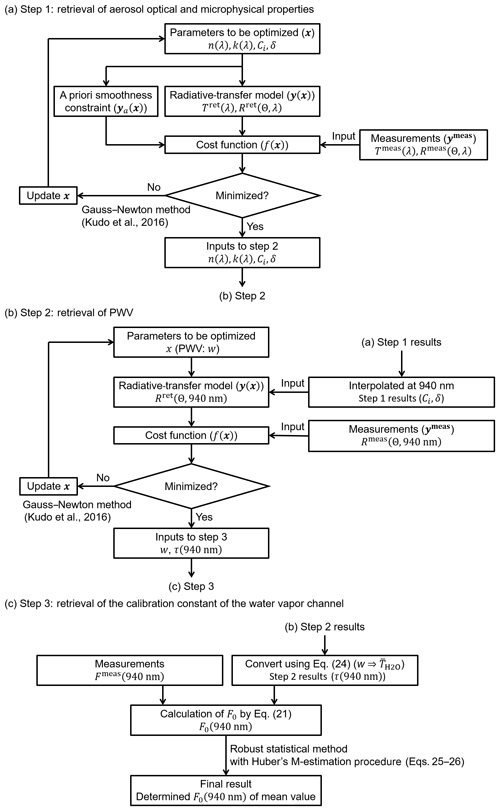
Figure 7Schematic diagrams of SKYMAP procedures. (a) Step 1. (b) Step 2. (c) Step 3. Square boxes show the calculation and input–output parameters.
2.2.1 Step 1: retrieval of aerosol optical and microphysical properties
Aerosol optical and microphysical properties are estimated from sky-radiometer measurements at aerosol channels using normalized angular distributions and transmittance with an optimal estimation method similar to the AERONET and SKYNET retrievals (Dubovik and King, 2000; Dubovik et al., 2006; Kobayashi et al., 2006; Hashimoto et al., 2012; Kudo et al., 2016). Estimated optical and microphysical properties are the real and imaginary parts of the refractive index at aerosol channels (Table 1), the volume size distribution, and the volume ratio of nonspherical particles to total particles in the coarse mode. Hereafter, these are referred to as aerosol parameters.
In step 1, we construct the forward model to calculate the sky-radiometer measurements from the aerosol parameters. We assume that the aerosol volume size distribution in the radius range from 0.02 to 20.0 µm consists of 20-modal lognormal size distributions as illustrated in Fig. 8:
where Ci, ri, and s are the volume, radius, and width of each lognormal function, respectively. η is the parameter to determine the width and is given by a fixed value (Appendix A). We can separate the size distribution into fine and coarse modes by giving the boundary radius rb, which is obtained as the local minimum. Furthermore, we separate the coarse mode into spherical and nonspherical particles:
where is the fine mode, is the coarse mode, and δ is the fraction of the nonspherical particles in the coarse mode (Fig. 8). The aerosol optical properties are calculated from the size distribution and refractive index, similar to the methods of Kudo et al. (2016) and Dubovik et al. (2006), as follows:
where τext∕sca(λ) denotes the optical thickness of extinction and scattering and τsca(λ)Pii(Θ,λ) denotes the directional scattering corresponding to the scattering matrix elements Pii(Θ, λ). KS and KNS are the kernels of extinction and scattering properties for spherical and nonspherical particles, respectively. n and k are the real and imaginary parts of the refractive index, respectively. We use randomly oriented spheroids as nonspherical particles and use the kernels developed by Dubovik et al. (2006).
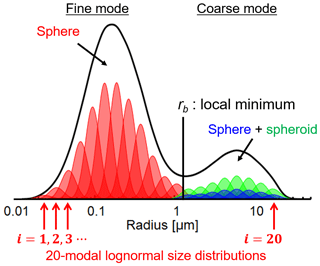
Figure 8This assumes volume size distributions in the SKYMAP algorithm. Fine- and coarse-mode particles are separated at radius rb. Spheroid particles are assumed only in the coarse mode. The black line is the volume size distribution, which is computed by the integration of 20-modal lognormal distribution functions (red, blue, and green lines).
We compute normalized angular distributions and transmittances of the extinction, using the radiative-transfer model RSTAR (Nakajima and Tanaka, 1986, 1988). The model atmosphere is divided by 18 altitudes of 0, 1, 2, 3, 4, 5, 6, 7, 8, 9, 10, 15, 20, 30, 40, 50, 70, and 120 km. Atmospheric vertical profiles of temperature and pressure are obtained from the NCEP/NCAR Reanalysis 1 data. The absorption coefficients of H2O, CO2, O3, N2O, CO, CH4, and O2 are calculated by the correlated k-distribution method from the data table of Sekiguchi and Nakajima (2008).
The aerosol parameters for the best fit to all measurements (normalized angular distributions and transmittances at aerosol channels) and a priori information are obtained by minimizing the following cost function:
where vector ymeas describes the measurements (normalized radiances Rmeas and transmittances of total extinction Tmeas) at the aerosol channels; vector x describes the aforementioned aerosol parameters – n(λ), k(λ), Ci, and δ – to be estimated; vector y(x) comprises the values corresponding to ymeas calculated from x by the forward model (Rret and Tret); and matrix W2 is the covariance matrix of y and is assumed to be diagonal. The diagonal elements of W are standard errors in the measurements. We set their values at 0.02 for Tmeas and 10 % for Rmeas.
To reduce the effects of observational error on retrieval and to conduct stable analyses, Dubovik and King (2000) considered restricting the spectral variability of the volume size distribution and limiting the length of the refractive index derivative with respect to the wavelength. They considered this a priori smoothness constraint as being of the same nature as a measurement and incorporated the smoothness constraint into their retrieval scheme. We also consider the smoothness constraints in this study. The second term of Eq. (13) consists of a priori information on the wavelength dependencies of the refractive index, aerosol optical thickness, and smoothness of the volume spectrum, which is described as
where vectors , , , , and are a priori information on the wavelength dependencies of the refractive index (real and imaginary parts), aerosol optical thickness (scattering and absorption parts), and smoothness of the volume spectrum, respectively. The matrix in Eq. (13) is the covariance matrix for determining the strengths of the constraints.
We adapt the smoothness constraints of the second derivative for the real and imaginary parts of the refractive index. The second derivatives are defined as
where and are the ith elements of the vectors and , respectively. Nw is the number of wavelengths. The values entered into the weight matrix Wa are 0.2 for the real part and 1.25 for the imaginary part. These values are adopted from Dubovik and King (2000). Furthermore, we introduce the smoothness constraints to the spectral distributions of the scattering and absorption parts of the aerosol optical thickness by
where and are the ith elements of the vectors and , respectively. The value entered in the weight matrix Wa is 2.5 for both the scattering and absorption parts of the aerosol optical thickness. To stabilize the estimation of the volume size distribution, we introduce the smoothness constraint for the adjacent volume size spectrum Ci as
where is the ith element of the vector . The small values of C0 and C21 at r0 and r21 are given to prevent both ends of the size distribution (C1 and C20) from being abnormal values because F and V do not have sufficient information to estimate the size distribution of both small (r<0.1 µm) and large particles (r>7 µm; Dubovik et al., 2000). Note that r0 and r21 satisfy Eq. (7). The value entered in the weight matrix Wa is 1.6 for the smoothness constraint of the size distribution.
We minimize f(x) of Eq. (13) using the algorithm developed in Kudo et al. (2016), which is based on the Gauss–Newton method and the logarithmic transformations of x and y. Finally, the aerosol optical properties from aerosol channels are obtained from x using Eqs. (11) and (12).
2.2.2 Step 2: retrieval of PWV
We estimate PWV by the following procedure. The aerosol volume size distribution is obtained from step 1, and the refractive index at 940 nm is calculated from those at 870 and 1020 nm by linear interpolation in the log–log plane. Using the size distribution and the interpolated refractive index, we can compute the aerosol optical properties and the normalized angular distribution at the water vapor channel using the forward model described in Section 2.2.1. We retrieve PWV by minimizing the following cost function:
where the component of vector x is PWV, vectors ymeas and y(x) are the normalized angular distribution in the range from 4 to 160∘, matrix W2 is assumed to be diagonal, and the values of the diagonal matrix W are assumed to be 10 %. The cost function is minimized by the Gauss–Newton method. Note that this process does not require the calibration constant of the sky radiometer because we use the normalized angular distribution (Eq. 4) to obtain PWV instead of using the direct solar irradiance (Eq. 1).
2.2.3 Step 3: retrieval of the calibration constant of the water vapor channel
F0 at the water vapor channel can be obtained from the observed F and the band average transmittance converted from PWV in step 2 as follows:
where τR and τa are Rayleigh scattering and aerosol optical thicknesses, respectively. The band average transmittance can be written as
where Φ(λ) is the filter response function, Δλ is the bandwidth of the filter response function, is the transmittance of water vapor at wavelength λ, is the optical air mass, gw is the mass mixing ratio, K is temperature, is the absorption coefficient at altitude z, and w is PWV. Equation (22) is discretized by
where Φi is the stepwise filter response function, Δλi is the sub-bandwidth of the filter response function, and Ns is the number of sub-bands. We calculate the absorption coefficients at each wavelength by the correlated k-distribution method (Sekiguchi and Nakajima, 2008) using the vertical profiles of temperature, pressure, and specific humidity in the NCEP/NCAR Reanalysis 1 data.
We can calculate a value for F0 from a data set of the normalized angular distribution. Therefore, for example, a time series of F0 for a day is obtained from the daily measurements of the sky radiometer. The mean value of the calibration constant at the water vapor channel is determined by the robust statistical and iterative method with Huber's M-estimation procedure:
where is the mean calibration constant and is calculated at each iterative step, F0(ti) is the calibration constant at a specific time t, and βH is Huber's weight function.
2.2.4 Cloud screening using the smoothness criteria of the angular distributions (SCAD method)
The SKYMAP algorithm can only be applied to measurements under clear-sky conditions. We estimated clear-sky conditions from two indexes calculated from sky-radiometer measurements. Index 1 is a value for the normalized radiances near the sun. If clouds pass over the sun, index 1 has a large temporal variation. Index 2 is a value for the normalized angular distribution. If clouds are detected on the scanning plane of the sky radiometer, the normalized angular distribution has a large variation. Index 1 is defined as follows. First, the mean normalized radiance near the sun is calculated by
where N is the number of measurements and R is the normalized radiance at a time t, scattering angle Θ, and wavelength 500 nm. Next, the running mean of the time series of with a window of three consecutive data points is calculated as . Index 1 is defined as the deviation of from ,
Index 2 is the deviation of normalized angular distributions far from the sun and is defined as
where is the running mean of R(Θi,t) with a window of three consecutive data points and σ(X) is the standard deviation of data set X. Note that the data for calculating vary depending on SZA, which limits available scattering angles. We judged clear-sky conditions when indexes 1 and 2 were both below their respective thresholds (0.1 and 0.2, respectively). We determined the thresholds by comparing the images of the whole-sky camera and the time series of the surface solar radiation observed by the pyranometer. Figure 9 is an example of the results for observations on 6 January 2014, in Tsukuba. Clear-sky conditions continued until 12:30 JST, and then clouds passed over the sky until 15:00 JST. Subsequently, there were clouds near the horizon, but the sky was almost clear. Our algorithm worked well, and cloudy scenes were eliminated. Although the whole-sky camera detected some clouds from 14:00 to 15:00 JST, our algorithm judged the scenes as representative of clear-sky conditions. This may be because there were no clouds in the line of sight of the sky radiometer. The decline in the surface solar radiation around 09:00 JST was due to wiping of the glass dome of the pyranometer to keep the dome clean.
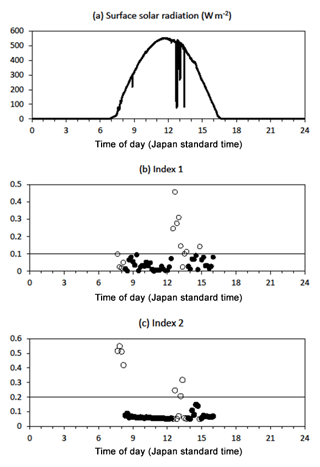
Figure 9An example result of the SCAD method on 6 January 2014, in Tsukuba. (a) Surface solar radiation observed by the pyranometer. (b) Index 1. (c) Index 2. The closed circles indicate clear-sky conditions, and the open circles indicate cloudy conditions (b, c). The lines at 0.1 in (b) and 0.2 in (c) are thresholds for indexes 1 and 2, respectively.
The method was applied to measurements from 2013 to 2014 at the Meteorological Research Institute (MRI) of the Japan Meteorological Agency (JMA) in Tsukuba. The results were validated using a visual observation of the amount of clouds in the Aerological Observatory of the JMA. Figure 10a shows the histograms of index 1 for cases in which the sun was and was not covered by clouds. Index 1 had a low value when there were no clouds shading the sun but had a wide range of values when clouds were shading the sun. Figure 10b shows the histograms of index 2 when cloud cover was and was not <20 %. The peak shifted to the right when cloud cover was ≥20 %, but the effect was not significant. Table 3 shows the validation results of this method. We defined “best condition” as cloud cover <20 % and “poor condition” as cloud cover ≥20 %. In less than 17 % of cases a poor condition was judged as a best condition. The sky radiometer observes only a part of the whole sky, but our algorithm showed good results.
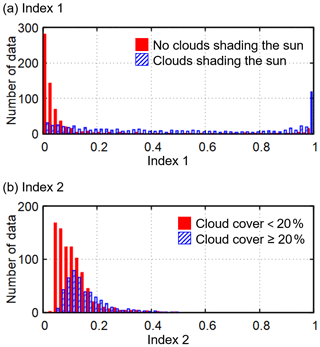
Figure 10Histograms of indexes 1 and 2 of sky-radiometer observations at Tsukuba. (a) Index 1 shows when the sun is covered by clouds (blue boxes) and not covered by clouds (red boxes). (b) Index 2 shows when cloud cover is less than to 20 % (red boxes) and greater than or equal to 20 % (blue boxes).
2.3 Estimation of PWV from direct solar irradiance (DSRAD algorithm)
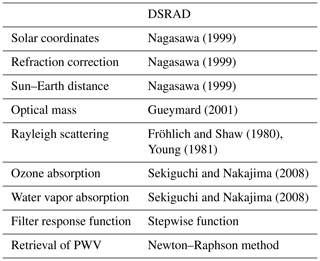
The sky radiometer observes the angular distribution of V every 10 min but observes the direct solar irradiance every 1 min. Once the calibration constant is determined by the SKYMAP algorithm, we can estimate PWV from the direct solar irradiance. The DSRAD algorithm computes the aerosol optical thickness and PWV from the direct solar irradiances at the aerosol and water vapor channels. Table 4 shows the references of the DSRAD algorithm. This algorithm consists of two steps. First, aerosol optical thicknesses at aerosol channels are calculated using direct solar irradiances. The aerosol optical thickness at the water vapor channel is interpolated from the aerosol optical thicknesses at 870 and 1020 nm by linear interpolation in the log–log plane. Second, the band mean transmittance of the water vapor, , is calculated from the calibrated direct solar irradiance. PWV is retrieved using the formula,
where is the optical air mass calculated by Gueymard (2001). Equation (30) is solved using the Newton–Raphson method.
To ensure the quality of the data and avoid cloud contamination, we adopt the method of Smirnov et al. (2000) with two main differences, similar to Estellés et al. (2012). First, an aerosol optical thickness at 500 nm>2 is considered cloud-affected data. Second, the triplet of the aerosol optical thickness in Smirnov et al. (2000) is built from the pre- and post-1 min data instead of 30 s.
We conducted sensitivity tests using simulated data to evaluate SKYMAP algorithm steps 1 and 2 (Fig. 7a and b). The simulation was conducted using the two aerosol types described in Sect. 2.1.2. The sensitivity test was conducted with sky radiances in the almucantar plane for the wavelengths of 340, 380, 400, 500, 675, 870, 940, and 1020 nm; aerosol optical thicknesses of 0.02, 0.06, and 0.20 at 940 nm; PWV of 0.0, 0.5, 1.0, 1.5, 2.0, 2.5, 3.0, 3.5, 4.0, 4.5, and 5.0 cm; and SZA of 30, 50, and 70∘.
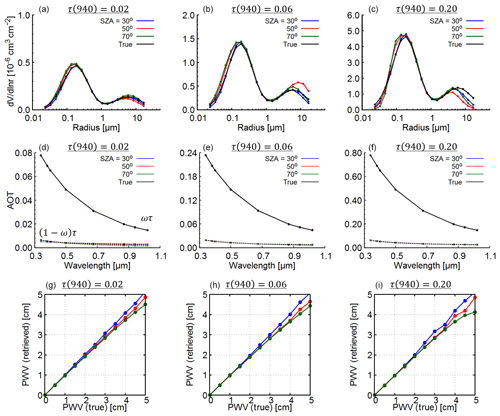
Figure 11Retrieval results from simulated data for continental-average aerosol. The top row is the volume size distribution; the middle row is the scattering and absorption parts of aerosol optical thickness; and the bottom row is a comparison of the true and retrieval values of PWV. Blue, red, and green lines are the retrieval results at SZA=30, 50, and 70∘, respectively. The black line is the true value. Note that the blue, red, green, and black lines in the middle row overlap.
Figure 11 illustrates the retrieval results from the simulated data for the continental-average aerosol with aerosol optical thicknesses of 0.02, 0.06, and 0.20 at 940 nm. The retrievals of the volume size distribution, aerosol optical thickness, and PWV corresponded with their input values (“true” values in Fig. 11) when the input of PWV was <2 cm. This was seen regardless of the magnitude of the aerosol optical thickness. When the input of PWV was >2 cm, the volume size distribution, scattering, and absorption optical thickness were retrieved well, but PWV was underestimated. When PWV was >2 cm, the normalized angular distribution was insensitive to PWV (Fig. 3). Figure 12 illustrates the retrieval results from the simulated data for the transported-dust aerosol with aerosol optical thicknesses of 0.02, 0.06, and 0.20 at 940 nm. The scattering and absorption optical thicknesses were retrieved well. The volume size distribution of the fine mode was slightly overestimated. The retrieval errors of PWV increased with increasing aerosol optical thickness because the near-infrared wavelength was strongly affected by the retrieval of coarse-mode particles.
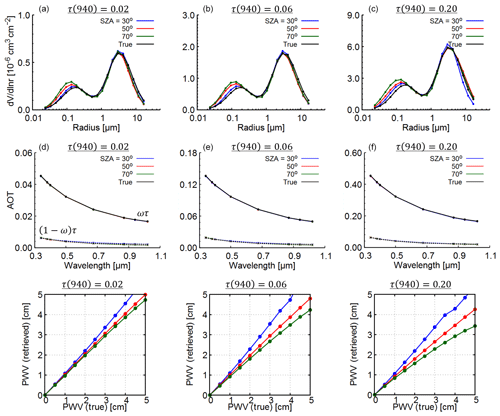
Figure 12Similar to Fig. 11 but for transported-dust aerosol. Note that the blue, red, green, and black lines in the middle row overlap.
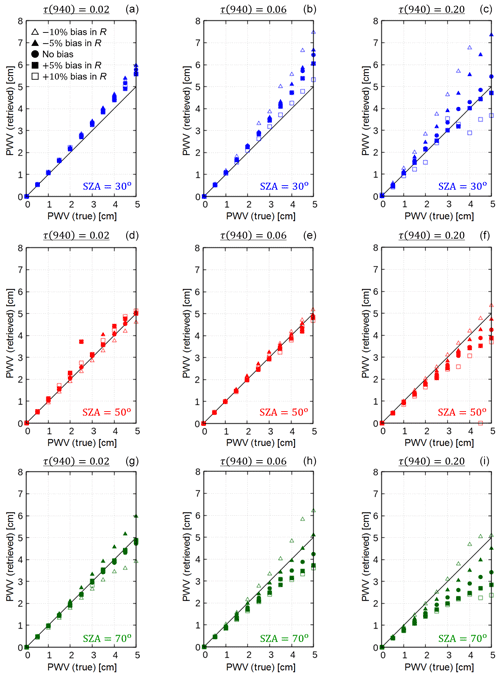
We also conducted sensitivity tests using the simulated data with bias errors to investigate uncertainty in the SKYMAP-derived PWV. The bias errors were ±5 % and ±10 % for R. The value of 5 % was given for the following reasons. The SVA bias errors of the diffuse radiances for the sky-radiometer observations were estimated to be less than 5 % (Uchiyama et al., 2018b). According to Dubovik et al. (2000), the uncertainty of the diffuse radiances for the AERONET measurements is ±5 %. Figures 13 and 14 show the results from the simulated data for the continental-average and transported-dust aerosols with aerosol optical thicknesses of 0.02, 0.06, and 0.20 at 940 nm. PWV was overestimated when −5 % bias was applied to R. This corresponds to the relationship between R and PWV, where R decreases with increasing PWV (Sect. 2.1.2). The bias errors strongly affected the retrieval of PWV at high PWV (>2 cm) because the sensitivity of high PWV is lower than that of low PWV. The retrieval error of PWV increased with increasing bias errors. The retrieval error of PWV due to ±5 % and ±10 % errors for R was within 10 % for PWV<2 cm and up to 200 % for PWV>2 cm.
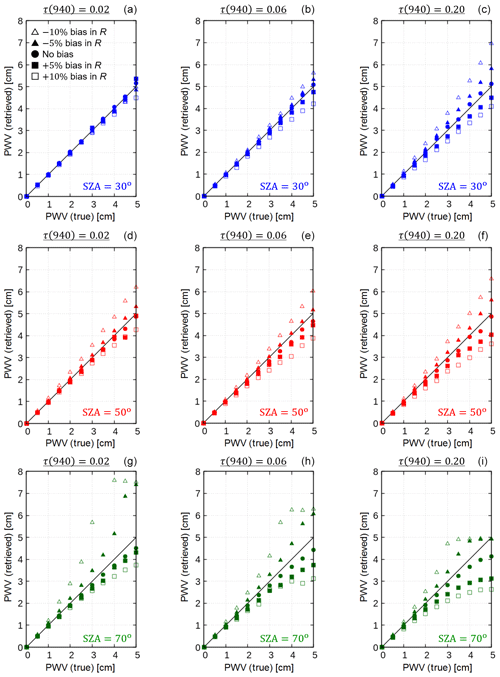
Figure 13Comparison of the true and retrieval values of PWV from simulated data for continental-average aerosol with bias errors. The top, middle, and bottom rows are the retrieval results at SZA=30, 50, and 70∘, respectively. Closed circles are the results with no bias errors. Closed squares and closed triangles are the results with bias errors of plus and minus 5 % in R, respectively. Open squares and open triangles are the results with bias errors of plus and minus 10 % in R, respectively.
When the input of PWV was <2 cm, the SKYMAP algorithm retrieved PWV very well, within an error of 10 % regardless of the aerosol optical thickness or aerosol type. This was also observed when the bias errors were added for R. The scattering and absorption parts of the aerosol optical thickness were also estimated very well within ±0.01 in all conditions. Present sensitivity tests suggest the design of a sky-radiometer calibration program as follows: to determine the calibration constant of the water vapor channel in dry days or seasons with PWV<2 cm and to obtain PWV from direct solar irradiance data throughout the year, as illustrated in Fig. 1.
We applied our methods to SKYNET sky-radiometer data in Tsukuba and Chiba. The results were compared to PWV observed by well-established instruments and methods other than the sky radiometer. The aerosol channels of the sky radiometer were calibrated by the IL method with SKYRAD.pack version 4.2 (Nakajima et al., 1996; Campanelli et al., 2004, 2007), and the SVA of all channels were calibrated by the on-site methods (Nakajima et al., 1996; Boi et al., 1999; Uchiyama et al., 2018b).
4.1 Observation at Tsukuba
In Tsukuba, the sky-radiometer model POM-02 (serial no. PS1202091) is installed at the MRI (36.05∘ N, 140.12∘ E). We used data from 2013 to 2014. The water vapor channel of PS1202091 was calibrated each winter by a side-by-side comparison with the reference sky radiometer, which was calibrated by the standard Langley method at the NOAA Mauna Loa Observatory (Uchiyama et al., 2014). PWV was also observed using a GNSS–GPS receiver (Shoji, 2013) at Ami station (no. 0584; 36.03∘ N, 140.20∘ E), approximately 7.5 km east-southeast of the MRI.
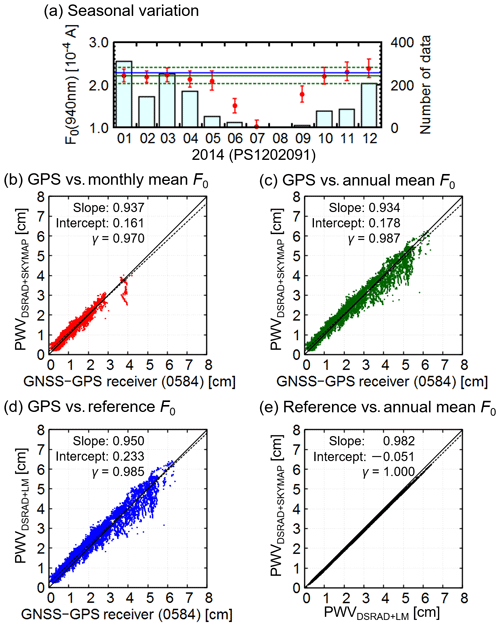
The calibration constant of the water vapor channel was determined for each month (Figs. 15a and 16a). To obtain the correct value, we used the retrieval results with PWVSKYMAP<2 cm and sufficiently small cost functions (Eqs. 13 and 20). The annual mean calibration constants for 2013 and 2014 were and A, respectively. The annual mean calibration constants changed drastically from 2013 to 2014 (+17.2 %). This is because the lens at the visible and near-infrared wavelengths was replaced in December 2013. The results in 2013 and 2014 were 10.1 % and 3.2 % lower, respectively, than those determined by the side-by-side comparison with the reference sky radiometer. The difference in the value of the calibration constant between the SKYMAP algorithm and the side-by-side comparison with the reference sky radiometer was attributable mainly to the calibration period. The calibration constant of the sky radiometer has seasonal variation due to the temperature dependency of the sensor output (Uchiyama et al., 2018a). Calibration by a side-by-side comparison with the reference sky radiometer was performed only in the winter. However, the calibration constant of the SKYMAP algorithm was the annual mean.
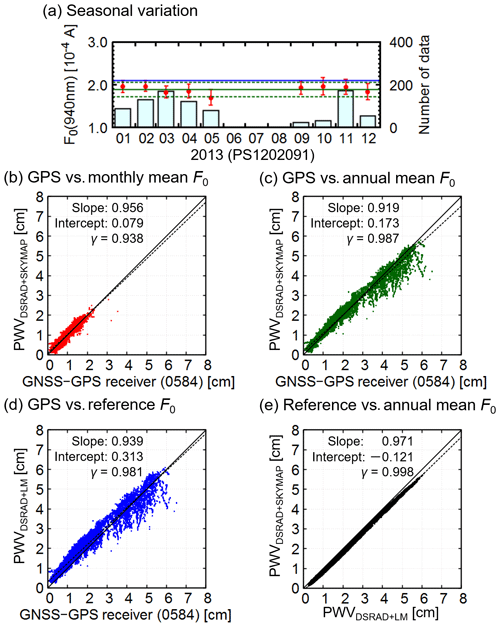
Figure 15Application of our methods to observational data from Tsukuba in 2013. (a) Seasonal variation in the calibration constant of the water vapor channel (red circles and error bars are monthly means and standard deviations, respectively; green solid and dotted lines are annual means and standard deviations, respectively; the blue line is the value obtained by a side-by-side comparison with the reference sky radiometer; boxes indicate the number of data points). (b–d) Comparisons of PWV between the GNSS–GPS receiver and the sky radiometer with (b) the monthly mean F0, (c) the annual mean F0, and (d) the reference F0. (e) Comparison of PWV from the sky radiometer with the reference and annual mean F0.
Figures 15b and 16b show the DSRAD-retrieved PWV, which is denoted by PWVDSRAD+SKYMAP, using the monthly calibration constant. PWVDSRAD+SKYMAP of the sky radiometer agreed well with that of the GNSS–GPS receiver. Note that we did not retrieve PWV using the monthly mean calibration constants for June and July 2014 because their values were obviously small and because little data were successfully retrieved due to the wet and cloudy conditions in the summer. In addition, it is possible that the measurements were contaminated by clouds. Although monthly mean calibration constants are best, in theory, they could not be obtained during the wet season or during periods of high aerosol optical thickness due to the transported dust. Thus, we used the annual mean calibration constant from all data in a year to estimate PWV. Figures 15c and 16c illustrate PWV using the annual mean calibration constants. The retrieved PWV agreed well with PWV from the GNSS–GPS receiver (correlation coefficient γ=0.987 and 0.987 and slope =0.919 and 0.934 for 2013 and 2014, respectively; Table 5). We estimated PWV, which is denoted by PWVDSRAD+LM, from the DSRAD algorithm using the calibration constant obtained by the side-by-side comparison with the reference sky radiometer. The comparison of PWVDSRAD+LM and the GNSS–GPS-derived PWV in Figs. 12d and 13d shows good agreement, and the results are similar to those in Figs. 15c and 16c. Then we compared PWVDSRAD+LM and PWVDSRAD+SKYMAP in Figs. 15e and 16e. The difference between PWVDSRAD+LM and PWVDSRAD+SKYMAP was small: 17 % in 2013 and 8 % in 2014. Our self-calibration method showed comparable results to those based on the standard Langley method (Uchiyama et al., 2014). Table 5 summarizes the results of comparisons of DSRAD-derived PWV and GNSS–GPS-derived PWV. The magnitude of the bias error and root mean square error were small, less than 0.11 cm and less than 0.226 cm, during 2013 to 2014. Table 6 shows the errors of the retrieved PWV with the annual mean calibration constants for the rank of PWV. The bias error was larger for high PWV than it was for low PWV. The magnitude of the bias errors of PWV was less than 0.163 cm for PWV<3 cm and less than 0.339 cm for PWV>3 cm.
4.2 Observation at Chiba
We used the data from the sky-radiometer model POM-02 (serial no. PS2501417) at Chiba University (35.63∘ N, 140.10∘ E) in 2017. PWV was also obtained by a Radiometrix MP-1500 microwave radiometer (MWR) and AERONET sun–sky radiometer (Cimel, France) at the same location. The MWR measured in the 22–30 GHz region at 1 min temporal resolution and retrieved PWVMWR using the default software. PWVCimel of the AERONET sun–sky radiometer was retrieved by the direct solar irradiance at 936 nm with adjustment parameters (direct sun algorithm version 3; Holben et al., 1998; Giles et al., 2019) and adopted the cloud-screening method (AERONET level 2.0). The AERONET product comprises three types of data: level 1.0 data are not screened for cloud-affected or low-quality data; level 1.5 data are screened but not completely calibrated; and level 2.0 data are finalized data that have been calibrated and screened. We used PWV for the level 2.0 data.
Figure 17 shows comparisons of PWVDSRAD+SKYMAP using monthly and annual mean calibration constants, PWVMWR, and PWVCimel. PWVDSRAD+SKYMAP using monthly mean calibration constants agreed well (correlation coefficient γ=0.961 and slope =0.964) with those of the MWR (Fig. 17b). PWVDSRAD+SKYMAP using the annual mean calibration constant agreed with PWVMWR (Fig. 17c). The error of PWVDSRAD+SKYMAP was cm and RMSE<0.212 cm for low PWV (<3 cm) and cm and RMSE>0.465 cm for high PWV (Table 6). Figure 17d shows that PWVDSRAD+SKYMAP using the annual mean calibration constant also agreed with PWVCimel for low PWV (<3 cm) but was smaller than PWVCimel for high PWV (>3 cm). PWVMWR was larger than PWVCimel (Fig. 17e). PWVDSRAD+SKYMAP using the annual mean calibration constant was 12 % and 9.1 % smaller than PWVMWR and PWVCimel, respectively (Table 5). These results suggest an underestimation of PWVDSRAD+SKYMAP, as the uncertainty of PWVCimel compared to the GNSS–GPS receiver is expected to be less than 10 % (Giles et al., 2019). The underestimation of PWVDSRAD+SKYMAP was due to two factors. The first is the retrieval of PWV by the annual mean calibration constant for the water vapor channel. The calibration constant is not only subject to aging but also undergoes seasonal variation due to temperature dependency (Uchiyama et al., 2018a). Thus, it is possible to underestimate the calibration constant in the wet season. Second, uncertainty regarding the aerosol optical thickness affected PWV retrieval. Figure 18 depicts the differences in PWV and aerosol optical thicknesses at 675, 870, and 1020 nm between the DSRAD algorithm and the AERONET retrieval. In the periods from January to May and from October to November, the differences in PWV and aerosol optical thicknesses were less than 0.1 cm and 0.015, respectively. However, the difference in PWV was greater than 0.1 cm from July to September. This corresponds to the difference in aerosol optical thicknesses at 675, 870, and 1020 nm from July to September, which indicates that the transmittance of water vapor was overestimated by the overestimation of aerosol optical thickness. This led to the underestimation of PWVDSRAD+SKYMAP using the annual mean calibration constant when PWV was >3 cm. In our error estimation, the error of +0.03 for the aerosol optical thickness at 940 nm resulted in the error of −0.214 cm for PWV (Appendix B).
Table 6Difference in PWV between DSRAD with the annual mean calibration constants and other instruments.
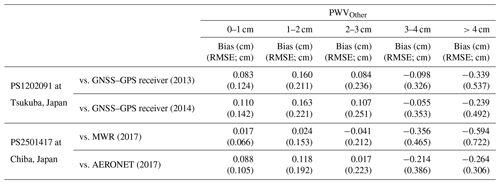
Bias: PWVDSRAD−PWVOther.
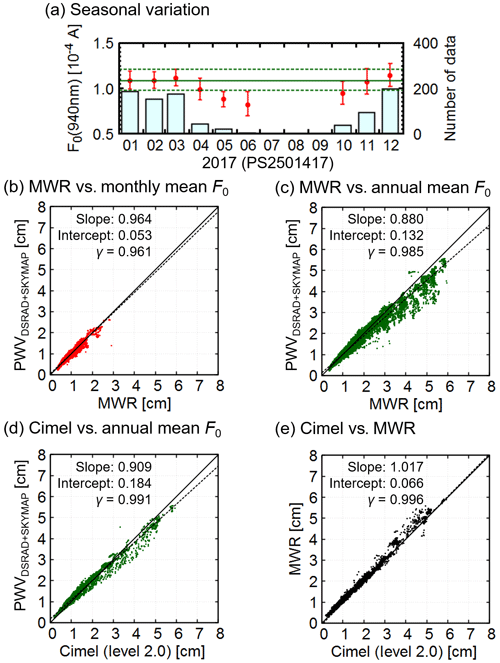
Figure 17Application of our methods to observational data from Chiba in 2017. (a) Seasonal variation in the calibration constant of the water vapor channel (red circles and error bars are monthly means and standard deviations, respectively; green solid and dotted lines are annual means and standard deviations, respectively; boxes indicate the number of data points). (b, c) Comparison of PWV between the MWR and the sky radiometer with (b) the monthly mean F0 and (c) the annual mean F0. (d) Comparison of PWV between the Cimel level 2.0 data and the sky radiometer with the annual mean F0. (e) Comparison of PWV between the Cimel level 2.0 data and the MWR.
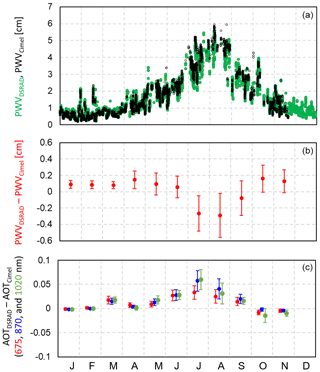
Figure 18The top row shows the time series of PWV in 2017 at Chiba (green and black circles are PWVDSRAD+SKYMAP and PWVCimel, respectively). The middle row is the difference between PWVDSRAD+SKYMAP and PWVCimel. The bottom row is the difference in aerosol optical thicknesses at 675 nm (red), 870 nm (blue), and 1020 nm (green) between the DSRAD algorithm and the AERONET retrieval results. Circles and error bars in the middle and bottom rows are means and standard deviations, respectively.
We developed a new on-site self-calibration method, SKYMAP, to retrieve PWV from sky-radiometer data at the water vapor channel. This method first retrieves PWV from the normalized angular distribution without the calibration constant. Then the calibration constant is retrieved from the obtained PWV. Once the calibration constant is determined, PWV can be estimated from the direct solar irradiance. Our DSRAD algorithm retrieves PWV from the direct solar irradiance. This method does not require adjustment parameters used in the empirical methods of previous studies (e.g., Holben et al., 1998; Uchiyama et al., 2014; Campanelli et al., 2014, 2018). Instead, the filter response function and the vertical profiles of water vapor, temperature, and pressure are required as input parameters. Thus, our physics-based algorithm has the potential to be applied to sky radiometers all over the world. This is the greatest advantage of the present study.
Sensitivity tests using simulated data from sky-radiometer measurements showed that the SKYMAP algorithm retrieved PWV within an error of 10 % for cases when PWV was <2 cm. Larger retrieval errors occurred in the cases when PWV was >2 cm because PWV became less sensitive to the normalized angular distribution. Therefore, the SKYMAP algorithm can be applied only to dry conditions.
We applied SKYMAP and DSRAD algorithms to the sky-radiometer measurements at two SKYNET sites (Tsukuba and Chiba, Japan). At Tsukuba, the calibration constant estimated by the SKYMAP algorithm was compared to that obtained by a side-by-side comparison with the reference sky radiometer calibrated by the standard Langley method. The calibration constant calculated by the SKYMAP algorithm was 10.1 % lower in 2013 and 3.2 % lower in 2014 compared with the calibration constant estimated by a side-by-side comparison. Our retrieved PWV data were compared to those obtained by a GNSS–GPS receiver, a microwave radiometer, and an AERONET sun–sky radiometer. The correlation coefficients and slopes were as good as >0.96 and 1.00±0.12, respectively. The magnitude of the bias error and the root mean square error were <0.163 and <0.251 cm, respectively, for low PWV (<3 cm). However, our retrieved PWV was underestimated in the wet conditions, and the magnitude of the bias error and the root mean square error was less than 0.594 cm and less than 0.722 cm for high PWV. This was due to seasonal variation in the calibration constant and the overestimation of aerosol optical thickness at 940 nm interpolated from those at 870 and 1020 nm.
These results show that our new on-site self-calibration method is practical. In future work, we plan to compare our method with others in the SKYNET framework (Uchiyama et al., 2014; Campanelli et al., 2014).
Because is expressed by the superposition of 20-modal lognormal size distributions (Eq. 6), the width of is larger than that of each lognormal size distribution. The width of the lognormal size distribution should be small to deal with the complicated and step variations in . However, cannot represent a natural curve if η is large and s is small (Fig. A1). Hence, we have to find the maximum value of η for making a natural curve. When Ci is constant, such a value of η minimizes the roughness of , and approaches a flat shape. For a simple formulation, we consider the function A(x) which consists of the multimodal normal distribution function Bi with a constant height. A(x) and Bi are expressed as
where iξ and are the mean and standard deviation, respectively. Its differential is written as
When the shape of A(x) approaches a flat shape, the difference between local maximum and minimum values of A(x) is approximately 0. Because equals 0 at , A(x) has the local maximum and minimum at x=jξ and in . The difference Δ between the local maximum and minimum values is obtained as
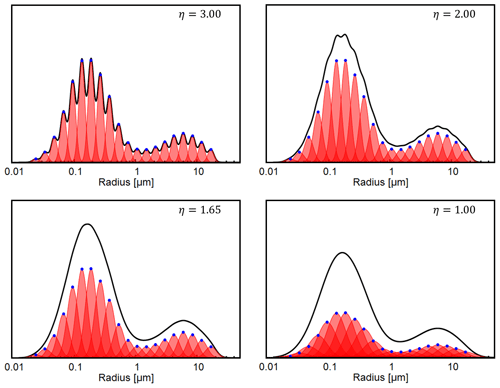
Figure A1Relationship between the volume size distribution and η. The black line is the volume size distribution, which is computed by the integration of 20-modal lognormal distribution functions (red lines). Blue circles are the peak volume of the lognormal size distribution.
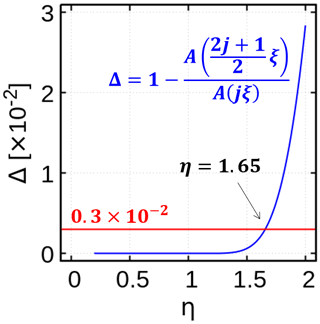
Figure A2 shows the relation between η and Δ. The value of Δ increases drastically at around η=1.5. In addition, the shape of is unnatural when η=2.0 (Fig. A1). Therefore, the value of η should be selected from the values around η=1.5. In this study, we fixed η at 1.65. This value represents the natural curve of and satisfies that the value of Δ is small enough, .
We evaluated the influence of the uncertainty of aerosol optical thickness on PWV using the empirical equation of Bruegge et al. (1992). PWV is described using the adjustment parameters as follows:
The uncertainty of PWV ϵPWV is given from the partial differentiation of Eq. (B1) with respect to as follows:
where is the uncertainty of . Using Eq. (B1) with the adjusting parameters of the sky radiometer, with a=0.620 and b=0.625 as the coefficient values for the trapezoidal spectral response function (Uchiyama et al., 2018a), we write the uncertainty of PWV as
If the uncertainty of the calibration constant at the water vapor channel is ignored, the uncertainty of is given from Eq. (21) as follows:
where ϵAOT is the uncertainty of the aerosol optical thickness at 940 nm. The uncertainty of PWV is written by Eqs. (B3) and (B4) as
where m0=3.0, w=5.0 cm, and ϵAOT=0.03.
The SKYMAP and DSRAD algorithms are available on request from the first author. The sky-radiometer data are available from the SKYNET website (http://www.skynet-isdc.org/, last access: 14 May 2020; ISDC, 2020), but the sky-radiometer data in Tsukuba, Japan, are available on request from the first author. The MWR data at Chiba University are available from CEReS, Chiba University (http://atmos3.cr.chiba-u.jp/skynet/, last access: 14 May 2020; SKYNET-ChibaU, 2020). The AERONET sun–sky radiometer data are available from the AERONET website (https://aeronet.gsfc.nasa.gov/, last access: 14 May 2020; AERONET, 2020).
This study was designed by MM, RK, KA, TM, KM, and TN. Sky-radiometer measurements at Tsukuba were conducted by RK. Sky-radiometer and MWR measurements at Chiba were conducted by HO and HI. Analyses of both sky radiometers were performed by MM. The calibration constant of the sky radiometer by the Langley method was provided by AU. Analyses of the GPS receiver were conducted by YS. Visual observations at Tsukuba were conducted by OI and MT. The paper was written by MM and RK, and all authors contributed to editing and revising the paper.
The authors declare that they have no conflict of interest.
This article is part of the special issue “SKYNET – the international network for aerosol, clouds, and solar radiation studies and their applications (AMT/ACP inter-journal SI)”. It is not associated with a conference.
This work was performed by the joint research programs of CEReS, Chiba University (2018), and the Environment Research and Technology Development Fund (S-12) of the Environmental Restoration and Conservation Agency. We are grateful to the OpenCLASTR project (http://157.82.240.167/~clastr/, last access: September 2018) for allowing us to use SKYRAD.pack (sky-radiometer analysis package), RSTAR (System for Transfer of Atmospheric Radiation for Radiance calculations), and PSTAR (System for Transfer of Atmospheric Radiation for Polarized radiance calculations) in this research. We acknowledge the AERONET networks for providing retrievals. NCEP reanalysis data were provided by the NOAA/OAR/ESRL PSD (Boulder, CO, USA) website at http://www.esrl.noaa.gov/psd/ (last access: September 2018).
This research has been supported by CEReS (grant no. P2018-2) and the ERTD (grant no. S-12).
This paper was edited by Monica Campanelli and reviewed by three anonymous referees.
AERONET: https://aeronet.gsfc.nasa.gov/, last access: 14 May 2020.
Bevis, M., Businger, S., Herring, T. A., Rocken, C., Anthes, R. A., and Ware, R. H.: GPS meteorology: Remote sensing of atmospheric water vapor using the Global Positioning System, J. Geophys. Res., 97, 15787–15801, 1992.
Boi, P., Tonna, G., Dalu, G., Nakajima, T., Olivieri, B., Pompei, A., Campanelli, M., and Rao, R.: Calibration and data elaboration procedure for sky irradiance measurements, Appl. Optics, 38, 896–907, 1999.
Bruegge, C. J., Conel, J. E., Green, R. O., Margolis, J. S., Holm, R. G., and Roon, G.: Water vapor column abundance retrievals during FIFE, J. Geophys. Res., 97, 18759–18768, 1992.
Campanelli, M., Nakajima, T., and Olivieri, B.: Determination of the solar calibration constant for a sun-sky radiometer: proposal of an in-situ procedure, Appl. Optics, 43, 651–659, 2004.
Campanelli, M., Estellés, V., Tomasi, C., Nakajima, T., Malvestuto, V., and Martínez-Lozano, J. A.: Application of the SKYRAD Improved Langley plot method for the in situ calibration of CIMEL Sun-sky photometers, Appl. Optics, 46, 2688–2702, 2007.
Campanelli, M., Nakajima, T., Khatri, P., Takamura, T., Uchiyama, A., Estelles, V., Liberti, G. L., and Malvestuto, V.: Retrieval of characteristic parameters for water vapour transmittance in the development of ground-based sun–sky radiometric measurements of columnar water vapour, Atmos. Meas. Tech., 7, 1075–1087, https://doi.org/10.5194/amt-7-1075-2014, 2014.
Campanelli, M., Mascitelli, A., Sanò, P., Diémoz, H., Estellés, V., Federico, S., Iannarelli, A. M., Fratarcangeli, F., Mazzoni, A., Realini, E., Crespi, M., Bock, O., Martínez-Lozano, J. A., and Dietrich, S.: Precipitable water vapour content from ESR/SKYNET sun–sky radiometers: validation against GNSS/GPS and AERONET over three different sites in Europe, Atmos. Meas. Tech., 11, 81–94, https://doi.org/10.5194/amt-11-81-2018, 2018.
Dubovik, O. and King, M. D.: A flexible inversion algorithm for retrieval of aerosol optical properties from sun and sky radiance measurements, J. Geophys. Res., 105, 20673–20696, 2000.
Dubovik, O., Smirnov, A., Holben, B. N., King, M. D., Kaufman, Y. J., Eck, T. F., and Slutsker, I.: Accuracy assessments of aerosol optical properties retrieved from Aerosol Robotic Network (AERONET) Sun and sky radiance measurements, J. Geophys. Res., 105, 9791–9806, 2000.
Dubovik, O., Sinyuk, A., Lapyonok, T., Holben, B. N., Mishchenko, M., Yang, P., Eck, T. F., Volte, H., Muñoz, O., Veihelmann, B., van der Zande, W. J., Leon, J.-F., Sorokin, M., and Slutsker, I.: Application of spheroid models to account for aerosol particle nonsphericity in remote sensing of desert dust, J. Geophys. Res., 111, D11208, https://doi.org/10.1029/2005JD006619, 2006.
Estellés, V., Campanelli, M., Utrillas, M. P., Expósito, F., and Martínez-Lozano, J. A.: Comparison of AERONET and SKYRAD4.2 inversion products retrieved from a Cimel CE318 sunphotometer, Atmos. Meas. Tech., 5, 569–579, https://doi.org/10.5194/amt-5-569-2012, 2012.
Fowle, F. E.: The spectroscopic determination of aqueous vapor, Astrophys. J., 35, 149–162, 1912.
Fowle, F. E.: The transparency of aqueous vapor, Astrophys. J., 42, 394–411, 1915.
Fröhlich, C. and Shaw, G. E.: New determination of Rayleigh scattering in the terrestrial atmosphere, Appl. Optics, 19, 1773–1775, 1980.
Giles, D. M., Sinyuk, A., Sorokin, M. G., Schafer, J. S., Smirnov, A., Slutsker, I., Eck, T. F., Holben, B. N., Lewis, J. R., Campbell, J. R., Welton, E. J., Korkin, S. V., and Lyapustin, A. I.: Advancements in the Aerosol Robotic Network (AERONET) Version 3 database – automated near-real-time quality control algorithm with improved cloud screening for Sun photometer aerosol optical depth (AOD) measurements, Atmos. Meas. Tech., 12, 169–209, https://doi.org/10.5194/amt-12-169-2019, 2019.
Gueymard, C. A.: Parameterized transmittance model for direct beam and circumsolar spectral irradiance, Solar Energy, 71, 325–346, 2001.
Halthore, R. N., Eck, T. F., Holben, B. N., and Markham, B. L.: Sun photometric measurements of atmospheric water vapor column abundance in the 940-nm band, J. Geophys. Res., 102, 4343–4352, 1997.
Hashimoto, M., Nakajima, T., Dubovik, O., Campanelli, M., Che, H., Khatri, P., Takamura, T., and Pandithurai, G.: Development of a new data-processing method for SKYNET sky radiometer observations, Atmos. Meas. Tech., 5, 2723–2737, https://doi.org/10.5194/amt-5-2723-2012, 2012.
Hess, M., Koepke, P., and Schult, I.: Optical properties of aerosols and clouds: the software package OPAC, B. Am. Meteorol. Soc., 79, 831–844, 1999.
Holben, B. N., Eck, T. F., Slutsker, I., Tanré, D., Buis, J. P., Setzer, A., Vermote, E., Reagan, J. A., Kaufman, Y. J., Nakajima, T., Lavenu, F., Jankowiak, I., and Smirnov, A.: AERONET-A federated instrument network and data archive for aerosol characterization, Remote Sens. Environ., 66, 1–16, 1998.
IPCC: Summary for Policymakers, in: Climate Change 2013: The Physical Science Basis. Contribution of Working Group I to the Fifth Assessment Report of the Intergovernmental Panel on Climate Change, edited by: Stocker, T. F., Qin, D., Plattner, G.-K., Tignor, M., Allen, S. K., Boschung, J., Nauels, A., Xia, Y., Bex, V., and Midgley, P. M., Cambridge University Press, Cambridge, United Kingdom and New York, NY, USA, 2013.
ISDC (Interntaional SKYNET Data Center), http://www.skynet-isdc.org/, last access: 14 May 2020.
Kasten, F. and Young, A. T.: Revised optical air mass tables and approximation formula, Appl. Optics, 28, 4735–4738, 1989.
Kobayashi, E., Uchiyama, A., Yamazaki, A., and Matsuse, K.: Application of the Statistical Optimization Method to the Inversion Algorithm for Analyzing Aerosol Optical Properties from Sun and Sky Radiance Measurements, J. Meteorol. Soc. Jpn., 84, 1047–1062, 2006.
Kudo, R., Nishizawa, T., and Aoyagi, T.: Vertical profiles of aerosol optical properties and the solar heating rate estimated by combining sky radiometer and lidar measurements, Atmos. Meas. Tech., 9, 3223–3243, https://doi.org/10.5194/amt-9-3223-2016, 2016.
Nagasawa, K.: Computations of Sunrise and Sunset, Chijin-Shoin, Japan, 1999 (in Japanese).
Nakajima, T. and Tanaka, M.: Matrix formulations for the transfer of solar radiation in a plane-parallel scattering atmosphere, J. Quant. Spectrosc. Ra., 35, 13–21, 1986.
Nakajima, T. and Tanaka, M.: Algorithms for radiative intensity calculations in moderately thick atmospheres using a truncation approximation, J. Quant. Spectrosc. Ra., 40, 51–69, 1988.
Nakajima, T., Tonna, G., Rao, R., Boi, P., Kaufman, Y., and Holben, B.: Use of Sky brightness measurements from ground for remote sensing of particulate polydispersions, Appl. Optics, 35, 2672–2686, 1996.
Nakajima, T., Yoon, S. C., Ramanathan, V., Shi, G. Y., Takemura, T., Higurashi, A., Takamura, T., Aoki, K., Sohn, B. J., Kim, S. W., Tsuruta, H., Sugimoto, N., Shimizu, A., Tanimoto, H., Sawa, Y., Lin, N. H., Lee, C. T., Goto, D., and Schutgens, N.: Overview of the atmospheric brown cloud east Asia regional experiment 2005 and a study of the aerosol direct radiative forcing in east Asia, J. Geophys. Res., 112, D24S91, https://doi.org/10.1029/2007JD009009, 2007.
Schmid, B., Thome, K. J., Demoulin, P., Peter, R., Matzler, C., and Sekler, J.: Comparison of modeled and empirical approaches for retrieving columnar water vapor from solar transmittance measurements in the 0.94-mm region, J. Geophys. Res., 101, 9345–9358, 1996.
Schmid, B., Michalsky, J. J., Slater, D. W., Barnard, J. C., Halthore, R. N., Liljegren, J. C., Holben, B. N., Eck, T. F., Livingston, J. M., Russell, P. B., Ingold, T., and Slutsker, I.: Comparison of columnar water-vapor measurements from solar transmittance methods, Appl. Optics, 40, 1886–1896, 2001.
Schmidt, G. A., Ruedy, R. A., Miller, R. L., and Lacis, A. A.: Attribution of the present-day total greenhouse effect, J. Geophys. Res., 115, D20106, https://doi.org/10.1029/2010JD014287, 2010.
Sekiguchi, M. and Nakajima, T.: A k-distribution-based radiation code and its computational optimization for an atmospheric general circulation model, J. Quant. Spectrosc. Ra., 109, 2779–2793, 2008.
Shoji, Y.: Retrieval of Water Vapor Inhomogeneity Using the Japanese Nationwide GPS Array and its Potential for Prediction of Convective Precipitation, J. Meteorol. Soc. Jpn., 91, 43–62, 2013.
SKYNET-ChibaU: http://atmos3.cr.chiba-u.jp/skynet/, last access: 14 May 2020.
Smirnov, A., Holben, B. N., Eck, T. F., Dubovik, O., and Slutsker, I.: Cloud-Screening and Quality Control Algorithms for the AERONET Database, Remote Sens. Environ., 73, 337–349, 2000.
Takamura, T. and Nakajima, T.: Overview of SKYNET and its activities, Ópt. Pur. y Apl., 37, 3303–3308, 2004.
Tanaka, M., Nakajima, T., and Shiobara, M.: Calibration of a sunphotometer by simultaneous measurements of direct-solar and circumsolar radiances, Appl. Optics, 25, 1170–1176, 1986.
Torres, B., Dubovik, O., Toledano, C., Berjon, A., Cachorro, V. E., Lapyonok, T., Litvinov, P., and Goloub, P.: Sensitivity of aerosol retrieval to geometrical configuration of ground-based sun/sky radiometer observations, Atmos. Chem. Phys., 14, 847–875, https://doi.org/10.5194/acp-14-847-2014, 2014.
Twomey, S. A.: Aerosol cloud physics and radiation, in: 7th Conference on Atmospheric Radiation, San Francisco, CA, 23–27 July 1990, AMS, j25–j28, 1990.
Uchiyama, A., Yamazaki, A., and Kudo, R.: Column Water Vapor Retrievals from Sky Radiometer (POM-02) 940 nm Data, J. Meteorol. Soc. Jpn., 92A, 195–203, 2014.
Uchiyama, A., Matsunaga, T., and Yamazaki, A.: The instrument constant of sky radiometers (POM-02) – Part 1: Calibration constant, Atmos. Meas. Tech., 11, 5363–5388, https://doi.org/10.5194/amt-11-5363-2018, 2018a.
Uchiyama, A., Matsunaga, T., and Yamazaki, A.: The instrument constant of sky radiometers (POM-02) – Part 2: Solid view angle, Atmos. Meas. Tech., 11, 5389–5402, https://doi.org/10.5194/amt-11-5389-2018, 2018b.
- Abstract
- Introduction
- Methods
- Sensitivity tests using simulated data
- Application to observational data
- Summary
- Appendix A: Width of the volume size distribution
- Appendix B: Error propagation from aerosol optical thickness to PWV
- Data availability
- Author contributions
- Competing interests
- Special issue statement
- Acknowledgements
- Financial support
- Review statement
- References


