the Creative Commons Attribution 4.0 License.
the Creative Commons Attribution 4.0 License.
The new instrument using a TC–BC (total carbon–black carbon) method for the online measurement of carbonaceous aerosols
Luka Drinovec
Gašper Lavrič
Athanasia Vlachou
André S. H. Prévôt
Jean Luc Jaffrezo
Iasonas Stavroulas
Jean Sciare
Judita Burger
Irena Kranjc
Janja Turšič
Anthony D. A. Hansen
Griša Močnik
We present a newly developed total carbon analyzer (TCA08) and a method for online speciation of carbonaceous aerosol with a high time resolution. The total carbon content is determined by flash heating of a sample collected on a quartz-fiber filter with a time base between 20 min and 24 h. The limit of detection is approximately 0.3 µg C, which corresponds to a concentration of 0.3 µg C m−3 at a sample flow rate of 16.7 L min−1 and a 1 h sampling time base. The concentration of particulate equivalent organic carbon (OC) is determined by subtracting black carbon concentration, concurrently measured optically by an Aethalometer®, from the total carbon concentration measured by the TCA08. The combination of the TCA08 and Aethalometer (AE33) is an easy-to-deploy and low-maintenance continuous measurement technique for the high-time-resolution determination of equivalent organic and elemental carbon (EC) in different particulate matter size fractions, which avoids pyrolytic correction and the need for high-purity compressed gases. The performance of this online method relative to the standardized off-line thermo-optical OC–EC method and respective instruments was evaluated during a winter field campaign at an urban background location in Ljubljana, Slovenia. The organic-matter-to-organic-carbon ratio obtained from the comparison with an aerosol chemical speciation monitor (ACSM) was , in the expected range.
- Article
(4470 KB) - Full-text XML
-
Supplement
(226 KB) - BibTeX
- EndNote
Carbonaceous aerosols frequently account for a large and often dominant fraction of fine particulate matter (PM2.5) mass in polluted atmospheres. They are extremely diverse (Gelencsér, 2004; Karanasiou et al., 2015), and they directly impact air quality, visibility, cloud formation and properties, the planetary radiation balance, and public health (Pöschl, 2005). The carbonaceous fractions can be described as black carbon (BC) or elemental carbon (EC) and organic matter (OM). OM is made up of many different molecular structures and includes not only particulate organic carbon but also hydrogen, oxygen, nitrogen and sulfur (Brown et al., 2013; Crenn et al., 2015). The amount of carbon that can be found in carbonaceous aerosols is called total carbon (TC), which is commonly categorized into fractions of organic carbon (OC) and elemental carbon (EC). OC can be directly emitted to the atmosphere in particulate form as primary organic matter by combustion and biogenic processes, or it can have a secondary origin from gas-to-particle conversion of (semi)volatile organic compounds in the atmosphere to aerosols after oxidation and condensation and nucleation (Hallquist et al., 2009). EC, on the other hand, is a mixture of graphite-like carbonaceous matter and is exclusively of primary origin and emitted by the incomplete combustion of carbonaceous fuels (Fuzzi et al., 2006; Karanasiou et al., 2015; Xu et al., 2015).
The first thermo-optical method for OC and EC determination was developed in 1982 by Huntzicker et al. (1982; Malissa et al., 1972). In thermo-optical methods, the carbonaceous aerosol deposited on the quartz filter is thermally desorbed according to a prescribed temperature protocol, first in an inert atmosphere (helium) and then in an oxidizing atmosphere (2 % oxygen, 98 % helium; Cavalli et al., 2010). EC is thermally refractive and does not volatilize in an inert atmosphere below ∼ 700 ∘C and can be combusted by oxygen at temperatures above 340 ∘C (Karanasiou et al., 2015; Petzold et al., 2013; Schmid et al., 2001). Ideally, the OC fraction would desorb in the inert stage of the analysis, while EC would desorb and combust in the high-temperature oxidizing stage of the analysis. Nevertheless, thermally unstable organic compounds pyrolyze (char) in the inert atmosphere to form pyrolytic carbon (PC), which combusts in the He+O2 gas stream in a manner similar to the original EC (Cavalli et al., 2010; Schauer et al., 2003; Karanasiou et al., 2015; Schmid et al., 2001). The PC that is formed during analysis, if not properly accounted for, would be incorrectly reported as EC. To account for this, illumination by a laser beam is used to monitor the optical properties of the filter during the analysis by measuring reflectance or transmittance (Chow et al., 1993). Because PC absorbs light, light transmission and reflectance signals decrease during the inert stage of the analysis when the PC is created and increase again in the oxidizing stage as the remaining carbonaceous material is burned off the filter. The time when the reflectance or transmittance signal values meet the prepyrolysis value is called the OC–EC split point.
The three most commonly used thermal protocols are IMPROVE_A, NIOSH 5040 and EUSAAR2. The IMPROVE protocol using light reflectance for correction was designed to be applied to the Interagency Monitoring of Protected Visual Environments network in the USA by Chow et al. (1993). The NIOSH protocol using light transmittance was developed for the analysis of the carbonaceous fraction of particulate diesel exhaust based on the US National Institute for Occupational Safety and Health method 5040. In 2010, the thermal optical analysis protocol EUSAAR2 was developed for European regional background sites. In order to improve the accuracy of the OC–EC split of this protocol, lower-temperature steps in the inert stage of the analysis and longer residence times are used to achieve reduction in PC and more complete evolution of OC (Cavalli et al., 2010). This protocol has recently become part of the European standard for the determination of OC–EC in PM2.5 samples (EN 16909:2017, 2017). Detailed discussion on the specific difference among protocols can be found elsewhere (Cavalli et al., 2010; Karanasiou et al., 2015).
The charring of organic material during thermal analysis is an important uncertainty in the thermo-optical methods. The amount of OC converted into PC during the analysis depends on many factors, including the number and type of organic compounds, the sources of air pollution, temperature steps in the analysis, the residence time at each temperature step, and the presence of certain inorganic constituents (Yu et al., 2002). When correcting for PC, thermal optical methods make two important assumptions:
-
PC created by charring during the helium stage of the analysis is more easily oxidized and will evolve before the original EC.
-
The specific light attenuation cross section of PC (σPC) is similar to that of the original EC on the filter (σEC).
However, PC and original EC combust concurrently in the oxidizing stage of the analysis. Moreover, PC can evolve even prematurely in the inert atmosphere depending on the thermal protocol used for the analysis, especially in the presence of oxygen donor substances in the sample (Sciare et al., 2003). Additionally, PC and EC have been shown to have significantly different values of σ (Bhagawan et al., 2015; Cavalli et al., 2010; Chen et al., 2015; Karanasiou et al., 2015; Subramanian et al., 2006). The σPC is mostly affected by the composition of its organic precursors, aerosol type and duration of sampling. For this reason, the magnitude of the uncertainty in the OC–EC split point varies from one aerosol sample to another. Overall, the uncertainty derived from an incorrect determination of the OC–EC split is a function of the following parameters (Karanasiou et al., 2015):
-
aerosol type – the amount of PC converted from OC in the sample and its properties;
-
sample oven soiling (i.e., presence of catalytic residues);
-
interference from other aerosol components – carbonate carbon, metal oxides, inorganic salts, brown carbon;
-
thermal protocol used for analysis.
Because OC is the larger and often the dominant fraction of TC, the uncertainty from an incorrect OC–EC split point has a greater effect on the EC value. However, TC is a measurement of all evolved carbon, irrespective of the possible conversion of the fractions or the sample properties. Hence the TC determination is not influenced by the amount of PC formed during analysis or the thermal protocol used and is therefore independent of the parameters mentioned above.
Thermal and optical methods refer to different properties of carbonaceous aerosol, and specific attention needs to be paid to using appropriate terminology when intercomparing carbonaceous analysis techniques using different measurement methods (Petzold et al., 2013). Measurements of optical attenuation or absorption are converted to mass concentration of black carbon (BC) using an externally determined mass attenuation or absorption cross section – the resulting quantity is called equivalent black carbon (eBC; Petzold et al., 2013). The thermo-optical and optical measurements share more than the optical pyrolysis determination during the inert phase of the heating in a thermal optical analyzer. The definition of eBC is tied to the thermal determination of the sample carbon content – the sample optical attenuation was compared to its thermally determined carbon content, both analyses performed after Soxhlet extraction (to remove nonsoluble carbon), obtaining the BC mass attenuation cross section independent of a specific thermal protocol (Gundel et al., 1984).
It was shown that the soluble carbon fraction did not absorb significantly, as the attenuation for the extracted samples decreased by no more than 7 % compared to the nonextracted ones. While the insoluble fraction is not identical to the thermally refractive one, the relationship between the optically determined BC and the thermo-optically determined EC can be determined by analyzing samples obtained at the same site during the same period. Differences in thermal protocols, giving (systematically) different EC values (Bae et al., 2009; Karanasiou et al., 2015), will result in different EC-to-BC regression slopes. At the same time, differences in the sample composition (and the sources of the aerosols) will influence the OC–EC split point, resulting in evolution of the less refractive part of EC in the inert phase and the more refractive part of OC in the oxidizing phase (Karanasiou et al., 2015). Sample composition and sources also impact the sample optical properties, especially at shorter wavelengths (Sandradewi et al., 2008; Zotter et al., 2017). All of these factors affect the relationship between EC and BC.
Carbonaceous aerosols are the major, dominant component of the mass of suspended particles in polluted atmospheres. Accurate, continuous and high-time-resolved data are needed in order to assess the severity of the problem, to identify and investigate the main sources which require attention, and to quantitate the improvements following the application of controls and regulations. The TC–BC method presented in this study is an easy-to-deploy and low-maintenance continuous measurement technique for the high-time-resolution determination of organic and elemental carbon in different PM fractions (PM10, PM2.5 and PM1). It can be used for routine air quality monitoring applications, fieldwork and laboratory research. For example, high-time-resolution data from the TC–BC method in combination with different size-selective inlets can be used for quality control in aerosol mass spectrometry through comparison of differently derived oxygen to carbon (O∕C) and organic aerosol to organic carbon (OA∕OC) ratios (Pieber et al., 2016). In this study, the online TC–BC method was tested during a field campaign from 7 February to 10 March 2017 at an urban background air quality monitoring station of the Slovenian Environmental Agency (ARSO). High-time-resolved data of TC and BC were compared to EUSAAR2 OC–EC analysis of PM2.5 filter samples that were collected in parallel with a high-volume sampler and to organic aerosol mass measured by an aerosol chemical speciation monitor (ACSM) with a PM1 aerodynamic lens. The performance of this online method relative to the standardized off-line thermo-optical OC–EC method and respective instruments is evaluated through analysis of regression models of the various compared methods.
2.1 TC–BC method for online high-time-resolved OC–EC measurements
In this study we present the newly developed application of the TC–BC method, which combines an optical method for measuring mass equivalent black carbon (eBC) by the AE33 Aethalometer (Drinovec et al., 2015; Hansen et al., 1984) and a thermal method for total carbon (TC) determination by a new instrument, the Total Carbon Analyzer TCA08, developed and commercialized by Aerosol d.o.o. (Ljubljana, Slovenia). The TC–BC method determines the equivalent organic carbon (eOC) fraction of carbonaceous aerosols defined as
where
is equivalent to elemental carbon (EC) and the determined proportionality parameter b is region or site specific but also depends to a large extent on the thermal protocol used to determine the EC fraction with a conventional OC–EC method. We call this determined parameter “equivalent elemental carbon” (eEC) since the measurement method is an optical one, and its result is converted to an equivalent concentration of elemental carbon, following the terminology logic of Petzold et al. (2013).
Although one can find conceptual similarities between the method presented in Bauer et al. (2009, and references therein) and the TC–BC method presented in this study, the new application of the method takes advantage of decoupling the thermal and optical method into two separate instruments, both dedicated to different measurements. With this, the TC–BC method has a higher time resolution, no sampling dead time and online loading nonlinearity compensation for eBC measurements (Drinovec et al., 2017) and is more convenient for field measurements as the thermal measurement is carried out without a fragile quartz cross oven, high-purity gases and a catalyst.
2.2 The TCA08 Total Carbon Analyzer
The TCA08 Total Carbon Analyzer instrument uses a thermal method for total carbon (TC) determination. The instrument contains two parallel flow channels with two analytical chambers, which alternate between sample collection and thermal analysis. While one channel is collecting its sample for the next time-base period, the other channel is analyzing the sample collected during the previous period. This sequential feature offers the great advantage of a continuous measurement of TC. Figure 1a shows the TCA08 flow diagram, controlled by a system of valves which alternate the two channels to the common elements of pump, CO2 analyzer, etc. The instrument collects the sample of atmospheric aerosols on a central spot area of 4.9 cm2 of a 47 mm diameter quartz-fiber filter enclosed in a small stainless-steel chamber (Fig. 1b), at a controlled sampling flow rate of 16.7 L min−1, i.e., 1 m3 h−1, provided by a closed-loop stabilized internal pump. The sampling time may be preset from 20 min to 24 h. A 1 h time base was used in the studies reported here.
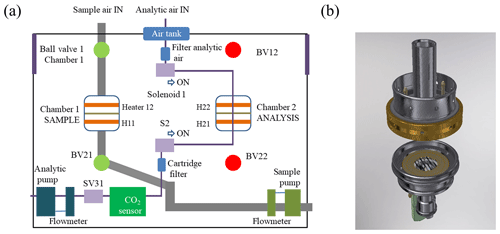
Figure 1(a) The TCA08 flow diagram. While chamber 1 collects a new atmospheric sample on the quartz-fiber filter, chamber 2 performs a thermal analysis of the previously collected sample. The system of ball valves (BV11, BV21, BV12, BV22) and solenoids (S1 and S2) change the airflows after the sample time base. (b) The analytical chamber of the TCA08 Total Carbon Analyzer is made of stainless steel. It supports the quartz-fiber aerosol collection filter between two closely spaced heating elements, one above and one below.
At the end of the collection period, the sample flow is switched from one channel to the other. A different configuration of valves provides a small analytical flow of 0.5 L min−1 of ambient air through the quartz-fiber filter and then to the CO2 detector. Before entering the chamber, the analytic air passes through a 10 L buffer volume for ambient CO2 fluctuation averaging and a capsule filter filled with activated carbon and a pleated glass fiber filter, which removes organic gases and particles from the stream. High-power electrical elements above and below the quartz filter heat the sample almost instantaneously to 940 ∘C, efficiently combusting carbonaceous compounds into CO2. Since the amount of CO2 produced is large compared to the internal volume of the system, this creates a pulse of CO2 in the analytical airstream of a short duration but well-defined amplitude over the baseline.
This has the very great advantage that filtered ambient air may be used as the analytical carrier gas, after temporal stabilization in the internal buffer volume to remove any rapid ambient fluctuations. This feature facilitates the field deployment of the TCA08 instrument, as it does not require compressed (carrier) gas for the analysis. The carrier gas concentration of CO2 is measured before and after the combustion step and fit using a polynomial function to create the baseline. The increase in CO2 concentration above the baseline is measured and integrated to give the total carbon content of the sample (mTC):
where Ccarb is a carbon calibration constant determined by a calibration with punches of ambient filters with known TC content; t2−t1 is the combustion duration of heating 1; fA(t) is the analytical airflow rate during combustion; and is the CO2 signal measured by the nondispersive infrared (NDIR) detector, relative to the fitted baseline level of CO2 in the ambient airstream. The second heating (t4−t3) is performed after the first heating when the chamber is cooled down to room temperature again. The term is the CO2 blank filter measurement relative to the fitted baseline level of CO2, as a result of an NDIR detector artifact due to rapid change in the air temperature in the chamber. The duration of analysis is 17 min and includes two identical heating and cooling cycles with measurement of background CO2 before and after heating. An example of such subtraction of two integrals in Eq. (3) is shown in Fig. 2.
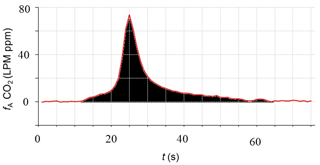
Figure 2Example output from the CO2 detector in the TCA08 Total Carbon Analyzer, showing the combustion-derived pulse of CO2 superimposed on the ambient-air baseline.
The CO2 sensor used in TCA08 is the LI-840A CO2/H2O Analyzer (LI-COR, Inc., 2016). It is an absolute, nondispersive infrared gas analyzer based upon a single-path, dual-wavelength and thermostatically controlled infrared (IR) detection system. Concentration measurements of CO2 and H2O are based on the difference ratio in IR absorption between sample and reference signal. The CO2 sample uses an optical filter centered at a wavelength of 4.26 µm (reference at 3.95 µm), while for H2O it is at 2.595 µm (reference at 2.35 µm). The concentration measurement of CO2 is pressure compensated and corrected for spectral cross-sensitivity of water molecules with an uncertainty of less than 1 ppm (at 370 ppm and 1 s signal filtering).
The light source life in the LI-840A CO2/H2O Analyzer is estimated to be 18 000 h. When the light source fails the TCA instrument detects it, stops the measurements and displays a LI-COR CO2 error status. Total carbon content of the sample measured by TCA08 is a function of a CO2 difference between signal and background values and thus not directly connected to the absolute value of CO2 (Eq. 3). This is why the TC result is less dependent on the light source drift in the NDIR detector than if the absolute value is used in the calculations. During the light source lifetime there is no need to perform internal standard calibration and a span check for the NDIR detector, as the whole system (NDIR detector + TCA08 analytic chamber) can be calibrated or validated with the carbon calibration and carbon validation procedure for TCA08, which is the great benefit of this instrument. Both procedures are described in the TCA08 User Manual (TCA08, 2019). Carbon calibration of TCA08 should be carried out once per year or after any major maintenance or modification of the system.
2.3 Positive and negative sampling artifacts in the TCA08 Total Carbon Analyzer
The measurement of carbonaceous aerosols using quartz-fiber filters is challenging because of the possibility of positive and negative sampling artifacts (Cheng et al., 2009; Kirchstetter et al., 2001; Subramanian et al., 2004; Watson et al., 2008). The adsorption of organic vapors (volatile organic compounds, VOCs) onto quartz-fiber filters during aerosol sampling causes OC concentrations to be overreported, while volatilization of the collected aerosols from the filter results in the loss of OC. These sampling artifacts have been estimated to range between +50 % for adsorption (Arhami et al., 2006; Kirchstetter et al., 2001) and −80 % for volatilization (Modey, 2001). In the European standard (EN 12341:2014, 2014) this phenomenon is acknowledged but not considered in the uncertainty budget, as its magnitude cannot be quantified precisely. However, different studies of positive and negative sampling artifacts have shown that the magnitude depends on the sampling face velocity, sampling duration, filter substrate, prefiring of filters, ambient temperature and location with its characteristic aerosol type (Karanasiou et al., 2015; Mader, 2003; Subramanian et al., 2004; Turpin et al., 2000). For comparison purposes, Table 1 shows a comparison of sample flow, sample face velocity, sample time base and filter media for the two different filter-based instruments used in this study: DIGITEL Sampler DHA-80 (DIGITEL Elektronik, 2012) and the TCA08. Different studies have noted that adsorption tends to be the dominant artifact at low-volume ambient sampling and shorter sample time bases. Consequently, we expect that volatilization effects will be small for the conditions used in the TCA08 instrument (McDow and Huntzicker, 1990; Subramanian et al., 2004; Turpin et al., 2000).
Table 1Filter collection area diameter, sample flow rate, face velocity, sample time base and filter material for the filter-based instruments used for the OC–EC concentration measurements.

Different approaches have been used to minimize the adsorption artifact and to quantify its magnitude, such as the “two filters” approach (quartz behind quartz, QBQ; quartz behind Teflon, QBT), the “slicing filters” approach, the regression intercept approach and the use of denuders (Eatough et al., 1999; Watson et al., 2008). For routine measurements in monitoring networks, a VOC denuder appears to be the most practical and realistic approach (Cavalli et al., 2016; Watson et al., 2009). Such denuders trap gaseous carbonaceous species, which would otherwise be adsorbed by quartz-fiber filters and measured as a positive sampling artifact. The denuder adsorbs organic gases by diffusion to its wall surfaces, while the aerosols remain suspended in the sample stream and are unaffected. The TCA08 instrument uses a honeycomb charcoal denuder to remove gas-phase OC with high efficiency at the sampling flow rate of 16.7 L min−1. Residence time for one denuder monolith in the TCA08 is 175 ms. Honeycomb denuders have a high density of channels and offer a large active surface area in a compact size (Mader et al., 2001). Additionally, solid charcoal material does not deteriorate under the influence of humidity, which is an advantage compared to denuders fabricated with carbon impregnated strips (Cavalli et al., 2016).
Depending on the location and the concentration of organic gases, some VOCs can still penetrate through the denuder and be adsorbed by the quartz-fiber filter matrix (denuder breakthrough; Arhami et al., 2006; Zhang et al., 2013). Denuder breakthrough occurs when the time for trapping VOCs is longer than the residence time. During the sampling the actual capacity of the denuder slowly decreases, as the denuder surfaces become occupied by adsorbed VOCs, leading to increased times to trap all VOCs. Longer residence times are needed on such occasions (two or more denuder monoliths). To account for this artifact, the TCA08 instrument incorporates a test procedure which can be used to determine the on-site efficiency of the VOC denuder and denuder breakthrough value on site. This (QBQ) approach integrates an in-line filter in the sample inlet stream to remove filterable aerosols. The denuder is then installed in the flow stream passing to Channel 1, while Channel 2 receives the undenuded stream (Fig. 3).
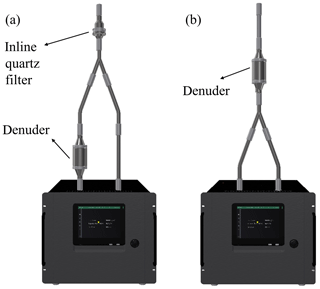
Figure 3TCA08 setup when (a) sampling and (b) performing denuder efficiency test. Note that the tubing length is identical in both setups. This permits the test to be performed at a permanent installation without disturbing the inlet plumbing.
The denuder efficiency ED is determined by comparing the TC results in chamber 1 and chamber 2 as
where TCis nth total carbon content measured in chamber 1, where the air sample stream goes through the filter above the divider and denuder, and TCF,n is nth total carbon content measured in chamber 2, where the air sample stream goes only through the filter above the divider. Constant gaseous OC concentration approximation through n measurements is used for calculation. TC also represents the denuder breakthrough value.
We developed these routines during the instrument design and performed the measurements as part of the field campaign. After 5 weeks of continuous operation with consistent TC data, the measured denuder efficiency was 74 %. We recommend that the denuder should be replaced or regenerated when its efficiency drops below 70 % (Ania et al., 2005; Bhagawan et al., 2015; Gao et al., 2014). The standard operating procedure for routine use of the TCA08 instrument recommends replacement or regeneration of the denuder honeycomb element once per month. Further, in environments with high VOC concentrations, two denuder honeycombs in series are recommended (Gregorič et al., 2020).
2.4 Field-testing measurement campaign
The TCA08 instrument was evaluated during a field measurement campaign at an urban background site in Ljubljana, Slovenia. Ljubljana is a city of ∼ 350 000 inhabitants located at the southern edge of a geographic basin. In wintertime, it is characterized by poor ventilation and frequent temperature inversions. Air quality in Ljubljana is influenced mostly by traffic and also by the combustion of biomass for household heating, both within the city and in surrounding areas (Ogrin et al., 2016).
The measurement campaign was conducted between 7 February and 10 March 2017 at the urban background air quality monitoring station of the Slovenian Environmental Agency (ARSO) at 46.0654∘ N, 14.5120∘ E, elevation 299 m. This sampling site and period of the year were selected to test the performance of the instrument in a complex environment characterized by various sources of carbonaceous aerosols (traffic, domestic heating, secondary organic) exhibiting strong temporal variability and a wide range of properties (OM∕OC, OC–EC, volatility, etc.). During the Ljubljana campaign, the daily average measured TC concentrations ranged from 3 to 26 µg m−3. This provided a wide dynamic range for the intercomparison of methods and analyses.
The TCA08 was operated on a 1 h time base, sampling PM2.5 fraction at 16.7 L min−1; co-located with a model AE33 Aethalometer measuring black carbon aerosols in PM2.5 on a 1 min time base at 5 L min−1. At the same location, 24 h PM2.5 filter samples were collected in parallel with a DIGITEL high-volume sampler for OC–EC offline analysis at two different laboratories: the Slovenian Environmental Agency (ARSO, Ljubljana, Slovenia) and the Institute for Geosciences and Environmental Research (IGE, Grenoble, France) both using the Sunset offline OC–EC analyzer with the EUSAAR_2 thermal protocol. Sampling start time was at 00:00 LT and sampling stop time was at 23:55 LT each day. During the 5 min idle period, the sampler automatically stored the sampled filter and replaced it with a new one. Additionally, nonrefractory organic matter (OM) measurements were performed during the campaign with an ACSM (Aerodyne, Billerica, MA; Ng et al., 2011) on a 29–30 min time base to derive high-time-resolution measurements of the OM-to-OC ratio. The ACSM, equipped with a PM1 aerodynamic lens, was sampling through a PM1 sharp-cut cyclone (SCC 1.197, BGI Inc.) at a flow rate of 3 L min−1 yielding a particle cutoff diameter of roughly 3 µm. Furthermore, the sample was driven through a Nafion dryer, upstream of the instrument inlet, keeping the sample relative humidity below 40 % throughout the campaign. The chemical-composition-dependent collection efficiency of the instrument was determined according to Middlebrook et al. (2012). Due to variability in the ACSM time base, we gathered the data into 3 h averages. All of the instruments were checked regularly and operated without interruption throughout the campaign. No data were selectively removed from the results presented in the following.
Table 2 reports comparison results between offline filter measurements and 24 h average values of high-time-resolution measurements of TC, eBC, eOC = TC − bBC and OM and between online measurements (3 h) of eOC and OM. Linear orthogonal regression results are shown with s as the slope for the model without an intercept and with s1 as the slope and i as the intercept for the model with an intercept (EN 16450:2017, 2017). is the square of the Pearson correlation coefficient. A total of 31 samples were collected for the offline comparison.
Table 2Summarized comparison results between off-line filter measurements and 24 h average values of high-time-resolution measurements of TC, BC, eOC and OM and between high-time-resolution measurements (3 h) of eOC and OMACSM measurements.
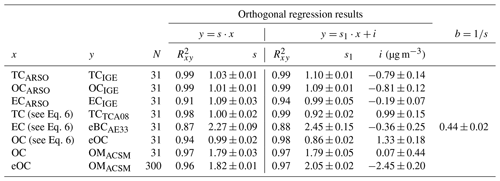
As there is no standard for a reference method for online measurement of OC and EC concentrations available at the time of the writing of this paper, we used tools and methods developed in EN16450:2017 and choose EN 16909:2017 as the reference method. Nevertheless, a proper application of EN16450:2017 would require a minimum of 40 valid data pairs with the further requirement of two candidate applications for each type of testing application. Additionally, the same standard further describes requirements related to the number of locations and the concentration range of data points. The results and discussion in this section are our best attempt at an equivalence comparison on the available data (31 daily filters due to the limited access to the DIGITEL high-volume sampler). Furthermore, we used only one set of instruments for the candidate method comparison. Both instruments, TCA08 and AE33, are compared to the reference set of instruments after their assembly as one of the tests during the final inspection procedure (in-house-defined requirements for successful intercomparison between new and reference set of instruments are (1) for TCA08, TC concentration range up to 75.000 ng m−3, slope between 0.95 and 1.05, R2 above 0.98 and (2) for AE33, eBC concentrations up to 25.000 ng m−3, slope between 0.95 and 1.05, R2 above 0.98; Table S1 in the Supplement).
A more in-depth analysis of these different correlations is provided in the following.
3.1 Interlaboratory comparison of off-line carbon analyses of 24 h filter samples
Figure 4 shows the comparisons of the off-line measurements performed by the ARSO and IGE laboratories for TC (a), OC (b) and EC (c); the OC–EC split point was derived from the thermogram using the EUSAAR_2 thermal protocol.
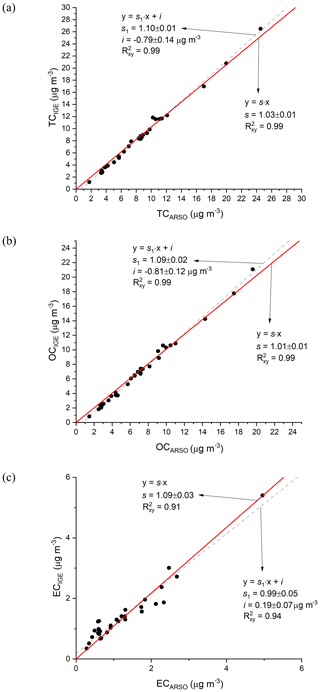
Figure 4Comparisons of offline measurements of (a) TC, (b) OC and (c) EC from the ARSO and IGE laboratory analyses. OC and EC were measured using the EUSAAR_2 thermal protocol. Linear orthogonal regression results are shown with s as the slope (red line) for the model without an intercept and with s1 as the slope and i as the intercept (dashed gray line) for the model with an intercept. is the square of the Pearson correlation coefficient. A total of 31 samples were collected for analysis during the campaign.
These results show that the off-line analyses of filter samples collected during the field campaign were consistent between the two external laboratories, both for the total carbon content of the samples and for the partitioning into EC and OC components. The uncertainty uRM between the reference methods for TC,
is 0.43 µg m−3 which is well below the limit of 2.00 µg m−3 requested for reference methods for PM mass concentration measurements (EN 16450:2017, 2017). As there is no method-specific uncertainty limit for TC available yet, the limit for PM can serve as an indication only, not as a direct criterion of compliance. However, the difference in slope for OC and consequently for TC is around 10 %, with a negative intercept value of around −0.80 µg m−3 for OC and TC (using a linear orthogonal regression model with intercept), which can indicate possible differences in instrument calibration, suboptimal performance of one of the instruments (featuring artifacts) or inadequate filter sample handling. The EN 16909:2017 standard includes in Sect. 7.2 a note that OC concentration may change depending on the sample handling. Both laboratories perform daily calibration constant validation with sucrose solution. Sucrose validations showed values within 5 % of the theoretical carbon content in the sucrose solution for the days these samples were analyzed at both laboratories. Hence, no calibration was needed and performed before filters from this study were analyzed. The ARSO laboratory also performed five duplicate measurements of the punches from the same filters; all results were within 5 %. The filter samples were first measured in the ARSO laboratory and then shipped to the IGE laboratory. Sampling, transport and storage of the filters were carried out according to EN 16909:2017 (2017).
These uncertainties and the regression slope are consistent with the results of the interlaboratory comparisons conducted in the ACTRIS (Aerosol, Clouds and Trace Gases Research Infrastructure) framework, where TC repeatability (intralaboratory measurement comparison) and reproducibility (interlaboratory measurement comparison) were reported to be in the range of 2 %–6 % and 3 %–13 %, respectively (ACTRIS, 2016, 2017, 2018). For EC∕TC, the ACTRIS exercises gave much larger reproducibility percentages, so, while there seems to be here a systematic (about 10 %) difference between the two laboratory analyses, the difference is within the range expected for the OC–EC determination. The OC–EC determination is quality controlled in the comparison exercise in which the Slovenian laboratory was participating. The 10 % difference in TC is larger than the reproducibility and repeatability of urban background samples analyzed in this exercise , and the difference is smaller for EC (ACTRIS, 2016) . This leads us to conclude that while the differences between the laboratories can be large, the 10 % difference between two laboratories using the same thermal protocol and sample protocols according to the applicable standard (EN 16909:2017, 2017) is not unusual (Panteliadis et al., 2015).
To reduce the uncertainty in OC–EC data in further analysis, an average of TC, OC and EC measurements on filters from both laboratories is used and reported in Table 2. Consequently, daily filter values of TCi, OCi and ECi are defined as
where represents each 24 h filter during the measurement campaign.
3.2 Comparison of TC on-line measurements with off-line filter analyses
Figure 5 shows a time series comparison of the 1 and 24 h average TCA08 data, together with the offline analyses results for TC analysis of filter samples defined by Eq. (6). Gaps in the TCA08 measurement data are due to regular maintenance and quality control procedures (quartz filter change procedure, denuder efficiency test, etc.).
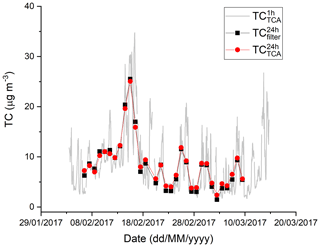
Figure 5Time series comparison of off-line results for TC derived from offline filter analyses to 1 and 24 h averaged TC data from the on-line TCA08 measurements.
These results show that on-line operation of the new TCA08 instrument with its simplified analysis method agrees very well with TC data measured by off-line thermo-optical analyses of filters. Figure 6 shows the comparison of these two datasets.
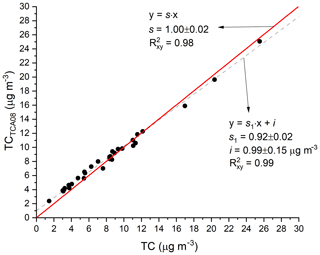
Figure 6Comparison of offline measurements of TC (laboratory filter analyses) to the 24 h average of 1 h online measurements of TC from the TCA08. Linear orthogonal regression results are shown with s as the slope (red line) for the model without an intercept and with s1 as the slope and i as the intercept (dashed gray line) for the model with an intercept. is the square of the Pearson correlation coefficient. A total of 31 samples were collected for analysis during the campaign.
The correlation plot of 24 h average TC results from the TCA08 versus the TC analyses of offline filters shows high Pearson correlation coefficients ( above 0.98 for both regression models). The linear orthogonal regression model without intercept shows slope s equal to 1.00±0.02, while the model with the intercept shows slope and an intercept of 0.99±0.15 µg m−3.
The fact that these slopes are close to unity for both regression models shows that the TCA instrument using no catalyst and filtered ambient air as the carrier gas during analysis has as high a combustion efficiency as the conventional offline OC–EC analyzer. The intercept of 0.99±0.15 µg m−3 may indicate a positive sampling artifact as described in Sect. 2.3. The positive sampling artifact attributed to VOC adsorption is more pronounced for the TCA method compared to offline filter analysis due to the difference in the sampling time, since both methods use similar face velocity (Table 1). VOC adsorption is most pronounced at the 1 h sampling time and saturates in a few hours (Gregorič et al., 2020); with a 24 h sampling time, the VOC contribution is small. Over a period of 24 h, VOCs adsorbed onto the filter during cooler parts of the day may be desorbed during warmer parts of the day, reducing their contribution to the OC result. The contribution of positive and negative artifacts for the 24 h filters is hard to estimate, while for a short sample time base the positive artifact prevails and can be described with a saturation curve. Therefore, the measured offset can be accounted for by denuder breakthrough, which was measured and confirmed by the denuder efficiency test. The delta analysis between TC analysis carried out on 24 h offline filters and online TC with 1 h time resolutions confirms this phenomenon, especially for the days with lower total carbon concentrations (lower than 5 µg m−3), where the relative difference between both methods can reach 25 %–50 % (Fig. 9). To achieve a lower offset in comparison to OC–EC measurements based on 24 h filters for the sampling sites with lower concentrations of TC, two denuder monoliths or a longer sampling time base should be used.
3.3 TCA08 method uncertainty
The uncertainty in TC data from conventional OC–EC analyzers is determined by the uncertainty in the volume of injected gaseous standard at the end of each analysis, the uncertainty in the external calibration standard, and the uncertainty in the CO2 and flow measurements during analysis (EN 16909:2017, 2017). The uncertainty uTCA associated with the TC data from the TCA08 includes individual uncertainty sources of the carbon calibration constant Ccarb, the uncertainty in the analytic flow measurement, and the uncertainty in the signal and blank CO2 peak measurement (Eq. 3). To calculate the measurement uncertainty in data from the TCA08, the CO2 signal measured by the NDIR detector is approximated with a box function, with its integral value the same as that of the measured CO2 signal function (Fig. 3). The height of the CO2 box function is a linear function of TC mass collected on the filter. The relative uncertainties in Ccarb and analytic flow are determined to be 5 % and 2 %, respectively, while the absolute uncertainty in CO2 measurement is approximately 1 ppm. The uTC for a representative range of concentrations of TC in air, using a 1h time base and sampling at 16.7 L min−1, is estimated to be
where LoD is the limit of detection of the TCA08 at a sample flow rate of 16.7 L min−1 and sample time base of 1 h. In the uncertainty budget of TC measurement with the TCA08 the following sources of uncertainties were not included: (1) temperature and pressure variations in the sample flow as they are measured by meteorological sensor and included in TC concentration calculations, (2) temperature and pressure variations in analytical flow as both parameters are measured within the NDIR LI-COR sensor and included in CO2 concentration determination, and (3) sampling artifacts and denuder efficiency – positive and negative artifacts phenomena are recognized by standards EN 12341:2014 and EN 16909:2017, but as the magnitude of these effects cannot be quantified precisely, they are not considered in the uncertainty budget. However, by using the denuder efficiency routine described in Sect. 2.3 and Eq. (4), one can estimate the absolute value of the positive artifact and set the sampling time base accordingly to reduce the contribution of this phenomenon to the uncertainty budget. Furthermore, introducing an inline Teflon filter at the sample inlet of one of the chambers provides semicontinuous measurement (every second measurement) of the positive artifact. The details of this method are described in Arhami et al. (2006). For this method, the denuder is installed in the common flow stream for both channels, while the inline Teflon filter is positioned only in the flow stream passing to Channel 1 (Fig. S1). An example of evaluation of denuder breakthrough contribution to the TC measurement uncertainty with the inline Teflon filter method is shown in Fig. S2.
3.4 Comparison of on-line BC measurements with off-line EC filter analyses
Figure 7 shows the regression of the off-line thermo-optical analysis of samples for EC (from the ARSO and IGE laboratories, using the EUSAAR_2 protocol) with the 24 h averaged BC (Aethalometer data) obtained during the field campaign period. An AE33 integrated “dual spot” real-time loading compensation algorithm was used for BC data treatment (Drinovec et al., 2015). The Pearson correlation coefficients of 0.87 and 0.88 are very similar for each of the regression models (with and without intercept). The linear relationship between EC and BC is described by slope s when an using orthogonal regression model without intercept. The proportionality parameter b (Eq. 2) is determined as
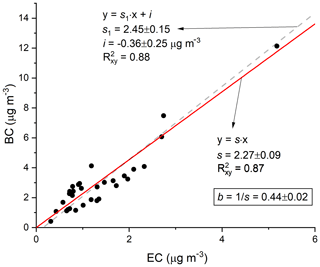
Figure 7Comparison of offline measurements of EC (laboratory filter analysis) using the EUSAAR_2 thermal protocol to the 24 h average of online measurements of BC data taken by the AE33 Aethalometer. Linear orthogonal regression results are shown with s as the slope (red line) for the model without an intercept and with s1 as the slope and i as the intercept (dashed gray line) for the model with an intercept. is the square of the Pearson correlation coefficient. A total of 31 samples were collected for analysis during the campaign.
Table 3Summary of b values (Eqs. 2, 8), where EC was determined by performing thermal optical analysis (NIOSH, IMPROVE TOT, IMPROVE TOR, SWISS_4S and EUSAAR_2) on 24 h filters, while BC was measured by the Aethalometer.
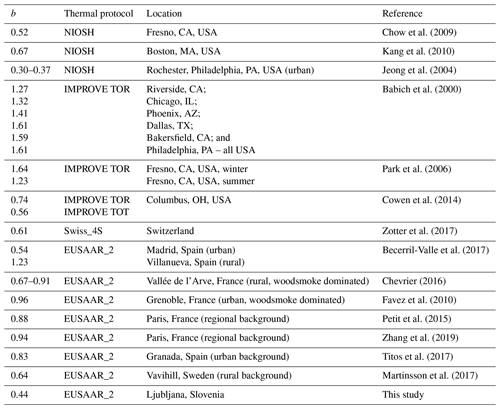
The proportionality parameter b (Eq. 2) is compared with values taken from the literature in Table 3. These values depend on the location, the nature of the aerosol and the thermal protocol used for analysis. The value of 0.44 which we determined in this study for an urban background site is slightly lower than values for other urban and urban background sites using the EUSAAR 2 thermal protocol and considerably lower than the values for rural sites. The proportionality parameter b is an effective value that features a local and a regional contribution of BC and EC. Usually, the local contribution to concentrations is dominant and the local BC and EC contributions dominate the relationship. The differences in b values presented in Table 3 show that there is a big variation between different rural and regional background sites and also between the urban sites. This is the reason why similar offline-to-online intercomparison is recommended for every new background site or site with a strong mixture of local and regional contribution. The time period of the intercomparison should cover seasonal variations in b values, for example 2–3 weeks each season. The re-evaluation intercomparison campaign for the certain location should be carried out if significant changes in the BC emission inventory are expected (traffic or wood-burning restrictions, etc.). For sites with a dominant traffic contribution, where the b factor mostly depends on the properties of the vehicle in the fleet, the intercomparison measurements will result in similar b values unless a significant fleet change occurs.
Uncertainties associated with the reported Aethalometer BC mass concentrations incorporate the uncertainty in flow calibration, the uncertainty in the attenuation measurement and the uncertainty in the conversion of the attenuation coefficient to mass concentrations – the constant mass attenuation cross-section approximation (Gundel et al., 1984; Hansen, 2007, Drinovec et al., 2015, Healy et al., 2017, Zotter et al., 2017). The overall estimated uncertainty for reported BC mass concentrations is approximately 25 % (World Meteorological Organization and Global Atmosphere Watch, 2016). The EC data determined by offline OC–EC analysis used in the comparison depends greatly on the thermal protocol used (Karanasiou et al., 2015). In addition, the uncertainty can be determined using the procedure described in the standard EN16909:2017. The uncertainty we use has been taken as the laboratory-to-laboratory variability of 10 %.
3.5 Comparison of online eOC measurements from TCA with offline OC filter analyses
Online eOC measurements can be derived using the EC–BC correlation plot (Fig. 7) to assign the appropriate operational value of the parameter b, the online BC data, and the online TCA data. Figure 8 shows the correlation between online eOC and offline OC derived from the 24 h filter samples analyzed with a thermo-optical OC–EC analyzer. These results show that when using an appropriate value of b, the TC–BC method yields online data for the eOC content of ambient aerosols that agree very well with conventional offline thermal analyses. The offset µg m−3 lies in the same range as that determined by TC correlation analysis, which confirms that organic carbon is the origin of the offset in the correlation plots in Figs. 6 and 8. The offset is also comparable to that determined by the interlaboratory comparison of off-line filter analyses (offset OCARSO– OCIGE is µg m−3; offset eOC–OC is µg m−3). The in-depth analysis of the relative difference between OC from 24 h filters and eOC determined by online measurement as TC − bBC shown in Fig. 9 reveals that the positive artifact can be the dominant apparent source of OC for days with very low OC concentrations (<5 µg m−3) in comparison to offline 24 h filters, for which also a negative artifact (desorption of VOCs) can occur. This leads to the importance of regular denuder efficiency and breakthrough determination (Figs. 3, S1 and S2) and a consequent appropriate sample time-base setup, according to the OC concentration and denuder breakthrough value. For this campaign, a longer sample time base and/or usage of two denuder monoliths in TCA08 would decrease the offset and reduce its contribution to the overall uncertainty budget of eOC measurement. For 11 of the 31 d (OC <5 µg m−3) in this campaign, a 2 h sample time base should be used. As we found out in this study, for field campaigns with daily TC or OC concentrations below 5 µg m−3, it is strongly recommended to perform longer denuder efficiency tests or test with an inline Teflon filter (Arhami et al., 2006) to estimate the contribution of the positive artifact and determine an appropriate sample time base.
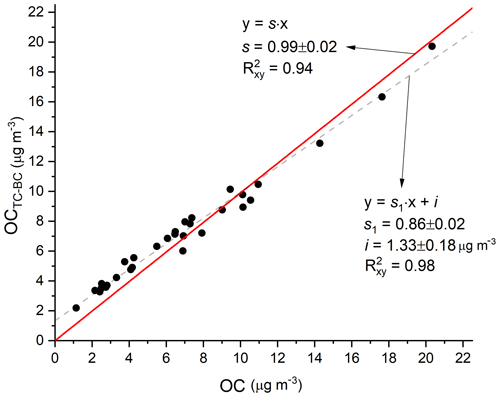
Figure 8Comparison of offline measurements of OC (laboratory filter analysis) using the EUSAAR_2 thermal protocol to the 24 h average of online measurement of OC = TC − bBC data taken by the AE33 Aethalometer and TCA08 Total Carbon Analyzer. Linear orthogonal regression results (n=31) are shown with s as the slope (red line) for the model without an intercept and with s1 as the slope and i as the intercept (dashed gray line) for the model with an intercept. is the square of the Pearson correlation coefficient.
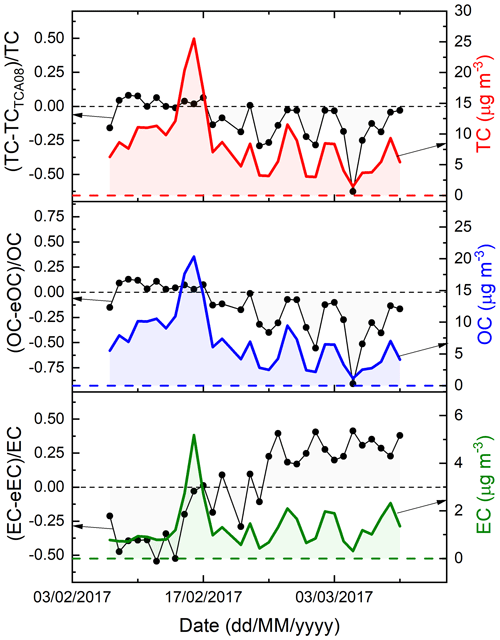
Figure 9Left y axis: relative difference between TC, OC and EC (see Eq. 6) measured on 24 h filters by conventional OC–EC method and TCTCA08, TC − bBC and bBC measured online by TCA08 at 1 h time resolution and AE33 at 1 min time resolution and then averaged over 24 h. Right y axis: the absolute concentrations of TC, OC and EC (red, blue and green line, respectively) are shown for easier comparison.
3.6 Comparison of OM online measurements from ACSM with offline OC from filter sampling and online eOC
The data from an AE33 and TCA08 can be combined with an operational time base of 1 h, yielding eOC and eEC data with a much greater time resolution than that which can be achieved by the analysis of filter samples. In order to assess the high-time-resolution performance of this on-line technique, comparison of BC (from AE33) and TC (from TCA08) together with OM analyzed by ACSM is shown in Fig. 10. Due to variability in ACSM timings, the data were gathered into 3 h averages. The chemical-composition-dependent collection efficiency of the ACSM was calculated according to Middlebrook et al. (2012).
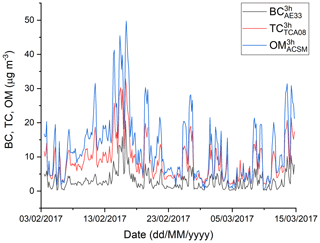
Figure 10Time series comparisons of high-time-resolution online measurements of OM by ACSM on 29–30 min time base, BC by AE33 on 1 min time base and TC by TCA08 on 1 h time base. All data are averaged to 3 h for easier comparison.
The ambient organic-mass-to-organic-carbon ratio (OM∕OC) in organic aerosol (OA) is an important parameter to investigate OA chemical composition. OM∕OC can vary widely depending on the sources, monitoring location, season and meteorology. The lower ambient OM∕OC ratios are consistent with fresh aerosol emissions from traffic, while the higher values are usually observed for aged ambient oxygenated OA (Chirico et al., 2010).
The slopes s of the regressions without intercept represent average OM∕OC values measured during this campaign (Fig. 11). The ratios determined from comparison of daily averages of OM measurements to OC from offline filters (Fig. 11a) and to eOC from the TC − bBC method (Fig. 11b) are 1.79 and 1.82, respectively. The ratio lies on the higher end of the OM-to-OC range determined for urban environments which is 1.4 to 1.8, while for the rural sites it varies from 1.7 to 2.3 (Aiken et al., 2008; Gilardoni et al., 2009; Sun et al., 2009; Turpin and Lim, 2001). This is consistent with other studies in similar urban environments with close proximity of the sampling site to fresh vehicle emissions and the additional contribution of biomass burning (Brown et al., 2013; Turpin and Lim, 2001; Xing et al., 2013). The sampling site used in this study is mainly influenced by fresh emissions from traffic with a regionally homogeneous contribution of biomass burning for household heating (Ogrin et al., 2016). The in-depth source apportionment analysis of OA and high time resolution of the OM∕OC ratio from this campaign will be discussed in a different study.
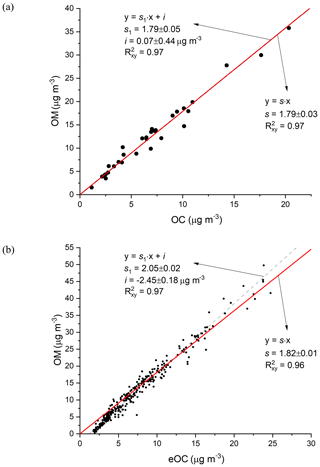
Figure 11(a) Comparison of offline measurements of OC (laboratory filter analysis) using the EUSAAR_2 thermal protocol to the 24 h average of online measurement of OM data taken by the ACSM. A total of 31 filter samples were collected for analysis during the campaign. Please note that the red trend line completely covers the dashed trend line (s=s1). (b) Comparison of 3 h eOC data derived as eOC = TC − bBC to OM data measured by ACSM. Linear orthogonal regression results are shown with s as the slope (red line) for the model without an intercept and with s1 as the slope and i as the intercept (dashed gray line) for the model with an intercept. is the square of the Pearson correlation coefficient. A total of 300 data points are used in the regression analysis.
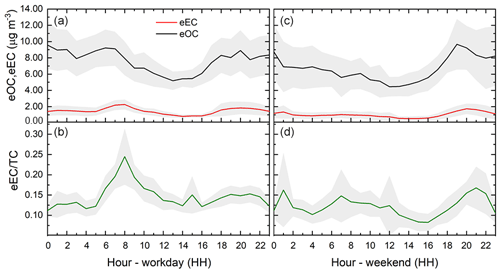
Figure 12Hourly diurnal profiles for workday (a, b) and weekend (c, d) for eOC (black line) and eEC (red line) and average-eEC-to-average-TC ratio (green line). The shaded gray area represents the 95 % confidence interval around the mean value. Time is local time.
The negative offset in the regression model with intercept (Fig. 11b) again reveals the pronounced positive sampling artifact due to adsorption of organics on quartz-fiber filters for short sampling times in the TCA08 method. This is not the case for the nonfilter-based ACSM measurement of organic aerosol mass. The influence of such a sampling artifact is noticeable only during conditions with low atmospheric loading of particulate organic aerosols. Again, the installation of two denuder monoliths or an increased sample time base for TCA08 is recommended in such an environment in order to minimize the influence of these sampling artifacts.
3.7 Diurnal profiles of high-time-resolution measurements of eOC, eEC, and eEC∕TC ratio
The coupling of TCA08 and Aethalometer instruments offers new opportunities to investigate the short-term variability of carbonaceous aerosols and the factors that control their atmospheric concentrations such as source variability and/or atmospheric (dynamic and photochemical) processes. For this purpose, diurnal profiles of organic carbon and elemental carbon concentrations were calculated for each hour of the day (Fig. 12a and c), separately grouped for working days (Monday to Friday) and for weekends (Saturday and Sunday). The diurnal variation of eOC and eEC for this urban background environment is strongly influenced by the temporal patterns of emissions from traffic and biomass burning (domestic heating) during wintertime. Two traffic peaks can be observed for working days in OC and EC concentrations: the first one observed during morning rush hours (between 6:00 and 10:00 LT) and the second in the afternoon, after 16:00 LT. Between the two peaks, (i.e., between 10:00 and 16:00 LT), OC and EC concentrations decrease due to atmospheric dilution in the increasing mixing height of the planetary boundary layer (Ogrin et al., 2016). During the weekend the morning traffic peak disappears, while the evening one remains present. Peaks in average-eEC-to-average-TC ratio are concomitant with the eEC peaks which are aligned with the EC-rich pattern of traffic emissions (Fig. 12b and d). eOC and eEC concentrations during the measurement campaign were 6.2 (3.6–9.5) and 0.9 (0.5–1.8) µg m−3 (median (first quartile–third quartile)), respectively, which is consistent with 24 h filter measurements of OC and EC at the other urban background location in Ljubljana (Biotehniška fakulteta), where averaged values for OC and EC of 8.4 and 1.0 µg m−3 were measured for the period between October 2016 and March 2017 (Gjerek et al., 2018).
We present the newly developed Total Carbon Analyzer model TCA08, which offers measurement of the concentrations of total aerosol carbon continuously with a high time resolution as rapid as 20 min. Two parallel flow channels provide continuous operation: while one channel analyzes, the other collects the next sample. Thermal analysis by flash heating of the sample collected on a quartz-fiber filter efficiently converts all the particulate carbon to CO2. The increase in CO2 concentration above baseline in a flow of analytic air is measured by an integrated NDIR detector. When the TCA08 is combined with an AE33 Aethalometer, the TC–BC method yields eOC–eEC data with a much greater time resolution than that offered by the analysis of filter-based samples. In this study, we show results from these instruments combined on an operational time base of 1 h and compare them to conventional 24 h filter measurements of EC and OC and high-time-resolution measurements of organic aerosols with an ACSM. The correlation analysis showed very high agreement between eOC = TC − bBC and eEC = bBC derived by the TC–BC method with OC–EC analysis using the EUSAAR2 thermal protocol on 24 h filters and OM from ACSM. The value of the proportionality parameter b can be derived for the desired OC–EC thermal protocol to obtain high-time-resolution eOC and eEC data.
These two instruments are automatic, rugged and designed for unattended operation in field-monitoring situations. Measurements can be carried out in different PM size fractions (PM1, PM2.5, PM10). The combined data may be analyzed to examine repetitive diurnal patterns, reflecting both anthropogenic inputs of carbonaceous aerosols to the atmosphere and production of secondary aerosols, as well as atmospheric processing and dispersion into mixing layers of varying depth. Additional analyses can compare these results between workdays and weekends, seeking patterns of human activity that may reflect changes in traffic or industrial emissions. Studies such as this, requiring large numbers of closely spaced data points, are greatly facilitated by online instruments.
The data used in this publication are available upon request to the corresponding author (martin.rigler@aerosol.eu).
The supplement related to this article is available online at: https://doi.org/10.5194/amt-13-4333-2020-supplement.
MR, LD and GM designed the study. MR, GL, LD, GM and IS performed and analyzed TC, BC and OM online measurements. MR, GL, LD, GM, AV, ASHP and ADAH were involved in the new instrument development. JLJ, JS, JB, IK and JT performed OC∕EC measurements on offline filters. All authors contributed to the scientific discussion.
At the time of the research, Martin Rigler, Luka Drinovec, Gašper Lavrič and Griša Močnik were also employed by the manufacturer of the Aethalometer and total carbon instruments. Other authors declare no conflict of interest.
The funding sponsors had no role in the design of the study; in the collection, analyses, or interpretation of data; in the writing of the manuscript; and in the decision to publish the results.
This research was partly funded by Eurostars (grant no. E!8296 TC-BC).
This paper was edited by Willy Maenhaut and reviewed by two anonymous referees.
ACTRIS: Results of the inter-laboratory comparison exercise for TC and EC measurements (ref.: OCEC-2016-2), available at: https://www.actris-ecac.eu/august-to-october--ocec-2016-2-.html (last access: 12 August 2020), 2016.
ACTRIS: Results of the inter-laboratory comparison exercise for TC and EC measurements (ref.: OCEC-2017-1), available at: https://www.actris-ecac.eu/january-to-march--ocec-2017-1-.html (last access: 12 August 2020), 2017.
ACTRIS: Results of the inter-laboratory comparison exercise for TC and EC measurements (ref.: OCEC-2018-1), available at: https://www.actris-ecac.eu/january-to-march--ocec-2018-1-.html (last access: 12 August 2020), 2018.
Aiken, A. C., DeCarlo, P. F., Kroll, J. H., Worsnop, D. R., Huffman, J. A., Docherty, K. S., Ulbrich, I. M., Mohr, C., Kimmel, J. R., Sueper, D., Sun, Y., Zhang, Q., Trimborn, A., Northway, M., Ziemann, P. J., Canagaratna, M. R., Onasch, T. B., Alfarra, M. R., Prevot, A. S. H., Dommen, J., Duplissy, J., Metzger, A., Baltensperger, U., and Jimenez, J. L.: O∕C and OM∕OC ratios of primary, secondary, and ambient organic aerosols with high-resolution time-of-flight aerosol mass spectrometry, Environ. Sci. Technol., 42, 4478–4485, https://doi.org/10.1021/es703009q, 2008.
Ania, C. O., Parra, J. B., Menendez, J. A., and Pis, J. J.: Effect of microwave and conventional regeneration on the microporous and mesoporous network and on the adsorptive capacity of activated carbons, Microporous Mesoporous Mater., 85, 7–15, 2005.
Arhami, M., Kuhn, T., Fine, P. M., Delfino, R. J., and Sioutas, C.: Effects of sampling artifacts and operating parameters on the performance of a semi-continuous particulate elemental carbon/organic carbon monitor, Environ. Sci. Technol., 40, 945–954, https://doi.org/10.1021/es0510313, 2006.
Babich, P., Davey, M., Allen, G., and Koutrakis, P.: Method comparisons for particulate nitrate, elemental carbon, and PM 2.5 mass in seven U.S. Cities, J. Air Waste Manag. Assoc., 50, 1095–1105, https://doi.org/10.1080/10473289.2000.10464152, 2000.
Bae, M.-S., Schauer, J. J., Turner, J. R., and Hopke, P. K.: Seasonal variations of elemental carbon in urban aerosols as measured by two common thermal-optical carbon methods, Sci. Total Environ., 407, 5176–5183, https://doi.org/10.1016/j.scitotenv.2009.05.035, 2009.
Bauer, J. J., Yu, X.-Y., Cary, R., Laulainen, N., and Berkowitz, C.: Characterization of the Sunset semi-continuous carbon aerosol analyzer, J. Air Waste Manag. Assoc., 59, 826–833, https://doi.org/10.3155/1047-3289.59.7.826, 2009.
Becerril-Valle, M., Coz, E., Prévôt, A. S. H., Močnik, G., Pandis, S. N., Sánchez de la Campa, A. M., Alastuey, A., Díaz, E., Pérez, R. M., and Artíñano, B.: Characterization of atmospheric black carbon and co-pollutants in urban and rural areas of Spain, Atmos. Environ., 169, 36–53, https://doi.org/10.1016/j.atmosenv.2017.09.014, 2017.
Bhagawan, D., Poodari, S., Ravi Kumar, G., Golla, S., Anand, C., Banda, K. S., Himabindu, V., and Vidyavathi, S.: Reactivation and recycling of spent carbon using solvent desorption followed by thermal treatment (TR), J. Mater. Cycles Waste Manag., 17, 185–193, https://doi.org/10.1007/s10163-014-0237-y, 2015.
Brown, S. G., Lee, T., Roberts, P. T., and Collett, J. L.: Variations in the OM∕OC ratio of urban organic aerosol next to a major roadway, J. Air Waste Manag. Assoc., 63, 1422–1433, https://doi.org/10.1080/10962247.2013.826602, 2013.
Cavalli, F., Viana, M., Yttri, K. E., Genberg, J., and Putaud, J.-P.: Toward a standardised thermal-optical protocol for measuring atmospheric organic and elemental carbon: the EUSAAR protocol, Atmos. Meas. Tech., 3, 79–89, https://doi.org/10.5194/amt-3-79-2010, 2010.
Cavalli, F., Alastuey, A., Areskoug, H., Ceburnis, D., Čech, J., Genberg, J., Harrison, R. M., Jaffrezo, J. L., Kiss, G., Laj, P., Mihalopoulos, N., Perez, N., Quincey, P., Schwarz, J., Sellegri, K., Spindler, G., Swietlicki, E., Theodosi, C., Yttri, K. E., Aas, W., and Putaud, J. P.: A European aerosol phenomenology 4: harmonized concentrations of carbonaceous aerosol at 10 regional background sites across Europe, Atmos. Environ., 144, 133–145, https://doi.org/10.1016/j.atmosenv.2016.07.050, 2016.
Chen, L.-W. A., Chow, J. C., Wang, X. L., Robles, J. A., Sumlin, B. J., Lowenthal, D. H., Zimmermann, R., and Watson, J. G.: Multi-wavelength optical measurement to enhance thermal/optical analysis for carbonaceous aerosol, Atmos. Meas. Tech., 8, 451–461, https://doi.org/10.5194/amt-8-451-2015, 2015.
Cheng, Y., He, K. B., Duan, F. K., Zheng, M., Ma, Y. L., and Tan, J. H.: Positive sampling artifact of carbonaceous aerosols and its influence on the thermal-optical split of OC/EC, Atmos. Chem. Phys., 9, 7243–7256, https://doi.org/10.5194/acp-9-7243-2009, 2009.
Chevrier, F.: Chauffage au bois et qualité de l'air en Vallée de l'Arve?: définition d'un système de surveillance et impact d'une politique de rénovation du parc des appareils anciens, Océan, Atmosphère. Université Grenoble Alpes, Grenoble, France, 2016.
Chirico, R., DeCarlo, P. F., Heringa, M. F., Tritscher, T., Richter, R., Prévôt, A. S. H., Dommen, J., Weingartner, E., Wehrle, G., Gysel, M., Laborde, M., and Baltensperger, U.: Impact of aftertreatment devices on primary emissions and secondary organic aerosol formation potential from in-use diesel vehicles: results from smog chamber experiments, Atmos. Chem. Phys., 10, 11545–11563, https://doi.org/10.5194/acp-10-11545-2010, 2010.
Chow, J. C., Watson, J. G., Pritchett, L. C., Pierson, W. R., Frazier, C. A., and Purcell, R. G.: The DRI thermal/optical reflectance carbon analysis system: description, evaluation and applications in U.S. air quality studies, Atmos. Environ. Gen. Top., 27, 1185–1201, https://doi.org/10.1016/0960-1686(93)90245-T, 1993.
Chow, J. C., Watson, J. G., Doraiswamy, P., Chen, L.-W. A., Sodeman, D. A., Lowenthal, D. H., Park, K., Arnott, W. P., and Motallebi, N.: Aerosol light absorption, black carbon, and elemental carbon at the Fresno supersite, California, Atmos. Res., 93, 874–887, https://doi.org/10.1016/j.atmosres.2009.04.010, 2009.
Cowen, K., Kelly, T., and Dindal, A.: Environmental Technology Verification Report – Magee Scientific Model AE33 Aethalometer, EPA/600/XX-14/309, ETV Advanced Monitoring Systems Center, U.S. Environmental Protection Agency, Ohio, USA, available at: https://cfpub.epa.gov/si/si_public_record_report.cfm?Lab=NRMRL&dirEntryId=287548 (last access: 12 August 2020), 2014.
Crenn, V., Sciare, J., Croteau, P. L., Verlhac, S., Fröhlich, R., Belis, C. A., Aas, W., Äijälä, M., Alastuey, A., Artiñano, B., Baisnée, D., Bonnaire, N., Bressi, M., Canagaratna, M., Canonaco, F., Carbone, C., Cavalli, F., Coz, E., Cubison, M. J., Esser-Gietl, J. K., Green, D. C., Gros, V., Heikkinen, L., Herrmann, H., Lunder, C., Minguillón, M. C., Močnik, G., O'Dowd, C. D., Ovadnevaite, J., Petit, J.-E., Petralia, E., Poulain, L., Priestman, M., Riffault, V., Ripoll, A., Sarda-Estève, R., Slowik, J. G., Setyan, A., Wiedensohler, A., Baltensperger, U., Prévôt, A. S. H., Jayne, J. T., and Favez, O.: ACTRIS ACSM intercomparison – Part 1: Reproducibility of concentration and fragment results from 13 individual Quadrupole Aerosol Chemical Speciation Monitors (Q-ACSM) and consistency with co-located instruments, Atmos. Meas. Tech., 8, 5063–5087, https://doi.org/10.5194/amt-8-5063-2015, 2015.
DIGITEL Elektronik: DIGITEL sequential high volume aerosol sampler DHA-80, User's Manual, DIGITEL Elektronik, Hagnau, Germany, 2012.
Drinovec, L., Močnik, G., Zotter, P., Prévôt, A. S. H., Ruckstuhl, C., Coz, E., Rupakheti, M., Sciare, J., Müller, T., Wiedensohler, A., and Hansen, A. D. A.: The “dual-spot” Aethalometer: an improved measurement of aerosol black carbon with real-time loading compensation, Atmos. Meas. Tech., 8, 1965–1979, https://doi.org/10.5194/amt-8-1965-2015, 2015.
Drinovec, L., Gregorič, A., Zotter, P., Wolf, R., Bruns, E. A., Prévôt, A. S. H., Petit, J.-E., Favez, O., Sciare, J., Arnold, I. J., Chakrabarty, R. K., Moosmüller, H., Filep, A., and Močnik, G.: The filter-loading effect by ambient aerosols in filter absorption photometers depends on the coating of the sampled particles, Atmos. Meas. Tech., 10, 1043–1059, https://doi.org/10.5194/amt-10-1043-2017, 2017.
Eatough, D. J., Obeidi, F., Pang, Y., Ding, Y., Eatough, N. L., and Wilson, W. E.: Integrated and real-time diffusion denuder sample for PM2.5, Atmos. Environ., 33, 2835–2844, 1999.
EN 12341:2014: Ambient air – Standard gravimetric measurement method for the determination of the PM10 or PM2.5 mass concentration of suspended particulate matter, European committee for standardization, Brussels, Belgium, 2014.
EN 16450:2017: Ambient air – Automated measuring systems for the measurement of concentration of particulate matter (PM10; PM2.5), European committee for standardization, Brussels, Belgium, 2017.
EN 16909:2017: Ambient air – Measurement of elemental carbon (EC) and organic carbon (OC) collected on filters, European committee for standardization, Brussels, Belgium, 2017.
Favez, O., El Haddad, I., Piot, C., Boréave, A., Abidi, E., Marchand, N., Jaffrezo, J.-L., Besombes, J.-L., Personnaz, M.-B., Sciare, J., Wortham, H., George, C., and D'Anna, B.: Inter-comparison of source apportionment models for the estimation of wood burning aerosols during wintertime in an Alpine city (Grenoble, France), Atmos. Chem. Phys., 10, 5295–5314, https://doi.org/10.5194/acp-10-5295-2010, 2010.
Fuzzi, S., Andreae, M. O., Huebert, B. J., Kulmala, M., Bond, T. C., Boy, M., Doherty, S. J., Guenther, A., Kanakidou, M., Kawamura, K., Kerminen, V.-M., Lohmann, U., Russell, L. M., and Pöschl, U.: Critical assessment of the current state of scientific knowledge, terminology, and research needs concerning the role of organic aerosols in the atmosphere, climate, and global change, Atmos. Chem. Phys., 6, 2017–2038, https://doi.org/10.5194/acp-6-2017-2006, 2006.
Gao, Y., Zhong, D., Zhang, D., Pu, X., Shao, X., Su, C., Yao, X., and Li, S.: Thermal regeneration of recyclable reduced graphene oxide/Fe3O4 composites with improved adsorption properties, J. Chem. Technol. Biotechnol., 89, 1859–1865, https://doi.org/10.1002/jctb.4268, 2014.
Gelencsér, A.: Carbonaceous Aerosol, Springer, Dordrecht, the Netherlands, 2004.
Gilardoni, S., Liu, S., Takahama, S., Russell, L. M., Allan, J. D., Steinbrecher, R., Jimenez, J. L., De Carlo, P. F., Dunlea, E. J., and Baumgardner, D.: Characterization of organic ambient aerosol during MIRAGE 2006 on three platforms, Atmos. Chem. Phys., 9, 5417–5432, https://doi.org/10.5194/acp-9-5417-2009, 2009.
Gjerek, M., Koleša, T., Logar, M., Matavž, L., Murovec, M., Rus, M., and Žabkar, R.: Kakovost zraka v Sloveniji 2017, Ministrstvo za okolje in prostor, Agencija Republike Slovenije za okolje, Ljubljana, Slovenia, 2018.
Gregorič, A., Lavrič, G., Drinovec, L., Močnik, G., and Rigler, M.: VOC denuder efficiency and positive sampling artefact evaluation using the Total carbon analyzer (TCA 08), in preparation, 2020.
Gundel, L., Dod, R. L., Rosen, H., and Novakov, T.: The relationship between optical attenuation and black carbon concentration for ambient and source particles, Sci. Total Environ., 36, 197–202, 1984.
Hallquist, M., Wenger, J. C., Baltensperger, U., Rudich, Y., Simpson, D., Claeys, M., Dommen, J., Donahue, N. M., George, C., Goldstein, A. H., Hamilton, J. F., Herrmann, H., Hoffmann, T., Iinuma, Y., Jang, M., Jenkin, M. E., Jimenez, J. L., Kiendler-Scharr, A., Maenhaut, W., McFiggans, G., Mentel, Th. F., Monod, A., Prévôt, A. S. H., Seinfeld, J. H., Surratt, J. D., Szmigielski, R., and Wildt, J.: The formation, properties and impact of secondary organic aerosol: current and emerging issues, Atmos. Chem. Phys., 9, 5155–5236, https://doi.org/10.5194/acp-9-5155-2009, 2009.
Hansen, A. D. A.: Operating manual for the AE31/22/42 Aethalometers, Magee Scientific, Berkeley, CA, USA, 2007.
Hansen, A. D. A., Rosen, H., and Novakov, T.: The Aethalometer – An instrument for the real-time measurement of optical absorption by aerosol particles, Sci. Total Environ., 36, 191–196, 1984.
Healy, R. M., Sofowote, U., Su, Y., Debosz, J., Noble, M., Jeong, C.-H., Wang, J. M., Hilker, N., Evans, G. J., Doerksen, G., Jones, K., and Munoz, A.: Ambient measurements and source apportionment of fossil fuel and biomass burning black carbon in Ontario, Atmos. Environ., 161, 34–47, https://doi.org/10.1016/j.atmosenv.2017.04.034, 2017.
Huntzicker, J. J., Johnson, R. L., Shah, J. J., and Cary, R. A.: Analysis of organic and elemental carbon in ambient aerosols by a thermal-optical method, Part. Carbon, 79–88, 1982.
Jeong, C.-H., Hopke, P. K., Kim, E., and Lee, D.-W.: The comparison between thermal-optical transmittance elemental carbon and Aethalometer black carbon measured at multiple monitoring sites, Atmos. Environ., 38, 5193–5204, https://doi.org/10.1016/j.atmosenv.2004.02.065, 2004.
Kang, C.-M., Koutrakis, P., and Suh, H. H.: Hourly measurements of fine particulate sulfate and carbon aerosols at the Harvard–US Environmental Protection Agency Supersite in Boston, J. Air Waste Manag. Assoc., 60, 1327–1334, 2010.
Karanasiou, A., Minguillón, M. C., Viana, M., Alastuey, A., Putaud, J.-P., Maenhaut, W., Panteliadis, P., Močnik, G., Favez, O., and Kuhlbusch, T. A. J.: Thermal-optical analysis for the measurement of elemental carbon (EC) and organic carbon (OC) in ambient air a literature review, Atmos. Meas. Tech. Discuss., 8, 9649–9712, https://doi.org/10.5194/amtd-8-9649-2015, 2015.
Kirchstetter, W. T., Corrigan, C. E., and Novakov, T.: Laboratory and field investigation of the adsorption of gaseous organic compounds onto quartz filters, Atmos. Environ., 35, 1663–1671, 2001.
LI-COR, Inc.: Instruction Manual: LI-840A CO2/H20 Gas Analyzer, LI-COR Inc., Lincoln, NE, USA, 2016.
Mader, B.: Sampling methods used for the collection of particle-phase organic and elemental carbon during ACE-Asia, Atmos. Environ., 37, 1435–1449, https://doi.org/10.1016/S1352-2310(02)01061-0, 2003.
Mader, B. T., Flagan, R. C., and Seinfeld, J. H.: Sampling atmospheric carbonaceous aerosols using a particle trap impactor/denuder sampler, Environ. Sci. Technol., 35, 4857–4867, https://doi.org/10.1021/es011059o, 2001.
Malissa, H., Grasserbauer, M., and Waldmann, E.: Relativkonduktometrische, simultane Kohlenstoff- und Schwefelbestimmung in Meteoriten, Microchim. Acta, 60, 455–458, 1972.
Martinsson, J., Abdul Azeem, H., Sporre, M. K., Bergström, R., Ahlberg, E., Öström, E., Kristensson, A., Swietlicki, E., and Eriksson Stenström, K.: Carbonaceous aerosol source apportionment using the Aethalometer model – evaluation by radiocarbon and levoglucosan analysis at a rural background site in southern Sweden, Atmos. Chem. Phys., 17, 4265–4281, https://doi.org/10.5194/acp-17-4265-2017, 2017.
McDow, R. S. and Huntzicker, J. J.: Vapor adsorption artifact in the sampling of organic aerosol: Face velocity effects, Atmos. Environ., 24, 2563–2571, 1990.
Middlebrook, A. M., Bahreini, R., Jimenez, J. L., and Canagaratna, M. R.: Evaluation of composition-dependent collection efficiencies for the Aerodyne aerosol mass spectrometer using field data, Aerosol Sci. Tech., 46, 258–271, https://doi.org/10.1080/02786826.2011.620041, 2012.
Modey, W.: Fine particulate (PM2.5) composition in Atlanta, USA: assessment of the particle concentrator – Brigham Young University organic sampling system, PC-BOSS, during the EPA supersite study, Atmos. Environ., 35, 6493–6502, https://doi.org/10.1016/S1352-2310(01)00402-2, 2001.
Ng, N. L., Herndon, S. C., Trimborn, A., Canagaratna, M. R., Croteau, P. L., Onasch, T. B., Sueper, D., Worsnop, D. R., Zhang, Q., Sun, Y. L., and Jayne, J. T.: An aerosol chemical speciation monitor (ACSM) for routine monitoring of the composition and mass concentrations of ambient aerosol, Aerosol Sci. Tech., 45, 780–794, https://doi.org/10.1080/02786826.2011.560211, 2011.
Ogrin, M., Vintar Mally, K., Planinšek, A., Gregorič, A., Drinovec, L., and Močnik, G.: Nitrogen dioxide and black carbon concentrations in Ljubljana, 1st ed., Ljubljana University Press, Faculty of Arts, Ljubljana, Slovenia, 2016.
Panteliadis, P., Hafkenscheid, T., Cary, B., Diapouli, E., Fischer, A., Favez, O., Quincey, P., Viana, M., Hitzenberger, R., Vecchi, R., Saraga, D., Sciare, J., Jaffrezo, J. L., John, A., Schwarz, J., Giannoni, M., Novak, J., Karanasiou, A., Fermo, P., and Maenhaut, W.: ECOC comparison exercise with identical thermal protocols after temperature offset correction – instrument diagnostics by in-depth evaluation of operational parameters, Atmos. Meas. Tech., 8, 779–792, https://doi.org/10.5194/amt-8-779-2015, 2015.
Park, K., Chow, J. C., Watson, J. G., Trimble, D. L., Doraiswamy, P., Park, K., Arnott, W. P., Stroud, K. R., Bowers, K., Bode, R., Petzdol, A., and Hansen, A. D. A.: Comparison of continuous and filter-based carbon measurements at the Fresno supersite, J. Air Waste Manag. Assoc., 56, 474–491, 2006.
Petit, J.-E., Favez, O., Sciare, J., Crenn, V., Sarda-Estève, R., Bonnaire, N., Močnik, G., Dupont, J.-C., Haeffelin, M., and Leoz-Garziandia, E.: Two years of near real-time chemical composition of submicron aerosols in the region of Paris using an Aerosol Chemical Speciation Monitor (ACSM) and a multi-wavelength Aethalometer, Atmos. Chem. Phys., 15, 2985–3005, https://doi.org/10.5194/acp-15-2985-2015, 2015.
Petzold, A., Ogren, J. A., Fiebig, M., Laj, P., Li, S.-M., Baltensperger, U., Holzer-Popp, T., Kinne, S., Pappalardo, G., Sugimoto, N., Wehrli, C., Wiedensohler, A., and Zhang, X.-Y.: Recommendations for reporting ”black carbon” measurements, Atmos. Chem. Phys., 13, 8365–8379, https://doi.org/10.5194/acp-13-8365-2013, 2013.
Pieber, S. M., El Haddad, I., Slowik, J. G., Canagaratna, M. R., Jayne, J. T., Platt, S. M., Bozzetti, C., Daellenbach, K. R., Fröhlich, R., Vlachou, A., Klein, F., Dommen, J., Miljevic, B., Jiménez, J. L., Worsnop, D. R., Baltensperger, U., and Prévôt, A. S. H.: Inorganic salt interference on in Aerodyne AMS and ACSM organic aerosol composition studies, Environ. Sci. Technol., 50, 10494–10503, https://doi.org/10.1021/acs.est.6b01035, 2016.
Pöschl, U.: Atmospheric aerosols: composition, transformation, climate and health effects, Angew. Chem. Int. Ed., 44, 7520–7540, https://doi.org/10.1002/anie.200501122, 2005.
Sandradewi, J., Prévôt, A. S. H., Szidat, S., Perron, N., Alfarra, M. R., Lanz, V. A., Weingartner, E., and Baltensperger, U.: Using aerosol light absorption measurements for the quantitative determination of wood burning and traffic emission contributions to particulate matter, Environ. Sci. Technol., 42, 3316–3323, https://doi.org/10.1021/es702253m, 2008.
Schauer, J. J., Mader, B. T., DeMinter, J. T., Heidemann, G., Bae, M. S., Seinfeld, J. H., Flagan, R. C., Cary, R. A., Smith, D., Huebert, B. J., Bertram, T., Howell, S., Kline, J. T., Quinn, P., Bates, T., Turpin, B., Lim, H. J., Yu, J. Z., Yang, H., and Keywood, M. D.: ACE-Asia intercomparison of a thermal-optical method for the determination of particle-phase organic and elemental carbon, Environ. Sci. Technol., 37, 993–1001, https://doi.org/10.1021/es020622f, 2003.
Schmid, H., Laskus, L., Abraham, J. H., Baltensperger, U., Lavanchy, V., Bizjak, M., Burba, P., Cachier, H., Crow, D., Chow, J., Gnauk, T., Even, A., Brink, H. M., Giesen, K.-P., Hitzenberger, R., Hueglin, C., Maenhaut, W., Pio, C., Carvalho, A., Putaud, J. P., Toom-Sauntry, D., and Puxbaum, H.: Results of the carbon conference international aerosol carbon round robin test stage I, Atmos. Environ., 35, 2111–2121, 2001.
Sciare, J., Bardouki, H., Moulin, C., and Mihalopoulos, N.: Aerosol sources and their contribution to the chemical composition of aerosols in the Eastern Mediterranean Sea during summertime, Atmos. Chem. Phys., 3, 291–302, https://doi.org/10.5194/acp-3-291-2003, 2003.
Subramanian, R., Khlystov, A. Y., Cabada, J. C., and Robinson, A. L.: Positive and negative artifacts in particulate organic carbon measurements with denuded and undenuded sampler configurations special issue of Aerosol Science and Technology on Findings from the Fine Particulate Matter Supersites Program, Aerosol Sci. Tech, 38, 27–48, https://doi.org/10.1080/02786820390229354, 2004.
Subramanian, R., Khlystov, A. Y., and Robinson, A. L.: Effect of peak inert-mode temperature on elemental carbon measured using thermal-optical analysis, Aerosol Sci. Tech., 40, 763–780, https://doi.org/10.1080/02786820600714403, 2006.
Sun, Y., Zhang, Q., Macdonald, A. M., Hayden, K., Li, S. M., Liggio, J., Liu, P. S. K., Anlauf, K. G., Leaitch, W. R., Steffen, A., Cubison, M., Worsnop, D. R., van Donkelaar, A., and Martin, R. V.: Size-resolved aerosol chemistry on Whistler Mountain, Canada with a high-resolution aerosol mass spectrometer during INTEX-B, Atmos. Chem. Phys., 9, 3095–3111, https://doi.org/10.5194/acp-9-3095-2009, 2009.
TCA08: Total Carbon Analyzer TCA 08 – User's Manual, Magee Scientific/Aerosol d.o.o., Ljubljana, Slovenia 2019.
Titos, G., Águila, A. del, Cazorla, A., Lyamani, H., Casquero-Vera, J. A., Colombi, C., Cuccia, E., Gianelle, V., Močnik, G., Alastuey, A., Olmo, F. J., and Alados-Arboledas, L.: Spatial and temporal variability of carbonaceous aerosols: assessing the impact of biomass burning in the urban environment, Sci. Total Environ., 578, 613–625, https://doi.org/10.1016/j.scitotenv.2016.11.007, 2017.
Turpin, B. J. and Lim, H.-J.: Species contributions to PM2.5 mass concentrations: revisiting common assumptions for estimating organic mass, Aerosol Sci. Tech., 35, 602–610, https://doi.org/10.1080/02786820119445, 2001.
Turpin, B. J., Saxena, P., and Andrews, E.: Measuring and stimulating particulate organics in the atmosphere: problems and prospects, Atmos. Environ., 34, 2983–3013, 2000.
Watson, J. G., Chow, J. C., Chen, L.-W. A., Kohl, S. D., Tropp, R. J., Trimble, D., Chancellor, S., Sodeman, D., Ozgem, S., and Frank, N.: Assessment of carbon sampling artifacts in the IMPROVE, STN/CSN, and SEARCH networks, US Environmental Protection Agency, Office of Air Quality Planning and Standards, North Carolina, USA, available at: https://www.researchgate.net/publication/235341848_Assessment_of_carbon_sampling_artifacts_in_the_IMPROVE_STNCSN_and_SEARCH_networks (last access: 12 August 2020), 2008.
Watson, J. G., Chow, J. C., Chen, L.-W. A., and Frank, N. H.: Methods to assess carbonaceous aerosol sampling artifacts for IMPROVE and other long-term networks, J. Air Waste Manag. Assoc., 59, 898–911, https://doi.org/10.3155/1047-3289.59.8.898, 2009.
World Meteorological Organization and Global Atmosphere Watch: WMO/GAW aerosol measurement procedures: guidelines and recommendations, Publications Board World Meteorological Organization, Geneva, Switzerland, 2016.
Xing, L., Fu, T.-M., Cao, J. J., Lee, S. C., Wang, G. H., Ho, K. F., Cheng, M.-C., You, C.-F., and Wang, T. J.: Seasonal and spatial variability of the OM/OC mass ratios and high regional correlation between oxalic acid and zinc in Chinese urban organic aerosols, Atmos. Chem. Phys., 13, 4307–4318, https://doi.org/10.5194/acp-13-4307-2013, 2013.
Xu, Z., Wen, T., Li, X., Wang, J., and Wang, Y.: Characteristics of carbonaceous aerosols in Beijing based on two–year observation, Atmos. Pollut. Res., 6, 202–208, https://doi.org/10.5094/APR.2015.024, 2015.
Yu, J. Z., Xu, J., and Yang, H.: Charring characteristics of atmospheric organic particulate matter in thermal Analysis, Environ. Sci. Technol., 36, 754–761, https://doi.org/10.1021/es015540q, 2002.
Zhang, J., Fan, X., Graham, L., Chan, T. W., and Brook, J. R.: Evaluation of an annular denuder system for carbonaceous aerosol sampling of diesel engine emissions, J. Air Waste Manag. Assoc., 63, 87–99, https://doi.org/10.1080/10962247.2012.739582, 2013.
Zhang, Y., Favez, O., Petit, J.-E., Canonaco, F., Truong, F., Bonnaire, N., Crenn, V., Amodeo, T., Prévôt, A. S. H., Sciare, J., Gros, V., and Albinet, A.: Six-year source apportionment of submicron organic aerosols from near-continuous highly time-resolved measurements at SIRTA (Paris area, France), Atmos. Chem. Phys., 19, 14755–14776, https://doi.org/10.5194/acp-19-14755-2019, 2019.
Zotter, P., Herich, H., Gysel, M., El-Haddad, I., Zhang, Y., Močnik, G., Hüglin, C., Baltensperger, U., Szidat, S., and Prévôt, A. S. H.: Evaluation of the absorption Ångström exponents for traffic and wood burning in the Aethalometer-based source apportionment using radiocarbon measurements of ambient aerosol, Atmos. Chem. Phys., 17, 4229–4249, https://doi.org/10.5194/acp-17-4229-2017, 2017.


