the Creative Commons Attribution 4.0 License.
the Creative Commons Attribution 4.0 License.
 | 07 Nov 2023
The viscosity and surface tension of supercooled levitated droplets determined by excitation of shape oscillations
Mohit Singh
Stephanie Helen Jones
Alexei Kiselev
Thomas Leisner
We report a new method for determining the viscosity and surface tension of supercooled liquid droplets using electrodynamic levitation and phase analysis of shape oscillations. The method uses a high-frequency alternating electrical potential to excite shape oscillations in a levitated droplet, and the phase shift in the oscillations is used to simultaneously determine droplet viscosity and surface tension. The advantages over existing contactless methods include its applicability to atmospherically relevant temperatures and the possibility of continuously monitoring changes in real time. We demonstrate proof-of-concept measurement for supercooled water droplets and dilute sucrose solution droplets, and we anticipate that the technique could be used to measure viscosity values for droplets containing dilute organics. The technique is especially well-suited for investigation of the role of atmospheric processing in the viscosity and surface tension of solution droplets in equilibrium with a given or changing relative humidity.
- Article
(1685 KB) - Full-text XML
-
Supplement
(1836 KB) - BibTeX
- EndNote


Atmospheric aerosols impact the radiative budget of the climate, air quality and human health (Masson-Delmotte et al., 2021; Shiraiwa et al., 2017). The physicochemical and optical properties of aerosols influence how aerosols scatter and absorb solar radiation and also dictate their ability to form cloud condensation nuclei (CCN) and ice nuclei (IN) (Masson-Delmotte et al., 2021). Viscosity and surface tension are important physical properties of aerosol which influence numerous atmospheric processes. Aerosol viscosity can impact the rate of heterogeneous and photochemical reactions, the lifetimes of chemical species, the evaporation and growth processes leading to CCN formation, and the ability to act as IN (Reid et al., 2018). Additionally, aerosol morphology and phase state are connected to viscosity (Koop et al., 2011; Zobrist et al., 2008) and knowledge of aerosol surface tension provides information on cloud droplet formation (e.g. Ovadnevaite et al., 2017). Owing to the complex chemical composition of atmospheric aerosol, the dynamic nature of the atmosphere, and the ability of aerosols to undergo hygroscopic growth, viscosity and surface tension are likely to evolve during an aerosol lifetime. Therefore, in order to better understand the impact of atmospheric aerosol on the climate, it is necessary to characterise aerosol properties such as viscosity and surface tension over a range of atmospherically relevant conditions such as temperature and relative humidity (RH).
To date, numerous viscosity measurements have been conducted on bulk material and smaller sample volumes such as particles (e.g. Reid et al., 2018). A variety of contact and non-contact methods have been used for smaller sample volumes including bounce measurements on an impactor (Virtanen et al., 2010), poke flow (Murray et al., 2012; Renbaum-Wolff et al., 2013a), bead mobility (Renbaum-Wolff et al., 2013b), and atomic force microscopy (AFM) measurements (Qin et al., 2021). Given the natural environment of an aerosol and the limited sample volume obtained in field studies, non-contact methods that use low sample volumes, such as those achieved using single particle levitation, provide the optimum environment in which to study aerosol viscosity. Furthermore, such techniques also ensure that there is no measurement artefact from contact with a substrate.
Measurements made using non-contact methods have focused on the determination of viscosity and/or surface tension of levitated droplets at ambient temperatures (Athanasiadis et al., 2016; Bzdek et al., 2015, 2020; Endo et al., 2018; Fitzgerald et al., 2016; Power and Reid, 2014; Power et al., 2013; Rafferty et al., 2019; Richards et al., 2020; Tong et al., 2022). Several studies have probed the collision of two levitated droplets (optically or electrodynamically levitated) to determine viscosity and surface tension from the relaxation time and oscillation frequency, respectively, following collision (Bzdek et al., 2015, 2020; Power and Reid, 2014; Power et al., 2013; Richards et al., 2020; Tong et al., 2022). Power and Reid (2014) and Power et al. (2013) determined viscosities over the range of 10−3 to 109 Pa s for droplets of volume <500 fL for single, binary, and ternary component droplets, whereas Bzdek and co-workers determined values of surface tension and viscosity for picolitre droplets containing glutaric acid and sodium chloride and glutaric acid droplets doped with surfactant (Bzdek et al., 2015, 2020). Richards et al. (2020) studied gel formation in levitated aerosol with a dual electrodynamic balance based on a linear quadrupole design with a second counterbalance. Viscosity values in the range of 104 Pa s were determined for sorbitol and glucose, using the characteristic time for relaxation, and surface tension data were extrapolated from the literature.
Fluorescence lifetime imaging has also been used to determine viscosity in optically levitated droplets at ambient temperature (Fitzgerald et al., 2016; Athanasiadis et al., 2016). The fluorescence lifetime of molecular rotors added to a levitated droplet is used to determine viscosity. Fitzgerald et al. (2016) explored the effect of relative humidity on viscosity for sucrose and pharmaceutically relevant NaCl and salbutamol sulfate aerosol for droplets in the size range of 2–12 µm. The authors cautioned that for fluorescent lifetimes of >2 ns, the correlation between viscosity and fluorescence lifetime becomes non-linear and viscosity values obtained at longer fluorescent lifetimes should be taken as an order of magnitude approximation.
Endo et al. (2018) determined the surface tension at ambient temperature of optically levitated droplets of ammonium sulfate and mixed ammonium sulfate and sodium dodecyl sulfate droplets. The authors assumed that a spherical spontaneous resonance arose from a thermally induced capillary wave and obtained droplet surface tension from analysis of the light-scattering signal. Surface tension was determined with a precision of ±1 mN m−1 on droplets in the size range of 4.7 to 12.4 µm radius.
Limited non-contact viscosity measurements have been performed at atmospherically relevant lower temperatures. Järvinen et al. (2016) conducted a chamber experiment on α-pinene secondary organic aerosol and monitored the depolarisation in backscattered light intensity to determine particle asphericity and thus estimate viscosity at temperatures of −10, −20, −30, and −38 ∘C. Relative humidity was gradually increased throughout these experiments to determine the RH range where a viscosity transition occurred i.e. a phase change from semi-solid to liquid indicated by an abrupt change to a spherical shape as detected by depolarisation measurements. Rothfuss and Petters (2017, 2016) studied nanoparticle dimer formation from the coagulation of charged monomers in a chamber over a range of temperatures and RHs. Mobility diameter measurements were conducted to assess the sintering rate of dimers and determine aerosol phase state over a wide RH range for atmospherically relevant organic material and inorganic salts (Rothfuss and Petters, 2016). Further measurements of viscosity and surface tension for sucrose nanoparticle dimers were also made as a function of temperature and RH. These studies explored a temperature range spanning −11 to 80 ∘C.
Trinh and Ohsaka (1995) measured a number of physical properties of acoustically levitated supercooled droplets. The amplitude of the acoustic force was modulated to induce shape oscillations in millimetre size levitated droplets from which the surface tension and viscosity were obtained. Surface tension was determined by the measurement of the resonance frequency of the induced shape oscillations, and viscosity was determined from the decay time after the force modulation was stopped. Measurements were made for water droplets in the millimetre size range down to −21 ∘C. Large oscillations, i.e. on the order of 1 %–2 % in droplet diameter, were induced and analysed for surface tension. Rafferty et al. (2019) also studied deformations induced by laser power in optically tweezed droplets to determine surface tension values from changes in cavity-enhanced Raman scattering.
Previously, shape oscillations of highly charged glycol and water droplets levitated in an electrodynamic balance (EDB) were studied (Duft et al., 2002; Giglio et al., 2008). The shape oscillations were driven by the electric field applied for levitation. Duft et al. (2002) measured the phase and amplitude of oscillation to validate the Rayleigh instability criteria. It was further proposed that analysis of such shape oscillations could be used to determine the viscosity and surface tension of levitated droplets.
To summarise, to date there is no generally accepted single technique capable of determining the different ranges of viscosity and surface tension over a broad range of environmentally relevant conditions, e.g. temperature and relative humidity. Non-contact methods are ideally suited to the measurement of aerosol because of the use of small sample volumes enabling the study of real atmospheric samples and no measurement artefact from a substrate. Although a wide range of viscosities can be experimentally determined from relaxation following the collision of levitated droplets, the analysis requires different methods depending on the viscosity range; i.e. viscosity up to 10 Pa s requires light scattering, viscosity >107 Pa s requires brightfield imaging, and viscosity >107 Pa s requires the reappearance of whispering gallery modes in cavity-enhanced Raman spectra (Power and Reid, 2014; Power et al., 2013). Furthermore, the majority of viscosity studies have been performed at ambient temperatures with concentrated organic solutions, meaning that measurements at lower temperatures and on more dilute aerosol droplets formed through hygroscopic growth are lacking. Such measurements are important given the potential for fast aqueous chemistry and photochemistry to occur and to determine the effect of viscosity on reaction kinetics.
Here we report a novel method to simultaneously measure the temperature-dependent viscosity and surface tension of charged droplets levitated in an electrodynamic balance. In addition to the alternating electric field required for levitation, a secondary electric field of variable frequency is applied to induce shape oscillations in the levitated droplet. The shape oscillations are analysed by light scattering and the phase shift in the induced shape oscillations with respect to the second electric field is then used to determine droplet viscosity and surface tension. Here, we report the proof-of-concept measurements performed on water droplets and sucrose solution droplets over the atmospherically relevant temperature range between ∼0 to −31 ∘C.
2.1 Theoretical background
The equilibrium shape of a free drop is spherical because it represents the configuration with the lowest surface energy for the system. When a drop is perturbed from equilibrium, the inertia of the system tends to drive the drop away from equilibrium and surface tension acts to restore the drop shape resulting in shape oscillations. Lord Rayleigh (1882) studied the shape oscillations of an inviscid and perfectly conducting free droplet surrounded by an insulating gas under the influence of inherent charge and surface tension. He expanded the droplet shape into an infinite series of spherical harmonic functions Ylm(Θ,ϕ) and derived the frequency of oscillations of its terms. Hasse (1975) later generalised this approach for the case of a charged viscous drop. He could show that the equation of motion for each mode l is given by
where αl is the deformation coefficient of the corresponding lth term of the spherical harmonics expansion. In Eq. (1) we added the term Fext,l to account for an external driving force exciting mode l. The coefficients are given as
where ε0 is the electrical permittivity of free space, R and Q are the radius and charge of the droplet, and ρ, σ, and η are the density, the surface tension, and the viscosity of the droplet, respectively.
At this point we will make use of the fact that the alternating quadrupole potential of the EDB is in the form of Y2,0 and preferentially excites the corresponding quadrupole (l=2, m=0) mode of droplet shape oscillation. The external forcing on the quadrupole mode of oscillation will have two components: one as a result of the low-frequency trapping potential at angular frequency ωt and the other from the high-frequency excitation potential at angular frequency ωe. The equation of motion for the quadrupole shape oscillation in the presence of the levitation and excitation potential is
where we included the driving forces due to the low-frequency trapping (Ft) and high-frequency excitation electric fields (Fe). Equation (2) can be rewritten as
This is the equation of a damped harmonic oscillation with harmonic excitation, where we identify γ as the damping constant and ω0 as the natural angular frequency of the droplet shape oscillation with the coefficients
Since Eq. (3) is linear with respect to α, the droplet's response to the combined influence of two driving fields will be the sum of their two independent responses. The steady-state solution of Eq. (3) can be written as
where At and Ae are the amplitudes of oscillation and ϕt and ϕe are the phase shifts with respect to the phase of the external driving forces. After inserting Eq. (4) into Eq. (3) and collecting the corresponding sine and cosine coefficients, the phase shift with respect to the excitation frequency is found to be
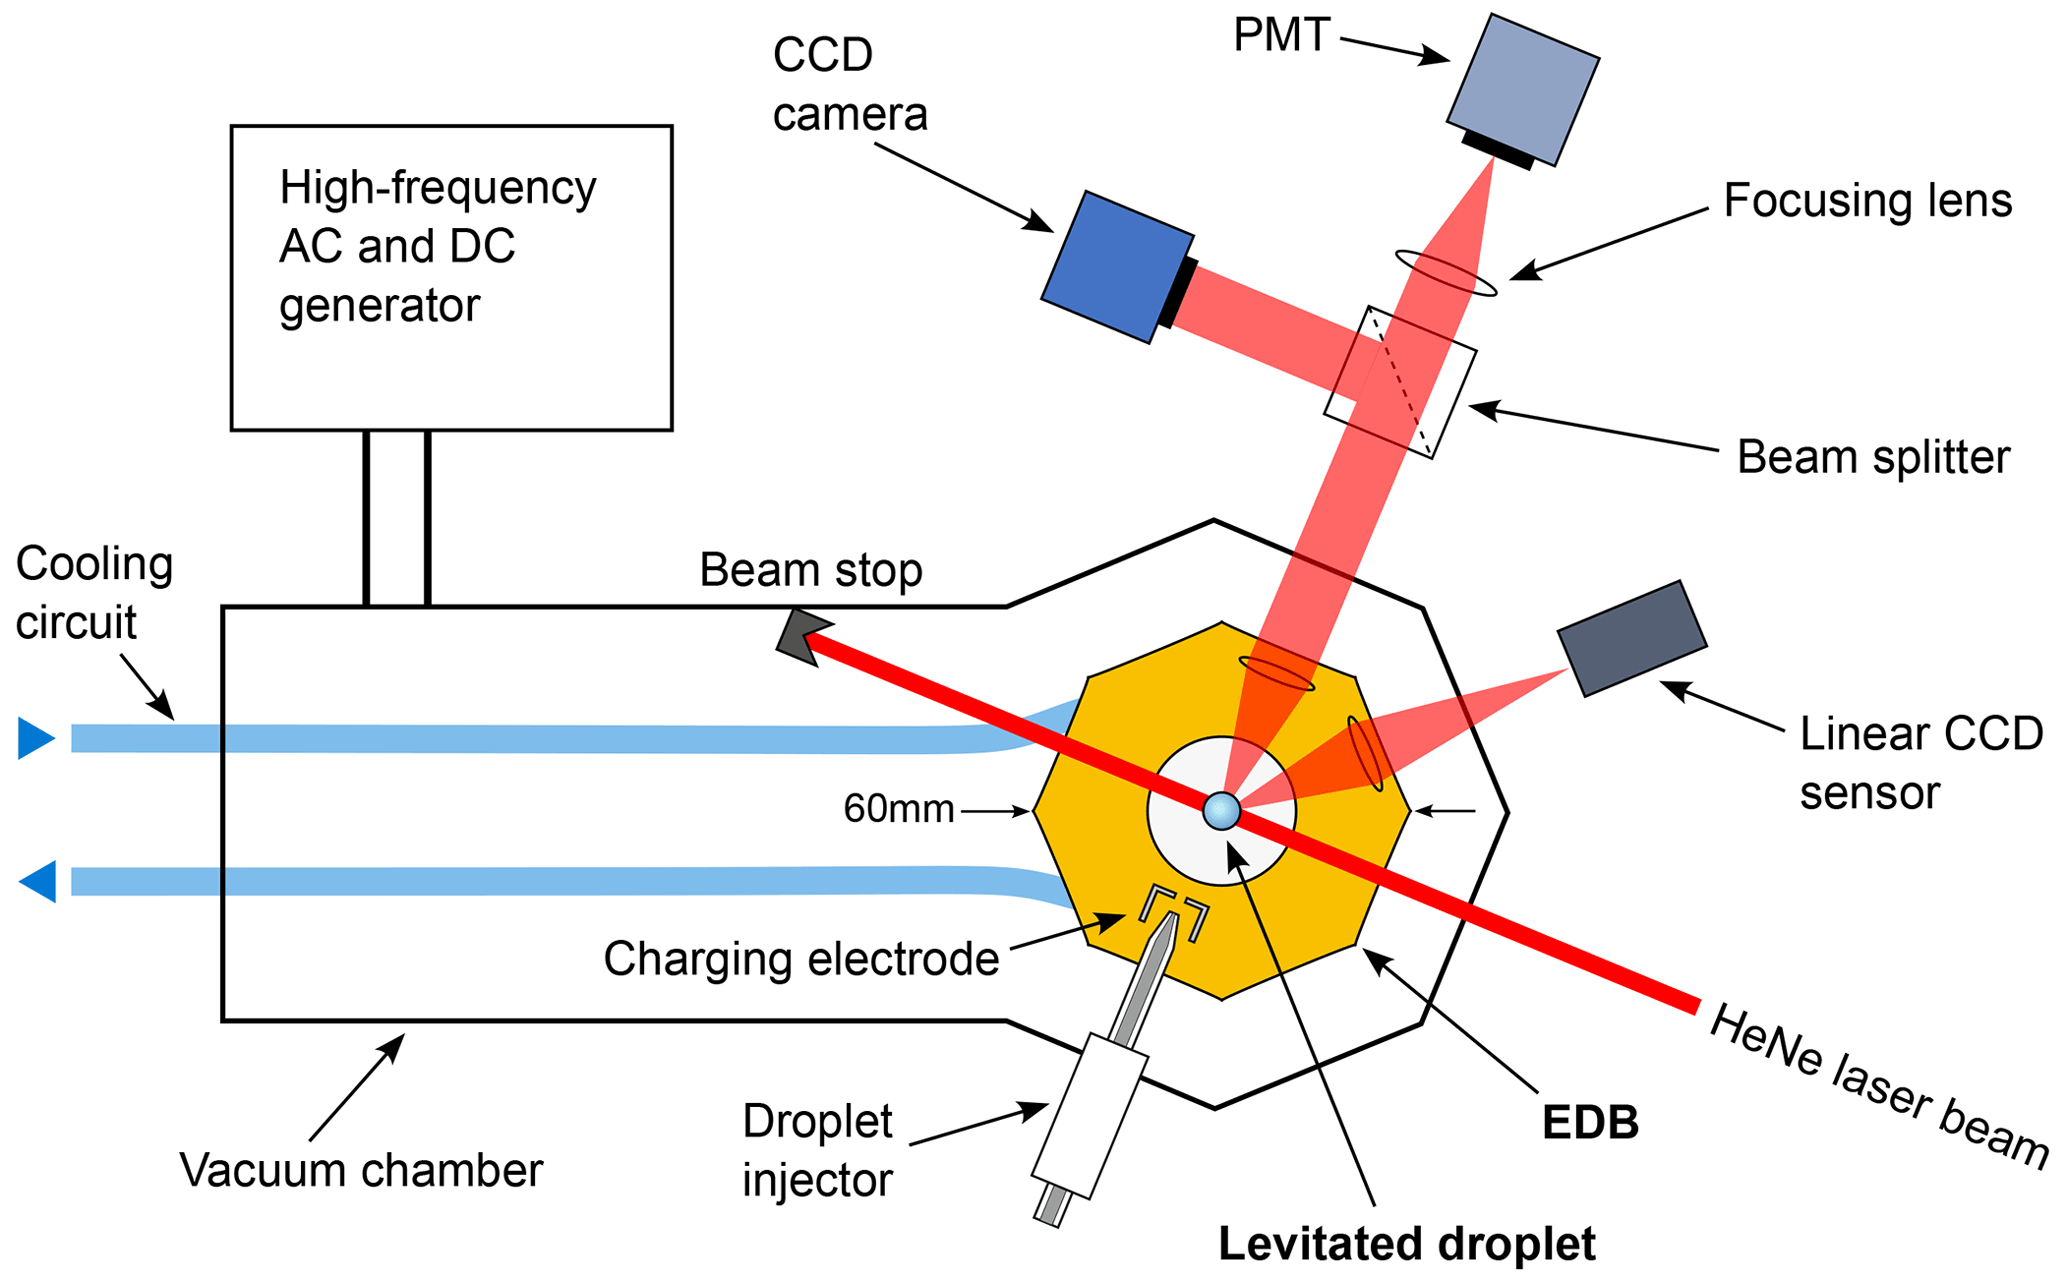
Figure 1Schematic of the experimental setup depicted from an overhead perspective. The axes of rotational symmetry for the electrodynamic trapping field and gravity pass through the viewing plane. The droplet is depicted at a considerably larger size for visibility.
If the phase shift between the driving force and response is measured over a sufficiently wide frequency interval, both γ and ω0 can be obtained experimentally by fitting Eq. (5). Once these parameters are known, the viscosity and surface tension of the droplet can be calculated independently using
and
Equations (6) and (7) follow from inserting Eqs. (3a) and (3c) into Eqs. (1a)–(1c) and solving for η and σ. It is important to emphasise that in this analysis, the amplitudes of both the droplet oscillation and the driving force are not required. From Eqs. (6) and (7) it becomes clear that in addition to γ and ω0, the parameters ρ, Q, and R have to be known. The procedures to determine the latter quantities are detailed in the Supplement.
2.2 Experimental setup and procedure
Charged droplets are levitated in a quadrupole EDB enclosing a 1 cm3 volume of air at ambient pressure. A detailed description of the EDB has been reported in a previous publication (Rzesanke et al., 2012), and Sect. S1 in the Supplement provides further information. An overview of the experimental setup is given in Fig. 1 and will be briefly described here. The EDB is of classical hyperboloid design (Paul, 1990) in order to provide l=2 excitation. The trapping alternating current (AC) potential at frequency ωt is applied to the central electrode. The potential applied to the end cap electrodes consists of the excitation AC potential at frequency ωe overlaid with a direct current (DC) potential which compensates for the gravitational force on the droplet. The EDB is operated without gas flow during individual experiments, eliminating the need to account for a drag force acting on the levitated droplet. The EDB is temperature-controlled and mounted in a vacuum housing for thermal insulation. Individual charged droplets are generated using a piezo-driven nozzle, and a HeNe (632.8 nm) laser is directed onto the levitated droplet. We estimate that the EDB allows the stable levitation of droplets between 5 and 200 µm in diameter. Part of the light scattered by the droplet is guided to the photomultiplier tube (PMT) (Hamamatsu H10723-20), while another fraction is used to obtain angular resolved light-scattering images using a charge-coupled device (CCD) camera. The vertical position of the droplet in the trap is controlled by a feedback loop that adjusts the DC potential applied to the end cap electrodes based on position information obtained from a signal on a linear CCD sensor. A custom-built high-frequency (HF) high-voltage AC generator is used to excite droplet shape oscillations. For a more detailed description of the HF generator, see Sect. S2.
A typical experiment involves the stable levitation of a ∼100 µm diameter charged droplet in the EDB. The temperature of the trap is set to the desired value at least 1 h before performing experiments. In order to maintain a humid environment and reduce droplet evaporation, at the start of each experiment, a water volume is placed into a cavity in the bottom electrode to serve as a source of water vapour. Using this method, a relative humidity ranging from 60 % to 85 % under conditions of steady state is achieved within the EDB. The temperature of the levitated droplet is offset with respect to the ambient temperature in the EDB due to the evaporative cooling effect. The relative humidity in the EDB and the temperature offset due to evaporative cooling are estimated by measuring the droplet evaporation rate and applying a steady-state evaporation model (Eq. 13-21 in Pruppacher and Klett, 1997). The droplet temperature reported here is always determined by adding the evaporative cooling offset (between −1.2 and −1.8 ∘C) to the ambient temperature in the EDB.
Images of the angular resolved light scattering (phase function) are recorded every 1 s using a CCD camera. From these images the droplet size is obtained by analysing the spatial frequency of fringes in the phase function and by comparison with the frequency from calculated phase functions using Mie theory. A more detailed description is provided in Sect. S3. During the experiment, the light scattered by the oscillating droplet is recorded while sweeping the frequency over a predetermined range. In our experiments, we applied frequency sweeps across two distinct ranges: 9 to 17 and 21 to 45 kHz, while maintaining a constant excitation amplitude of approximately 1.5 kV peak to peak. The duration of individual frequency sweeps was selected as either 5 or 10 s. In the range between 17 and 21 kHz the HF transformers employed in our generator possess their own resonance with strongly varying output amplitudes. Therefore, this frequency range was avoided. In the future, an improved generator design should allow for a continuous tuning of the excitation frequency. During the sweep, each frequency value is held constant for a duration of 100 ms before moving to the next frequency value. The amplitude of the applied excitation voltage is kept constant during the frequency sweep. Further frequency sweeps can subsequently be applied to follow the temporal evolution of η and σ if desired.
It is important to note that the PMT electronics constitute a low-pass filter to the signal. This introduces an additional frequency-dependent phase shift in the experimental data. To account for this, the following equation is used:
where ϕc is the corrected phase, ϕS is the phase shift obtained by symmetry analysis, fe is the frequency of the excitation signal and BWL is the bandwidth limit of the PMT (200 kHz). For excitation frequencies ranging from 9 to 45 kHz, the phase shift correction resulting from the PMT bandwidth limit ranges from 2.6 to 12.7∘ illustrating the substantial impact of the correction.
Droplets of nanopure water (Thermo Scientific, GenPure Pro UV) and of dilute aqueous sucrose solutions with concentrations of 1 wt % and 2.5 wt % were investigated. The solutions were prepared by dissolving sucrose (VWR Chemicals, proteomic grade, >99.9 %) in water. We studied water as it is a fundamental constituent of the atmosphere and its viscosity and surface tension are well known, while sucrose is used as a proxy for organic aerosol and exhibits a strongly concentration-dependent viscosity. Measurements were taken at temperatures between ∼0 and −31 ∘C. For the majority of measurements, a single frequency sweep was administered a few seconds after introducing the droplet into the EDB. Subsequently, the droplet was expelled from the EDB. This process was iterated using a minimum of 10 to 15 droplets at each temperature in order to acquire an ensemble average. For the sucrose solution droplets a repeated number of frequency sweeps were applied for each individual droplet with the objective of capturing the temporal changes in viscosity and surface tension as the sucrose concentration increased as a result of water evaporation from the droplet.
2.3 Phase analysis method
The light-scattering intensity from a droplet that undergoes quadrupole deformations according to Eq. (4) is a complex function of the deformation coordinate α and eludes a direct inversion. To determine surface tension and viscosity it is necessary to measure the phase shift between droplet response and applied excitation. This can be achieved by focusing on the extrema of droplet deformation and their phase shift relative to the maxima of the excitation. Around the turning points of the droplet deformation, the light-scattering function should be symmetrical in time. This is explored in the “cycle symmetry method” which we introduce in this work and which is explained in detail in the Supplement. In brief, we calculate a scalar symmetry parameter for each point in time for the recorded light-scattering data. The maxima of this symmetry time series, i.e. the moments in time of highest local symmetry, correspond to the turning points of the droplet oscillation. It turns out that the cycle symmetry method is a very robust method of determining the phase shift between droplet oscillation and excitation. The method can easily be applied to data taken with a changing excitation frequency as is the case during a frequency sweep as long as the frequency changes slowly compared to the vibrational period. The result of such an analysis of a frequency sweep on a levitated water droplet of R=44.3 µm and at a temperature of T=0.4 ∘C is shown in Fig. 2. A fit to the data according to Eq. (5) is shown as a red line. The fit yields values for γ and ω0. Viscosity and surface tension are then obtained using Eqs. (6) and (7).
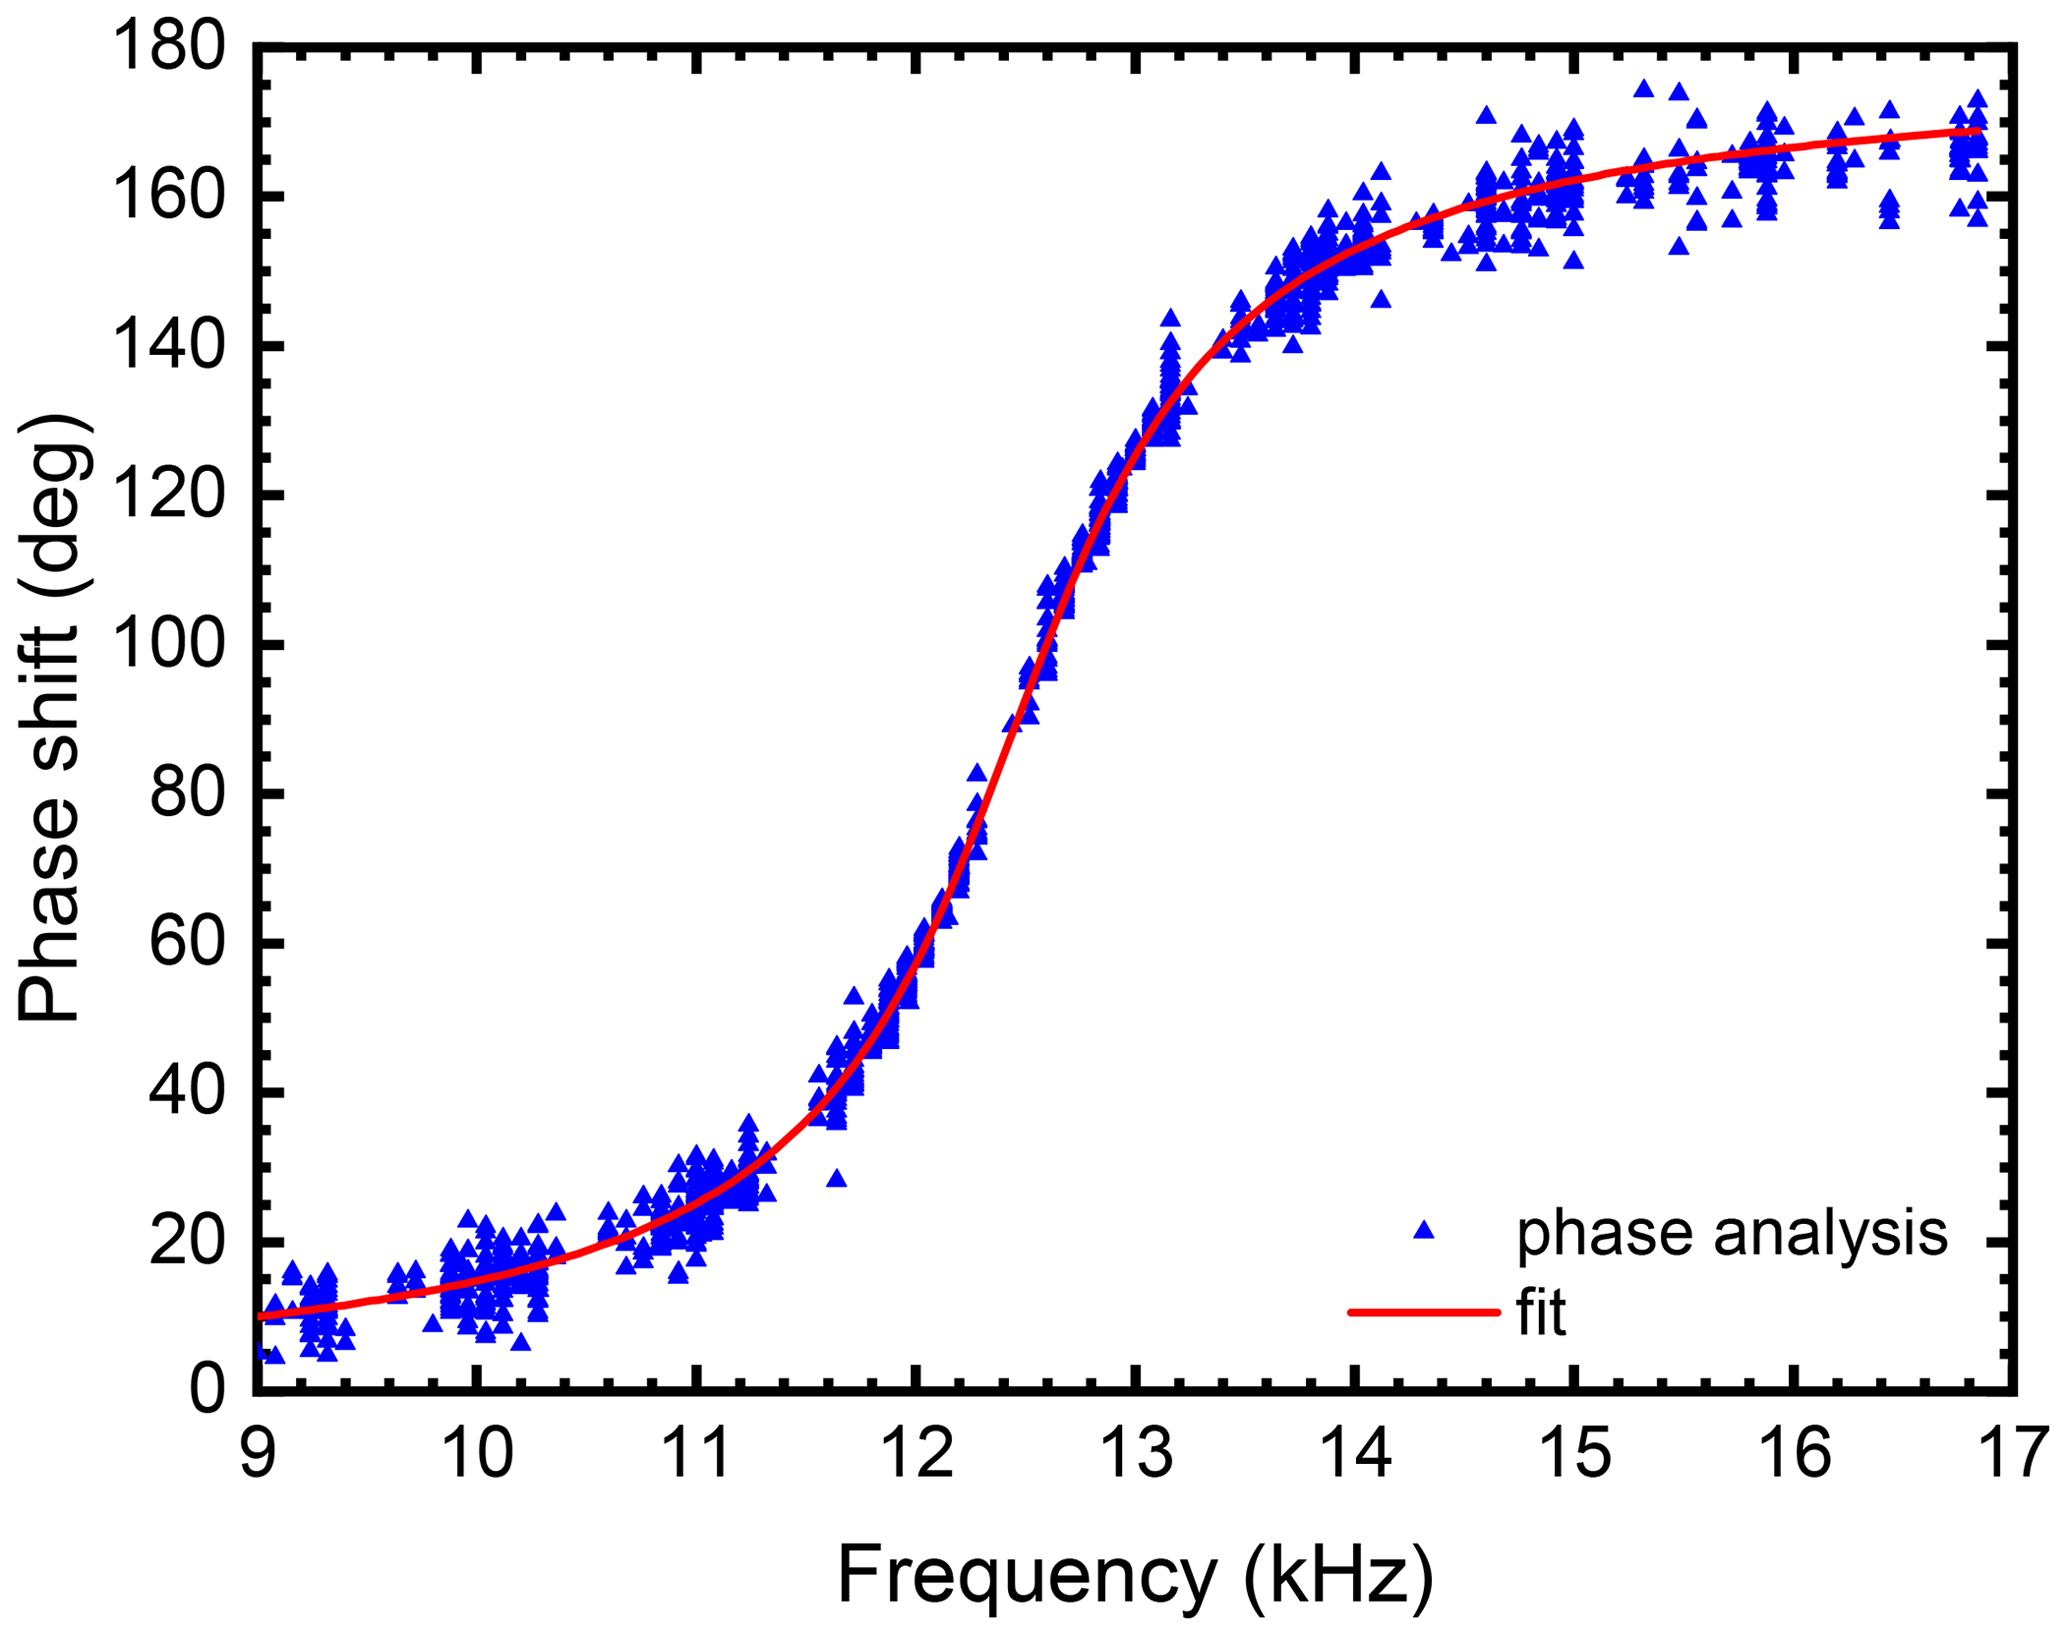
Figure 2Phase-frequency data obtained from the symmetry analysis method for a water droplet with R=44.3 µm and Q=0.82 p C at T=0.4 ∘C. Also plotted is a fit according to Eq. (5) with fit parameters γ=4639 s−1 and kHz. Application of Eqs. (6) and (7) yielded the values of η=182 mPa s for viscosity and σ=68 mN m−1 for surface tension,.
In analogy to the phase shift, the amplitude of the oscillation could in theory also be analysed in order to determine viscosity and surface tension. For the example shown in Fig. 2 the oscillation amplitude in droplet radius was between 3.5 Å off-resonance (17 kHz) and 5 nm on-resonance (12.5 kHz). We would like to highlight that oscillations in droplet radius as small as a single monolayer of water can be detected. However, due to the complex nature of the light-scattering signal as a function of the oscillation coordinate, we found amplitude analysis to be more error prone compared to the phase shift analysis.
The phase shift in induced droplet oscillations was measured to determine the viscosity and surface tension of individual water droplets and individual sucrose solution droplets from −0 to −31 ∘C. The ensemble average of the viscosity for 10 water droplets at each measurement temperature is shown in Fig. 3. The error bars shown in the plot represent the uncertainty associated with the fit and the uncertainties from independent radius and charge determination with the radius determination predominantly influencing the outcome. Details on estimation of uncertainties in these parameters are provided in Sects. S3 and S4. Overall, the results agree well with literature values. However, at temperatures below −20 ∘C, we observe a deviation of the measured average values compared to the literature values. To elucidate the cause, further investigation is necessary.
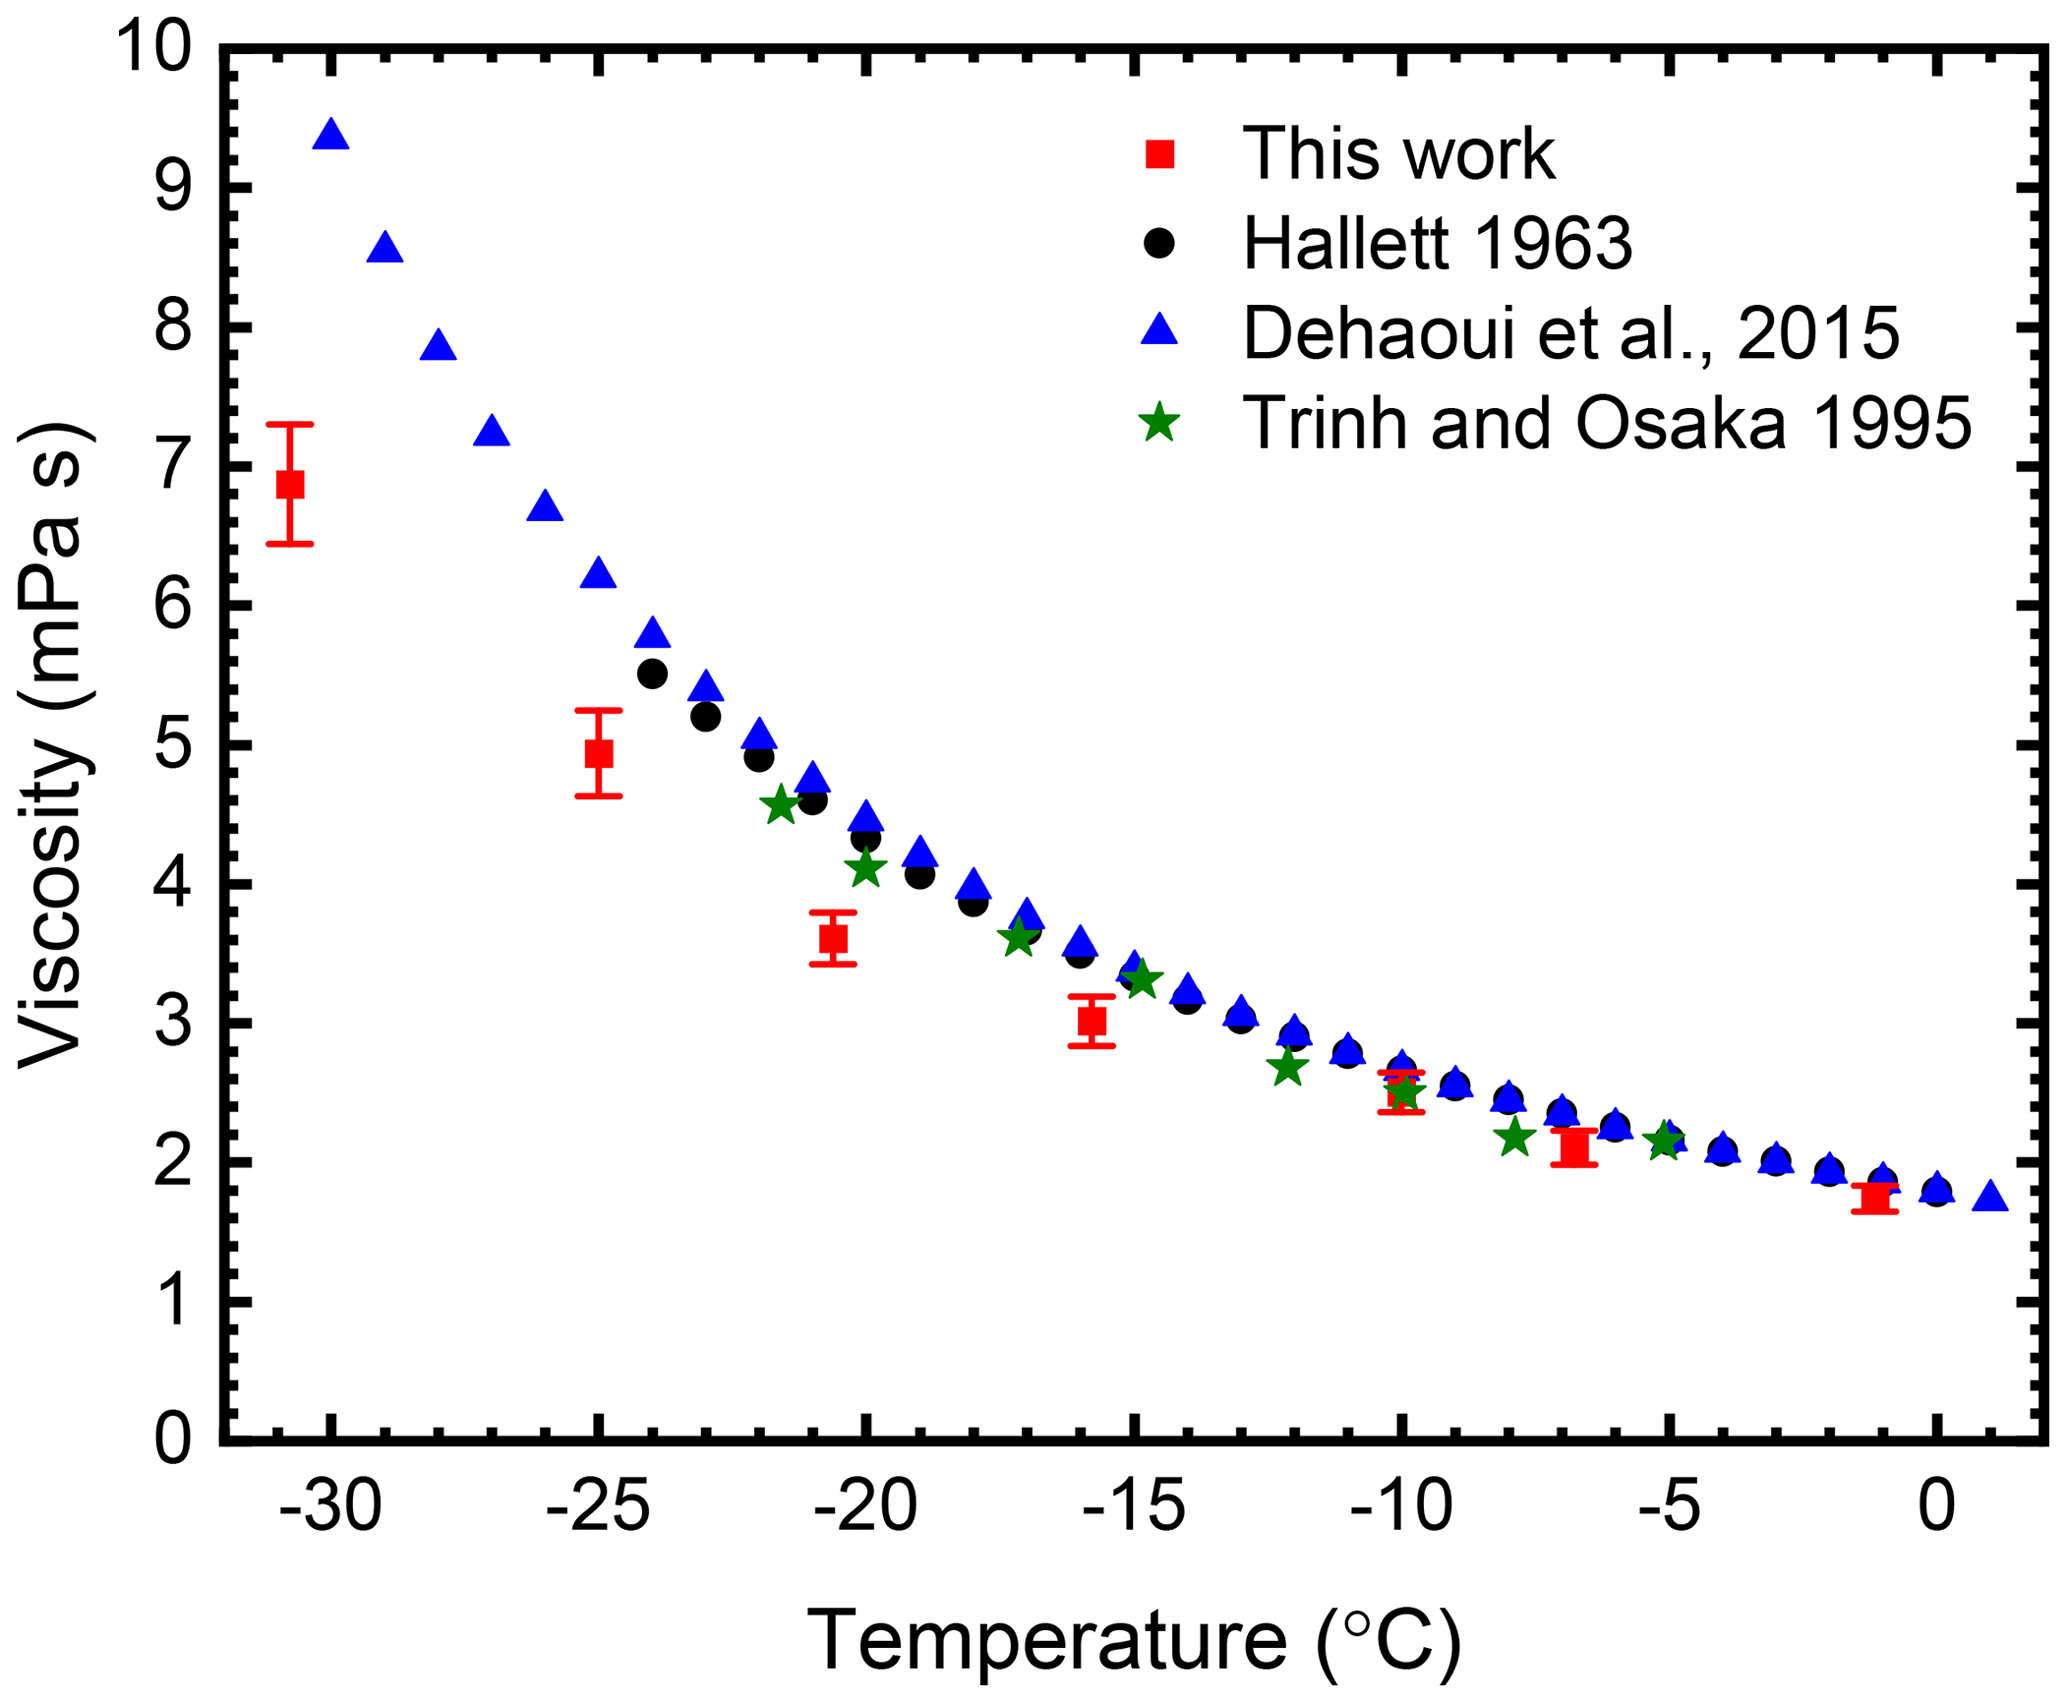
Figure 3Experimentally determined viscosity values of water with respect to temperature. The red data points are the average viscosity for 10 levitated water droplets, and the error bars represent the relative error in the fit. Literature values are also shown for comparison.
The literature values for the viscosity of supercooled water shown in Fig. 3 were determined using a range of different methods. Bulk measurements were performed by Hallett (1963), who used a capillary flow technique to measure the viscosity of water at temperatures down to −23.8 ∘C, whereas Dehaoui et al. (2015) studied Brownian motion of polystyrene spheres suspended in water to determine the viscosity of supercooled water down to −34 ∘C. They indicate that the uncertainties associated with their data range from 2.3 % at the highest temperature to 2.8 % at the lowest temperature. A drawback to their method is that they require a reference value of viscosity at a known temperature, meaning their method is not widely applicable to a range of compounds. Furthermore, polystyrene spheres are often pre-coated with surface-active molecules to prevent coagulation, and this coating might affect their mobility and hence the viscosity measurement. The most relevant literature values for this study are those determined by Trinh and Ohsaka (1995), who performed measurements on individually acoustically levitated supercooled droplets. They determined the decay time following induced shape oscillations in acoustically levitated spheres to determine the viscosity down to −21 ∘C.
The measured viscosity values for an evaporating sucrose solution droplet of initial concentration 2.5 wt % are shown in Fig. 4. Using the measured size evolution of the droplet and knowledge of the initial concentration at droplet injection, the concentration as function of time can be calculated. The relationship between concentration and time was used to calculate the upper axis. We note that the data are in excellent agreement with the parameterisation published by Barber (1966). In this work, the data were analysed after completion of the experiment. However, it is worth noting that, in principle, the analysis can be performed while the droplet is still levitated in the EDB and that changes in viscosity and surface tension could be followed in situ.
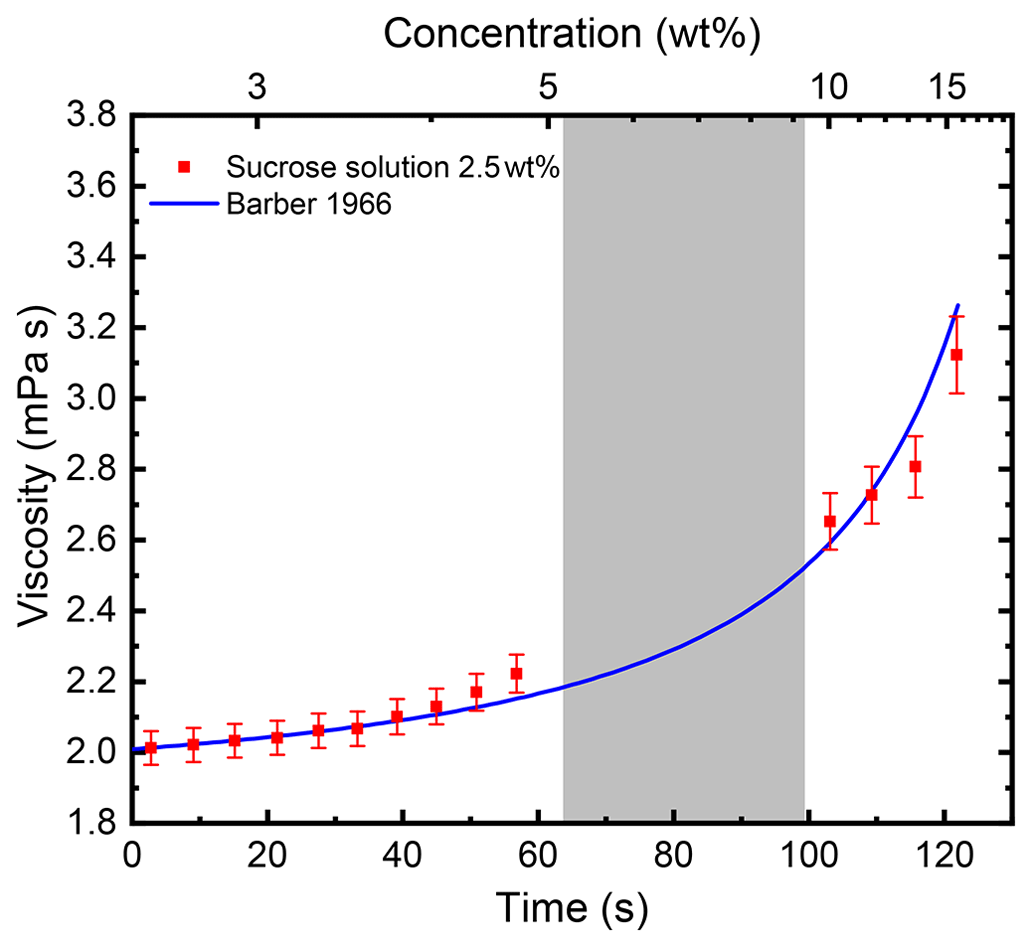
Figure 4Viscosity of an evaporating sucrose solution droplet with initial concentration of 2.5 wt % as a function of evaporation time at ∘C. The line represents calculated values according to a parameterisation for the viscosity of sucrose solution as a function of concentration and temperature (Barber, 1966). The grey-shaded area between ∼64 and 100 s indicates the time range in which the natural frequency of the droplet oscillation was between the two frequency sweep ranges. Here, the fitting procedure did not yield reliable results, which explains the gap in the data.
In addition to the viscosity, we calculated the surface tension using Eq. (7) and the experimentally determined values of radius at the natural frequency, mass, and charge of the droplet. The resulting ensemble average of the surface tension for 10 droplets at each temperature setting is shown in Fig. 5. Error bars represent the uncertainty derived from the fit, the radius measurement and the charge measurement as the standard deviation of the ensemble average was typically smaller than the uncertainties derived from the independent variables.
Comparison with the literature values in Fig. 5 shows that the surface tension of water is a weak function of temperature. The values measured in the current study are lower than the literature values and possess more scatter. The different literature measurements agree well with each other, and the majority were determined using a technique based on the capillary rise method (Hrubý et al., 2014; Kalová and Mareš, 2021; Vinš et al., 2015) apart from Trinh and Ohsaka (1995), who determined surface tension by the determination of the natural frequency for the fundamental mode of shape oscillations.
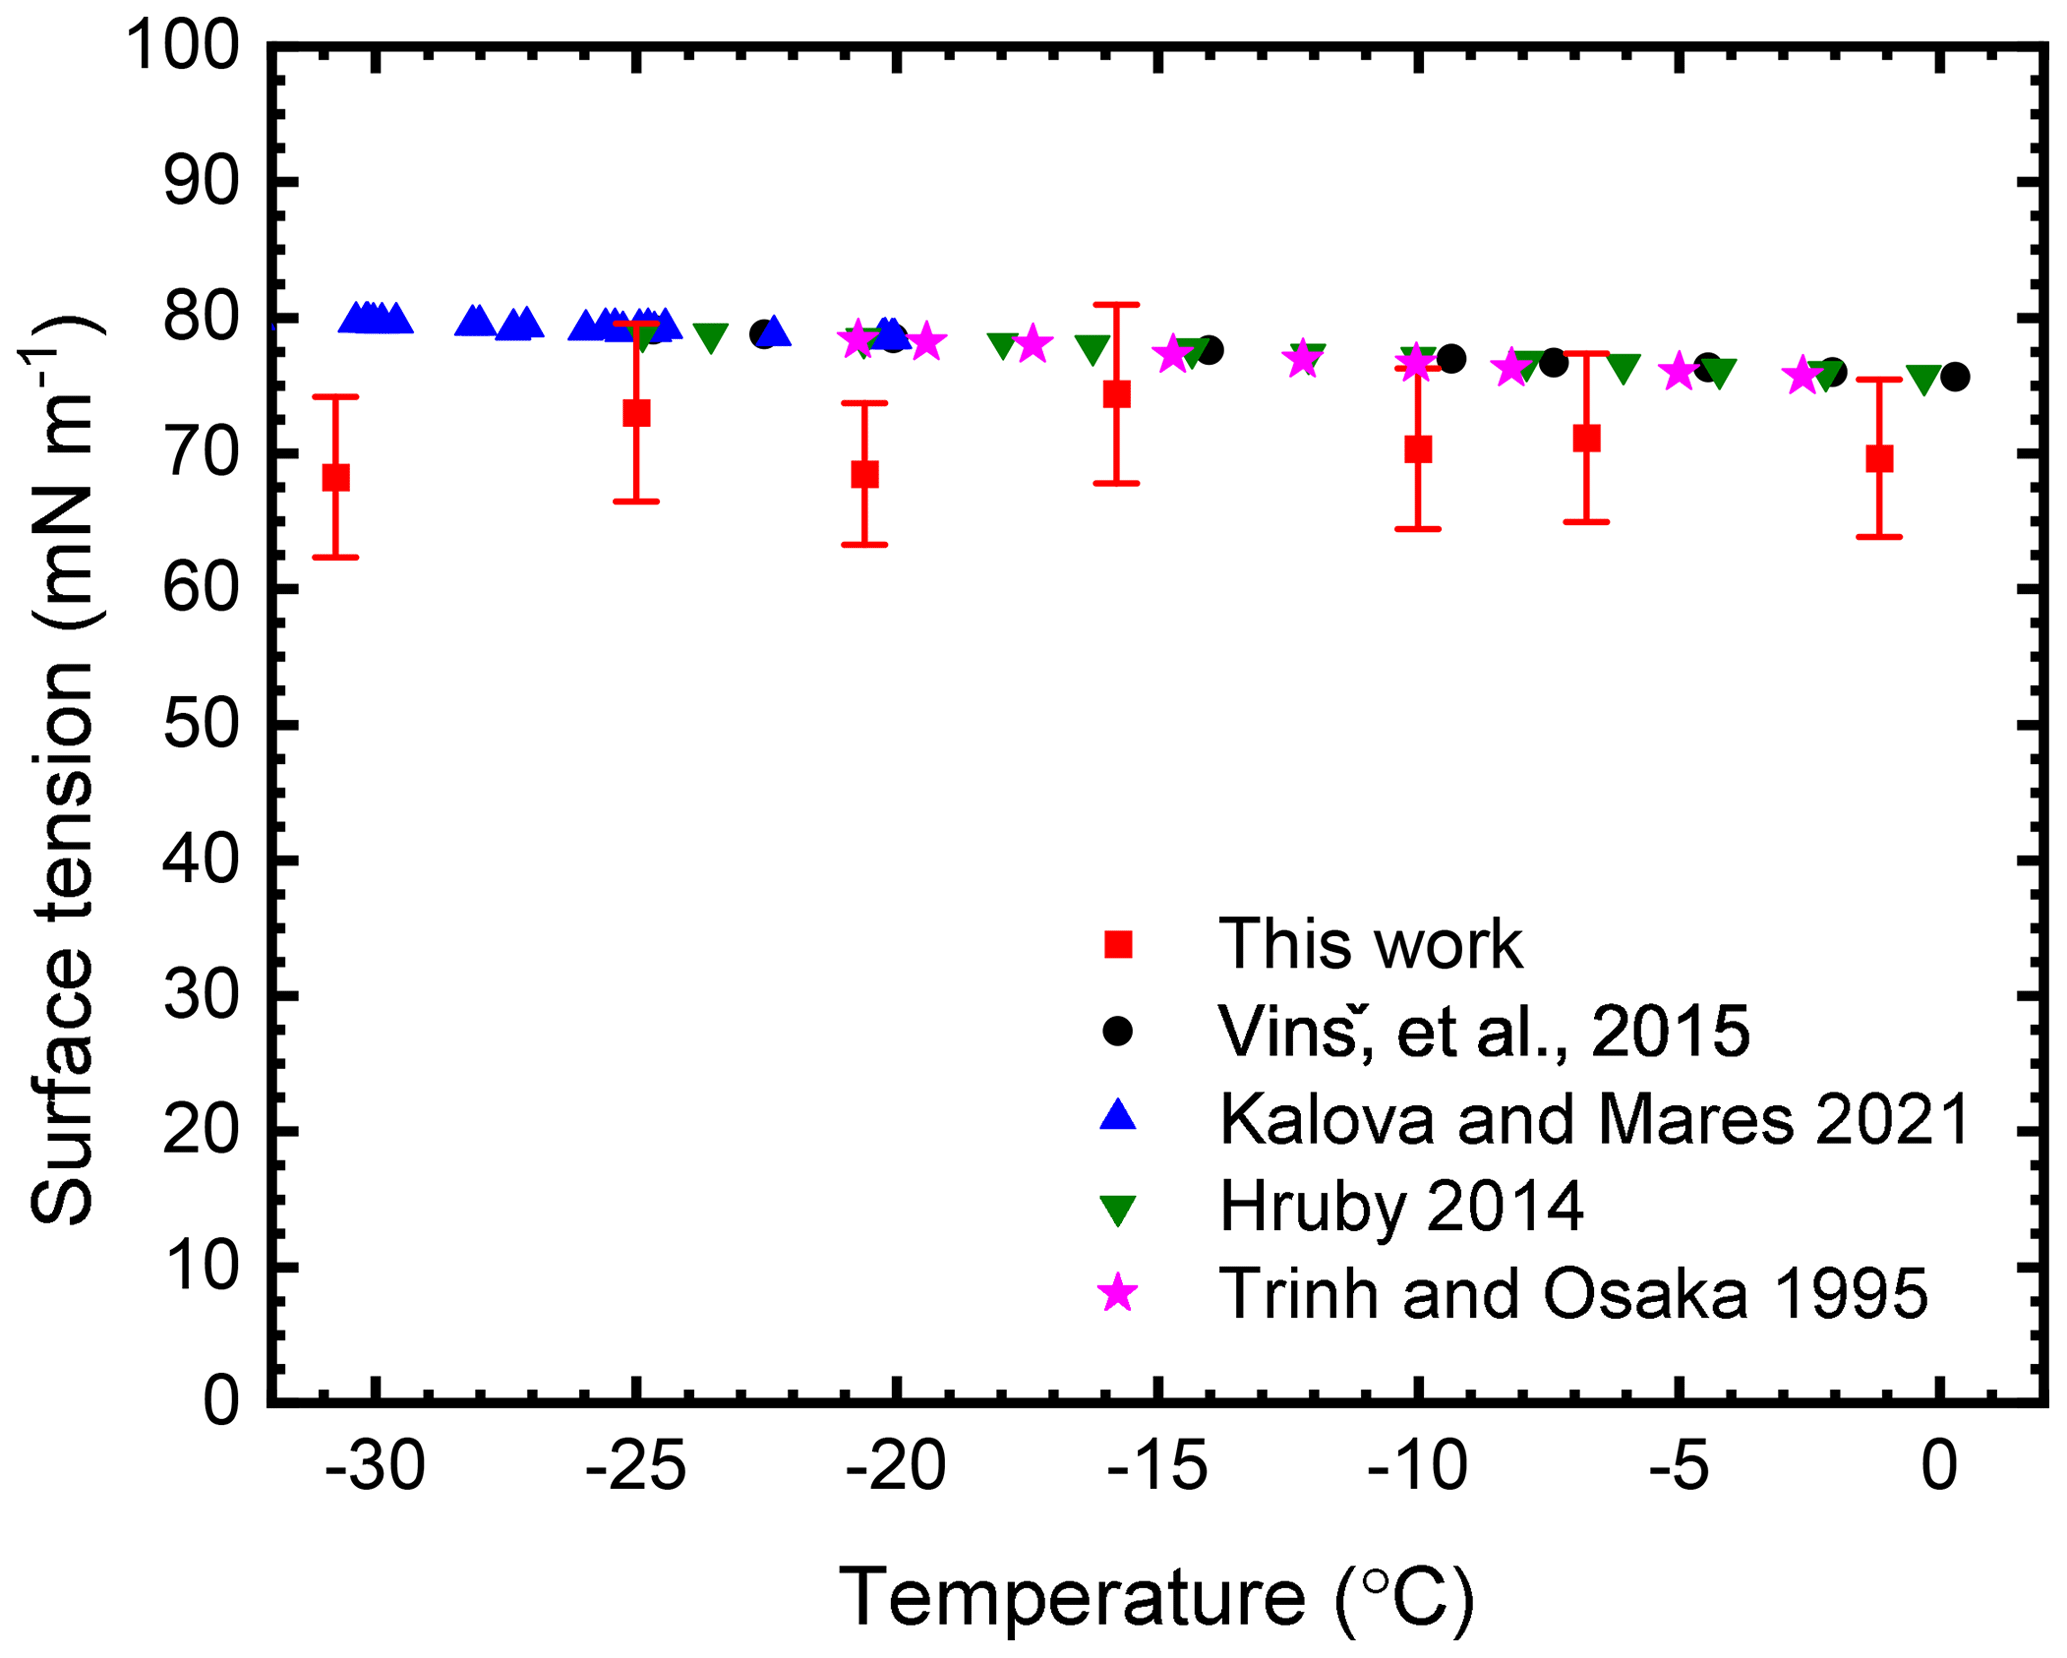
Figure 5Experimentally determined surface tension of supercooled levitated water droplets and comparison to literature values. Red data points correspond to the average surface tension value for 10 water droplets and error bars represent the relative error in the fit.
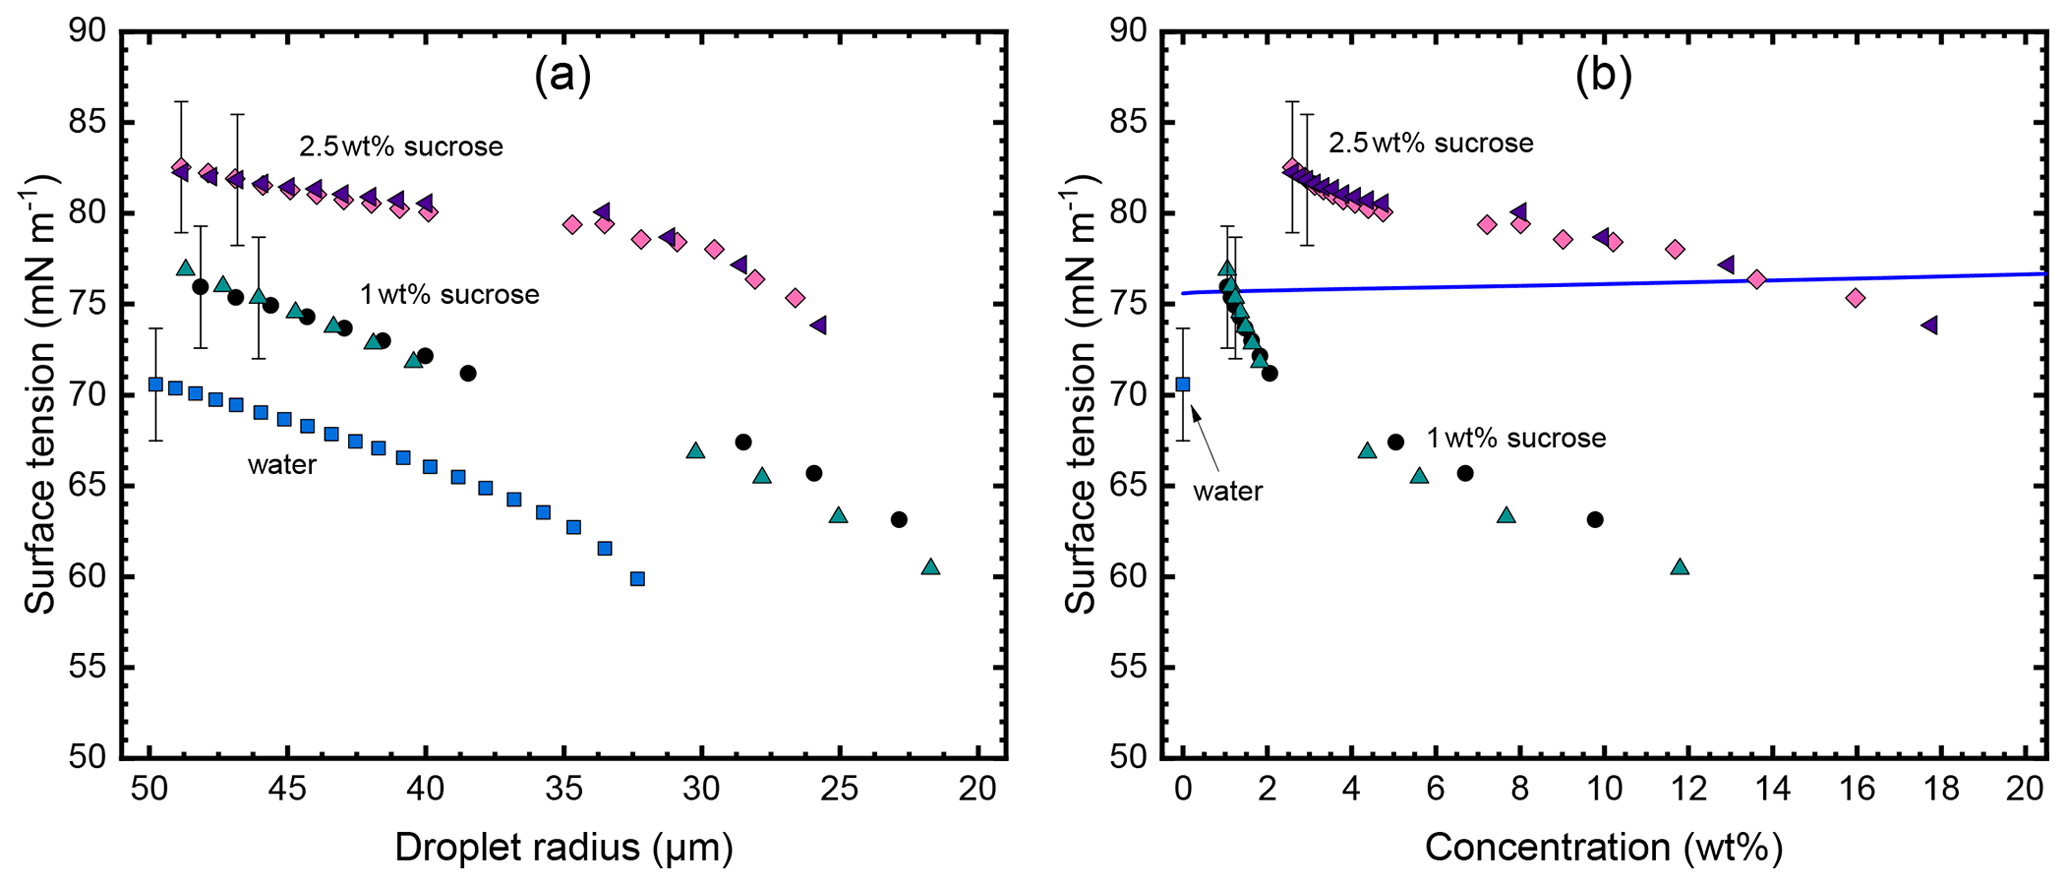
Figure 6Surface tension of water and sucrose solution droplets. Shown are the results from five individual droplets at a temperature of ∘C. Two droplets at two initial sucrose concentrations (1 wt % and 2.5 wt %) and one droplet of pure water. Panel (a) shows the evolution of the surface tension as the droplets evaporate in the EDB. The presence of gaps in the data series indicates that the natural frequency of the droplet has shifted beyond the resonance of the excitation transformer preventing analysis of data in that range. Panel (b) depicts the surface tension plotted as function of the concentration as calculated from the initial sucrose concentration and droplet radius under the assumption that only water evaporates from the droplet. For water, only the initial data point is plotted. The solid line represents the expected dependency for the surface tension derived from literature as detailed in the text. To enhance clarity, error bars are displayed solely for one data point in each series in both panels.
It is well known that levitated droplets can readily absorb potentially surface-active substances from the surrounding air in the EDB affecting surface tension measurements (Bzdek et al., 2015; Duft et al., 2002). Similarly, it is possible that a small amount of surfactant present in the sample solution can concentrate on the droplet surface during evaporation. We investigated this effect by analysing the surface tension of individual droplets as they evaporated in the EDB, as shown in Fig. 6. Here, one pure water droplet, two droplets of 1 wt %, and two droplets of 2.5 wt % initial sucrose concentration were observed over a time span ranging from 100 to 120 s. Figure 6a shows the surface tension plotted as a function of droplet radius as the droplets evaporate with time. As the droplets evaporate, their surface tension decreases indicating a possible accumulation of surfactants on the droplet surface. As in the viscosity analysis, the measured radius change is used to calculate the concentration in each droplet as function of time, resulting in a plot of surface tension as a function of concentration (Fig. 6b). To the best of our knowledge no data on the surface tension of a sucrose solution below 20 ∘C are available. Nevertheless, to be able to put our results into perspective we estimated the surface tension of a sucrose solution at low temperatures using data measured at 25 ∘C from a study performed by Aumann et al. (2010). We then used the well-known data for water to scale the sucrose solution values according to to lower temperature. The resulting reference curve is plotted as a solid line in Fig. 6b. The comparison of our data with the reference clearly shows that the observed decrease in surface tension as the droplets evaporate is not due to the increase in sucrose concentration. However, the similarity of the decrease when plotted against the radius may indicate an increase in surfactant concentration and may hence explain the decreasing surface tension. A second observation in Fig. 6b is the much more pronounced difference in surface tension at initial sucrose concentration. We plan to further investigate these effects quantitatively in a forthcoming paper.
The novel method reported here is directly applicable to the determination of viscosity and surface tension at atmospherically relevant supercooled temperatures and can also be applied at ambient temperature. As previously mentioned, the majority of contactless methods used to determine aerosol viscosity and surface tension have predominantly focused on measurements at ambient temperature and above (e.g. Athanasiadis et al., 2016; Bzdek et al., 2015; Endo et al., 2018; Fitzgerald et al., 2016; Power and Reid, 2014; Power et al., 2013; Richards et al., 2020; Tong et al., 2022) and tend to focus on concentrated droplets.
A key advantage of the method reported here is that it utilises only one analysis method, the symmetry analysis of droplet shape oscillations, to determine both droplet viscosity and surface tension over a wide temperature range (ambient to supercooled). Other studies involving coalescence of two optically levitated droplets use multiple analysis methods to cover different viscosity ranges and determine surface tension (e.g. Bzdek et al., 2020; Power and Reid, 2014). Furthermore, the study by Trinh and Ohsaka (1995), who induced shape oscillations in acoustically levitated droplets used two different methods to determine surface tension and viscosity: the analysis of resonance frequency of oscillations and relaxation time to a sphere, respectively. Having one analysis method to determine both viscosity and surface tension as described in the present study has additional advantages in terms of providing insight into the phase state of complex mixtures; e.g. for water droplets coated in an organic film, information on the viscosity of the water droplet and the surface tension of the shell could be deduced from a single experiment. Additionally, the method described here allows the viscosity and surface tension to be calculated independently using two separate equations.
Regarding surface tension, the technique allows a measurement to be made within about 2 s after droplet levitation allowing little time for contaminants to accumulate on the droplet surface. This is a shorter timescale than that obtained with the contactless method that interrogates the resulting oscillations of two coalesced optically trapped droplets 10 s after they are individually trapped (Bzdek et al., 2015).
Furthermore, the current study only requires small-scale oscillations (amplitude of angstroms to tens of nanometres) meaning that more atmospherically relevant smaller droplets can be probed, in comparison to larger-scale oscillations of 1 %–2 % in diameter for a millimetre-sized acoustically levitated droplet (Trinh and Ohsaka, 1995).
In comparison to non-levitation techniques such as the study by Dehaoui et al. (2015), our method does not require the knowledge of any other material property apart from density to derive the viscosity, similar to Hallett (1963).
To date, there remain few measurements of viscosity and surface tension for atmospherically relevant organic aerosols and organic containing mixtures at supercooled temperatures. As aerosols take up water and grow to become cloud droplets, their concentration will likely be diluted. It is therefore important to determine viscosity and surface tension of dilute substances as well as concentrated ones. The viscosity range covered by the current proof of concept measurements ranges from 2 to 7 mPa s. The results indicate the potential for the new technique to explore dilute organic solutions at supercooled atmospherically relevant temperatures. We estimate an upper limit for the viscosity measurement of a few pascal seconds for the current experimental setup (see Sect. S6), while the determination of a lower limit remains elusive. However, further studies are required to determine the full extent of the range of viscosities using this method. We hypothesise that the technique could be used to measure viscosity values for droplets containing dilute organics. Regarding surface tension, we estimate that the method is applicable within a range of at least 10−3 to 1 N m−1, thus encompassing the complete spectrum of values typically encountered for atmospheric aerosols.
As demonstrated by the surface tension measurements in Fig. 6, we are able to measure small changes in viscosity and surface tension in real time. Therefore, the technique is ideally suited to investigate the role of atmospheric processing in the viscosity and surface tension of solution droplets in equilibrium with surrounding water vapour such as relative humidity, photochemistry, and oxidation.
We have developed a new technique to determine viscosity and surface tension of levitated droplets at supercooled temperatures. A high-frequency AC signal swept over a variable frequency range is used to excite shape oscillations in a levitated droplet. From the analysis of light scattered by the droplet as it undergoes shape oscillations we are able to determine the phase shift in oscillations compared to the excitation signal, which can then be used to determine droplet viscosity and surface tension. The proof-of-concept measurement has been demonstrated for supercooled water droplets and sucrose solution droplets over a temperature range of ∼0 to −31 ∘C. We estimate that the method is suitable for viscosities below a few pascal seconds and surface tensions falling between 10−3 and 1 N m−1. The technique represents a step forward in the simultaneous measurement of viscosity and surface tension of levitated droplets at supercooled temperatures utilising only one analysis method.
The code for the phase analysis is available from the authors upon request.
The data are available from the authors upon request.
The supplement related to this article is available online at: https://doi.org/10.5194/amt-16-5205-2023-supplement.
The project was conceptualised by TL. The methodology was developed by MS, SHJ, DD, and TL. The HF generator was designed by TL and implemented by MS. The experiments were carried out by MS and SHJ. The phase analysis code and various software tools were developed by DD. The collected data were analysed by MS, SHJ, and DD. The initial draft of the manuscript was prepared by MS, SHJ, and DD. The manuscript was reviewed and edited by MS, SHJ, and DD, with contributions from AK and TL. Throughout the project, supervision was provided by AK, DD, and TL.
The contact author has declared that none of the authors has any competing interests.
Publisher's note: Copernicus Publications remains neutral with regard to jurisdictional claims made in the text, published maps, institutional affiliations, or any other geographical representation in this paper. While Copernicus Publications makes every effort to include appropriate place names, the final responsibility lies with the authors.
This research has been supported by the Alexander von Humboldt-Stiftung (Humboldt-Research grant for Postdocs) and the Deutsche Forschungsgemeinschaft (grant no. JO 1849/1-1).
The article processing charges for this open-access publication were covered by the Karlsruhe Institute of Technology (KIT).
This paper was edited by Pierre Herckes and reviewed by two anonymous referees.
Athanasiadis, A., Fitzgerald, C., Davidson, N. M., Giorio, C., Botchway, S. W., Ward, A. D., Kalberer, M., Pope, F. D., and Kuimova, M. K.: Dynamic viscosity mapping of the oxidation of squalene aerosol particles, Phys. Chem. Chem. Phys., 18, 30385–30393, https://doi.org/10.1039/C6CP05674A, 2016.
Aumann, E., Hildemann, L. M., and Tabazadeh, A.: Measuring and modeling the composition and temperature-dependence of surface tension for organic solutions, Atmos. Environ., 44, 329–337, https://doi.org/10.1016/j.atmosenv.2009.10.033, 2010.
Barber, E. J.: Calculation of Density and Viscosity of Sucrose as a Function of Concentration and Temperature, The Development of Zonal Centrifuges and Ancillary Systems for Tissue Fractionation and Analysis, 21, 219–239, 1966.
Bzdek, B. R., Power, R. M., Simpson, S. H., Reid, J. P., and Royall, C. P.: Precisecontactless measurements of the surface tension of picolitre aerosol droplets, Chem. Sci., 7, 274–285, https://doi.org/10.1039/C5SC03184B, 2015.
Bzdek, B. R., Reid, J. P., Malila, J., and Prisle, N. L.: The surface tension of surfactant-containingfinite volume droplets, P. Natl. Acad. Sci. USA, 117, 8335–8343, https://doi.org/10.1073/pnas.1915660117, 2020.
Dehaoui, A., Issenmann, B., and Caupin, F.: Viscosity of deeply supercooled water and its coupling to molecular diffusion, P. Natl. Acad. Sci. USA, 112, 12020–12025, https://doi.org/10.1073/pnas.1508996112, 2015.
Duft, D., Lebius, H., Huber, B. A., Guet, C., and Leisner, T.: Shape Oscillations and Stability of Charged Microdroplets, Phys. Rev. Lett., 89, 084503, https://doi.org/10.1103/PhysRevLett.89.084503, 2002.
Endo, T., Ishikawa, K., Fukuyama, M., Uraoka, M., Ishizaka, S., and Hibara, A.: Spherical Spontaneous Capillary–Wave Resonance on Optically Trapped Aerosol Droplet, J. Phys. Chem. C, 122, 20684–20690, https://doi.org/10.1021/acs.jpcc.8b03784, 2018.
Fitzgerald, C., Hosny, N. A., Tong, H., Seville, P. C., Gallimore, P. J., Davidson, N. M., Athanasiadis, A., Botchway, S. W., Ward, A. D., Kalberer, M., Kuimova, M. K., and Pope, F. D.: Fluorescence lifetime imaging of optically levitated aerosol: a technique to quantitatively map the viscosity of suspended aerosol particles, Phys. Chem. Chem. Phys., 18, 21710–21719, https://doi.org/10.1039/C6CP03674K, 2016.
Giglio, E., Gervais, B., Rangama, J., Manil, B., Huber, B. A., Duft, D., Müller, R., Leisner, T., and Guet, C.: Shape deformations of surface-charged microdroplets, Phys. Rev. E, 77, 036319, https://doi.org/10.1103/PhysRevE.77.036319, 2008.
Hallett, J.: The Temperature Dependence of the Viscosity of Supercooled Water, P. Phys. Soc., 82, 1046, https://doi.org/10.1088/0370-1328/82/6/326, 1963.
Hasse, R. W.: Inertiafrictionand angular momentum of an oscillating viscous charged liquid drop under surface tension, Ann. Phys., 93, 68–87, https://doi.org/10.1016/0003-4916(75)90206-7, 1975.
Hrubý, J., Vinš, V., Mareš, R., Hykl, J., and Kalová, J.: Surface Tension of Supercooled Water: No Inflection Point down to −25 ∘C, J. Phys. Chem. Lett., 5, 425–428, https://doi.org/10.1021/jz402571a, 2014.
Järvinen, E., Ignatius, K., Nichman, L., Kristensen, T. B., Fuchs, C., Hoyle, C. R., Höppel, N., Corbin, J. C., Craven, J., Duplissy, J., Ehrhart, S., El Haddad, I., Frege, C., Gordon, H., Jokinen, T., Kallinger, P., Kirkby, J., Kiselev, A., Naumann, K.-H., Petäjä, T., Pinterich, T., Prevot, A. S. H., Saathoff, H., Schiebel, T., Sengupta, K., Simon, M., Slowik, J. G., Tröstl, J., Virtanen, A., Vochezer, P., Vogt, S., Wagner, A. C., Wagner, R., Williamson, C., Winkler, P. M., Yan, C., Baltensperger, U., Donahue, N. M., Flagan, R. C., Gallagher, M., Hansel, A., Kulmala, M., Stratmann, F., Worsnop, D. R., Möhler, O., Leisner, T., and Schnaiter, M.: Observation of viscosity transition in α-pinene secondary organic aerosol, Atmos. Chem. Phys., 16, 4423–4438, https://doi.org/10.5194/acp-16-4423-2016, 2016.
Kalová, J. and Mareš, R.: Surface Tension in the Supercooled Water Region, Int. J. Thermophys., 42, 131, https://doi.org/10.1007/s10765-021-02884-z, 2021.
Koop, T., Bookhold, J., Shiraiwa, M., and Pöschl, U.: Glass transition and phase state of organic compounds: dependency on molecular properties and implications for secondary organic aerosols in the atmosphere, Phys. Chem. Chem. Phys., 13, 19238–19255, https://doi.org/10.1039/C1CP22617G, 2011.
Masson-Delmotte, V., Zhai, P., Pirani, A., Connors, S. L., Péan, C., Berger, S., Caud, N., Chen, Y., Goldfarb, L., Gomis, M. I., Huang, M., Leitzell, K., Lonnoy, E., Matthews, J. B. R., Maycock, T. K., Waterfield, T., Yelekçi, Ö., Yu, R., and Zhou, B.: Climate Change 2021: The Physical Science Basis. Contribution of Working Group I to the Sixth Assessment Report of the Intergovernmental Panel on Climate ChangeCambridge University PressCambridge, United Kingdom and New York, NY, USA, https://doi.org/10.1017/9781009157896, 2021.
Murray, B. J., Haddrell, A. E., Peppe, S., Davies, J. F., Reid, J. P., O'Sullivan, D., Price, H. C., Kumar, R., Saunders, R. W., Plane, J. M. C., Umo, N. S., and Wilson, T. W.: Glass formation and unusual hygroscopic growth of iodic acid solution droplets with relevance for iodine mediated particle formation in the marine boundary layer, Atmos. Chem. Phys., 12, 8575–8587, https://doi.org/10.5194/acp-12-8575-2012, 2012.
Ovadnevaite, J., Zuend, A., Laaksonen, A., Sanchez, K. J., Roberts, G., Ceburnis, D., Decesari, S., Rinaldi, M., Hodas, N., Facchini, M. C., Seinfeld, J. H., and O' Dowd, C.: Surface tension prevails over solute effect in organic-influenced cloud droplet activation, Nature, 546, 637–641, https://doi.org/10.1038/nature22806, 2017.
Paul, W.: Electromagnetic traps for charged and neutral particles, Rev. Mod. Phys., 62, 531–540, https://doi.org/10.1103/RevModPhys.62.531, 1990.
Power, R. M. and Reid, J. P.: Probing the micro-rheological properties of aerosol particles using optical tweezers, Rep. Prog. Phys., 77, 074601, https://doi.org/10.1088/0034-4885/77/7/074601, 2014.
Power, R. M., Simpson, S. H., Reid, J. P., and Hudson, A. J.: The transition from liquid to solid-like behaviour in ultrahigh viscosity aerosol particles, Chem. Sci., 4, 2597–2604, https://doi.org/10.1039/C3SC50682G, 2013.
Pruppacher, H. R. and Klett, J. D.: Microphysics of clouds and precipitation, Kluwer Academic Publishers, https://doi.org/10.1007/978-0-306-48100-0, 1997.
Qin, Y., Ye, J., Ohno, P., Nah, T. T., and Martin, S.: Temperature-Dependent Viscosity of Organic Materials Characterized by Atomic Force Microscope, Atmosphere, 12, 1476, https://doi.org/10.3390/atmos12111476, 2021.
Rafferty, A., Gorkowski, K., Zuend, A., and Preston, T. C.: Optical deformation of single aerosol particles, P. Natl. Acad. Sci. USA, 116, 19880–19886, https://doi.org/10.1073/pnas.1907687116, 2019.
Rayleigh, L.: On the equilibrium of liquid conducting masses charged with electricity, The London Edinburgh and Dublin Philosophical Magazine and Journal of Science, 14, 184–186, https://doi.org/10.1080/14786448208628425, 1882.
Reid, J. P., Bertram, A. K., Topping, D. O., Laskin, A., Martin, S. T., Petters, M. D., Pope, F. D., and Rovelli, G.: The viscosity of atmospherically relevant organic particles, Nat. Commun., 9, 956, https://doi.org/10.1038/s41467-018-03027-z, 2018.
Renbaum-Wolff, L., Grayson, J. W., Bateman, A. P., Kuwata, M., Sellier, M., Murray, B. J., Shilling, J. E., Martin, S. T., and Bertram, A. K.: Viscosity of a-pinene secondary organic material and implications for particle growth and reactivity, P. Natl. Acad. Sci. USA, 110, 8014–8019, https://doi.org/10.1073/pnas.1219548110, 2013a.
Renbaum-Wolff, L., Grayson, J. W., and Bertram, A. K.: Technical Note: New methodology for measuring viscosities in small volumes characteristic of environmental chamber particle samples, Atmos. Chem. Phys., 13, 791–802, https://doi.org/10.5194/acp-13-791-2013, 2013b.
Richards, D. S., Trobaugh, K. L., Hajek-Herrera, J., and Davis, R. D.: Dual-Balance Electrodynamic Trap as a Microanalytical Tool for Identifying Gel Transitions and Viscous Properties of Levitated Aerosol Particles, Anal. Chem., 92, 3086–3094, https://doi.org/10.1021/acs.analchem.9b04487, 2020.
Rothfuss, N. E. and Petters, M. D.: Characterization of the temperature and humidity-dependent phase diagram of amorphous nanoscale organic aerosols, Phys. Chem. Chem. Phys., 19, 6532–6545, https://doi.org/10.1039/C6CP08593H, 2017.
Rothfuss, N. E. and Petters, M. D.: Coalescence-based assessment of aerosol phase state using dimers prepared through a dual-differential mobility analyzer technique, Aerosol Sci. Tech., 50, 1294–1305, https://doi.org/10.1080/02786826.2016.1221050, 2016.
Rzesanke, D., Nadolny, J., Duft, D., Müller, R., Kiselev, A., and Leisner, T.: On the role of surface charges for homogeneous freezing of supercooled water microdroplets, Phys. Chem. Chem. Phys., 14, 9359–9363, https://doi.org/10.1039/C2CP23653B, 2012.
Shiraiwa, M., Ueda, K., Pozzer, A., Lammel, G., Kampf, C. J., Fushimi, A., Enami, S., Arangio, A. M., Fröhlich-Nowoisky, J., Fujitani, Y., Furuyama, A., Lakey, P. S. J., Lelieveld, J., Lucas, K., Morino, Y., Pöschl, U., Takahama, S., Takami, A., Tong, H., Weber, B., Yoshino, A., and Sato, K.: Aerosol Health Effects from Molecular to Global Scales, Environ. Sci. Technol., 51, 13545–13567, https://doi.org/10.1021/acs.est.7b04417, 2017.
Tong, Y. K., Liu, Y., Meng, X., Wang, J., Zhao, D., Wu, Z., and Ye, A.: The relative humidity-dependent viscosity of single quasi aerosol particles and possible implications for atmospheric aerosol chemistry, Phys. Chem. Chem. Phys., 24, 10514–10523, https://doi.org/10.1039/D2CP00740A, 2022.
Trinh, E. H. and Ohsaka, K.: Measurement of densitysound velocitysurface tensionand viscosity of freely suspended supercooled liquids, Int. J. Thermophys., 16, 545–555, https://doi.org/10.1007/BF01441920, 1995.
Vinš, V., Fransen, M., Hykl, J., and Hrubý, J.: Surface Tension of Supercooled Water Determined by Using a Counterpressure Capillary Rise Method, J. Phys. Chem. B, 119, 5567–5575, https://doi.org/10.1021/acs.jpcb.5b00545, 2015.
Virtanen, A., Joutsensaari, J., Koop, T., Kannosto, J., Yli-Pirilä, P., Leskinen, J., Mäkelä, J. M., Holopainen, J. K., Pöschl, U., Kulmala, M., Worsnop, D. R., and Laaksonen, A.: An amorphous solid state of biogenic secondary organic aerosol particles, Nature, 467, 824–827, https://doi.org/10.1038/nature09455, 2010.
Zobrist, B., Marcolli, C., Pedernera, D. A., and Koop, T.: Do atmospheric aerosols form glasses?, Atmos. Chem. Phys., 8, 5221–5244, https://doi.org/10.5194/acp-8-5221-2008, 2008.