the Creative Commons Attribution 4.0 License.
the Creative Commons Attribution 4.0 License.
 | 02 May 2024
TOLNet validation of satellite ozone profiles in the troposphere: impact of retrieval wavelengths
Matthew S. Johnson
Alexei Rozanov
Mark Weber
Nora Mettig
John Sullivan
Michael J. Newchurch
Shi Kuang
Thierry Leblanc
Fernando Chouza
Timothy A. Berkoff
Guillaume Gronoff
Kevin B. Strawbridge
Raul J. Alvarez
Andrew O. Langford
Christoph J. Senff
Guillaume Kirgis
Brandi McCarty
Larry Twigg
The Tropospheric Ozone Lidar Network (TOLNet) was used to validate retrievals of ozone (O3) profiles in the troposphere from the TROPOspheric Monitoring Instrument (TROPOMI) ultraviolet (UV), Cross-track Infrared Sounder (CrIS) infrared (IR), and a combined UV + IR wavelength retrieval from TROPOMI/CrIS. Observations from six separate ground-based lidar systems and various locations of ozonesondes distributed throughout North America and in the Netherlands were used to quantify systematic bias and random errors for each satellite retrieval. Furthermore, TOLNet data were used to intercompare idealized UV, IR, and UV + IR convolved lidar profiles of O3 in the troposphere during case studies representative of high-O3 events. This study shows that the improved sensitivity and vertical resolution in UV + IR retrievals in the middle- and upper-troposphere resulted in tropospheric degree of freedom (DOF) values ∼ 33 % higher compared to UV- and IR-only retrievals. The increased DOFs in the UV + IR retrievals allowed for improved reproduction of mid- and upper-tropospheric O3 enhancements and, to a lesser degree, near-surface pollution enhancements compared to single-wavelength satellite products.
The validation of O3 profiles in the troposphere retrieved with the UV-only, IR-only, and UV + IR Tikhonov regularised Ozone Profile retrievAl with SCIATRAN (TOPAS) algorithm developed at the Institute for Environmental Physics, University of Bremen, demonstrated the utility of using TOLNet as a satellite evaluation data set. TOPAS UV-only, IR-only, and UV + IR wavelength retrievals had systematic biases, quantified with normalized mean bias, throughout the troposphere of 11.2 ppb (22.1 %), −1.7 ppb (−0.3 %), and 3.5 ppb (7.8 %), respectively, which meet the tropospheric systematic bias requirements defined by the science teams for the TROPOMI and CrIS sensors. The primary drivers of systematic bias were determined to be solar zenith angle, surface albedo, and cloud fraction. Random errors, representative of uncertainty in the retrievals and quantified by root mean squared errors (RMSEs), were large for all three retrievals, with UV-only, IR-only, and UV + IR wavelength retrievals having RMSEs throughout the troposphere of 17.4 ppb (19.8 % of mean tropospheric column values), 10.5 ppb (12.6 % of mean tropospheric column values), and 14.0 ppb (14.6 % of mean tropospheric column values), respectively. TOPAS UV-only profiles did not meet the uncertainty requirements defined for TROPOMI for the troposphere; however, CrIS IR-only retrievals did meet the uncertainty requirements defined by this mission. The larger random errors reflect the challenge of retrieving daily O3 profiles due to the limited sensitivity and vertical resolution of these retrievals in the troposphere. Tropospheric systematic biases and random error were lower in IR-only and combined UV + IR retrievals compared to UV-only products due to the increased sensitivity in the troposphere allowing the retrievals to deviate further from the a priori profiles. Observations from TOLNet demonstrated that the performance of the three satellite products varied by season and altitude in the troposphere. TOLNet was shown to result in similar validation statistics compared to ozonesonde data, which are a commonly used satellite evaluation data source, demonstrating that TOLNet is a sufficient source of satellite O3 profile validation data in the troposphere, which is critical as this data source is the primary product identified for the tropospheric O3 validation of the recently launched Tropospheric Emissions: Monitoring of Pollution (TEMPO) mission.
- Article
(5881 KB) - Full-text XML
-
Supplement
(1047 KB) - BibTeX
- EndNote


Consistent observations of tropospheric ozone (O3) are critical for understanding atmospheric chemistry, important societal issues such as air quality and human health (WHO, 2003; US EPA, 2006), and long-term trends in atmospheric chemical composition (Cooper et al., 2014). Monitoring tropospheric O3 is typically done with ground-based in situ measurement networks, tropospheric O3 lidars, and ozonesonde launches (Lefohn et al., 2018; Tarasick et al., 2019; Sullivan et al., 2022). These observation types provide high-accuracy information; however, surface-level monitoring networks do not detect O3 vertical profiles throughout the tropospheric column, and ozonesondes and lidars are spatiotemporally sparse. To fill this time and space void, over the past couple of decades satellite sensors have been developed to retrieve O3 profiles in the stratosphere and troposphere with near-global coverage (Hoogen et al., 1999; Liu et al., 2005). However, due to the coarse vertical resolution of nadir-viewing passive satellite retrievals of O3 profiles in the troposphere (> 6 km), the representativeness and accuracy of this data source can be degraded compared to ozonesondes and lidars. Given the benefit from the observational coverage of satellites, it is vital to quantify these sensors' systematic biases and unresolved errors in the troposphere.
Vertical profiles of O3 in the troposphere have been retrieved by satellites for multiple decades, and Table 1 summarizes some of the most commonly used spaceborne sensors. The first spaceborne sensor to retrieve tropospheric O3 vertical profiles was the Global Ozone Monitoring Experiment (GOME) instrument, which was launched in 1995 on board the European Space Agency (ESA) European Remote Sensing satellite (ERS-2) (Burrows et al., 1999). This ultraviolet (UV) wavelength (between 237–406 nm) retrieval (Hoogen et al., 1999; Liu et al., 2005) from GOME had a vertical resolution of 10–15 km in the troposphere and spatial resolution of 40 km × 320 km (Liu et al., 2005). A follow-on sensor for continued vertical profiling of tropospheric O3, GOME-2, was launched in 2006 on board the ESA MetOp-A satellite (Callies et al., 2000). GOME-2 applies a UV wavelength (between 240–403 nm) retrieval and has a ground pixel size of 40 km × 80 km with a vertical resolution of 7–15 km in the troposphere (Miles et al., 2015; Kauppi et al., 2016). The National Aeronautics and Space Administration (NASA) launched the polar-orbiting Aura satellite in 2004, which is the platform for the Dutch–Finnish nadir-viewing spectrometer Ozone Monitoring Instrument (OMI) currently still retrieving tropospheric O3 profiles (Liu et al., 2010). There are three O3 profile retrieval algorithms for OMI (NASA – Royal Netherlands Meteorological Institute (KNMI), van Oss et al., 2002; Smithsonian Astrophysical Observatory (SAO), Liu et al., 2010; Rutherford Appleton Laboratory (RAL) Space, Pope et al., 2023). The SAO algorithm uses UV wavelengths (270–330 nm) to provide data at a spatial resolution of 13 km × 48 km and a vertical resolution in the troposphere of 10–14 km (Liu et al., 2010; Bak et al., 2013). The NASA KNMI OMI algorithm uses the same UV wavelengths, resulting in similar spatial and vertical resolutions in the troposphere to the SAO product (Kroon et al., 2011). The RAL Space algorithm uses UV wavelengths (270–350 nm) to retrieve O3 profiles at the native spatial resolution of the sensor (13 km × 24 km at nadir) with similar vertical resolution to the other two algorithms (Miles et al., 2015; Keppens et al., 2018; Pope et al., 2023). Finally, the TROPOspheric Monitoring Instrument (TROPOMI) was launched on board ESA's Sentinel-5 Precursor (S5P) satellite in 2017 and retrieves tropospheric O3 profiles with relatively high spatial resolution (28.8 km × 5.6 km) and vertical resolution of 10–15 km in the troposphere using UV wavelengths (270–330 nm) (Mettig et al., 2021).
Table 1Information about some of the recent UV and IR satellite sensors retrieving O3 vertical profiles in the troposphere.
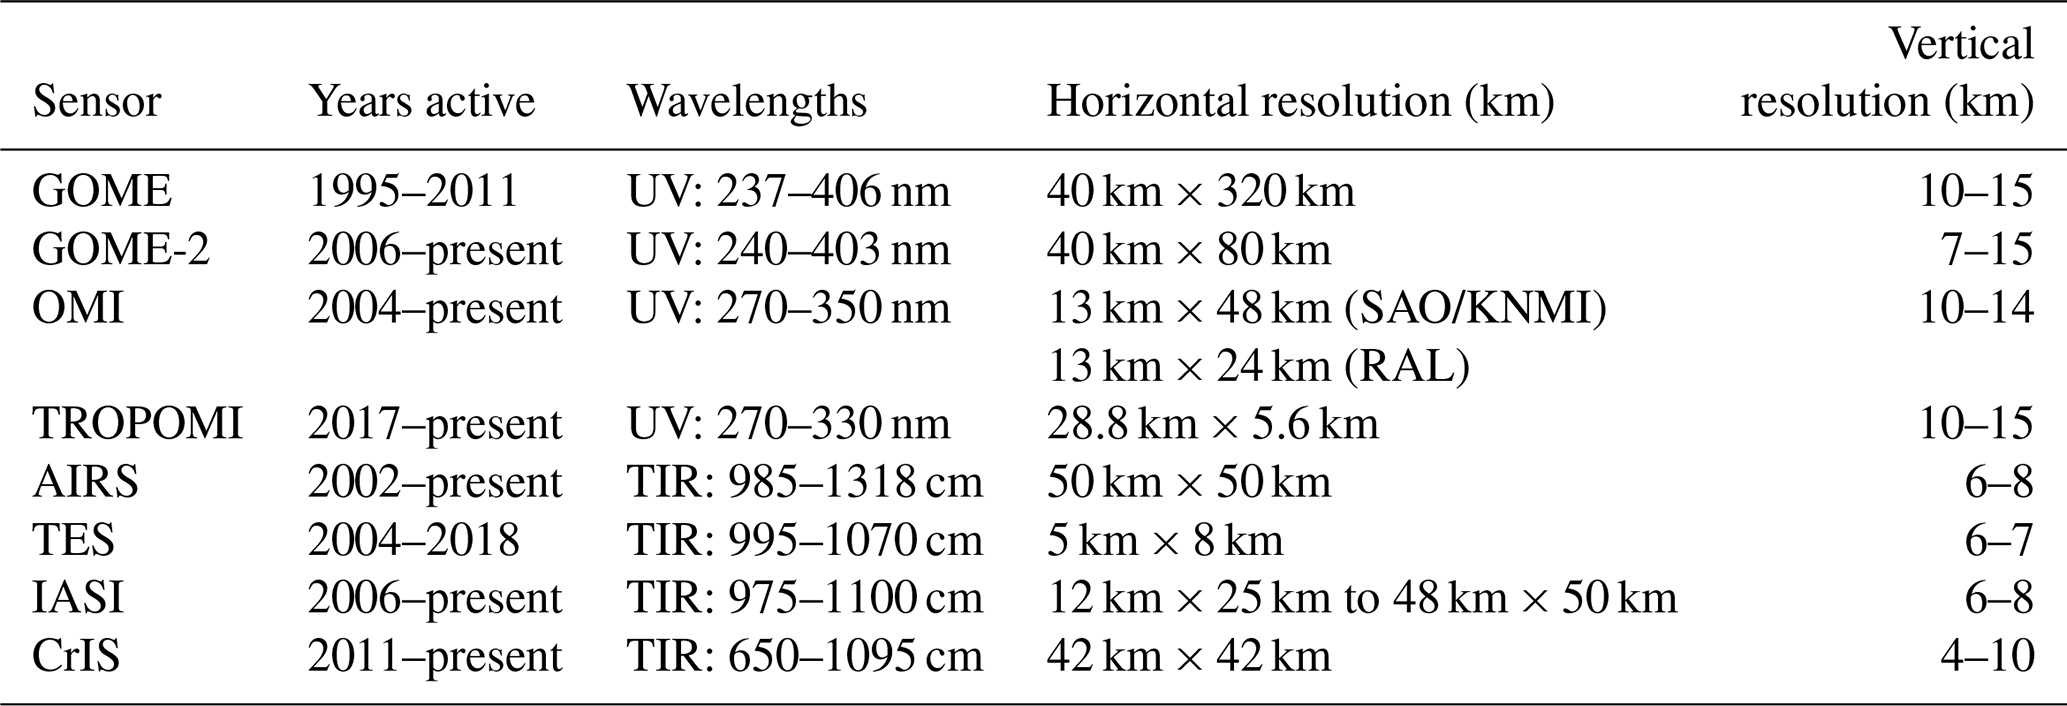
Spaceborne sensors using thermal infrared (TIR) wavelengths such as the Infrared Atmospheric Sounding Interferometer (IASI) (Clerbaux et al., 2010), Atmospheric Infrared Sounder (AIRS) (Chahine et al., 2006), Tropospheric Emission Spectrometer (TES) (Beer et al., 2001), and Cross-track Infrared Sounder (CrIS) (Ma et al., 2016) also retrieve tropospheric O3 vertical profiles. Three IASI sensors have been launched to provide continuous data from 2006 (on board MetOp-A) to the present (on board MetOp-C) using multiple algorithms applying TIR wavelengths between 975–1100 cm (Keim et al., 2009; Hurtmans et al., 2012). Tropospheric O3 vertical profiles from IASI sensors have similar spatial resolution to UV-based retrievals (from 12 km × 25 km to 48 km × 50 km) with a higher vertical resolution in the troposphere (6–8 km) compared to UV-based sensors (Boynard et al., 2009). TES, also on board NASA's Aura satellite, uses TIR wavelengths (995–1070 cm) to retrieve O3 vertical profiles with high spatial resolution (5 km × 8 km) and similar vertical resolution to IASI (6–7 km in the troposphere) (H. M. Worden et al., 2007). The NASA Aqua satellite was launched in 2002, which is the platform for the AIRS TIR sensor which retrieves O3 profiles at ∼ 50 km × 50 km spatial resolution with vertical resolution in the troposphere of 6–8 km using wavelengths between 985–1318 cm (Fu et al., 2018). The National Oceanic and Atmospheric Administration (NOAA) Suomi National Polar-orbiting Partnership (Suomi NPP) satellite, which houses CrIS, was launched in 2011 and retrieves O3 profiles in the TIR wavelengths (650–1095 cm) at 42 km × 42 km spatial resolution and vertical resolution between 4–10 km (Ma et al., 2016).
Given the higher vertical resolution of TIR retrievals compared to UV-only sensors in the troposphere, studies have been conducted to demonstrate the improvements in O3 vertical profile retrievals when combining both wavelength ranges (e.g., Natraj et al., 2011). This has been demonstrated by combining retrievals from OMI+TES (J. Worden et al., 2007; Fu et al., 2013; Colombi et al., 2021), GOME-2+IASI (Cuesta et al., 2013), and OMI+AIRS (Fu et al., 2018). Multiple recent studies have combined UV + IR wavelength retrievals from two newer satellite sensors, TROPOMI and CrIS, to retrieve tropospheric O3 vertical profiles (Mettig et al., 2022; Malina et al., 2022). The combined UV + IR TROPOMI/CrIS O3 profile retrievals from Mettig et al. (2022) were evaluated in the troposphere for a full year between 2018–2019 using a small sample (two lidar systems which are also part of the Tropospheric Ozone Lidar Network (TOLNet)) of ground-based lidar remote-sensing observations from the Network for the Detection of Atmospheric Composition Change (NDACC) and ozonesondes (i.e., World Ozone and Ultraviolet Radiation Data Centre (WOUDC) and the Southern Hemisphere Additional Ozonesondes (SHADOZ)) and demonstrated that the combined UV + IR retrievals were more consistent with observations compared to the UV-only product. Malina et al. (2022) also evaluated a full year (between 2019–2020) of combined UV + IR TROPOMI/CrIS O3 profiles using correlative satellite retrievals and ozonesondes and further showed that combined UV + IR retrievals were more accurate in the troposphere compared to UV- and IR-only products. Mettig et al. (2022) and Malina et al. (2022) both combined TROPOMI and CrIS retrievals; however, they applied different retrieval algorithms, a priori input data, and portions of the spectral bands from each satellite. The validation results thus differed to some degree, which is discussed in the current paper.
One of the primary goals of TOLNet is to validate tropospheric O3 retrievals from the recently launched NASA Tropospheric Emissions: Monitoring of Pollution (TEMPO) geostationary satellite mission (Chance et al., 2013; Zoogman et al., 2017). Demonstrating the capability of TOLNet to sufficiently validate satellite O3 profiles is vital as TOLNet is the primary validation data source for validating TEMPO O3 products in the troposphere. To date, studies validating satellite data with TOLNet have been limited to one or two individual systems, rather than using the entire network of eight lidar systems (Mettig et al., 2022; Sullivan et al., 2022). TEMPO will retrieve O3 profiles, along with partial columns, including lowermost-tropospheric (0–2 km above ground level (a.g.l.)) values, using combined UV (290–345 nm) and visible (VIS; 540–650 nm) wavelengths (Natraj et al., 2011; Chance et al., 2013; Zoogman et al., 2017). UV+VIS retrievals of O3 profiles have increased sensitivity to O3 in the lower troposphere when compared to UV-only sensors (Natraj et al., 2011; Zoogman et al., 2017). TEMPO will provide 1–2 h averaged tropospheric columns, 0–2 km partial columns, and O3 profiles at a high spatial resolution of 8.0 km × 4.5 km.
This study builds upon Mettig et al. (2022) to demonstrate the full capability of TOLNet (six of the eight systems that were available for the first year of TROPOMI observations) to validate satellite O3 retrievals at multiple vertical levels in the troposphere. This study applies all available TOLNet systems with spatial coverage throughout the United States and in the Netherlands, compared to the small subset of two lidar systems used in Mettig et al. (2022), to conduct a more robust validation of the UV-only TROPOMI, IR-only CrIS, and UV+TIR TROPOMI/CrIS O3 profile retrievals. Furthermore, the only other study to validate TROPOMI/CrIS UV + IR retrievals (Malina et al., 2022) did not apply any ground-based lidar observations. Finally, this study conducts a detailed statistical analysis of satellite O3 profile retrievals at various vertical levels of the troposphere and investigates the capability of these retrievals to reproduce anomalous atmospheric composition with large impacts on air quality (e.g., stratospheric intrusions, lowermost-troposphere pollution events), which was not conducted in past studies validating TROPOMI/CrIS UV + IR retrievals in the troposphere (Mettig et al., 2022; Malina et al., 2022). The paper is organized in the following manner: Sect. 2 describes the TOLNet data (which serve as the primary validation data set), ozonesondes, and satellite data products applied in this study; Sect. 3 presents the results of the validation; Sect. 4 discusses the overall systematic biases and random errors of the retrievals; and Sect. 5 includes the conclusions of the study.
2.1 TOLNet
TOLNet was established in 2011 and consists of eight lidar systems distributed throughout North America (Newchurch et al., 2016; https://tolnet.larc.nasa.gov/, last access: 21 April 2024). Figure 1 shows the geographic locations of the home sites for each of the lidars making up TOLNet. The primary goals of TOLNet are to provide data for (a) understanding physicochemical processes controlling tropospheric O3 concentrations and morphology, (b) evaluation of satellite profile products retrieving tropospheric O3, and (c) chemical transport and air quality model evaluation. TOLNet measurements provide high-vertical- and high-temporal-resolution data with minimal systematic bias (∼ 5 %) and sufficient precision between 0 % to 20 % depending on specific systems, the time of the day, altitude, and temporal and vertical averaging (Leblanc et al., 2016, 2018). These high-resolution observations with minimal bias and error are a desirable satellite validation data set and have been used to evaluate and better understand O3 profile retrievals (e.g., Johnson et al., 2018; Sullivan et al., 2022; Mettig et al., 2021, 2022). However, to date, the full complement of TOLNet lidars has not been used to validate satellite O3 vertical profiles.
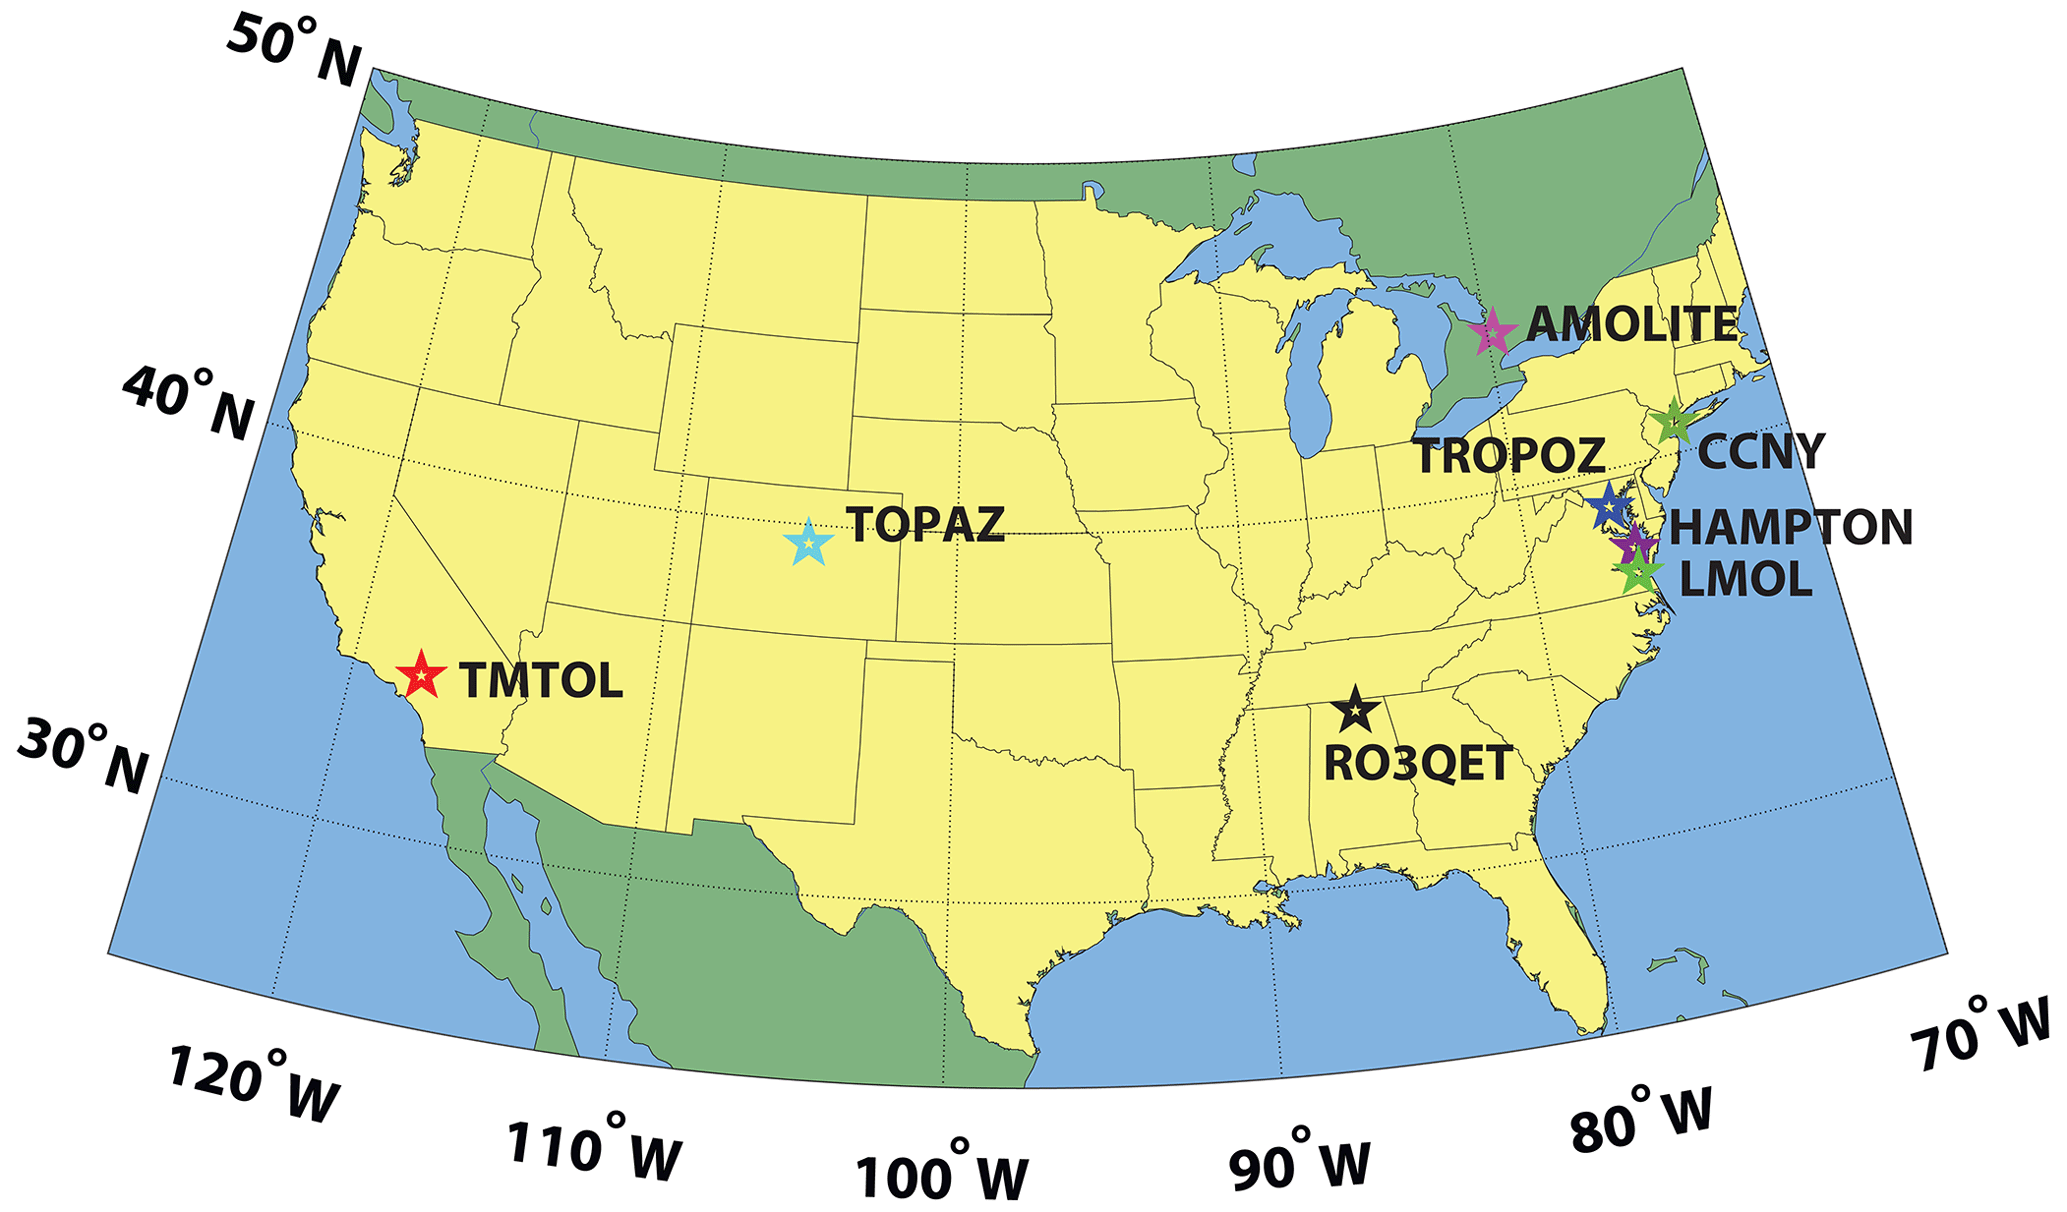
Figure 1Locations of home stations for the lidar systems of TOLNet (https://tolnet.larc.nasa.gov/, last access: 21 April 2024).
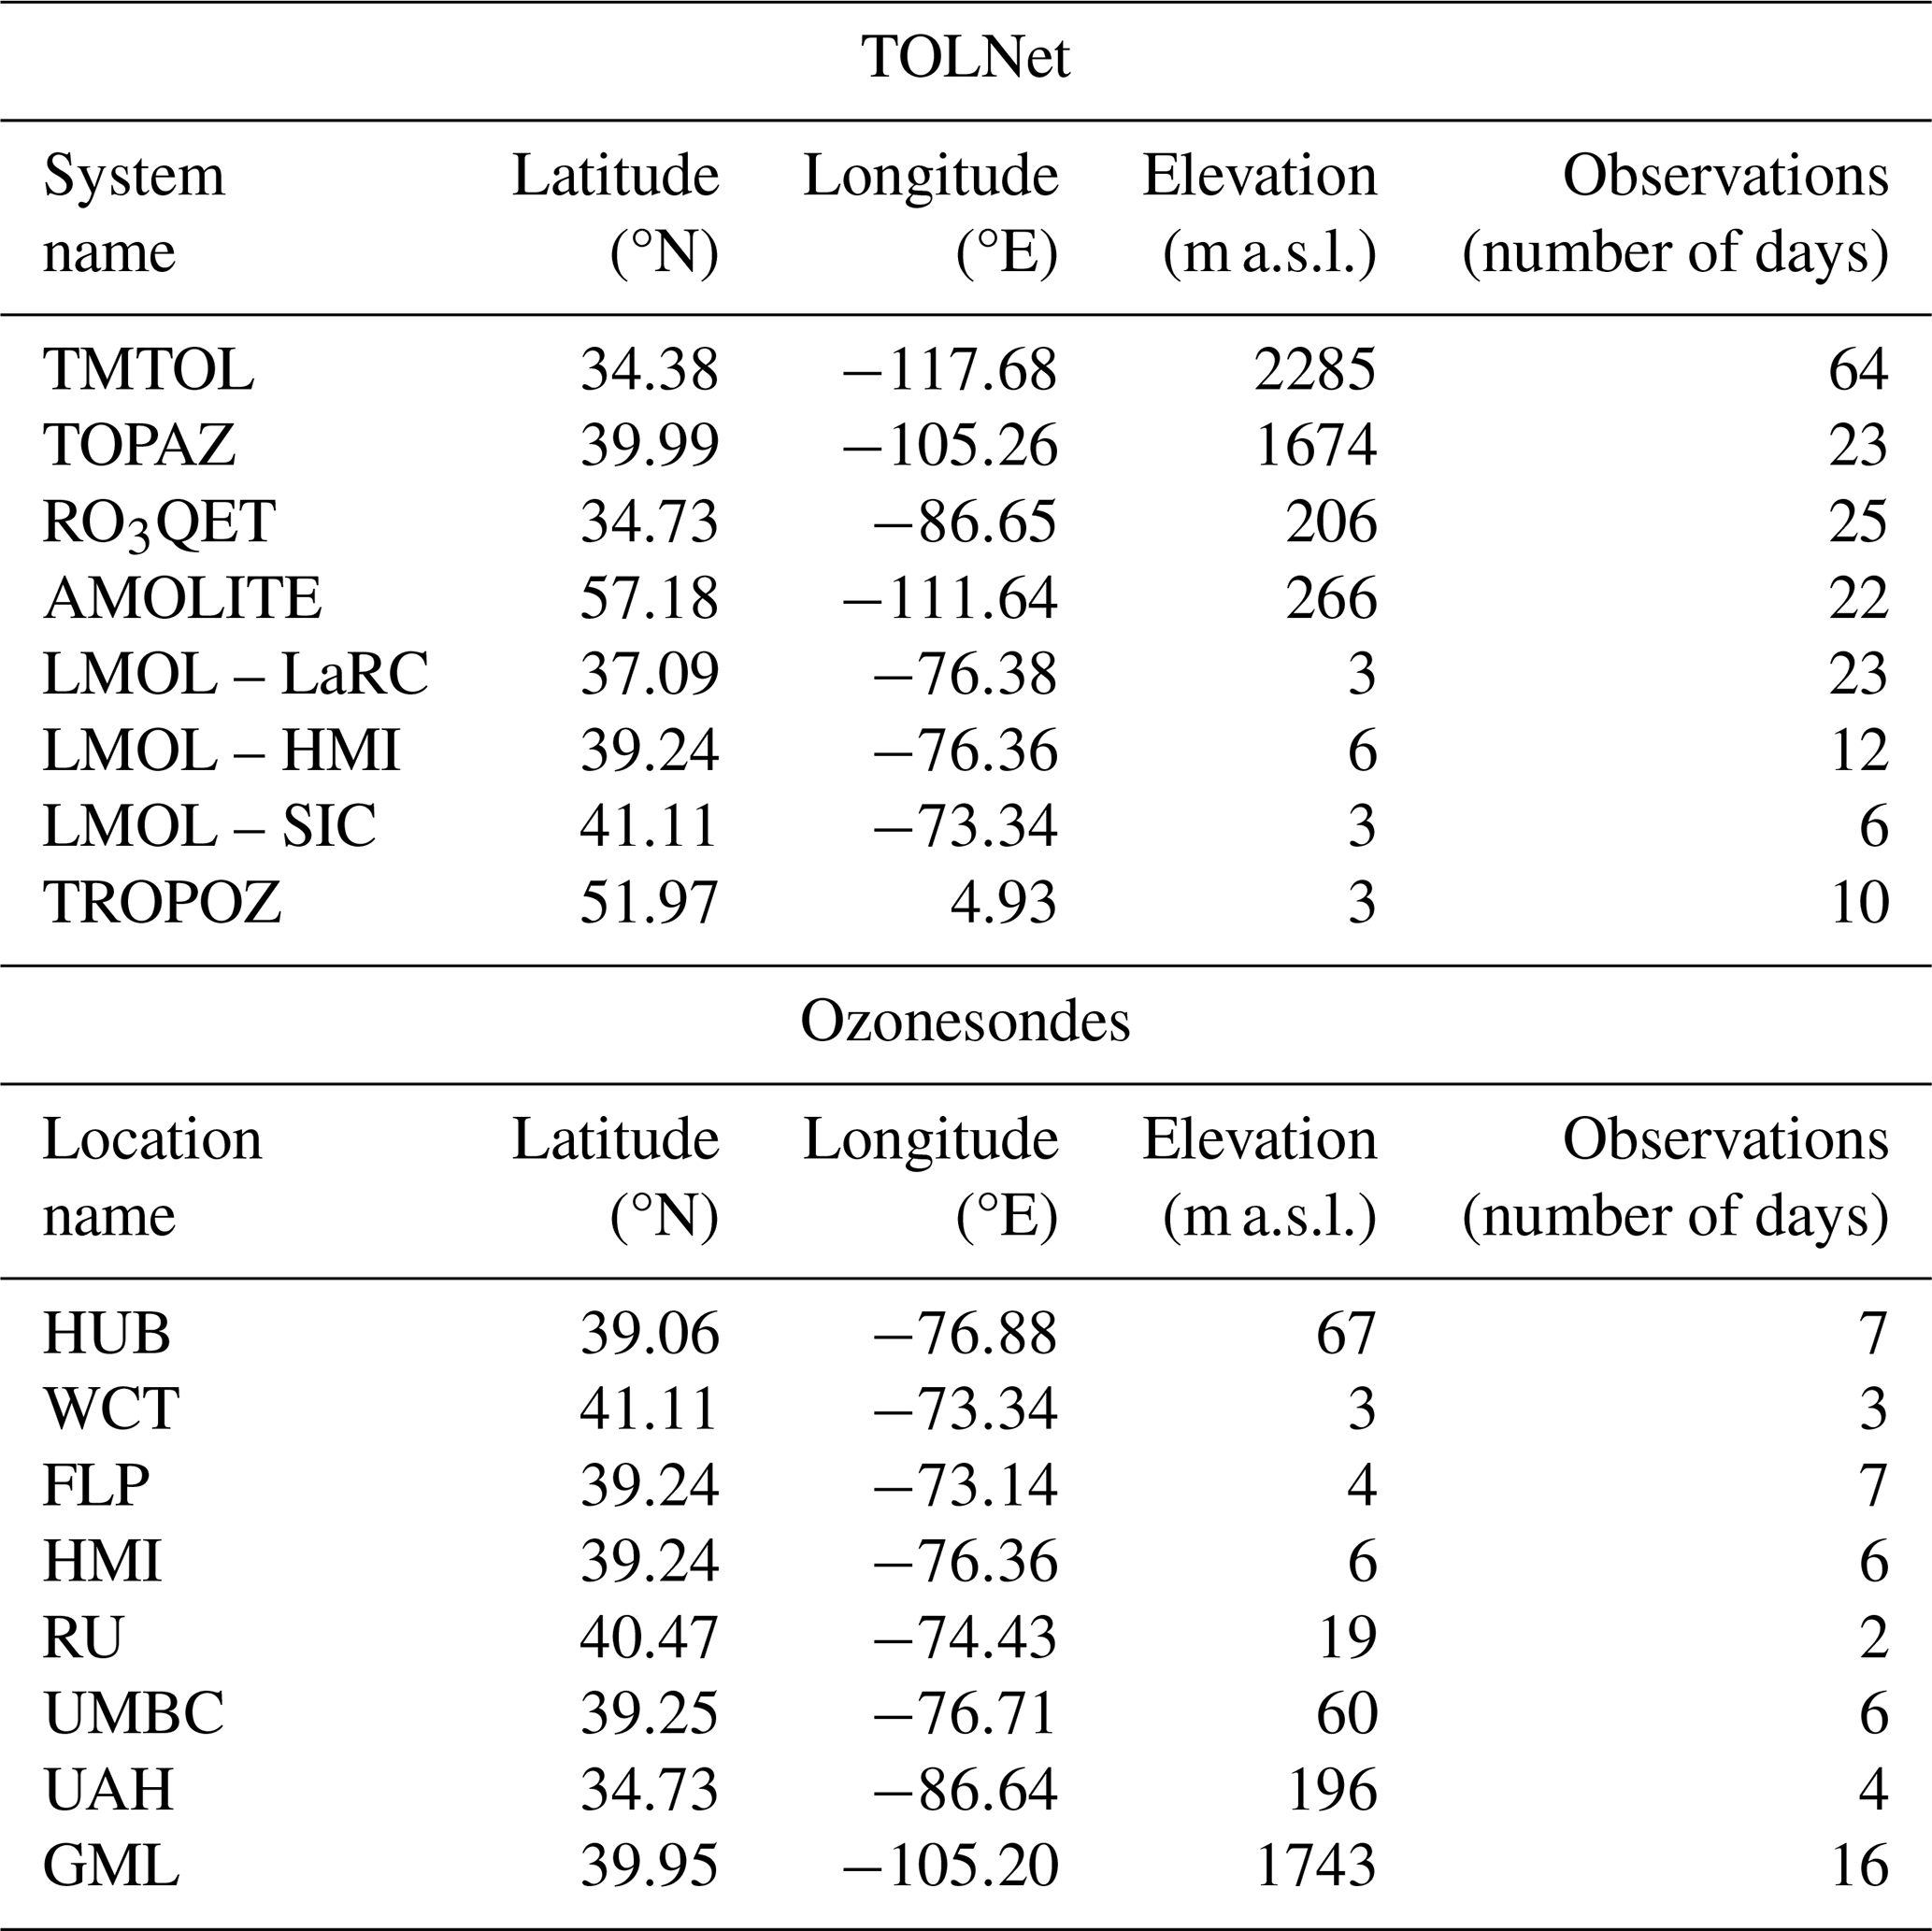
During the years just after the launch of TROPOMI, TOLNet lidar systems made dedicated observations during the overpass time of this spaceborne sensor (± 1 h) for validation (L2 CALVAL). For this study, there are a total of 185 TOLNet observations for validation during the time of TROPOMI/CrIS data availability between 2018–2019 (see details in Sect. 2.3). Differential absorption lidar (DIAL-)derived vertically resolved O3 from six of the eight TOLNet lidar systems was applied to validate UV-only TROPOMI, IR-only CrIS, and UV+TIR TROPOMI/CrIS O3 profile retrievals. Data from the following TOLNet stations were applied: (1) NASA's Jet Propulsion Laboratory (JPL) Table Mountain tropospheric ozone lidar (TMTOL) (McDermid et al., 2002), (2) the NOAA Tunable Optical Profiler for Aerosol and oZone (TOPAZ) lidar (Alvarez et al., 2011), (3) the University of Alabama in Huntsville Rocket-city O3 Quality Evaluation in the Troposphere (RO3QET) lidar (Kuang et al., 2013), (4) the Autonomous Mobile Ozone Lidar for Tropospheric Experiments (AMOLITE) (Strawbridge et al., 2018), (5) the NASA Langley Mobile Ozone Lidar (LMOL) (De Young et al., 2017; Gronoff et al., 2019; Farris et al., 2019), and (6) NASA's Goddard Space Flight Center mobile Tropospheric Ozone Lidar (TROPOZ) (Sullivan et al., 2014). Table 2 provides the basic information about these lidar systems used for validation during 2018–2019.
A portion of TOLNet systems are mobile (e.g., LMOL, TROPOZ, TOPAZ, AMOLITE, and RO3QET) and were not located solely at their home stations between 2018–2019. For instance, during the summers of 2018 and 2019, LMOL took observations at NASA's Langley Research Center, VA (LaRC), Hart Miller Island, MD (HMI), and Sherwood Island, CT (SIC). The majority of the lidar systems applied here were distributed throughout the United States, while TROPOZ was in the Netherlands based at the Cabauw Experimental Site for Atmospheric Research (CESAR) for the 2019 TROpomi vaLIdation eXperiment (TROLIX-19) campaign (Sullivan et al., 2022). TOLNet provides observations ideal for satellite validation as the lidars are located at various locations which experience variable atmospheric composition and meteorological conditions and have different viewing conditions (e.g., surface reflectivity, system altitudes, topography, solar zenith (sza) and viewing angles). The lidars also take measurements in all seasons throughout the year, providing a robust validation data set. This study includes 13, 28, 78, and 66 TOLNet observations for the winter (DJF), spring (MAM), summer (JJA), and fall (SON) months, respectively. Furthermore, the higher vertical resolution of ground-based lidars, compared to satellite profile products, make these observations ideal for validating satellite O3 profiles in the troposphere at various altitudes.
Table 2TOLNet lidar system and ozonesonde observation information between 2018–2019 used for satellite validation.
2.2 Ozonesondes
In addition to TOLNet data, ozonesonde observations from the same time period and similar locations were applied for validating satellite O3 profiles. Ozonesonde data from launches at Howard University in Beltsville, MD (HUB); Westport, CT (WCT); Flax Pond, NY (FLP); HMI; Rutgers University, NJ (RU); the University of Maryland in Baltimore Country, MD (UMBC); the University of Alabama in Huntsville, AL (UAH); and the Global Monitoring Laboratory (GML) in Boulder, CO, were applied (see Table 2). Ozonesondes have been used extensively to validate satellite O3 vertical profiles in past research (e.g., H. M. Worden et al., 2007; Kroon et al., 2011; Verstraeten et al., 2013; Huang et al., 2017; Malina et al., 2022). In addition to the fact that TOLNet lidar data have been shown to be highly accurate (Leblanc et al., 2016, 2018) as discussed above, this study intercompares the validation statistics from spatially and temporally collocated TOLNet and ozonesonde observations to demonstrate the capability of TOLNet to be used for validating satellite O3 vertical profiles. All in all, we apply 51 ozonesonde observations for validation of satellite data between 2018–2019. The seasonal distributions of these ozonesondes were 2, 2, 39, and 8 for the winter, spring, summer, and fall months, respectively. In order to have a direct comparison of the validation using ozonesonde and TOLNet, we use ozonesondes which were nearly directly spatially and temporally co-located with lidar systems, as shown in the location information provided in Table 2. Similar to TOLNet data, the ozonesondes provide high-vertical-resolution (effective resolution ∼ 100 m) O3 information with high accuracy (< 15 % below ∼ 20 km a.g.l.) (e.g., Witte et al., 2018; Sterling et al., 2018; Thompson et al., 2019) from locations distributed throughout the United States in regions which experience variable atmospheric composition, meteorological conditions, and spaceborne sensor viewing conditions.
2.3 Satellite O3 profile retrievals
This study validates O3 profiles in the troposphere retrieved with the University of Bremen Tikhonov regularised Ozone Profile retrievAl with SCIATRAN (TOPAS) algorithm, which was applied to TROPOMI UV-only, CrIS IR-only, and TROPOMI/CrIS UV + IR data (Mettig et al., 2021, 2022). Mettig et al. (2021, 2022) describe the three-step iterative TOPAS retrieval in detail, which is based on the first-order Tikhonov regularization approach (Tikhonov, 1963). Briefly, retrievals of O3 vertical profiles (xi) from the surface to 60 km a.s.l., provided in 1 km bins, are done employing Eq. (1):
where index i denotes the iteration number. Climatological a priori O3 profiles (xa) are applied in the retrieval, and the profile shapes are determined based on total O3 column abundances (Lamsal et al., 2004). A priori standard deviation is assumed to be 30 % and is accounted for in the regularization matrix (Sr) (Mettig et al., 2022) shown in Eq. (2):
where Sa is a diagonal matrix containing a priori standard deviations, is used as the zeroth-order Tikhonov term, γ is a scaling factor, and St is the first-order derivative matrix (Rodgers, 2002; Rozanov et al., 2011). The forward model Jacobian matrix (K) is needed for the linearization of the ill-posed retrieval problem. Sy is the error covariance matrix and is calculated with the fit residuals from the pre-processing step of the retrieval, which corrects for effects not accounted for in the radiative transfer model (RTM), such as the rotational Raman scattering, polarization correction, and secondary calibration (Mettig et al., 2022). For this study we apply a cloud fraction threshold of < 0.3 to avoid scenes with significant cloud coverage. Finally, atmospheric pressure and temperature profiles used in the retrieval are taken from ECMWF ERA5 model simulations (Hersbach et al., 2020). For more details about the TOPAS retrieval setup, see Table 1 of Mettig et al. (2022).
TOPAS results presented in this study are based on TROPOMI Level 1 (L1) version 2 radiances from a pre-operational validation data set and on CrIS Level 2 (L2) Community Long-term Infrared Microwave Coupled Product System (CLIMCAPS) full-spectral-resolution version 2 radiance data. The specific TOPAS product applied here has retrievals available for 12 weeks in total between July 2018 and October 2019, which overlaps with the intensive TROPOMI validation measurements made by TOLNet. The 12 weeks of data include retrievals from 2 weeks every 3 months, allowing for seasonal validation of TOPAS. Quality control is performed on each retrieval pixel before application in TOPAS, as described in detail in Mettig et al. (2021, 2022).
2.3.1 TROPOMI UV-only retrievals
TROPOMI is a nadir-viewing spectrometer which was launched in October 2017 and has an equatorial overpass time of ∼ 13:30 (local time) and a swath width of ∼ 2600 km, providing near-daily global coverage. TROPOMI makes retrievals in the UV (270–330 nm), VIS (320–500 nm), near-infrared (NIR; 675–775 nm), and shortwave infrared (SWIR; 2305–2385 nm) (Veefkind et al., 2012). The UV spectrometer has 0.5 nm spectral resolution and 0.065 nm sampling. Vertical profiles of O3 are retrieved using two bands of UV wavelengths (i.e., UV1 (270–300 nm) and UV2 (300–330 nm)) with nadir spatial resolutions of 28.8 × 5.6 km2 (cross track × along track) and 3.6 × 5.6 km2, respectively. In order to be combined with the coarser data from CrIS, TROPOMI UV retrievals are degraded to the spatial resolution of 42×42 km2. The TROPOMI TOPAS UV-only wavelength retrieval is described in detail in Mettig et al. (2021). The RTM used to simulate TROPOMI retrievals in the UV1 and UV2 wavelengths is SCIATRAN V4.5 (Rozanov et al., 2011) with the assumption of a pseudo-spherical atmosphere and O3 absorption cross sections from Serdyuchenko et al. (2014). For more details about the TROPOMI retrieval setup, see Table 2 of Mettig et al. (2022).
2.3.2 TROPOMI/CrIS UV+TIR retrievals
CrIS retrievals and combined retrievals from TROPOMI and CrIS were produced and described in detail in Mettig et al. (2022). CrIS is a Fourier-transform spectrometer launched in October 2011 and retrieves soundings in the TIR, covering the SWIR (3.92–4.64 µm), middle-wave (MWIR; 5.71–8.26 µm), and longwave infrared (LWIR; 9.14–15.38 µm) (Han et al., 2013; Strow et al., 2013) with a spectral resolution of 0.625 cm−1. Ozone retrievals from the University of Bremen algorithm use a continuous spectrum from 9350 to 9900 nm with a spectral sampling of 0.05 nm. The same RTM (SCIATRAN V4.5, Rozanov et al., 2011) is applied to model the radiances in both UV and IR ranges. It is possible to combine observations from TROPOMI and CrIS since Suomi NPP is in the same orbit as S5P, and there is only a 3 min offset in overpass times. For the O3 profiles, the CrIS field of view, consisting of 3 × 3 circular pixels, each with 14 km diameter at nadir, is combined, resulting in a spatial resolution of 42×42 km2. For more details about the CrIS retrieval setup, see Table 3 of Mettig et al. (2022).
2.4 Evaluation technique
TOPAS O3 profile retrievals using TROPOMI UV, CrIS IR, and TROPOMI/CrIS UV + IR data were evaluated using TOLNet and ozonesonde observations. The satellite retrievals were compared to raw observations and when the observations were convolved (Xc) with the averaging kernel (A) and a priori information from each retrieval using Eq. (3):
where Xa is the a priori O3 profile, Xt is the TOLNet/ozonesonde data interpolated (linear) to the vertical resolution of TOPAS, and A is the averaging kernel matrix. The TOPAS retrieval is conducted with relative deviations from Xa; therefore averaging kernel is converted appropriately as explained in Mettig et al. (2021). Statistical comparisons between co-located satellite retrievals and observations were conducted using spatiotemporal thresholds of 2.5 h and 30 km. Sensitivity studies were conducted using coarser co-location spatiotemporal thresholds of 5 h and 100 km to maximize the number of co-locations for statistical evaluation and to be more consistent with recent TROPOMI/CrIS O3 profile validation studies which use looser co-location thresholds (Mettig et al., 2021, 2022). As this study focuses on tropospheric O3, which has large spatiotemporal variability, we feel the stricter spatiotemporal thresholds are most appropriate.
To intercompare the performance of UV, IR, and UV + IR TOPAS retrievals in idealized and controlled case studies, TOLNet lidar profiles were convolved using averaging kernels and a priori profiles from each of the three retrieval types and a similar calculation as in Eq. (3), except Xt is replaced with a known TOLNet O3 profile (black lines in Fig. 4). The TOLNet profiles, which represent typical clean atmospheric conditions and events of planetary boundary layer (PBL) pollution enhancements and stratospheric intrusions, are shown in Fig. 4. The same a priori profile was used for each case to isolate the impact of the different wavelength retrieval averaging kernels. To produce the three cases, a TOLNet lidar observation from RO3QET on 3 September 2019 which is representative of clean atmospheric conditions was applied. To perturb this same O3 profile to represent a PBL enhancement and stratospheric intrusion, we multiplied the clean atmosphere TOLNet lidar profile by a factor of 1.5 at and below 3 km a.s.l. and between 8 and 18 km a.s.l., respectively. The a priori profile used in Eq. (3) was from the TOPAS retrieval on 3 September 2019.
The statistical evaluation of co-located satellite data and lidar and ozonesonde observations focused on bias; normalized mean bias (NMB; see Eq. S1), which is normalized to the magnitude of observational data convolved with retrieval averaging kernels; root mean squared error (RMSE; see Eq. S2); and simple ordinary least-squares linear regression (slope, y intercept, coefficient of determination (R2)). The evaluation was conducted for the partial column between 0–12 km to represent the troposphere. This vertical extent was chosen as these are the altitudes typically measured by TOLNet. Furthermore, since TOLNet and ozonesonde data provide the unique opportunity to evaluate satellite O3 profiles in the troposphere at various vertical levels, statistics were calculated for 2 km bins between the surface and 12 km a.s.l.
3.1 Intercomparison of the UV, IR, and UV + IR retrievals
The averaging kernel is an important aspect of satellite retrievals and illustrates the sensitivity of the satellite measurement at any altitude to the true atmosphere (Rodgers, 2002). Examples of the mean averaging kernels of all three retrievals are shown in Fig. 2. Each of the three retrievals display different total column DOFs (0–60 km a.s.l.), with UV + IR retrievals having the highest sensitivity (5.65), followed by UV-only (5.01) and IR-only (2.28) retrievals. For all the retrievals the UV-only wavelengths have the largest sensitivity to O3 in the stratosphere above 25 km. Below 20 km, in particular between 10–20 km, IR-only averaging kernels are larger by up to a factor of 2 compared to UV-only retrievals. While IR retrievals have limited sensitivities above 25 km, it greatly improves the tropospheric sensitivity of UV + IR retrievals compared to UV-only retrievals in the troposphere. While total column DOFs in UV + IR retrievals are only slightly larger compared to UV only, UV + IR retrievals have ∼ 33 % larger tropospheric DOFs (0–12 km a.s.l.) compared to UV only, as shown in Fig. 2. The increases in total column and tropospheric DOFs can be even larger than this at certain times and locations as demonstrated in Mettig et al. (2022). While all retrievals have minimal sensitivity to the lowermost troposphere (0–2 km a.s.l.), UV + IR averaging kernels have ∼ 50 % higher DOFs in the lower portion of the atmosphere compared to UV-only retrievals. A similar study applying UV + IR retrievals except from GOME-2+IASI (Cuesta et al., 2013) showed even larger increases in sensitivity in the troposphere due to the addition of IR wavelengths in comparison to TROPOMI+CrIS used in this study and Mettig et al. (2022). This demonstrates that different combinations of joint UV + IR satellite retrievals can have varying impacts on the sensitivity to O3 in the troposphere.
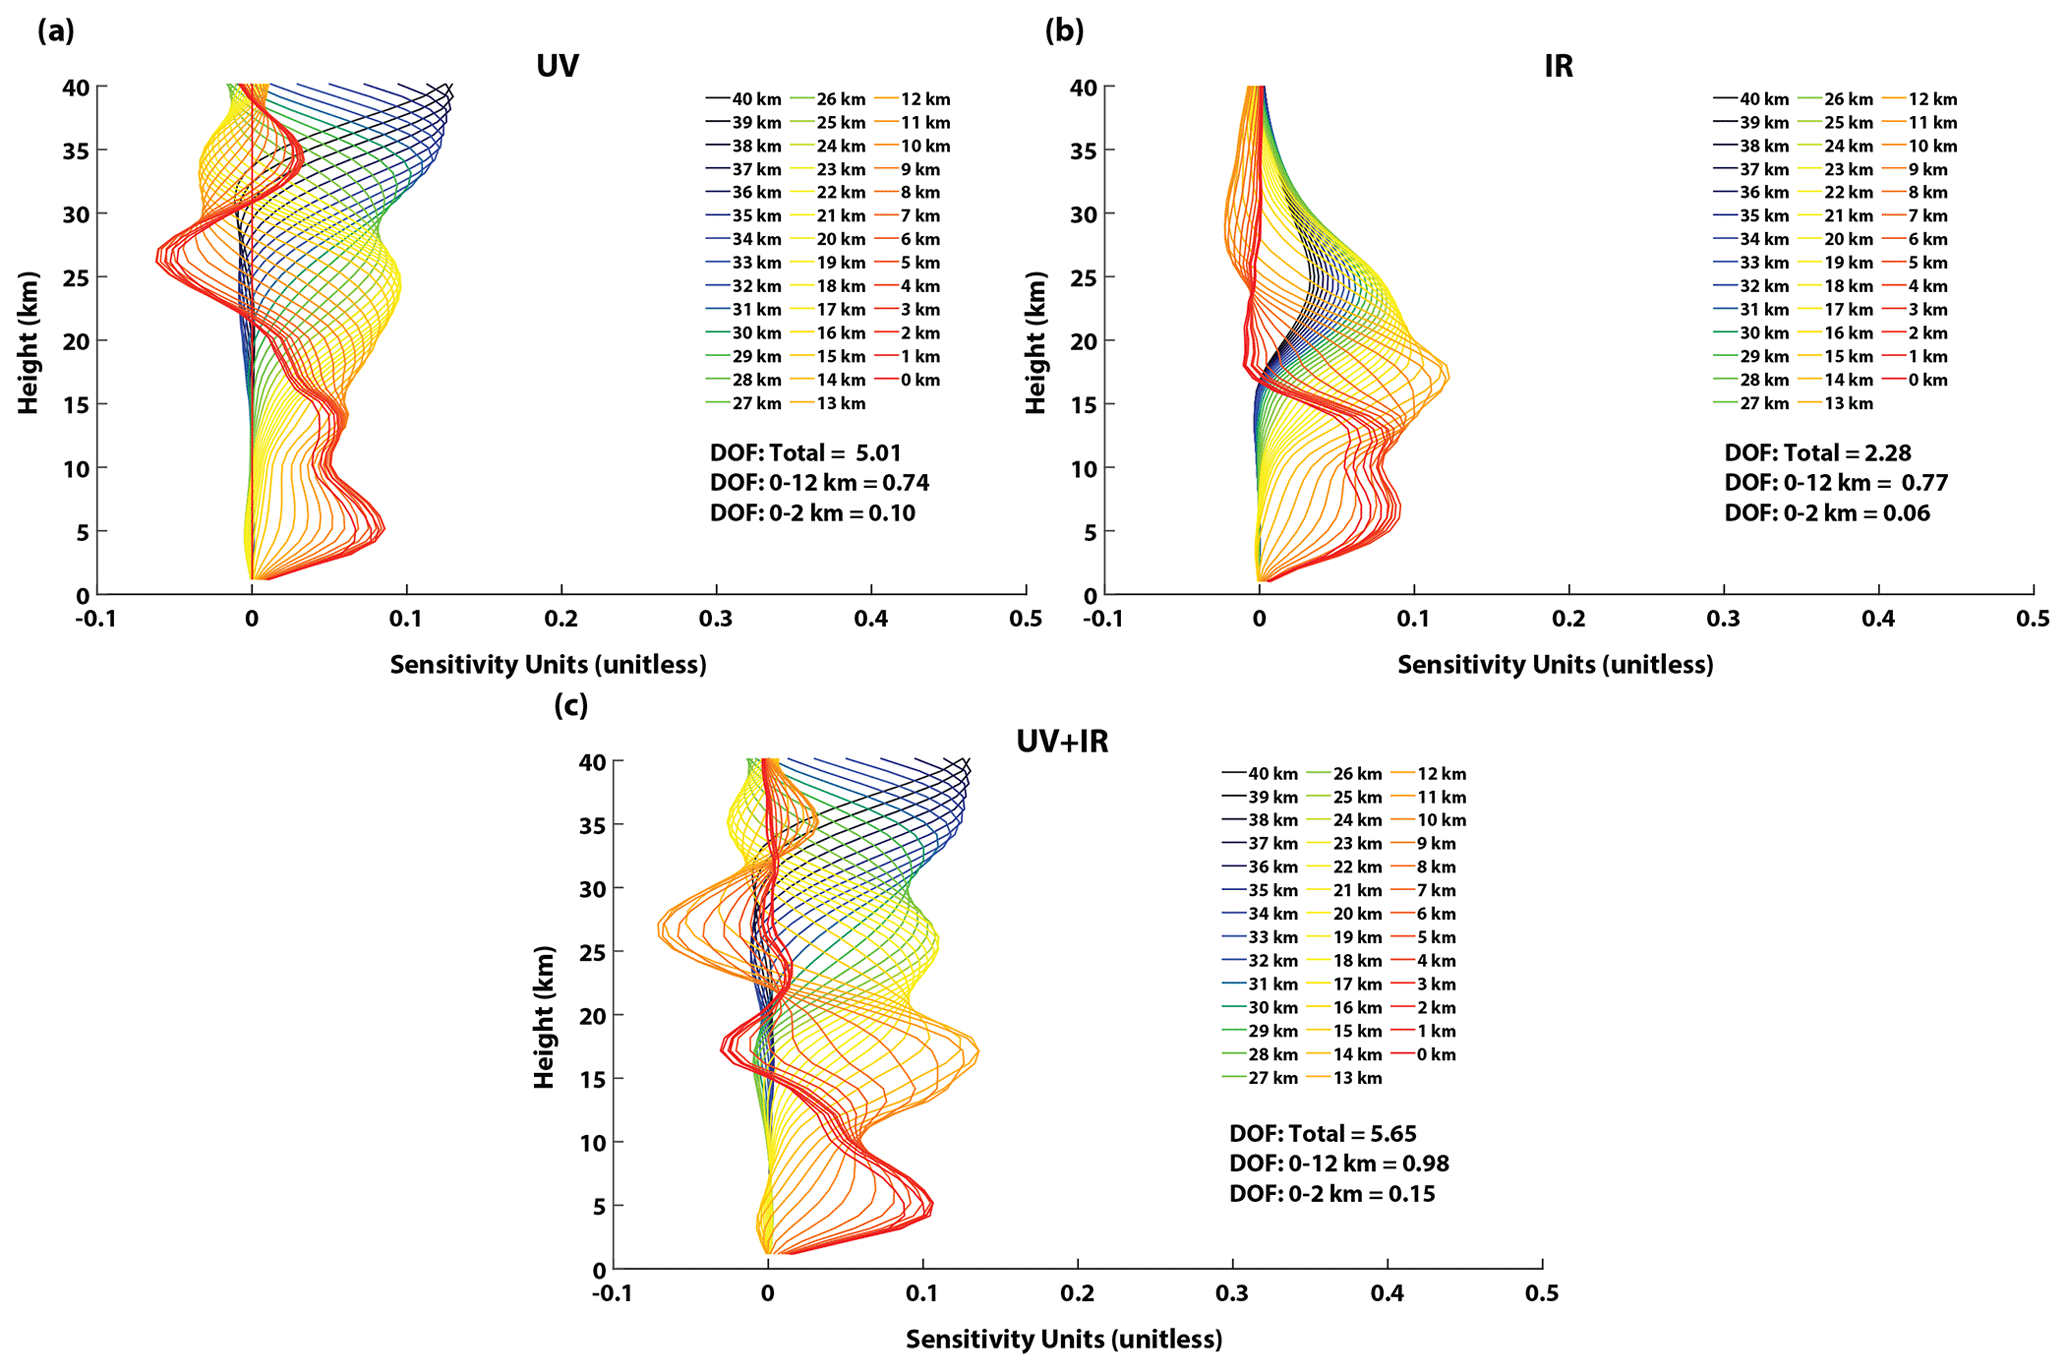
Figure 2Mean averaging kernels for all (a) UV-only, (b) IR-only, and (c) UV + IR retrievals applied in this study at the location of RO3QET (34.73° N, 86.65° W). Each line shows the averaging kernel for a particular 1 km vertical bin from the surface to 40 km a.s.l. The figure inset shows the DOF values for the entire atmosphere (total, 0–60 km), 0–12 km partial tropospheric column, and 0–2 km lowermost-tropospheric partial column.
The vertical resolution of the retrieval is calculated by the inverse of the diagonal of the averaging kernel matrix (Rodgers, 2002), and an example for each retrieval is shown in Fig. 3. UV-only retrievals have the highest vertical resolution (between 10–12 km) above 20 km in the stratosphere. Below this altitude the UV-based retrievals have decreased vertical resolution (∼ 20 km), with the coarsest resolution at altitudes around 15 and 10 km a.s.l. This suggests that UV-only O3 profiles have limited information from the retrieval in the middle to upper troposphere. IR-only retrievals have limited information above 30 km a.s.l. as vertical resolution and averaging kernel values are diminished. However, below 20 km a.s.l., IR-only retrievals have higher vertical resolution compared to UV-only data. Between 5–15 km a.s.l. IR-only retrievals have vertical resolutions as low as ∼ 12 km. When combining UV and IR information, vertical resolutions of the retrievals are improved (8–10 km) compared to IR-only retrievals above 12 km and below 8 km.
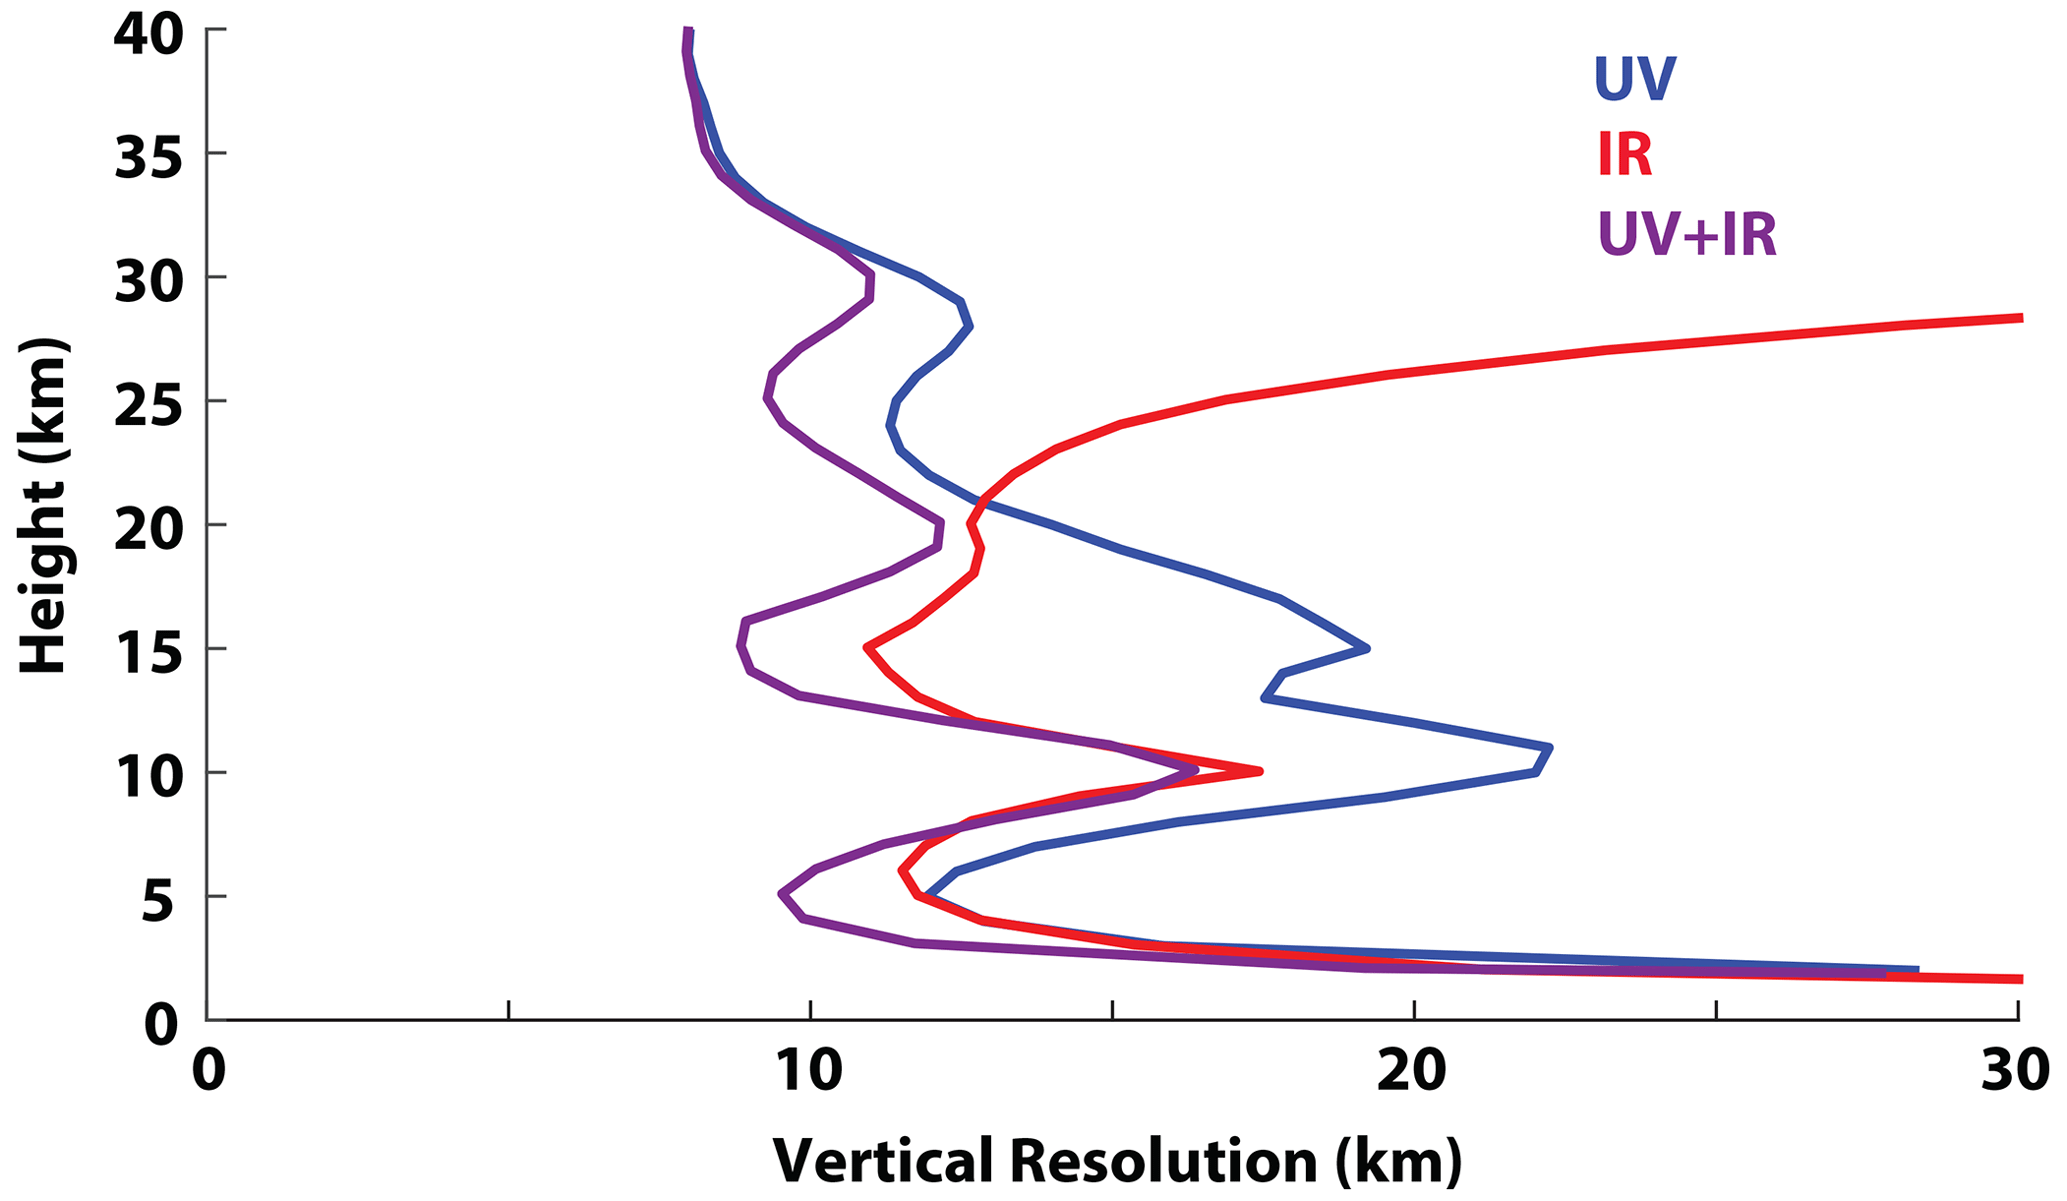
Figure 3Average vertical resolution of the UV-only (blue), IR-only (red), and UV + IR (purple) retrievals at the location of RO3QET (34.73° N, 86.65° W) for each 1 km vertical bin from the surface to 40 km a.s.l.
3.2 Intercomparison of UV, IR, and UV + IR convolved lidar profiles
To evaluate all three retrievals in idealized and controlled case studies, we produced example TOPAS retrievals by convolving known lidar profiles with each retrieval's averaging kernel and a priori profile using Eq. (3) for three scenarios: (a) background/clean conditions, (b) PBL pollution enhancement, and (c) stratospheric intrusion (see description in Sect. 2.4). The results of this intercomparison for the three case studies are shown in Fig. 4. From Fig. 4a it can be seen that despite the a priori profile having a low bias throughout the troposphere compared to the truth in the clean condition case, the true lidar profiles convolved with averaging kernels from all three retrievals are able to accurately reproduce the truth. In the partial column covering the majority of the troposphere (0–12 km a.s.l., hereinafter referred to as the tropospheric column), all example retrieval profiles have minimal biases < 3 ppb (absolute value of NMB ≤ 3 %), where the a priori profile has a low bias of ∼ −16 ppb (NMB = −27 %). This suggests that all three retrievals are able to retrieve tropospheric column O3 abundance regardless of biases in the a priori profile for typical background and clean conditions. Similar to the tropospheric column, the 0–2 km partial column (hereinafter referred to as the lowermost-tropospheric column) was well reproduced by the true lidar profile convolved by all three retrieval averaging kernels with absolute value NMBs ≤ 6 %.
It is most interesting to see how retrievals perform in physicochemical environments which differ from typical clean conditions (e.g., pollution events, stratospheric intrusions, wildfires). Figure 4b and c demonstrate whether the UV-only, IR-only, and UV + IR retrievals were able to replicate tropospheric and lowermost-tropospheric O3 during a PBL pollution event and a stratospheric intrusion, respectively. For the PBL O3 enhancement case, results of the convolution of the known lidar profiles with averaging kernels from UV-only, IR-only, and UV + IR wavelength retrievals were similar to those for clean conditions with only slightly larger values. This small adjustment is due to these retrievals having minimal sensitivity in the lowermost troposphere. For all example retrievals, low biases in the lowermost troposphere of ∼ −40 % were seen. Regardless of the inability of the retrievals to fully capture the PBL O3 enhancement, tropospheric column biases for all true lidar profiles representative of the three retrievals had absolute values ≤ 13 %. Overall, in comparison to the a priori profile, the three example retrievals result in smaller biases throughout the troposphere. This suggests that the retrievals provide some information for studying large pollution events; however, the limited sensitivity to the lowermost troposphere largely limits these retrievals.
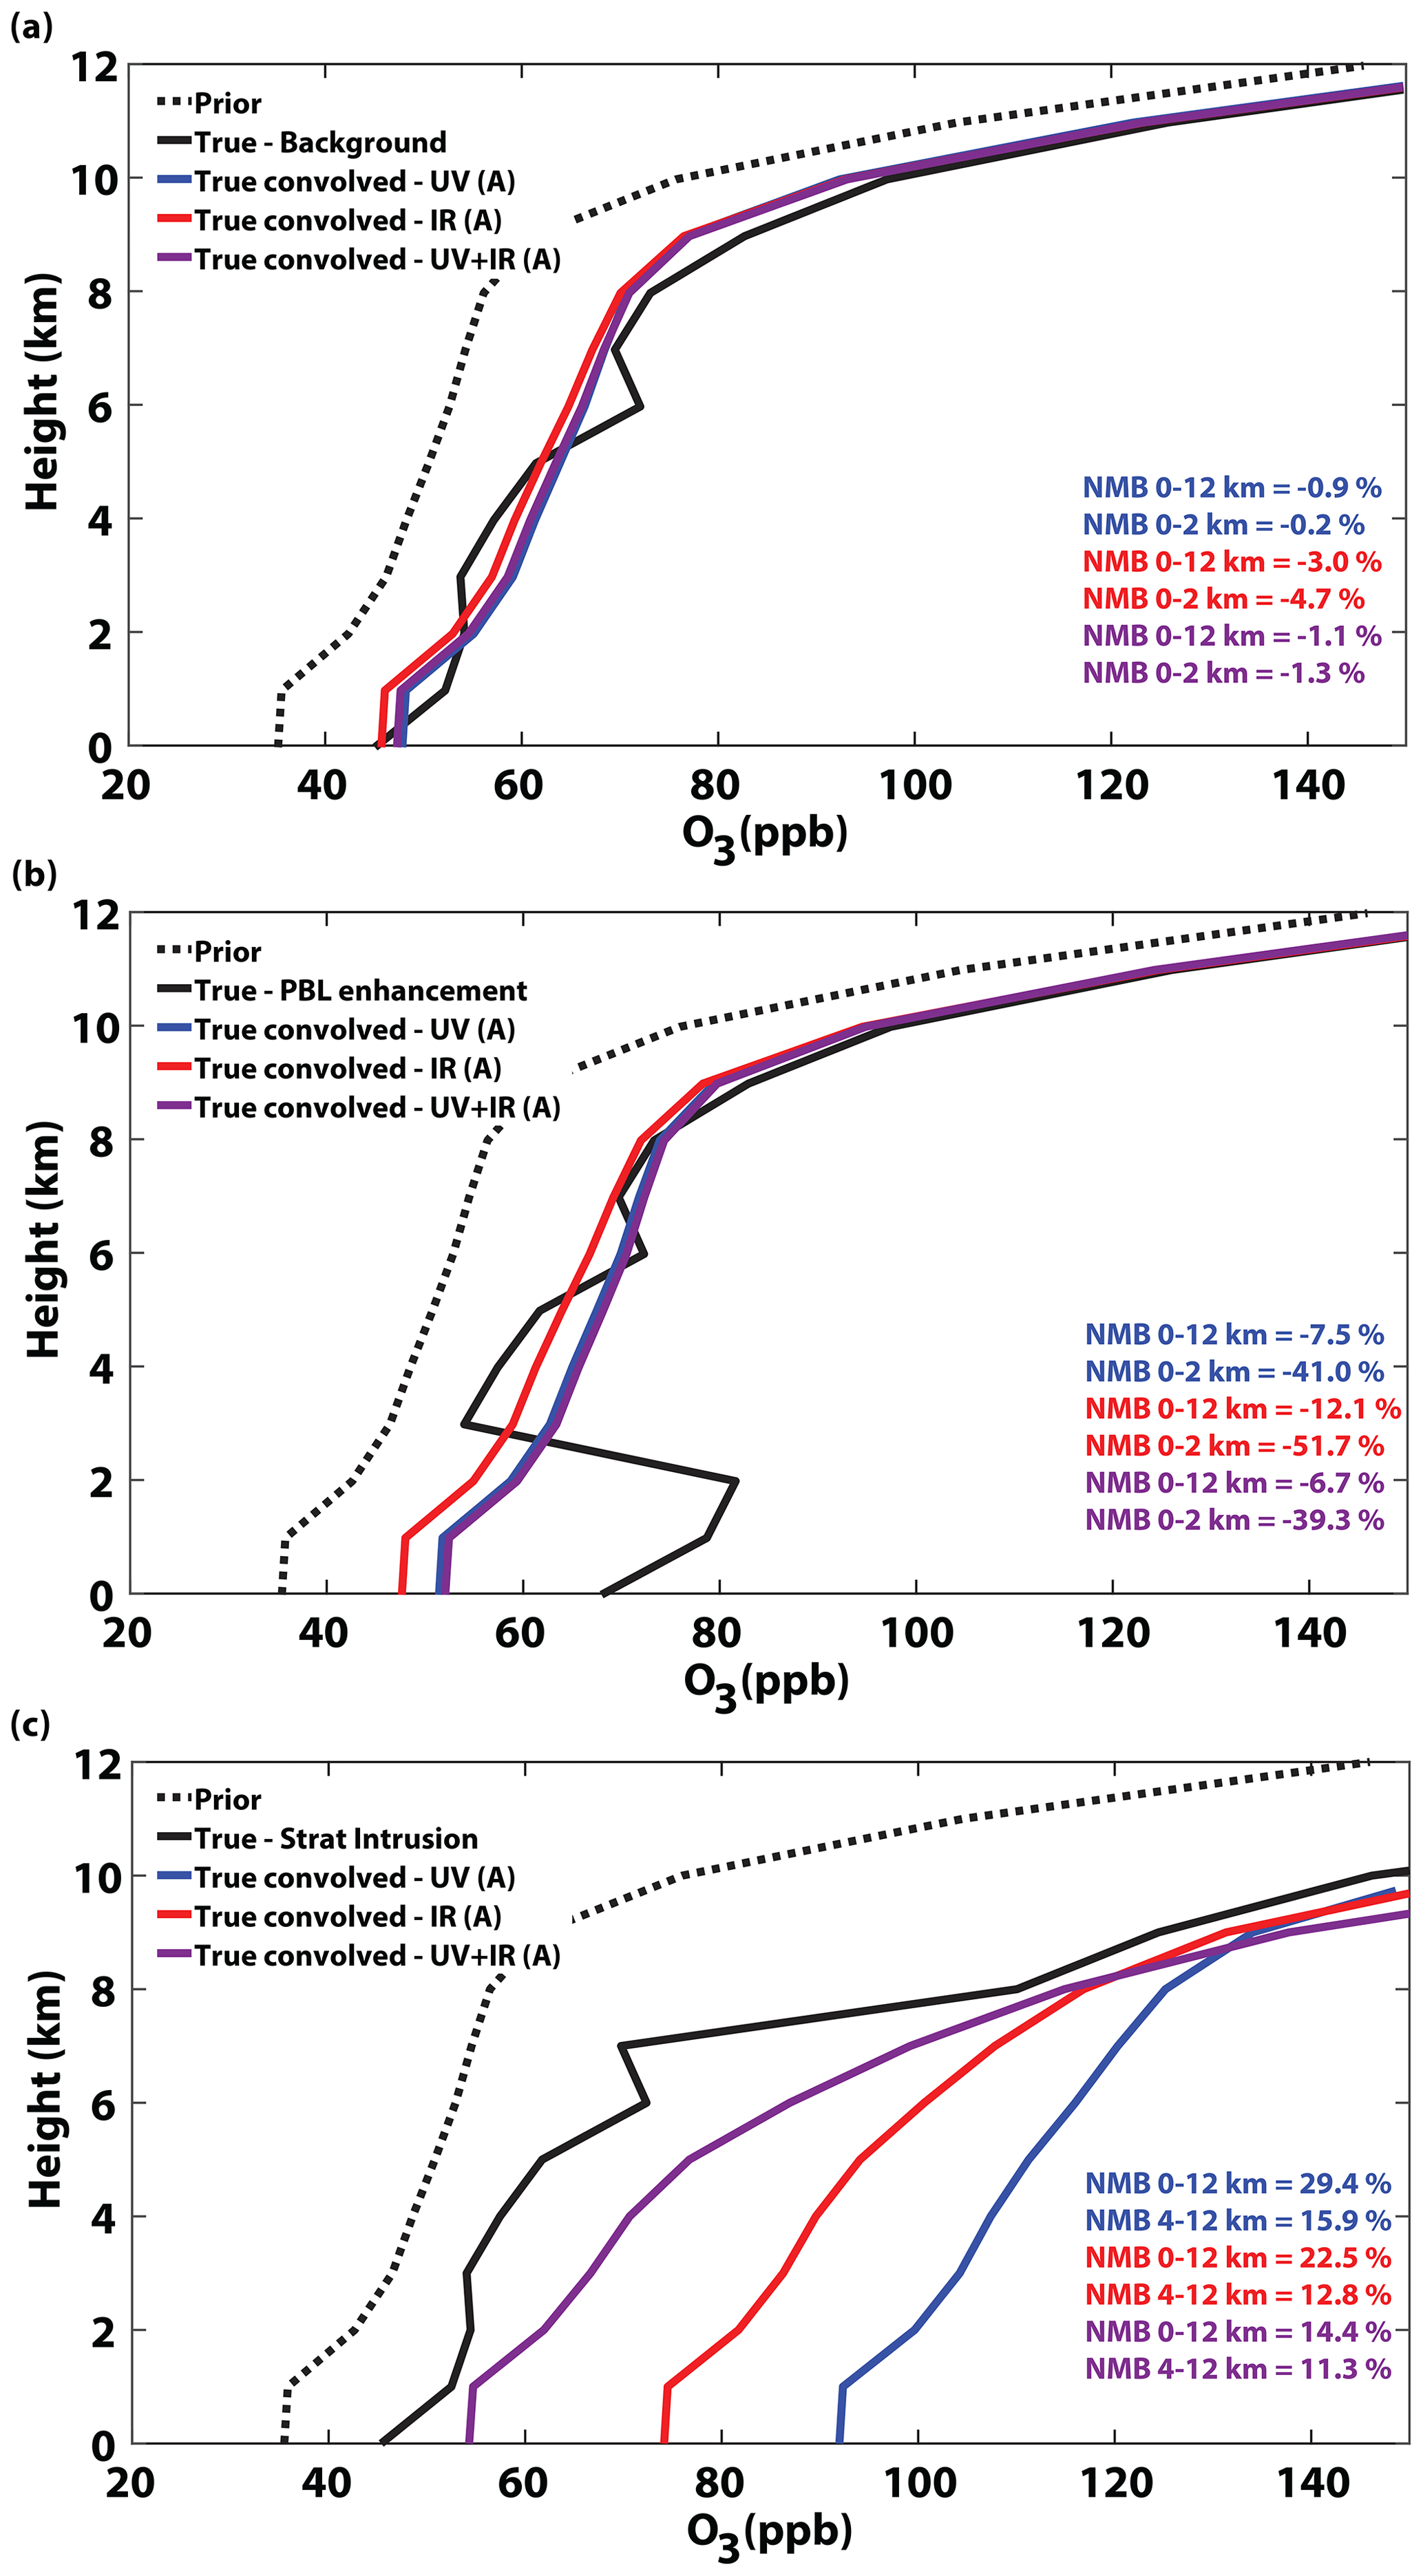
Figure 4Example TOPAS retrievals produced from TOLNet lidar profiles convolved with averaging kernels and a priori profiles (identified by (A)) from UV-only (blue), IR-only (red), and UV + IR (purple) retrievals at the location of RO3QET (34.73° N, 86.65° W) from the surface to 40 km a.s.l. for the case studies of (a) clean/background conditions, (b) PBL pollution enhancement, and (c) stratospheric intrusion. The figure inset shows the normalized mean bias (NMB) percent for the 0–12 tropospheric, 0–2 lowermost tropospheric (Fig. 4b), and mid- to upper-tropospheric (4–12 km, Fig. 4c) partial columns. The reference used to calculate the NMB is the “true” atmospheric state provided by the TOLNet observations.
For a stratospheric intrusion, the true lidar profiles convolved with retrieval averaging kernels had high biases compared to the truth throughout the troposphere (see Fig. 4c). The large O3 concentrations in the middle to upper troposphere, where all three retrievals have some sensitivity to the true atmosphere, result in NMBs between 14.4 % and 47.2 % for tropospheric columns. Regardless of the high biases in the convolved lidar profiles, they still evaluate better for tropospheric column abundances compared to the a priori, which had an NMB = −51.2 %. Compared to the truth, the example UV + IR retrievals replicate these dynamic O3 profiles throughout the troposphere with the most skill. In the middle to upper troposphere (4–12 km), UV + IR retrievals had the least high bias (NMB) of 11.3 %, while IR-only (12.8 %) and UV-only (15.9 %) retrievals had larger high biases. Compared to the a priori, true lidar profiles convolved with all three retrieval averaging kernels, compared much more accurately emphasizing the ability of these retrievals to capture enhanced mid- to upper-tropospheric O3 enhancements. Only the UV + IR example retrieval was able to replicate lowermost-tropospheric O3 (NMB = 10.9 %) better compared to the a priori (NMB = −33.9 %). This sensitivity study suggests that retrievals other than UV + IR data may be challenged to accurately observe O3 profiles throughout the entire tropospheric column during times of enhanced middle- and upper-tropospheric O3 concentrations.
This analysis of complex atmospheric environments using idealized retrievals, produced with known O3 profiles convolved separately with different retrieval averaging kernels, in this study expands on past studies that have evaluated TROPOMI/CrIS retrievals (Mettig et al., 2022; Malina et al., 2022). It is important to understand the extent to which TROPOMI, CrIS, and TROPOMI/CrIS joint satellite retrievals, which rely on different wavelengths, can accurately retrieve typical and anomalous structures of O3 in the troposphere.
3.3 Validation of TOPAS UV-only, IR-only, and UV + IR retrievals
3.3.1 Mean vertical O3 profile validation
TOLNet convolved with each retrieval's averaging kernel and a priori (observation operator) was the primary data set used to validate satellite retrievals of O3 vertical profiles. Figure 5 shows the comparison of the three vertical O3 profile satellite retrievals to co-located TOLNet observations at the location of all six lidars between 2018–2019 (statistics in Table 3). The validation with TOLNet convolved with TOPAS retrieval averaging kernels (hereinafter TOLNet-A) demonstrates that the TROPOMI UV-only retrieval meets the defined systematic bias requirement of ± 30% (ESA, 2014) throughout the troposphere. The CrIS IR-only retrieval of O3 profiles meets the systematic bias threshold requirement of ± 10 % defined for this spaceborne sensor (JPSS, 2019) from the surface to ∼ 10 km a.s.l. However, above 10 km a.s.l. the CrIS IR-only retrievals exceeded the systematic bias requirement threshold. The combined UV + IR retrievals consistently have NMB values lower than ± 10 % at all altitudes in the troposphere. All three retrievals generally evaluated more consistently to lidar observations compared to the a priori profiles, suggesting that the satellite O3 profiles provide useful information for studying tropospheric composition.
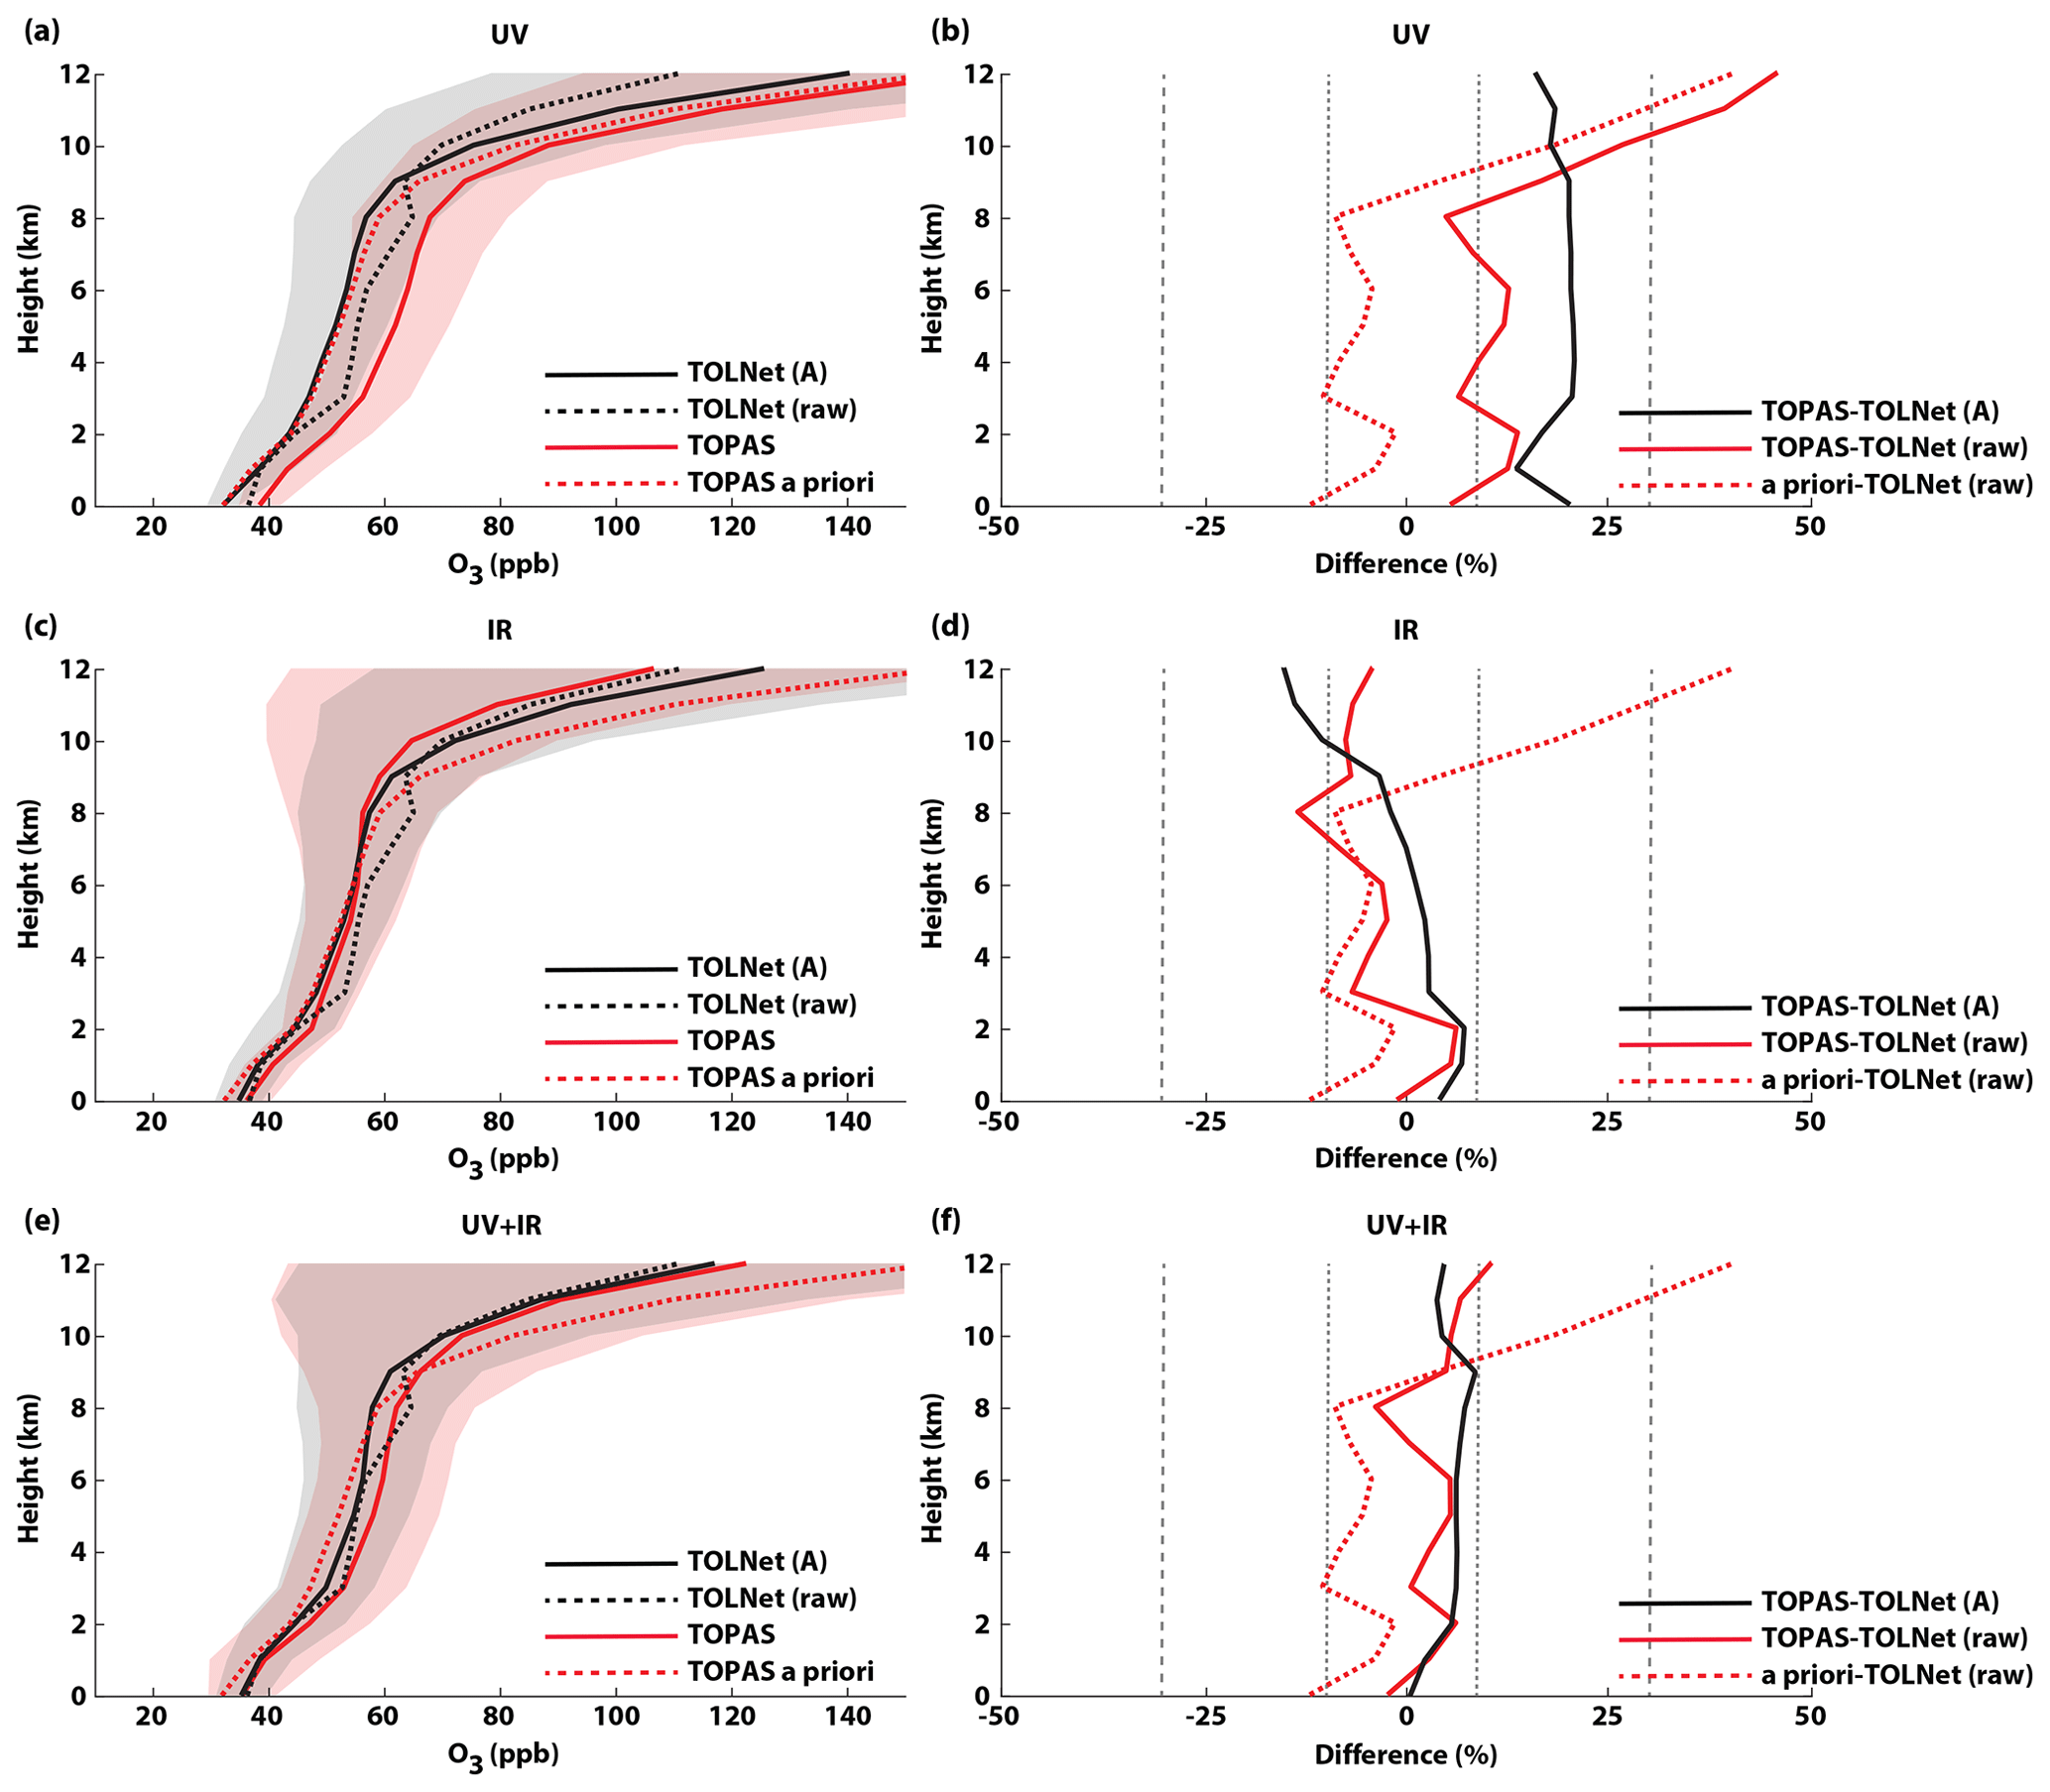
Figure 5Vertical O3 profile comparison of TOLNet interpolated to the satellite vertical grid (TOLNet-raw); TOLNet convolved with the TOPAS averaging kernel (TOLNet-A); UV, IR, and UV + IR TOPAS satellite retrievals; and the a priori profile information used in the TOPAS retrieval (total number of co-locations (N) = 89). The direct comparison of the profiles and percent difference, displayed as normalized mean bias (NMB), for UV-only (a, b), IR-only (c, d), and UV + IR (e, f) retrievals are displayed. The NMBs between TOPAS satellite retrievals and TOLNet-A and TOLNet-raw used as the references are labeled TOPAS-TOLNet (A) and TOPAS-TOLNet (raw), respectively. The grey- and pink-shaded regions illustrate the 1σ standard deviation of TOLNet-A and satellite O3 vertical profiles, respectively. NMB values of 30 % and 10 % are displayed using dashed and dotted grey lines, respectively.
The RMSE values in Table 3 represent the random errors in the daily TOPAS O3 profile retrievals when validated with TOLNet-A observations. While systematic biases were significantly reduced in the three retrievals compared to the a priori profiles, random errors still remained elevated in most instances. UV-only retrievals had unresolved errors ∼ 35 % less compared to the a priori. However, the average RMSE values for this retrieval product still remained large (∼ 17 ppb) throughout the troposphere (compared to ∼ 27 ppb for the a priori). IR-only retrievals displayed the least unresolved errors of all three retrievals, with average RMSE values throughout the troposphere of ∼ 10.5 ppb, which is ∼ 60% less compared to the a priori. The combined UV + IR profiles had average RMSE values of ∼ 14 ppb, ∼ 50 % less compared to the a priori, throughout the troposphere. The fact that unresolved errors are reduced in all three retrievals compared to the a priori further emphasizes that satellite O3 profiles can provide useful information in the troposphere. However, given that unresolved errors of daily profiles on average still remain large (> 10 ppb), the accuracy of these satellite products still suffers due to the limited sensitivity of spaceborne sensors to tropospheric O3. These RMSE values calculated with TOLNet-A are similar in magnitude to those derived using ozonesonde data to validate TROPOMI/CrIS retrievals in Malina et al. (2022) in the troposphere (at 681 mb). Overall, the improvement in tropospheric O3 retrievals from IR-only and joint UV + IR retrievals compared to UV-only determined through the validation with TOLNet agrees with many recent studies (e.g., Landgraf and Hasekamp, 2007; J. Worden et al., 2007; Cuesta et al., 2013, 2018; Costantino et al., 2017; Colombi et al., 2021; Malina et al., 2022; Mettig et al., 2022).
While observations convolved with the observation operator is the primary validation data source, comparing the three retrievals to TOLNet observations not convolved with the retrieval averaging kernels (hereinafter TOLNet-raw) is also important to understand how the satellite retrievals reproduce actual atmospheric composition in the troposphere. The comparison of TOPAS retrievals and TOLNet-raw suggests that the TROPOMI UV-only data have NMBs lower than ± 15 % at all altitudes below 10 km a.s.l. with high biases > 30 % between 10–12 km a.s.l. A general low bias in IR-only profiles compared to TOLNet-raw is determined below 12 km a.s.l. (NMB typically between −5 % and −15 %), except for ∼ 2 km a.s.l. where a slight high bias is calculated. The combined UV + IR retrievals compare most closely to TOLNet-raw observations, with NMBs lower than ± 10 % at all altitudes. Overall, the IR-only and UV + IR satellite retrieval products evaluate more favorably to TOLNet-A data compared to TOLNet-raw. However, UV-only profiles have higher biases when evaluated with TOLNet-A data compared to TOLNet-raw below 10 km a.s.l. To have a more consistent validation of the three O3 profile retrievals, we used TOLNet-A throughout the rest of the study.
In the troposphere, the UV-only retrievals are consistently biased high (NMB = 15 %–20 %) compared to TOLNet-A data (see Fig. 5a, b; Table 3). The systematic high bias determined in this study agrees with the recent TOPAS validation study by Mettig et al. (2022) and the validation of TROPOMI/CrIS in Malina et al. (2022). Due to Rayleigh scattering, UV-only retrievals are the most sensitive to the stratosphere and limited in the troposphere (Chance et al., 1997). IR-only O3 profiles have a small high bias in the lowest 8 km a.s.l. and a systematic low bias up to −12 % above this altitude. This low bias in the middle to upper troposphere determined in this study agrees with the recent work by Mettig et al. (2022) and to a lesser extent with that found in Malina et al. (2022). Finally, the UV + IR retrievals have minimal bias throughout the troposphere, with NMB values ranging from 1 % to 8 %, demonstrating minimal dependance on altitude, which also agrees with past TROPOMI/CrIS validation studies (Mettig et al., 2022; Malina et al., 2022). The agreement in the validation statistics of TROPOMI UV, CrIS IR, and TROPOMI/CrIS UV + IR retrievals determined in this study when using TOLNet-A and those using primarily ozonesonde data (Mettig et al., 2022; Malina et al., 2022) demonstrates that TOLNet is a sufficient validation source for satellite O3 profile retrievals in the troposphere.
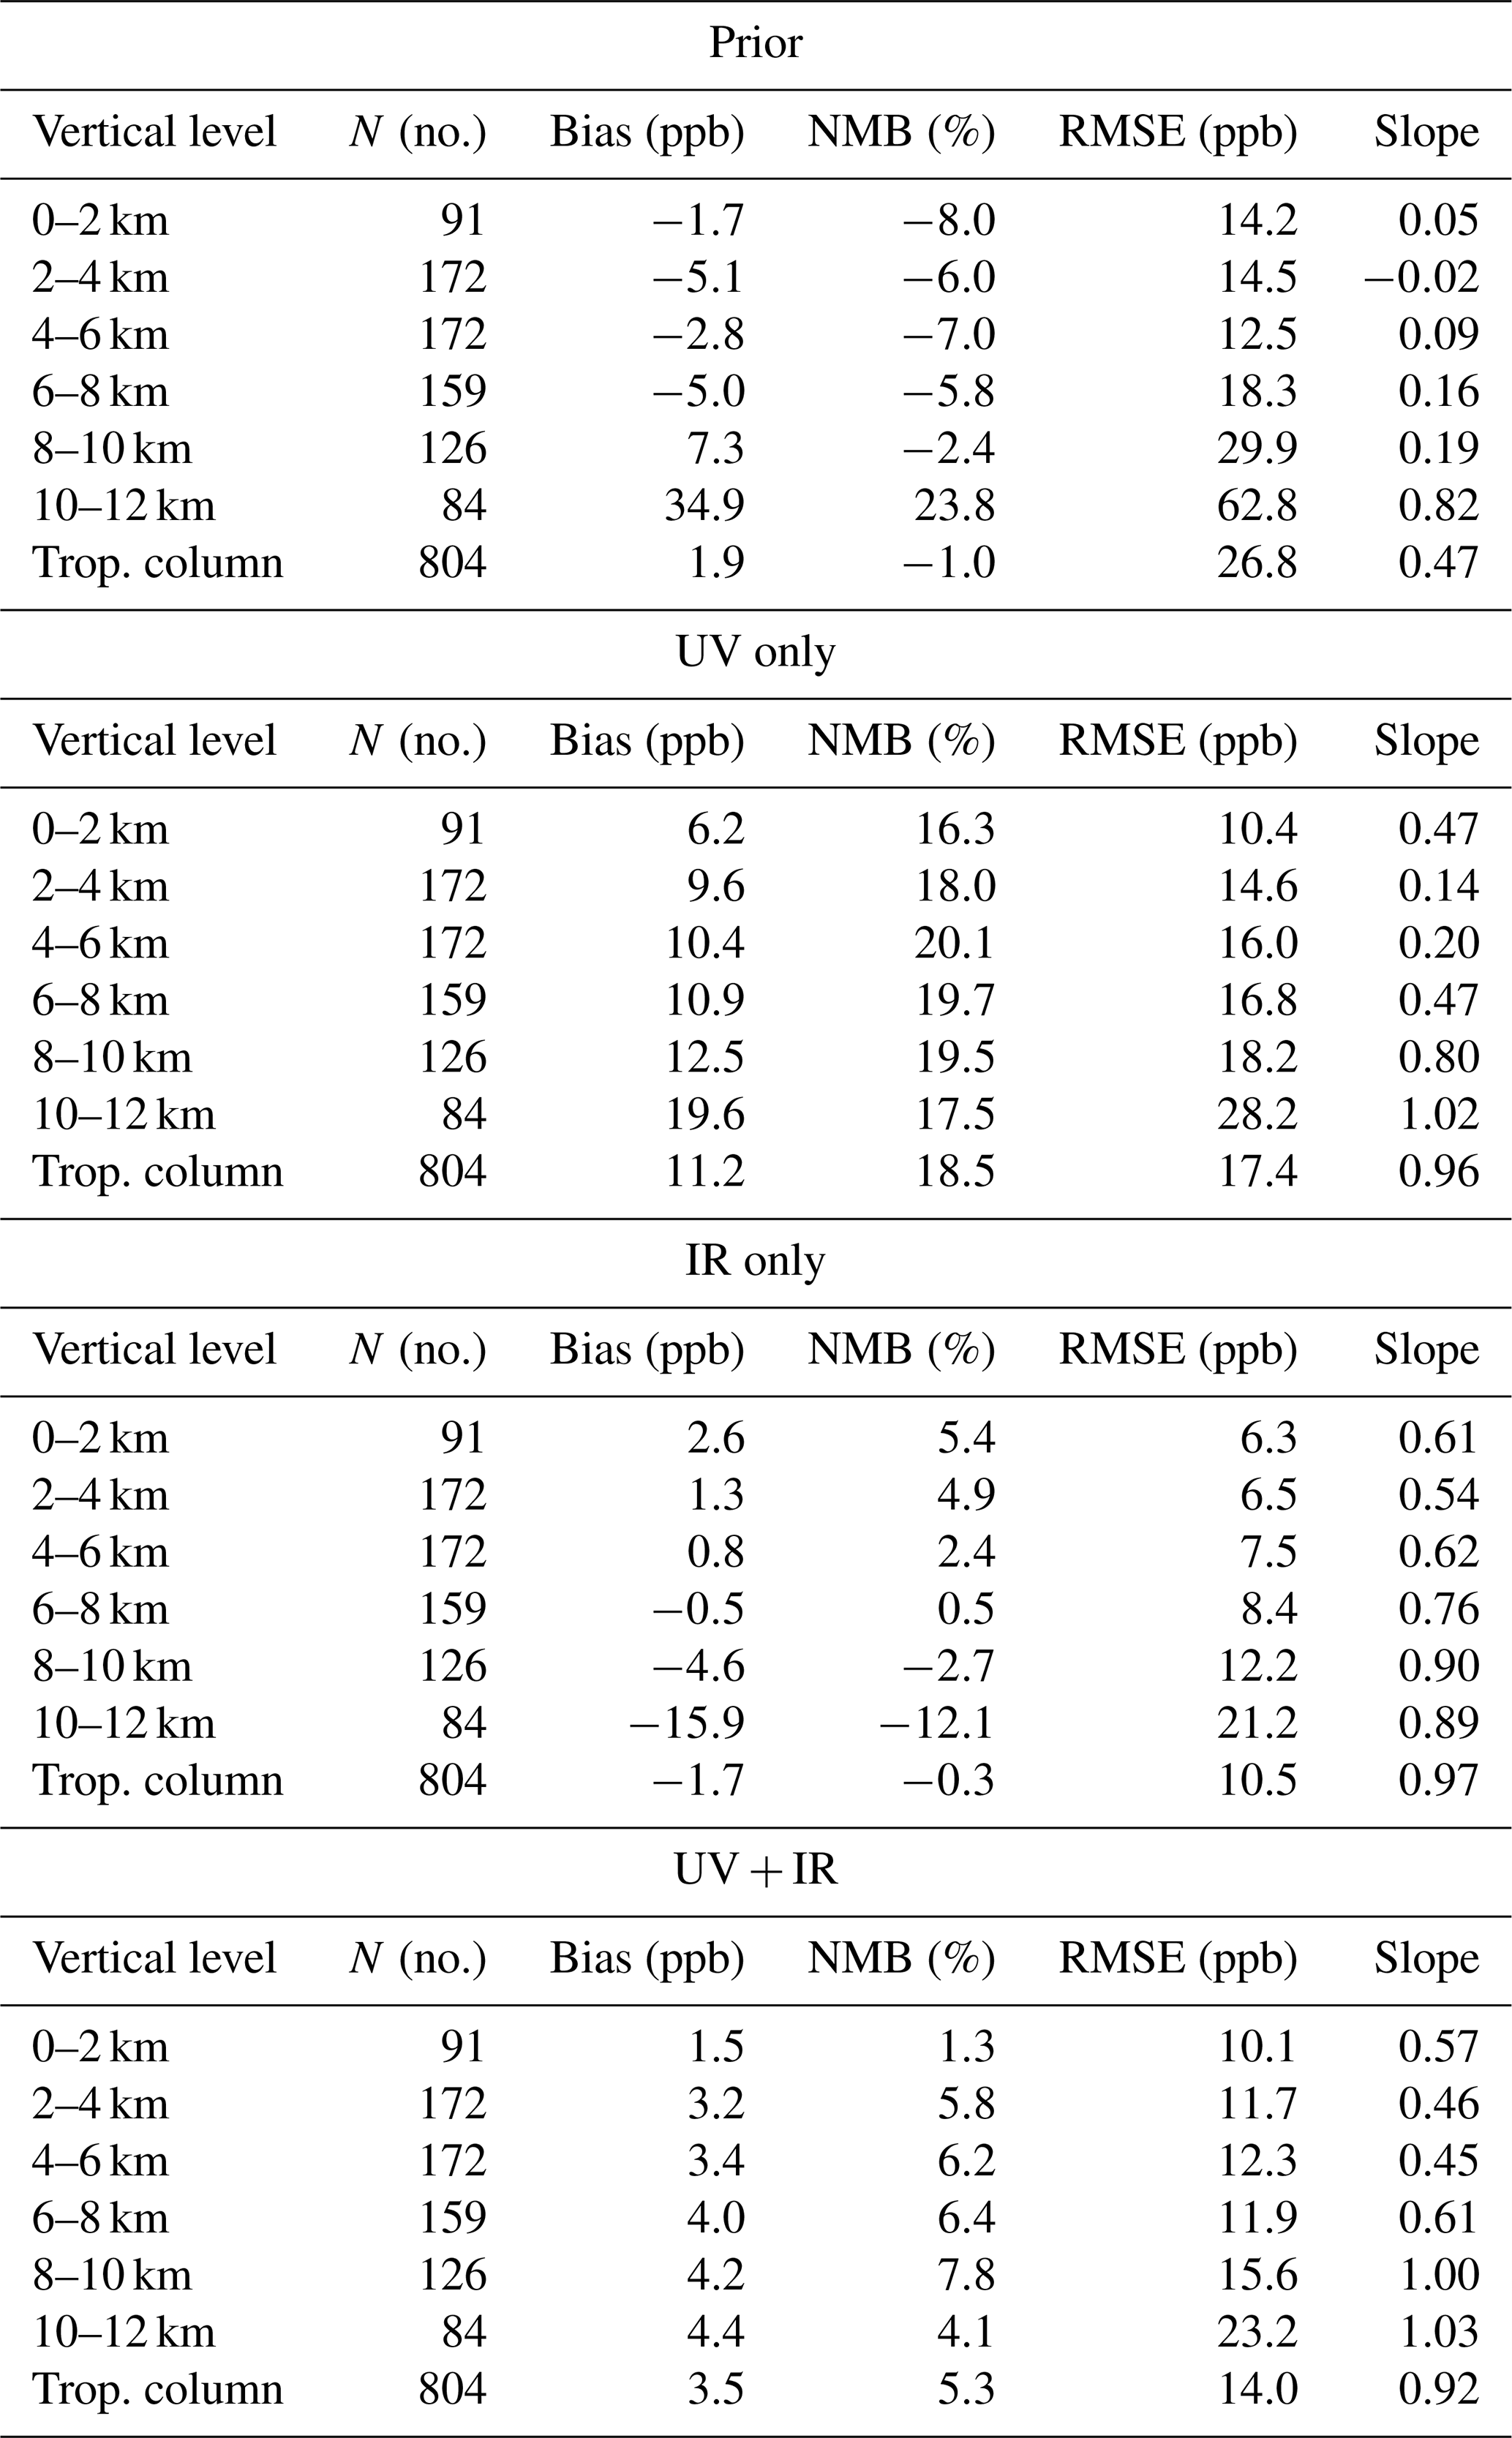
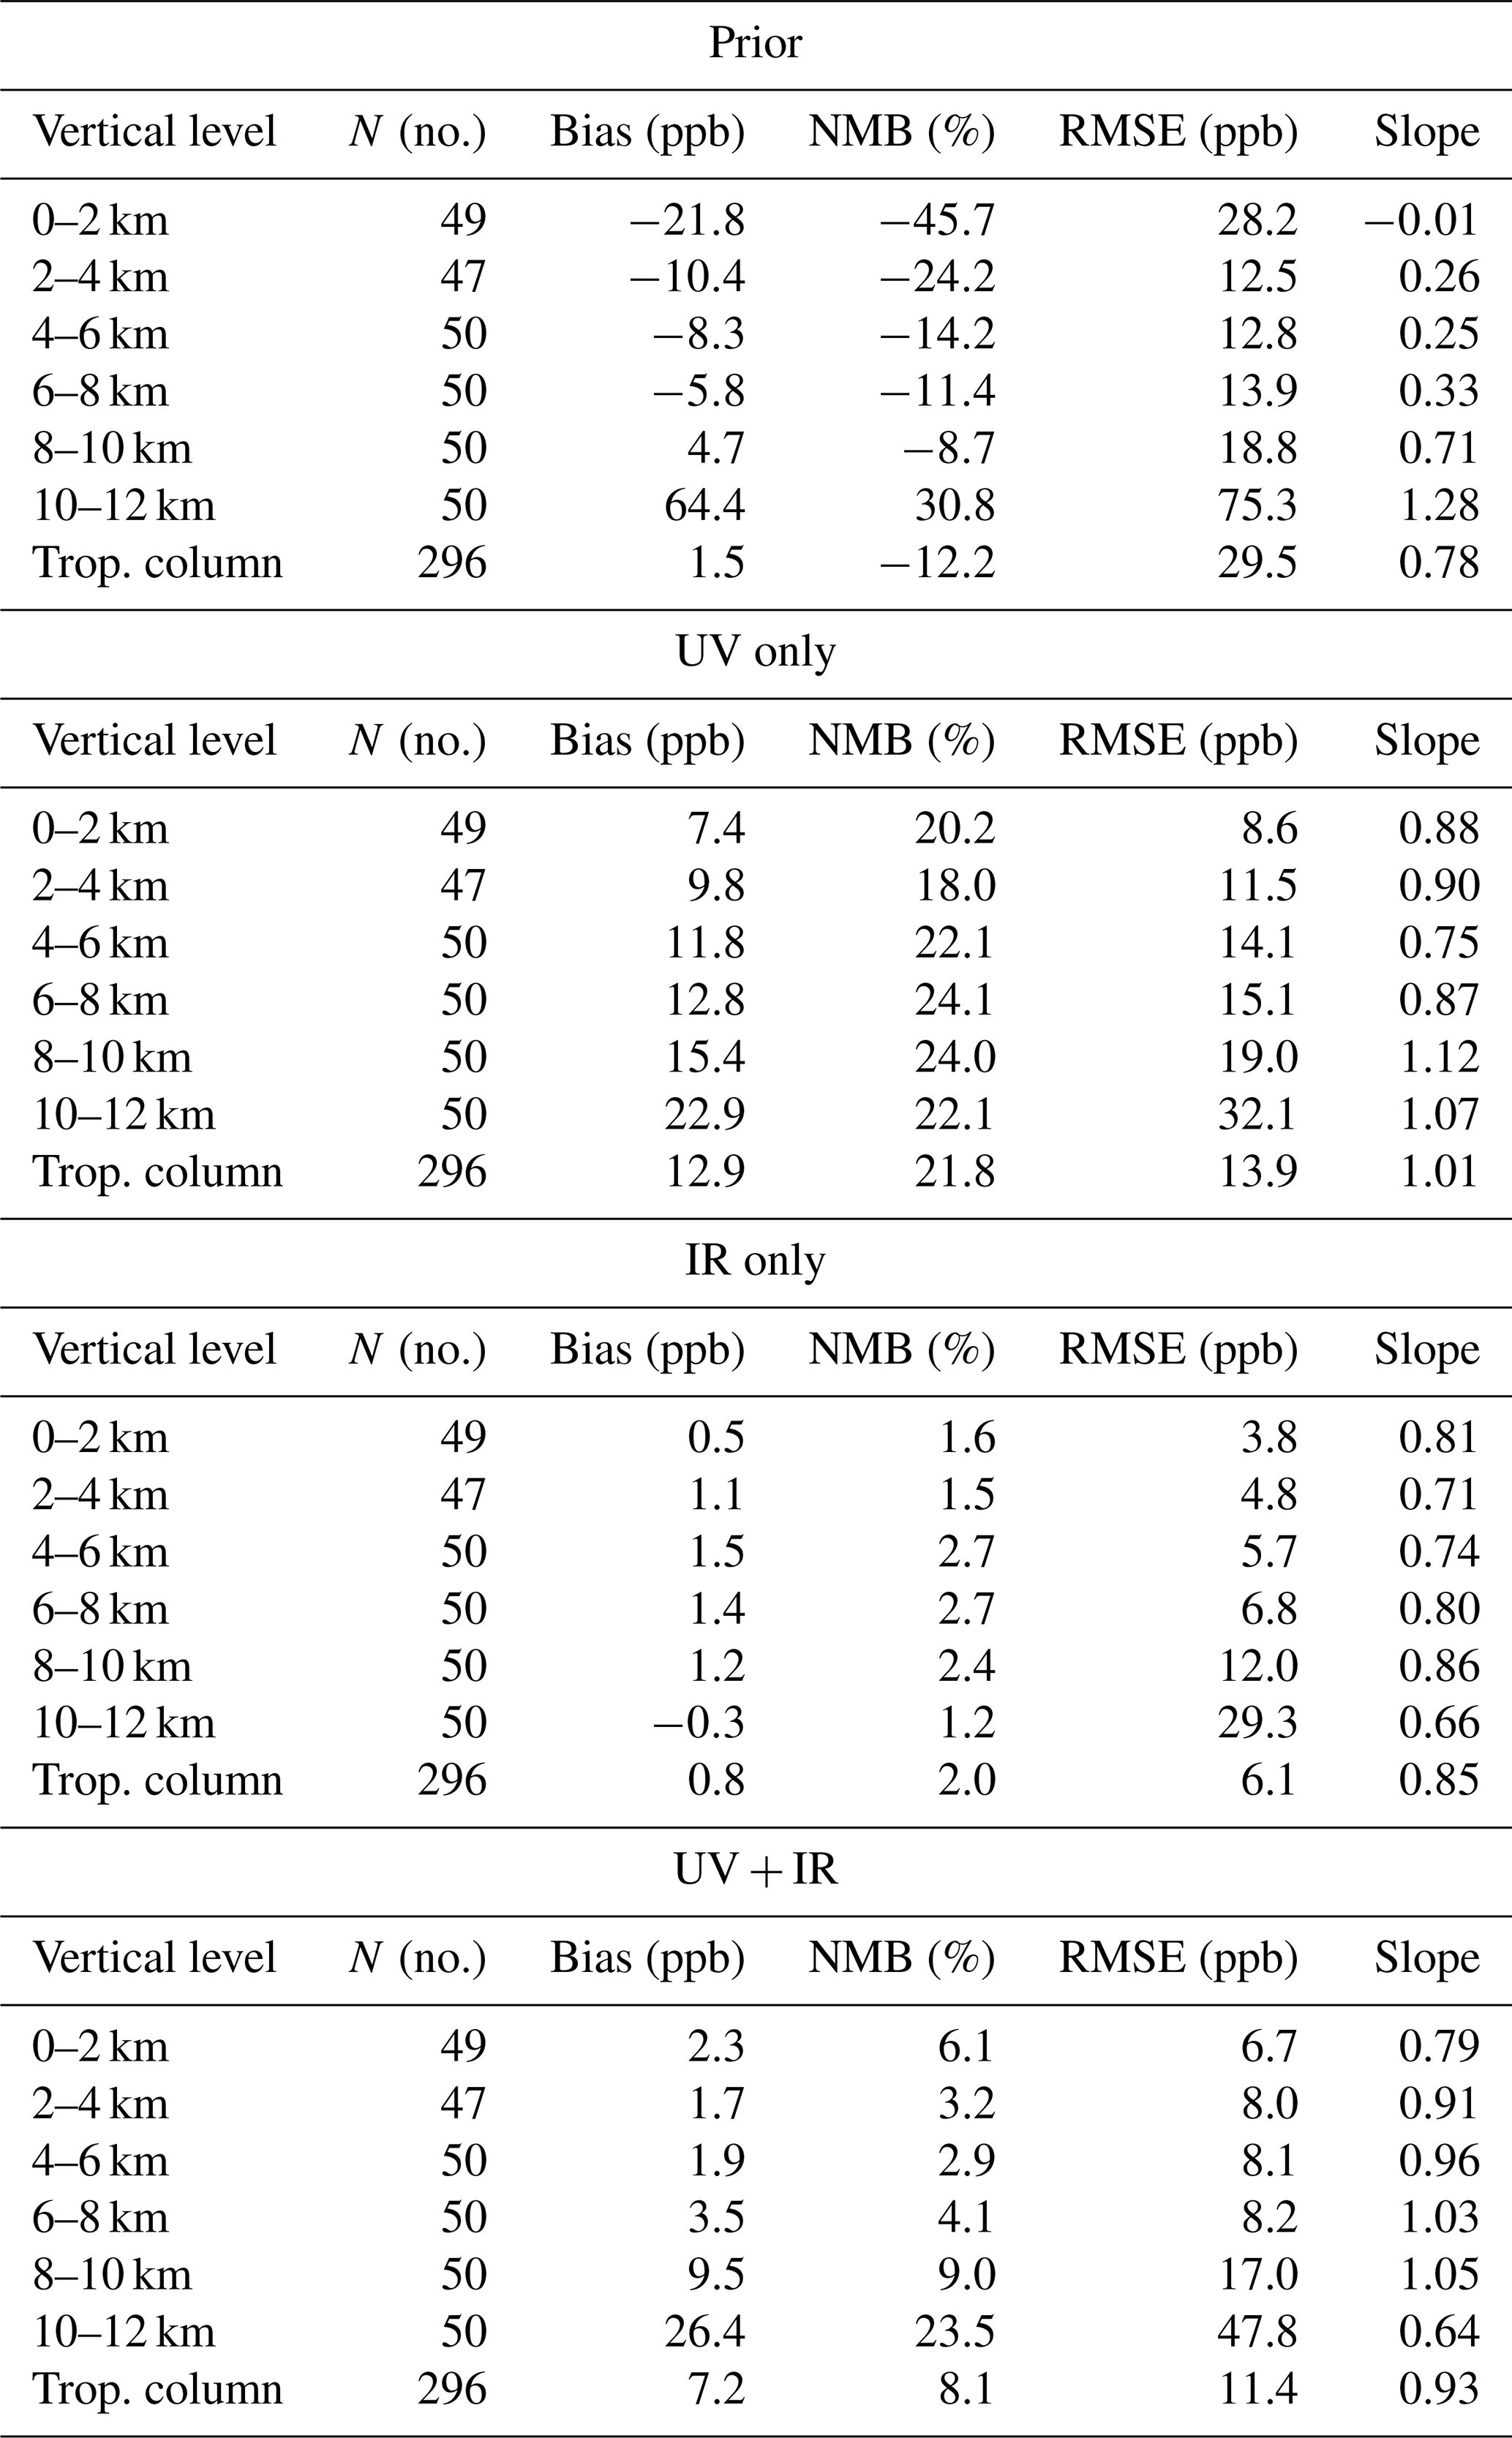
Table 3Statistical validation of TOPAS UV, IR, and UV + IR retrievals with convolved TOLNet-A observations. All observations and satellite retrievals were co-located using 2.5 h and 30 km threshold criteria.
Ozonesondes, which are a commonly used validation data source for evaluating satellite O3 profile retrievals, were also used to validate TOPAS O3 retrievals. Figure 6 shows the comparison of the three vertical O3 profile satellite retrievals to co-located ozonesonde observations at the locations displayed in Table 2 between 2018–2019 (statistics in Table 4). Ozonesondes convolved with retrieval averaging kernels and a priori profiles (hereinafter ozonesonde-A) when compared to TROPOMI UV-only retrievals suggest these retrievals meet the defined systematic bias requirement of ± 30 % (ESA, 2014) throughout the troposphere. CrIS IR-only retrievals compared most favorably to ozonesondes, meeting the systematic bias requirement of ± 10 % defined for this spaceborne sensor (JPSS, 2019). The combined UV + IR retrievals had NMB values < 30 % at all altitudes in the troposphere. All three satellite retrieval types performed better than the a priori profile product, further suggesting that the satellite O3 profiles provide useful information for tropospheric composition. Overall, the comparison of TROPOMI UV-only and CrIS IR-only retrievals to both TOLNet and ozonesondes suggests these two satellite sensors meet the systematic bias criteria identified for the O3 vertical profile products in the troposphere.
The RMSE values in Table 4 represent the random errors in the daily TOPAS O3 profile retrievals when validated with ozonesonde-A observations. All three TOPAS retrievals had lower random errors compared to the a priori profiles; however, random errors still remained elevated in most instances except for the IR-only retrievals. UV-only retrievals had unresolved errors ∼ 50 % less compared to the a priori (13.9 ppb). IR-only retrievals displayed the least unresolved errors of all three retrievals with average RMSE values of 6.1 ppb, which is ∼ 80 % less compared to the a priori. The combined UV + IR profiles had average RMSE values of 11.4 ppb, ∼ 60 % less compared to the a priori, throughout the troposphere. Given that unresolved errors of daily profiles on average still remain large (> 10 ppb) for retrievals using UV wavelengths (UV, UV + IR), the accuracy of these satellite products still suffers due to the limited sensitivity of spaceborne sensors to tropospheric O3. On the contrary, NMB and RMSE values for IR-only retrievals when compared to ozonesonde-A observations were low, suggesting this product had some skill in capturing the daily vertical distributions of O3 in the troposphere during this validation. This increased tropospheric sensitivity in IR-only profiles, and when combining UV and IR wavelengths, allows these retrievals to deviate from biased a priori profiles, which improves the ability of this retrieval to capture daily O3 vertical profile distribution variability in the troposphere, which is in agreement with many recent studies (e.g., Landgraf and Hasekamp, 2007; J. Worden et al., 2007; Cuesta et al., 2013, 2018; Costantino et al., 2017; Colombi et al., 2021; Malina et al., 2022; Mettig et al., 2022).
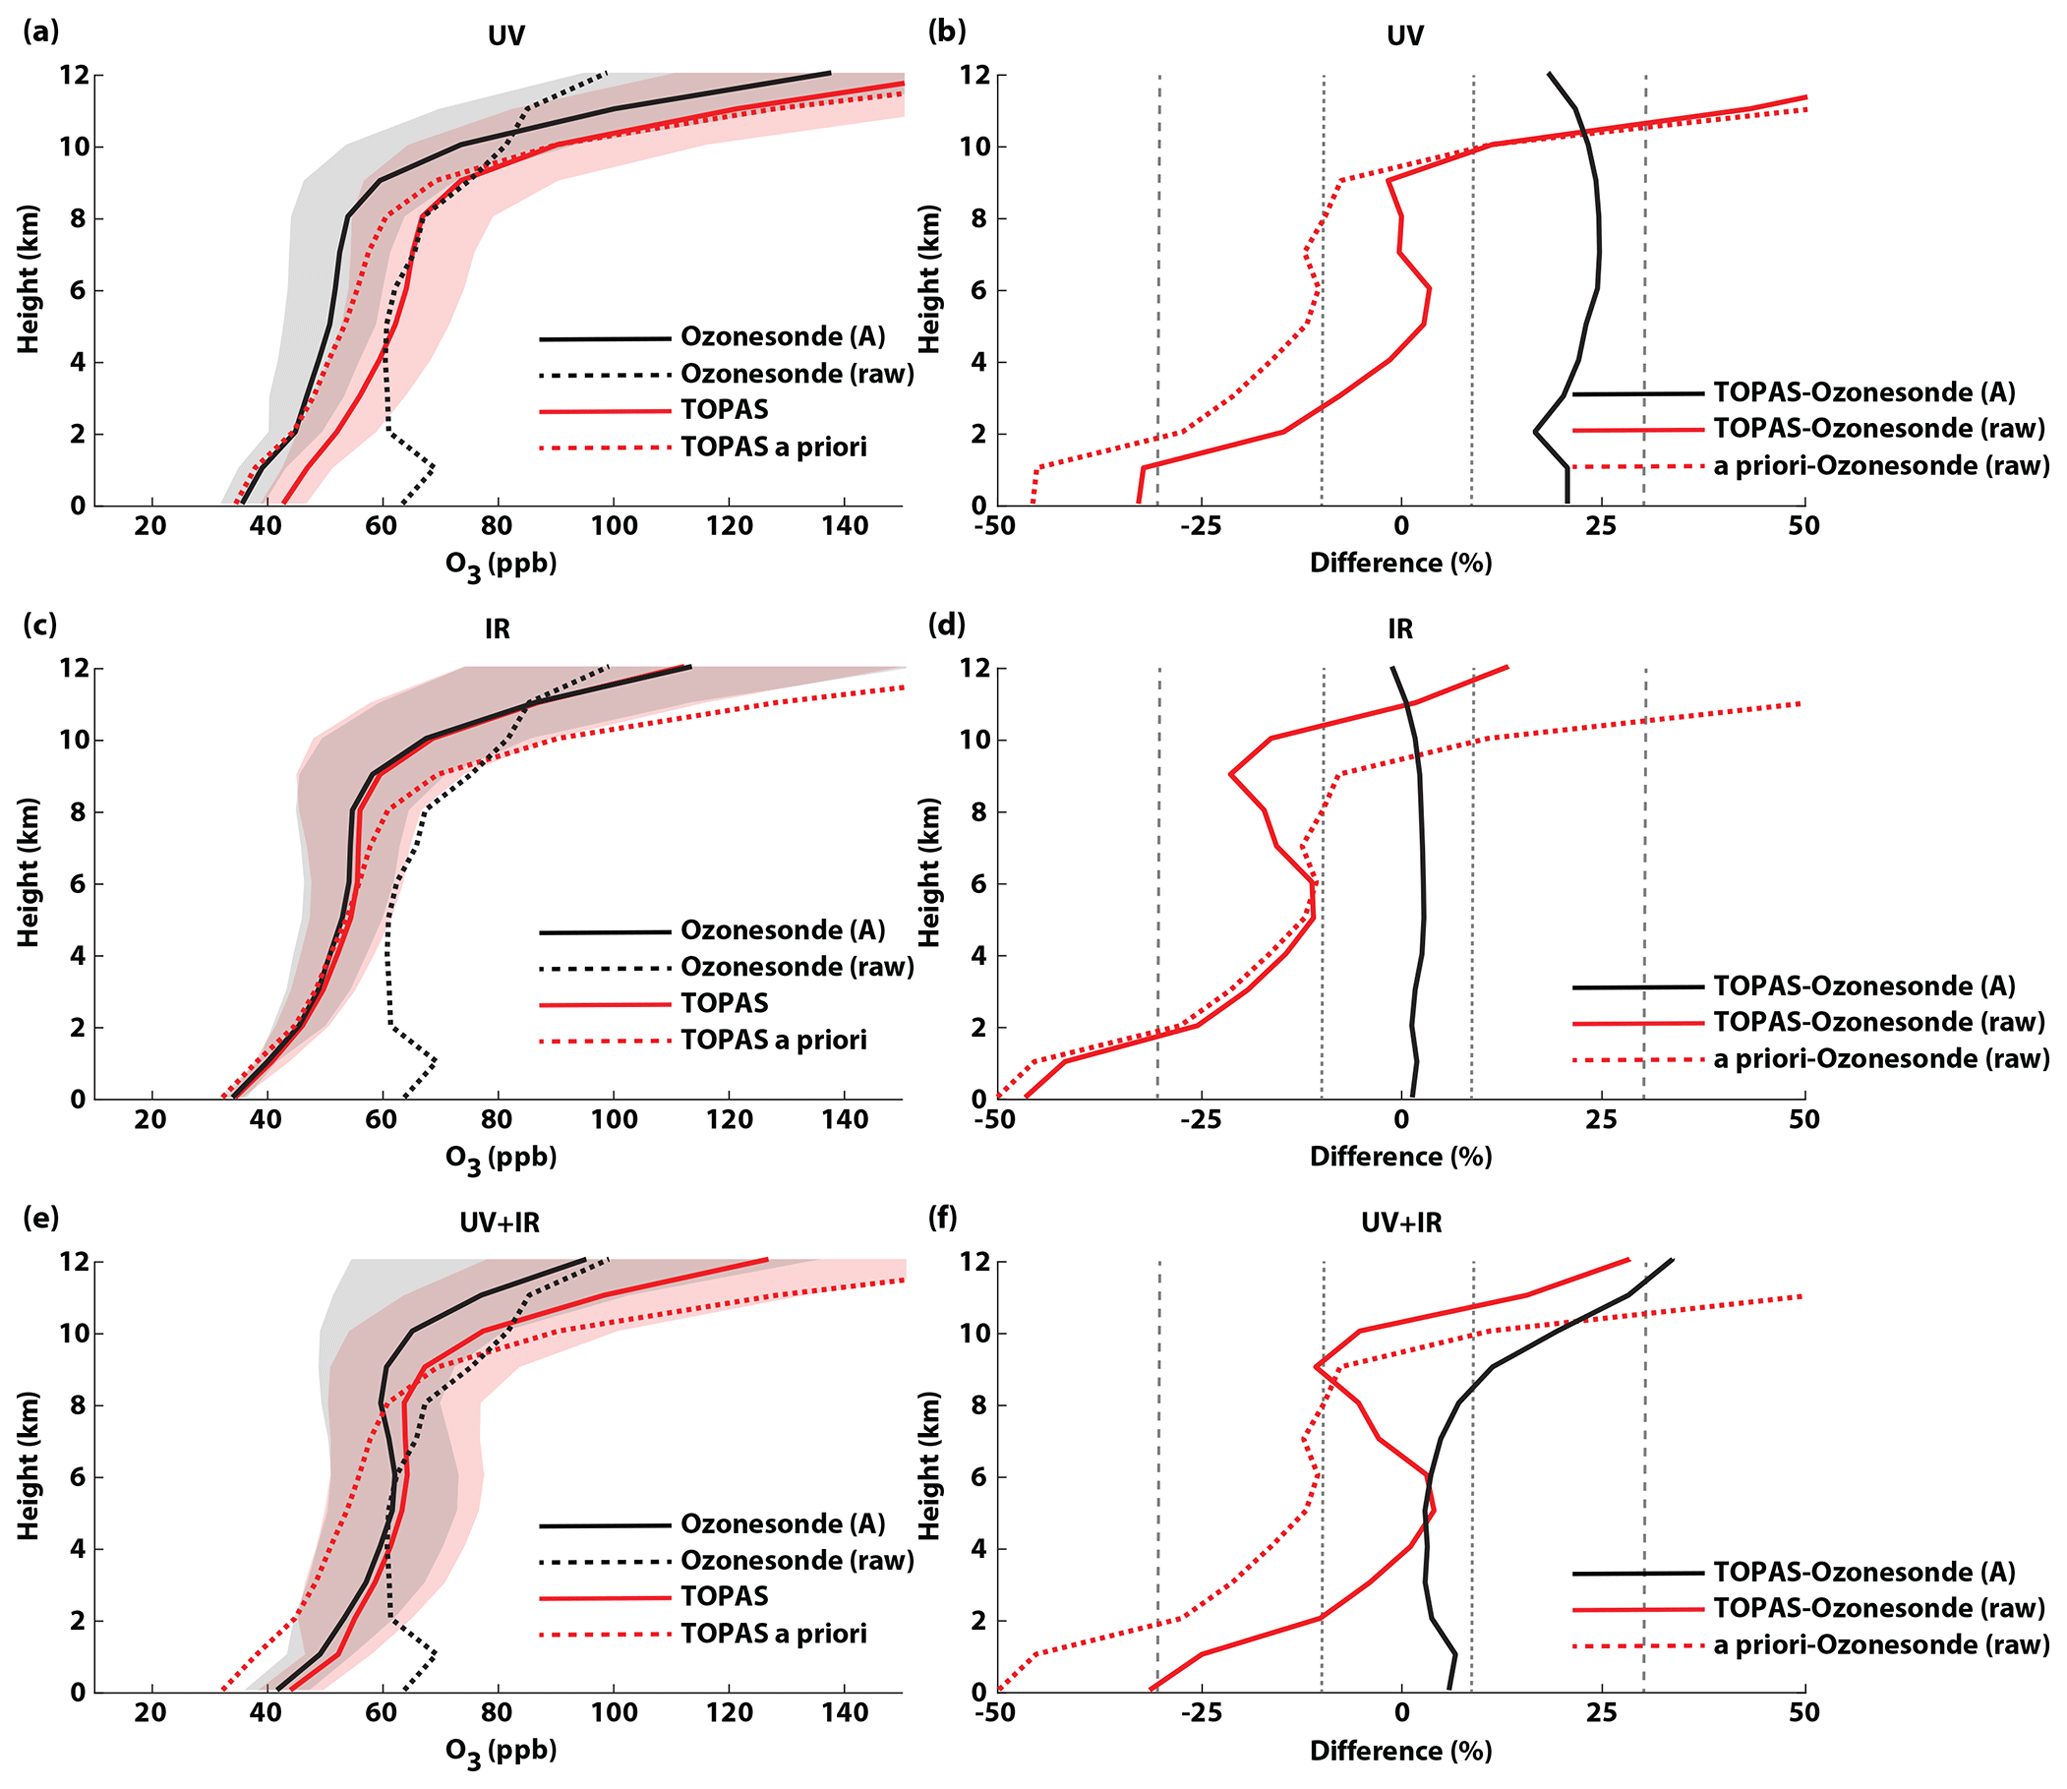
Figure 6Vertical O3 profile comparison of ozonesondes interpolated to the satellite vertical grid (ozonesonde-raw); ozonesondes convolved with the TOPAS averaging kernel (ozonesonde-A); UV, IR, and UV + IR TOPAS satellite retrievals; and the a priori profile information used in the TOPAS retrieval (total number of co-locations (N) = 26). The direct comparison of the profiles and percent difference for UV-only (a, b), IR-only (c, d), and UV + IR (e, f) retrievals are displayed. The normalized mean bias (NMB) between TOPAS satellite retrievals and ozonesonde-A and ozonesonde-raw used as the reference is labeled as TOPAS-ozonesonde (A) and TOPAS-ozonesonde (raw), respectively. The grey- and pink-shaded regions illustrate the 1σ standard deviation of ozonesonde-A and satellite O3 vertical profiles, respectively. NMB values of 30 % and 10 % are displayed using dashed and dotted grey lines, respectively.
Comparing the three satellite profile retrievals to ozonesonde observations not convolved with the retrieval averaging kernels (hereinafter ozonesonde-raw) suggests TROPOMI UV-only data have NMBs lower than ± 10 % between 3 and 10 km a.s.l. but much higher biases above and below these altitudes (see Fig. 6). A low bias in IR-only profiles compared to ozonesonde-raw was determined below 11 km a.s.l. (NMB between −10 % and −50 %), with a small positive bias above this altitude. The combined UV + IR retrievals compare most closely to ozonesonde-raw observations, with NMBs lower than ± 10 % at all altitudes below 11 km and above 2 km a.s.l. The low bias in all three satellite retrievals in the lowermost troposphere is caused by the lack of sensitivity to O3 at these altitudes not allowing the retrievals to replicate the larger O3 concentrations observed in the PBL by ozonesonde-raw data. The evaluation of TOPAS retrievals with ozonesonde-raw differs from results using TOLNet-raw primarily below 4 km where ozonesonde observed large O3 enhancements in the lowermost troposphere which were not evident in the TOLNet data. In general, the satellite retrievals compare more consistently to ozonesonde-A than to ozonesonde-raw.
In the troposphere, UV-only retrievals were consistently biased high compared to ozonesonde-A data (see Fig. 6a, b; Table 4). This systematic high bias is consistent with the validation using TOLNet-A observations. IR-only O3 profiles compare very well to ozonesonde-A data, with NMB values < 3 % throughout the troposphere. This outperforms the IR-only profiles when compared to TOLNet-A data, which displayed a low bias aloft. Finally, the UV + IR retrievals have minimal bias below 10 km a.s.l., with NMB values < 10 % when compared with TOLNet-A observations; however, when compared with ozonesonde-A data, the UV + IR retrievals had a noticeable high bias above 9 km. The overall validation of the three satellite O3 profile retrievals using ozonesonde-A was generally consistent compared to when using TOLNet-A. It is important to note that TOLNet and ozonesonde validation statistics are generally consistent given the fact that ozonesondes are a highly accurate and commonly applied satellite validation data source. This suggests that TOLNet is a sufficient validation data source of tropospheric O3 profile retrievals from satellites. Given that TOLNet is able to accurately validate satellite-derived O3 profiles, and the focus of this work is on the demonstration of TOLNet for validating satellite retrievals, the rest of this study focuses on the validation using the lidar network observations.
Table 4Statistical validation of TOPAS UV, IR, and UV + IR retrievals with convolved ozonesonde observations. All observations and satellite retrievals were co-located using 2.5 h and 30 km threshold criteria.
3.3.2 Impact of co-location criteria on mean vertical O3 profile validation
To determine the impact of using coarser spatiotemporal co-location criteria (5 h and 100 km) for satellite O3 profile validation, more consistent with recent TROPOMI/CrIS validation studies (Malina et al., 2022; Mettig et al., 2022), we conducted a sensitivity study validation of the mean vertical O3 profiles using the coarser co-location criteria. Figure S1 in the Supplement shows the comparison of the three vertical O3 profile satellite retrievals to co-located TOLNet-A observations at the location of all six lidars between 2018–2019 using the coarser spatiotemporal co-location criteria (statistics in Table S1). The coarser co-location criteria resulted in a larger number of co-location data points for evaluation. While this results in a more reliable statistical evaluation, the validation of all three satellite retrievals is consistent using both the fine and the coarse spatiotemporal co-location criteria. Given the consistent validation and the fact that representation error between ground-based and satellite data is minimized when applying the finer co-location criteria, including the fact that tropospheric O3 can experience rapid changes during daylight hours, we feel the finer co-location criteria are more appropriate for this validation.
3.3.3 Validation at different vertical levels in the troposphere using TOLNet
A major advantage of using TOLNet for validation of satellite O3 profile retrievals is the ability to make accurate, high-temporal- and high-vertical-resolution observations at different vertical levels of the troposphere. While TROPOMI and CrIS are polar-orbiting systems which only retrieve O3 profiles once per day, the observations throughout an entire day available from TOLNet systems are vital for validating geostationary sensors such as TEMPO. However, the high-vertical-resolution and accurate O3 observations from TOLNet are applied here to robustly validate satellite retrievals at multiple layers of the troposphere. Figure 7 shows the direct comparison of all co-located satellite and TOLNet-A O3 profiles for two separate 6 km vertical layers between the surface and 12 km a.s.l. This same analysis is shown for six separate 2 km vertical layers in Fig. S3 (statistics in Table 3), and results are described in Supplement Sect. S1. This section focuses on the 6 km layer analysis as this is more representative of the vertical resolution of satellite retrievals in the troposphere; however, Supplement Sect. S1 is important in order to show the full capability of TOLNet. The TROPOMI/CrIS validation at multiple layers in the troposphere presented in Supplement Sect. S1 allows for more detailed interpretation of the capability of these satellite vertical profiles to retrieve middle- to lower-tropospheric O3 in comparison to other recent TROPOMI/CrIS validation studies (Malina et al., 2022; Mettig et al., 2022).
In the lower to middle troposphere, between the surface and 6 km a.s.l., all three retrievals have improved performance compared to the a priori profiles (see Figs. 7 and S3). In these lower regions of the troposphere, the UV + IR (NMB of 7.0 %, RMSE of 11.6 ppb, slope of 0.80) and especially IR-only (NMB of 4.3 %, RMSE of 6.9 ppb, slope of 0.88) retrievals outperform UV-only retrievals (NMB of 21.5 %, RMSE of 14.4 ppb, slope of 0.57) due to the enhanced sensitivity provided by the IR wavelengths. The UV + IR and IR-only retrievals have better linear regression slopes compared to the UV-only product due to the ability to deviate further from the a priori profile shape. Figure 7 also shows the comparison of the TOPAS retrievals compared to TOLNet-A for the upper troposphere between 6–12 km a.s.l. For these higher vertical layers of the troposphere, all three TOPAS retrieval types once again perform better compared to a priori profiles. UV-only retrievals display larger bias (NMB of 21.0 %, RMSE of 19.8 ppb, slope of 0.81) compared to UV + IR (NMB of 6.8 %, RMSE of 16.3 ppb, slope of 0.93) and IR-only (NMB of −7.3 %, RMSE of 13.6 ppb, slope of 0.91) retrievals. All three products have linear regression slopes in the upper troposphere closer to unity compared to lower altitudes, demonstrating the improvement in retrieval performance in regions with more sensitivity to O3. In general, the IR-only and UV + IR retrievals had the least bias out of all three retrievals when compared to TOLNet-A, and IR-only data had the least spread in the upper troposphere compared to observations.
At all altitudes in the troposphere the retrievals typically evaluate better (lower bias and RMSE values and linear regression slopes closer to unity) with observations compared to the a priori product. The linear regression slope provides information about the capability of the retrieval to deviate from the prior profile shape and magnitudes. In the lower to middle troposphere the IR wavelengths provide additional DOFs, which allow the IR-only and UV + IR retrievals to deviate further from the prior profile shape and compare better to observations. Above 6 km all three retrievals have linear regression slopes which are more similar, indicating they are able to deviate to some degree from the a priori shape and compare better to observations. While none of the three retrievals have more than 1.0 DOF below 12 km a.s.l., the information provided by all retrievals does improve upon the prior vertical profile, suggesting these satellite data provide useful information for studying tropospheric O3.
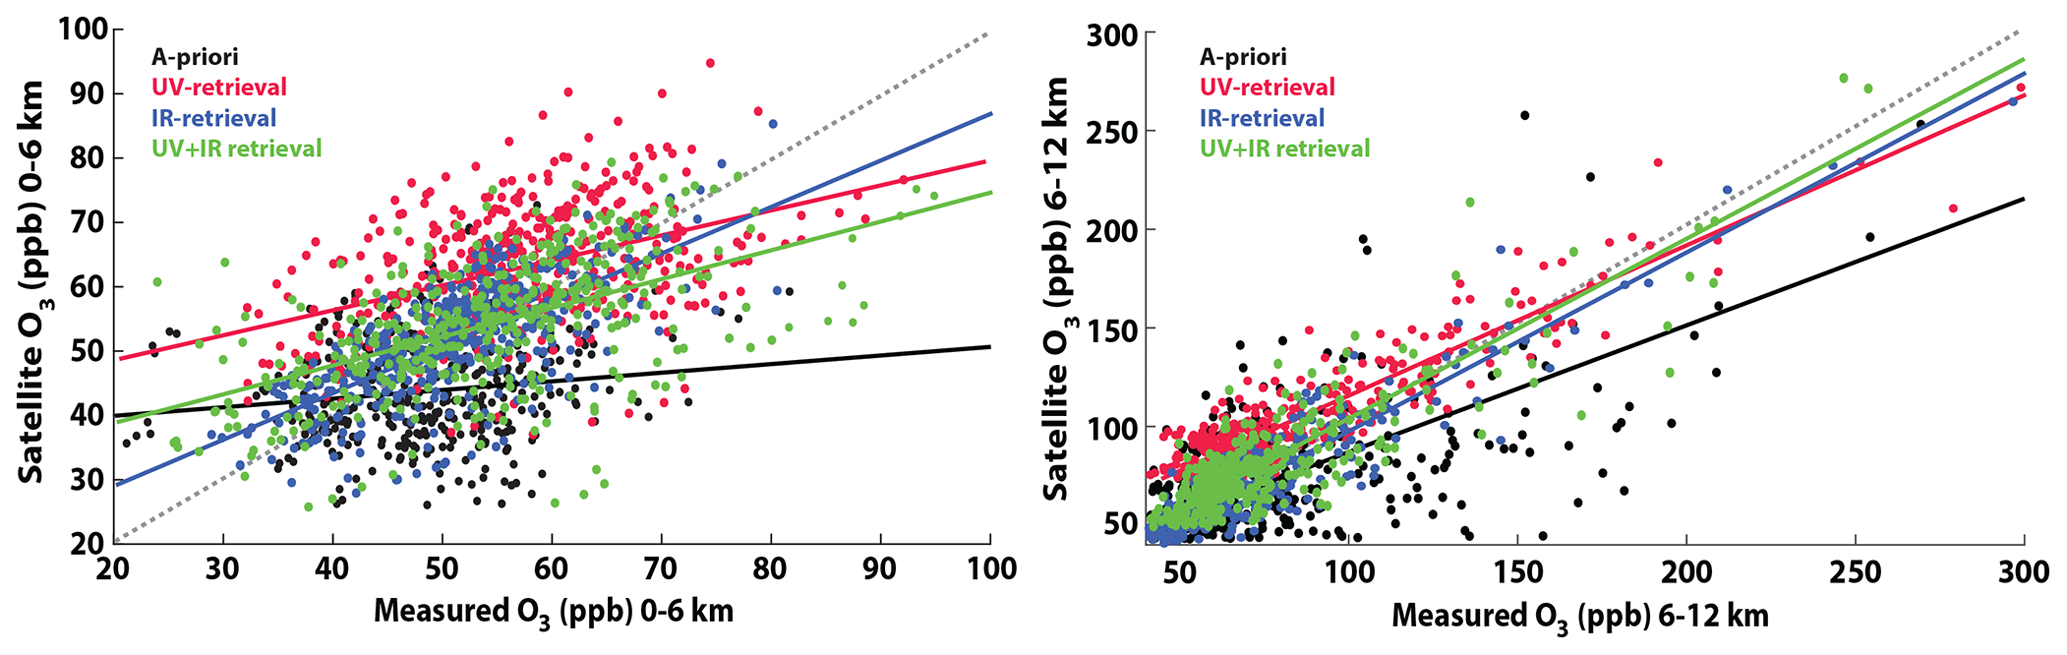
Figure 7Scatterplot comparison of co-located TOPAS UV-only (red), IR-only (blue), and combined UV + IR (green) retrievals and a priori O3 vertical profiles to TOLNet observations in 6 km vertical layers between the surface and 12 km a.s.l. The satellite profiles are compared to TOLNet-A, and the a priori data are compared to TOLNet-raw. The solid-colored lines illustrate the linear regression fit of each satellite TOLNet comparison, and the dashed line represents the 1:1 fit line. Statistics of the intercomparison at 2 km vertical levels are presented in Table 3.
3.3.4 TOLNet validation of seasonal vertical O3 profiles
A seasonal validation of the three TOPAS O3 profile retrievals was performed using TOLNet-A observations. Figure 8 shows the comparison of satellite retrievals and lidar profiles divided into meteorological season (i.e., winter (DJF), spring (MAM), summer (JJA), and fall (SON)). The number of co-locations is limited during the winter and spring (N<10) outside of the primary O3 season covering the summer and fall. More robust observational coverage by TOLNet is apparent in the summer (N=34) and fall (N=41). Given the limited number of co-located observations in the winter and spring available for this study, the statistical validation of the satellite retrievals during these months should be viewed as relatively uncertain. The focus of this study was to demonstrate the capability of TOLNet data to validate satellite retrievals; however, to improve the number of seasonal co-locations, we also used ozonesonde data (ozonesonde-A), in addition to lidar measurements, and these results are shown in Fig. S2. Given that the performance of the validation was similar when using TOLNet-A and the combination of TOLNet-A and ozonesonde-A, the main text of the paper focuses on the seasonal validation of TOPAS retrievals using TOLNet-A data only.
During the winter months, UV + IR retrievals compared most closely to TOLNet-A observations. This combined retrieval is the only satellite product which validates better with observations compared to the a priori below 8 km a.s.l. The NMBs of the UV- and IR-only profiles exceed ± 10 % throughout the majority of the tropospheric column, while UV + IR retrievals have NMB values < 7 % from the surface to 12 km a.s.l. The prior profile and UV-only retrievals have similar unresolved errors (RMSE) of ∼ 24 ppb throughout the tropospheric column, suggesting the UV-only product was unable to improve upon the a priori information. The random errors in the retrievals, including IR wavelengths (e.g., IR only and UV + IR), had lower RMSE values of ∼ 13 ppb.
In the spring months all three retrievals evaluated more consistently with observations compared to the a priori profiles. At all altitudes in the troposphere the IR-only profiles compared the best to observations with NMB values < 10 %. The two retrievals which incorporate UV wavelengths had larger positive biases compared to the IR-only data with NMB values between 10 %–15 % and 15 %–25 % for the UV + IR and UV-only vertical profiles, respectively. IR-only retrievals in the spring had the lowest bias and random error (RMSE = 7 ppb). UV-only retrievals also had lower random errors compared to the a priori data source (RMSE = 21 ppb) with unresolved errors of ∼ 14 ppb. UV + IR retrievals in the spring had moderate systematic biases and the largest unresolved errors of all three retrievals (∼ 19 ppb).
During the summer, UV + IR had the lowest biases (within ± 10 %) above 2 km a.s.l. compared to other retrievals and the a priori. The UV-only retrievals had a constant high bias of 10 %–15 % throughout the entire troposphere. The IR-only retrievals had variable biases below 8 km, while above this altitude a large negative bias was displayed. All three retrievals had smaller RMSE values compared to the a priori of 17, 11, and 14 ppb for the UV-only, IR-only, and UV + IR retrievals, respectively. Overall, all three satellite retrievals had smaller bias and uncertainties compared to the a priori profiles for the summer months.
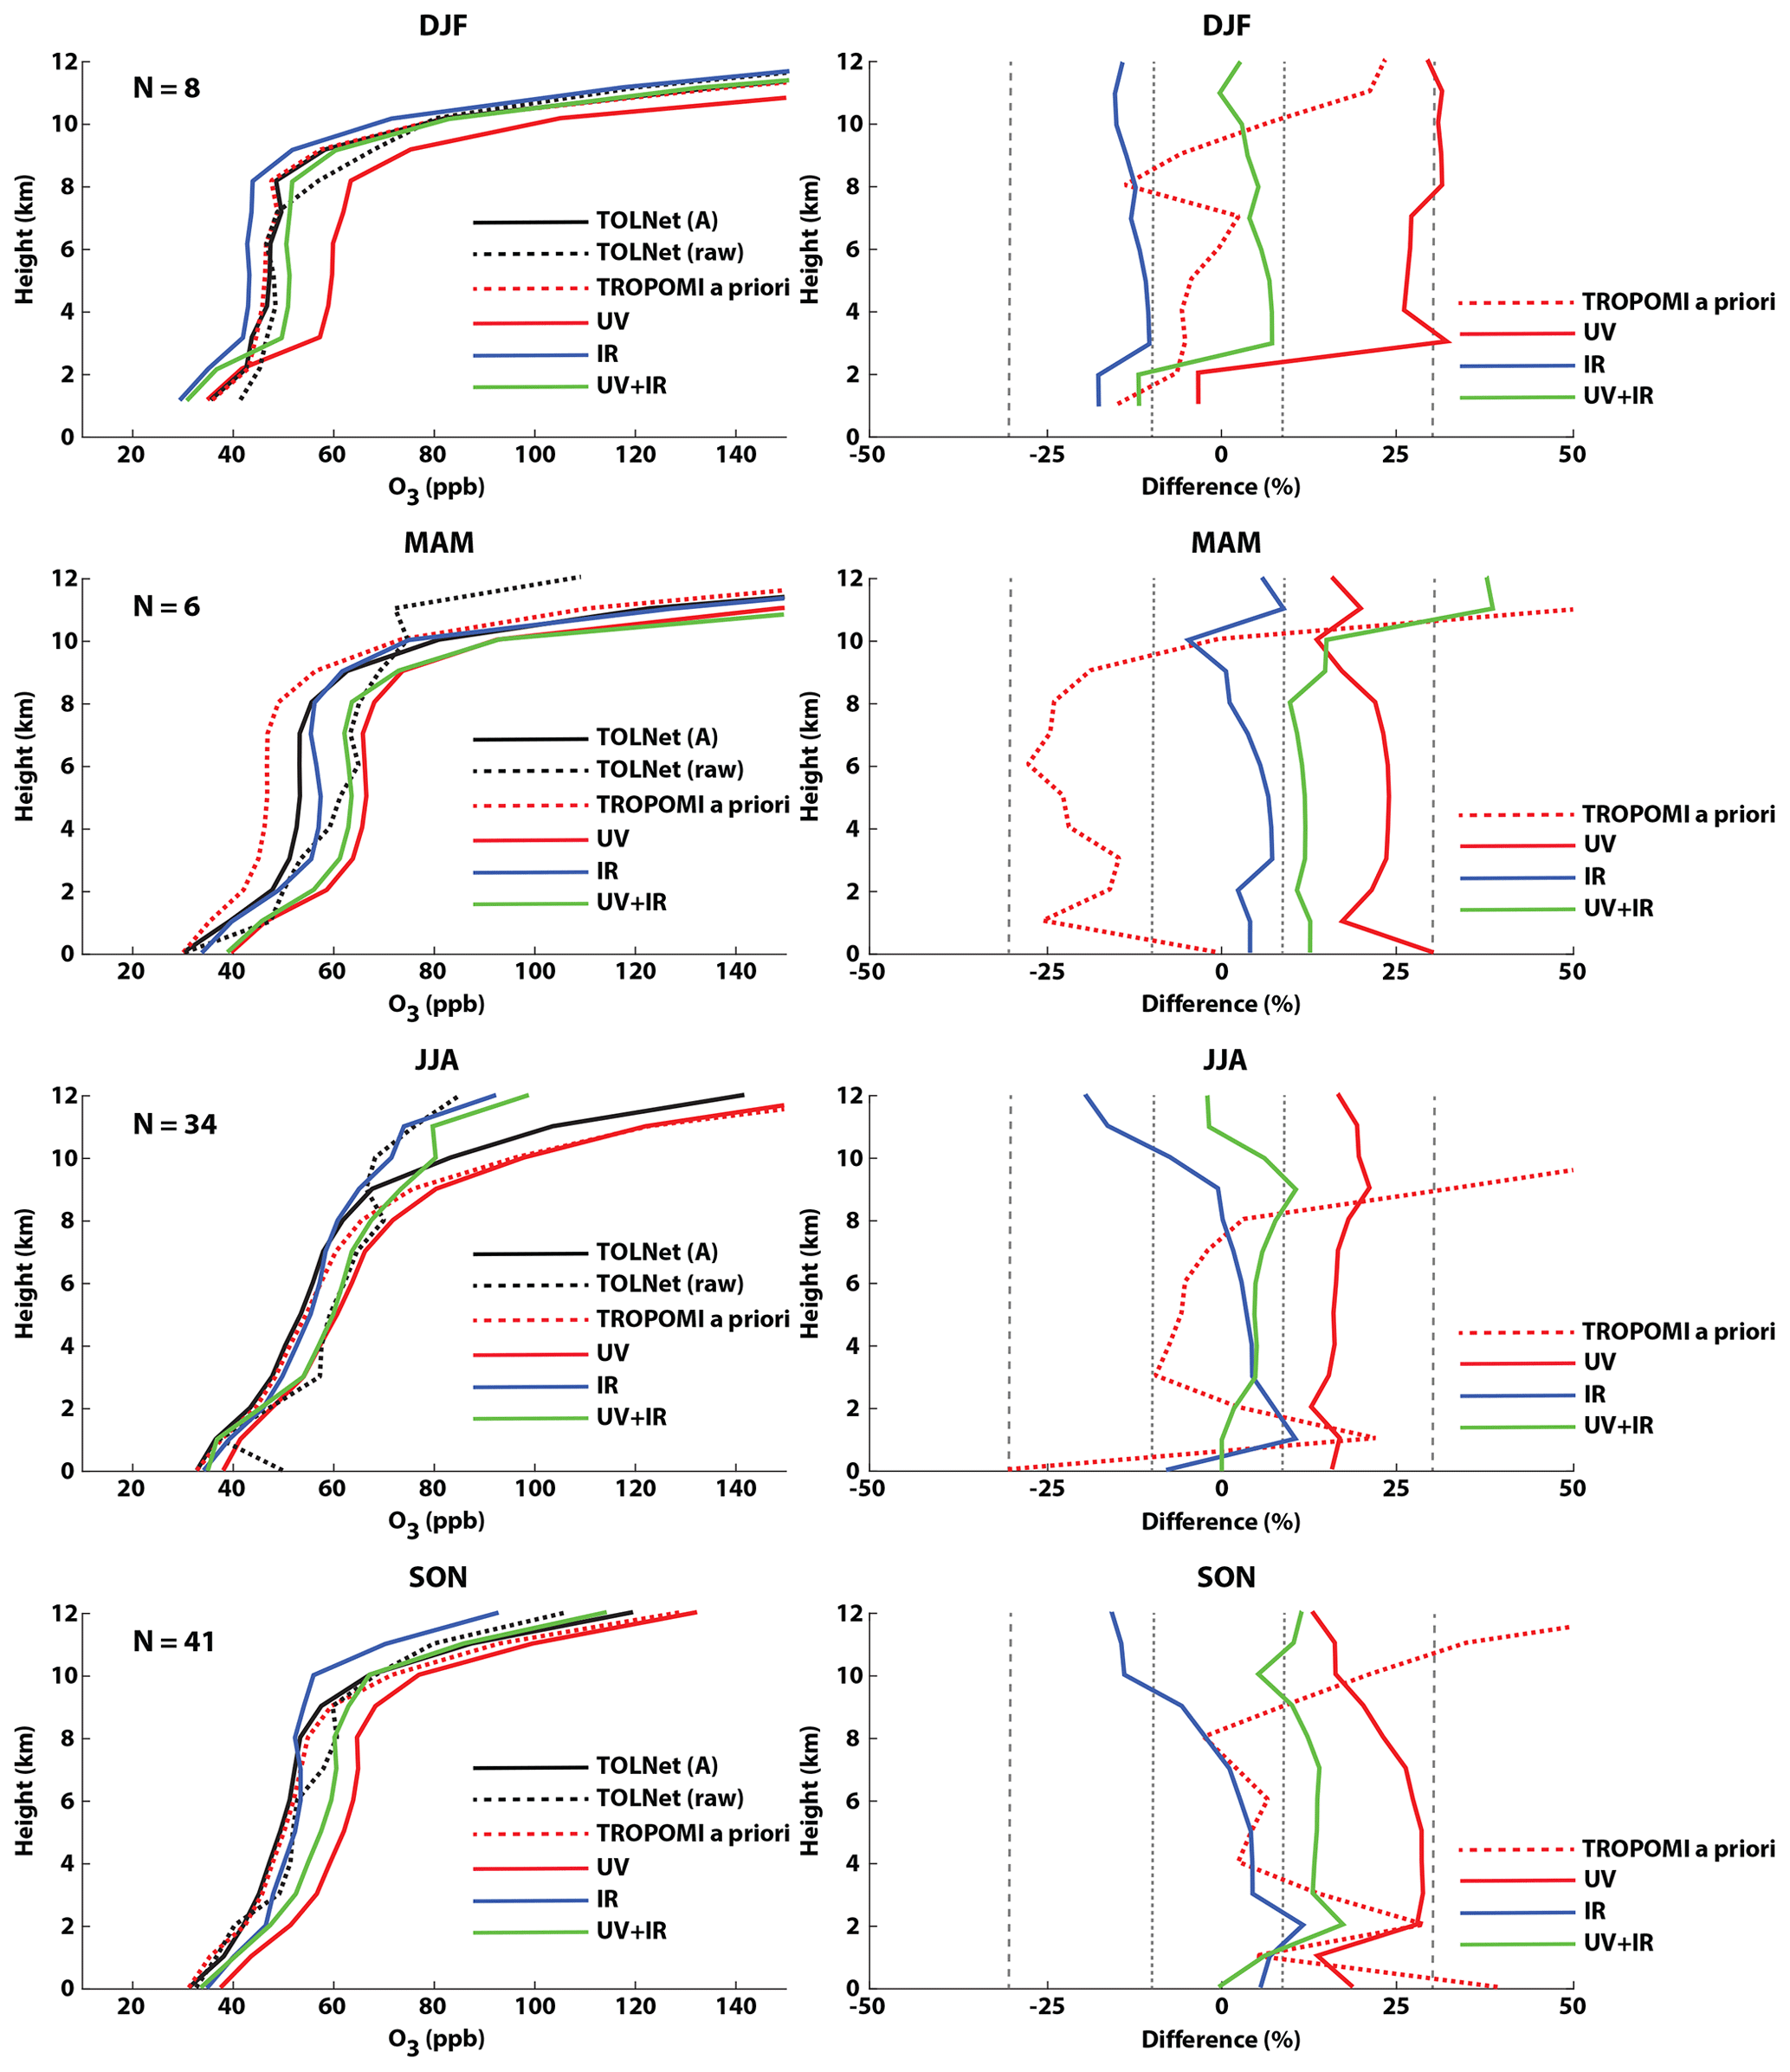
Figure 8Seasonally averaged vertical O3 profile comparison of TOLNet interpolated to the satellite vertical grid (TOLNet-raw); TOLNet convolved with the TOPAS averaging kernels (TOLNet-A); UV, IR, and UV + IR TOPAS satellite retrievals; and the a priori profile information. The TOLNet profile convolved with the UV + IR averaging kernels is displayed, and the other two (UV- and IR-only) convolved profiles are not shown to reduce the number of profiles presented. The direct comparison of the profiles (left column) and normalized mean bias (NMB) (right column) for UV-only, IR-only, and UV + IR retrievals compared to TOLNet-A as the reference are displayed. NMB values for each of the three retrievals are calculated using the TOLNet profiles convolved with the correct retrieval-specific averaging kernel as the reference. NMB values of 30 % and 10 % are displayed using dashed and dotted grey lines, respectively. The total number (N) of co-located profiles are shown in the figure inset.
At all altitudes in the troposphere during the fall months the retrievals using IR wavelengths (IR-only and UV + IR) compared the best to observations, with NMB values < 15 %. UV-only retrievals had consistent high biases typically > 20 %. IR-only profiles had the best overall performance with small biases (within ± 10 %) below 9 km and a larger negative bias aloft. All three retrievals had smaller RMSE values compared to the a priori of 16, 10, and 13 ppb for the UV-only, IR-only, and UV + IR retrievals, respectively. Similar to the summer months, during the fall all three retrievals had noticeably lower random errors compared to the a priori profiles.
The seasonal validation of TROPOMI, CrIS, and TROPOMI/CrIS retrievals in Mettig et al. (2022) and Malina et al. (2022) did not apply ground-based O3 lidars; therefore, this study provides a new perspective on the seasonal validation of these retrievals. All three TROPOMI, CrIS, and TROPOMI/CrIS validation studies applied a similar number of profiles during each season. Overall, the seasonal validation in Malina et al. (2022) tends to show lower systematic biases and random error compared to this study and Mettig et al. (2022) in all seasons. The satellite retrievals in Malina et al. (2022), which differ in many ways from those produced with the TOPAS algorithm, were produced using the MUlti-SpEctra, MUlti-SpEcies, MUlti-SEnsors (MUSES) retrieval algorithm. In general, the validation in this study resulted in lower systematic biases and bias variability in the mean vertical profiles, in all seasons except for winter months compared to Mettig et al. (2022). All three studies provide useful information about the evaluation of TROPOMI, CrIS, and TROPOMI/CrIS retrievals since they all use different retrieval algorithms to produce satellite data and ground-based observations as validation data sets.
To determine a retrieval product's accuracy, it is important to quantify systematic bias and random errors. Figure 5 and Table 3 illustrate each of the three retrievals' systematic biases represented by NMB values when validated with TOLNet-A observations. TOPAS UV-only retrievals have a consistent positive bias ranging between 16 %–20 % throughout the entire troposphere, in agreement with the validation of TROPOMI in the middle northern latitudes for the middle to lower troposphere by Mettig et al. (2021). These UV-only retrievals had the largest random errors (RMSE) in the troposphere (17.4 ppb) in comparison to IR-only (10.5 ppb) and UV + IR (14.0 ppb) products. The higher random errors derived in this study for UV-only retrievals agree with Mettig et al. (2022) but do not agree with Malina et al. (2022), who derived the lowest values for TROPOMI in comparison to CrIS and TROPOMI/CrIS. In agreement with other recent TROPOMI, CrIS, and TROPOMI/CrIS retrieval validation studies (Mettig et al., 2022; Malina et al., 2022), the addition of the IR wavelength retrievals to UV-only data was shown to improve the satellite retrievals of O3 profiles throughout the troposphere. Systematic biases from the IR-only retrievals were minimal (NMB < 6 %) in the lowest 10 km of the troposphere, with the product having a negative bias between 10–12 km (NMB %). The low mean biases derived in this study from IR-only retrievals agree with Mettig et al. (2022) and Malina et al. (2022); however, the negative bias between 10–12 km is unique to this study using lidar profiles for evaluation. The lowest random errors were calculated for CrIS IR-only profiles, which agrees with Mettig et al. (2022). When combining the UV and IR wavelengths, the TOPAS retrieval has minimal systematic bias throughout the troposphere, with NMB values ranging between 1 % and 8 % and average RMSE values of 14.0 ppb when validated with TOLNet-A observations. These systematic and random errors for UV + IR wavelengths agree well with the work by Malina et al. (2022).
Applying different combinations of UV + IR joint wavelength retrievals (e.g., GOME-2+IASI) also displays improvements compared to UV-only products in the troposphere, similar to that determined in this study (e.g., Cuesta et al., 2013, 2018). Cuesta et al. (2013, 2018) demonstrated how GOME-2+IASI retrievals show high accuracy compared to ozonesondes in the lowermost troposphere and display a clear capability to capture PBL O3 enhancements. This differs from the results of this study, which suggest that TROPOMI+CrIS UV + IR joint wavelength retrievals still struggle to reproduce large PBL O3 enhancements due to limited lowermost-tropospheric sensitivity. The reasons why GOME-2+IASI displays a remarkable capability to retrieve lowermost-tropospheric enhancements compared to the results from TROPOMI+CrIS are not immediately apparent. There are differences in the retrieval algorithms, a priori input data sets, and the spectral resolutions of the UV and IR sensors applied. Comparing our results to Cuesta et al. (2013) shows that DOFs are higher in the troposphere and in the 0–2 km a.g.l. column (> 33 % higher) in GOME-2+IASI retrievals compared to TROPOMI+CrIS, which would explain some of the differences in capabilities to retrieve lowermost-tropospheric O3 enhancements.
Systematic biases in O3 profile retrievals when compared to raw observations can largely be explained by biases and the shape of the a priori vertical profiles (e.g., Kulawik et al., 2006; Zhang et al., 2010; Johnson et al., 2018; Malina et al., 2022). However, this study focuses on systematic and random biases in O3 profile retrievals when compared to observations convolved with individual retrievals' operational operators to remove the impact of a priori profile information. Additional sources of error from sza, surface albedo, and cloud fraction were determined in this study to be controlling factors for systematic bias. All three retrievals had similar bias impacts from sza, surface albedo, and cloud fraction, so here we discuss the analysis of UV + IR retrievals only. When comparing TOPAS UV + IR retrievals to all co-located convolved TOLNet retrievals, it was determined that the daily averaged bias was 14.4 ppb. When separating this for high (> 60°) and low (< 60°) sza it was found that systematic biases were larger (18.3 ppb) for high-sza conditions compared to low-sza conditions (13.1 ppb). Minimal impact was calculated for RMSE values for high and low sza pixels (∼ 15.0 ppb). The dependance of satellite O3 profile retrievals in the troposphere on sza has also been shown in recent TROPOMI and TOPAS validation studies (e.g., Mettig et al., 2021, 2022). As sza values become large, the sensitivity of the retrieval in the troposphere is reduced, leading to increased biases in the satellite products. Surface albedo has also been demonstrated to be a controlling factor for the accuracy of tropospheric O3 retrievals. This validation study using TOLNet observations further confirms this. When separating the TOPAS validation for high (> 0.2) and low (< 0.2) albedo values it was found that systematic biases were larger (16.4 ppb) for low-albedo conditions compared to high-surface-reflectivity conditions (12.8 ppb). RMSE values, representative of unresolved errors in the retrievals, were larger for low-albedo conditions (16.9 ppb) compared to high-reflectivity scenes (12.2 ppb). Cloud interference can impact retrievals of most atmospheric constituents such as O3 profiles. Here it was determined that while systematic biases for low-cloud scenes (cloud fraction < 0.2) and times of high clouds (cloud fraction > 0.2) were similar (∼ 14 ppb), RMSE values were larger for cloudy scenes (17.1 ppb) compared to clear pixels (13.5 ppb). This study further emphasizes that clouds can have a detrimental impact on the accuracy and uncertainties in O3 profile retrievals.
This study applied the full complement of TOLNet observations (six out of eight systems were operational between 2018–2019) to validate UV-only TROPOMI, IR-only CrIS, and UV+TIR TROPOMI/CrIS TOPAS O3 profile retrievals. TOLNet proved to be a vital validation tool for satellite tropospheric O3 retrievals. TOLNet data provide (a) highly accurate, high-temporal-resolution O3 observations for multiple continuous hours and/or days; (b) retrievals with minimal dependance on a priori information; and (c) profiles with higher vertical resolution compared to satellite products. The multi-hour observations provided by TOLNet will be important for validation of tropospheric O3 profiles and the lowermost-tropospheric (0–2 km) partial columns from the recently launched geostationary TEMPO mission. As a primary validation data source for TEMPO, TOLNet will make dedicated validation observations for this geostationary sensor during all times of the day. These observations will provide hourly tropospheric O3 observations during all seasons, which will greatly increase the amount of data from TOLNet needed for seasonal validation, which was not available for this study.
TOLNet was used to intercompare the three retrievals, using idealized case studies by convolving high-resolution lidar profiles with retrieval-specific averaging kernels of TROPOMI UV, CrIS IR, and TROPOMI/CrIS UV + IR based on the TOPAS algorithm of the University of Bremen. All three retrievals were determined to be able to reproduce typical O3 profiles. However, the results differed more for physicochemical environments which deviate from typical clean conditions. Retrievals using combinations of wavelengths proved to be more capable of capturing conditions with air quality impacts such as stratospheric intrusions. UV + IR O3 profiles most accurately observed O3 profiles throughout the troposphere during times of enhanced middle- and upper-tropospheric O3 concentrations such as what occurs during stratospheric intrusions. For near-surface O3 pollution conditions, all three retrievals were not able to accurately replicate enhancements in the lowermost troposphere due to minimal sensitivity to this portion of the atmosphere. The reason that combined-wavelength retrievals (UV + IR) outperform the single-wavelength data products (UV, IR) is the increased vertical resolution and sensitivity to O3 in the troposphere, aiding in the ability to deviate further from the a priori profile shape. This analysis of retrieval performance in air-quality-relevant environments is unique to this study in comparison to other TROPOMI, CrIS, and TROPOMI/CrIS intercomparison studies (e.g., Mettig et al., 2022; Malina et al., 2022).
TOPAS O3 profiles from TROPOMI UV, CrIS IR, and TROPOMI/CrIS UV + IR retrievals were validated with TOLNet and ozonesonde observations. The validation results using the two observational data sets were overall consistent. Compared to TOLNet-A, UV-only TROPOMI retrievals had mean biases which meet the defined systematic bias requirement of ± 30 % (ESA, 2014) throughout the troposphere. The CrIS IR-only retrieval of O3 profiles meets the systematic bias requirement of ± 10 % defined for this spaceborne sensor (JPSS, 2019) from the surface to ∼ 10 km a.s.l., and above 10 km a.s.l. the CrIS IR-only retrievals exceeded this systematic bias requirement. Finally, the combined UV + IR retrievals consistently had NMB values lower than ± 10 % at all altitudes in the troposphere. The primary drivers of systematic biases were determined to be sza, surface albedo, and cloud fraction. The accuracy of all three retrievals tends to be degraded with increasing sza and cloud fraction and lower surface albedo values.
Just as important as systematic bias, this study validated the TROPOMI UV, CrIS IR, and TROPOMI/CrIS UV + IR TOPAS retrievals for daily unresolved errors. Random error (uncertainty) requirements for TROPOMI UV O3 profile retrievals are ± 10 % (ESA, 2014) and ± 25 % for CrIS IR profiles in the troposphere (JPSS, 2019). The validation of UV-only, IR-only, and UV + IR retrievals using the TOLNet-A observations resulted in troposphere-averaged RMSE values of 19.8 %, 12.6 %, and 14.6 %, respectively. TROPOMI UV-only profiles evaluated here do not meet the uncertainty requirements defined by the ESA. CrIS IR-only retrievals do meet the uncertainty requirements defined by the mission. The ability of the retrievals to deviate from the a priori profile shape assumption is key to lower systematic bias and unresolved error. UV-only retrievals have the least sensitivity to O3 in the troposphere, leading to posterior vertical profiles with a nearly identical shape compared to the a priori (see Fig. 5). The improved sensitivity of IR wavelengths to O3 in the troposphere allows IR-only and UV + IR retrievals to deviate further from the shape of the a priori, resulting in lower systematic biases and unresolved errors (see Fig. 5 and Table 3).
The results of this validation study can be used to understand the biases and random errors associated with TROPOMI UV, CrIS IR, and TROPOMI/CrIS UV + IR retrievals. While this study is specific to the TOPAS algorithm, it reflects the overall accuracy and precision of TROPOMI and CrIS O3 vertical profiles in the troposphere. The satellite retrievals provide useful information for understanding tropospheric O3; however, the sensitivity of TROPOMI UV-only retrievals is still a limiting factor for accurately assessing variability in tropospheric O3. IR retrievals from CrIS provide enhanced sensitivity to tropospheric O3; however, it is limited by the coarse spatial resolution of the sensor and lack of sensitivity to O3 in the stratosphere. Combining these retrievals improves the ability to observe tropospheric O3 to some degree. Future work should consider building on the many studies which have retrieved tropospheric O3 profiles with the combination of individual satellite retrievals with different wavelength ranges (e.g., J. Worden et al., 2007; Fu et al., 2013, 2018; Cuesta et al., 2013; Colombi et al., 2021; Mettig et al., 2022; Malina et al., 2022) in order to continue improving the sensitivity of spaceborne retrievals of O3 in the troposphere. TOLNet will make dedicated observations for TEMPO validation to evaluate the combination of UV+VIS wavelengths. The UV+VIS retrievals have enhanced lowermost-tropospheric sensitivity, and in combination with the sensor's high spatiotemporal resolution, should provide important spaceborne information of the tropospheric column and lowermost-tropospheric O3. While TEMPO O3 profile and partial column data were not available at the time of this publication, preliminary analysis suggests that the UV+VIS-derived 0–2 km partial column product from this geostationary sensor should have DOF values between 0.2–0.3 (Natraj et al., 2011; Zoogman et al., 2016; Johnson et al., 2018). An important result of this study was showing that TOLNet is a sufficient validation data source for satellite retrievals since TOLNet has been identified as the primary data source for validation of TEMPO O3 in the troposphere.
The TOLNet data used for the satellite data validation are available for download (https://tolnet.larc.nasa.gov/download, TOLNet Science Team, 2024). The TOPAS satellite retrievals are available upon request to the corresponding author and University of Bremen coauthors. Ozonesonde data can be downloaded for GML (https://gml.noaa.gov/dv/data/index.php?category=Ozone&type=Balloon&site=BLD, Johnson, 2024), HUB, HMI, and UMBC (https://www-air.larc.nasa.gov/cgi-bin/ArcView/owlets.2018?SONDE=1, Sullivan, 2024a), FLP (https://www-air.larc.nasa.gov/cgi-bin/ArcView/listos?GROUND-FLAX-POND=1, Everette, 2024), WCT (https://www-air.larc.nasa.gov/cgi-bin/ArcView/listos?GROUND-WESTPORT=1, Berkoff, 2024), and RU (https://www-air.larc.nasa.gov/cgi-bin/ArcView/listos?GROUND-RUTGERS=1, Sullivan, 2024b). Ozonesondes from UAH can be acquired by email to the corresponding author.
The supplement related to this article is available online at: https://doi.org/10.5194/amt-17-2559-2024-supplement.
MSJ, JS, and MJN were responsible for acquiring the funding for this study. MSJ designed the technical methods and performed the experiments. AR, MW, and NM developed and produced the satellite retrieval data applied in this study. JS, MJN, SK, TL, FC, TAB, GG, RJA, AOL, CJS, GK, BC, and LT were instrumental in obtaining and providing the lidar data used for validation. MSJ prepared the paper with contributions from all coauthors.
At least one of the (co-)authors is a member of the editorial board of Atmospheric Measurement Techniques. The peer-review process was guided by an independent editor, and the authors also have no other competing interests to declare.
The views, opinions, and findings contained in this report are those of the authors and should not be construed as an official NASA or United States Government position, policy, or decision.
Publisher’s note: Copernicus Publications remains neutral with regard to jurisdictional claims made in the text, published maps, institutional affiliations, or any other geographical representation in this paper. While Copernicus Publications makes every effort to include appropriate place names, the final responsibility lies with the authors.
Resources supporting this work were provided by the NASA high-end computing (HEC) program through the NASA Advanced Supercomputing (NAS) Division at NASA Ames Research Center. Some calculations were performed on high-performance computing (HPC) facilities of the IUP, University of Bremen, funded under DFG/FUGG grant nos. INST 144/379-1 and INST 144/493-1. The authors gratefully acknowledge the computing time granted by the Resource Allocation Board and provided on the supercomputer Lise at NHR@Berlin as part of the national high-performance computing infrastructure. The calculations for this research were conducted with computing resources under the hbp00072 project. GALAHAD Fortran Library was used for calculations. Retrievals use the GALAHAD Fortran library. The S5P L1b version 2 data are provided by ESA/KNMI via the S5P validation team (S5P-VT) activities. Level 1 and level 2 products from CrIS used in the retrieval are provided by NASA.
Matthew S. Johnson, John Sullivan, Michael J. Newchurch, Shi Kuang, Thierry Leblanc, Fernando Chouza, Timothy A. Berkoff, Guillaume Gronoff, Raul J. Alvarez, Andrew O. Langford, Christoph J. Senff, Guillaume Kirgis, Brandi McCarty, and Larry Twigg received funding from the NASA Tropospheric Composition Program through the TOLNet Science Team. The TROPOMI retrievals at the University of Bremen and Alexei Rozanov, Mark Weber, and Nora Mettig were funded by the BMWi/German Aerospace Center (DLR) S5P Datennutzung project (Förderkennzeichen 50EE1811A), the University of Bremen, and the federal state of Bremen. Kevin B. Strawbridge provided lidar retrievals through in-kind efforts.
This paper was edited by Sandip Dhomse and reviewed by Richard Pope and two anonymous referees.
Alvarez, R. J., Senff, C. J., Langford, A. O., Weickmann, A. M., Law, D. C., Machol, J. L., Merritt, D. A., Marchbanks, R. D., Sandberg, S. P., Brewer, W. A., Hardesty, R. M., and Banta, R. M.: Development and Application of a Compact, Tunable, Solid-State Airborne Ozone Lidar System for Boundary Layer Profiling, J. Atmos. Ocean Tech., 28, 1258–1272, https://doi.org/10.1175/jtech-d-10-05044.1, 2011.
Bak, J., Liu, X., Wei, J. C., Pan, L. L., Chance, K., and Kim, J. H.: Improvement of OMI ozone profile retrievals in the upper troposphere and lower stratosphere by the use of a tropopause-based ozone profile climatology, Atmos. Meas. Tech., 6, 2239–2254, https://doi.org/10.5194/amt-6-2239-2013, 2013.
Beer, R., Glavich, T. A., and Rider, D. M.: Tropospheric emission spectrometer for the Earth Observing System's Aura satellite, Appl. Opt., 40, 2356–2367, https://doi.org/10.1364/AO.40.002356, 2001.
Berkoff, T.: WCT, NASA [data set], https://www-air.larc.nasa.gov/cgi-bin/ArcView/listos?GROUND-WESTPORT=1, last access: 26 April 2024.
Boynard, A., Clerbaux, C., Coheur, P.-F., Hurtmans, D., Turquety, S., George, M., Hadji-Lazaro, J., Keim, C., and Meyer-Arnek, J.: Measurements of total and tropospheric ozone from IASI: comparison with correlative satellite, ground-based and ozonesonde observations, Atmos. Chem. Phys., 9, 6255–6271, https://doi.org/10.5194/acp-9-6255-2009, 2009.
Burrows, J. P., Weber, M., Buchwitz, M., Rozanov, V., Ladstätter-Weißenmayer, A., Richter, A., Debeek, R., Hoogen, R., Bramstedt, K., Eichmann, K.-U., Eisinger, M., and Perner, D.: The Global Ozone Monitoring Experiment (GOME): Mission concept and first results, J. Atmos. Sci., 56, 151–175, https://doi.org/10.1175/1520-0469(1999)056<0151:TGOMEG>2.0.CO;2, 1999.
Callies, J., Corpaccioli, E., Eisinger, M., Hahne, A., and Lefebvre, A.: GOME-2 – Metop's Second-Generation, Sensor for Operational Ozone Monitoring, ESA Bulletin number 102, May 2000, 28–36, https://www.esa.int/esapub/bulletin/bullet102/Callies102.pdf (last access: 26 April 2024), 2000.
Chahine, M. T., Pagano, T. S., Aumann, H. H., Atlas, R., Barnet, C., Blaisdell, J., Chen, L., Divakarla, M., Fetzer, E. J., Goldberg, M., Gautier, C., Granger, S., Hannon, S., Irion, F. W., Kakar, R., Kalnay, E., Lambrigtsen, B. H., Lee, S.-Y., Marshall, J. L., Mcmillan, W. W., Mcmillin, L., Olsen, E. T., Revercomb, H., Rosenkranz, P., Smith, W. L., Staelin, D., Strow, L. L., Susskind, J., Tobin, D., Wolf, W., and Zhou, L.: AIRS: Improving Weather Forecasting and Providing New Data on Greenhouse Gases, B. Am. Meteorol. Soc., 87, 911–926, https://doi.org/10.1175/BAMS-87-7-911, 2006.
Chance, K., Burrows, J., Perner, D., and Schneider, W.: Satellite measurements of atmospheric ozone profiles, including tropospheric ozone, from ultraviolet/visible measurements in the nadir geometry: a potential method to retrieve tropospheric ozone, J. Quant. Spectrosc. Ra., 57, 467–476, https://doi.org/10.1016/S0022-4073(96)00157-4, 1997.
Chance, K., Liu, X., Suleiman, R. M., Flittner, D. E., Al-Saadi, J., and Janz, S. J.: Tropospheric emissions: monitoring of pollution (TEMPO), in: Earth Observing Systems XVIII, Earth Observing Systems XVIII, Soc. Photo-Optical Instrum. Eng. (SPIE), 8866, 88660D, https://doi.org/10.1117/12.2024479, 2013.
Clerbaux, C., Turquety, S., and Coheur, P. F.: Infrared remote sensing of atmospheric composition and air quality: Towards operational applications, Compt. Rendus Geosci., 342, 349–356, https://doi.org/10.1016/j.crte.2009.09.010, 2010.
Colombi, N., Miyazaki, K., Bowman, K. W., Neu, J. L., and Jacob, D. J.: A new methodology for inferring surface ozone from multispectral satellite measurements, Environ. Res. Lett., 16, 105005, https://doi.org/10.1088/1748-9326/ac243d, 2021.
Cooper, O. R., Parrish, D. D., Ziemke, J., Balashov, N. V., Cupeiro, M., Galbally, I. E., Gilge, S., Horowitz, L., Jensen, N. R., Lamarque, J.-F., Naik, V., Oltmans, S. J., Schwab, J., Shindell, D. T., Thompson, A. M., Thouret, V., Wang, Y., and Zbinden, R. M.: Global distribution and trends of tropospheric ozone: An observation-based review, Elem. Sci. Anth., 2, 000029 p., https://doi.org/10.12952/journal.elementa.000029, 2014.
Costantino, L., Cuesta, J., Emili, E., Coman, A., Foret, G., Dufour, G., Eremenko, M., Chailleux, Y., Beekmann, M., and Flaud, J.-M.: Potential of multispectral synergism for observing ozone pollution by combining IASI-NG and UVNS measurements from the EPS-SG satellite, Atmos. Meas. Tech., 10, 1281–1298, https://doi.org/10.5194/amt-10-1281-2017, 2017.
Cuesta, J., Eremenko, M., Liu, X., Dufour, G., Cai, Z., Höpfner, M., von Clarmann, T., Sellitto, P., Foret, G., Gaubert, B., Beekmann, M., Orphal, J., Chance, K., Spurr, R., and Flaud, J.-M.: Satellite observation of lowermost tropospheric ozone by multispectral synergism of IASI thermal infrared and GOME-2 ultraviolet measurements over Europe, Atmos. Chem. Phys., 13, 9675–9693, https://doi.org/10.5194/acp-13-9675-2013, 2013.
Cuesta, J., Kanaya, Y., Takigawa, M., Dufour, G., Eremenko, M., Foret, G., Miyazaki, K., and Beekmann, M.: Transboundary ozone pollution across East Asia: daily evolution and photochemical production analysed by IASI + GOME2 multispectral satellite observations and models, Atmos. Chem. Phys., 18, 9499–9525, https://doi.org/10.5194/acp-18-9499-2018, 2018.
De Young, R., Carrion, W., Ganoe, R., Pliutau, D., Gronoff, G., Berkoff, T., and Kuang, S.: Langley mobile ozone lidar: ozone and aerosol atmospheric profiling for air quality research, Appl. Opt., 56, 721–730, https://doi.org/10.1364/ao.56.000721, 2017.
European Space Agency, Requirements for the Geophysical Validation of Sentinel-5 Precursor Products, written by Sentinel-5 Precursor Team, S5P-RS-ESA-SY-164, https://sentinel.esa.int/documents/247904/2474724/Sentinel-5P-Science-Validation-Implementation-Plan (last access: 26 April 2024), 2014.
Everette, J.: FLP, NASA [data set], https://www-air.larc.nasa.gov/cgi-bin/ArcView/listos?GROUND-FLAX-POND=1, last access: 26 April 2024.
Farris, B. M., Gronoff, G. P., Carrion, W., Knepp, T., Pippin, M., and Berkoff, T. A.: Demonstration of an off-axis parabolic receiver for near-range retrieval of lidar ozone profiles, Atmos. Meas. Tech., 12, 363–370, https://doi.org/10.5194/amt-12-363-2019, 2019.
Fu, D., Worden, J. R., Liu, X., Kulawik, S. S., Bowman, K. W., and Natraj, V.: Characterization of ozone profiles derived from Aura TES and OMI radiances, Atmos. Chem. Phys., 13, 3445–3462, https://doi.org/10.5194/acp-13-3445-2013, 2013.
Fu, D., Kulawik, S. S., Miyazaki, K., Bowman, K. W., Worden, J. R., Eldering, A., Livesey, N. J., Teixeira, J., Irion, F. W., Herman, R. L., Osterman, G. B., Liu, X., Levelt, P. F., Thompson, A. M., and Luo, M.: Retrievals of tropospheric ozone profiles from the synergism of AIRS and OMI: methodology and validation, Atmos. Meas. Tech., 11, 5587–5605, https://doi.org/10.5194/amt-11-5587-2018, 2018.
Gronoff, G., Robinson, J., Berkoff, T., Swap, R., Farris, B., Schroeder, J., Halliday, H. S., Knepp, T., Spinei, E., Carrion, W., Adcock, E. E., Johns, Z., Allen, D., and Pippin, M.: A Method for Quantifying near Range Point Source Induced O3 Titration Events Using Co-Located Lidar and Pandora Measurements, Atmos. Environ., 204, 43–52, https://doi.org/10.1016/j.atmosenv.2019.01.052, 2019.
Han, Y., Revercomb, H., Cromp, M., Gu, D., Johnson, D., Mooney, D., Scott, D., Strow, L., Bingham, G., Borg, L., Chen, Y., DeSlover, D., Esplin, M., Hagan, D., Jin, X., Knuteson, R., Motteler, H., Predina, J., Suwinski, L., Taylor, J., Tobin, D., Tremblay, D., Wang, C., Wang, L., Wang, L., and Zavyalov, V.: Suomi NPP CrIS measurements, sensor data record algorithm, calibration and validation activities, and record data quality, J. Geophys. Res.-Atmos., 118, 12734–12748, https://doi.org/10.1002/2013JD020344, 2013.
Hersbach, H., Bell, B., Berrisford, P., Hirahara, S., Horányi, A., Muñoz-Sabater, J., Nicolas, J., Peubey, C., Radu, R., Schepers, D., Simmons, A., Soci, C., Abdalla, S., Abellan, X., Balsamo, G., Bechtold, P., Biavati, G., Bidlot, J., Bonavita, M., Chiara, G., Dahlgren, P., Dee, D., Diamantakis, M., Dragani, R., Flemming, J., Forbes, R., Fuentes, M., Geer, A., Haimberger, L., Healy, S., Hogan, R. J., Hólm, E., Janisková, M., Keeley, S., Laloyaux, P., Lopez, P., Lupu, C., Radnoti, G., Rosnay, P., Rozum, I., Vamborg, F., Villaume, S., and Thépaut, J.-N.: The ERA5 global reanalysis, Q. J. Roy. Meteorol. Soc., 146, 1999–2049, https://doi.org/10.1002/qj.3803, 2020.
Hoogen, R., Rozanov, V. V., and Burrows, J. P.: Ozone profiles from GOME satellite data: Algorithm description and first validation, J. Geophys. Res.-Atmos., 104, 8263–8280, https://doi.org/10.1029/1998JD100093, 1999.
Huang, G., Liu, X., Chance, K., Yang, K., Bhartia, P. K., Cai, Z., Allaart, M., Ancellet, G., Calpini, B., Coetzee, G. J. R., Cuevas-Agulló, E., Cupeiro, M., De Backer, H., Dubey, M. K., Fuelberg, H. E., Fujiwara, M., Godin-Beekmann, S., Hall, T. J., Johnson, B., Joseph, E., Kivi, R., Kois, B., Komala, N., König-Langlo, G., Laneve, G., Leblanc, T., Marchand, M., Minschwaner, K. R., Morris, G., Newchurch, M. J., Ogino, S.-Y., Ohkawara, N., Piters, A. J. M., Posny, F., Querel, R., Scheele, R., Schmidlin, F. J., Schnell, R. C., Schrems, O., Selkirk, H., Shiotani, M., Skrivánková, P., Stübi, R., Taha, G., Tarasick, D. W., Thompson, A. M., Thouret, V., Tully, M. B., Van Malderen, R., Vömel, H., von der Gathen, P., Witte, J. C., and Yela, M.: Validation of 10-year SAO OMI Ozone Profile (PROFOZ) product using ozonesonde observations, Atmos. Meas. Tech., 10, 2455–2475, https://doi.org/10.5194/amt-10-2455-2017, 2017.
Hurtmans, D., Coheur, P.-F., Wespes, C., Clarisse, L., Scharf, O., Clerbaux, C., Hadji-Lazaro, J., George, M., and Turquety, S.: FORLI radiative transfer and retrieval code for IASI, J. Quant. Spectrosc. Ra., 113, 1391–1408, https://doi.org/10.1016/j.jqsrt.2012.02.036, 2012.
Johnson, B.: Vertical Profile of Ozone from Balloon flight, GML [data set], https://gml.noaa.gov/dv/data/index.php?category=Ozone&type=Balloon&site=BLD, last access: 26 April 2024.
Johnson, M. S., Liu, X., Zoogman, P., Sullivan, J., Newchurch, M. J., Kuang, S., Leblanc, T., and McGee, T.: Evaluation of potential sources of a priori ozone profiles for TEMPO tropospheric ozone retrievals, Atmos. Meas. Tech., 11, 3457–3477, https://doi.org/10.5194/amt-11-3457-2018, 2018.
Joint Polar Satellite System (JPSS) Level 1 Requirements Document Supplement (L1RDS) – Final, JPSS-REQ-1002/470-00032, Revision 2.11, https://www.nesdis.noaa.gov/s3/2022-03/L1RDS.pdf (last access: 26 April 2024), 2019.
Kauppi, A., Tuinder, O. N. E., Tukiainen, S., Sofieva, V., and Tamminen, J.: Comparison of GOME-2/Metop-A ozone profiles with GOMOS, OSIRIS and MLS measurements, Atmos. Meas. Tech., 9, 249–261, https://doi.org/10.5194/amt-9-249-2016, 2016.
Keim, C., Eremenko, M., Orphal, J., Dufour, G., Flaud, J.-M., Höpfner, M., Boynard, A., Clerbaux, C., Payan, S., Coheur, P.-F., Hurtmans, D., Claude, H., Dier, H., Johnson, B., Kelder, H., Kivi, R., Koide, T., López Bartolomé, M., Lambkin, K., Moore, D., Schmidlin, F. J., and Stübi, R.: Tropospheric ozone from IASI: comparison of different inversion algorithms and validation with ozone sondes in the northern middle latitudes, Atmos. Chem. Phys., 9, 9329–9347, https://doi.org/10.5194/acp-9-9329-2009, 2009.
Keppens, A., Lambert, J.-C., Granville, J., Hubert, D., Verhoelst, T., Compernolle, S., Latter, B., Kerridge, B., Siddans, R., Boynard, A., Hadji-Lazaro, J., Clerbaux, C., Wespes, C., Hurtmans, D. R., Coheur, P.-F., van Peet, J. C. A., van der A, R. J., Garane, K., Koukouli, M. E., Balis, D. S., Delcloo, A., Kivi, R., Stübi, R., Godin-Beekmann, S., Van Roozendael, M., and Zehner, C.: Quality assessment of the Ozone_cci Climate Research Data Package (release 2017) – Part 2: Ground-based validation of nadir ozone profile data products, Atmos. Meas. Tech., 11, 3769–3800, https://doi.org/10.5194/amt-11-3769-2018, 2018.
Kroon, M., de Haan, J. F., Veefkind, J. P., Froidevaux, L., Wang, R., Kivi, R., and Hakkarainen, J. J.: Validation of operational ozone profiles from the Ozone Monitoring Instrument, J. Geophys. Res., 116, D18305, https://doi.org/10.1029/2010JD015100, 2011.
Kuang, S., Newchurch, M. J., Burris, J., and Liu, X.: Ground-based lidar for atmospheric boundary layer ozone measurements, Appl. Opt., 52, 3557–3566, https://doi.org/10.1364/ao.52.003557, 2013.
Kulawik, S. S., Worden, H., Osterman, G., Luo, M., Beer, R., Kinnison, D. E., Bowman, K. W., Worden, J., Eldering, A., Lampel, M., Steck, T., and Rodgers, C. D.: TES atmospheric profile retrieval characterization: An orbit of simulated observations, Philos. T. Roy. Soc. S-A, 44, 1324–1333, https://doi.org/10.1109/TGRS.2006.871207, 2006.
Lamsal, L. N., Weber, M., Tellmann, S., and Burrows, J. P.: Ozone column classified climatology of ozone and temperature profiles based on ozonesonde and satellite data, J. Geophys. Res.-Atmos., 109, D20304, https://doi.org/10.1029/2004JD004680, 2004.
Landgraf, J. and Hasekamp, O. P.: Retrieval of tropospheric ozone: The synergistic use of thermal infrared emission and ultraviolet reflectivity measurements from space, J. Geophys. Res.-Atmos., 112, 8310, https://doi.org/10.1029/2006JD008097, 2007.
Leblanc, T., Sica, R. J., van Gijsel, J. A. E., Haefele, A., Payen, G., and Liberti, G.: Proposed standardized definitions for vertical resolution and uncertainty in the NDACC lidar ozone and temperature algorithms – Part 3: Temperature uncertainty budget, Atmos. Meas. Tech., 9, 4079–4101, https://doi.org/10.5194/amt-9-4079-2016, 2016.
Leblanc, T., Brewer, M. A., Wang, P. S., Granados-Muñoz, M. J., Strawbridge, K. B., Travis, M., Firanski, B., Sullivan, J. T., McGee, T. J., Sumnicht, G. K., Twigg, L. W., Berkoff, T. A., Carrion, W., Gronoff, G., Aknan, A., Chen, G., Alvarez, R. J., Langford, A. O., Senff, C. J., Kirgis, G., Johnson, M. S., Kuang, S., and Newchurch, M. J.: Validation of the TOLNet lidars: the Southern California Ozone Observation Project (SCOOP), Atmos. Meas. Tech., 11, 6137–6162, https://doi.org/10.5194/amt-11-6137-2018, 2018.
Lefohn, A. S., Malley, C. S., Smith, L., Wells, B., Hazucha, M., Simon, H., Naik, V., Mills, G., Schultz, M. G., Paoletti, E., De Marco, A., Xu, X. B., Zhang, L., Wang, T., Neufeld, H. S., Musselman, R. C., Tarasick, D., Brauer, M., Feng, Z. Z., Tang, H. Y., Kobayashi, K., Sicard, P., Solberg, S., and Gerosa, G.: Tropospheric ozone assessment report: Global ozone metrics for climate change, human health, and crop/ecosystem research, Elementa, 6, 27, https://doi.org/10.1525/elementa.279, 2018.
Liu, X., Chance, K. V., Sioris, C. E., Spurr, R. J. D., Kurosu, T. P., Martin, R. V., and Newchurch, M. J.: Ozone profile and tropospheric ozone retrievals from the Global Ozone Monitoring Experiment: Algorithm description and validation, J. Geophys. Res., 110, D20307, https://doi.org/10.1029/2005JD006240, 2005.
Liu, X., Bhartia, P. K., Chance, K., Spurr, R. J. D., and Kurosu, T. P.: Ozone profile retrievals from the Ozone Monitoring Instrument, Atmos. Chem. Phys., 10, 2521–2537, https://doi.org/10.5194/acp-10-2521-2010, 2010.
Ma, P., Chen, L., Wang, Z., Zhao, S., Li, Q., Tao, M., and Wang, Z.: Ozone Profile Retrievals from the Cross-Track Infrared Sounder, IEEE Trans. Geosci. Remote Sens., 54, 3985–3994, 2016.
Malina, E., Bowman, K. W., Kantchev, V., Kuai, L., Kurosu, T. P., Miyazaki, K., Natraj, V., Osterman, G. B., and Thill, M. D.: Joint spectral retrievals of ozone with Suomi NPP CrIS augmented by S5P/TROPOMI, EGUsphere [preprint], https://doi.org/10.5194/egusphere-2022-774, 2022.
Mettig, N., Weber, M., Rozanov, A., Arosio, C., Burrows, J. P., Veefkind, P., Thompson, A. M., Querel, R., Leblanc, T., Godin-Beekmann, S., Kivi, R., and Tully, M. B.: Ozone profile retrieval from nadir TROPOMI measurements in the UV range, Atmos. Meas. Tech., 14, 6057–6082, https://doi.org/10.5194/amt-14-6057-2021, 2021.
Mettig, N., Weber, M., Rozanov, A., Burrows, J. P., Veefkind, P., Thompson, A. M., Stauffer, R. M., Leblanc, T., Ancellet, G., Newchurch, M. J., Kuang, S., Kivi, R., Tully, M. B., Van Malderen, R., Piters, A., Kois, B., Stübi, R., and Skrivankova, P.: Combined UV and IR ozone profile retrieval from TROPOMI and CrIS measurements, Atmos. Meas. Tech., 15, 2955–2978, https://doi.org/10.5194/amt-15-2955-2022, 2022.
McDermid, I. S., Beyerle, G., Haner, D. A., and Leblanc, T.: Redesign and improved performance of the tropospheric ozone lidar at the Jet Propulsion Laboratory Table Mountain Facility, Appl. Opt., 41, 7550–7555, 2002.
Miles, G. M., Siddans, R., Kerridge, B. J., Latter, B. G., and Richards, N. A. D.: Tropospheric ozone and ozone profiles retrieved from GOME-2 and their validation, Atmos. Meas. Tech., 8, 385–398, https://doi.org/10.5194/amt-8-385-2015, 2015.
Natraj, V., Liu, X., Kulawik, S. S., Chance, K., Chatfield, R., Edwards, D. P., Eldering, A., Francis, G., Kurosu, T., Pickering, K., Spurr, R., and Worden, H.: Multispectral sensitivity studies for the retrieval of tropospheric and lowermost tropospheric ozone from simulated clear sky GEO-CAPE measurements, Atmos. Environ., 45, 7151–7165, https://doi.org/10.1016/j.atmosenv.2011.09.014, 2011.
Newchurch, M. J., Kuang, S., Leblanc, T., Alvarez, R. J., Langford, A. O., Senff, C. J., Burris, J. F., McGee, T. J., Sullivan, J. T., DeYoung, R. J., Al-Saadi, J., Johnson, M., and Pszenny, A.: TOLNET – A Tropospheric Ozone Lidar Profiling Network for Satellite Continuity and Process Studies, EPJ Web of Conferences, 119, 20001, https://doi.org/10.1051/epjconf/201611920001, 2016.
Pope, R. J., Kerridge, B. J., Siddans, R., Latter, B. G., Chipperfield, M. P., Feng, W., Pimlott, M. A., Dhomse, S. S., Retscher, C., and Rigby, R.: Investigation of spatial and temporal variability in lower tropospheric ozone from RAL Space UV–Vis satellite products, Atmos. Chem. Phys., 23, 14933–14947, https://doi.org/10.5194/acp-23-14933-2023, 2023.
Rodgers, C. D.: Inverse methods for atmospheric sounding: Theory and practice, in: Series on atmospheric oceanic and planetary physics: Volume 2, World Scientific, Singapore, https://doi.org/10.1142/3171, 2002.
Rozanov, A., Kühl, S., Doicu, A., McLinden, C., Puķīte, J., Bovensmann, H., Burrows, J. P., Deutschmann, T., Dorf, M., Goutail, F., Grunow, K., Hendrick, F., von Hobe, M., Hrechanyy, S., Lichtenberg, G., Pfeilsticker, K., Pommereau, J. P., Van Roozendael, M., Stroh, F., and Wagner, T.: BrO vertical distributions from SCIAMACHY limb measurements: comparison of algorithms and retrieval results, Atmos. Meas. Tech., 4, 1319–1359, https://doi.org/10.5194/amt-4-1319-2011, 2011.
Serdyuchenko, A., Gorshelev, V., Weber, M., Chehade, W., and Burrows, J. P.: High spectral resolution ozone absorption cross-sections – Part 2: Temperature dependence, Atmos. Meas. Tech., 7, 625–636, https://doi.org/10.5194/amt-7-625-2014, 2014.
Sterling, C. W., Johnson, B. J., Oltmans, S. J., Smit, H. G. J., Jordan, A. F., Cullis, P. D., Hall, E. G., Thompson, A. M., and Witte, J. C.: Homogenizing and estimating the uncertainty in NOAA's long-term vertical ozone profile records measured with the electrochemical concentration cell ozonesonde, Atmos. Meas. Tech., 11, 3661–3687, https://doi.org/10.5194/amt-11-3661-2018, 2018.
Strawbridge, K. B., Travis, M. S., Firanski, B. J., Brook, J. R., Staebler, R., and Leblanc, T.: A fully autonomous ozone, aerosol and nighttime water vapor lidar: a synergistic approach to profiling the atmosphere in the Canadian oil sands region, Atmos. Meas. Tech., 11, 6735–6759, https://doi.org/10.5194/amt-11-6735-2018, 2018.
Strow, L. L., Motteler, H., Tobin, D., Revercomb, H., Hannon, S., Buijs, H., Predina, J., Suwinski, L., and Glumb, R.: Spectral calibration and validation of the Cross-track Infrared Sounder on the Suomi NPP satellite, J. Geophys. Res.-Atmos., 118, 12486–12496, https://doi.org/10.1002/2013JD020480, 2013.
Sullivan, J.: HUB, HMI and UMBC, NASA [data set], https://www-air.larc.nasa.gov/cgi-bin/ArcView/owlets.2018?SONDE=1, last access: 26 April 2024a.
Sullivan, J.: RU, NASA [data set], https://www-air.larc.nasa.gov/cgi-bin/ArcView/listos?GROUND-RUTGERS=1, last access: 26 April 2024b.
Sullivan, J. T., McGee, T. J., Sumnicht, G. K., Twigg, L. W., and Hoff, R. M.: A mobile differential absorption lidar to measure sub-hourly fluctuation of tropospheric ozone profiles in the Baltimore–Washington, D.C. region, Atmos. Meas. Tech., 7, 3529–3548, https://doi.org/10.5194/amt-7-3529-2014, 2014.
Sullivan, J. T., Apituley, A., Mettig, N., Kreher, K., Knowland, K. E., Allaart, M., Piters, A., Van Roozendael, M., Veefkind, P., Ziemke, J. R., Kramarova, N., Weber, M., Rozanov, A., Twigg, L., Sumnicht, G., and McGee, T. J.: Tropospheric and stratospheric ozone profiles during the 2019 TROpomi vaLIdation eXperiment (TROLIX-19), Atmos. Chem. Phys., 22, 11137–11153, https://doi.org/10.5194/acp-22-11137-2022, 2022.
Tarasick, D., Galbally, I. E., Cooper, O. R., Schultz, M. G., Ancellet, G., Leblanc, T., Wallington, T. J., Ziemke, J. R., Liu, X., Steinbacher, M., Staehelin, J., Vigouroux, C., Hannigan, J. W., García, O., Foret, G., Zanis, P., Weatherhead, E., Petropavlovskikh, I., Worden, H. M., Osman, M., Liu, J. J., Chang, K.-L., Gaudel, A., Lin, M., Granados-Muñoz, M., Thompson, A. M., Oltmans, S. J., Cuesta, J., Dufour, G., Thouret, V., Hassler, B., Trickl, T., and Neu, J. L.: Tropospheric Ozone Assessment Report: Tropospheric ozone from 1877 to 2016, observed levels, trends and uncertainties, Elementa, 7, 39, https://doi.org/10.1525/elementa.376, 2019.
Thompson, A. M., Smit, H. G. J., Witte, J. C., Stauffer, R. M., Johnson, B. J., Morris, G., von der Gathen, P., Van Malderen, R., Davies, J., Piters, A., Allaart, M., Posny, F., Kivi, R., Cullis, P., Hoang Anh, N. T., Corrales, E., Machinini, T., da Silva, F. R., Paiman, G., Thiong'o, K., Zainal, Z., Brothers, G. B., Wolff, K. R., Nakano, T., Stübi, R., Romanens, G., Coetzee, G. J. R., Diaz, J. A., Mitro, S., Mohamad, M., and Ogino, S.-Y.: Ozonesonde Quality Assurance: The JOSIE–SHADOZ (2017) Experience, B. Am. Meteorol. Soc., 100, 155–171, https://doi.org/10.1175/BAMS-D-17-0311.1, 2019.
Tikhonov, A. N.: Solution of incorrectly formulated problems and the regularization method, Soviet Math. Dokl., 4, 1035–1038, 1963.
TOLNet Science Team: TOLNet – Tropospheric Ozone Lidar Network, TOLNet [data set], https://tolnet.larc.nasa.gov/download, last access: 26 April 2024.
US Environmental Protection Agency (US EPA): Air Quality Criteria for Ozone and Related Photochemical Oxidants (2006 Final), U.S. Environmental Protection Agency, Washington, DC, EPA/600/R-05/004aF-cF, https://cfpub.epa.gov/ncea/risk/recordisplay.cfm?deid=149923 (last access: 26 April 2024), 2006.
van Oss, R. F., Voors, R. H. M., and Spurr, R. J. D.: Ozone profile algorithm, in: OMI Algorithm Theoretical Basis Document, Volume II, OMI Ozone Products, edited by: Bhartia, P. K., NASA Goddard Space Flight Center, Greenbelt, MD, 51–73, https://eospso.nasa.gov/sites/default/files/atbd/ATBD-OMI-02.pdf (last access: 26 April 2024), 2002.
Veefkind, J. P., Aben, I., McMullan, K., Förster, H., de Vries, J., Otter, G., Claas, J., Eskes, H. J., de Haan, J. F., Kleipool, Q., van Weele, M., Hasekamp, O., Hoogeveen, R., Landgraf, J., Snel, R., Tol, P., Ingmann, P., Voors, R., Kruizinga, B., Vink, R., Visser, H., and Levelt, P. F.: TROPOMI on the ESA Sentinel-5 Precursor: A GMES mission for global observations of the atmospheric composition for climate, air quality and ozone layer applications, Remote Sens. Environ., 120, 70–83, https://doi.org/10.1016/j.rse.2011.09.027, 2012.
Verstraeten, W. W., Boersma, K. F., Zörner, J., Allaart, M. A. F., Bowman, K. W., and Worden, J. R.: Validation of six years of TES tropospheric ozone retrievals with ozonesonde measurements: implications for spatial patterns and temporal stability in the bias, Atmos. Meas. Tech., 6, 1413–1423, https://doi.org/10.5194/amt-6-1413-2013, 2013.
WHO: Health aspects of air pollution with particulate matter, ozone and nitrogen dioxide: report on a WHO working group, Bonn, Germany 13–15 January 2003, https://iris.who.int/handle/10665/107478 (last access: 26 April 2024), 2003.
Worden, H. M., Logan, J. A., Worden, J. R., Beer, R., Bowman, K., Clough, S. A., Eldering, A., Fisher, B. M., Gunson, M. R., Herman, R. L., Kulawik, S. S., Lampel, M. C., Luo, M., Megretskaia, I. A., Osterman, G. B., and Shephard, M. W.: Comparisons of Tropospheric Emission Spectrometer (TES) ozone profiles to ozonesondes: Methods and initial results, J. Geophys. Res., 112, D03309, https://doi.org/10.1029/2006JD007258, 2007a.
Worden, J., Liu, X., Bowman, K., Chance, K., Beer, R., Eldering, A., Gunson, M., and Worden, H.: Improved tropospheric ozone profile retrievals using OMI and TES radiances, Geophys. Res. Lett., 34, L01809, https://doi.org/10.1029/2006GL027806, 2007b.
Witte, J. C., Thompson, A. M., Smit, H. G. J., Vömel, H., Posny, F., and Stübi, R.: First Reprocessing of Southern Hemisphere ADditional OZonesondes Profile Records: 3. Uncertainty in Ozone Profile and Total Column, J. Geophys. Res.-Atmos., 123, 3243–3268, https://doi.org/10.1002/2017JD027791, 2018.
Zhang, L., Jacob, D. J., Liu, X., Logan, J. A., Chance, K., Eldering, A., and Bojkov, B. R.: Intercomparison methods for satellite measurements of atmospheric composition: application to tropospheric ozone from TES and OMI, Atmos. Chem. Phys., 10, 4725–4739, https://doi.org/10.5194/acp-10-4725-2010, 2010.
Zoogman, P., Liu, X., Suleiman, R. M., Pennington, W. F., Flittner, D. E., Al-Saadi, J. A., Hilton, B. B., Nicks, D. K., Newchurch, M. J., Carr, J. L., Janz, S. J., Andraschko, M. R., Arola, A., Baker, B. D., Canova, B. P., Chan Miller, C., Cohen, R. C., Davis, J. E., Dussault, M. E., Edwards, D. P., Fishman, J., Ghulam, A., González Abad, G., Grutter, M., Herman, J. R., Houck, J., Jacob, D. J., Joiner, J., Kerridge, B. J., Kim, J., Krotkov, N. A., Lamsal, L., Li, C., Lindfors, A., Martin, R. V., McElroy, C. T., McLinden, C., Natraj, V., Neil, D. O., Nowlan, C. R., O'Sullivan, E. J., Palmer, P. I., Pierce, R. B., Pippin, M. R., Saiz-Lopez, A., Spurr, R. J. D., Szykman, J. J., Torres, O., Veefkind, J. P., Veihelmann, B., Wang, H., Wang, J., and Chance, K.: Tropospheric emissions: Monitoring of pollution (TEMPO), J. Quant. Spectrosc. Ra., 186, 17–39, https://doi.org/10.1016/j.jqsrt.2016.05.008, 2016.