the Creative Commons Attribution 4.0 License.
the Creative Commons Attribution 4.0 License.
 | 07 May 2024
An integrated uncrewed aerial vehicle platform with sensing and sampling systems for the measurement of air pollutant concentrations
Chen-Wei Liang
Chang-Hung Shen
In this study, an uncrewed aerial vehicle (UAV) platform with sensing and sampling systems was developed for three-dimensional (3D) measurements of air pollutant concentrations. The sensing system of this platform contains multiple microsensors and Internet of Things devices for determining the 3D distributions of four critical air pollutants and two meteorological parameters in real time. Moreover, the sampling system comprises remote-controllable gas sampling kits, each of which contains a 1 L Tedlar bag for the 3D measurement of volatile organic compound (VOC) concentrations according to the Toxic Organics-15 (TO-15) method of the US Environmental Protection Agency. The performance of the developed UAV platform was verified in experiments where it was used to detect air pollutant emissions from a large industrial zone in Taiwan that included a traditional industrial park, a precision machinery park, and a municipal waste incineration plant. Three locations were selected as field measurement sites according to the prevailing local wind direction. The vertical distributions of four critical air pollutants, the ambient temperature, and the relative humidity were determined from data gathered at the aforementioned sites in March and May 2023. A total of 56 and 72 chemical species were qualitatively and quantitatively analyzed in these two periods, respectively. The experimental results verified the feasibility of using the proposed UAV platform for accurately evaluating the air pollutant concentration distribution and transport in an industrial zone. The sampling system can be used as the sampling part of the TO-15 method, thus extending the method to measure the 3D distribution of VOCs in an area. The UAV platform can serve as a useful tool in the management of and decision-making process for air pollution in industrial areas.
- Article
(7554 KB) - Full-text XML
- BibTeX
- EndNote


Uncrewed aerial vehicle (UAV) remote sensing technology has been widely used in a variety of fields such as agricultural monitoring, surveying and mapping management, disaster emergency response management (Yang et al., 2022), and especially defense (Zhu et al., 2021). This technology is also used in environmental monitoring to determine the distributions of pollutants, especially air pollutants (Liu et al., 2020; Zheng et al., 2021; Shen et al., 2022; Sun et al., 2023). Fumian et al. (2021) used a UAV platform with metal oxide and photoionization detectors to confirm the presence of specific classes of chemicals in a contaminated area. UAV systems for air quality monitoring are inexpensive and allow high-spatiotemporal-resolution data on air pollutant concentrations to be gathered over a large area (Gu et al., 2018). Cozma et al. (2022) proposed an autonomous multi-rotor aerial platform for the real-time high-resolution monitoring of air quality in large cities by obtained fine-grained heatmaps. Duangsuwan et al. (2022) used a UAV system capable of real-time air pollution monitoring and a machine learning method to obtain a three-dimensional (3D) air quality index (AQI) map of an area. Samad et al. (2022) developed a low-cost, practical, and reliable UAV system for the high-resolution 3D profiling of air pollutants at a roadside area. Galle et al. (2021) used a multi-rotor UAV to obtain in situ measurements of sulfur dioxide (SO2), hydrogen sulfide (H2S), and carbon dioxide (CO2) concentrations in volcanic gas plumes. De Fazio et al. (2022) developed a remote-controlled UAV with a wide set of sensors to measure the concentrations of air pollutants emitted by waste fires. Samad et al. (2022) developed a UAV system for the 3D profiling of particulate matter (PM), ultrafine particle, and black carbon concentrations. Suroto et al. (2018) designed a waypoint UAV for automatically determining the ambient carbon monoxide (CO) and PM concentrations. Arroyo et al. (2022) developed an electrochemical gas sensing module for a UAV to measure ambient CO, ozone (O3), nitrogen monoxide (NO), and nitrogen dioxide (NO2) concentrations. Yungaicela-Naula et al. (2017) used a UAV system and metaheuristic algorithms to measure air pollutant concentrations and track pollution sources in real time. Huang et al. (2022) integrated a UAV platform with an X-ray fluorescence analyzer to develop a high-efficiency system for the rapid detection of heavy metal pollution in soil.
UAV remote sensing technology has also been widely used in industrial safety management and agricultural production. Qiu et al. (2017) used a UAV-based monitoring platform and an artificial neural network model to conduct an atmospheric dispersion simulation for identifying contaminant sources in a chemical industry park. Xie et al. (2013) proposed a design framework for an emergency atmospheric monitoring system based on a UAV platform. Their platform has high efficiency, high flexibility, and a wide monitoring range. Alvarado et al. (2015) developed a low-cost airborne sensing system based on a UAV platform for monitoring dust particles after blasting at open-pit mine sites. Rotorcraft UAVs are often used to spray pesticides, and the crop movement caused by the rotor of the UAV is a crucial indicator of the effectiveness of the spraying (2023). Boursianis et al. (2022) analyzed the roles of UAV and Internet of Things (IoT) technologies in irrigation, fertilizer application, pesticide application, weed management, plant growth monitoring, crop disease management, and field-level phenotyping. Their results indicated that UAV and IoT technologies are two of the most important technologies for transforming traditional farming practices into precision agriculture practices. Singh and Sharma (2022) proposed a platform for managing the agricultural crop information collected by a UAV, which has high potential for use in agricultural applications such as crop health monitoring, fertilizer spraying, and pesticide spraying. In addition, UAVs with low-cost lidar sensor networks can provide continuous area surveillance of large spaces (Fumian et al., 2020). A UAV with a sampling system can collect important samples for subsequent laboratory analysis and confirm results previously obtained from field measurements (Leitner et al., 2023). Opportunities to collect samples of environmental contaminants expand the possibility of confirming field measurements through laboratory analysis (Pounds et al., 2011).
Most UAV environmental monitoring systems used in previous studies have contained various microsensors for measuring air pollutant concentrations. Few studies have proposed designs of UAV-based atmospheric sampling systems for the qualitative and quantitative analysis of low-altitude gas samples. The components of atmospheric gas samples, especially volatile organic compounds (VOCs), can be accurately identified and quantified through a combination of atmospheric sampling and laboratory analysis. In the present study, a UAV platform with sensing and sampling systems was developed for the measurement of low-altitude air pollutant concentrations. The developed UAV platform contains an atmospheric sensing system with various low-cost microsensors for in situ measurement of meteorological parameters and air pollutant concentrations to obtain their vertical profiles. Moreover, this platform contains a gas sampling system with multiple remote-controllable gas sampling sets. The gas samples collected by the gas sampling system were analyzed in a laboratory through gas chromatography–mass spectrometry (GC–MS) using thermal adsorption equipment in accordance with the Toxic Organics-15 (TO-15) method of the US Environmental Protection Agency (EPA). Finally, the developed UAV platform was verified in field experiments where it collected measurements in a large industrial zone, which included two industrial parks and a municipal waste incineration plant; these measurements were used to determine pollution levels and contamination sources.
2.1 Developed UAV platform
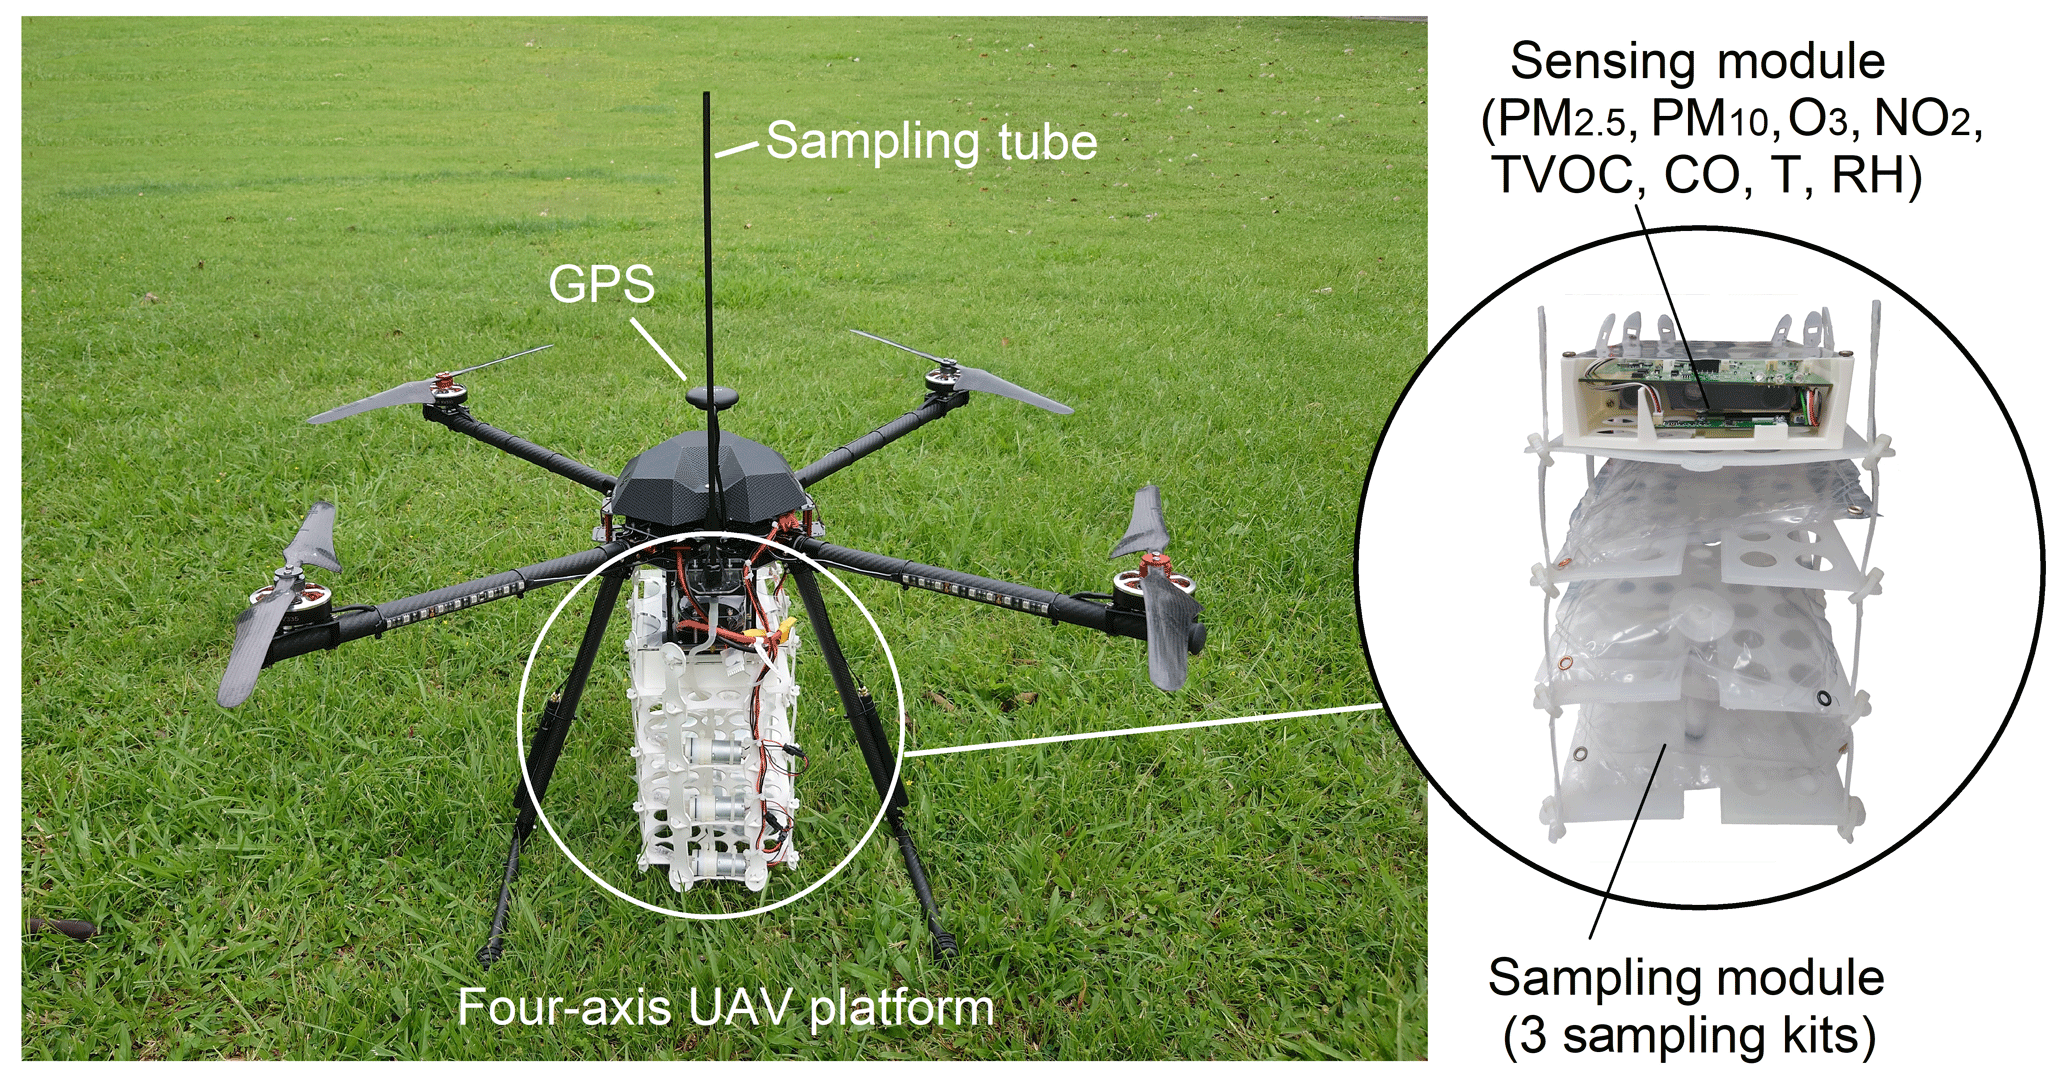
Figure 1 shows the prototype of the developed UAV platform that comprises three parts: a UAV, a sensing system, and a sampling system. The hardware of the platform was constructed using off-the-shelf consumer parts, and the open-source software ArduPilot was used for flight control and data fusion. An all-in-one drone remote control solution for long-range high-definition video transmission, namely the Skydroid H16, was used as the UAV's remote controller. A Pixhawk 6C flight controller was used as the autopilot, and a NEO V2 GPS module was used as the uncrewed system positioning and navigation module because of its high sensitivity and strong resistance to interference. This module allows for an exact 3D spatial location of the sampling site to better describe the air quality of large spaces.
Table 1Specifications of the sensing module.
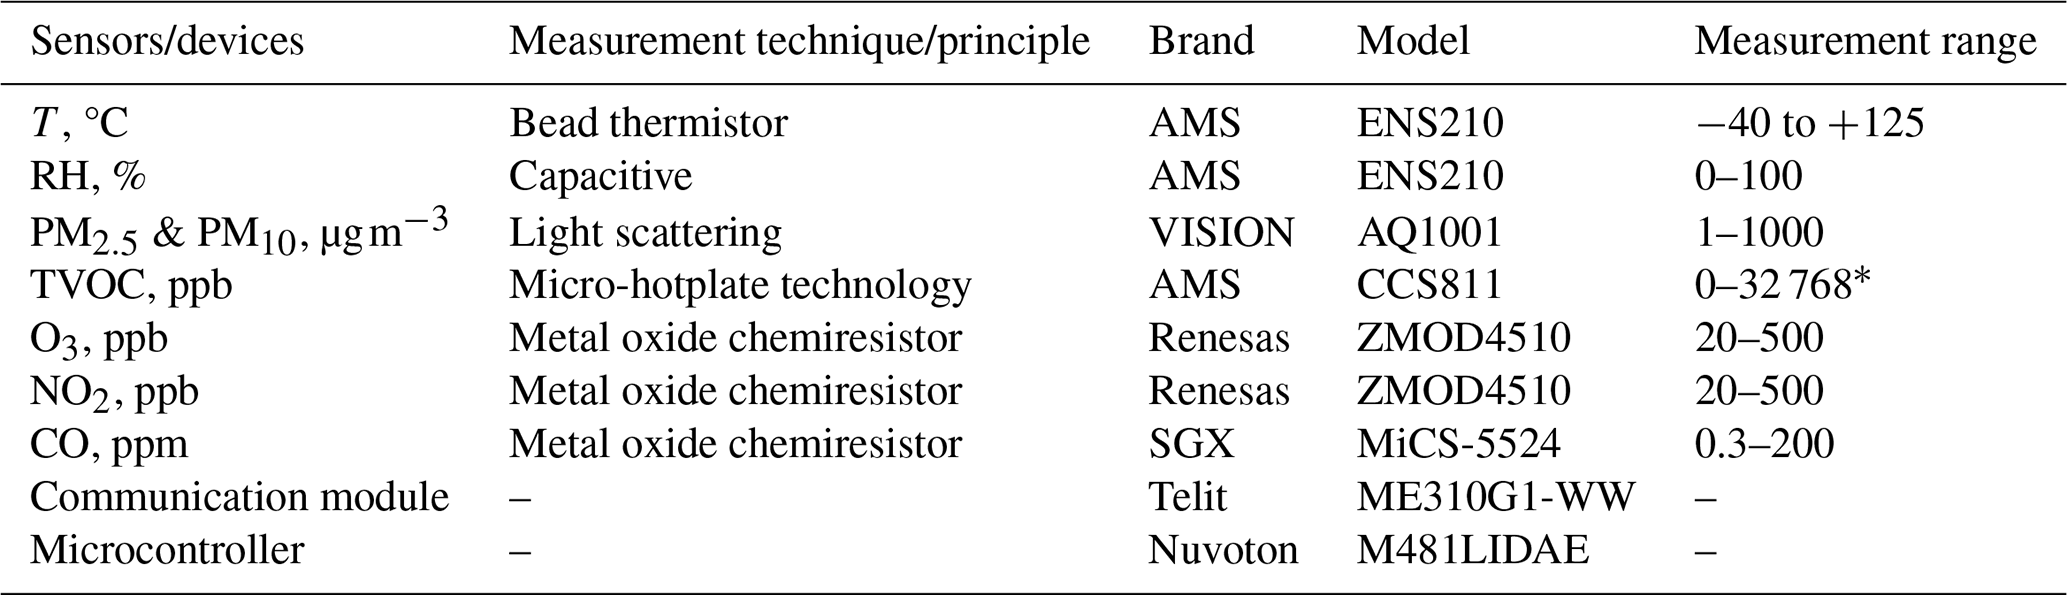
∗ System integrator Green Ideas Synergy Company adjusted the eTVOC detection upper limit according to the batch parameters supplied by the sensor manufacturer.
2.2 Sensing system
The use of low-cost microsensors in a UAV platform offers numerous advantages for measurement, especially real-time measurement, of the spatiotemporal distribution of air pollutant concentrations (Gu and Jia, 2019; Pochwała et al., 2020). The present study used a low-cost air quality monitoring kit (Air Quality Detector II, VISION) as the sensing system in the developed UAV platform. This monitoring kit is one of the air quality monitor sensors recommended by the Taiwanese Environmental Protection Administration. The parameters monitored with the aforementioned kit include PM2.5 concentration, PM10 concentration, total VOC (TVOC) concentration, O3 concentration, CO concentration, ambient temperature (T), and relative humidity (RH). The sensing system of the developed UAV platform is connected to an IoT system and a cloud server through a communication module to track air pollutant concentrations and weather data in real time. The data obtained by the microsensors of the sensing system are processed by a microprocessor, and the processed data are transferred to a cloud server for storage through Wi-Fi. The data stored on the cloud server can be presented in a graphical form in real time. The specifications of the sensing system are listed in Table 1.
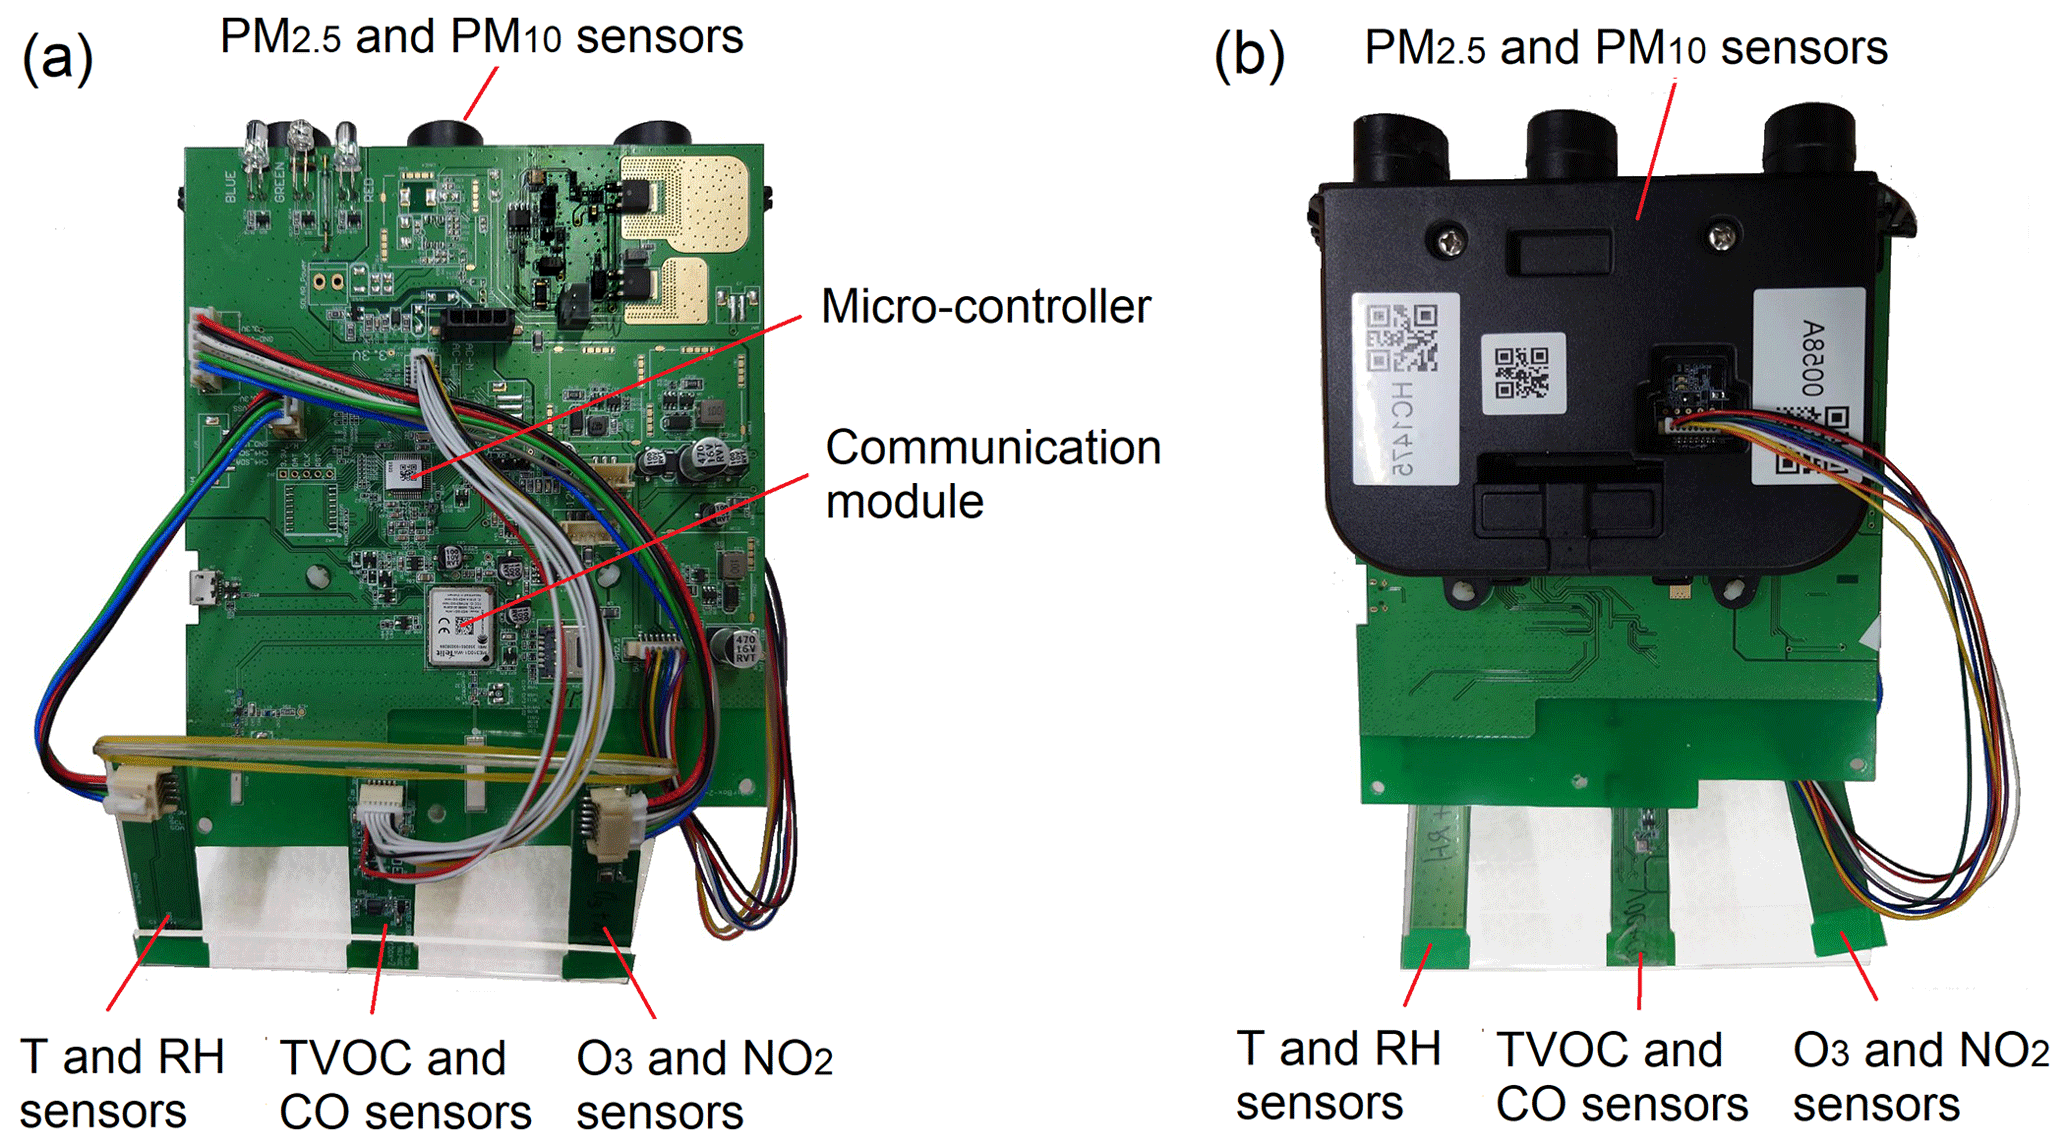
Figure 2The circuit board with the particulate matter and gas sensors used in the UAV platform. Front (a) and back (b) of the circuit board.
Prior to each field measurement run, the PM2.5, PM10, O3, NO2, TVOC, CO, T, and RH sensors had to be calibrated using monitoring data from the Wenshan Air Quality Monitoring Station of the Taichung Environmental Protection Bureau (this station is located in the study area; Fig. 4).
2.3 Sampling system
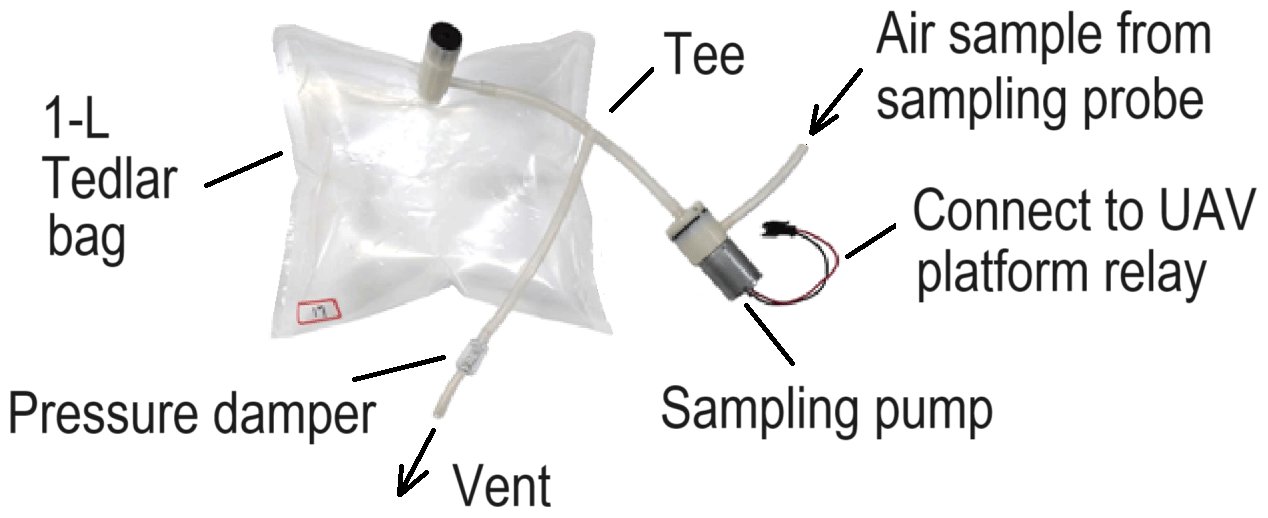
The sampling module contains three gas sampling kits that each comprise three mini air pumps (TCS Electrical Co. JQC24381), a 1 L Tedlar bag (Keika Ventures), and a plastic one-way check valve with a compression spring (AliExpress, 4 mm hose size). This one-way valve was installed in reverse to act as a pressure damper for the Tedlar bag after sampling by compression spring. Figure 3 shows the scheme of the sampling kit. The three air pumps of the sampling kits are connected in parallel to a length of 60 cm vertical sampling tube at the top of the UAV. The sampling kits are powered by the batteries of the UAV platform and are individually controlled by the UAV's remote controller. Therefore, the sampling system can perform multipoint sampling at different altitudes or locations in a single flight mission. Multipoint sampling in a single flight can overcome the problem caused by rapidly changing wind fields and makes it easier to obtain representative samples.
2.4 Analysis of high-altitude VOC concentrations
The collected gas samples were analyzed in a laboratory in accordance with the TO-15 method of the US EPA. This method is based on criteria for the sampling and analysis of VOCs in the air and is primarily employed for the monitoring of airborne pollutants in urban and industrial environments. In the TO-15 method, air samples are collected in a special canister. Stainless-steel canisters are too heavy and bulky and thus are unsuitable for use in the developed UAV platform. Therefore, a 1 L Tedlar bag was used instead of a stainless-steel canister in the developed UAV platform. Ambient VOCs were collected in a 1 L Tedlar bag and analyzed using GC–MS (Shimadzu QP-2010 SE GCMS) and thermal adsorption equipment (ENTECH 7100A Preconcentrator) in accordance with the analytical procedure of the TO-15 method. The analysis column in GC–MS is a Chrompack DB-1 capillary column with an inner diameter of 0.25 mm and a length of 60 m. For quantification of VOC species, 101 standard curves were prepared using the standard gases adopted in the calibration mixture of the TO-14A method of the US EPA, the ozone precursor mixtures which were adopted in the TO-15 method. Because these standard curves did not encompass all the compounds in the air samples, a semiquantitative method of analysis was used in which the analyte quantity was based on the standard curve of toluene (in units of parts per billion of toluene). Finally, all VOC concentrations were converted to units of parts per billion of carbon (ppbC). Because Tedlar bags are not as suitable as steel canisters for storing samples over long time periods (more than approximately 30 d), the collected samples were analyzed within 10 d of sampling.
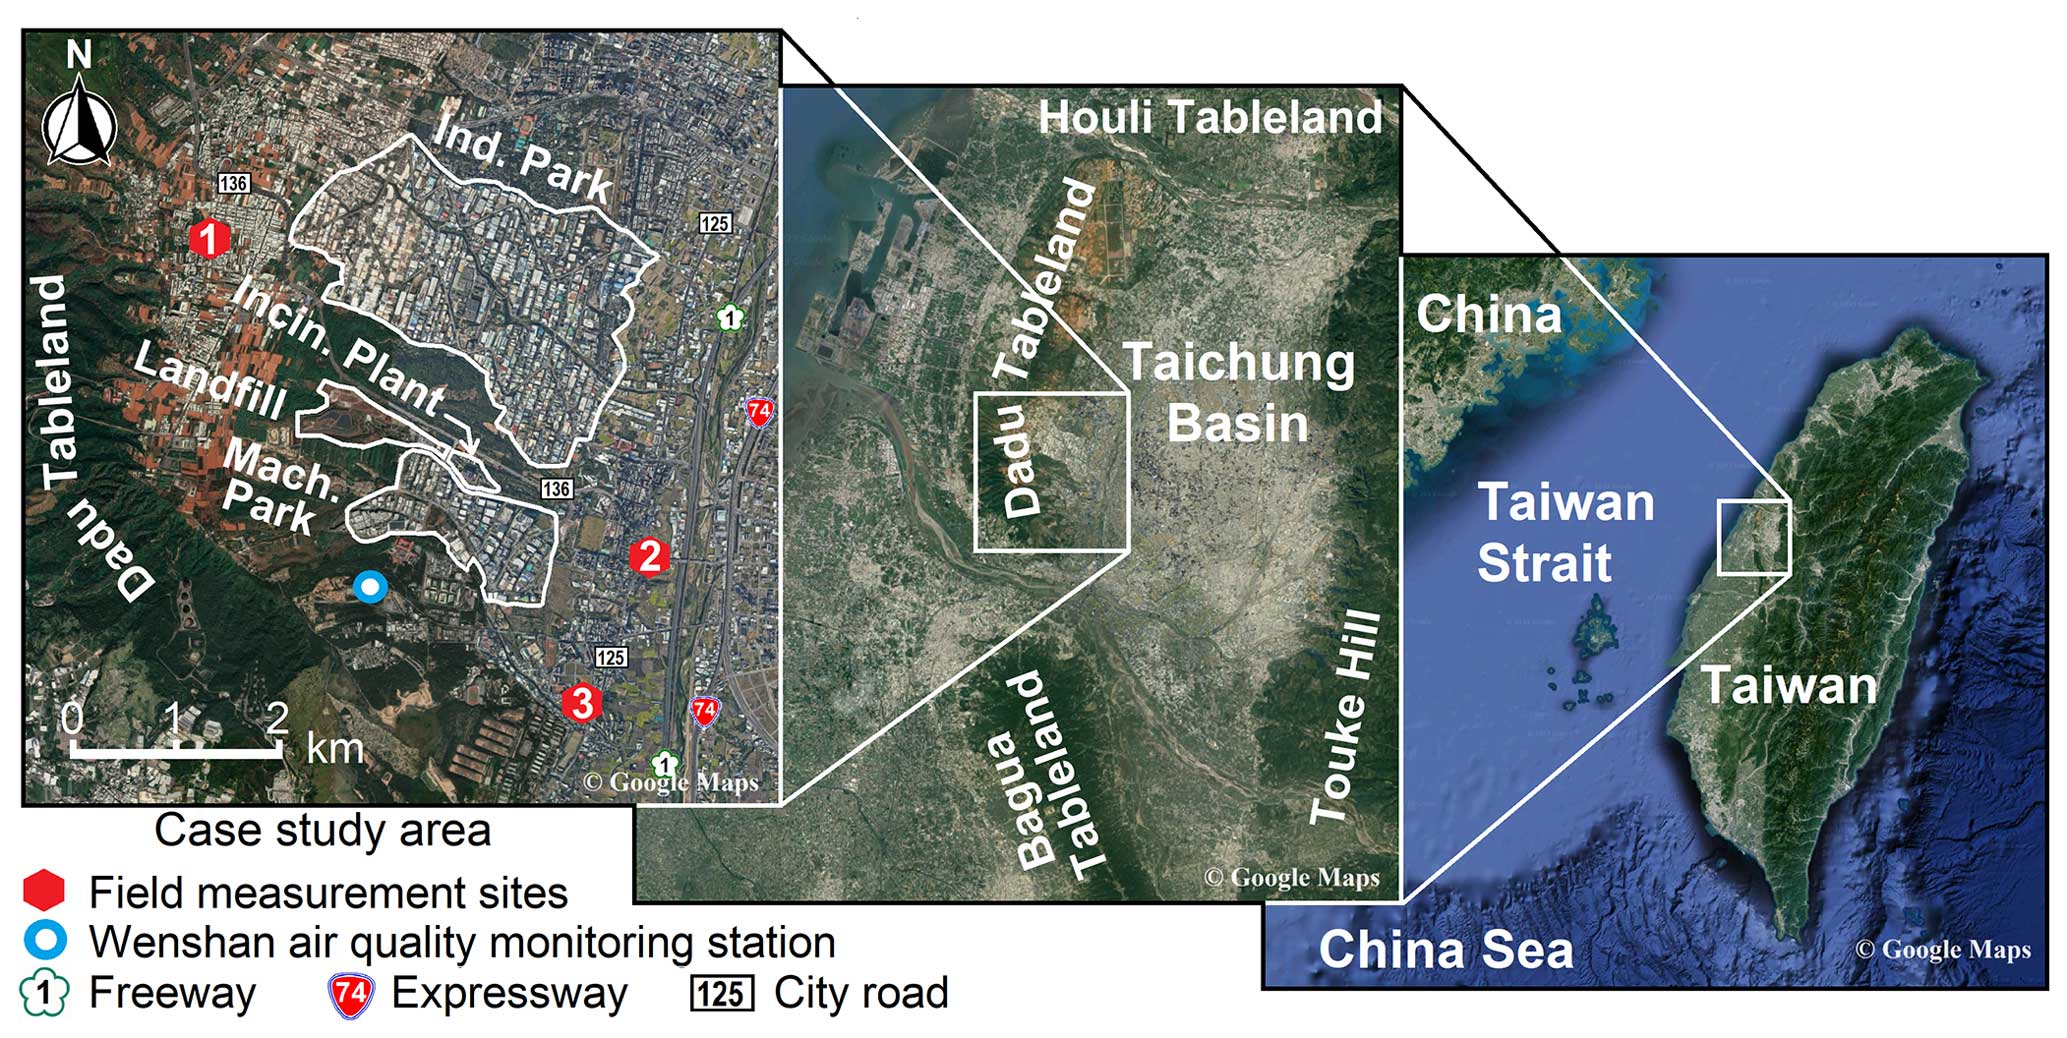
Figure 4Locations of field measurement sites and the Wenshan Air Quality Monitoring Station in the case study area.
2.5 Field measurements
We used the developed UAV platform for detecting air pollutant concentrations in a large special industrial zone that included a traditional industrial park, a precision machinery park, and a municipal waste incineration plant. Figure 4 shows the location of the study area, which is located at the southern piedmont of the Dadu Tableland in the western part of the Taichung Basin, Taiwan. Two industrial parks (the Taichung Industrial Park, TIP, and the Taichung Precision Machinery Park, TPMP), a municipal waste incineration plant (the Wenshan Waste Incineration Plant, WWIP), and a landfill (the Wenshan Landfill) were located within the study area. The TIP is a large industrial space with a total area of 5.82 km2. Currently, 1086 factories that employ a total of approximately 44 000 people are located in this industrial park. In addition to traditional industries, high-tech industries such as optoelectronics, electronics, and precision machinery are located in TIP. TPMP is an industrial park with an area of 1.61 km2 and mainly includes companies focusing on precision machinery innovation. This industrial park is a crucial base of production of Taiwan's machinery industry and has a 100 % occupancy rate. As of the end of December 2022, 170 manufacturers employing approximately 21 329 people were operating in TPMP. WWIP began operation in 1995 and was the first large-scale incineration plant to be established in central Taiwan. This plant covers an area of 0.044 km2 and has three incinerators that handle a total of 900 t of waste per day. The Wenshan Landfill was opened in 1983 and covers an area of 0.365 km2. The restoration of this landfill was completed in March 2019 and involved the installation of a solar photovoltaic system with a capacity of approximately 6.2 MWp over an area covering 0.0483 km2. In addition, a busy national freeway and a provincial expressway are located in the eastern part of the study area (Fig. 4) with weekday southbound and northbound traffic volumes of approximately 112 150 and 85 480 PCU (passenger car unit), respectively.
The annual prevailing wind directions in the study area are north and north–northeast, which can be attributed to the spoon-shaped topography of the Dadu Tableland (Fig. 4). Moreover, the most prevalent local average wind speed is 1–3 m s−1, followed by 3–5 m s−1. Therefore, three locations were selected as field measurement sites (sites 1, 2, and 3) according to the prevailing wind directions (Fig. 5). These sites were located in densely populated parts of the study area. Site 1 was located upwind of the two industrial areas and WWIP, whereas sites 2 and 3 were located downwind of these areas and WWIP. Because of regulations limiting the altitude of local flights to 200 ft (61 m), the heights at which samples were gathered were 2, 20, 40, and 60 m above the ground at each site. Noori and Dahnil (2020) indicated that a UAV monitoring system can accurately measure the concentrations of air pollutants at flight speeds slower than 6 m s−1 and that detection accuracy decreases considerably at flight speeds greater than 8 m s−1. Therefore, the flight speed of the developed UAV platform was controlled at ≤ 6 m s−1 in this study.

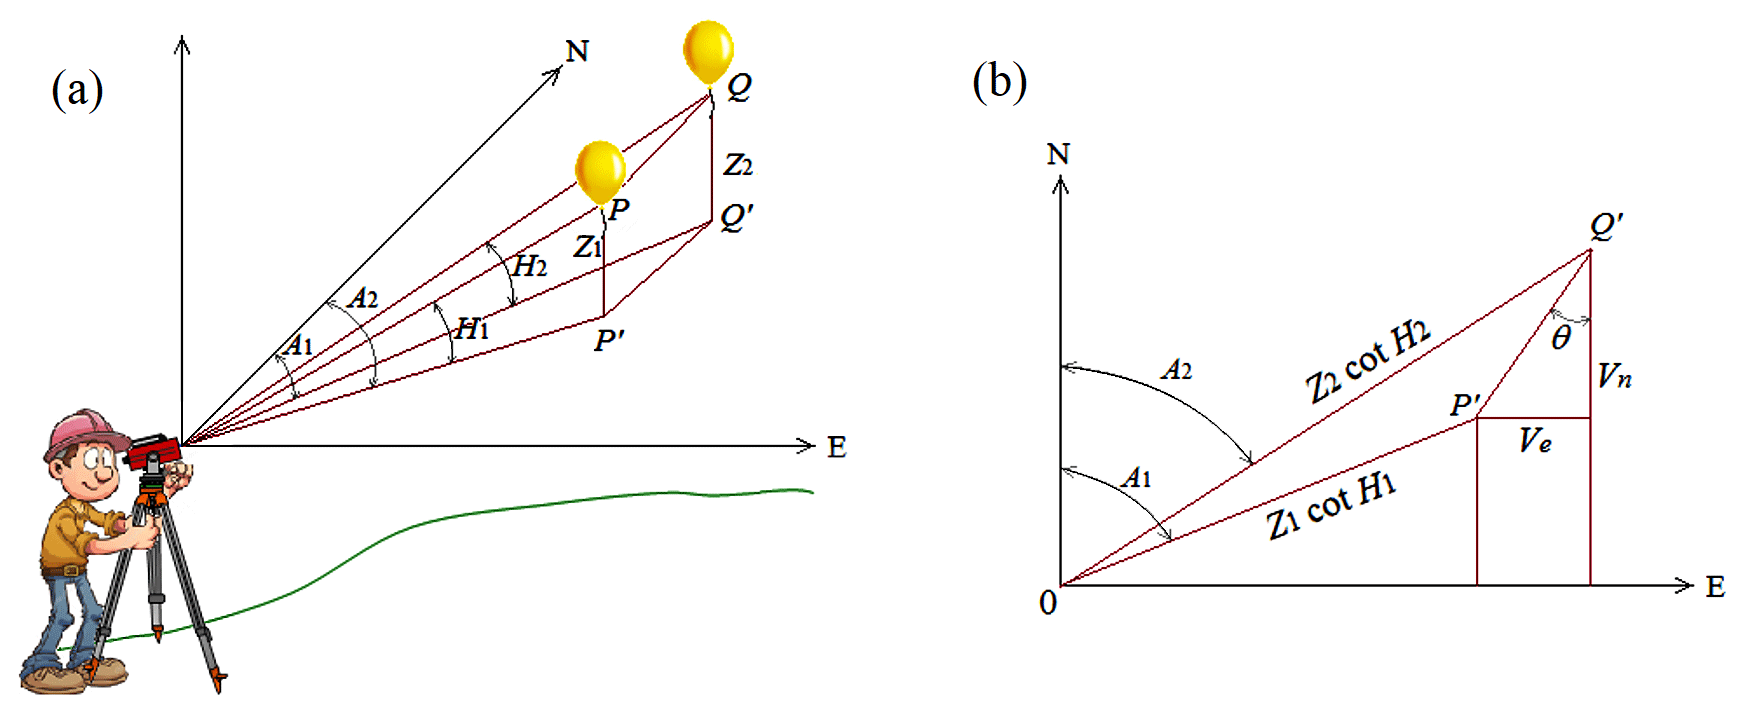
Figure 6(a) Geometry of the single-theodolite method and (b) the slide-rule method of computation.
2.6 Measurement of the speed and direction of the upper winds
To keep the airflow caused by the rotor of the UAV from affecting the measurement of the speed and direction of the upper winds, the single-theodolite method (Middleton and Spilhaus, 2019) was used in this study. A theodolite (WORLD E105-S Theodolite) was used to measure the speed and direction of the upper winds according to the pilot-balloon observation method (Pollak and Brunt, 1939). Figure 6 shows a schematic of the measurement of the upper winds using the single-theodolite method, with Fig. 6a and b displaying the ground-projection-based and sliding-rule-based wind field diagrams, respectively. The following formula is used for computing the speed of the upper winds:
where u, L, and W are the rising speed (m s−1), buoyancy (g), and weight of the pilot balloon (g), respectively; r1, Z1, and H1 are the projected length (m) from the ground up to point p, the rising height (m), and the elevation angle (°), respectively; Ve and Vn are the eastern and northern projection lengths (m) of the wind speed, respectively; θ, Ai, and V are the northeastern wind speed angle (°), azimuth angle (°), and average wind speed at time t, respectively; and is PQ at ground projection (m). The wind directions at in quadrants I, II, III, and IV are defined to be 180° + θ, 180° − θ, θ, and 360° − θ, respectively.

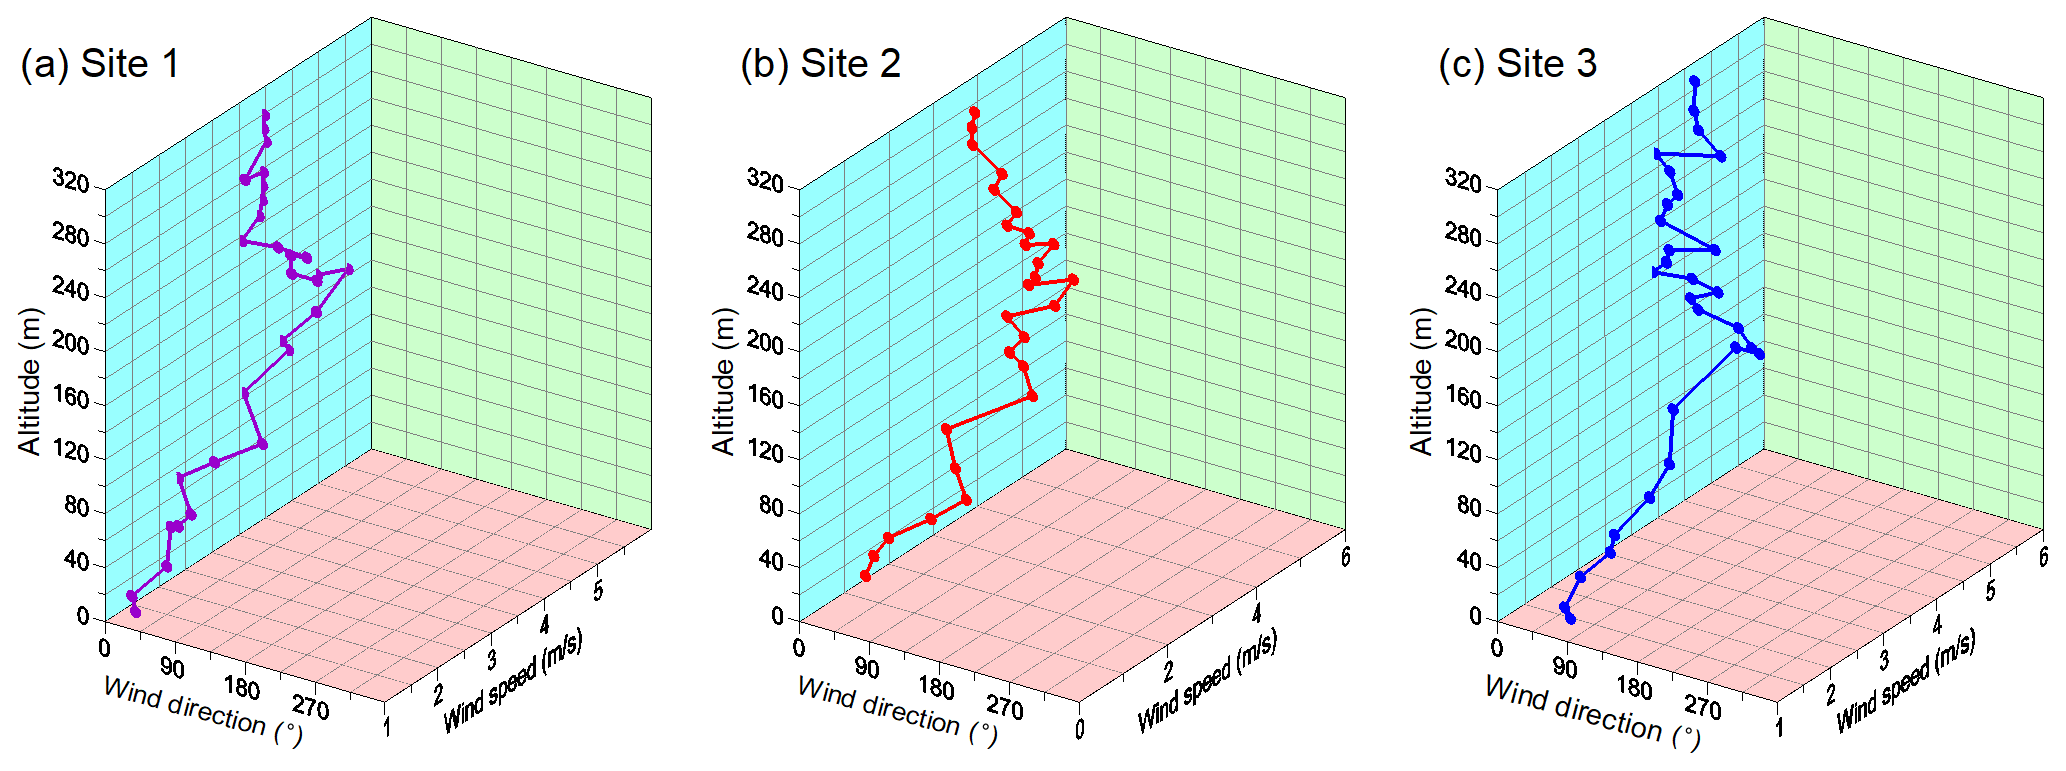
Figure 7The observation results of the upper winds from 13:30–16:30 UTC+8 on 29 March 2023; panels (a–c) show sites 1–3, respectively.
3.1 Field measurement 1
3.1.1 Upper winds
Figure 7 illustrates the observation results for the upper winds at the three field measurement sites between 13:30 and 16:30 UTC+8 on 29 March 2023. During the observation period, all wind directions at the three sites were between the north and northeast. All upper wind speeds observed at the three sites were less than 2 m s−1. The prevailing wind directions at sites 1, 2, and 3 were north–northeast, north by east, and northeast, respectively. The wind speed at site 3 on the southern (downwind) side was marginally higher than those at the other two sites. The wind speeds at the three sites increased with altitude, which is consistent with the power law of the vertical distribution of wind speed. In the Taichung Basin, the average hourly wind speed was mostly between 0 and 3 m s−1. The sampling period coincided with a period of comfortable weather in Taiwan.
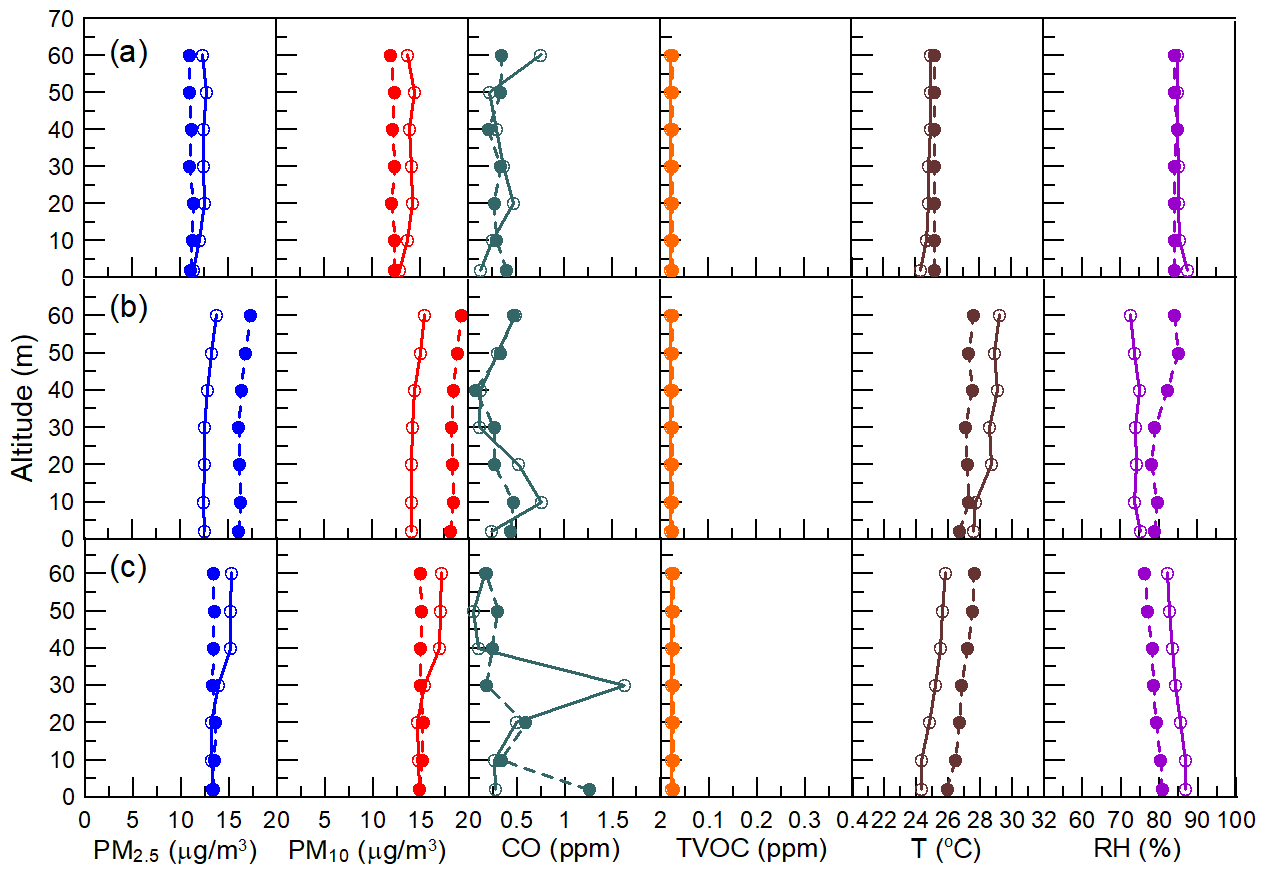
Figure 8The observation results of critical air pollutants, ambient temperature, and relative humidity from 13:30–16:30 UTC+8 on 29 March 2023; panels (a–c) show sites 1–3, respectively. Solid and dashed lines are the results of run 1 and run 2, respectively.
3.1.2 Vertical distributions of critical air pollutants
Prior to each UAV telemetry run, the sensing system was connected to the IoT system to ensure that the monitoring data were input to the cloud server. Two runs were conducted at each monitoring site; thus, six runs were performed in total. Figure 7 displays the vertical distributions of critical air pollutants, ambient temperature, and RH from 13:30–16:30 UTC+8 on 29 March 2023. In Fig. 8, the solid and dashed lines represent the results obtained in runs 1 and 2 at each site, respectively. The PM2.5 and PM10 concentrations at the three sites were 11.0–17.3 (average = 13.4) and 11.9–19.3 (average = 15.0), respectively. The highest and lowest concentrations of PM (both PM2.5 and PM10) were observed at site 2 (downwind) and site 1 (upwind), respectively. The results indicate that the investigated industrial zone had high local PM concentrations, especially at site 2. CO is mainly emitted from mobile sources. The CO concentrations at the three sites were marginally variable but low. Therefore, the differences in the influences of the mobile sources on the three locations were small. The TVOC concentrations at the three sites were very low (≤ 0.02 ppm), which might be attributable to the lack of large VOC emission sources in the investigated industrial zone. Because the sensitivities of the O3 and NO2 sensors were too low (Table 1), their monitoring data were 0 ppm in all the measurements.
The temperature ranges at sites 1 to 3 were 24.3–25.2 °C (average = 25.0 °C), 26.7–29.2 °C (average = 27.9 °C), and 24.3–27.6 °C (average = 26.0 °C). At all locations, the lowest temperature was observed on the ground because of the heat radiation from the surface on cloudy days. The temperatures at the three sites gradually decreased in the afternoon with time. The RH values of the three locations changed with the temperature, and the RH range in the study area was 76.1 %–87.6 %.

Figure 9The analysis results of upper-altitude VOCs from 13:30–16:30 UTC+8 on 29 March 2023. Panels (a) and (b) show the results of run 1 and run 2, respectively. The insets in each subpanel are zoomed-in views of the retention time range from 17 to 24 min.
3.1.3 Vertical distributions of VOCs
Sampling was performed twice at four altitudes at each site using the UAV platform; thus, eight samples were collected per site. Figure 9 displays the analysis results obtained through GC–MS with thermal adsorption equipment for the upper-altitude VOCs at the three sites from 13:30–16:30 UTC+8 on 29 March 2023. A total of more than 56 species were analyzed at different altitudes at each site. The analysis results indicated the feasibility of using the developed UAV platform with a Tedlar bag sampling system for the 3D measurement of VOC concentrations in accordance with the TO-15 method. All dominant VOCs at various altitudes at the three sites appeared within the retention time of 10–15 min in GC–MS chromatography. The peak patterns of the dominant species at the three sites were highly similar, which indicated that the three sites had similar air pollution sources. A second set of dominant VOCs appeared at various altitudes within the retention time of 17–24 min, especially at site 3. The second dominant species at site 2 had a considerably higher concentration than those at the other sites, which indicated that site 2 was located downwind of some air pollution emission sources. TIP is located upwind of site 2 (Fig. 4).
Table 2The average concentrations (in ppb C) of upper-altitude VOCs at the three sites on 29 March 2023.
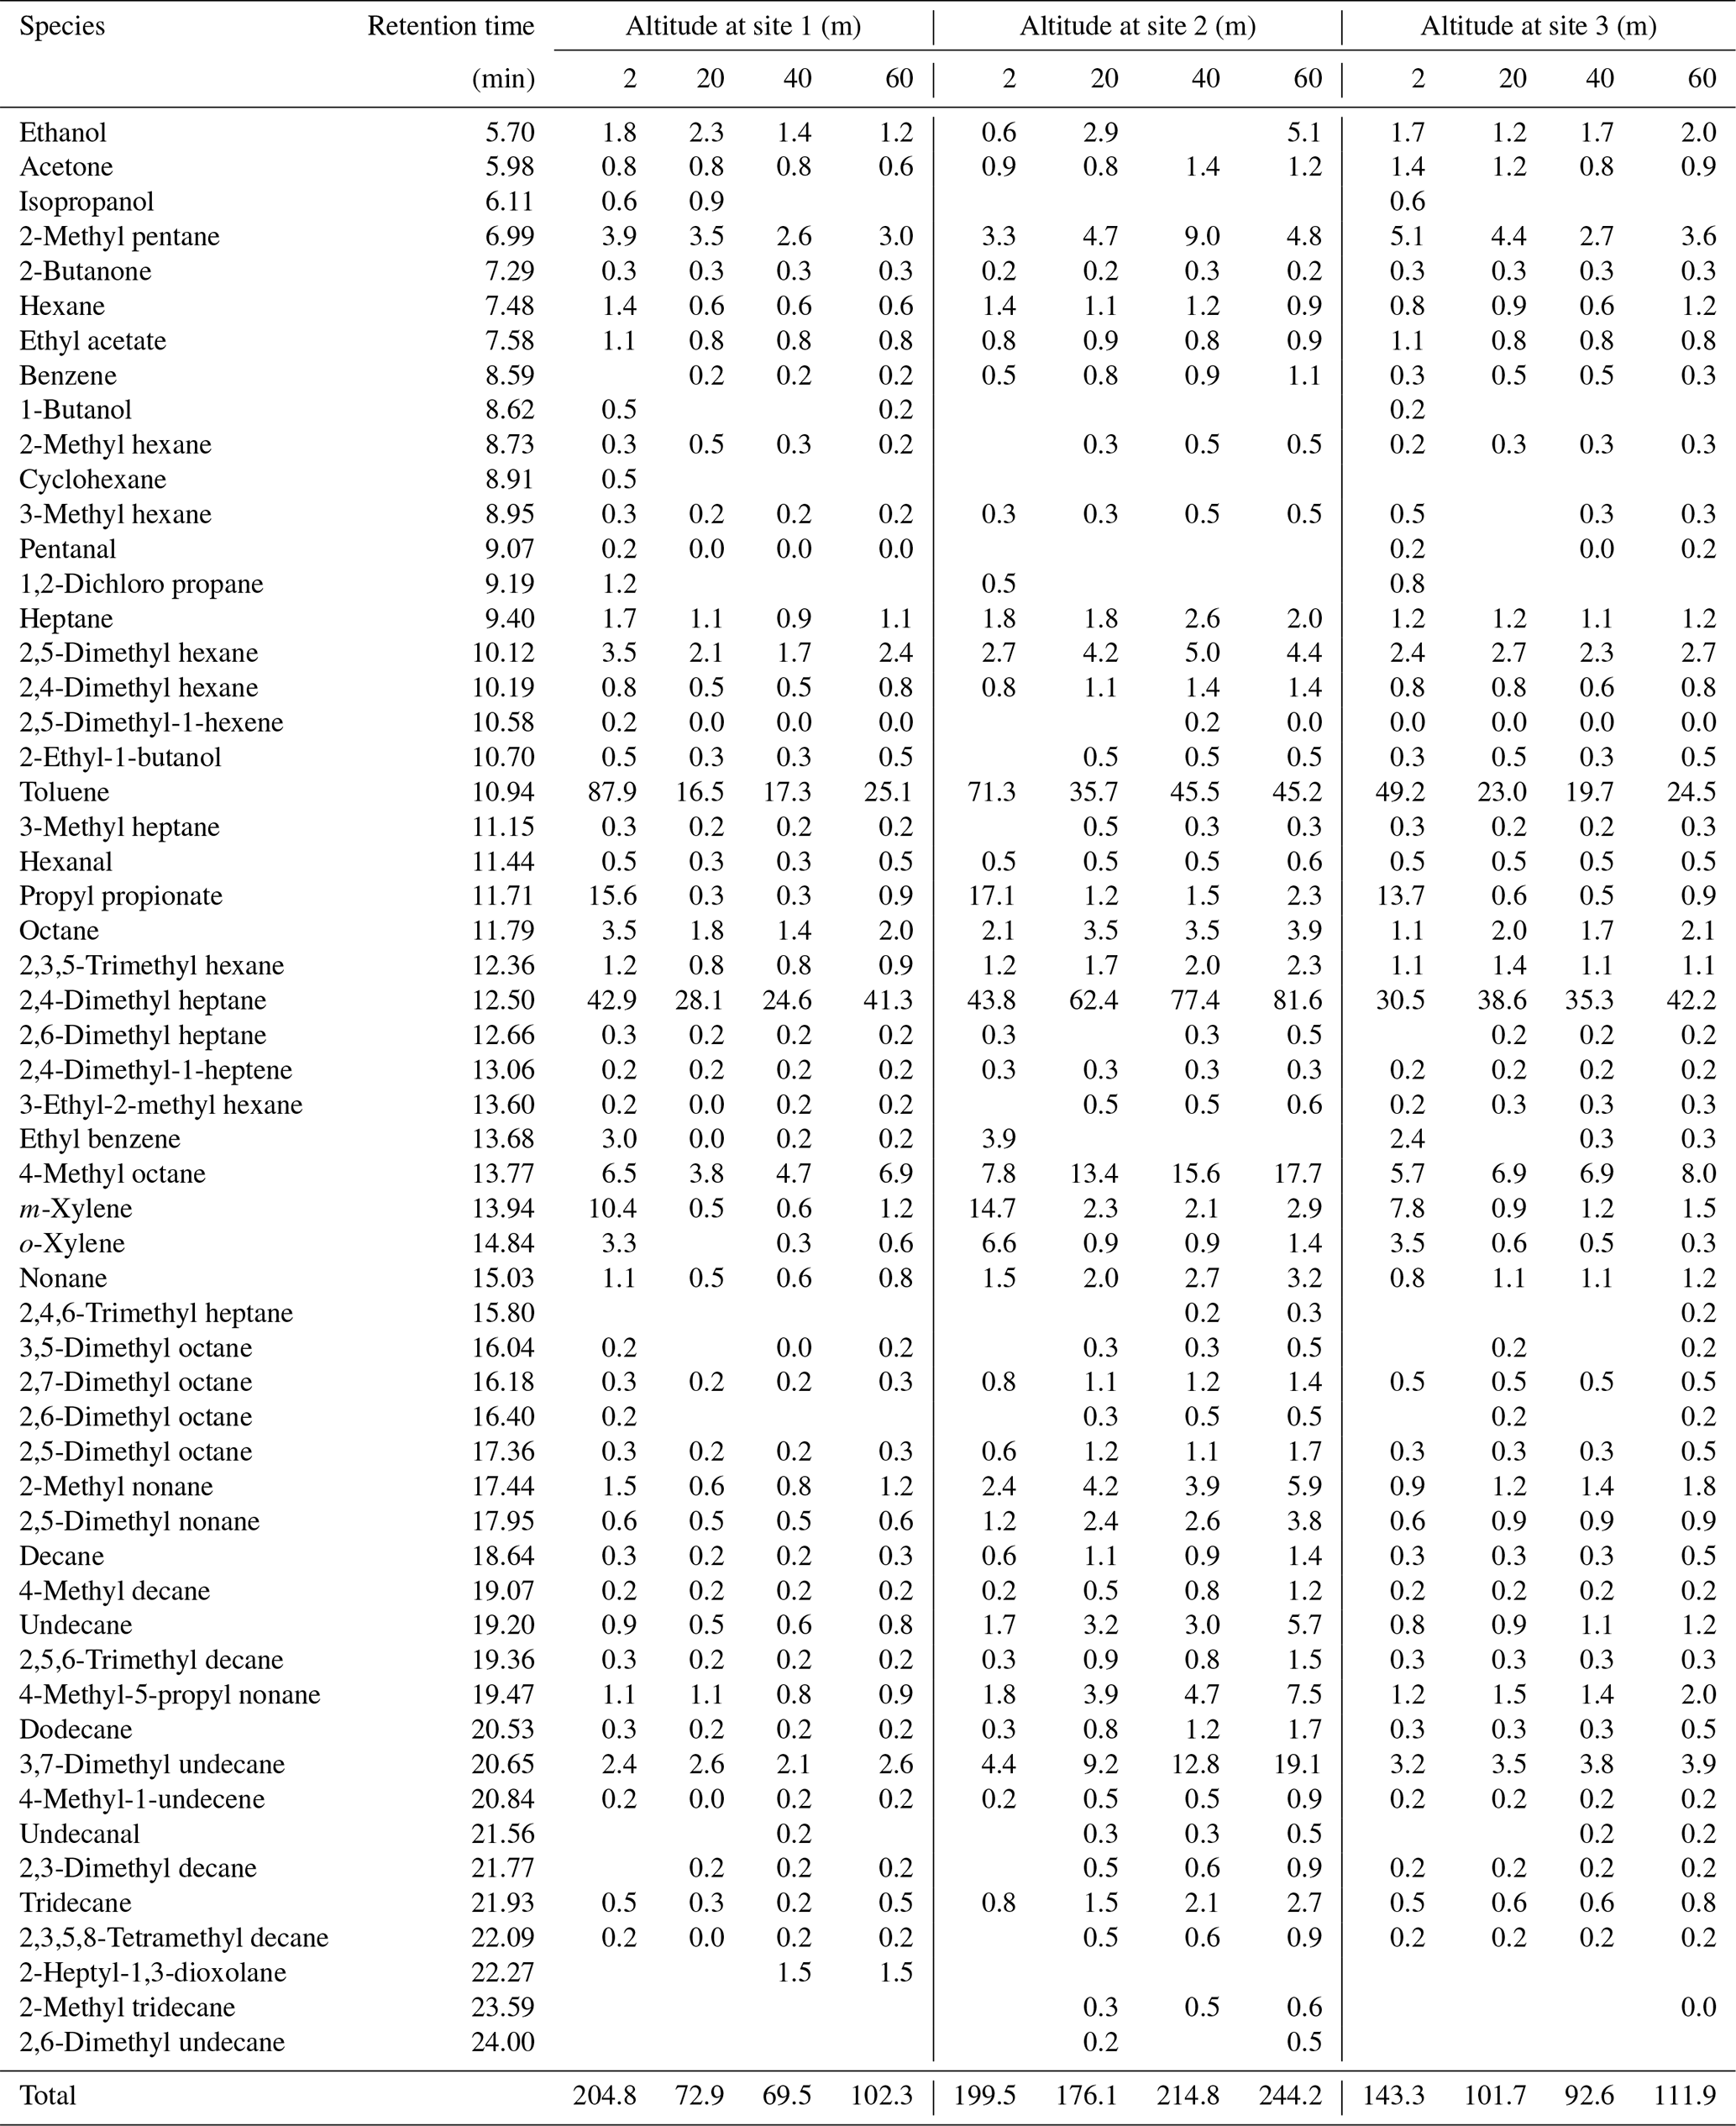
Table 2 lists the qualitative and quantitative analysis results of the VOC samples collected from the three sites, where the concentration is the average of those obtained in two sampling runs (runs 1 and 2 in Fig. 9). The concentrations of the top five VOC species at the four sampled altitudes had the following order from highest to lowest: site 1, toluene > 2,4-dimethyl heptane > 4-methyl octane > propyl propionate > 3,7-dimethyl undecane; site 2, 2,4-dimethyl heptane > toluene > 4-methyl octane > 3,7-dimethyl undecane > propyl propionate; and site 3, 2,4-dimethyl heptane > toluene > 4-methyl octane > propyl propionate > 3,7-dimethyl undecane. The ranges of the concentration ratio of the top five species to all upper-altitude VOCs at sites 1, 2, and 3 were 71.1 %–80.9 % (average = 74.9 %), 69.1 %–79.7 % (average = 72.9 %), and 72.3 %–76.8 % (average = 73.6 %), respectively. Thus, the top five VOC species dominated the upper-altitude VOC concentrations.
Toluene and 2,4-dimethyl heptane exhibited the highest and second-highest concentrations among the VOCs at the three sites. Toluene might have originated from vehicle exhaust and industrial emissions. Common industrial organic solvents, such as benzene, xylene, ethylbenzene, and butanone, were detected at the four altitudes at each site, which indicated that a considerable quantity of the toluene in the study area originated from industrial emissions. In general, because its branched structure allows for combustion without knocking, 2,4-dimethyl heptane is blended with other gasoline components to produce high-octane fuel. In addition, alkanes were the dominant VOC species at various altitudes and sites. Thus, the concentrations of the VOCs originating from vehicle exhaust might have been higher than those of the VOCs originating from industrial exhaust. Propyl propionate is a safer alternative for toluene because of its low odor, moderately volatile nature, and nonhazardous and nonpolluting ester product; thus, the propyl propionate detected in field measurement 1 mainly originated from industrial emissions. The average VOC concentrations at the three sites had the following order from highest to lowest: site 2 > (site 1 ≈ site 3). The highest and second-highest total VOC concentrations at sites 1 and 3 appeared at altitudes of 2 and 60 m, respectively. In contrast, the highest and second-highest total VOC concentrations at site 2 appeared at altitudes of 60 and 40 m, respectively. This result indicates that some VOCs were transmitted from upwind sources.
3.2 Field measurement 2
3.2.1 Upper winds
Figure 10 shows the observation results for the upper winds at the three field measurement sites between 13:30 and 16:30 UTC+8 on 10 May 2023. During the measurement period, all wind directions at the three sites were between north and east. The prevailing wind directions at sites 1, 2, and 3 were north–northeast, northeast by east, and northeast by east, respectively. The upper wind speeds at sites 1–3 were 1.1–5.6 m s−1 (average = 3.5 m s−1), 1.2–5.1 m s−1 (average = 3.6 m s−1), and 1.2–5.2 m s−1 (average = 3.7 m s−1), respectively. The wind speeds at the three sites increased with an increase in altitude but decreased marginally as the altitude increased beyond 200 m. Compared to the upper winds during field measurement 1 (on 29 March 2023), those during field measurement 2 (on 10 May 2023) had higher speeds and a more easterly direction.

Figure 11The observation results of critical air pollutants, ambient temperature, and relative humidity from 13:30–16:30 UTC+8 on 10 May 2023; panels (a–c) show sites 1–3, respectively. Solid and dashed lines are the results of run 1 and run 2, respectively.
3.2.2 Vertical distributions of critical air pollutants
As was the case in field measurement 1, two runs of UAV telemetry were implemented at each monitoring site; thus, a total of six runs were performed. The sensing system was connected to the IoT system prior to UAV telemetry to ensure that the monitoring data were input to the cloud server after each run. Figure 11 displays the vertical distributions of critical air pollutants, ambient temperature, and RH for the period of 13:30–16:30 UTC+8 on 10 May 2023. The PM2.5 and PM10 concentration ranges at the three sites were 12.1–16.8 µg m−3 (average = 13.1 µg m−3) and 13.1–17.4 µg m−3 (average = 14.3 µg m−3), respectively. The highest and lowest concentrations of PM (both PM2.5 and PM10) were observed at site 3 (downwind) and site 2 (upwind), respectively. The highest CO concentrations at the three sites were at the ground level, and the highest CO concentration of 4.66 ppm was measured at site 2. The CO concentrations at all altitudes except for the ground level at the three sites varied between 0 and 2.4 ppm. As was the case in field measurement 1, the O3 and NO2 concentrations were 0 ppm in field measurement 2 because the sensitivities of the O3 and NO2 sensors were too low. The TVOC concentrations at the three sites were very low (≤ 0.02 ppm; as in field measurement 1), possibly because the sensitivity of the TVOC sensor was too low.
The temperature ranges at sites 1–3 were 24.12–26.4 °C (average = 24.9 °C), 26.0–29.6 °C (average = 27.0 °C), and 26.7–29.9 °C (average = 27.6 °C), respectively. The highest temperatures at these sites were observed at the ground level because of the thermal radiation of the surface on sunny days. The temperatures at the three sites gradually decreased in the afternoon with time. The RH values of the three sites changed with the temperature, and the RH range in the study area was 55.1 %–68.4 %.
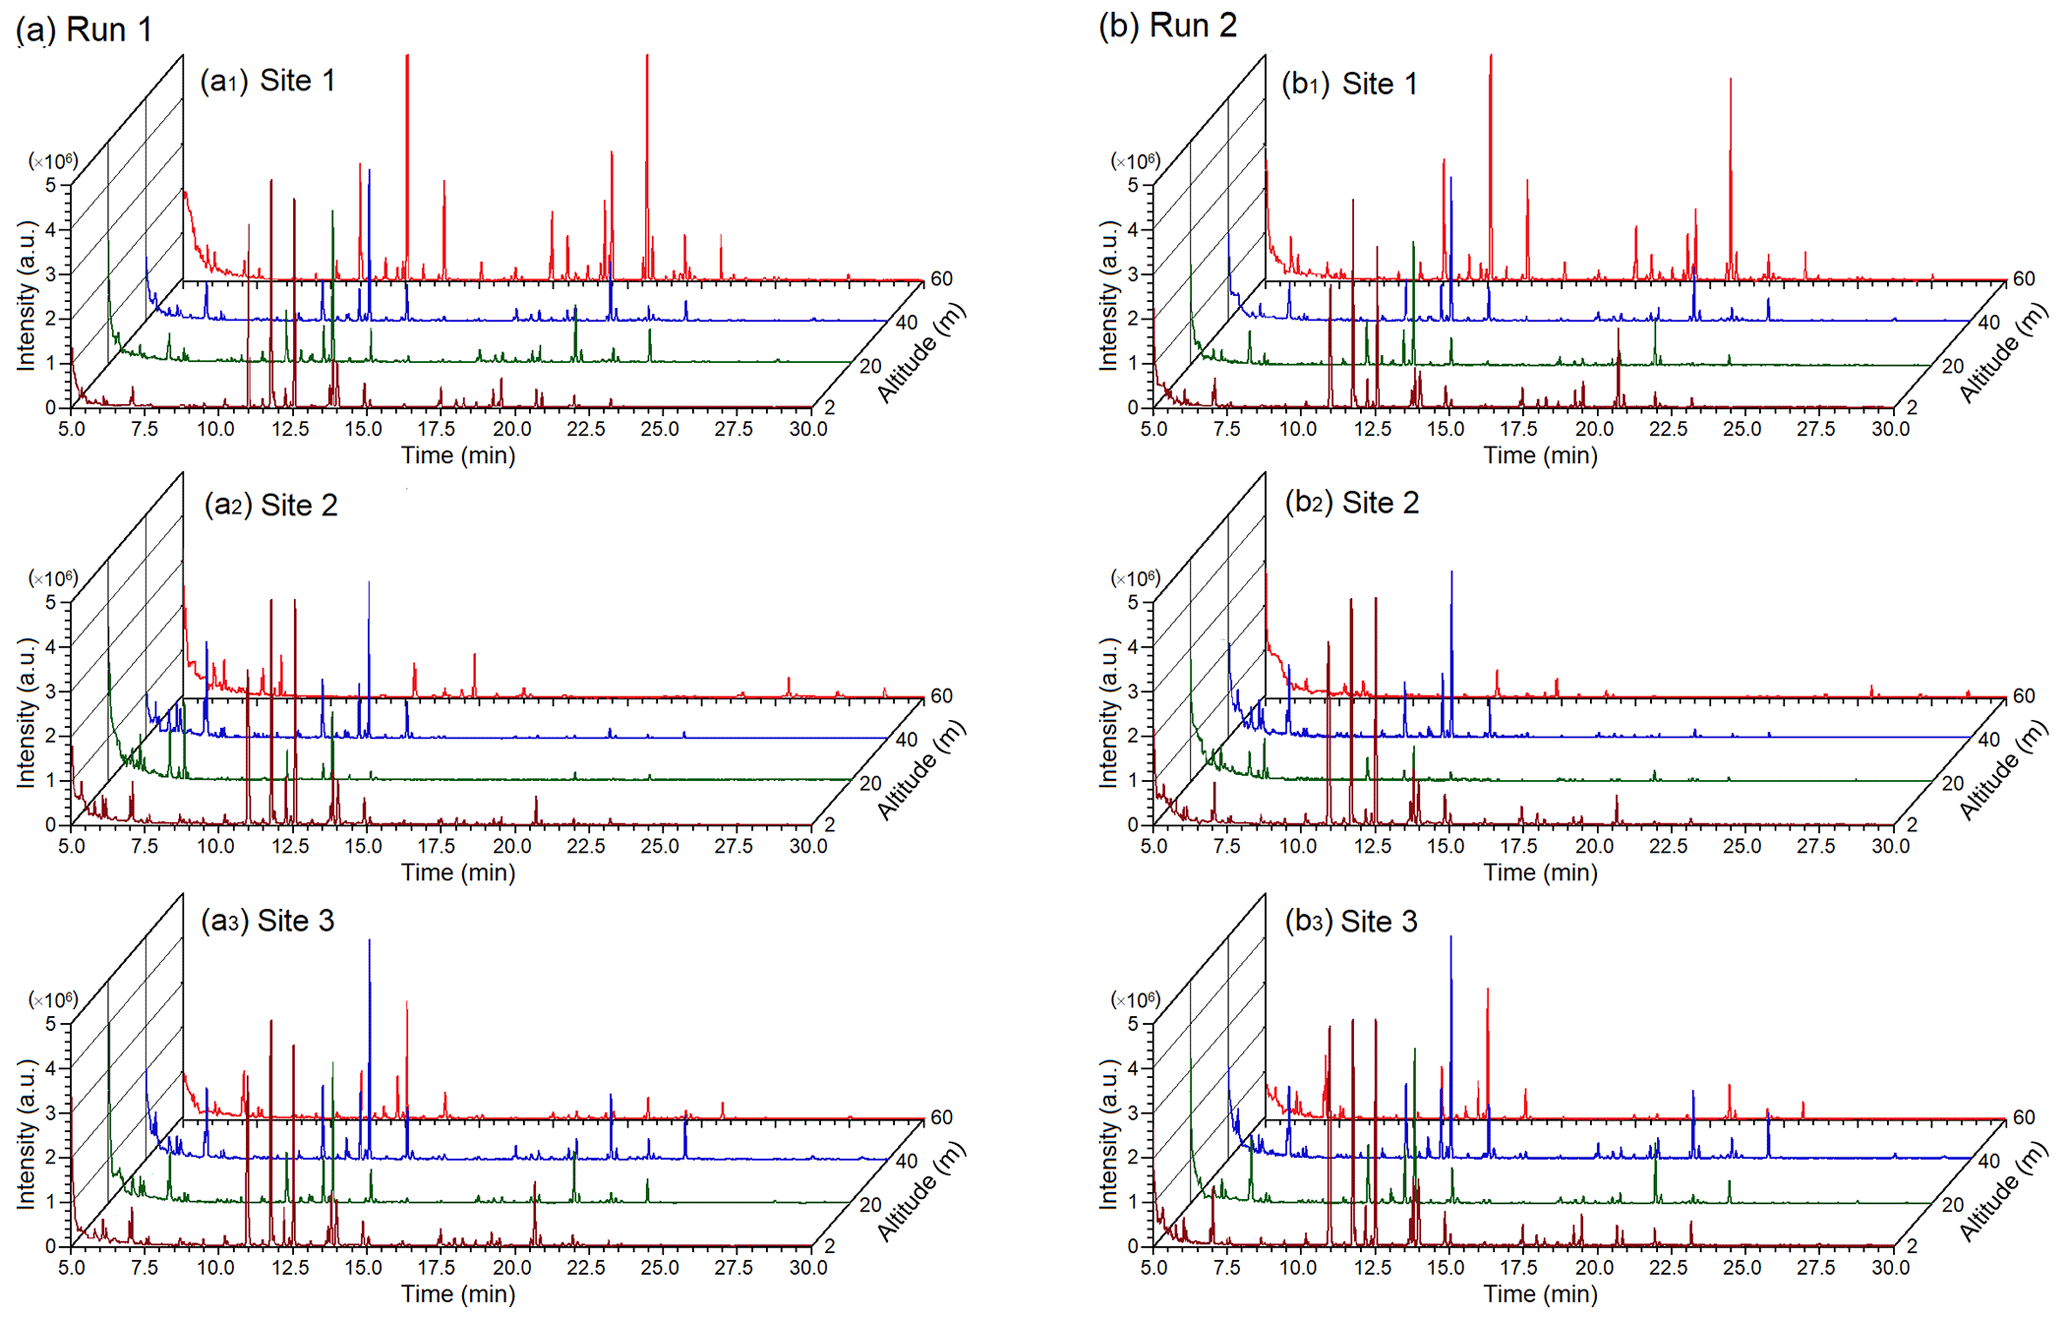
Figure 12The analysis results of upper-altitude VOCs from 13:30–16:30 UTC+8 on 10 May 2023. Panels (a) and (b) show the results of run 1 and run 2, respectively.
3.2.3 Vertical distributions of VOCs
Figure 12 depicts the GC–MS analysis results for upper-altitude VOCs at the three field measurement sites from 13:30–16:30 UTC+8 on 10 May 2023. Sampling was performed twice at four altitudes (2, 20, 40, and 60 m) at each site using the UAV platform; thus, a total of 24 measurements were performed (8 at each site). A total of 79 VOC species were analyzed at different altitudes at the three sites, and this number is higher than the number of VOCs analyzed in field measurement 1 (i.e., 52). All the dominant VOC species at various altitudes at the three sites appeared within the retention time of 10–15 min in the GC–MS chromatogram, which is in line with the results obtained in field measurement 1. The peak patterns of the dominant VOC species at the three sites were highly similar, which indicated that the three sites had similar air pollution sources. The highest peak intensities of the dominant VOC species at the three locations were observed at an altitude of 2 m. A second dominant VOC species appeared at various altitudes within the retention time of 17–24 min, especially at an altitude of 60 m at site 1. The peak intensity of the second dominant species at site 2 was considerably lower than those at the other two sites. In addition, the concentrations of all the VOCs at an altitude of 60 m at site 2 were lower than those at the same altitude at sites 1 and 3.
Table 3The average concentrations (in ppb C) of upper-altitude VOCs at the three sites on 10 May 2023.
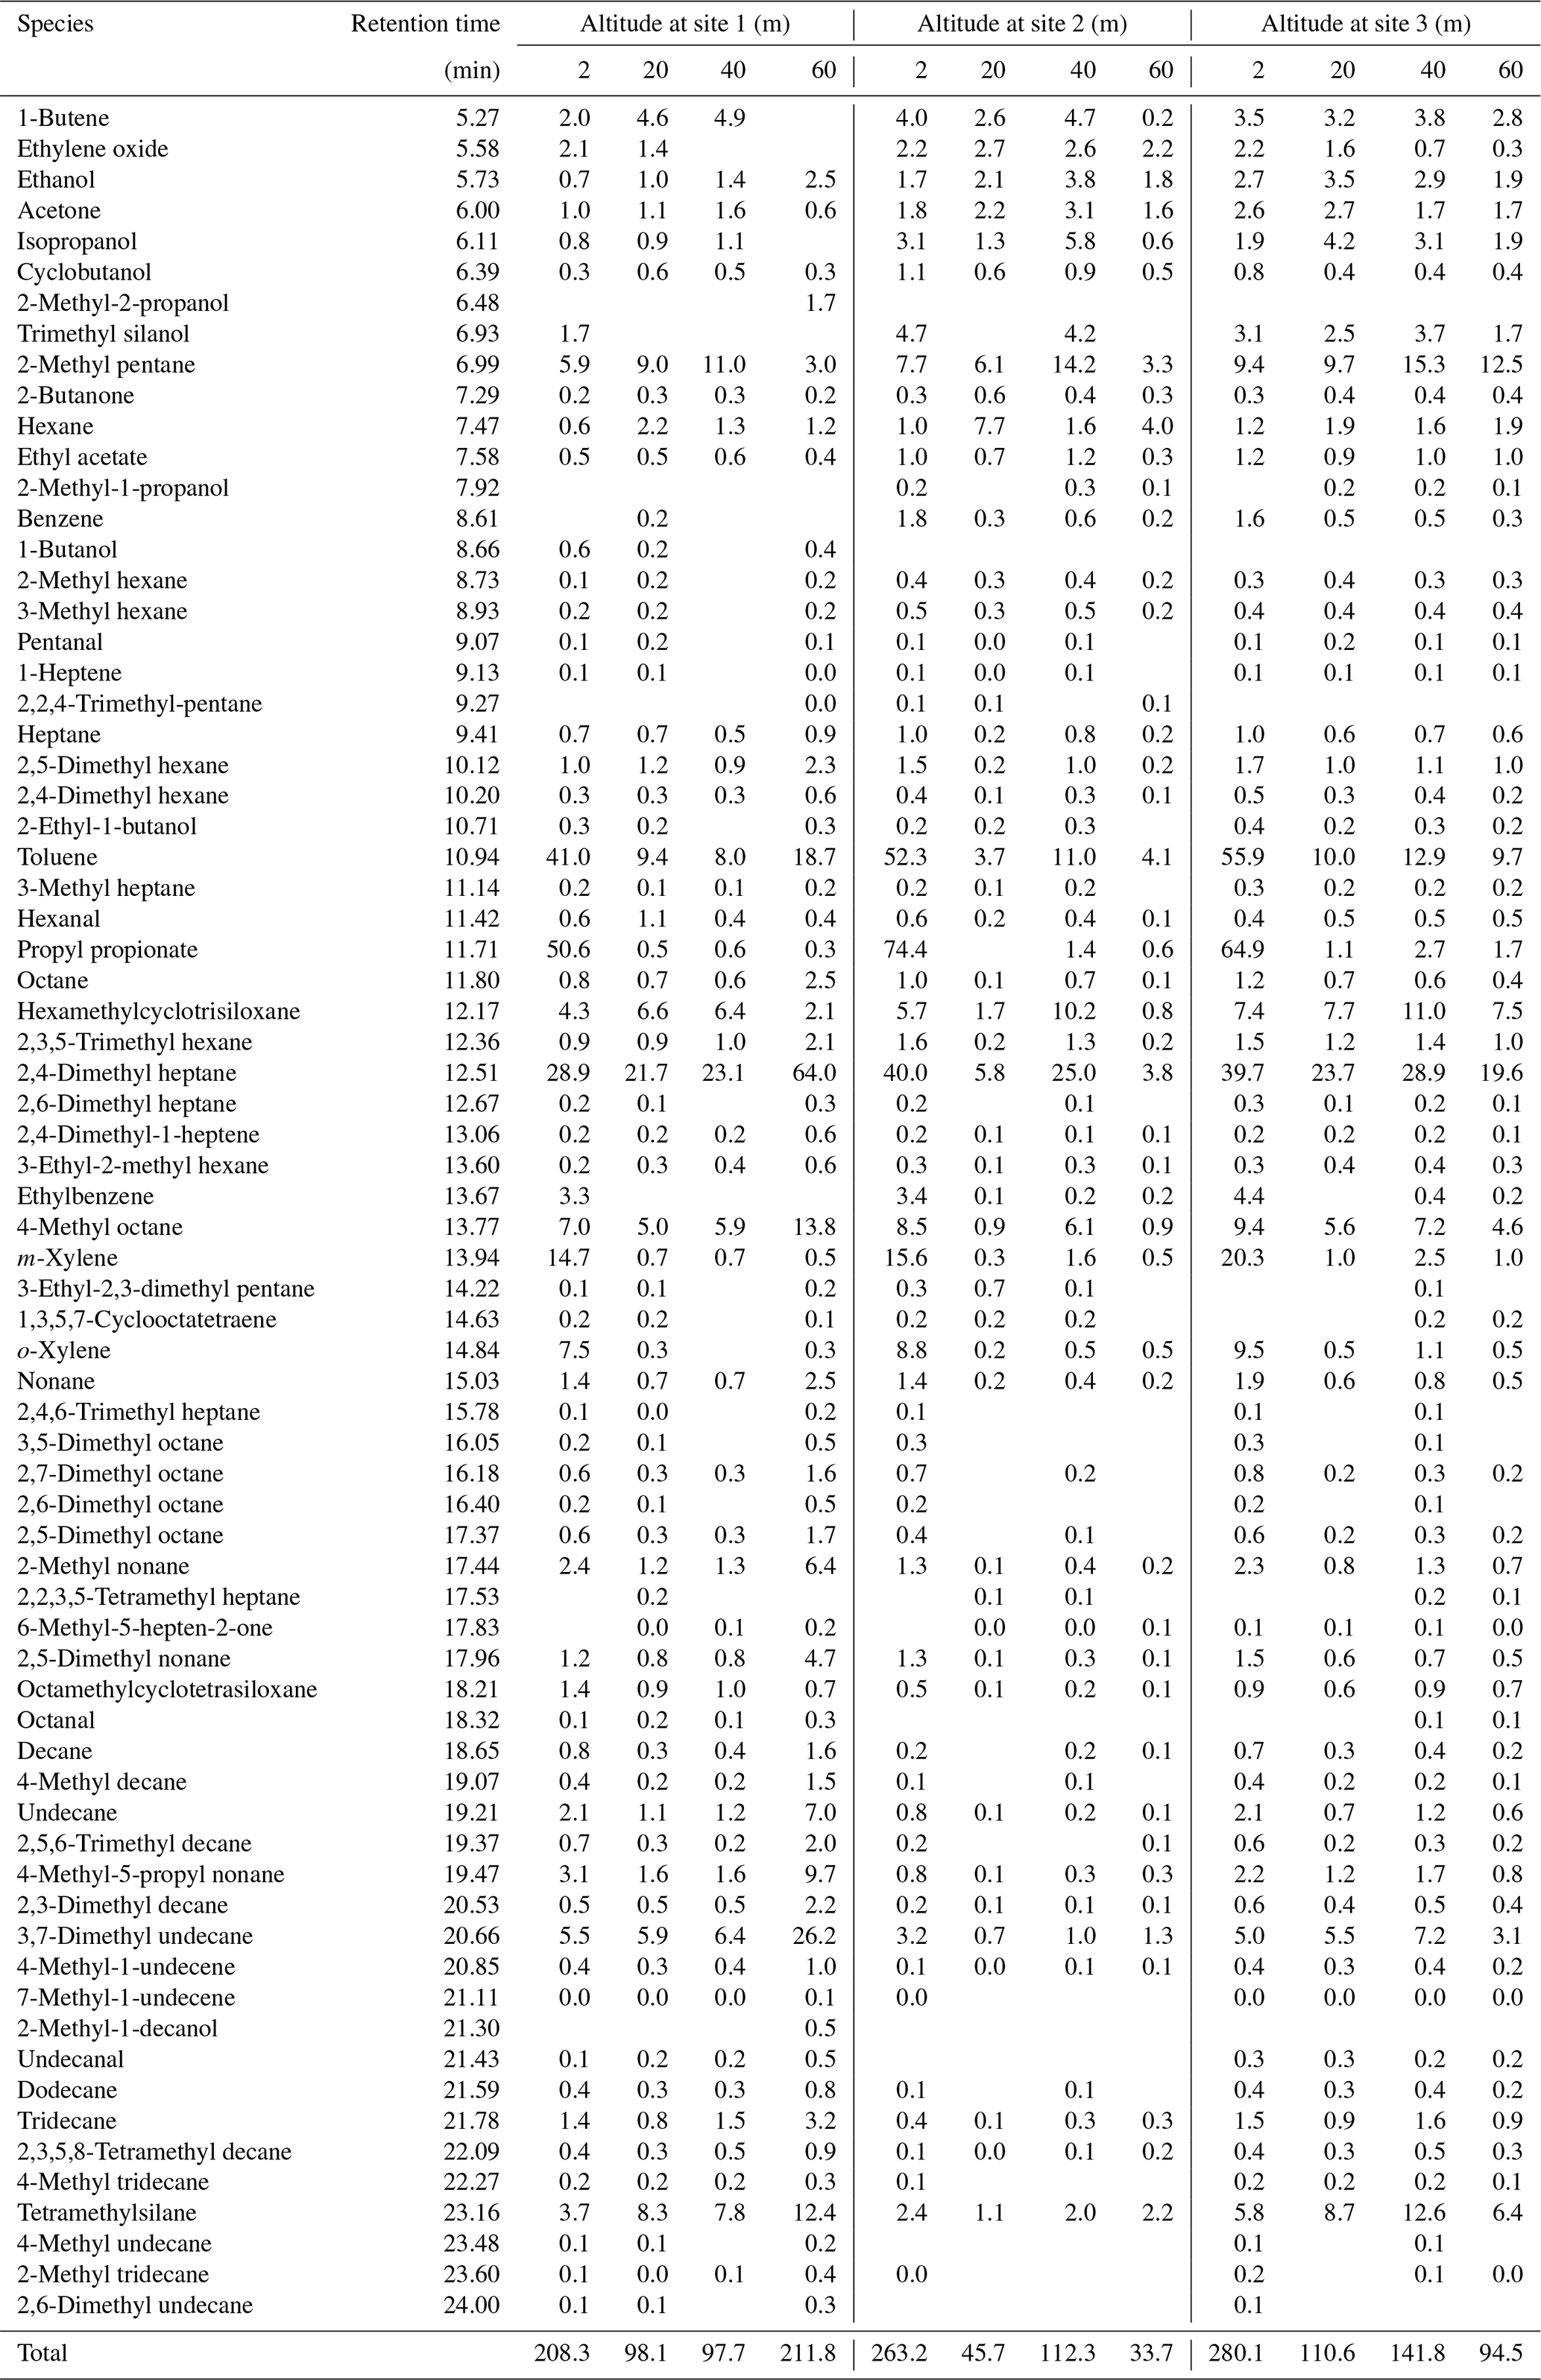
Table 3 lists the average upper-altitude VOC concentrations at the three sites on 10 May 2023. The total upper-altitude VOC concentrations at the three sites in field measurement 2 were marginally lower than those in field measurement 1; however, the total number of VOCs detected in field measurement 2 was higher than that in field measurement 1. In addition, the highest and lowest VOC concentrations occurred at an altitude of 2 m at site 3 and at an altitude of 60 m at site 1, respectively. This result is different from that obtained in field measurement 1.
The top five VOCs at the four altitudes had the following order from highest to lowest: site 1, 2,4-dimethyl heptane > toluene > propyl propionate > 3,7-dimethyl undecane > tetramethylsilane; site 2, propyl propionate > 2,4-dimethyl heptane > toluene > 2-methyl pentane > hexamethylcyclotrisiloxane; and site 3, 2,4-dimethyl heptane > toluene > propyl propionate > 2-methyl pentane > tetramethylsilane. The ranges of the concentration ratios of the top five species to all the upper-altitude VOCs at sites 1, 2, and 3 were 56.0 %–68.5 % (average = 61.5 %), 51.7 %–72.6 % (average = 60.1 %), and 54.1 %–67.9 % (average = 59.5 %), respectively. The predominance of the top five species in the total upper-altitude VOC concentration in field measurement 2 was lower than that in field measurement 1, which was because more VOCs were detected in field measurement 2 than in field measurement 1.
2,4-Dimethyl heptane and toluene had the highest and second-highest concentrations among the VOCs at sites 1 and 3, respectively. However, at site 2, they had the second- and third-highest concentrations, respectively, with propyl propionate having the highest concentration. Toluene is the most common organic compound and originates from vehicle exhaust and industrial emissions. At each site, the detected concentrations of industrial organic solvents, such as benzene, xylene, ethylbenzene, butanone, acetone, isopropyl alcohol, and ethyl acetate, were higher in field measurement 2 than in field measurement 1. Isopropyl alcohol is a crucial cleaning agent and disinfectant in high-tech factories. The second-largest high-tech park in Taiwan is located approximately 4 km north of the study area. Thus, a considerable quantity of the toluene detected in field measurement 2 originated from industrial emissions. 2,4-Dimethylheptane is a crucial component of high-octane fuel such as gasoline; thus, the detected 2,4-dimethylheptane content mainly originated from vehicle emissions. Hexamethylcyclotrisiloxane is used as an additive in the creation of plastic and rubber products, paints, adhesives, cosmetics, food packaging, and many other products; thus, the detected hexamethylcyclotrisiloxane content probably originated from TIP and TPMP (Fig. 4). Tetramethylsilane is used as a starting material for synthesizing more complex organosilanes, and the tetramethylsilane detected in field measurement 2 might have also originated from TIP and TPMP. In addition, propyl propionate is a safer substitute for toluene because of its low odor, moderately volatile nature, and nonhazardous and nonpolluting ester product; thus, the propyl propionate detected in field measurement 2 mainly originated from industrial emissions. Alkanes were the dominant VOCs at various altitudes and sites in field measurement 2. Thus, concentrations of the VOCs originating from vehicle exhaust might have been higher than those of the VOCs originating from industrial exhaust, which is in line with the results of field measurement 1. The order of average VOC concentrations at the three sites in field measurement 2 was as follows: site 3 > site 1 > site 2. This order differed from that in field measurement 1, and this difference was probably because the prevailing winds in the study area changed from north–northeast in field measurement 1 to northeast by east in field measurement 2.
In this study, a UAV platform with sensing and sampling systems was developed for 3D air pollutant concentration measurements. This platform was used in two measurement periods for detecting air pollutant concentrations in a large special industrial zone that includes a traditional industrial park, a precision machinery park, and a municipal waste incineration plant. To elucidate the transport of air pollutants in the aforementioned industrial zone, this study used a single theodolite on the ground to measure the speeds and directions of the upper winds during the field measurement periods. The use of this method prevented the airflow caused by the rotor of the UAV from influencing the measurements. The measurement results obtained by the sensing system of the developed platform, which contains multiple microsensors and is integrated with IoT technology, demonstrated the feasibility of this platform for determining the real-time 3D distributions of critical air pollutants. The NO2 and O3 contents were 0 ppm in the two field measurements because the sensitivities of the NO2 and O3 sensors were too low. All VOC concentrations at the three field measurement sites were very low (≤ 0.02 ppm), possibly because the sensitivity of the VOC sensor was also too low. The sum of the O3 and NO2 concentrations ([O3] + [NO2]) is defined as odd oxygen (ODO) in atmospheric chemistry (Yee et al., 2021; Zhang et al., 2018). Many studies have indicated that a high positive correlation exists between the concentrations of ODO and secondary organic aerosols (SOAs; Herndon et al., 2008; Wood et al., 2010; Hu et al., 2016); thus, the concentration of SOAs can be represented by the sum of the O3 and NO2 concentrations. SOAs can have detrimental effects on the health and mortality of patients with chronic inflammatory diseases (Déméautis et al., 2022). Therefore, developing highly sensitive O3, NO2, and VOC microsensors is desirable for improving UAV air pollutant telemetry.
The sampling system of the developed platform, which contains multiple remote-controllable gas sampling sets, can conduct multipoint sampling according to the relevant situation for analyzing the composition of air pollutants. The results show that it is feasible to replace a canister with a 1 L Tedlar sampling bag for the 3D measurement of VOC concentrations according to the procedures of the TO-15 method of the US EPA. Moreover, the three air pumps of the gas sampling kits are connected in parallel to a length of 60 cm vertical sampling tube at the top of the UAV. The sampling tube was at the top of the UAV because the propeller causes downwash when the UAV is close to the ground (Yang et al., 2020). In addition, the dispersion effects of drone propellers are small in the monitoring of atmospheric pollutants (Fan et al., 2023) but cause a large negative bias in the measurement of pollutant concentrations in plumes (Villa et al., 2016). Therefore, the arrangement of the vertical sampling pipe is acceptable.
The observation and analysis data obtained from the single-theodolite method, sensing system, and sampling system were used to examine the effect of air pollutant discharge from the investigated industrial zone on the study area. The results of this study indicate the feasibility of using the developed UAV platform to accurately identify pollutants and determine their 3D spatial distribution concentrations in a study area. Thus, the UAV platform can serve as a useful tool in the management of and decision-making process for air pollution in industrial areas.
Most research on the application of UAV systems in air pollution monitoring has focused on the development of microsensors and control and communication systems; few studies have used UAV systems for the sampling and analysis of low-altitude pollutants near the ground level. Therefore, in the present study, a UAV platform with sensing and sampling systems was developed for 3D air pollutant concentration measurements. The sensing system of this platform contains multiple microsensors and IoT technologies for obtaining the real-time 3D distributions of critical air pollutants. The sampling system contains multiple remote-controllable gas sampling sets as sampling devices, and these sampling sets contain a 1 L Tedlar bag instead of a canister for the 3D measurement of VOC concentrations in accordance with the TO-15 method of the US EPA. The developed platform was used to detect air pollutant emissions in a large special industrial zone that includes a traditional industrial park, a precision machinery park, and a municipal waste incineration plant. According to the local prevailing wind direction in the study area, three field measurement sites were selected – one site located upwind and two sites located downwind. Comprehensive air pollutant characterization was performed in the aforementioned industrial zone during two field measurements in March and May 2023. The results of this characterization indicate that the developed UAV platform can accurately obtain the 3D concentration distributions of critical air pollutants in real time and conduct multipoint sampling according to the relevant situation for analyzing the composition of air pollutants.
Data not available – data provision requires the consent of the financial support unit (Financial support – Environmental Protection Administration, Executive Yuan, Taiwan). If data access is required, please contact the author for assistance in applying for consent from the financial support unit.
JWL developed the concept and methodology for this work. JWL and CHS processed the field measurement data collected and analyzed the samples. JWL provided scientific expertise on in situ data. Data handling and analysis were performed by CHS with contributions from JWL. Both authors contributed to the proofreading and added valuable suggestions to the final paper.
The contact author has declared that neither of the authors has any competing interests.
Publisher's note: Copernicus Publications remains neutral with regard to jurisdictional claims made in the text, published maps, institutional affiliations, or any other geographical representation in this paper. While Copernicus Publications makes every effort to include appropriate place names, the final responsibility lies with the authors.
The authors gratefully acknowledge Jeng-Jong Liang, Feng Chia University, Taiwan, for providing the air pollution expertise and gas chromatography/mass spectrometry and would also like to thank Green Ideas Synergy Co., Taiwan, for providing the microsensors and allowing use of the company's IoT framework for this research.
This research has been supported by the Environmental Protection Administration, Executive Yuan, Taiwan (grant no. Taichung EPB-P1111017073).
This paper was edited by Cuiqi Zhang and reviewed by Salvatore Manfreda and Francesca Fumian.
Alvarado, M., Gonzalez, F., Fletcher, A., and Doshi, A.: Towards the development of a low cost airborne sensing system to monitor dust particles after blasting at open-pit mine sites, Sensors, 15, 19667–19687, https://doi.org/10.3390/s150819667, 2015.
Arroyo, P., Gómez-Suárez, J., Herrero, J. L., and Lozano, J.: Electrochemical gas sensing module combined with Unmanned Aerial Vehicles for air quality monitoring, Sensor. Actuat. B-Chem., 364, 131815, https://doi.org/10.1016/j.snb.2022.131815, 2022.
Boursianis, A. D., Papadopoulou, M. S., Diamantoulakis, P., Liopa-Tsakalidi, A., Barouchas, P., Salahas, G., Karagiannidis, G., Wan, S., and Goudos, S.K.: Internet of Things (IoT) and Agricultural Unmanned Aerial Vehicles (UAVs) in smart farming: A comprehensive review, Internet of Things, 18, 100187, https://doi.org/10.1016/j.iot.2020.100187, 2022.
Cozma, A., Firculescu, A. C., Tudose, D., and Ruse, L.: Autonomous multi-rotor aerial platform for air pollution monitoring, Sensors, 22, 860, https://doi.org/10.3390/s22030860, 2022.
De Fazio, R., Matteo Dinoi, L., De Vittorio, M., and Visconti, P.: A sensor-based drone for pollutants detection in Eco-Friendly Cities: Hardware design and data analysis application, Electronics, 11, 52, https://doi.org/10.3390/electronics11010052, 2022.
Déméautis, T., Delles, M., Tomaz, S., Monneret, G., Glehen, O., Devouassoux, G., George, C., and Bentaher, A.: Pathogenic mechanisms of secondary organic aerosols, Chem. Res. Toxicol., 35, 1146–1161, https://doi.org/10.1021/acs.chemrestox.1c00353, 2022.
Duangsuwan, S., Prapruetdee, P., Subongkod, M., and Klubsuwan, K.: 3D AQI mapping data assessment of low-altitude drone real-time air pollution monitoring, Drones, 6, 191, https://doi.org/10.3390/drones6080191, 2022.
Fan, G., Liu, Z., Qin, Y., Long, B., Li, H., and Li, J.: Airflow characteristics of rotorcraft plant protection UAV operating in rice fields, Biosyst. Eng., 226, 209–222, https://doi.org/10.1016/j.biosystemseng.2023.01.007, 2023.
Fumian, F., Giovanni, D. D., Martellucci, L., Rossi, R., and Gaudio, P.: Application of miniaturized sensors to unmanned aerial systems, a new pathway for the survey of polluted areas: preliminary results. Atmosphere 11, 471, https://doi.org/10.3390/atmos11050471, 2020.
Fumian, F., Chierici, A., Bianchelli, M., Martellucci, L., Rossi, R., Malizia, A., Gaudio, P., d'Errico, F., and Giovanni, D. D.: Development and performance testing of a miniaturized multi-sensor system combining MOX and PID for potential UAV application in TIC, VOC and CWA dispersion scenarios, Eur. Phys. J. Plus, 136, 913, https://doi.org/10.1140/epjp/s13360-021-01858-2, 2021.
Galle, B., Arellano, S., Bobrowski, N., Conde, V., Fischer, T. P., Gerdes, G., Gutmann, A., Hoffmann, T., Itikarai, I., Krejci, T., Liu, E. J., Mulina, K., Nowicki, S., Richardson, T., Rüdiger, J., Wood, K., and Xu, J.: A multi-purpose, multi-rotor drone system for long-range and high-altitude volcanic gas plume measurements, Atmos. Meas. Tech., 14, 4255–4277, https://doi.org/10.5194/amt-14-4255-2021, 2021.
Gu, Q. and Jia, C.: A consumer UAV-based air quality monitoring system for smart cities, 11–13 January 2019 IEEE International Conference on Consumer Electronics (ICCE), Las Vegas, NV, USA, https://doi.org/10.1109/ICCE.2019.8662050, 2019.
Gu, Q., Michanowicz, D. R., and Jia, C.: Developing a modular unmanned aerial vehicle (UAV) platform for air pollution profiling, Sensors, 18, 4363, https://doi.org/10.3390/s18124363, 2018.
Herndon, S. C., Onasch, T. B., Wood, E. C., Kroll, J. H., Canagaratna, M. R., Jayne, J. T., Zavala, M. A., Knighton, W. B., Mazzoleni, C., Dubey, M. K., Ulbrich, I. M., Jimenez, J. L., Seila, R., de Gouw, J. A., de Foy, B. Fast, J., Molina, L. T., Kolb, C. E., and Worsnop, D. R.: Correlation of secondary organic aerosol with odd oxygen in Mexico City, Geophys. Res. Lett., 35, 15804, https://doi.org/10.1029/2008GL034058, 2008.
Hu, W., Hu, M., Hu, W., Jimenez, J. L., Yuan, B., Chen, W., Wang, M., Wu, Y., Chen, C., Wang, Z., Peng, J., Zeng, L., and Min Shao, M.: Chemical composition, sources, and aging process of submicron aerosols in Beijing: Contrast between summer and winter, J. Geophys. Res.-Atmos., 121, 1955–1977, https://doi.org/10.1002/2015JD024020, 2016.
Huang, F., Peng, S., Yang, H., Cao, H., Ma, N., and Ma, L.: Development of a novel and fast XRF instrument for large area heavy metal detection integrated with UAV, Environ. Res., 214, 113841, https://doi.org/10.1016/j.envres.2022.113841, 2022.
Leitner, S., Feichtinger, W., Mayer, S., Mayer, F., Krompetz, D., Hood-Nowotny, R., and Watzinger, A.: UAV-based sampling systems to analyse greenhouse gases and volatile organic compounds encompassing compound-specific stable isotope analysis, Atmos. Meas. Tech., 16, 513–527, https://doi.org/10.5194/amt-16-513-2023, 2023.
Liu, C., Huang, J., Wang, Y., Tao, X., Hu, C., Deng, L., Xu, J., Xiao, H. W., Luo, L., Xiao, H. Y., and Xiao, W.: Vertical distribution of PM2.5 and interactions with the atmospheric boundary layer during the development stage of a heavy haze pollution event, Sci. Total Environ. 704, 135329, https://doi.org/10.1016/j.scitotenv.2019.135329, 2020.
Middleton, W. E. K. and Spilhaus A. F.: Meteorological Instruments, 3rd edn., University of Toronto Press, Heritage, https://doi.org/10.3138/9781487572013-056, 181–183 pp., 2019.
Noori, R. and Dahnil, D. P.: The effects of speed and altitude on wireless air pollution measurements using hexacopter drone, Int. J. Adv. Comput. Sci. Appl. (IJACSA), 11, 268–276, https://doi.org/10.14569/IJACSA.2020.0110931, 2020.
Pochwała, S., Gardecki, A., Lewandowski, P., Somogyi, V., and Anweiler, S.: Developing of low-cost air pollution sensor – Measurements with the unmanned aerial vehicles in Poland, Sensors 20, 3582, https://doi.org/10.3390/s20123582, 2020.
Pollak, L. W. and Brunt, D.: A new theodolite for following fast moving objects especially for making pilot balloon observations of greater accuracy, Q. J. Roy. Meteor. Soc., 65, 443–447, https://doi.org/10.1002/qj.49706528117, 1939.
Pounds, P. E. I., Bersak, D. R., and Dollar, A. M.: Grasping from the air: Hovering capture and load stability, 2011 IEEE ICRA SHICC, May, 2011, Shanghai, China, https://doi.org/10.1109/ICRA.2011.5980314, 2011.
Qiu, S., Chen, B., Wang, R., Zhu, Z., Wang, Y., and Qiu, X.: Estimating contaminant source in chemical industry park using UAV-based monitoring platform, artificial neural network and atmospheric dispersion simulation, RSC Adv., 7, 39726–39738, https://doi.org/10.1039/C7RA05637K, 2017.
Samad, A., Florez, D. A., Chourdakis, I., and Vogt, U.: Concept of using an unmanned aerial vehicle (UAV) for 3D investigation of air quality in the atmosphere – Example of measurements near a roadside, Atmosphere, 13, 663, https://doi.org/10.3390/atmos13050663, 2022.
Shen, L., Cheng, Y., Bai, X., Dai, H., Wei, X., Sun, L., Yang, Y., Zhang, J., Feng, Y., Li, Y. J., Chen, D. R., Liu, J., and Gui, H.: Vertical profile of aerosol number size distribution during a haze pollution episode in Hefei, China, Sci. Total Environ., 814, 152693, https://doi.org/10.1016/j.scitotenv.2021.152693, 2022.
Singh, P. K. and Sharma, A.: An intelligent WSN-UAV-based IoT framework for precision agriculture application, Comput. Electr. Eng., 100, 107912, https://doi.org/10.1016/j.compeleceng.2022.107912, 2022.
Sun, X., Zhao, T., Tang, G., Bai, Y., Kong, H., Zhou, Y., Hu, J., Tan, C., Shu, Z., Xu, J., and Ma, X.: Vertical changes of PM2.5 driven by meteorology in the atmospheric boundary layer during a heavy air pollution event in central China, Sci. Total Environ., 858, 159830, https://doi.org/10.1016/j.scitotenv.2022.159830, 2023.
Suroto, A., Ubaidillah, A., and Ulum, M.: Air condition monitoring using way point based UAV (Unmanned Aerial Vehicle), Int. J. Sci. Eng. Inf. Technol., 3, 109–114, https://journal.trunojoyo.ac.id/ijseit (last access: June 2023), 2018.
Villa, T. F., Salimi, F., Morton, K., Morawska, L., and Gonzalez, F.: Development and validation of a UAV based system for air pollution measurements, Sensors 16, 2202, https://doi.org/10.3390/s16122202, 2016.
Wood, E. C., Canagaratna, M. R., Herndon, S. C., Onasch, T. B., Kolb, C. E., Worsnop, D. R., Kroll, J. H., Knighton, W. B., Seila, R., Zavala, M., Molina, L. T., DeCarlo, P. F., Jimenez, J. L., Weinheimer, A. J., Knapp, D. J., Jobson, B. T., Stutz, J., Kuster, W. C., and Williams, E. J.: Investigation of the correlation between odd oxygen and secondary organic aerosol in Mexico City and Houston, Atmos. Chem. Phys., 10, 8947–8968, https://doi.org/10.5194/acp-10-8947-2010, 2010.
Xie, T., Liu, R., Hai, R. T., Hu, Q. H., and Lu. Q.: UAV platform based atmospheric environmental emergency monitoring system design, J. Appl. Sci., 13, 1289–1296, https://doi.org/10.3923/jas.2013.1289.1296, 2013.
Yang, S., Tang, Q., Zheng, Y., Liu, X., and Chen, J.: Model migration for CFD and verification of a sixrotor UAV downwash, Int. J. Agr. Biol. Eng., 13, 10–18, https://doi.org/10.25165/j.ijabe.20201304.5569, 2020.
Yang, Z., Yu, X., Dedman, S., Rosso, M., Zhu, J., Yang, J., Xia, Y., Tian, Y., Zhang, G., and Wang, J.: UAV remote sensing applications in marine monitoring: Knowledge visualization and review, Sci. Total Environ., 838, 155939, https://doi.org/10.1016/j.scitotenv.2022.155939, 2022.
Yee, L. D., Craven, J. S., Loza, C. L., Schilling, K. A., Ng, N. L., Canagaratna, M. R., Ziemann,P. J., C Flagan, R. C., and Seinfeld, J. H.: Secondary organic aerosol formation from low-NOx photooxidation of dodecane: evolution of multigeneration gas-phase chemistry and aerosol composition, J. Phys. Chem. A, 116, 6211–6230, https://doi.org/10.1021/jp211531h, 2021.
Yungaicela-Naula, N. M., Garza-Castanón, L. E., Mendoza- ˇ Domínguez, A., Minchala-Avila, L. I., and Garza-Elizondo, L. E.: Design and implementation of an UAV-based platform for air pollution monitoring and source identification, 4–6 October 2017 Congreso Nacional de Control Automático, Monterrey, Nuevo León, Mexico, https://amca.mx/memorias/amca2017/media/files/0041.pdf, 2017.
Zhang, C., Lu, X. H., Zhai, J. H., Chen, H., Yang, X., Zhang, Q., Zhao, Q., Fu, Q., Sha, F., and Jin, J.: Insights into the formation of secondary organic carbon in the summertime in urban Shanghai, J. Environ. Sci.-China, 72, 118–132, https://doi.org/10.1016/j.jes.2017.12.018, 2018.
Zheng, T., Li, B., Li, X. B., Wang, Z., Li, S. Y., and Peng, Z. R.: Vertical and horizontal distributions of traffic-related pollutants beside an urban arterial road based on unmanned aerial vehicle observations, Build. Environ., 187, 107401, https://doi.org/10.1016/j.buildenv.2020.107401, 2021.
Zhu, X., Zhu, X., Rui Yan, R., and Peng R.: Optimal routing, aborting and hitting strategies of UAVs executing hitting the targets considering the defense range of targets, Reliab. Eng. Syst. Safe., 215, 107811, https://doi.org/10.1016/j.ress.2021.107811, 2021.