the Creative Commons Attribution 4.0 License.
the Creative Commons Attribution 4.0 License.
 | 29 May 2024
Geostationary aerosol retrievals of extreme biomass burning plumes during the 2019–2020 Australian bushfires
Daniel J. V. Robbins
Caroline A. Poulsen
Steven T. Siems
Simon R. Proud
Andrew T. Prata
Roy G. Grainger
Adam C. Povey
Extreme biomass burning (BB) events, such as those seen during the 2019–2020 Australian bushfire season, are becoming more frequent and intense with climate change. Ground-based observations of these events can provide useful information on the macro- and micro-physical properties of the plumes, but these observations are sparse, especially in regions which are at risk of intense bushfire events. Satellite observations of extreme BB events provide a unique perspective, with the newest generation of geostationary imagers, such as the Advanced Himawari Imager (AHI), observing entire continents at moderate spatial and high temporal resolution. However, current passive satellite retrieval methods struggle to capture the high values of aerosol optical thickness (AOT) seen during these BB events. Accurate retrievals are necessary for global and regional studies of shortwave radiation, air quality modelling and numerical weather prediction. To address these issues, the Optimal Retrieval of Aerosol and Cloud (ORAC) algorithm has used AHI data to measure extreme BB plumes from the 2019–2020 Australian bushfire season. The sensitivity of the retrieval to the assumed optical properties of BB plumes is explored by comparing retrieved AOT with AErosol RObotic NETwork (AERONET) level-1.5 data over the AERONET site at Tumbarumba, New South Wales, between 1 December 2019 at 00:00 UTC and 3 January 2020 at 00:00 UTC. The study shows that for AOT values > 2, the sensitivity to the assumed optical properties is substantial. The ORAC retrievals and AERONET data are compared against the Japan Aerospace Exploration Agency (JAXA) Aerosol Retrieval Product (ARP), Moderate Resolution Imaging Spectroradiometer (MODIS) Deep Blue over land, MODIS MAIAC, Sentinel-3 SYN and VIIRS Deep Blue products. The comparison shows the ORAC retrieval significantly improves coverage of optically thick plumes relative to the JAXA ARP, with approximately twice as many pixels retrieved and peak retrieved AOT values 1.4 times higher than the JAXA ARP. The ORAC retrievals have accuracy scores of 0.742–0.744 compared to the values of 0.718–0.833 for the polar-orbiting satellite products, despite successfully retrieving approximately 28 times as many pixels over the study period as the most successful polar-orbiting satellite product. The AHI and MODIS satellite products are compared for three case studies covering a range of BB plumes over Australia. The results show good agreement between all products for plumes with AOT values ≤ 2. For extreme BB plumes, the ORAC retrieval finds values of AOT > 15, significantly higher than those seen in events classified as extreme by previous studies, although with high uncertainty. A combination of hard limits in the retrieval algorithms and misclassification of BB plumes as cloud prevents the JAXA and MODIS products from returning AOT values significantly greater than 5.
- Article
(9955 KB) - Full-text XML
- BibTeX
- EndNote


Aerosols are an important component of the Earth's atmosphere with significant effects on the Earth's radiation budget (Bellouin et al., 2020). Overall, aerosols are considered to have a net cooling effect, but a high level of uncertainty remains regarding the effects of some aerosol species, such as organic and black carbon (Arias et al., 2021). Aerosols affect cloud formation and weather. For example, Connolly et al. (2012) found that the inclusion of aerosols in modelling of the convective system known as “Hector” in northern Australia improved the accuracy regarding the storm's development. Huang and Ding (2021) demonstrated that aerosols can have a significant impact on temperature forecasts. Biomass burning (BB) events release large amounts of black and brown carbon aerosol into the atmosphere (Andreae, 2019; Pan et al., 2020), which can directly affect the local and global radiation budget by absorbing and scattering shortwave radiation, known as the “direct radiation effect”, or through interaction with clouds, known as the “semi-direct effect” and “indirect effect” (Ackerman et al., 2000; Haywood and Boucher, 2000; Bellouin et al., 2005; Lisok et al., 2018; Matus et al., 2019; Shi et al., 2019; Liu et al., 2020). Characterisation of aerosols is important for numerical weather prediction (NWP), where assimilation of aerosols is needed to ensure accurate incident radiation and temperature predictions (Huang and Ding, 2021; Juliano et al., 2022), as well as in global reanalysis products of aerosols (Flemming et al., 2017; Gelaro et al., 2017). BB aerosols affect air quality, most notably through the emission of particulate matter under 2.5 µm in diameter (PM2.5), which is known to have serious impacts on people's health and can remain suspended in air for several days (Engel-Cox et al., 2004; Reisen et al., 2013; Chen et al., 2017; Sorek-Hamer et al., 2020).
1.1 Measuring aerosols
Observations of aerosols, such as BB, are important for evaluating their uncertainties in models and impacts (Schutgens et al., 2020; Vogel et al., 2022; Zhong et al., 2022). Ground-based instrumentation, such as the AErosol RObotic NETwork (AERONET) (Holben et al., 1998), can accurately monitor atmospheric aerosol properties in the area above the site location and are a useful tool for building global aerosol climatologies. AERONET data are used in the development of aerosol classifications and models for satellite retrieval products (Omar et al., 2009; Lyapustin et al., 2018). However, AERONET sites are sparse, with very few sites in regions such as Australia.
Satellites provide global observations. Active instruments in low Earth orbit (LEO), such as the Cloud-Aerosol Lidar with Orthogonal Polarization (CALIOP) (Winker et al., 2009), retrieve profiles of aerosols in the atmosphere along the sub-orbital path but have a narrow swath, greatly limiting coverage. Passive LEO instruments, such as the Moderate Resolution Imaging Spectroradiometer (MODIS) (Justice et al., 2002) and Sea and Land Surface Temperature Radiometer (Sentinel-3) (Coppo et al., 2010), have wider swaths and can retrieve aerosol properties over a larger area with moderately high resolution and shorter revisit times. Passive geostationary (GEO) satellite instruments, such as the Advanced Himawari Imager (AHI) on board the Himawari-8 and Himawari-9 satellites (Bessho et al., 2016), the Advanced Baseline Imager (ABI) on board the GOES-16 and GOES-17 satellites (Schmit et al., 2017; Goodman, 2020), and the Flexible Combined Imager (FCI) on board the recently launched MTG-I1 satellite (Holmlund et al., 2021), have been used to provide aerosol products of high temporal and moderately high spatial resolution. Passive satellite instruments rely on retrieval algorithms that require a representation of the surface reflectance and aerosol micro-physical properties alongside cloud masking, all of which are sources of error.
1.2 Wildfires in Australia
Biomass burning events have been frequent throughout Australia's history. Indigenous people across Australia engaged in cultural or cool burning before colonisation, and, more recently, states across Australia have moved to prescribed burns as part of fire management strategies (Gott, 2005; Morgan et al., 2020). There have been several significant uncontrolled BB events, known as “bushfires”, in Australia in recent years, such as the Black Saturday bushfires in 2009 and the 2019–2020 Black Summer bushfires, which were exacerbated by hot, dry conditions and a build-up in combustible material (Cruz et al., 2012; van Oldenborgh et al., 2021). The conditions for fire events are expected to become more intense and extreme with climate change (Abram et al., 2021; Canadell et al., 2021).
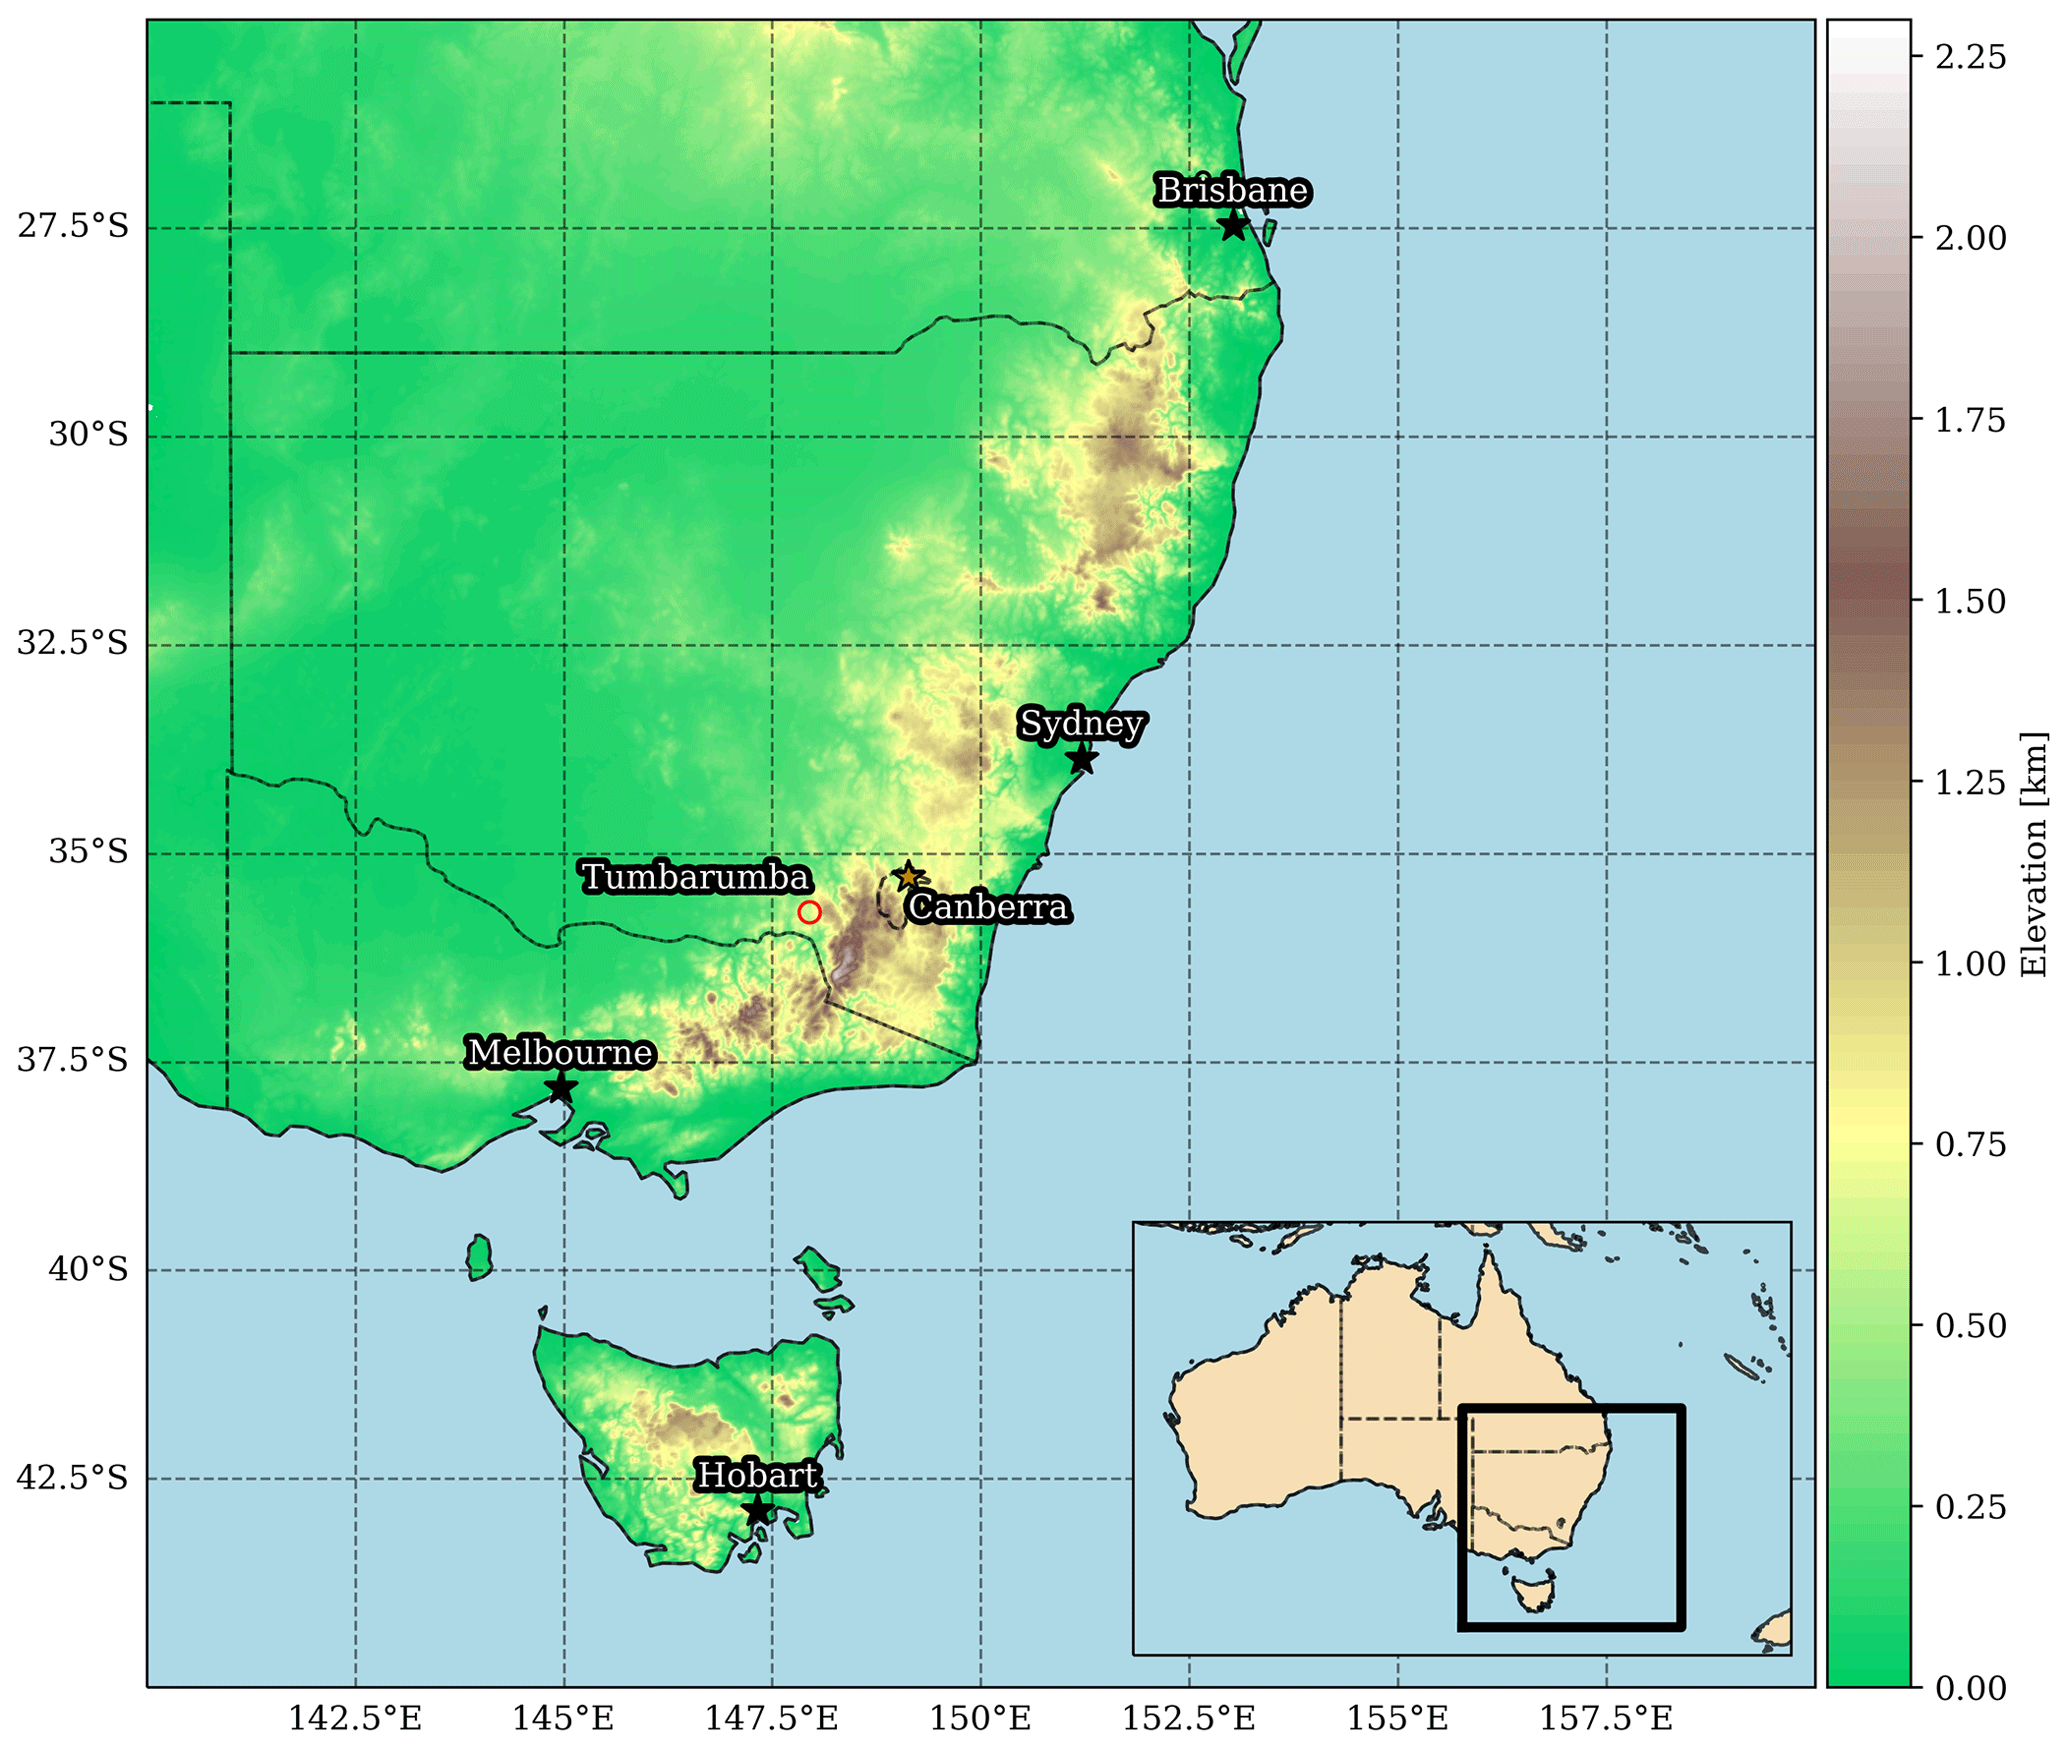
Figure 1Digital elevation model (DEM) derived from Geoscience Australia data (Hutchinson et al., 2008) of the southeast coast of Australia with the locations of major cities (stars) and the Tumbarumba AERONET site (red circle). The DEM shows the Great Dividing Range dominating the topography of the southeast coast, extending all the way from Victoria in the south of mainland Australia to Queensland in the north. The inset map shows the wider context of the region, with the region of interest highlighted by the black square, in relation to the Australian region.
In the case of the 2019–2020 Australian bushfire season, over 110 Tg of biomass was burnt, releasing approximately 1.7 Tg of particulate matter with a diameter < 2.5 µm (PM2.5) into the atmosphere (Li et al., 2021a). The fires had a significant impact on people's health (Walter et al., 2020; Graham et al., 2021) and directly resulted in the deaths of 34 people (Wen et al., 2022). It is estimated that there were approximately 417 excess deaths associated with the very high concentrations of PM2.5 (Arriagada et al., 2020), and approximately 3 billion animals were estimated to have either been killed or displaced as a result of fire (Dickman, 2021). Large fires have also occurred in North America, Siberia and southern Europe (Markowicz et al., 2016; Zhuravleva et al., 2017; Ribeiro et al., 2020; Fernández-García et al., 2022) but have not matched the scale of the Australian bushfires (Boer et al., 2020; Collins et al., 2021). When fires on these scales occur in mountainous regions with large valleys, Kochanski et al. (2019) demonstrated that smoke can cause inversions and lead to high optical thickness throughout the region. This suggests that, in regions of Australia with similar topography, such as the southeast coast of Australia which is dominated by the Great Dividing Range (see Fig. 1), BB events can lead to high optical thicknesses and high levels of pollution. These optically thick plumes are clearly visible in satellite imagery as well as in the very poor air quality measurements seen along the southeast coast of Australia during the 2019–2020 bushfire period (Graham et al., 2021). This paper will focus on the 2019–2020 fires as a study of high-impact events with high aerosol loading.
1.3 Satellite measurements
Previous analyses of the 2019–2020 fires mostly focused on optically thin stratospheric layers or publicly available tropospheric satellite aerosol optical thickness (AOT) products (Torres et al., 2020; Chang et al., 2021; Hirsch and Koren, 2021; Li et al., 2021b; Attiya and Jones, 2022; Papanikolaou et al., 2022; Sellitto et al., 2022; Isaza et al., 2023). Li et al. (2021b) found that AOT440 nm values over the Tumbarumba AERONET site reached 2.74. Torres et al. (2020) found TROPOspheric Monitoring Instrument (TROPOMI) AOT388 nm values > 5 in plumes transported over New Zealand, whereas with CALIOP, Papanikolaou et al. (2022) found a maximum AOT532 nm value of 0.54 in lower-tropospheric layers near fire spots. For the summer months of 2019–2020 in the state of Victoria, Chang et al. (2021) found AOT550 nm values slightly greater than 0.3 in MODIS L3 monthly data. Upon closer inspection of the AERONET data used by Li et al. (2021b), AOT500 nm values > 6 can be seen at the Tumbarumba site (https://aeronet.gsfc.nasa.gov/cgi-bin/data_display_aod_v3?site=Tumbarumba, last access: 6 June 2023), which is located at approximately 35.7083° S, 147.9499° E, near Canberra (see Fig. 1), suggesting that these studies have not explored the more optically thick events during the 2019–2020 bushfire season.
A review of passive retrievals for extreme smoke plumes from fires in North America and Siberia offers some insight into why the retrievals may be restricted. The 2012 western Siberian fires were found by Zhuravleva et al. (2017) to reach an AOT550 nm value of approximately 3.54 in MODIS level-3 daily data, with subsequent significant cooling effects on the surface. Markowicz et al. (2016) found that fires in Canada from July 2013 produced AOT500 nm anomalies up to 1.5 times the climatology for July at several AERONET sites, with similar enhancements observed over Polish and Central European AERONET sites. However, Markowicz et al. (2016) observed that AOT data from SEVIRI and MODIS did not reach AOT values greater than 0.6. Petrenko et al. (2017) showed that average MODIS BB AOT observations and adjusted GOCART model BB AOT values were less than 2 for regional results of reanalysis-filled MODIS Dark Target observations of almost 900 fires across the globe. These values are all considered extreme but are significantly less than the peak in AOT500 nm seen at the Tumbarumba AERONET site during the 2019–2020 bushfire season. Eck et al. (2019) demonstrated that the AERONET products are capable of dealing with extrapolated AOT550 nm values as high as 13, well beyond the upper limits seen in these previous studies. Much of this underprediction is the result of misclassification of aerosol as cloud and limitations in the retrieval models. For example, the algorithm theoretical basis document (ATBD) for the MODIS Multi-Angle Implementation of Atmospheric Correction (MAIAC) algorithm states that the AOT470 nm retrieval is limited to a maximum of 4 (Lyapustin and Wang, 2008), well below the peak seen in the Tumbarumba data. Previous work has demonstrated that operational cloud masks for the Himawari-8 AHI misclassify the more extreme smoke plumes as cloud (Robbins et al., 2022), which is also seen in other retrievals of high-AOT events (Wei et al., 2019; Ye et al., 2022). All of these limitations prevent proper classification of the values of AOT seen during the 2019–2020 Australian bushfire season and limit our ability to study the impacts of this event. In addition, current aerosol retrieval algorithms assume that an aerosol layer is translucent and well mixed, meaning that extreme AOT values are not physically sensible in these types of retrieval.
Some attempts to overcome these limitations have been made. For example, Mukai et al. (2021) demonstrated that existing satellite data can be used to carry out retrievals of extreme biomass burning plumes by utilising the UV band of the second-generation global imager to correctly identify optically thick BB plumes, and van Donkelaar et al. (2011) showed that simply relaxing the cloud screening of the MODIS aerosol products significantly improved coverage of the biomass burning plumes from the 2010 Moscow fires, but these methods have not been applied to geostationary meteorological satellites.
In this study, we present a novel method for retrieving BB aerosol optical properties from Himawari-8 AHI using the Optimal Retrieval of Aerosol and Cloud (ORAC) algorithm (Thomas et al., 2009; Poulsen et al., 2012; McGarragh et al., 2018). Using data from the 2019–2020 Australian bushfires, we demonstrate that this retrieval method, in combination with the cloud mask developed in Robbins et al. (2022), is capable of retrieving extreme values of AOT well beyond what current retrieval algorithms can retrieve. These results demonstrate the limitations of current satellite retrieval products, suggesting that AOTs from the 2019–2020 Australian bushfires and other large-scale fires around the globe are likely to have been systematically underestimated, which will alter estimates of the extent of BB plumes and the radiative impact of fires.
2.1 AERONET
The AERONET (Holben et al., 1998; Giles et al., 2019) project is a network of sun–sky photometers located across the globe collecting information on aerosol optical properties, such as the complex refractive index, AOT and classification of aerosols, e.g. fine or coarse. These data are extracted from the raw output using the V3 inversion algorithm developed by Sinyuk et al. (2020), which provides improved cloud clearing over the previous algorithm as well as being more capable of handling extreme AOT values. The maximum value of AOT reported by AERONET is approximately 7, as the instrument is unable to automatically locate the sun under such large attenuations.
For the period of this study (1 December 2019–2 January 2020), only version-3 level-1.5 direct sun AOT data from the Tumbarumba AERONET site were available at the time of publication. The level-1.5 data are cloud-cleared but have not gone through the full QA screening required to report the data at level 2.0. Level-1.5 data are considered suitable for this work and have been used in similar studies (González et al., 2020; Li et al., 2021b; Yang et al., 2021).
2.2 Himawari-8 AHI
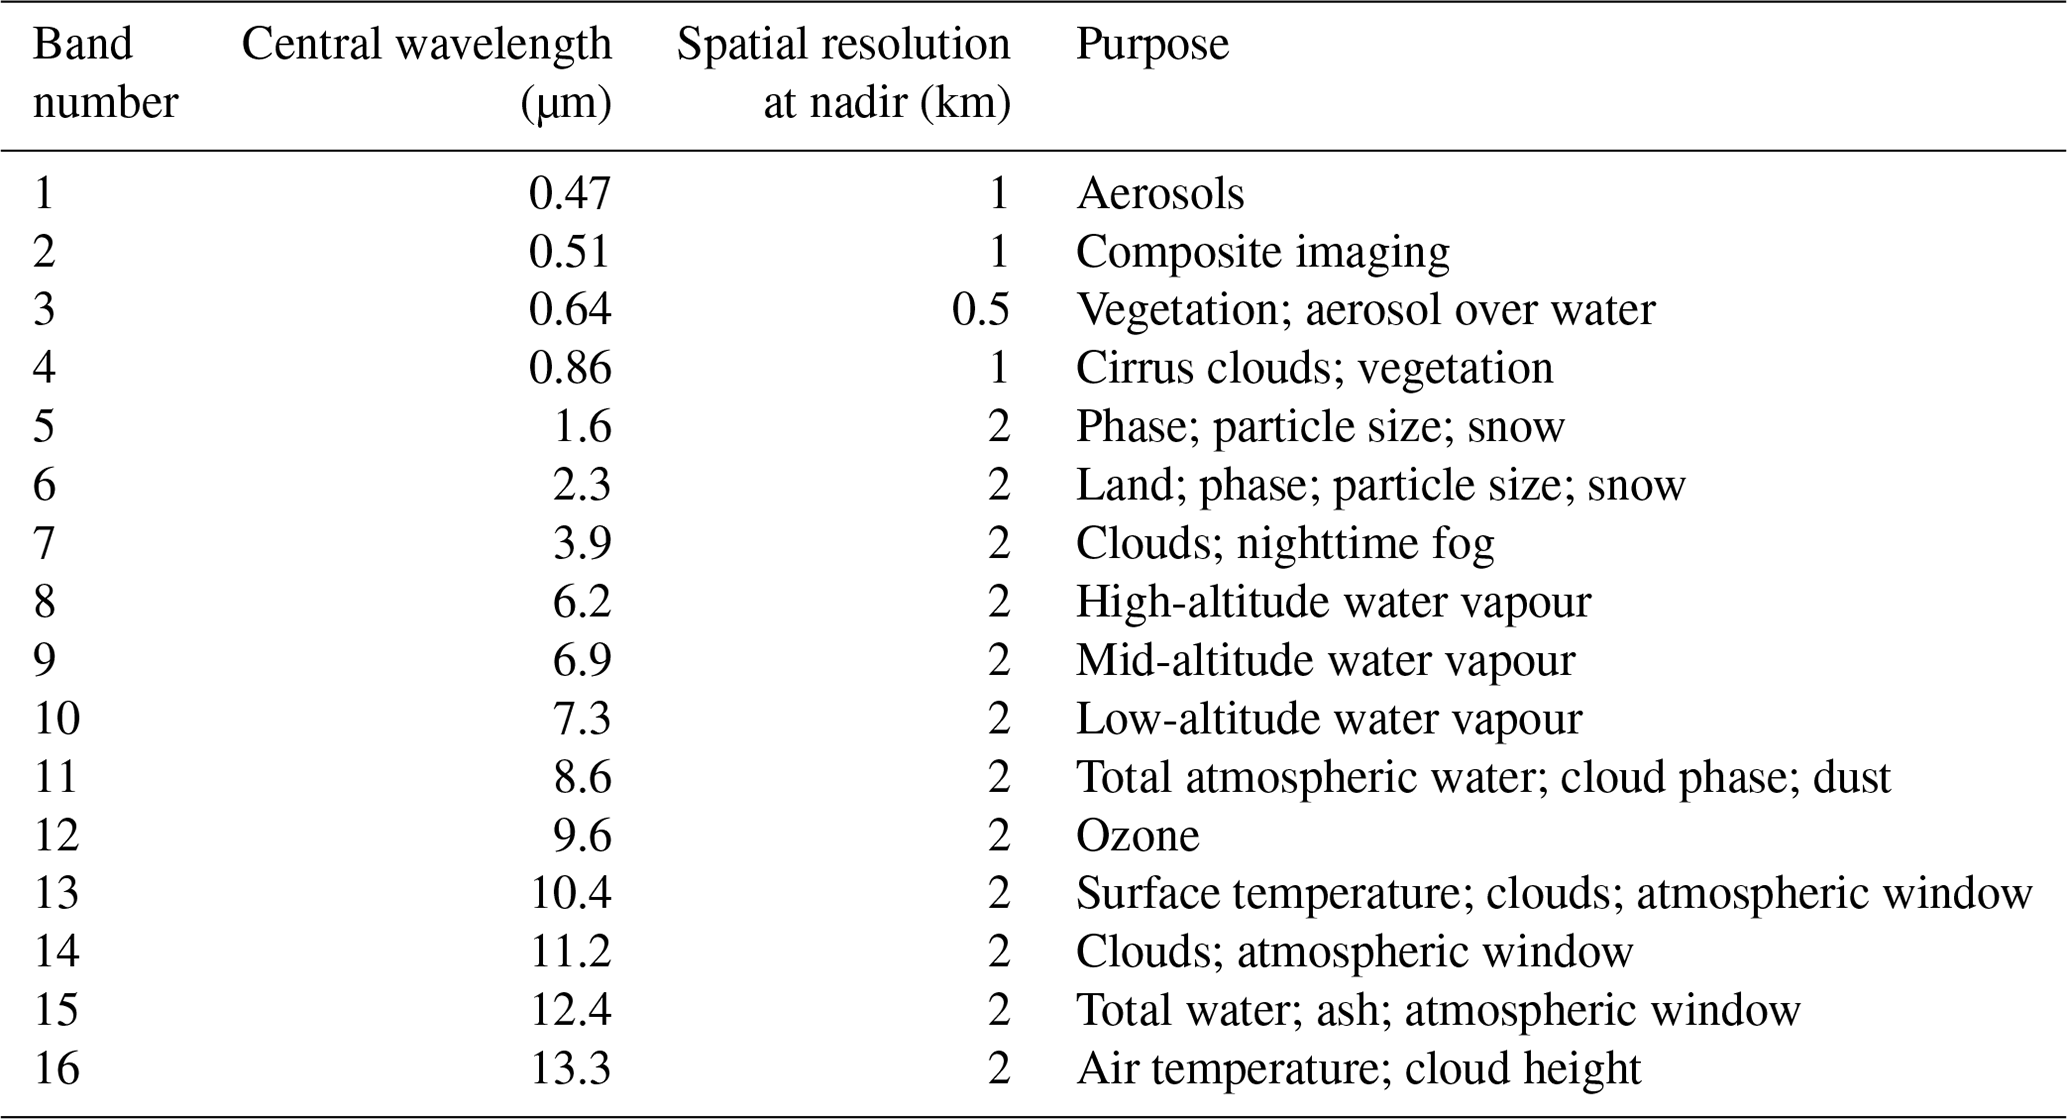
The Himawari-8 satellite is a geostationary meteorological satellite operated by the Japanese Meteorological Agency (JMA), which is positioned above 140.7° E and carries AHI. AHI is a passive satellite instrument which produces whole visible disc images every 10 min across 16 bands at 0.5–2 km spatial resolution at nadir (see Table 1), with the exception of scheduled “housekeeping times” at 02:40 and 14:40 UTC (Bessho et al., 2016). The raw digital counts for each band, along with the calibration information, are published as L1b Himawari Standard Data (HSD) files.
Table 1Description of Himawari-8 Advanced Himawari Imager bands and their associated purposes (Bessho et al., 2016; Zhang et al., 2018; Robbins et al., 2022).
Two Himawari aerosol products are considered in this study. The Japan Aerospace Exploration Agency (JAXA) produces the level-2 (L2) Aerosol Retrieval Product (ARP) for AHI, which provides aerosol optical thickness (AOT), AOT uncertainty and the Ångström exponent on a regular 0.05° latitude–longitude grid every 10 min (Yoshida et al., 2018). The ORAC algorithm is applied to AHI to retrieve AOT and effective radius at the native resolution of AHI (2 km × 2 km at nadir). The calibration outlined in block header 5 of the HSD files is used to extract the radiances.
2.3 MODIS
MODIS is a passive instrument on board NASA's Terra and Aqua satellites. The satellites operate in sun-synchronous LEO with the constellation providing rapid return-to-target times, allowing for moderate spatial (0.25–1 km) and daily temporal coverage. The sun-synchronous orbit means that areas are viewed at approximately the same local solar time by each satellite; this is late morning for Terra and mid-afternoon for Aqua.
In this study, AOT values from the Collection 6.1 Deep Blue (DB) (Sayer et al., 2019) and MAIAC (Lyapustin et al., 2018) algorithms are employed. The DB product (MOD04_L2 for Terra and MYD_L2 for Aqua) is provided at 10 km resolution for each MODIS granule, whereas the MAIAC product (MCD19A2) is provided at 1 km resolution, with data from each MODIS granule regridded to a sinusoidal grid.
2.4 Sentinel-3
The Sea and Land Surface Temperature Radiometer (SLSTR) is a dual-view passive instrument carried on board the Sentinel-3A and Sentinel-3B LEO satellites (Coppo et al., 2010) along with the Ocean and Land Colour Instrument (OLCI). For the period of this study, the L2 AOD product is not available, but the SYN product is available to compare with AERONET and other retrievals. This product only provides AOT data over land and is regridded to the OLCI native grid (North and Henkel, 2010; Henocq et al., 2018).
2.5 VIIRS
The Visible Infrared Imaging Radiometer Suite (VIIRS) on board NASA's Suomi National Polar-orbiting Partnership (SNPP) NOAA-20 and NOAA-21 satellites is a passive instrument that provides aerosol optical thickness data at 6 km spatial resolution for each VIIRS granule. Level-2 data are produced using the Deep Blue algorithm over land (Sayer et al., 2018; Hsu et al., 2019). For this study, the AERDB_L2_VIIRS_SNPP Collection 1.1 products available over the full validation period are used.
Two types of analysis were carried out as part of this study:
-
an analysis of the sensitivity to the assumed optical properties in retrieving AOTs from biomass burning plumes in AHI data
-
case studies comparing retrieved properties for relatively low AOT plumes over land as well as for an extreme plume on the coast of southeast Australia.
3.1 ORAC, optimal estimation and state vectors
Throughout this work, the ORAC algorithm is applied to AHI data to retrieve AOTs at 550 nm, effective radii and (where possible) heights for all pixels. ORAC is an optimal estimation algorithm that utilises the Bayes theorem to minimise a cost function whilst accounting for uncertainties in a priori information and satellite measurements (Rodgers, 2000). ORAC contains two approaches to retrieving properties: one for aerosol (Thomas et al., 2009) and one for cloud (Poulsen et al., 2012; McGarragh et al., 2018). The aerosol approach assumes that the aerosol plume is optically thin and well mixed in the atmosphere and that the surface reflectance makes a significant contribution to the top-of-atmosphere reflectance. Therefore, both the AOT and the surface reflectance are included in the retrieved variables (Thomas et al., 2009). In the case of high-AOT BB plumes, like those from the 2019–2020 bushfires, the aerosol is thick enough that the surface contributions are a sufficiently minor source of error to be held constant during the retrieval. The cloud approach uses an estimate of surface reflectance based on MODIS observations over land and the Cox–Munk algorithm over ocean (Cox and Munk, 1954; Sayer et al., 2010). This approach is used for high-AOT plumes, and the conventional aerosol approach would be the correct method for dealing with more conventional BB plumes. The novelty of using the cloud approach is that significantly higher values of optical thickness can be retrieved compared with the aerosol approach. The cloud approach uses two radiative transfer models that are considered separately but resolved simultaneously: the solar radiation component and the thermal radiation component. A full description of this technique can be found in Prata et al. (2022), McGarragh et al. (2018) and Poulsen et al. (2012). Similar to the methodology described in Prata et al. (2022), cloud fraction is ignored in the state vector, as all pixels are assumed to contain some level of aerosol. The cloud mask developed in Robbins et al. (2022) is used to remove cloud pixels that may be erroneously retrieved and may contaminate further analysis in case studies and height comparisons. In addition, a cost threshold is applied such that pixels which have not adequately fitted the observations are not included in the study.
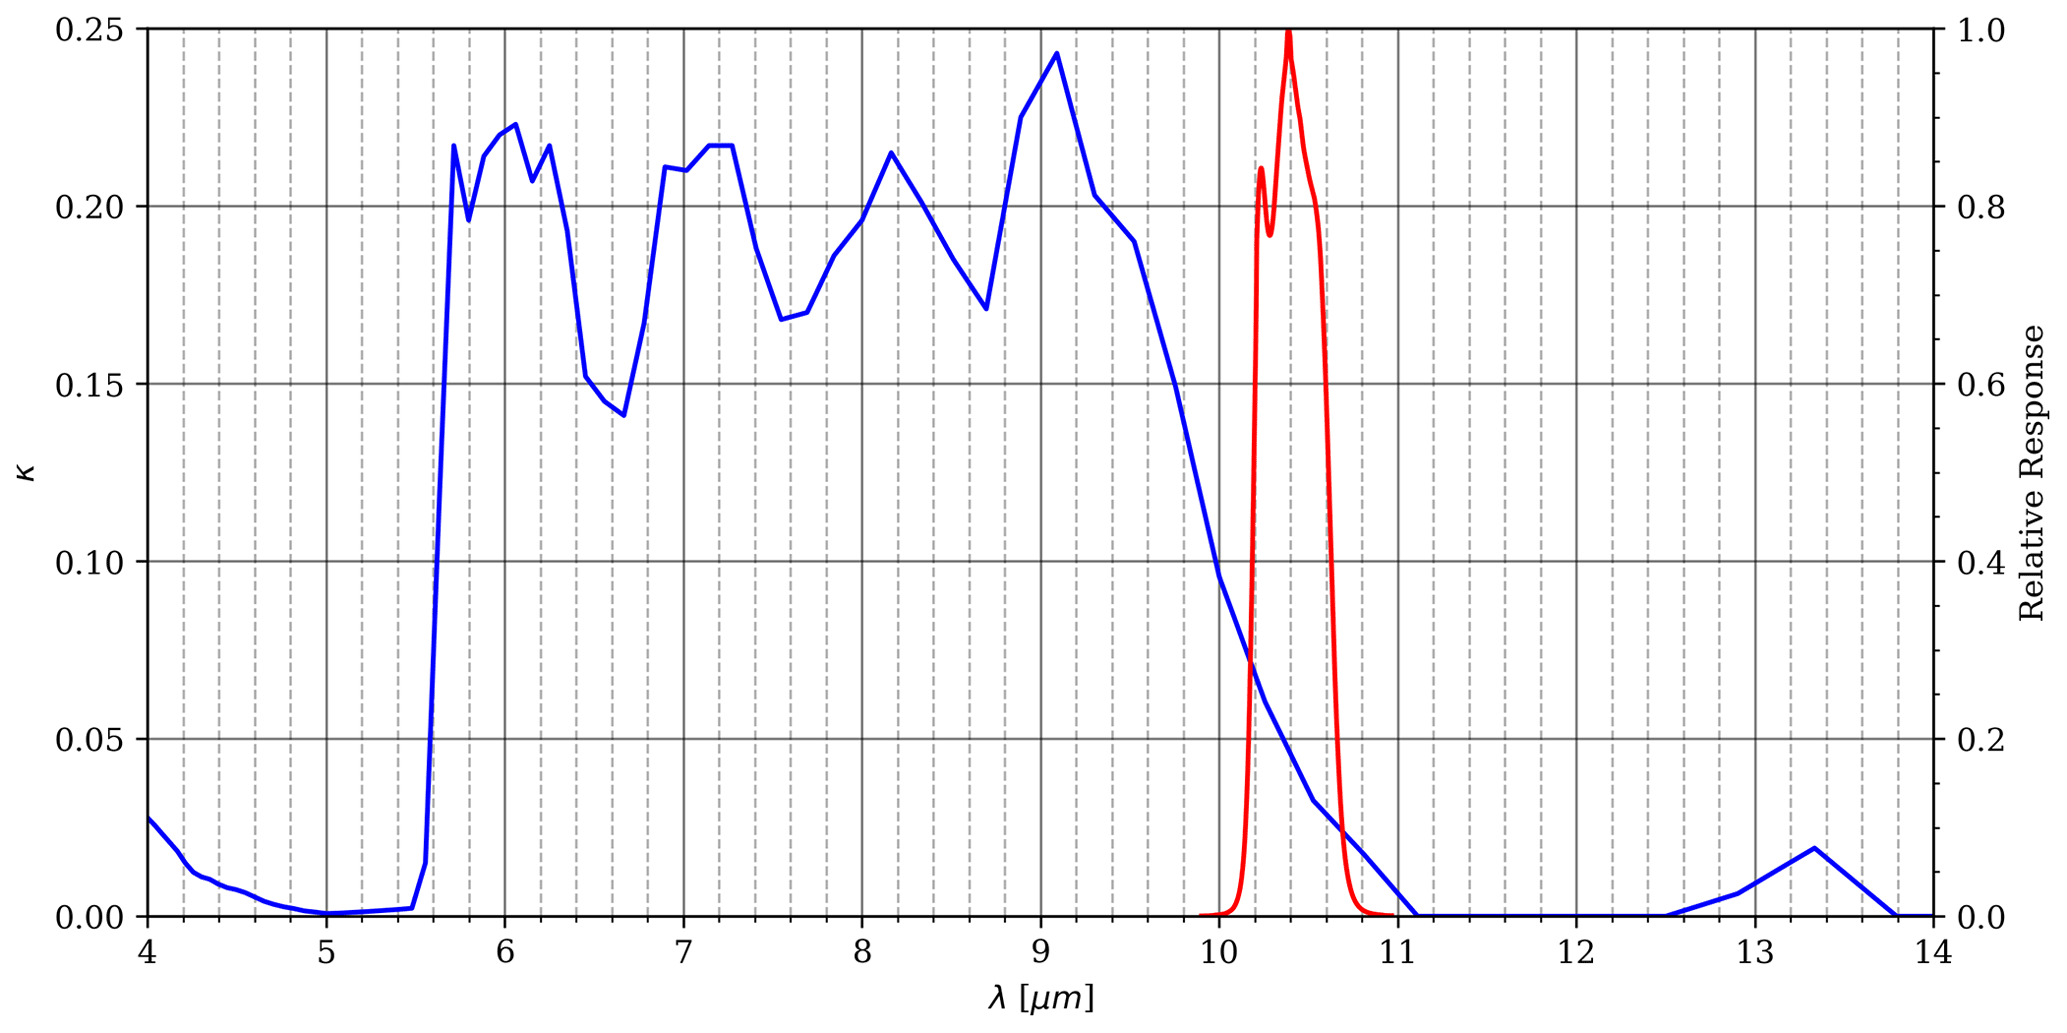
Figure 2The spectral response for band 13 in Himawari-8 AHI (red; https://www.data.jma.go.jp/mscweb/en/himawari89/space_segment/srf_201309/AHI-08_SpectralResponsivity.zip, last access: 21 March 2023) overlaid onto the imaginary component of the refractive index for biomass burning described in Sutherland and Khanna (1991) (blue).
The ORAC algorithm can evaluate any combination of visible–infrared observations in atmospheric windows (e.g. that lack substantial absorption). In this study, a shortwave (SW) channel retrieval scheme is chosen that uses AHI bands 1 and 3–5, with the 0.51 µm band omitted, as it does not match the corresponding band in MODIS (see Appendix A). The 2.3 µm band is not used because it conflicts with information regarding effective radius that is captured by the 1.6 µm band and is less sensitive to AOT from BB, as AOT values from BB drop off rapidly with wavelength. Smoke, including biomass burning plumes, is usually considered transparent in the longwave (LW), and the literature regarding the optical properties of biomass burning material in the LW is sparse. However, the characterisation of biomass burning by Sutherland and Khanna (1991) reveals that smoke has weak absorption in the AHI 10.4 µm band (see Fig. 2), suggesting that it is possible to retrieve aerosol information from optically thick plumes.
Throughout this study, it is assumed that the smoke particles are spherical. The review of Tumbarumba AERONET data from December 2019 by Li et al. (2021b) indicates that fine-mode AOT dominates, with a BB median radius of 0.14–0.25 µm. Therefore, all ORAC retrievals use values of 0.195 ± 0.055 µm for the first guess and a priori of effective radius.
3.2 Development and utilisation of look-up tables
The ORAC algorithm relies on offline parameterisation of the multiple scattering properties of a cloud or aerosol layer. This information is stored in look-up tables (LUTs), which are used in the forward model to describe the macro- and micro-physical properties of a cloud or aerosol layer, such as biomass burning plumes. These LUTs are generated using the DIscrete Ordinates Radiative Transfer (DISORT) code (Stamnes et al., 1988). A full description of this generation and the limitations of this method can be found in McGarragh et al. (2018). For this study, three new LUTs have been developed for AHI: the mean biomass, increased biomass and decreased biomass LUTs. The SW optical properties are derived using data from the Tumbarumba AERONET site during 2019, with the mean values for refractive index (RI) used for mean biomass, the mean RI plus 1 SD for increased biomass and the mean RI minus 1 SD for decreased biomass. It should be noted that although all these LUTs are derived from within the bounds of measurement uncertainty, the decreased biomass and increased biomass development is an oversimplification and assumes that changes in optical properties have no influence on other properties of the aerosol, which is not true. Nakajima–King plots (Nakajima and King, 1990) for these LUTs (see Fig. 3) indicate that for the effective radii that are observed during the 2019–2020 bushfire period, there may be a relatively flat cost surface that leads to a wide range of solutions within the bounds of instrument and model error, leading to relatively high uncertainties at high AOT values. The thermal infrared (TIR) response is derived from properties described in Sutherland and Khanna (1991). The three versions of the LUTs are used to investigate how sensitive single-view aerosol retrievals of high-AOT biomass burning events are to the refractive index.
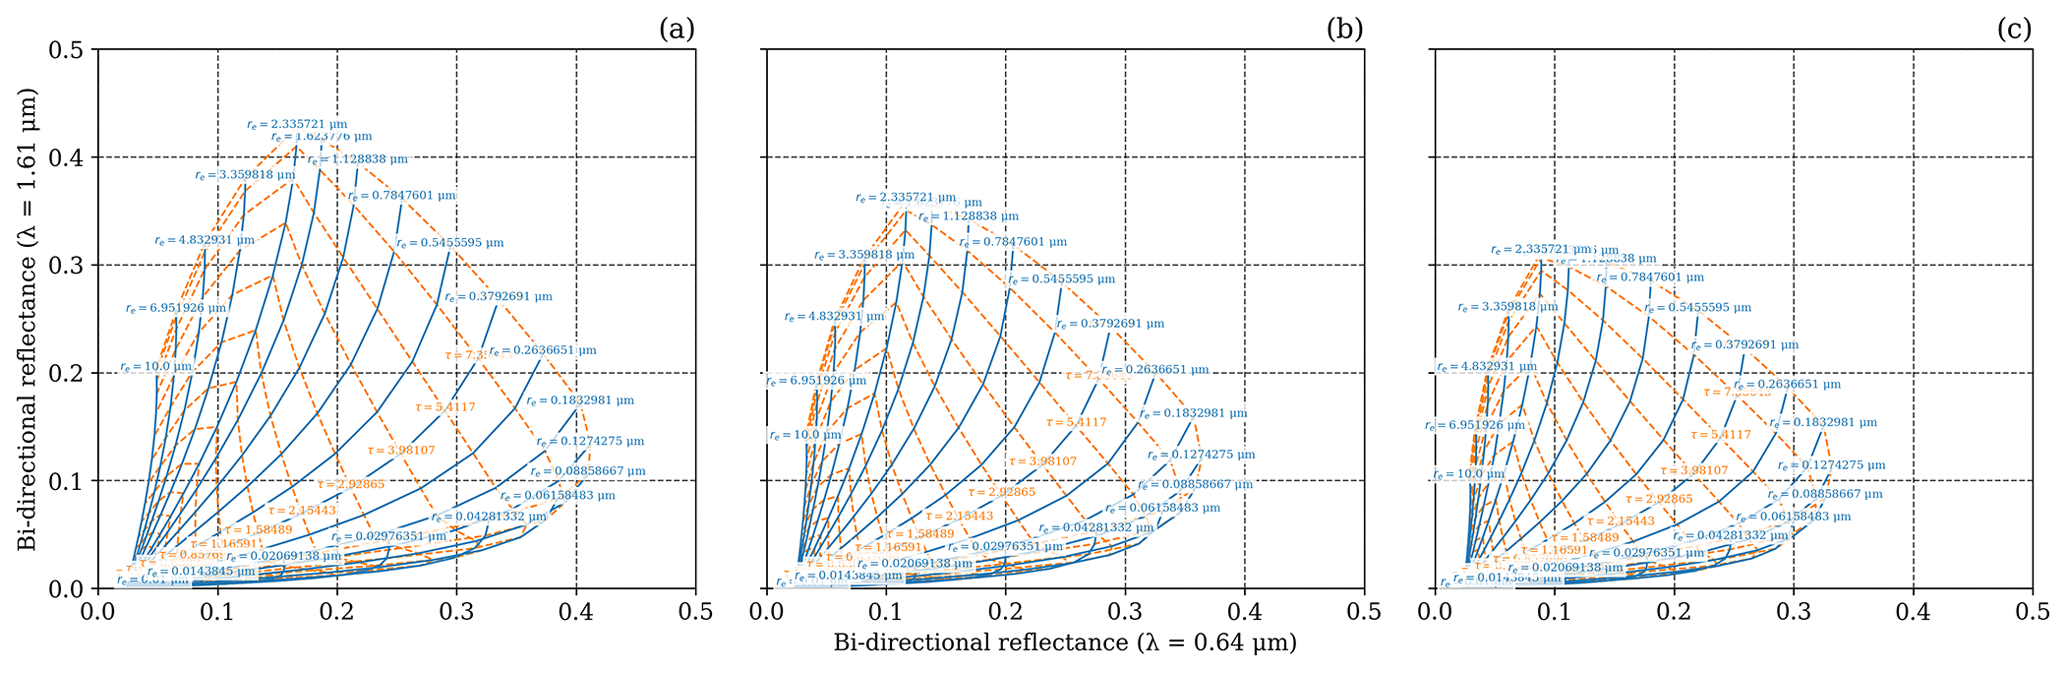
Figure 3Nakajima–King plots for the (a) decreased biomass, (b) mean biomass and (c) increased biomass LUTs at a solar zenith angle of 20°, a satellite zenith angle of 40° and a relative azimuth angle of 54°. These values are chosen as they are approximately the viewing angle of AHI to the Tumbarumba site with a solar zenith angle at approximately mid-day during the study period. The optical depth (orange) and effective radius (blue) are plotted for AHI band 3 (0.64 µm) on the x axis and for AHI band 5 (1.61 µm) on the y axis.
3.3 Collocation methodology
For the sensitivity study, AERONET data between 1 December 2019 at 00:00 UTC (inclusive) and 3 January 2020 at 00:00 UTC (exclusive) have been collocated with ORAC retrievals, JAXA ARP, MODIS Deep Blue, MODIS MAIAC and Sentinel-3 SYN data. Beyond January 2020, AERONET data at Tumbarumba may have become contaminated with ash (possibly in the collimator and on the lens; Ian Lau, personal communication, 25 November 2021) and other particulates after large fires around this site (González et al., 2020). The period chosen overlaps with the time identified by Li et al. (2021b) at which there were smoke plumes over the Tumbarumba site.
AERONET data are provided between 440 and 1640 nm, but shorter wavelengths tend to become saturated at lower values of optical depth than bands at longer wavelengths (Giles et al., 2019). Eck et al. (2019) demonstrated that during extreme BB events, higher values of AOT are retained for the 675 nm band, and extrapolation of AOT at 550 nm from these values enables high-AOT events to be studied with AERONET data. Therefore, to ensure that all values of AOT are compared at the same wavelength and to reduce the likelihood that data are missed due to saturation of the channel under extreme smoke plumes, the AOT at 675 nm has been extrapolated to 550 nm using the equation
where τλ is the AOT at some wavelength, λ, is the AOT at some reference wavelength, λ0, and α is the Ångström exponent for that range.
To ensure the best match in time between all products, the AERONET data have been averaged in 10 min segments to match the temporal resolution of AHI. The AERONET data have been binned from the start of an AHI scene time, e.g. 00:00 UTC, to the approximate end of the scene time, e.g. 00:10 UTC. This introduces some temporal error to the AERONET data, as instantaneous AOTs may be significantly higher or lower than the derived mean. Given the relatively short period over which this downsampling occurs, it is not expected that there will be significant jumps in AOT, and the standard deviations of the temporally downsampled bins are retained within this analysis.
As the JAXA ARP has a spatial resolution of approximately 5 km, whilst ORAC retrieves values at 2 km resolution (at nadir), two datasets are presented for ORAC retrievals. The first is derived from the collocated pixel that corresponds to the Tumbarumba site, which gives the best match for comparing against AERONET data and is referred to as the “pixel-wise comparison”. The second set is for a 3 × 3 pixel region around the site such that the retrieved values are at approximately 6 km spatial resolution, and is referred to as “spatially downsampled”. This gives a more suitable comparison with JAXA ARP but at the expense of accuracy when comparing with AERONET. JAXA ARP data are taken from the pixel collocated with Tumbarumba. The AOT at 500 nm is extrapolated to 550 nm by using the Ångström exponent provided for each ARP pixel using Eq. (1).
Several AOT products from polar orbiters are compared in this study. The Deep Blue and MAIAC products from MODIS are included when a MODIS granule is coincident with the Tumbarumba site. As the MAIAC product is provided at 1 km resolution, a 5 × 5 pixel mean about the Tumbarumba site is calculated, with the population mean and standard deviation retained for analysis. Similarly, the Sentinel-3 SYN product is included where available. As the product is provided on the OLCI grid at 300 m resolution, a 17 × 17 pixel grid about the Tumbarumba site is calculated when a Sentinel-3 overpass is coincident. VIIRS Deep Blue products, at 6 km spatial resolution, are also included where coincident with the Tumbarumba site.
It should be noted that the comparison makes no assumption regarding the heights of the plumes, which have not been parallax-corrected. This will introduce some unquantified error into the study. The heights of extreme BB plumes in this region are generally < 3 km with AHI viewing zenith angles of approximately 40°. This suggests the plumes are shifted by < 2.5 km due to parallax, which is within the spatial window of the downsampled AHI data. In addition, for all downsampled products, if there is a failed retrieval within the downsampled region, i.e. a pixel is masked such that only the fill value is available, that whole region is flagged as a failed retrieval to ensure that the comparison between the high-resolution and lower-resolution products is as consistent as possible. To evaluate the skill of flagging an aerosol event, several metrics are presented for this comparison including the true-positive rate (TPR), the false-positive rate (FPR) and the Kuiper skill score (KSS). The KSS is calculated by
where a is the number of true positives, b is the number of false positives, c is the number of false negatives and d is the number of true negatives (Hanssen and Kuipers, 1965).
For the case studies presented, retrievals from ORAC using the mean biomass LUT are compared with the JAXA ARP, MODIS DB and MODIS MAIAC. The AOT data from each product are shown without any downsampling and with only pixel-level quality control measures applied. For the ORAC product, this is the pixel-wise quality control, whilst for the other products, only failed retrievals are not shown. For all products, the minimum AOT is set as 0.2 to ensure that only significantly high values of AOT are shown, as this study is focused on the analysis of thick plumes.
To ensure temporal matching, the AHI products that include the MODIS granule data are compared with each other; i.e. the MODIS granule is within 10 min of the start of the corresponding AHI scene. The AOT data for each product are plotted over true-colour RGBs generated from AHI 5 km regridded radiances, which is from the matching AHI time stamp. Within each plotted region, a 2° × 2° area is highlighted and the distribution of AOT for each product is shown in violin plots. The region is chosen to focus on the distribution of high-AOT pixels and ignore erroneously retrieved cloud or background AOT, which is not the focus of this study.
3.4 Quality control for retrievals
To maximise the number of available pixels, only failed retrievals from the JAXA ARP, MODIS, VIIRS and Sentinel-3 products are omitted, and quality control flags are ignored to ensure that high-AOT pixels are included. This is done to test the accuracy and skill of the retrieval products at higher values of AOT than may be considered acceptable for operational purposes.
For ORAC retrievals, all pixels used in the collocation are included unless they are declared as cloud by the cloud mask described in Robbins et al. (2022) or the cost is greater than 5. The use of a cost threshold is important, as cost is a measure of how well the retrieval describes the aerosol type in the pixel. High cost suggests that the retrieved state resulted in a poor fit between the forward model and the measurements; i.e. the pixel does not correspond to the aerosol optical properties described in the LUT or may be misclassified cloud, clear air or some other aerosol species. Applying this mask ensures a more consistent comparison between the operational retrieval products and the ORAC retrievals. The cloud mask developed in Robbins et al. (2022) was specifically developed to improve the differentiation between clouds and optically thick aerosol plumes but most likely leads to some cloud contamination in AHI retrievals, which can be seen in case studies. This is considered acceptable for research purposes, where individual case studies can be checked and AERONET data can help to indicate whether cloud is present in collocated pixels; depending on the application, a conservative cloud mask could be used.
4.1 Sensitivity analysis
For the study period, between 00:00 UTC on 1 December 2019 (inclusive) and 00:00 UTC on 3 January 2020 (exclusive), there were 1115 successful ORAC retrievals with AERONET data available. Figure 4 shows the distribution of retrieved ORAC AOT values versus AERONET AOT values. The figure indicates that all three LUTs produce good agreement with AERONET when a linear fit is applied, with correlation values of 0.758, 0.741 and 0.755 for decreased biomass, mean biomass and increased biomass, respectively. The vast majority of the collocated data are clustered in the low-AOT region (AOT ≤ 2) with a similar distribution across all the LUTs, whereas the distribution of high AOT values (AOT > 2) is more widely spread. This suggests that under less extreme circumstances, i.e. AOT ≤ 2, the sensitivity of the ORAC retrieval to the assumed optical properties of the biomass plume is relatively small.
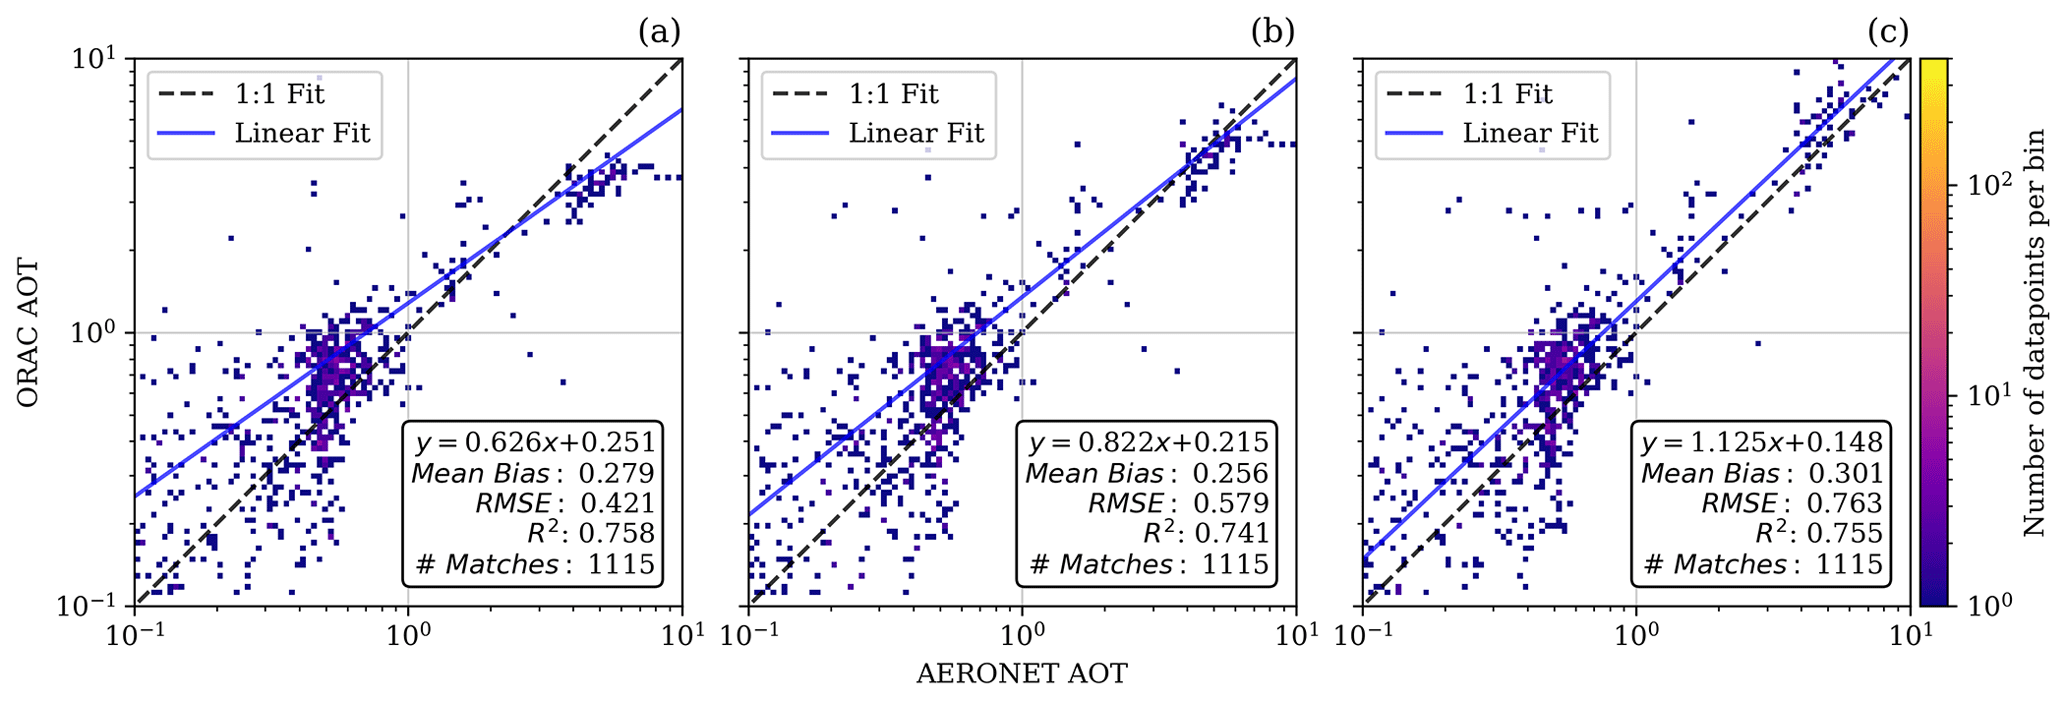
Figure 4Heat maps of the distribution of collocated ORAC AOT values versus AERONET AOT values at 550 nm for (a) decreased biomass, (b) mean biomass and (c) increased biomass LUTs, along with the linear fits (blue line), 1:1 fit (dashed black line) and associated statistics for each LUT.
However, for larger values of AOT (AOT > 2), the ORAC AOT values begin to diverge from AERONET for the decreased biomass and increased biomass LUTs. As can be seen in Fig. 4b, the mean bias for mean biomass is the smallest of the three LUTs. This suggests that under more extreme circumstances, such as the smoke plumes seen during the 2019–2020 Australian bushfires, the sensitivity of the retrieval to the assumed optical properties becomes much more important, which can lead to systematic underestimation or overestimation of AOT if the aerosol type is considered too absorbing (increased biomass) or less absorbing (decreased biomass).
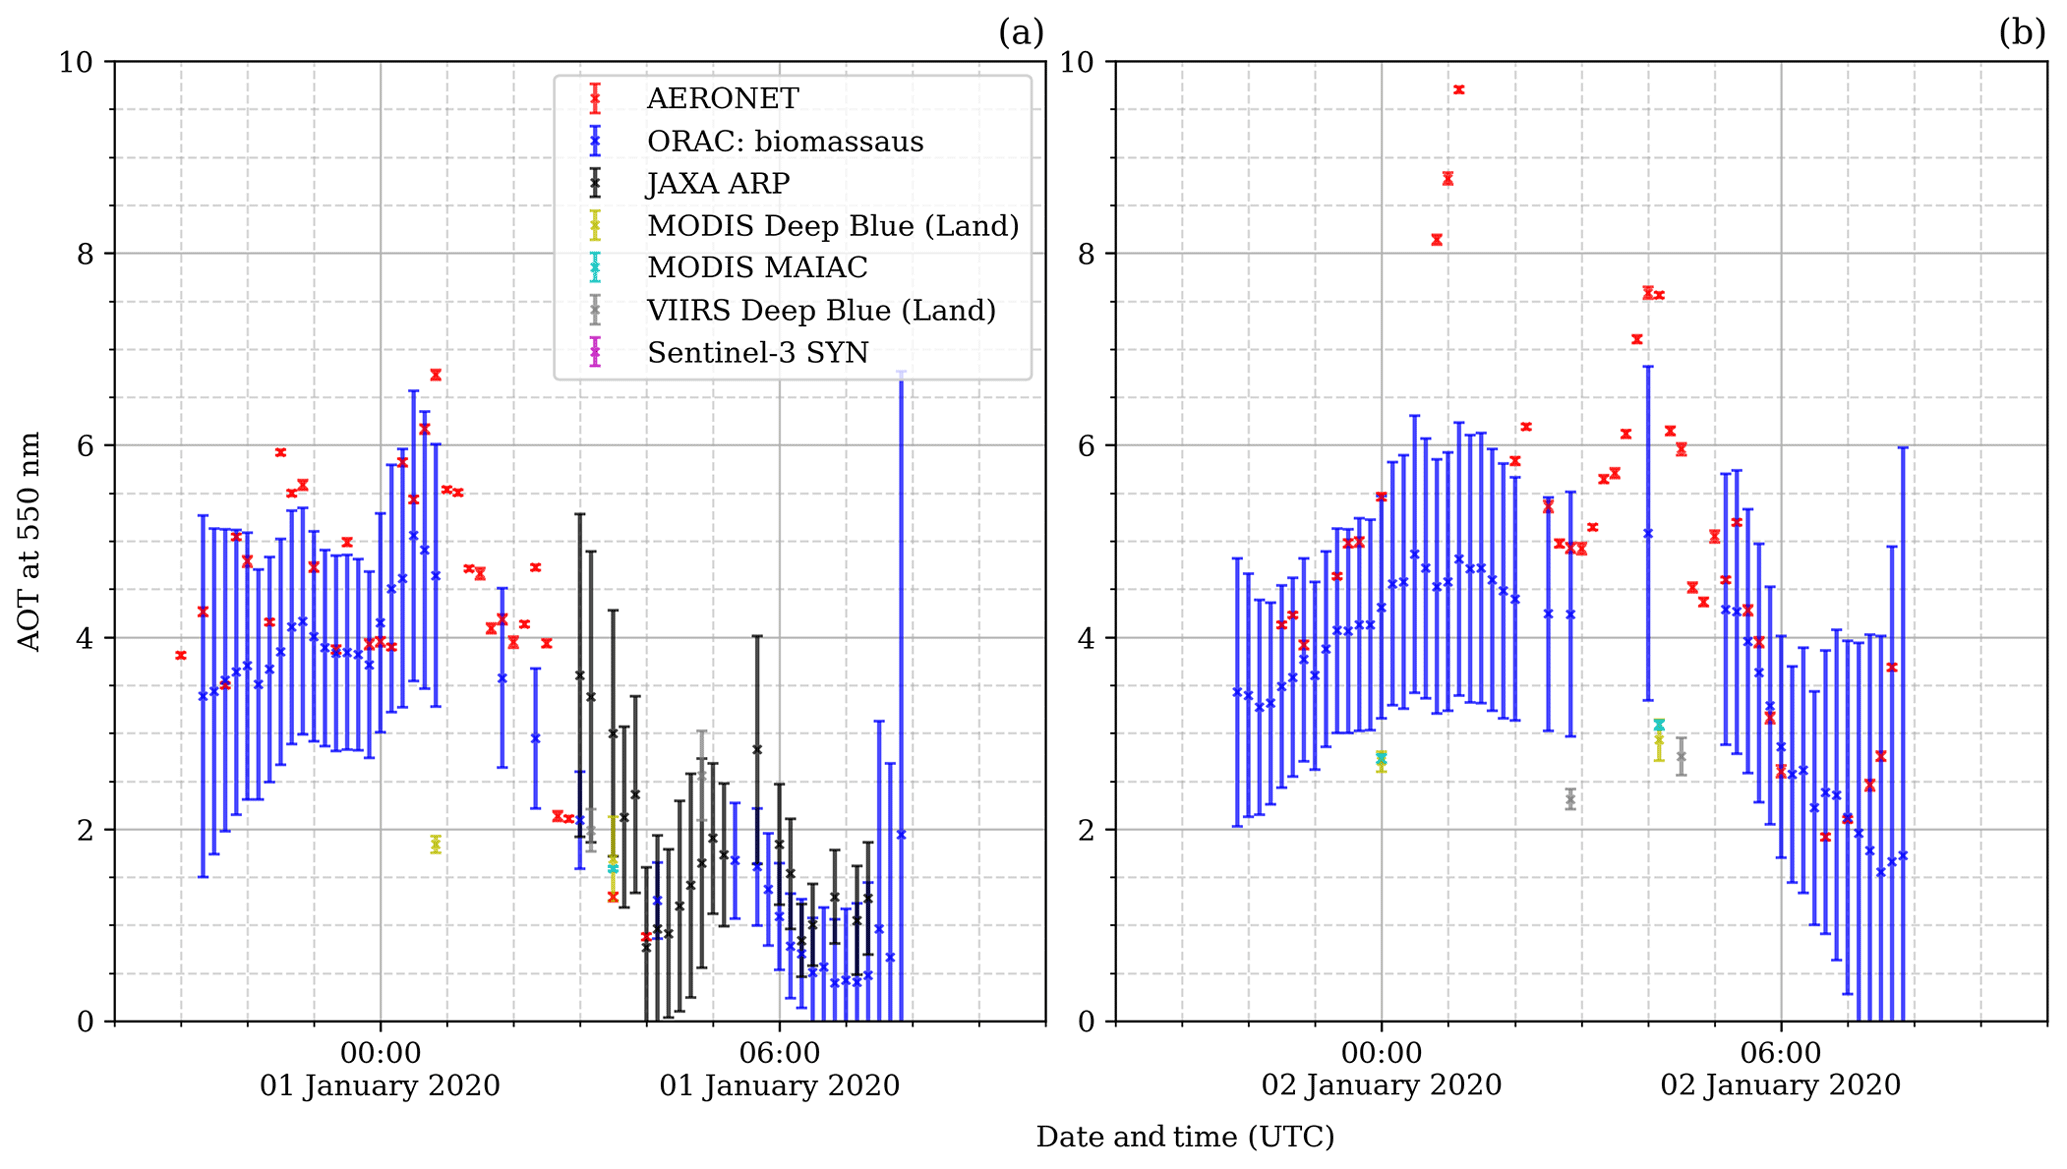
Figure 5Time series for (a) 31 December 2019–1 January 2020 and (b) 1–2 January 2020 of the retrieval products used in the sensitivity study during the peak values seen in the AERONET data. For the ORAC retrievals, only the mean biomass values are shown to prevent significant clutter in the figure. Note that there are no Sentinel-3 SYN data plotted, as there are no successful retrievals for this product in this time period.
Table 2Resulting statistics of collocations between the retrieval products and AERONET where both retrievals are successful for the whole study period. The number of collocations where both the retrieval product and AERONET are successful are shown in the first column. The second and third column show the maximum retrieved AOT value in the study period where both retrievals are successful for AERONET and the retrieval product, respectively. The fourth and fifth columns show the gradient and offset for the linear fit between the retrieval product and AERONET. The mean bias of the collocated data and the root mean square error (RMSE) are shown in the sixth and seventh column, respectively. The Pearson correlation coefficient is shown in the final column.
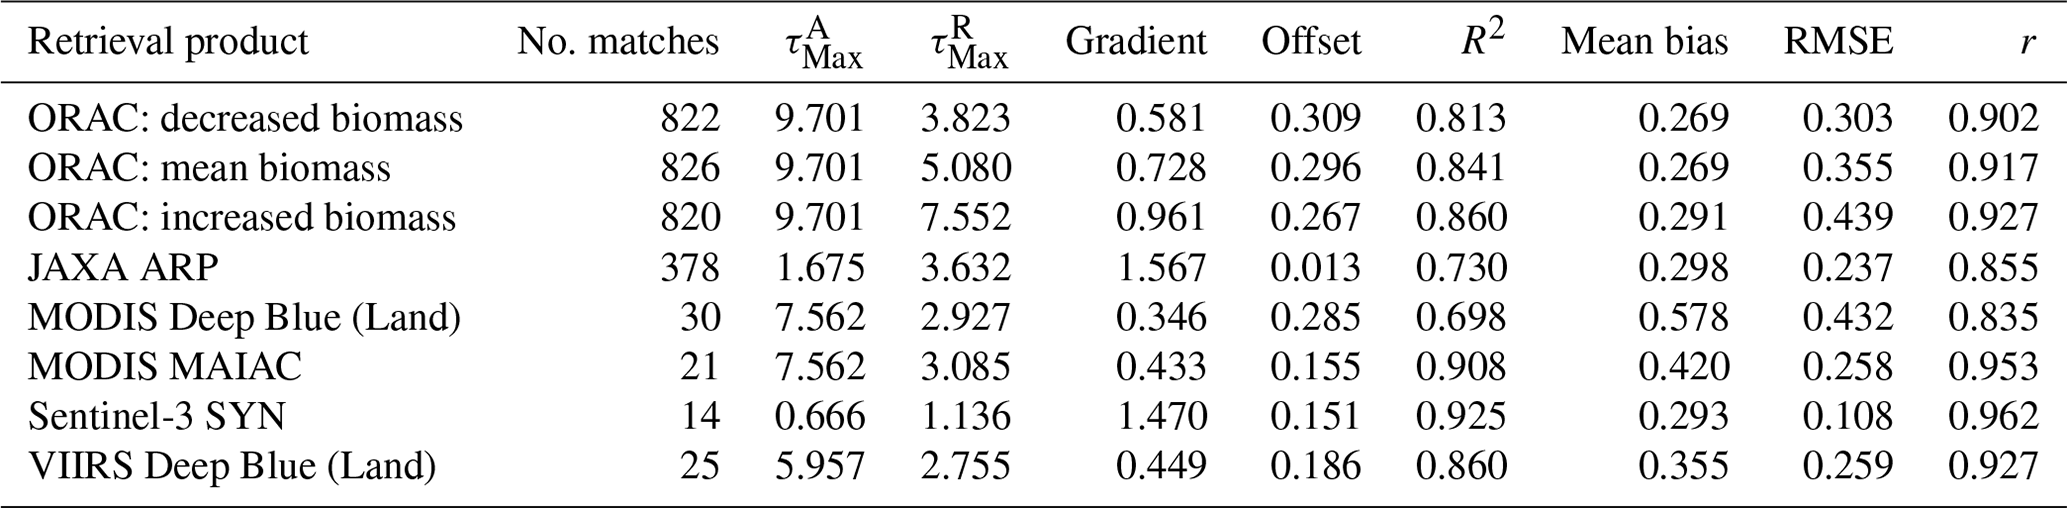
Table 3Comparison between satellite and AERONET retrievals showing the skill of each satellite product at flagging an aerosol event successfully. The truth label is set by AERONET; i.e. if AERONET provides an AOT value, the label is 1 (BB present), but if AERONET does not provide an AOT value, the label is 0 (masked as cloud or too optically thick to retrieve information). It should be noted that this may introduce some bias, where high AOT values in the retrieval products are classified as false positives. The first column provides the total number of pixels collocated between the satellite product and AERONET regardless of whether either retrieval is successful. The second column shows the number of matches, which is equivalent to the number of true positives (TPs) for the satellite product assuming AERONET is truth. The third column shows the true-positive rate (TPR) and the fourth column shows the false-positive rate (FPR). The fifth column shows the accuracy of the satellite product. The final column shows the Kuiper skill score (KSS) for the retrieval product (Hanssen and Kuipers, 1965).
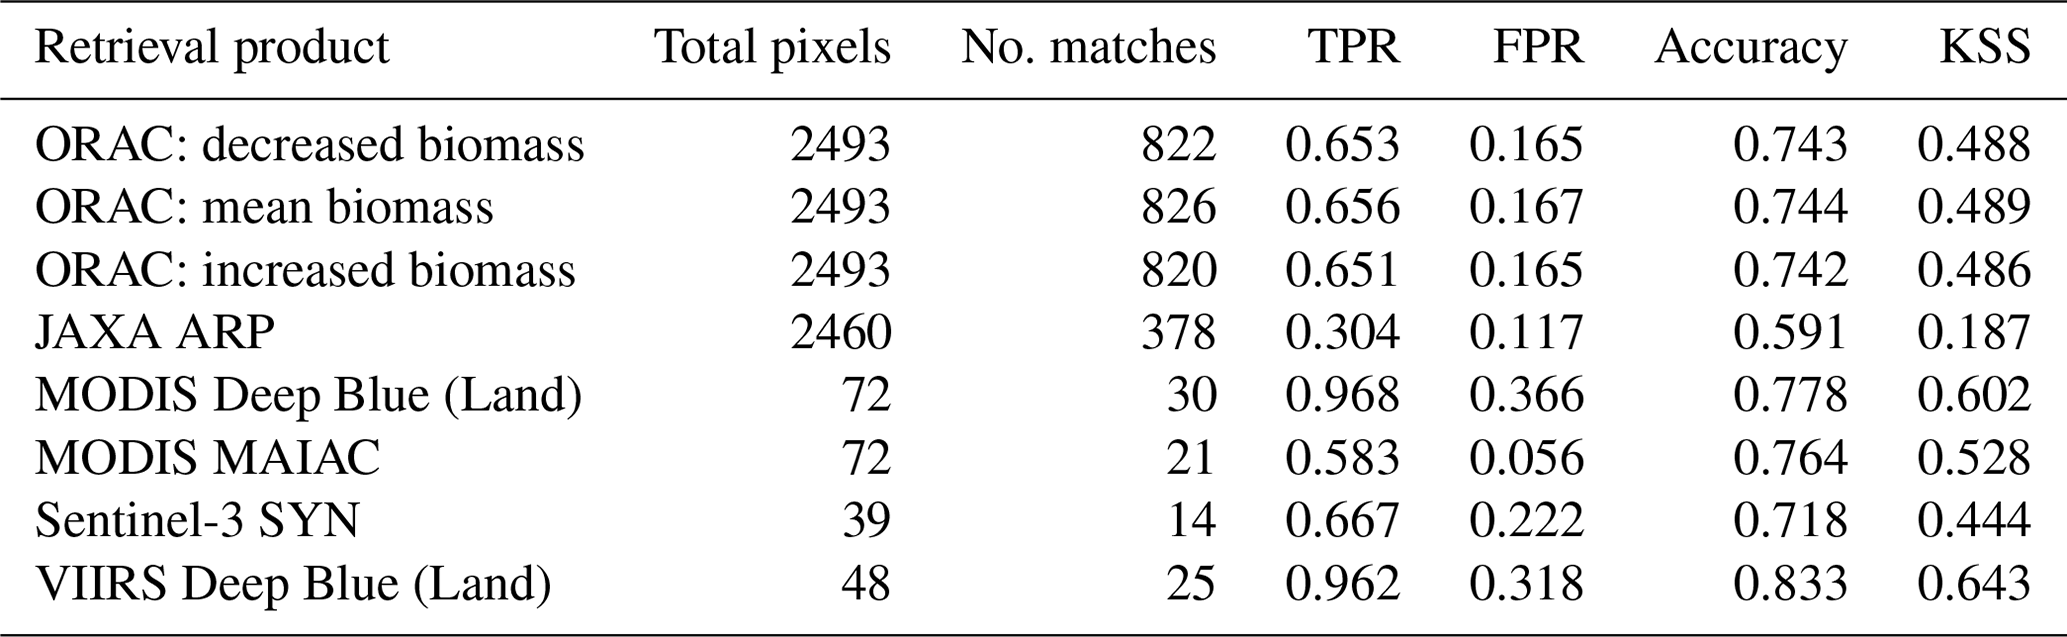
Figure 5 shows that the ORAC mean biomass retrieval compared to the JAXA ARP using the strict quality controls set out in Sect. 3.2 (with the exception of the cutoff for AOT < 0.2) provides improved temporal coverage. In addition, ORAC retrieves AOT values > 5. In this high-AOT case the JAXA ARP fails due to misclassifying the aerosol as cloud. This can also be seen over the whole study period, as shown in Table 3. ORAC successfully retrieves approximately 2 times as many pixels as the JAXA ARP. When compared with the LEO satellite products, the mean values of ORAC are generally closer to AERONET values, whilst providing significantly improved coverage, successfully retrieving approximately 28 times as many pixels as the most successful LEO product (MODIS Deep Blue) with smaller values of mean bias and similar values of RMSE (see Table 2). Figure 5 also demonstrates the impacts of viewing and solar geometry on the geostationary retrievals, where the high solar zenith angles towards the beginning and end of the day lead to higher uncertainties in the ORAC retrievals, which are a function of the changing signal-to-noise ratio.
The LEO products have lower uncertainties when compared with the ORAC retrievals. These low uncertainties are important to note, as the AOT values and associated uncertainties generally underestimate AERONET values. In addition, Fig. 5 shows the AERONET values at higher AOT are well outside the range of uncertainty for the LEO retrieval. This is likely due to two reasons. Firstly, as can be seen in Table 2, both MODIS products are capable of retrieving high-AOT plumes, with values of 7.562, where AERONET data are also available. In addition, values as high as 3 can be seen in Fig. 5. Table 3 shows the skill of each satellite product at flagging an aerosol event, with the truth value assigned by the presence of an AERONET retrieval. The relatively high accuracy of these products at flagging (0.778 and 0.764 for MODIS Deep Blue and MAIAC, respectively) is greater than the accuracy of the ORAC retrievals (0.743, 0.744 and 0.742 for decreased biomass, mean biomass and increased biomass, respectively). This indicates that cloud masking in these products is not a major issue. Instead, it would suggest that the parameterisation of the biomass burning plumes in the MODIS retrieval products is for a type that is not absorbing enough, leading to the small values for gradient seen in Table 2. This is consistent with the results of Shi et al. (2019), where the operational MODIS DB product was found to underestimate the AOT values for the 2015 Indonesian fires. Secondly, internal limits in the algorithms can lead to systematic underestimation of the retrieved AOT. In the case of MAIAC, the maximum value of AOT440 nm is set at 4 (Lyapustin and Wang, 2008). When coupled with the large values of α seen during biomass burning plumes, this leads to much smaller values of retrieved (2.927 and 3.085 for Deep Blue and MAIAC, respectively) when compared with AERONET. In the case of the Sentinel-3 SYN product, the low values of and suggest that the conservative cloud masking of the SYN algorithm prevents retrievals of extreme biomass burning plumes. The VIIRS DB product shows similar performance to the MODIS DB and MAIAC algorithms, with the same issue of systematic underestimation of AOT when compared with AERONET, suggesting the same mischaracterisation of the BB plumes is present in the VIIRS DB algorithm. It should be noted that the VIIRS DB product has the highest accuracy of all products when compared with AERONET (see Table 3) but still appears to suffer from the upper AOT limit problem.
The ORAC retrieval results indicate that the mean biomass LUT corresponds best to the biomass burning plumes throughout this study.
4.2 Case studies over Australia
Three case studies from the 2019–2020 bushfire season in Australia are selected to demonstrate the performance of satellite measurements of AOT during extreme biomass plume events. The three case studies show BB plumes of varying optical thickness (AOT > 2) over a range of surface types. Regions are selected from within the case study areas to highlight where the use of the BB LUT is appropriate and where MODIS DB and MAIAC products are also available.
4.2.1 Moderately thick AOT over vegetation
The first case study over Melbourne and the southeast coast of Australia from 13 January 2020 at 03:50 UTC shows a moderately optically thick (2 ≤ AOT ≤ 5) smoke plume (see Fig. 6). Overall, the cloud mask for the ORAC retrieval captures the optically thick regions of the smoke plume that the JAXA ARP misses (see Fig. 6c and d). In addition, the ORAC retrieval resulted in significantly higher values of AOT when compared with the MODIS products.
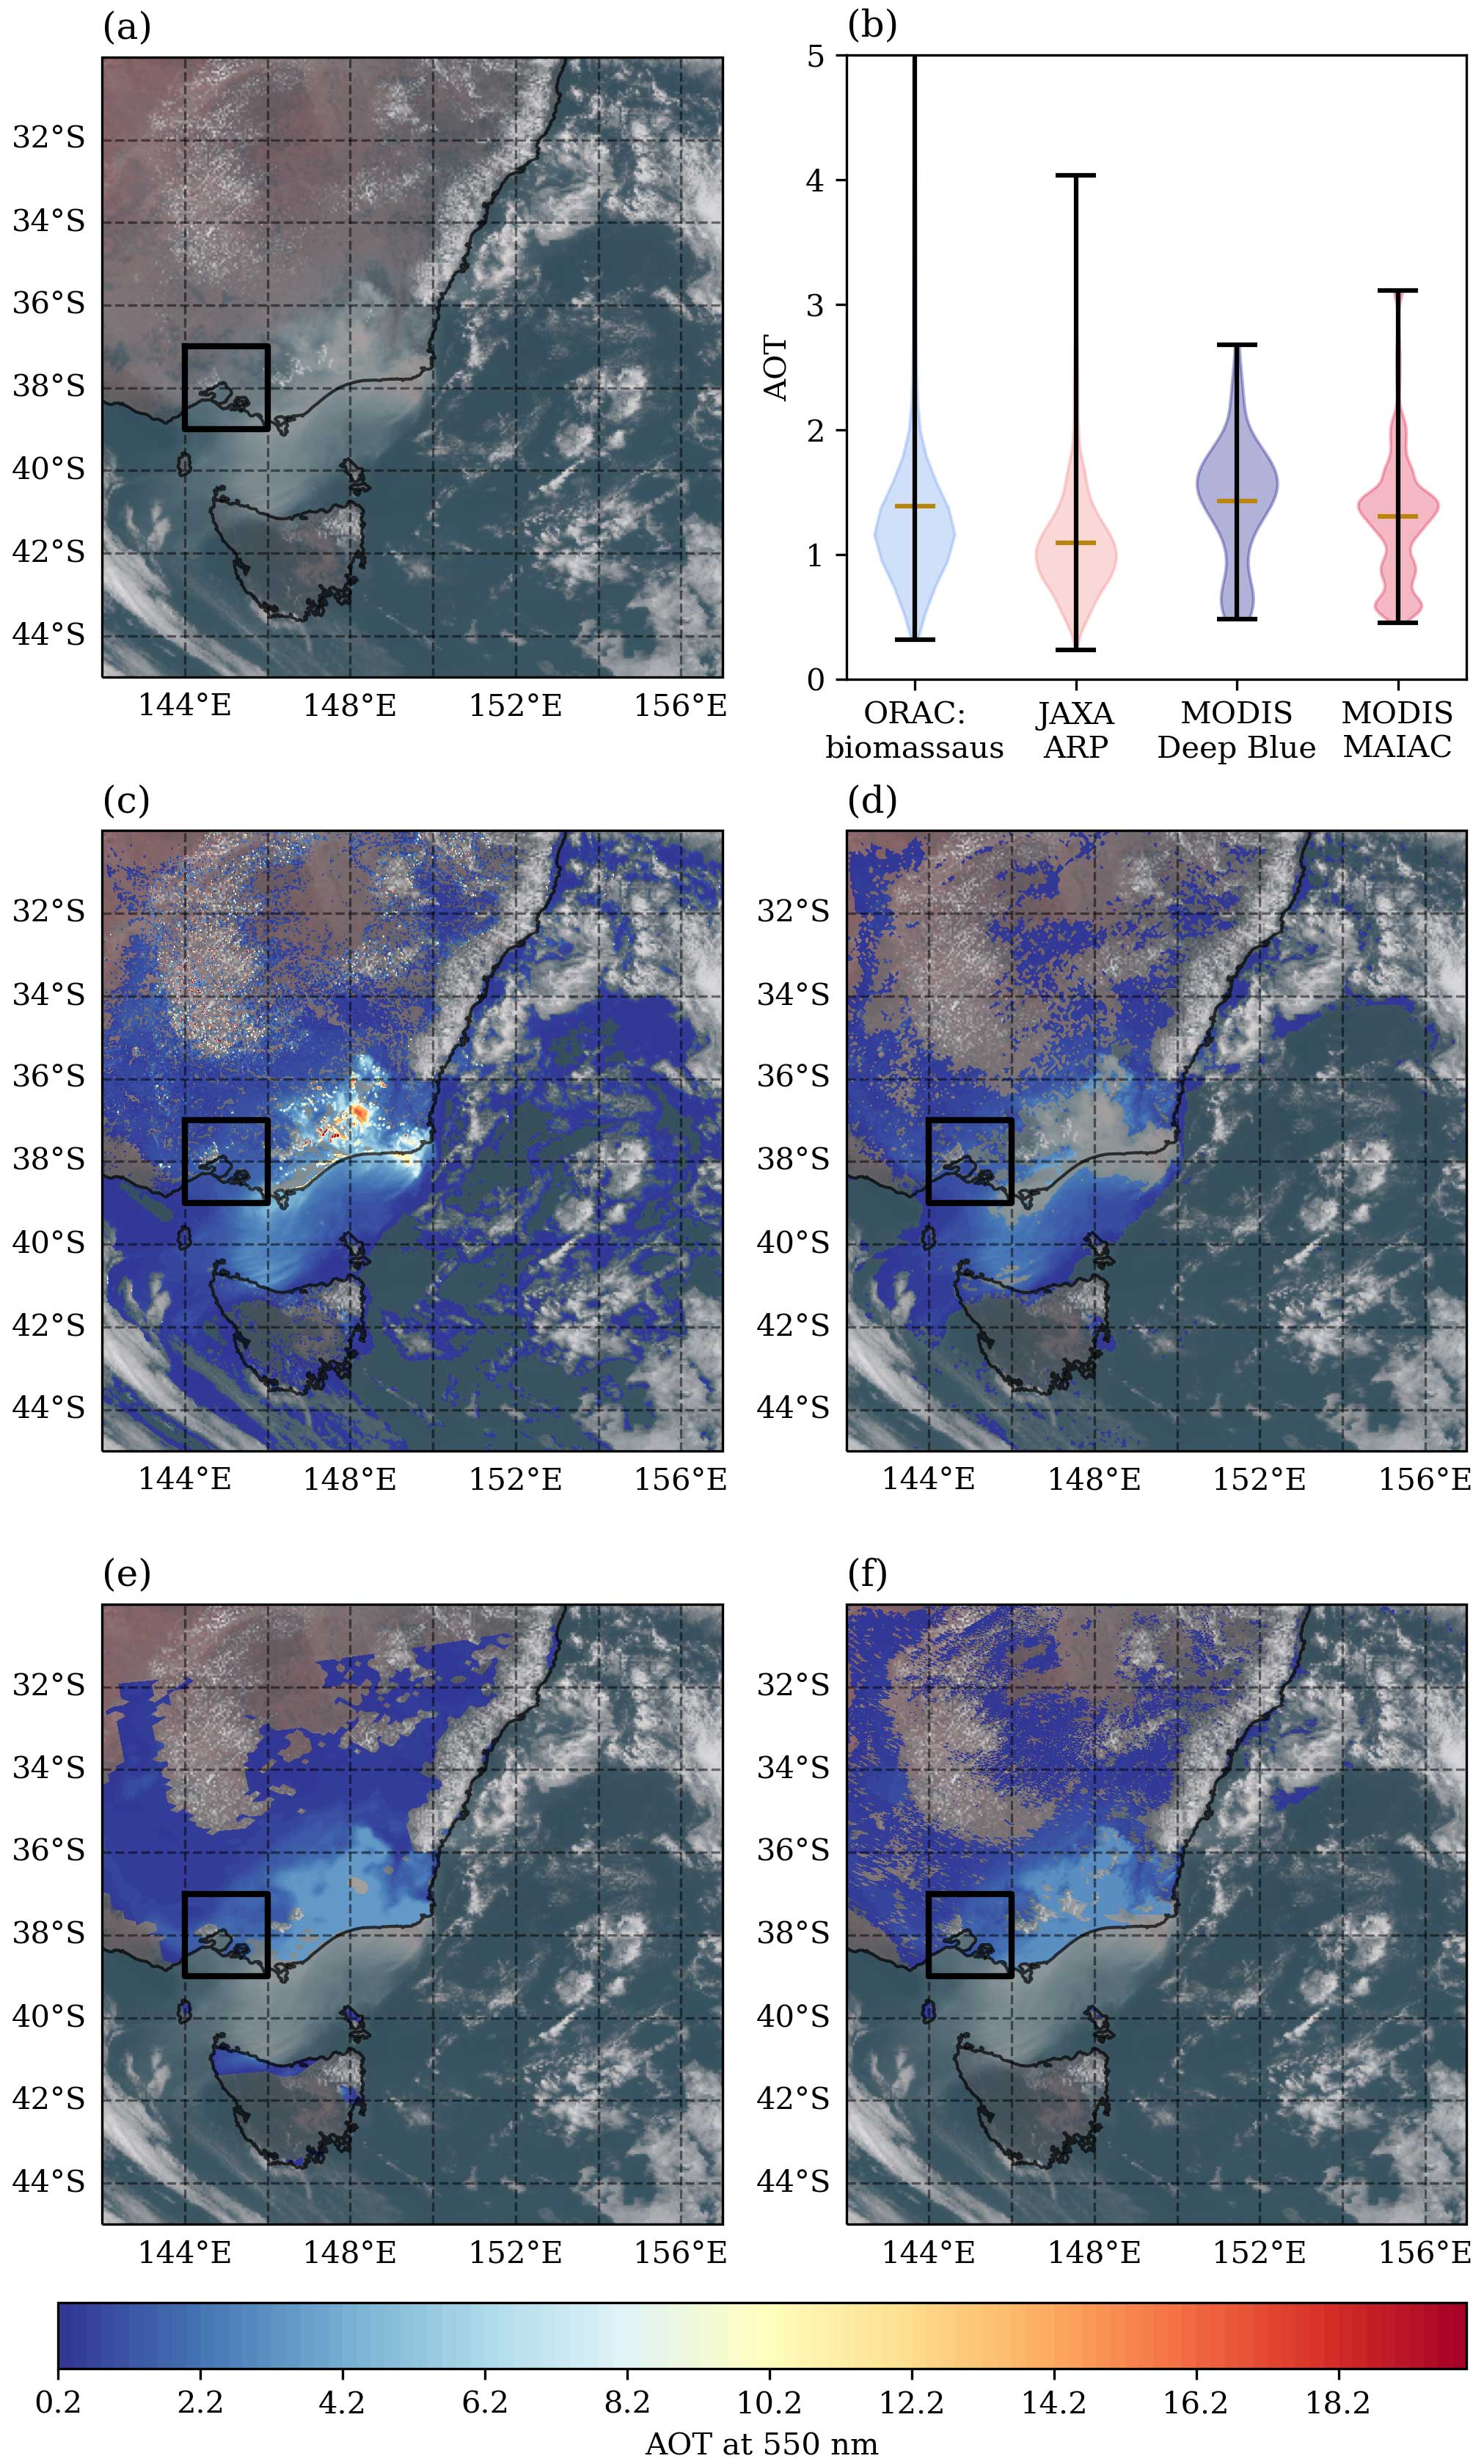
Figure 6Relatively low-AOT smoke over vegetation for 13 January 2020 at 03:50 UTC. True-colour RGB from AHI (a). Violin plots of the AOT values within the highlighted box (b) indicating the frequency of AOT values for (c) ORAC mean biomass, (d) JAXA ARP, (e) MODIS Deep Blue and (f) MODIS MAIAC AOT retrievals.
Within the section of the plume shown in the 2° × 2° box, Fig. 6b indicates that the less optically thick region over vegetation is retrieved with reasonable agreement between all four products, with mean values for AOT of around 1.5 for ORAC, DB and MAIAC, whilst the JAXA ARP gives a slightly lower value. The distribution of AOT values seen in Fig. 6b suggests that, under conditions that would normally be considered extreme smoke plumes by Zhuravleva et al. (2017) and Markowicz et al. (2016), all products perform similarly and would be suitable for use in further studies.
4.2.2 Moderately thick AOT over semi-arid land
In this case study, a moderately high-AOT smoke plume from the 2019–2020 bushfire season at 00:30 UTC on 20 December 2019 over the east of Australia is presented. Figure 7 shows that all of the satellite products retrieve significant portions of the biomass burning plume towards the centre of the scene. The distributions of the AOTs within the 2° × 2° box for the ORAC, Deep Blue and MAIAC products generally agree, with mean values between 2 and 3 (see Fig. 7b). However, for the JAXA ARP product shown in Fig. 7d, the most optically thick areas are not retrieved, whilst the AOT distribution (see Fig. 7b) is more widely spread compared with the other products. The peak values of this distribution are located around the edge of the more optically thick region of the plume. This, in combination with the large value for gradient in Table 2, suggests that the optical properties for biomass burning are set for a more absorbing aerosol type in JAXA ARP. This is likely to be the category-2 fine aerosol type described in Omar (2005) that is used in the JAXA ARP algorithm as described by Yoshida et al. (2018), which is not derived from data over Australia. In addition, the more optically thick plumes towards the bottom of this scene are not retrieved by the JAXA ARP, whilst the other products are capable of retrieving the AOT values. Inspection of the QA flag for the JAXA ARP indicates that the plume was correctly classified but retrievals failed. Figure 7b shows that ORAC and MODIS MAIAC have similar distributions, with two peaks above and below AOT values of 2, whilst the MODIS Deep Blue product has a single wide distribution peaking towards an AOT value of 3. The single peak is likely due to the lower spatial resolution of this product.
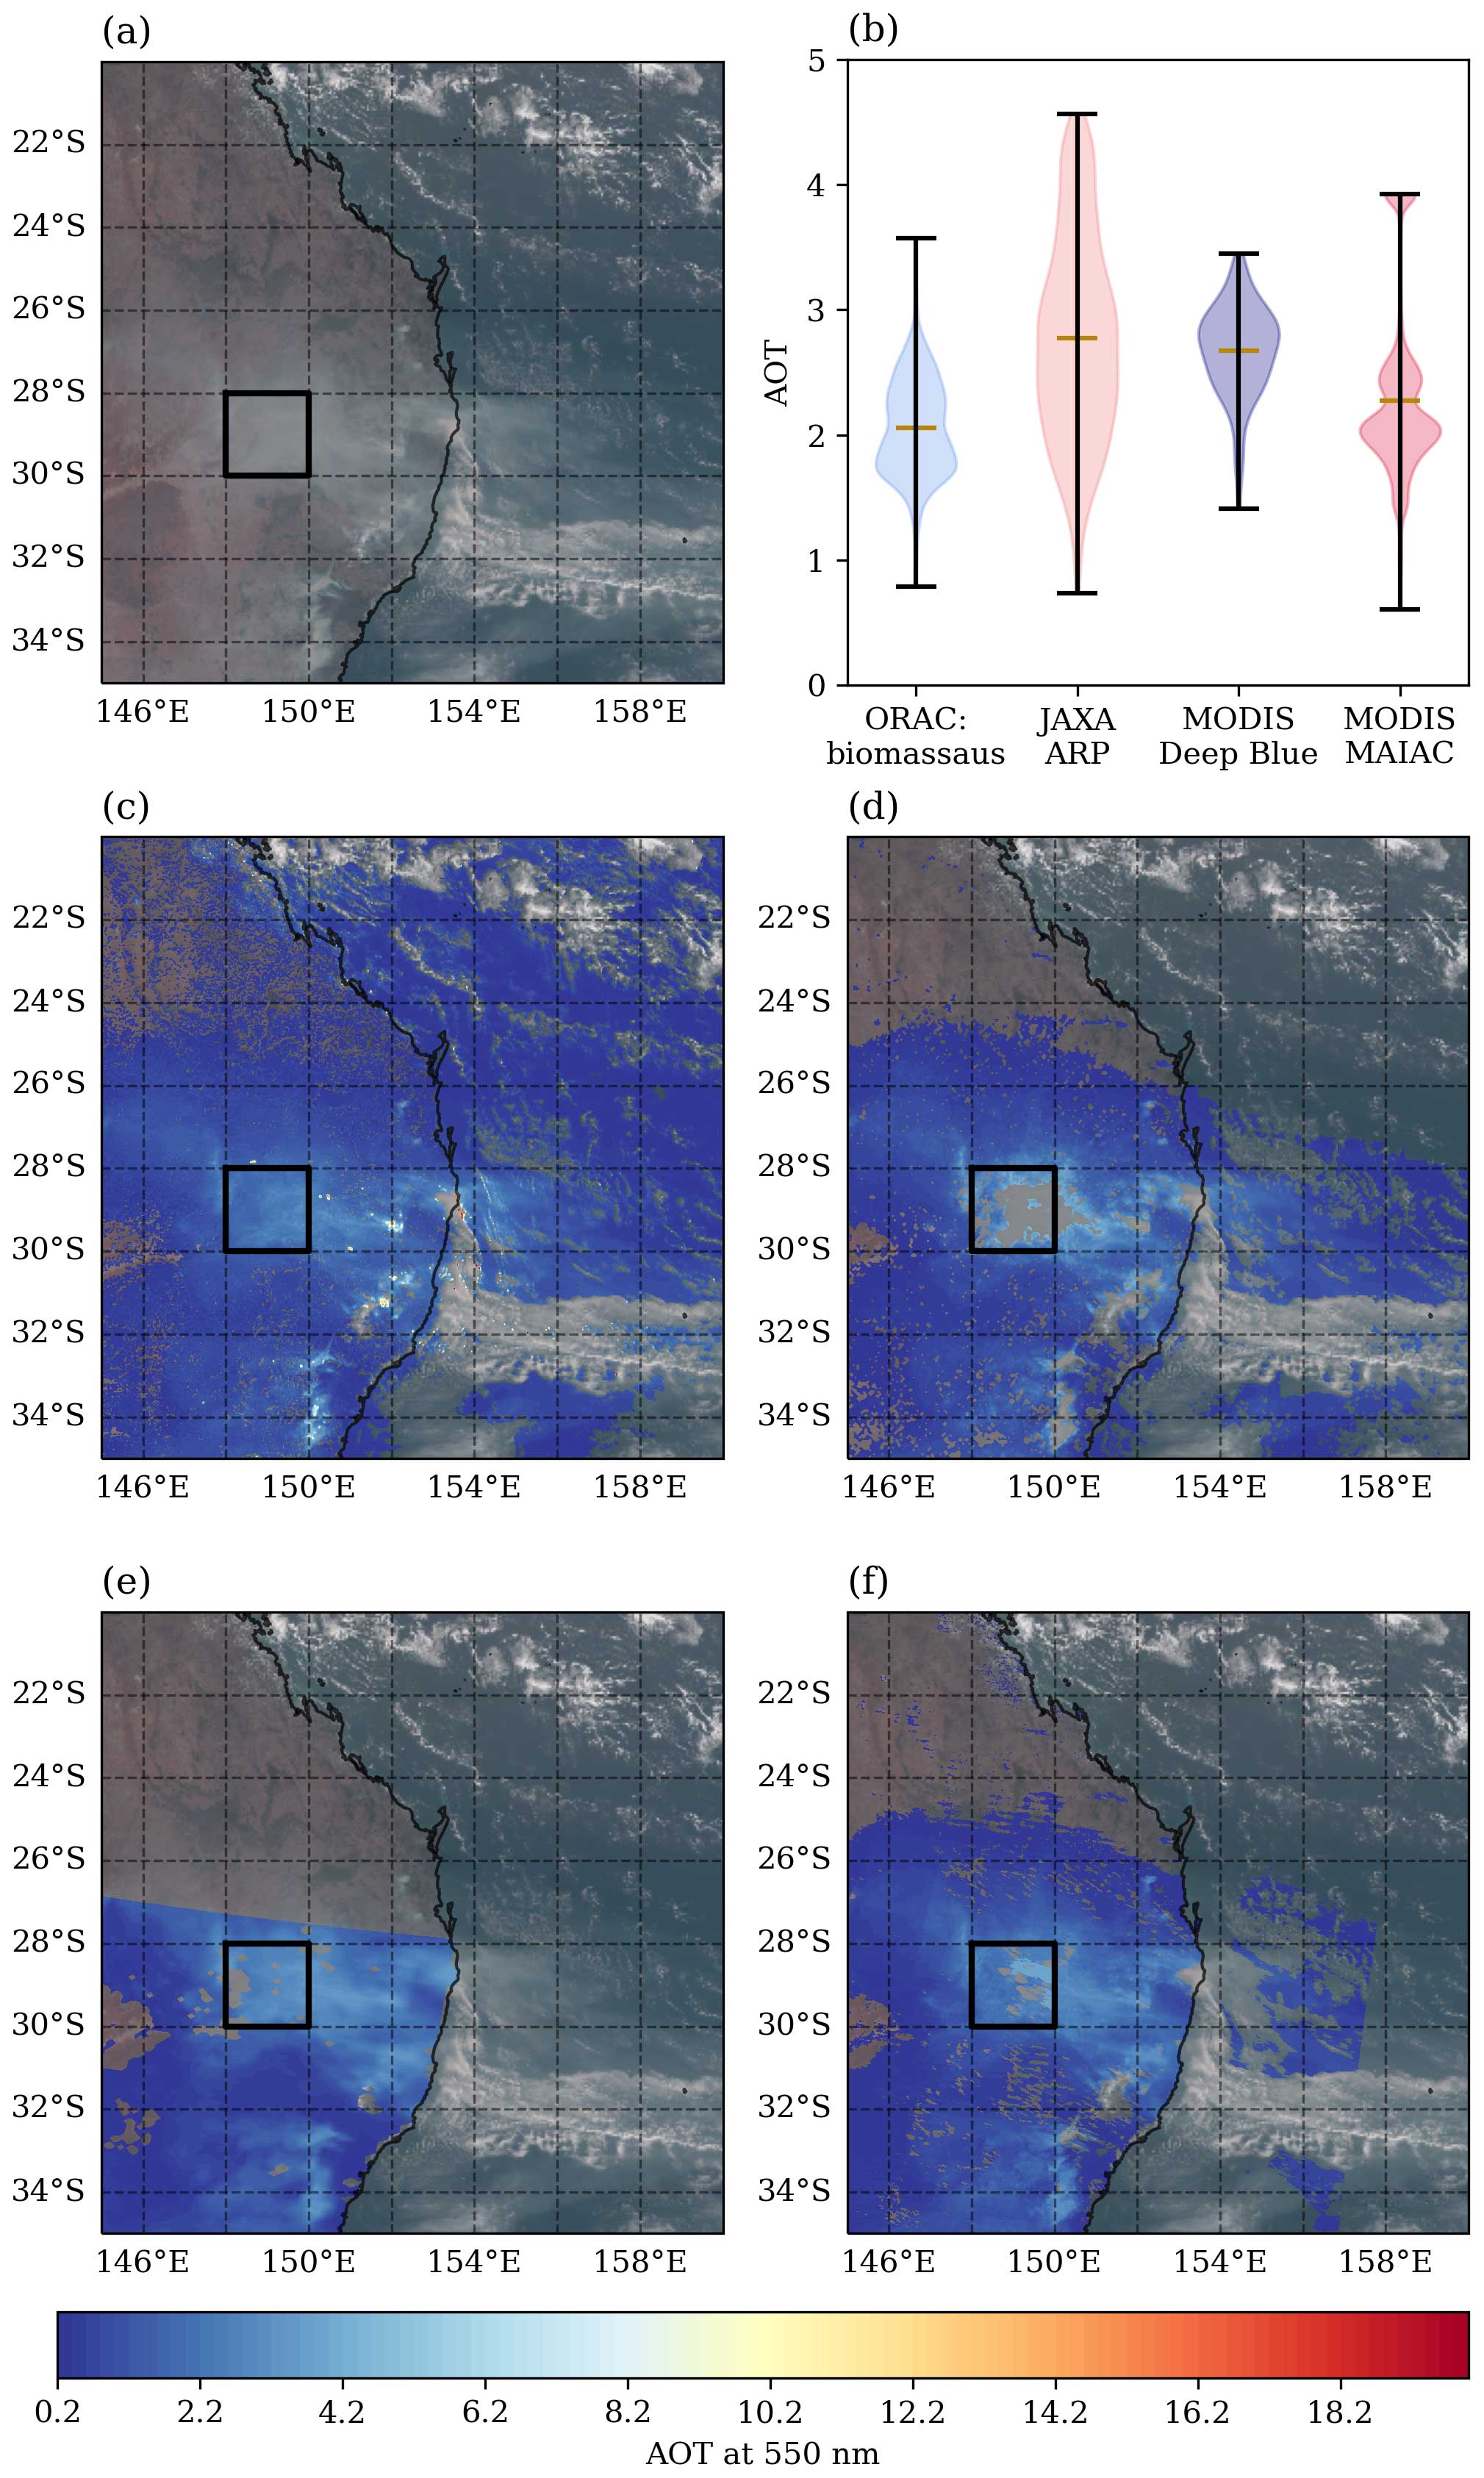
Figure 7Low-AOT smoke over semi-arid land for 20 December 2019 at 00:30 UTC. True-colour RGB from AHI (a). Violin plots of the AOT values within the highlighted box (b) indicating the frequency of AOT values for (c) ORAC mean biomass, (d) JAXA ARP, (e) MODIS Deep Blue and (f) MODIS MAIAC AOT retrievals.
4.2.3 Extreme AOT
The extreme biomass burning plume (AOT values ≫ 2) presented in Fig. 8 at 03:30 UTC on 1 January 2020 is taken during the peak of the 2019–2020 Australian bushfires. Figure 8a shows that the plume is extremely optically thick and covers a large area along the southeast coast, with the most optically thick regions of the plume to the southeast of the Great Dividing Range. Figure 8c shows that ORAC retrieves AOT values greater than 15, although with high uncertainty, and a mean value of 10, which are significantly higher values than those seen in events classified as extreme by previous studies where the highest values of AOT from satellite instruments were approximately 5 (van Donkelaar et al., 2011; Markowicz et al., 2016; Petrenko et al., 2017; Zhuravleva et al., 2017; Shi et al., 2019; Mukai et al., 2021).
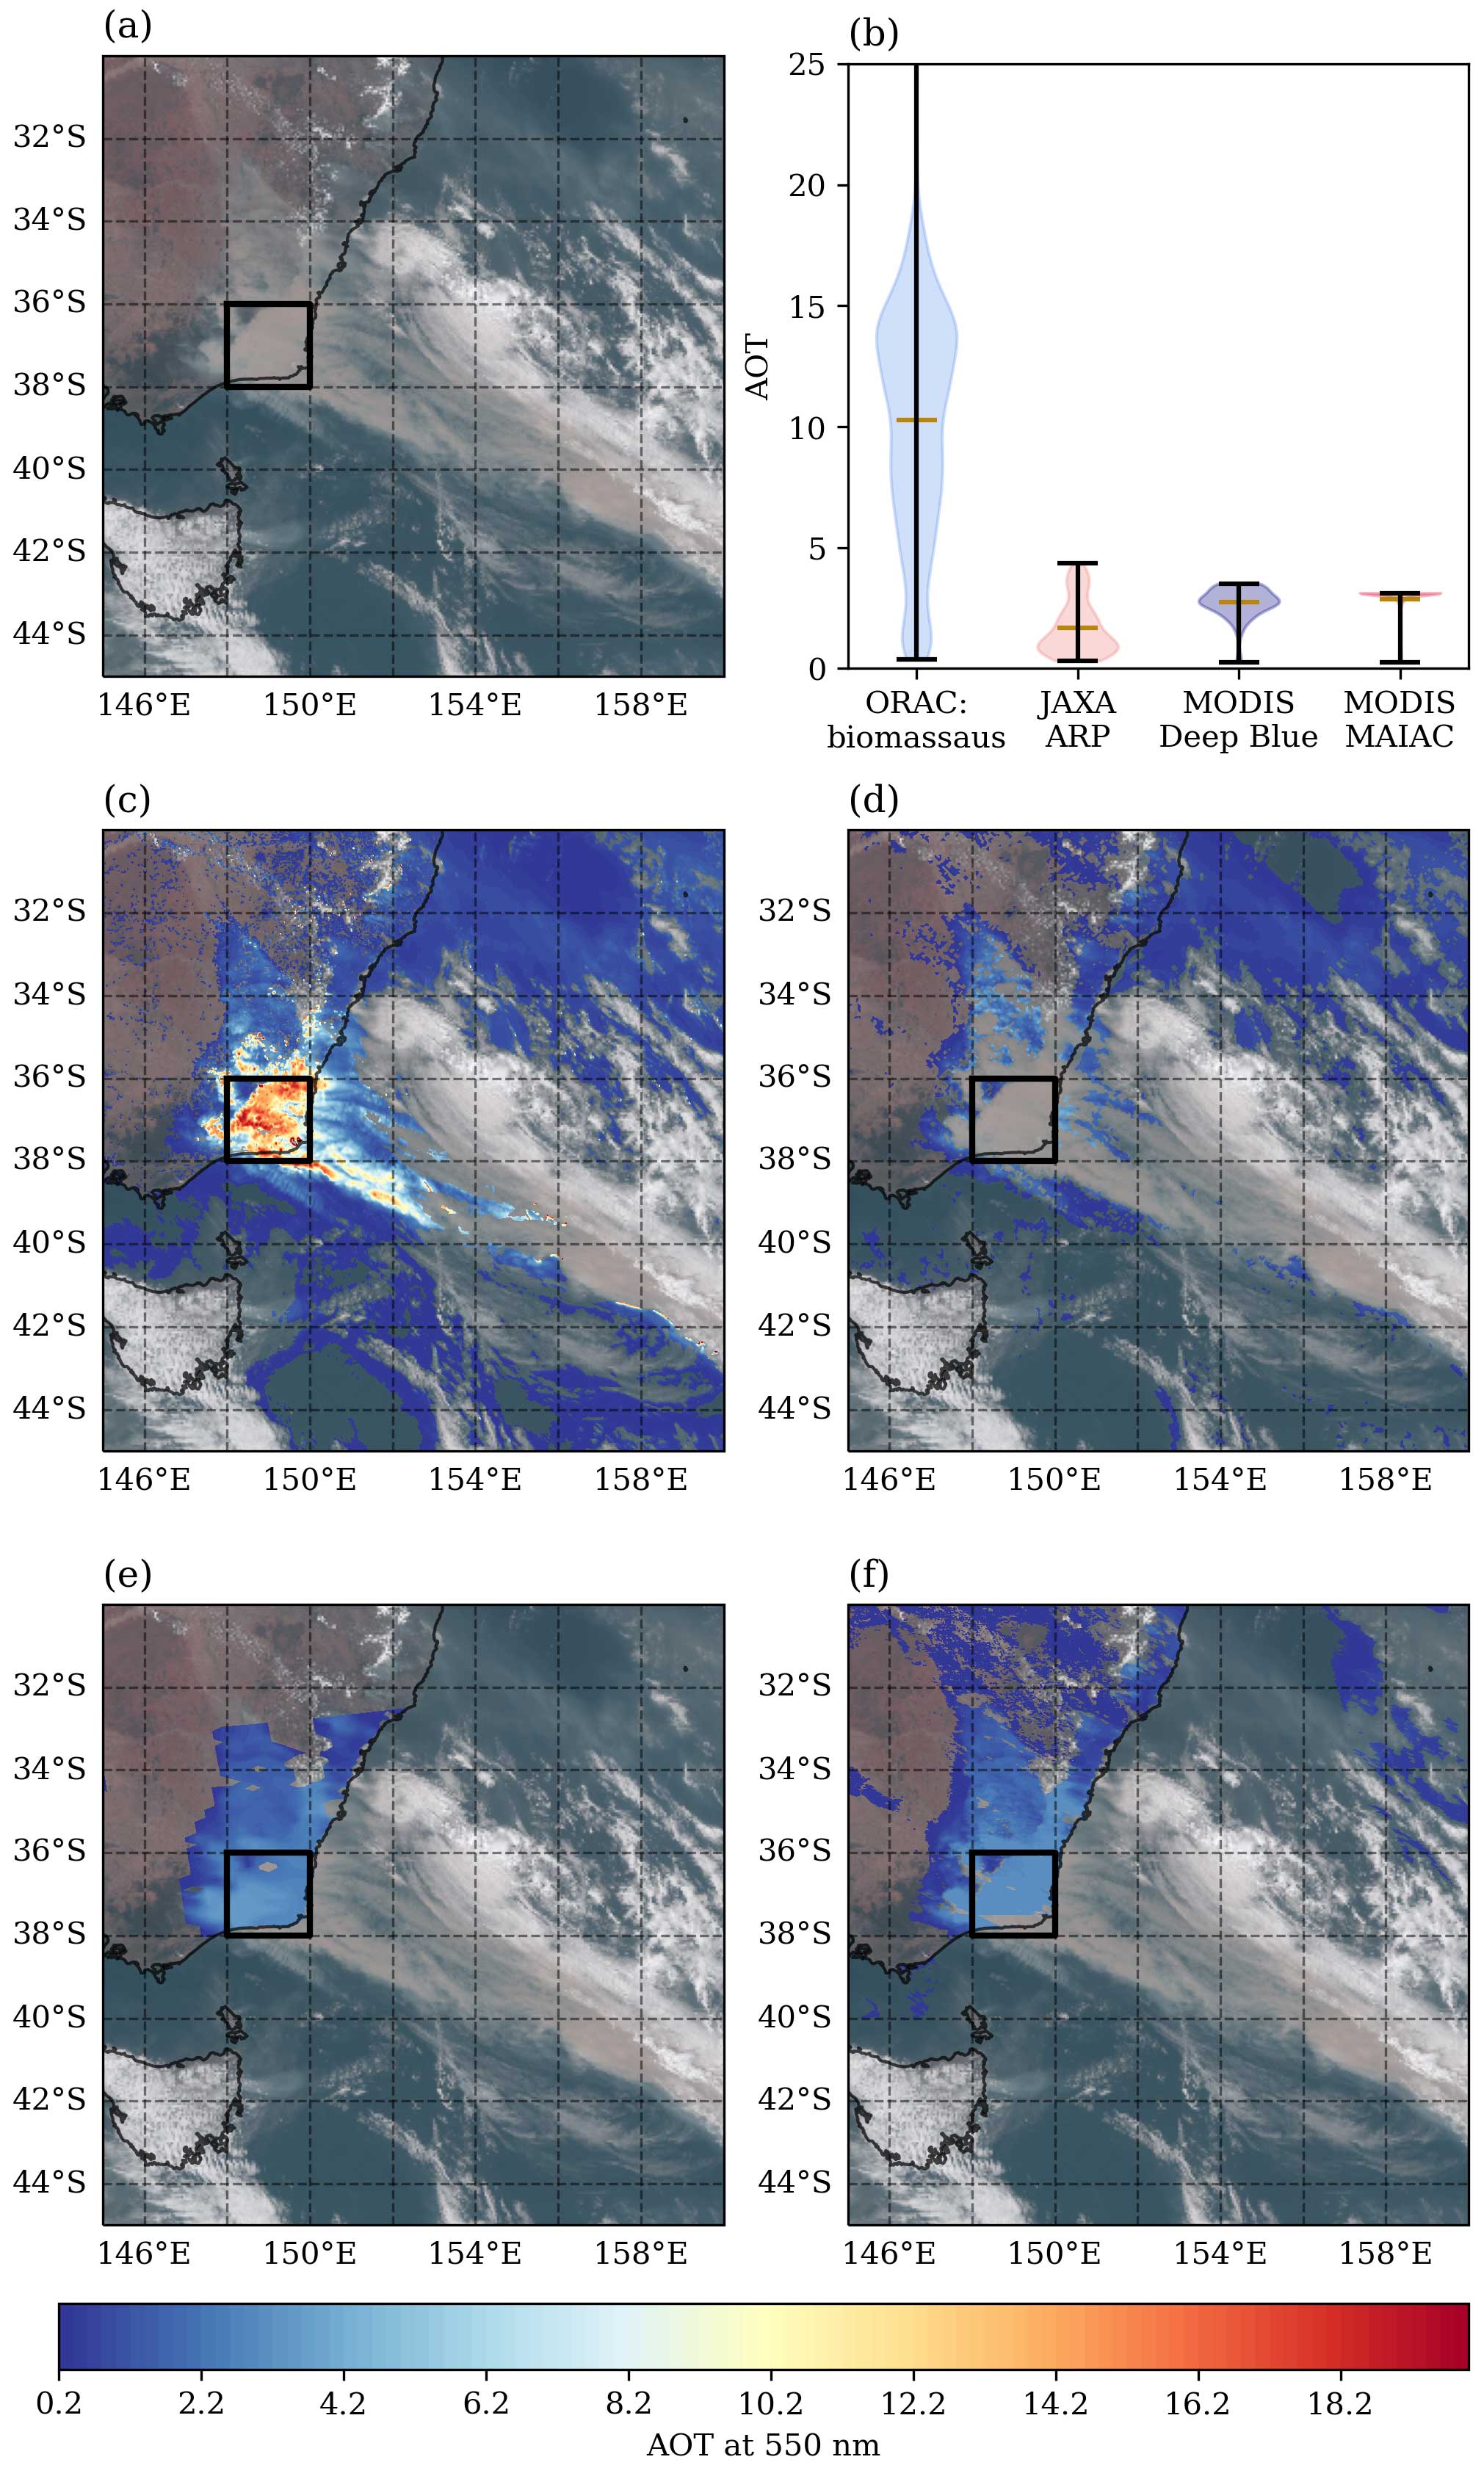
Figure 8High-AOT smoke for 1 January 2020 at 03:30 UTC. True-colour RGB from AHI (a). Violin plots of the AOT values within the highlighted box (b) indicating the frequency of AOT values for (c) ORAC mean biomass, (d) JAXA ARP, (e) MODIS Deep Blue and (f) MODIS MAIAC AOT retrievals.
Both visual inspection and the cloud mask developed in Robbins et al. (2022) suggest that this plume is not cloud-contaminated, but it can be seen in Fig. 8d that the JAXA ARP cloud mask misclassifies most of the BB plumes, which prevented any retrieval from being carried out in the most extreme regions of the plume. The MODIS products have not been cloud-cleared in these optically thick regions; however, Fig. 8b shows that the maximum retrieved value is approximately 5, significantly lower than the values found by ORAC or observed by AERONET. Of particular note is the distribution of the MODIS MAIAC AOT values, which show a narrow distribution of AOT around the peak value, suggesting that the MAIAC algorithm is capable of retrieving values closer to those seen by ORAC but is constrained by the internal maximum AOT threshold of the algorithm. This is apparent in Fig. 8f, where it can be seen that the retrieved AOT values from MAIAC are almost completely homogeneous across the whole of the plume despite significant differences observed in the true-colour RGB from AHI in Fig. 8a and the ORAC retrieval in Fig. 8c. A similar issue for the Deep Blue retrieval can been seen in Fig. 8b and e, where the distribution of AOT values is relatively narrow and heavily skewed towards the maximum value with a notable cutoff at that maximum.
The gaps in the JAXA ARP data and the underestimation of AOT in the MODIS products seen in this case study suggest that there has been a systematic underestimation of AOT values during the 2019–2020 Australian bushfire season, as plumes of this magnitude were present for many days along the southeast coast of Australia. This would have led to systematic underestimation in climate datasets and the estimation of radiative impacts. In addition, the lack of high-quality AOT data for the full bushfire period will have consequences for air quality (AQ) modelling, which often ingests satellite AOT products to assess concentrations of particulate matter on the ground (Inness et al., 2019).
In this study an aerosol property retrieval algorithm targeted at biomass burning plumes measured by the AHI on board Himawari-8 has been presented. It uses the cloud approach from the ORAC algorithm with BB LUTs developed for the 2019–2020 Australian bushfire season and the neural network (NN) cloud mask developed in Robbins et al. (2022). Three LUTs were developed utilising refractive index information for the BB plumes from the Tumbarumba AERONET site: decreased biomass, mean biomass and increased biomass. A sensitivity study compared available AERONET AOT values at 550 nm with ORAC retrievals using these three LUTs for the period between 00:00 UTC on 1 December 2019 (inclusive) and 00:00 UTC on 3 January 2020 (exclusive), showing that 1115 retrievals were successfully collocated. Linear fits of the LUT data with AERONET showed coefficient of determination values of 0.758, 0.741 and 0.755 for decreased biomass, mean biomass and increased biomass, respectively, but the mean bias of the mean biomass retrieval is the smallest, suggesting that this LUT best described the optical properties of the BB plumes from the 2019–2020 bushfire season. The similar clustering of low AOT values for all the LUTs but the divergence of ORAC values at higher optical depths (AOT ≫ 2) suggests the sensitivity to assumed optical properties becomes significant during these extreme events. The ORAC retrievals were compared against JAXA ARP, MODIS DB, MODIS MAIAC, Sentinel-3 SYN and VIIRS DB products for the study period. The ORAC retrievals had the smallest mean bias (0.269 for mean biomass) compared to the other satellite products, whilst retrieving higher values of AOT. This underestimation of AOT corresponds to the findings of Shi et al. (2019) and suggests that even where AOT data have been available from LEO satellite products, the optical thickness of the BB plumes has been underestimated and therefore the full impacts of the 2019–2020 bushfires have most likely not been studied in full.
Case studies of optically thick BB plumes from the southeast coast of Australia during the 2019–2020 bushfire season showed that, under less extreme conditions, the ORAC, JAXA ARP, MODIS DB and MODIS MAIAC products generally agree on AOT values for BB plumes, with the minor exception of regions of higher AOT values failing to be retrieved in the JAXA ARP. In the case of a more extreme BB plume, the ORAC retrieval found AOT values > 15, although with high uncertainty, which are significantly higher than those seen in events classified as extreme by previous studies (van Donkelaar et al., 2011; Markowicz et al., 2016; Petrenko et al., 2017; Zhuravleva et al., 2017; Shi et al., 2019; Mukai et al., 2021). The corresponding JAXA ARP misclassifies the more optically thick regions as cloud, whilst the MODIS products reach the upper limit of the retrieval algorithms. This suggests that there has been systematic underestimation of AOT values throughout the 2019–2020 bushfire season and implies that similar-scale fires which produced BB plumes with AOT > 5 have not been studied in full. As these data can be used for air quality modelling, the lack of satellite AOT data may impact health studies and AQ forecasts for people in regions impacted by extreme plumes. The omission of extreme plumes will affect long-term climatological studies, particularly those investigating the impacts of BB on the atmosphere and weather. However, it should be noted that this study covers the development of a scientific product, not an operational one, and further work will be needed to balance the cloud approach for extreme plumes with the aerosol approach for typical conditions in an operational setting.
Throughout this study, there has been a lack of ground-based instrumentation to validate AOT retrievals as well as a lack of active instrument data that are collocated with cloud-free BB plumes. This makes validating satellite products over Australia challenging. Over the period covered in this study, only the Tumbarumba AERONET site was active in the vicinity of the more extreme BB plumes. In addition, there are no publicly available ground-based lidar sites in this region. Overall, the lack of ground-based instrumentation across Australia, and particularly in more populated regions, poses a serious challenge to any study of aerosols and satellite AOT retrievals in the region. Therefore, an increase in ground-based sites would provide the opportunity to comprehensively validate the satellite products during the next extreme bushfire event, leading to higher-quality satellite products for Australia and improved forecasts.
The optical properties used in this study were derived from AERONET data that are publicly available in near-real time. Therefore, applying this same technique to similar situations across the globe when and where AERONET data are available, e.g. across much of North America, could lead to significantly improved BB AOT products globally. However, on an operational scale, this technique may not be viable, as it could lead to inconsistent time series of AOT as well as potentially excessive computational costs. A compromise could be to generate more specific look-up tables for areas that are prone to burning, e.g. Australia temperate forest and Canadian boreal forest, and using these to generate a more accurate global product that remains consistent through time.
The ORAC algorithm makes use of the MODIS Bidirectional Reflectance Distribution Function (BRDF) product to estimate the surface reflectance of a clear-sky scene for use in the aerosol and cloud retrievals. This includes reflectances across the visible spectrum, such as the green vegetation bands in bands 5–7 (see Fig. A1). However, the equivalent of the green band in Himawari-8 AHI is centred at 0.51 µm, which is not centred on the reflectance peak of healthy vegetation of 0.55 µm (Knipling, 1970) and leads to vegetated areas appearing dark in true-colour imagery (Miller et al., 2016). With respect to ORAC retrievals utilising the MODIS BRDF, this leads to a significant difference between expected reflectances in the green band, as it can be seen that there is very little overlap between the AHI green band and the MODIS green bands in Fig. A1. In addition, under the conditions seen during the 2019–2020 bushfire season, large swaths of land were burnt, changing the colour of the surface significantly in the MODIS BRDF but less so in the AHI green band. Therefore, although the cloud approach of ORAC is less sensitive to the characterisation of the surface, to ensure that this difference does not cause issues in the retrieval due to the significant uncertainty associated with the different characterisations of vegetated surface reflectance, the Himawari-8 AHI band 2 is not included in the retrievals.
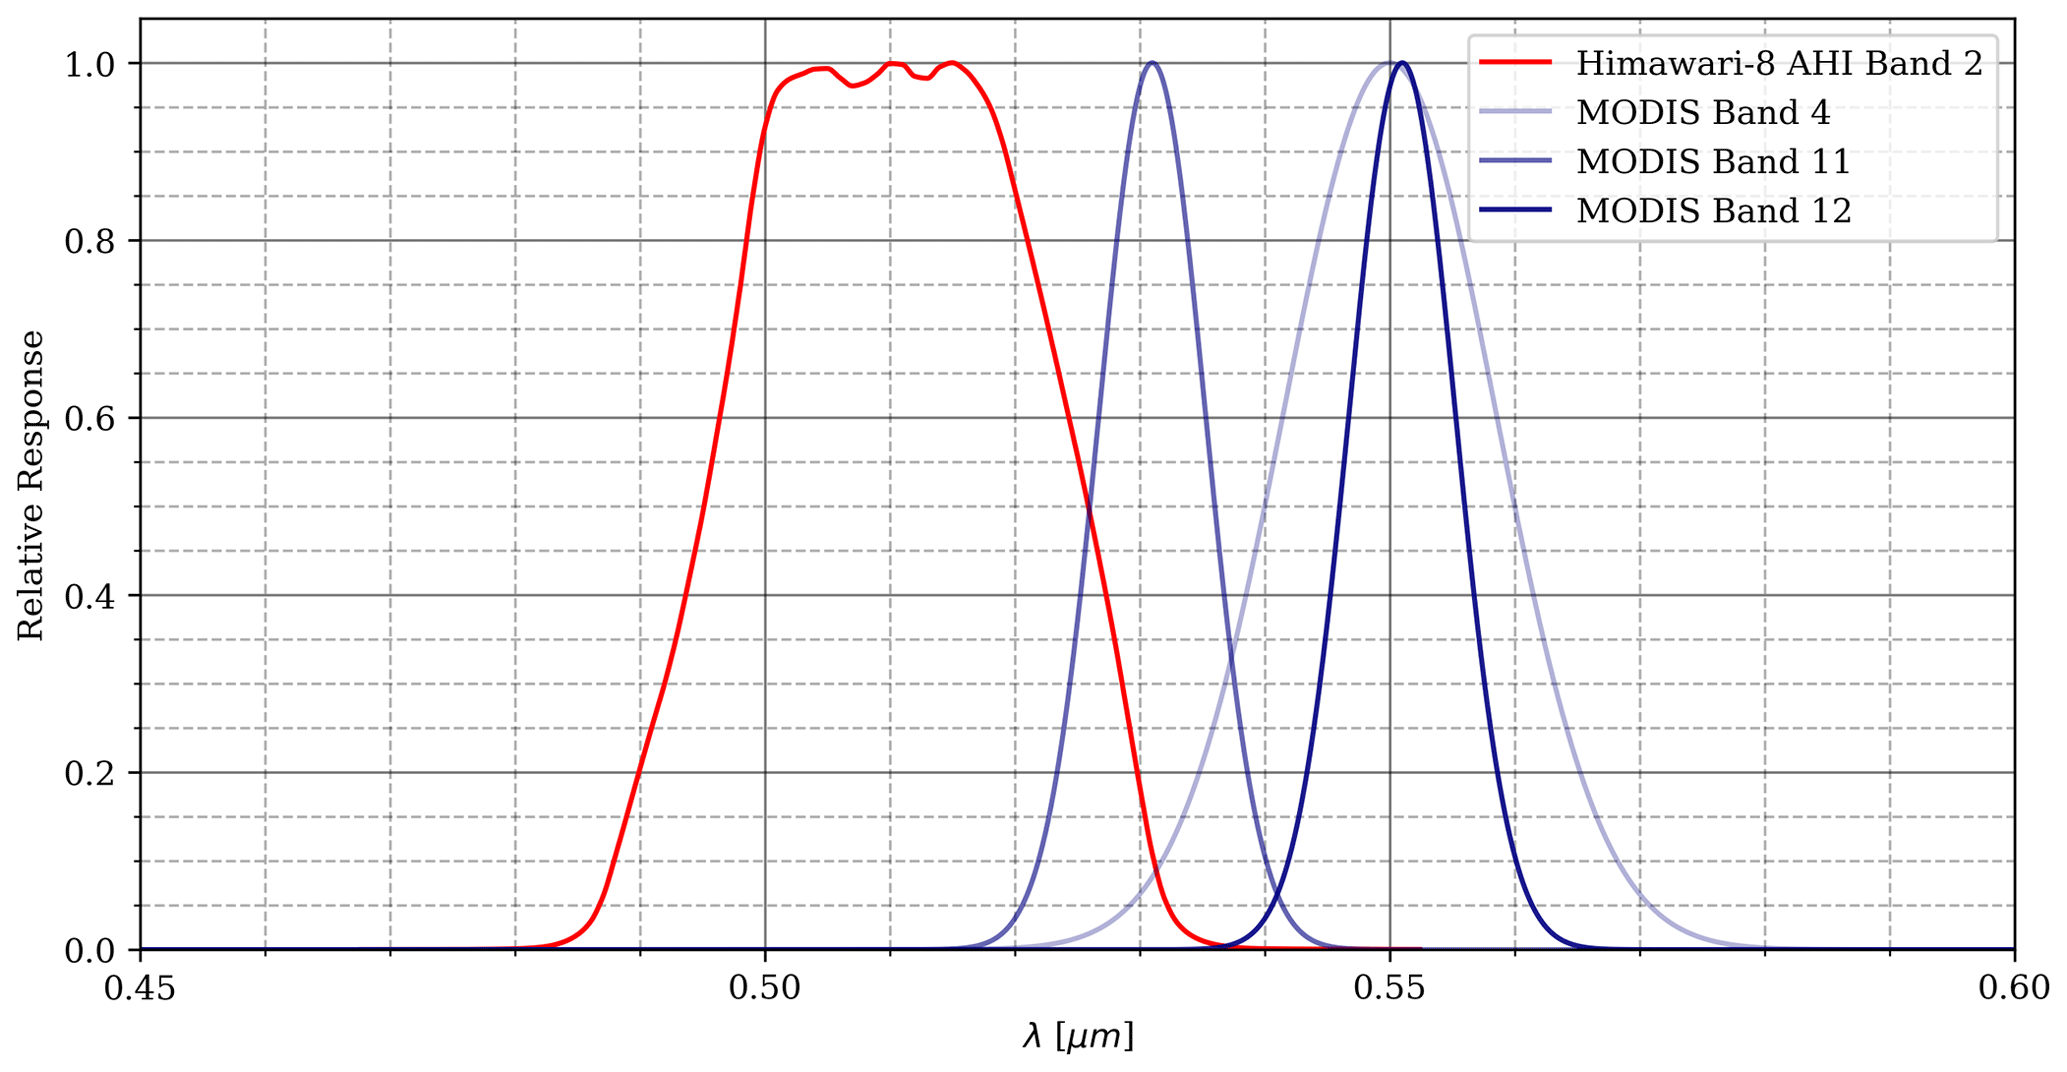
Figure A1The relative spectral response for band 2 in Himawari-8 AHI (red; https://www.data.jma.go.jp/mscweb/en/himawari89/space_segment/srf_201309/AHI-08_SpectralResponsivity.zip, last access: 21 March 2023) along with the nominal response for bands 4, 11 and 12 in MODIS (blue; https://modis.gsfc.nasa.gov/about/specifications.php, last access: 4 August 2023). The AHI band is considered a green band, but it does not significantly overlap with the green bands of the MODIS instruments.
The VIIRS and Sentinel-3 AOT products are not collocated within the 10 min of MODIS and AHI products, and thus they are not included in the case studies section. However, the closest spatially and temporally matching products are presented in Fig. B1 for each case study. Figure B1a and c show that the VIIRS product has a similar performance to the MODIS products during less optically thick BB plumes but significantly underestimates AOT for the more optically thick plume seen in Fig. B1e. Figure B1b, d and f demonstrate that the Sentinel-3 SYN product has no data available for large areas within BB plumes and generally has significantly lower values of AOT when compared with the other operational AOT products, suggesting that AOT values will be even more severely underestimated in climatologies derived from these data than climatologies derived from other operational AOT products.
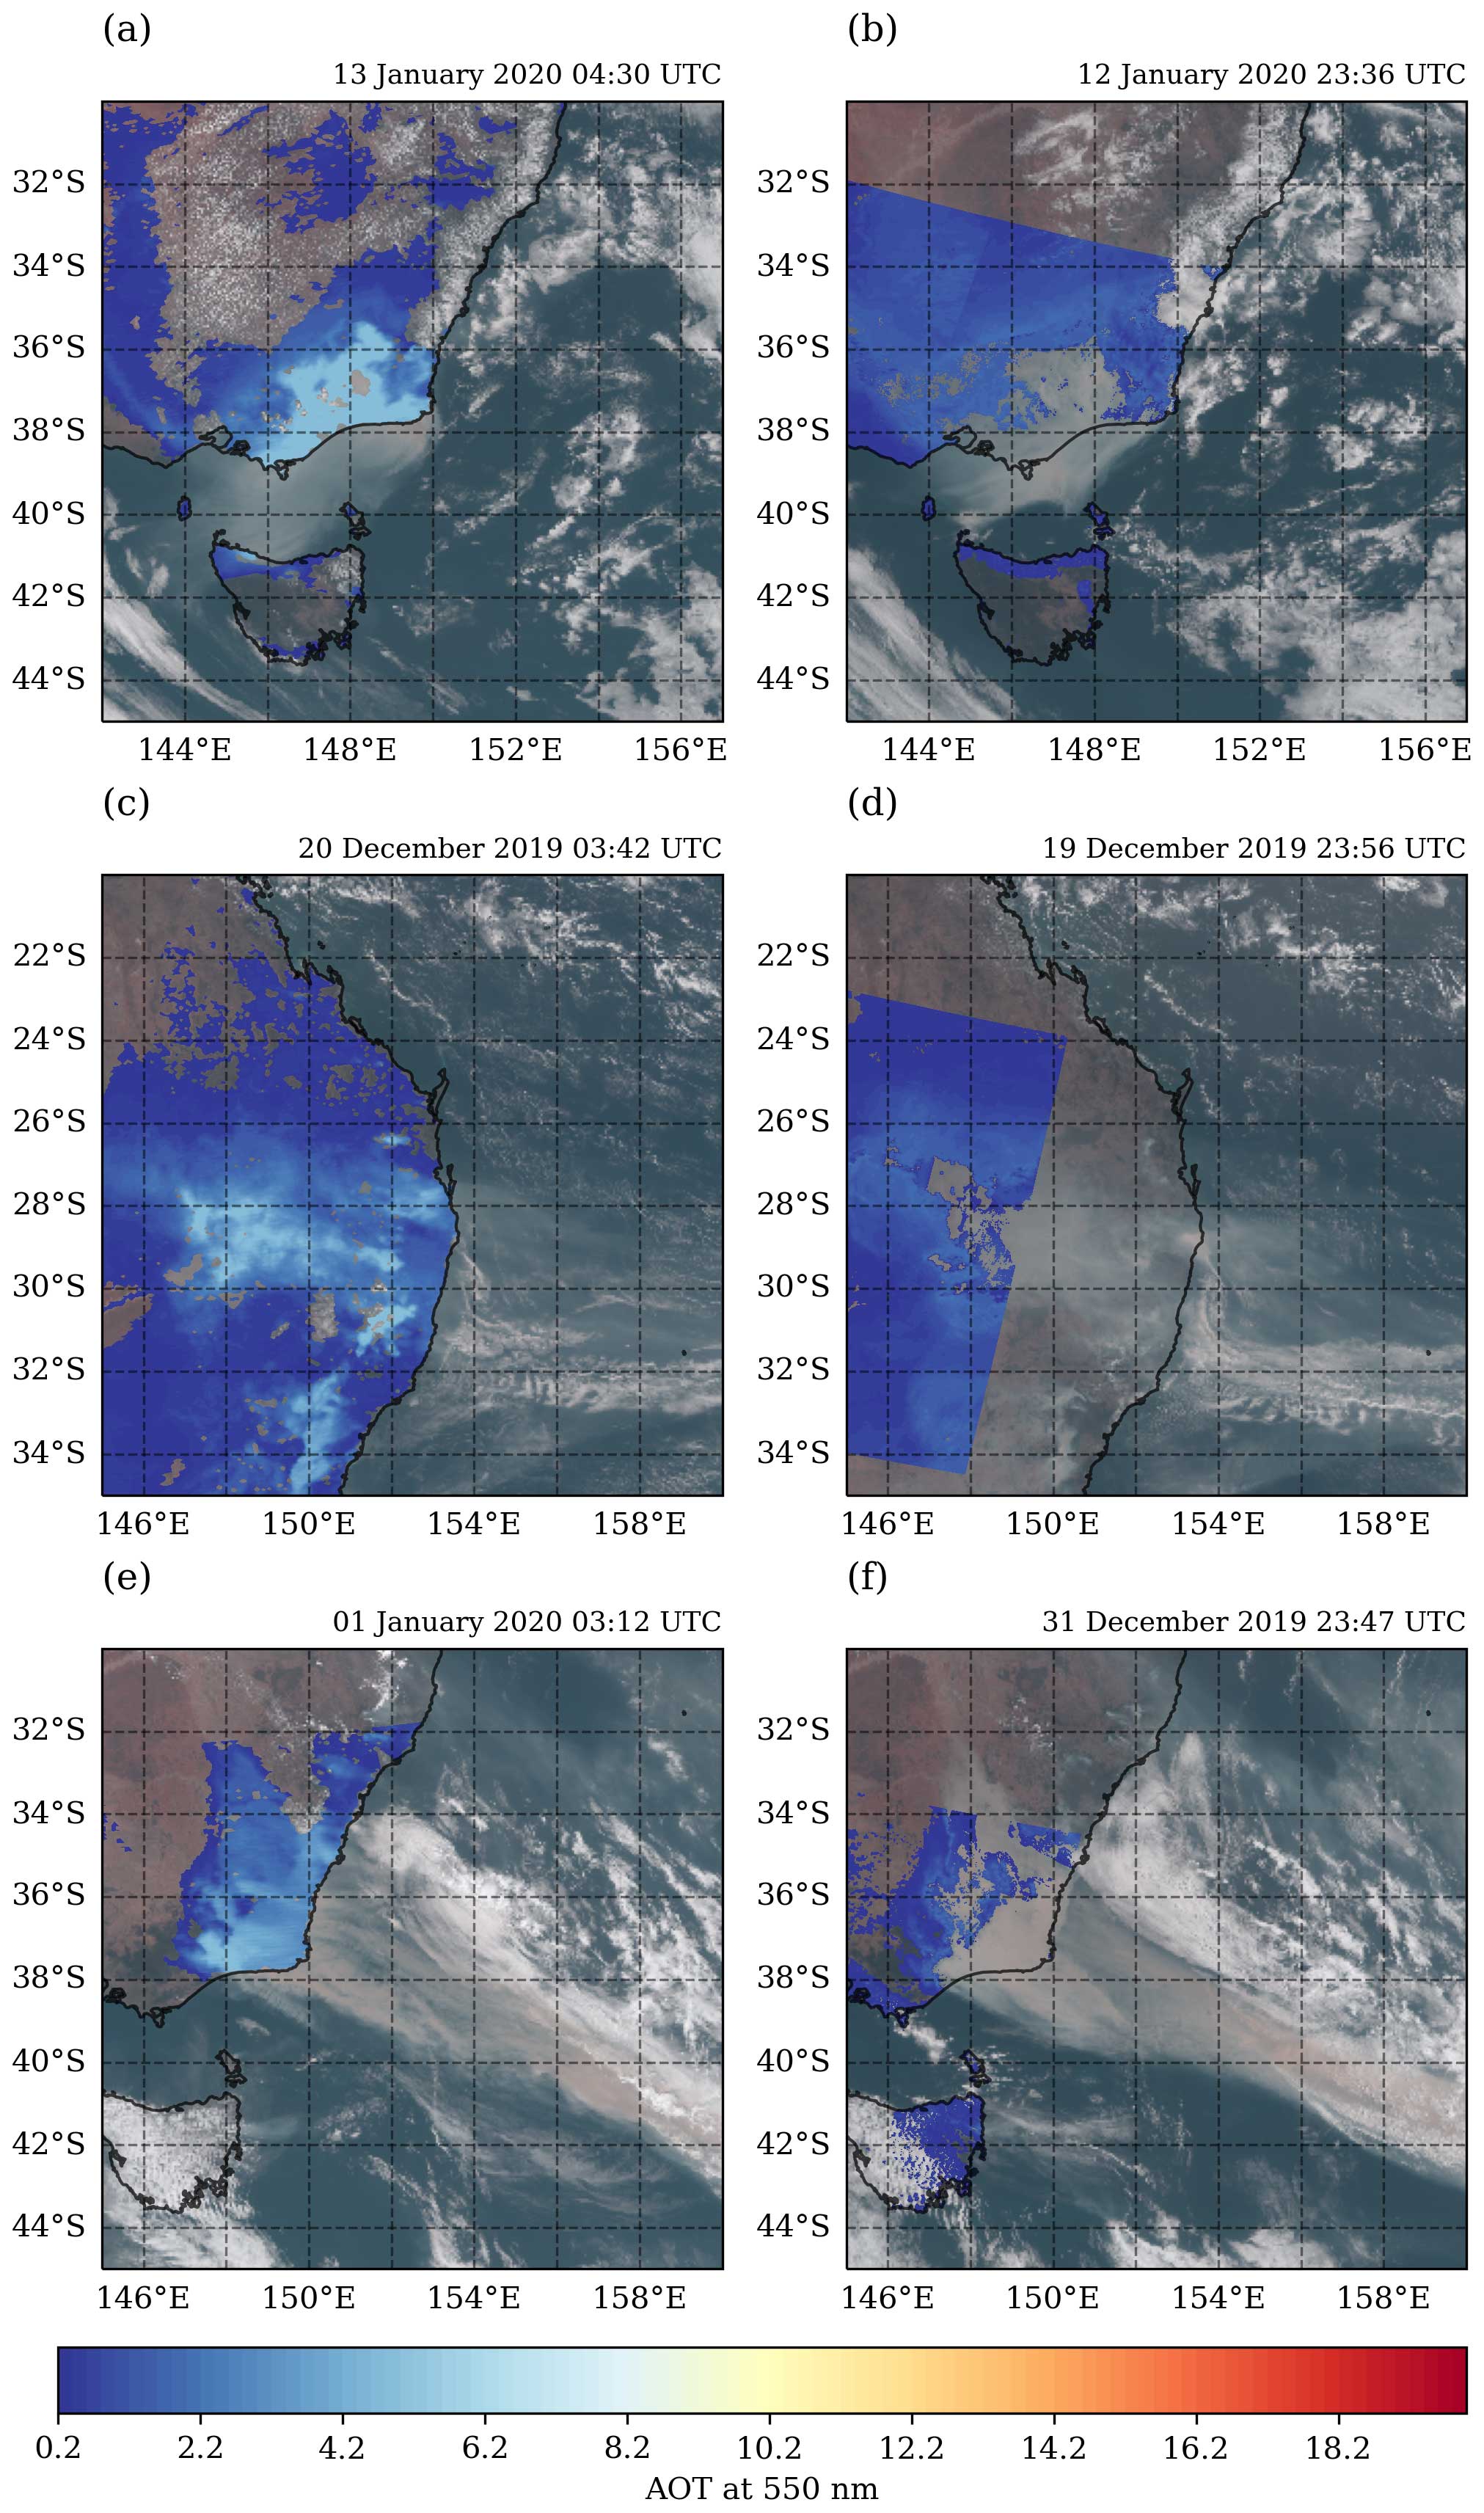
Figure B1The closest matching VIIRS DB (a, c and e) and Sentinel-3 SYN (b, d and f) products for the case studies presented in Sect. 4.2. The top row (a, b) matches the first case study, the middle row (c, d) matches the second case study and the bottom row (e, f) matches the third case study.
The ORAC code is open-source and available from GitHub under the GNU General Public License (GPL) Version 3 (https://github.com/ORAC-CC/orac, last access: 4 August 2023; Thomas et al., 2009; Poulsen et al., 2012; McGarragh et al., 2018; https://doi.org/10.5281/zenodo.11217795, Povey et al., 2024). The ORAC data for the BB plumes, including the time series and case studies data, are available on request from the corresponding author. AERONET data are available from the AERONET site (https://aeronet.gsfc.nasa.gov/cgi-bin/data_display_aod_v3, last access: 4 August 2023; AERONET, 2023; Holben et al., 1998; Giles et al., 2019). The AHI L1b data used in the ORAC retrievals are available on NCI Gadi (https://doi.org/10.25914/6TV5-F523, (Bureau Of Meteorology, 2022)). The JAXA ARP is available from the P-TREE system (https://www.eorc.jaxa.jp/ptree/, last access: 4 August 2023; JAXA, 2023; Yoshida et al., 2018). The MODIS, Sentinel-3 and VIIRS products are available from the NASA EarthSearch system (https://search.earthdata.nasa.gov/search, last access: 4 August 2023; NASA, 2023; North and Henkel, 2010; Lyapustin et al., 2018; Sayer et al., 2018; Hsu et al., 2019; Sayer et al., 2019).
DJVR led the study, carried out the analysis and wrote the manuscript. CAP assisted in the analysis, provided scientific advice and assisted in the writing of the manuscript. STS assisted in the analysis of the results, provided scientific advice during the study, and helped to edit and review the manuscript. SRP assisted in the development of the code and assisted in the analysis. ATP assisted in the development of the code and helped to edit and review the manuscript. RGG created the new aerosol LUTs and assisted in the analysis. ACP assisted in the development of the code.
The contact author has declared that none of the authors has any competing interests.
Publisher's note: Copernicus Publications remains neutral with regard to jurisdictional claims made in the text, published maps, institutional affiliations, or any other geographical representation in this paper. While Copernicus Publications makes every effort to include appropriate place names, the final responsibility lies with the authors.
This research project was undertaken with the assistance of resources and services from the National Computational Infrastructure (NCI), which is supported by the Australian government. This study was partly funded through NERC support of the National Centre for Earth Observation under award number NE/R016518/1. We thank Ian Lau and David Barker for their effort in establishing and maintaining the Tumbarumba site.
This research has been supported by the National Centre for Earth Observation (grant no. NE/R016518/1).
This paper was edited by Marloes Penning de Vries and reviewed by Antti Lipponen, Marloes Penning de Vries, and one anonymous referee.
Abram, N. J., Henley, B. J., Gupta, A. S., Lippmann, T. J. R., Clarke, H., Dowdy, A. J., Sharples, J. J., Nolan, R. H., Zhang, T., Wooster, M. J., Wurtzel, J. B., Meissner, K. J., Pitman, A. J., Ukkola, A. M., Murphy, B. P., Tapper, N. J., and Boer, M. M.: Connections of climate change and variability to large and extreme forest fires in southeast Australia, Commun. Earth Environ., 2, 8, https://doi.org/10.1038/s43247-020-00065-8, 2021. a
Ackerman, A. S., Toon, O. B., Stevens, D. E., Heymsfield, A. J., Ramanathan, V., and Welton, E. J.: Reduction of Tropical Cloudiness by Soot, Science, 288, 1042–1047, https://doi.org/10.1126/science.288.5468.1042, 2000. a
AERONET: AERONET Aerosol Optical Depth Data Display Interface, Goddard Space Flight Center, Aerosol Robotic Network [data set], https://aeronet.gsfc.nasa.gov/cgi-bin/data_display_aod_v3, last access: 4 August 2023. a
Andreae, M. O.: Emission of trace gases and aerosols from biomass burning – an updated assessment, Atmos. Chem. Phys., 19, 8523–8546, https://doi.org/10.5194/acp-19-8523-2019, 2019. a
Arias, P. A., Bellouin, N., Coppola, E., Jones, R. G., Krinner, G., Marotzke, J., Naik, V., Palmer, M. D., Plattner, G.-K., Rogelj, J., Rojas, M., Sillmann, J., Storelvmo, T., Thorne, P. W., Trewin, B., Achuta Rao, K., Adhikary, B., Allan, R. P., Armour, K., Bala, G., Barimalala, R., Berger, S., Canadell, J. G., Cassou, C., Cherchi, A., Collins, W., Collins, W. D., Connors, S. L., Corti, S., Cruz, F., Dentener, F. J., Dereczynski, C., Di Luca, A., Diongue Niang, A., Doblas-Reyes, F. J., Dosio, A., Douville, H., Engelbrecht, F., Eyring, V., Fischer, E., Forster, P., Fox-Kemper, B., Fuglestvedt, J. S., Fyfe, J. C., Gillett, N. P., Goldfarb, L., Gorodetskaya, I., Gutierrez, J. M., Hamdi, R., Hawkins, E., Hewitt, H. T., Hope, P., Islam, A. S., Jones, C., Kaufman, D. S., Kopp, R. E., Kosaka, Y., Kossin, J., Krakovska, S., Lee, J.-Y., Li, J., Mauritsen, T., Maycock, T. K., Meinshausen, M., Min, S.-K., Monteiro, P. M. S., Ngo-Duc, T., Otto, F., Pinto, I., Pirani, A., Raghavan, K., Ranasinghe, R., Ruane, A. C., Ruiz, L., Sallée, J.-B., Samset, B. H., Sathyendranath, S., Seneviratne, S. I., Sörensson, A. A., Szopa, S., Takayabu, I., Treguier, A.-M., van den Hurk, B., Vautard, R., von Schuckmann, K., Zaehle, S., Zhang, X., and Zickfeld, K.: Technical Summary, in: Climate Change 2021: The Physical Science Basis. Contribution of Working Group I to the Sixth Assessment Report of the Intergovernmental Panel on Climate Change, edited by: Masson-Delmotte, V., Zhai, P., Pirani, A., Connors, S. L., Péan, C., Berger, S., Caud, N., Chen, Y., Goldfarb, L., Gomis, M. I., Huang, M., Leitzell, K., Lonnoy, E., Matthews, J. B. R., Maycock, T. K., Waterfield, T., Yelekçi, O., Yu, R., and Zhou, B., Cambridge University Press, Cambridge, United Kingdom and New York, NY, USA, https://www.ipcc.ch/report/ar6/wg1/downloads/report/IPCC_AR6_WGI_TS.pdf (last access: 4 August 2023), 2021. a
Arriagada, N. B., Palmer, A. J., Bowman, D. M., Morgan, G. G., Jalaludin, B. B., and Johnston, F. H.: Unprecedented smoke-related health burden associated with the 2019–20 bushfires in eastern Australia, Med. J. Australia, 213, 282–283, https://doi.org/10.5694/mja2.50545, 2020. a
Attiya, A. A. and Jones, B. G.: Impact of Smoke Plumes Transport on Air Quality in Sydney during Extensive Bushfires (2019) in New South Wales, Australia Using Remote Sensing and Ground Data, Remote Sens.-Basel, 14, 5552, https://doi.org/10.3390/rs14215552, 2022. a
Bellouin, N., Boucher, O., Haywood, J., and Reddy, M. S.: Global estimate of aerosol direct radiative forcing from satellite measurements, Nature, 438, 1138–1141, https://doi.org/10.1038/nature04348, 2005. a
Bellouin, N., Quaas, J., Gryspeerdt, E., Kinne, S., Stier, P., Watson-Parris, D., Boucher, O., Carslaw, K. S., Christensen, M., Daniau, A.-L., Dufresne, J.-L., Feingold, G., Fiedler, S., Forster, P., Gettelman, A., Haywood, J. M., Lohmann, U., Malavelle, F., Mauritsen, T., McCoy, D. T., Myhre, G., Mülmenstädt, J., Neubauer, D., Possner, A., Rugenstein, M., Sato, Y., Schulz, M., Schwartz, S. E., Sourdeval, O., Storelvmo, T., Toll, V., Winker, D., and Stevens, B.: Bounding Global Aerosol Radiative Forcing of Climate Change, Rev. Geophys., 58, e2019RG000660, https://doi.org/10.1029/2019rg000660, 2020. a
Bessho, K., Date, K., Hayashi, M., Ikeda, A., Imai, T., Inoue, H., Kumagai, Y., Miyakawa, T., Murata, H., Ohno, T., Okuyama, A., Oyama, R., Sasaki, Y., Shimazu, Y., Shimoji, K., Sumida, Y., Suzuki, M., Taniguchi, H., Tsuchiyama, H., Uesawa, D., Yokota, H., and Yoshida, R.: An Introduction to Himawari-8/9- Japan's New-Generation Geostationary Meteorological Satellites, J. Meteorol. Soc. Jpn. Ser. II, 94, 151–183, https://doi.org/10.2151/jmsj.2016-009, 2016. a, b, c
Boer, M. M., de Dios, V. R., and Bradstock, R. A.: Unprecedented burn area of Australian mega forest fires, Nat. Clim. Change, 10, 171–172, https://doi.org/10.1038/s41558-020-0716-1, 2020. a
Bureau Of Meteorology: Bureau of Meteorology Satellite Low Level Data, NCI Australia [data set], https://doi.org/10.25914/6TV5-F523, 2022. a
Canadell, J. G., Meyer, C. P., Cook, G. D., Dowdy, A., Briggs, P. R., Knauer, J., Pepler, A., and Haverd, V.: Multi-decadal increase of forest burned area in Australia is linked to climate change, Nat. Commun., 12, 6921, https://doi.org/10.1038/s41467-021-27225-4, 2021. a
Chang, D. Y., Yoon, J., Lelieveld, J., Park, S. K., Yum, S. S., Kim, J., and Jeong, S.: Direct radiative forcing of biomass burning aerosols from the extensive Australian wildfires in 2019–2020, Environ. Res. Lett., 16, 044041, https://doi.org/10.1088/1748-9326/abecfe, 2021. a, b
Chen, J., Li, C., Ristovski, Z., Milic, A., Gu, Y., Islam, M. S., Wang, S., Hao, J., Zhang, H., He, C., Guo, H., Fu, H., Miljevic, B., Morawska, L., Thai, P., LAM, Y. F., Pereira, G., Ding, A., Huang, X., and Dumka, U. C.: A review of biomass burning: Emissions and impacts on air quality, health and climate in China, Sci. Total Environ., 579, 1000–1034, https://doi.org/10.1016/j.scitotenv.2016.11.025, 2017. a
Collins, L., Bradstock, R. A., Clarke, H., Clarke, M. F., Nolan, R. H., and Penman, T. D.: The 2019/2020 mega-fires exposed Australian ecosystems to an unprecedented extent of high-severity fire, Environ. Res. Lett., 16, 044029, https://doi.org/10.1088/1748-9326/abeb9e, 2021. a
Connolly, P. J., Vaughan, G., May, P. T., Chemel, C., Allen, G., Choularton, T. W., Gallagher, M. W., Bower, K. N., Crosier, J., and Dearden, C.: Can aerosols influence deep tropical convection? Aerosol indirect effects in the Hector island thunderstorm, Q. J. Roy. Meteor. Soc., 139, 2190–2208, https://doi.org/10.1002/qj.2083, 2012. a
Coppo, P., Ricciarelli, B., Brandani, F., Delderfield, J., Ferlet, M., Mutlow, C., Munro, G., Nightingale, T., Smith, D., Bianchi, S., Nicol, P., Kirschstein, S., Hennig, T., Engel, W., Frerick, J., and Nieke, J.: SLSTR: a high accuracy dual scan temperature radiometer for sea and land surface monitoring from space, J. Mod. Optic., 57, 1815–1830, https://doi.org/10.1080/09500340.2010.503010, 2010. a, b
Cox, C. and Munk, W.: Measurement of the Roughness of the Sea Surface from Photographs of the Sun's Glitter, J. Opt. Soc. Am., 44, 838–850, https://doi.org/10.1364/josa.44.000838, 1954. a
Cruz, M., Sullivan, A., Gould, J., Sims, N., Bannister, A., Hollis, J., and Hurley, R.: Anatomy of a catastrophic wildfire: The Black Saturday Kilmore East fire in Victoria, Australia, Forest Ecol. Manag., 284, 269–285, https://doi.org/10.1016/j.foreco.2012.02.035, 2012. a
Dickman, C. R.: Ecological consequences of Australia's “Black Summer” bushfires: Managing for recovery, Integr. Environ. Asses., 17, 1162–1167, https://doi.org/10.1002/ieam.4496, 2021. a
Eck, T. F., Holben, B. N., Giles, D. M., Slutsker, I., Sinyuk, A., Schafer, J. S., Smirnov, A., Sorokin, M., Reid, J. S., Sayer, A. M., Hsu, N. C., Shi, Y. R., Levy, R. C., Lyapustin, A., Rahman, M. A., Liew, S.-C., Cortijo, S. V. S., Li, T., Kalbermatter, D., Keong, K. L., Yuggotomo, M. E., Aditya, F., Mohamad, M., Mahmud, M., Chong, T. K., Lim, H.-S., Choon, Y. E., Deranadyan, G., Kusumaningtyas, S. D. A., and Aldrian, E.: AERONET Remotely Sensed Measurements and Retrievals of Biomass Burning Aerosol Optical Properties During the 2015 Indonesian Burning Season, J. Geophys. Res.-Atmos., 124, 4722–4740, https://doi.org/10.1029/2018jd030182, 2019. a, b
Engel-Cox, J. A., Holloman, C. H., Coutant, B. W., and Hoff, R. M.: Qualitative and quantitative evaluation of MODIS satellite sensor data for regional and urban scale air quality, Atmos. Environ., 38, 2495–2509, https://doi.org/10.1016/j.atmosenv.2004.01.039, 2004. a
Fernández-García, V., Beltrán-Marcos, D., Fernández-Guisuraga, J. M., Marcos, E., and Calvo, L.: Predicting potential wildfire severity across Southern Europe with global data sources, Sci. Total Environ., 829, 154729, https://doi.org/10.1016/j.scitotenv.2022.154729, 2022. a
Flemming, J., Benedetti, A., Inness, A., Engelen, R. J., Jones, L., Huijnen, V., Remy, S., Parrington, M., Suttie, M., Bozzo, A., Peuch, V.-H., Akritidis, D., and Katragkou, E.: The CAMS interim Reanalysis of Carbon Monoxide, Ozone and Aerosol for 2003–2015, Atmos. Chem. Phys., 17, 1945–1983, https://doi.org/10.5194/acp-17-1945-2017, 2017. a
Gelaro, R., McCarty, W., Suárez, M. J., Todling, R., Molod, A., Takacs, L., Randles, C. A., Darmenov, A., Bosilovich, M. G., Reichle, R., Wargan, K., Coy, L., Cullather, R., Draper, C., Akella, S., Buchard, V., Conaty, A., da Silva, A. M., Gu, W., Kim, G.-K., Koster, R., Lucchesi, R., Merkova, D., Nielsen, J. E., Partyka, G., Pawson, S., Putman, W., Rienecker, M., Schubert, S. D., Sienkiewicz, M., and Zhao, B.: The Modern-Era Retrospective Analysis for Research and Applications, Version 2 (MERRA-2), J. Climate, 30, 5419–5454, https://doi.org/10.1175/jcli-d-16-0758.1, 2017. a
Giles, D. M., Sinyuk, A., Sorokin, M. G., Schafer, J. S., Smirnov, A., Slutsker, I., Eck, T. F., Holben, B. N., Lewis, J. R., Campbell, J. R., Welton, E. J., Korkin, S. V., and Lyapustin, A. I.: Advancements in the Aerosol Robotic Network (AERONET) Version 3 database – automated near-real-time quality control algorithm with improved cloud screening for Sun photometer aerosol optical depth (AOD) measurements, Atmos. Meas. Tech., 12, 169–209, https://doi.org/10.5194/amt-12-169-2019, 2019. a, b, c
González, R., Toledano, C., Román, R., Mateos, D., Asmi, E., Rodríguez, E., Lau, I. C., Ferrara, J., D'Elia, R., Antuña-Sánchez, J. C., Cachorro, V. E., Calle, A., and de Frutos, Á. M.: Characterization of Stratospheric Smoke Particles over the Antarctica by Remote Sensing Instruments, Remote Sens.-Basel, 12, 3769, https://doi.org/10.3390/rs12223769, 2020. a, b
Goodman, S. J.: GOES-R Series Introduction, in: The GOES-R Series, Elsevier, 1–3, https://doi.org/10.1016/b978-0-12-814327-8.00001-9, 2020. a
Gott, B.: Aboriginal fire management in south-eastern Australia: aims and frequency, J. Biogeogr., 32, 1203–1208, https://doi.org/10.1111/j.1365-2699.2004.01233.x, 2005. a
Graham, A. M., Pringle, K. J., Pope, R. J., Arnold, S. R., Conibear, L. A., Burns, H., Rigby, R., Borchers-Arriagada, N., Butt, E. W., Kiely, L., Reddington, C., Spracklen, D. V., Woodhouse, M. T., Knote, C., and McQuaid, J. B.: Impact of the 2019/2020 Australian Megafires on Air Quality and Health, GeoHealth, 5, e2021GH000454, https://doi.org/10.1029/2021gh000454, 2021. a, b
Hanssen, A. and Kuipers, W.: On the Relationship Between the Frequency of Rain and Various Meteorological Parameters (with Reference to the Problem Of Objective Forecasting), Koninkl. Nederlands Meterologisch Institut, Mededelingen en Verhandelingen, Staatsdrukkerij- en Uitgeverijbedrijf, https://books.google.com.au/books?id=nTZ8OgAACAAJ (last access: 4 August 2023), 1965. a, b
Haywood, J. and Boucher, O.: Estimates of the direct and indirect radiative forcing due to tropospheric aerosols: A review, Rev. Geophys., 38, 513–543, https://doi.org/10.1029/1999rg000078, 2000. a
Henocq, C., North, P., Heckel, A., Ferron, S., Lamquin, N., Dransfeld, S., Bourg, L., TOTE, C., and Ramon, D.: OLCI/SLSTR SYN L2 Algorithm and Products Overview, in: IGARSS 2018–2018 IEEE International Geoscience and Remote Sensing Symposium, Valencia, Spain, 22–27 July 2018, IEEE, https://doi.org/10.1109/igarss.2018.8517420, 2018. a
Hirsch, E. and Koren, I.: Record-breaking aerosol levels explained by smoke injection into the stratosphere, Science, 371, 1269–1274, https://doi.org/10.1126/science.abe1415, 2021. a
Holben, B., Eck, T., Slutsker, I., Tanré, D., Buis, J., Setzer, A., Vermote, E., Reagan, J., Kaufman, Y., Nakajima, T., Lavenu, F., Jankowiak, I., and Smirnov, A.: AERONET – A Federated Instrument Network and Data Archive for Aerosol Characterization, Remote Sens. Environ., 66, 1–16, https://doi.org/10.1016/s0034-4257(98)00031-5, 1998. a, b, c
Holmlund, K., Grandell, J., Schmetz, J., Stuhlmann, R., Bojkov, B., Munro, R., Lekouara, M., Coppens, D., Viticchie, B., August, T., Theodore, B., Watts, P., Dobber, M., Fowler, G., Bojinski, S., Schmid, A., Salonen, K., Tjemkes, S., Aminou, D., and Blythe, P.: Meteosat Third Generation (MTG): Continuation and Innovation of Observations from Geostationary Orbit, B. Am. Meteorol. Soc., 102, E990–E1015, https://doi.org/10.1175/bams-d-19-0304.1, 2021. a
Hsu, N. C., Lee, J., Sayer, A. M., Kim, W., Bettenhausen, C., and Tsay, S.-C.: VIIRS Deep Blue Aerosol Products Over Land: Extending the EOS Long-Term Aerosol Data Records, J. Geophys. Res.-Atmos., 124, 4026–4053, https://doi.org/10.1029/2018jd029688, 2019. a, b
Huang, X. and Ding, A.: Aerosol as a critical factor causing forecast biases of air temperature in global numerical weather prediction models, Sci. Bull., 66, 1917–1924, https://doi.org/10.1016/j.scib.2021.05.009, 2021. a, b
Hutchinson, M., Stein, J., Stein, J., Anderson, H., and Tickle, P.: GEODATA 9 second DEM and D8: Digital Elevation Model Version 3 and Flow Direction Grid 2008, Geoscience Australia, http://pid.geoscience.gov.au/dataset/ga/66006 (last access: 27 March 2023), 2008. a
Inness, A., Ades, M., Agustí-Panareda, A., Barré, J., Benedictow, A., Blechschmidt, A.-M., Dominguez, J. J., Engelen, R., Eskes, H., Flemming, J., Huijnen, V., Jones, L., Kipling, Z., Massart, S., Parrington, M., Peuch, V.-H., Razinger, M., Remy, S., Schulz, M., and Suttie, M.: The CAMS reanalysis of atmospheric composition, Atmos. Chem. Phys., 19, 3515–3556, https://doi.org/10.5194/acp-19-3515-2019, 2019. a
Isaza, A., Kay, M., Evans, J. P., Prasad, A., and Bremner, S.: Air quality impacts on rooftop photovoltaic energy production during the 2019–2020 Australian bushfires season, Sol. Energy, 257, 240–248, https://doi.org/10.1016/j.solener.2023.04.014, 2023. a
JAXA: JAXA Himawari Monitor P-Tree, Japan Aerospace Exploration Agency [data set], https://www.eorc.jaxa.jp/ptree/, last access: 4 August 2023. a
Juliano, T. W., Jiménez, P. A., Kosović, B., Eidhammer, T., Thompson, G., Berg, L. K., Fast, J., Motley, A., and Polidori, A.: Smoke from 2020 United States wildfires responsible for substantial solar energy forecast errors, Environ. Res. Lett., 17, 034010, https://doi.org/10.1088/1748-9326/ac5143, 2022. a
Justice, C., Townshend, J., Vermote, E., Masuoka, E., Wolfe, R., Saleous, N., Roy, D., and Morisette, J.: An overview of MODIS Land data processing and product status, Remote Sens. Environ., 83, 3–15, https://doi.org/10.1016/s0034-4257(02)00084-6, 2002. a
Knipling, E. B.: Physical and physiological basis for the reflectance of visible and near-infrared radiation from vegetation, Remote Sens. Environ.,s 1, 155–159, https://doi.org/10.1016/s0034-4257(70)80021-9, 1970. a
Kochanski, A. K., Mallia, D. V., Fearon, M. G., Mandel, J., Souri, A. H., and Brown, T.: Modeling Wildfire Smoke Feedback Mechanisms Using a Coupled Fire-Atmosphere Model With a Radiatively Active Aerosol Scheme, J. Geophys. Res.-Atmos., 124, 9099–9116, https://doi.org/10.1029/2019jd030558, 2019. a
Li, F., Zhang, X., and Kondragunta, S.: Highly anomalous fire emissions from the 2019–2020 Australian bushfires, Environmental Research Communications, 3, 105005, https://doi.org/10.1088/2515-7620/ac2e6f, 2021a. a
Li, M., Shen, F., and Sun, X.: 2019–2020 Australian bushfire air particulate pollution and impact on the South Pacific Ocean, Sci. Rep.-UK, 11, 12288, https://doi.org/10.1038/s41598-021-91547-y, 2021b. a, b, c, d, e, f
Lisok, J., Rozwadowska, A., Pedersen, J. G., Markowicz, K. M., Ritter, C., Kaminski, J. W., Struzewska, J., Mazzola, M., Udisti, R., Becagli, S., and Gorecka, I.: Radiative impact of an extreme Arctic biomass-burning event, Atmos. Chem. Phys., 18, 8829–8848, https://doi.org/10.5194/acp-18-8829-2018, 2018. a
Liu, L., Cheng, Y., Wang, S., Wei, C., Pöhlker, M. L., Pöhlker, C., Artaxo, P., Shrivastava, M., Andreae, M. O., Pöschl, U., and Su, H.: Impact of biomass burning aerosols on radiation, clouds, and precipitation over the Amazon: relative importance of aerosol–cloud and aerosol–radiation interactions, Atmos. Chem. Phys., 20, 13283–13301, https://doi.org/10.5194/acp-20-13283-2020, 2020. a
Lyapustin, A. and Wang, Y.: MODIS Multi-Angle Implementation of Atmospheric Correction (MAIAC) Data User's Guide, US Geological Survey (USGS), https://lpdaac.usgs.gov/documents/110/MCD19_User_Guide_V6.pdf (last access: 13 February 2023), 2008. a, b
Lyapustin, A., Wang, Y., Korkin, S., and Huang, D.: MODIS Collection 6 MAIAC algorithm, Atmos. Meas. Tech., 11, 5741–5765, https://doi.org/10.5194/amt-11-5741-2018, 2018. a, b, c
Markowicz, K., Chilinski, M., Lisok, J., Zawadzka, O., Stachlewska, I., Janicka, L., Rozwadowska, A., Makuch, P., Pakszys, P., Zielinski, T., Petelski, T., Posyniak, M., Pietruczuk, A., Szkop, A., and Westphal, D.: Study of aerosol optical properties during long-range transport of biomass burning from Canada to Central Europe in July 2013, J. Aerosol Sci., 101, 156–173, https://doi.org/10.1016/j.jaerosci.2016.08.006, 2016. a, b, c, d, e, f
Matus, A. V., L′Ecuyer, T. S., and Henderson, D. S.: New Estimates of Aerosol Direct Radiative Effects and Forcing From A-Train Satellite Observations, Geophys. Res. Lett., 46, 8338–8346, https://doi.org/10.1029/2019gl083656, 2019. a
McGarragh, G. R., Poulsen, C. A., Thomas, G. E., Povey, A. C., Sus, O., Stapelberg, S., Schlundt, C., Proud, S., Christensen, M. W., Stengel, M., Hollmann, R., and Grainger, R. G.: The Community Cloud retrieval for CLimate (CC4CL) – Part 2: The optimal estimation approach, Atmos. Meas. Tech., 11, 3397–3431, https://doi.org/10.5194/amt-11-3397-2018, 2018. a, b, c, d, e
Miller, S. D., Schmit, T. L., Seaman, C. J., Lindsey, D. T., Gunshor, M. M., Kohrs, R. A., Sumida, Y., and Hillger, D.: A Sight for Sore Eyes: The Return of True Color to Geostationary Satellites, B. Am. Meteorol. Soc., 97, 1803–1816, https://doi.org/10.1175/bams-d-15-00154.1, 2016. a
Morgan, G. W., Tolhurst, K. G., Poynter, M. W., Cooper, N., McGuffog, T., Ryan, R., Wouters, M. A., Stephens, N., Black, P., Sheehan, D., Leeson, P., Whight, S., and Davey, S. M.: Prescribed burning in south-eastern Australia: history and future directions, Aust. Forestry, 83, 4–28, https://doi.org/10.1080/00049158.2020.1739883, 2020. a
Mukai, S., Sano, I., and Nakata, M.: Improved Algorithms for Remote Sensing-Based Aerosol Retrieval during Extreme Biomass Burning Events, Atmosphere, 12, 403, https://doi.org/10.3390/atmos12030403, 2021. a, b, c
Nakajima, T. and King, M. D.: Determination of the Optical Thickness and Effective Particle Radius of Clouds from Reflected Solar Radiation Measurements. Part I: Theory, J. Atmos. Sci., 47, 1878–1893, https://doi.org/10.1175/1520-0469(1990)047<1878:dotota>2.0.co;2, 1990. a
NASA: Earthdata Search, NASA [data set], https://search.earthdata.nasa.gov/search, last access: 4 August 2023. a
North, P. and Henkel, A.: Sentinel-3 Optical Products and Algorithm Definition: SYN Algorithm Theoretical Basis Document, Swansea University, https://sentinels.copernicus.eu/documents/247904/0/SYN_L2-3_ATBD.pdf/8dfd9043-5881-4b38-aae5-86fb9034a94d (last access: 21 March 2023), 2010. a, b
Omar, A. H.: Development of global aerosol models using cluster analysis of Aerosol Robotic Network (AERONET) measurements, J. Geophys. Res., 110, D10S14, https://doi.org/10.1029/2004jd004874, 2005. a
Omar, A. H., Winker, D. M., Vaughan, M. A., Hu, Y., Trepte, C. R., Ferrare, R. A., Lee, K.-P., Hostetler, C. A., Kittaka, C., Rogers, R. R., Kuehn, R. E., and Liu, Z.: The CALIPSO Automated Aerosol Classification and Lidar Ratio Selection Algorithm, J. Atmos. Ocean. Tech., 26, 1994–2014, https://doi.org/10.1175/2009jtecha1231.1, 2009. a
Pan, X., Ichoku, C., Chin, M., Bian, H., Darmenov, A., Colarco, P., Ellison, L., Kucsera, T., da Silva, A., Wang, J., Oda, T., and Cui, G.: Six global biomass burning emission datasets: intercomparison and application in one global aerosol model, Atmos. Chem. Phys., 20, 969–994, https://doi.org/10.5194/acp-20-969-2020, 2020. a
Papanikolaou, C.-A., Kokkalis, P., Soupiona, O., Solomos, S., Papayannis, A., Mylonaki, M., Anagnou, D., Foskinis, R., and Gidarakou, M.: Australian Bushfires (2019–2020): Aerosol Optical Properties and Radiative Forcing, Atmosphere, 13, 867, https://doi.org/10.3390/atmos13060867, 2022. a, b
Petrenko, M., Kahn, R., Chin, M., and Limbacher, J.: Refined Use of Satellite Aerosol Optical Depth Snapshots to Constrain Biomass Burning Emissions in the GOCART Model, J. Geophys. Res.-Atmos., 122, 10,983–11,004, https://doi.org/10.1002/2017jd026693, 2017. a, b, c
Poulsen, C. A., Siddans, R., Thomas, G. E., Sayer, A. M., Grainger, R. G., Campmany, E., Dean, S. M., Arnold, C., and Watts, P. D.: Cloud retrievals from satellite data using optimal estimation: evaluation and application to ATSR, Atmos. Meas. Tech., 5, 1889–1910, https://doi.org/10.5194/amt-5-1889-2012, 2012. a, b, c, d
Povey, A., McGarragh, G., Proud, S., Poulsen, C., Thomas, G., Philipp, D., Prata, A., and Stengel, M.: ORAC-CC/orac: ORAC Code for DOI (v09-beta), Zenodo [code], https://doi.org/10.5281/zenodo.11217795, 2024. a
Prata, A. T., Grainger, R. G., Taylor, I. A., Povey, A. C., Proud, S. R., and Poulsen, C. A.: Uncertainty-bounded estimates of ash cloud properties using the ORAC algorithm: application to the 2019 Raikoke eruption, Atmos. Meas. Tech., 15, 5985–6010, https://doi.org/10.5194/amt-15-5985-2022, 2022. a, b
Reisen, F., Meyer, C. M., and Keywood, M. D.: Impact of biomass burning sources on seasonal aerosol air quality, Atmos. Environ., 67, 437–447, https://doi.org/10.1016/j.atmosenv.2012.11.004, 2013. a
Ribeiro, L. M., Viegas, D. X., Almeida, M., McGee, T. K., Pereira, M. G., Parente, J., Xanthopoulos, G., Leone, V., Delogu, G. M., and Hardin, H.: Extreme wildfires and disasters around the world, in: Extreme Wildfire Events and Disasters, Elsevier, 31–51, https://doi.org/10.1016/b978-0-12-815721-3.00002-3, 2020. a
Robbins, D., Poulsen, C., Siems, S., and Proud, S.: Improving discrimination between clouds and optically thick aerosol plumes in geostationary satellite data, Atmos. Meas. Tech., 15, 3031–3051, https://doi.org/10.5194/amt-15-3031-2022, 2022. a, b, c, d, e, f, g, h
Rodgers, C. D.: Inverse methods for atmospheric sounding: theory and practice, vol. 2, World Scientific, ISBN 9789814498685, 2000. a
Sayer, A. M., Thomas, G. E., and Grainger, R. G.: A sea surface reflectance model for (A)ATSR, and application to aerosol retrievals, Atmos. Meas. Tech., 3, 813–838, https://doi.org/10.5194/amt-3-813-2010, 2010. a
Sayer, A. M., Hsu, N. C., Lee, J., Bettenhausen, C., Kim, W. V., and Smirnov, A.: Satellite Ocean Aerosol Retrieval (SOAR) Algorithm Extension to S-NPP VIIRS as Part of the “Deep Blue” Aerosol Project, J. Geophys. Res.-Atmos., 123, 380–400, https://doi.org/10.1002/2017jd027412, 2018. a, b
Sayer, A. M., Hsu, N. C., Lee, J., Kim, W. V., and Dutcher, S. T.: Validation, Stability, and Consistency of MODIS Collection 6.1 and VIIRS Version 1 Deep Blue Aerosol Data Over Land, J. Geophys. Res.-Atmos., 124, 4658–4688, https://doi.org/10.1029/2018jd029598, 2019. a, b
Schmit, T. J., Griffith, P., Gunshor, M. M., Daniels, J. M., Goodman, S. J., and Lebair, W. J.: A Closer Look at the ABI on the GOES-R Series, B. Am. Meteorol. Soc., 98, 681–698, https://doi.org/10.1175/bams-d-15-00230.1, 2017. a
Schutgens, N., Sayer, A. M., Heckel, A., Hsu, C., Jethva, H., de Leeuw, G., Leonard, P. J. T., Levy, R. C., Lipponen, A., Lyapustin, A., North, P., Popp, T., Poulsen, C., Sawyer, V., Sogacheva, L., Thomas, G., Torres, O., Wang, Y., Kinne, S., Schulz, M., and Stier, P.: An AeroCom–AeroSat study: intercomparison of satellite AOD datasets for aerosol model evaluation, Atmos. Chem. Phys., 20, 12431–12457, https://doi.org/10.5194/acp-20-12431-2020, 2020. a
Sellitto, P., Belhadji, R., Kloss, C., and Legras, B.: Radiative impacts of the Australian bushfires 2019–2020 – Part 1: Large-scale radiative forcing, Atmos. Chem. Phys., 22, 9299–9311, https://doi.org/10.5194/acp-22-9299-2022, 2022. a
Shi, Y. R., Levy, R. C., Eck, T. F., Fisher, B., Mattoo, S., Remer, L. A., Slutsker, I., and Zhang, J.: Characterizing the 2015 Indonesia fire event using modified MODIS aerosol retrievals, Atmos. Chem. Phys., 19, 259–274, https://doi.org/10.5194/acp-19-259-2019, 2019. a, b, c, d, e
Sinyuk, A., Holben, B. N., Eck, T. F., Giles, D. M., Slutsker, I., Korkin, S., Schafer, J. S., Smirnov, A., Sorokin, M., and Lyapustin, A.: The AERONET Version 3 aerosol retrieval algorithm, associated uncertainties and comparisons to Version 2, Atmos. Meas. Tech., 13, 3375–3411, https://doi.org/10.5194/amt-13-3375-2020, 2020. a
Sorek-Hamer, M., Chatfield, R., and Liu, Y.: Review: Strategies for using satellite-based products in modeling PM2.5 and short-term pollution episodes, Environ. Int., 144, 106057, https://doi.org/10.1016/j.envint.2020.106057, 2020. a
Stamnes, K., Tsay, S.-C., Wiscombe, W., and Jayaweera, K.: Numerically stable algorithm for discrete-ordinate-method radiative transfer in multiple scattering and emitting layered media, Appl. Optics, 27, 2502, https://doi.org/10.1364/ao.27.002502, 1988. a
Sutherland, R. A. and Khanna, R. K.: Optical Properties of Organic-based Aerosols Produced by Burning Vegetation, Aerosol Sci. Tech., 14, 331–342, https://doi.org/10.1080/02786829108959495, 1991. a, b, c
Thomas, G. E., Carboni, E., Sayer, A. M., Poulsen, C. A., Siddans, R., and Grainger, R. G.: Oxford-RAL Aerosol and Cloud (ORAC): aerosol retrievals from satellite radiometers, in: Satellite Aerosol Remote Sensing over Land, Springer Berlin Heidelberg, 193–225, https://doi.org/10.1007/978-3-540-69397-0_7, 2009. a, b, c, d
Torres, O., Jethva, H., Ahn, C., Jaross, G., and Loyola, D. G.: TROPOMI aerosol products: evaluation and observations of synoptic-scale carbonaceous aerosol plumes during 2018–2020, Atmos. Meas. Tech., 13, 6789–6806, https://doi.org/10.5194/amt-13-6789-2020, 2020. a, b
van Donkelaar, A., Martin, R. V., Levy, R. C., da Silva, A. M., Krzyzanowski, M., Chubarova, N. E., Semutnikova, E., and Cohen, A. J.: Satellite-based estimates of ground-level fine particulate matter during extreme events: A case study of the Moscow fires in 2010, Atmos. Environ., 45, 6225–6232, https://doi.org/10.1016/j.atmosenv.2011.07.068, 2011. a, b, c
van Oldenborgh, G. J., Krikken, F., Lewis, S., Leach, N. J., Lehner, F., Saunders, K. R., van Weele, M., Haustein, K., Li, S., Wallom, D., Sparrow, S., Arrighi, J., Singh, R. K., van Aalst, M. K., Philip, S. Y., Vautard, R., and Otto, F. E. L.: Attribution of the Australian bushfire risk to anthropogenic climate change, Nat. Hazards Earth Syst. Sci., 21, 941–960, https://doi.org/10.5194/nhess-21-941-2021, 2021. a
Vogel, A., Alessa, G., Scheele, R., Weber, L., Dubovik, O., North, P., and Fiedler, S.: Uncertainty in Aerosol Optical Depth From Modern Aerosol-Climate Models, Reanalyses, and Satellite Products, J. Geophys. Res.-Atmos., 127, e2021JD035483, https://doi.org/10.1029/2021jd035483, 2022. a
Walter, C. M., Schneider-Futschik, E. K., Knibbs, L. D., and Irving, L. B.: Health impacts of bushfire smoke exposure in Australia, Respirology, 25, 495–501, https://doi.org/10.1111/resp.13798, 2020. a
Wei, X., Chang, N.-B., Bai, K., and Gao, W.: Satellite remote sensing of aerosol optical depth: advances, challenges, and perspectives, Crit. Rev. Env. Sci. Tec., 50, 1640–1725, https://doi.org/10.1080/10643389.2019.1665944, 2019. a
Wen, B., Wu, Y., Xu, R., Guo, Y., and Li, S.: Excess emergency department visits for cardiovascular and respiratory diseases during the 2019–20 bushfire period in Australia: A two-stage interrupted time-series analysis, Sci. Total Environ., 809, 152226, https://doi.org/10.1016/j.scitotenv.2021.152226, 2022. a
Winker, D. M., Vaughan, M. A., Omar, A., Hu, Y., Powell, K. A., Liu, Z., Hunt, W. H., and Young, S. A.: Overview of the CALIPSO Mission and CALIOP Data Processing Algorithms, J. Atmos. Ocean. Tech., 26, 2310–2323, https://doi.org/10.1175/2009jtecha1281.1, 2009. a
Yang, X., Zhao, C., Yang, Y., and Fan, H.: Long-term multi-source data analysis about the characteristics of aerosol optical properties and types over Australia, Atmos. Chem. Phys., 21, 3803–3825, https://doi.org/10.5194/acp-21-3803-2021, 2021. a
Ye, X., Deshler, M., Lyapustin, A., Wang, Y., Kondragunta, S., and Saide, P.: Assessment of Satellite AOD during the 2020 Wildfire Season in the Western U. S., Remote Sens.-Basel, 14, 6113, https://doi.org/10.3390/rs14236113, 2022. a
Yoshida, M., Kikuchi, M., Nagao, T. M., Murakami, H., Nomaki, T., and Higurashi, A.: Common Retrieval of Aerosol Properties for Imaging Satellite Sensors, J. Meteorol. Soc. Jpn. Ser. II, 96B, 193–209, https://doi.org/10.2151/jmsj.2018-039, 2018. a, b, c
Zhang, W., Xu, H., and Zheng, F.: Aerosol Optical Depth Retrieval over East Asia Using Himawari-8/AHI Data, Remote Sens.-Basel, 10, 137, https://doi.org/10.3390/rs10010137, 2018. a
Zhong, Q., Schutgens, N., van der Werf, G., van Noije, T., Tsigaridis, K., Bauer, S. E., Mielonen, T., Kirkevåg, A., Seland, Ø., Kokkola, H., Checa-Garcia, R., Neubauer, D., Kipling, Z., Matsui, H., Ginoux, P., Takemura, T., Le Sager, P., Rémy, S., Bian, H., Chin, M., Zhang, K., Zhu, J., Tsyro, S. G., Curci, G., Protonotariou, A., Johnson, B., Penner, J. E., Bellouin, N., Skeie, R. B., and Myhre, G.: Satellite-based evaluation of AeroCom model bias in biomass burning regions, Atmos. Chem. Phys., 22, 11009–11032, https://doi.org/10.5194/acp-22-11009-2022, 2022. a
Zhuravleva, T. B., Kabanov, D. M., Nasrtdinov, I. M., Russkova, T. V., Sakerin, S. M., Smirnov, A., and Holben, B. N.: Radiative characteristics of aerosol during extreme fire event over Siberia in summer 2012, Atmos. Meas. Tech., 10, 179–198, https://doi.org/10.5194/amt-10-179-2017, 2017. a, b, c, d, e
- Abstract
- Introduction
- Data sources
- Methodology
- Results and discussion
- Conclusions
- Appendix A: Himawari-8 band 3 versus MODIS green bands
- Appendix B: VIIRS and Sentinel-3 case studies
- Code and data availability
- Author contributions
- Competing interests
- Disclaimer
- Acknowledgements
- Financial support
- Review statement
- References