the Creative Commons Attribution 4.0 License.
the Creative Commons Attribution 4.0 License.
 | 04 Jun 2024
Characterisation of particle single-scattering albedo with a modified airborne dual-wavelength CAPS monitor
Edouard Pangui
Kevin Tu
Mathieu Cazaunau
Maxime Feingesicht
Landsheere Xavier
Thierry Bourrianne
Vincent Michoud
Christopher Cantrell
Timothy B. Onasch
Andrew Freedman
Paola Formenti
Atmospheric aerosols impact the Earth's climate system directly by scattering and absorbing solar radiation, and it is important to characterise the aerosol optical properties in detail. This study reports the development and validation of an airborne dual-wavelength cavity-attenuated phase-shift (CAPS) single monitor, named A2S2 (Aerosol Absorption Spectral Sizer), based on the commercial CAPS single-scattering albedo monitor (CAPS-PMSSA; Aerodyne), to simultaneously measure the aerosol optical scattering and extinction at both 450 and 630 nm wavelengths. Replaced pressure and temperature sensors and an additional flow control system were incorporated into the A2S2 for its utilisation on board research aircraft measuring within the troposphere. The evaluation of A2S2 characteristics was performed in the laboratory and included the investigation of the signal-to-noise ratio, validation of performance at various pressure levels, optical closure studies and intercomparing with the currently validated techniques. The chamber experiments show that the A2S2 can perform measurements at sample pressures as low as 550 hPa and at sample temperatures as high as 315 K. Based on the Allan analysis results, we have evaluated that the minimum detection limit of the measurements shows that the measurements have a limit accuracy of ∼ 2 Mm−1 at 450 nm and ∼ 1 Mm−1 at 630 nm for 1 Hz measurements of both scattering coefficients (σsca) and extinction coefficients (σext). The optical closure study with size-selected polystyrene latex (PSL) particles shows that the truncation error of the A2S2 is negligible for particles with particle volume diameter (Dp) < 200 nm, while, for the larger sub-micrometre particles, the measurement uncertainty of A2S2 increases but remains less than 20 %. The average factors to correct the truncation error are 1.13 and 1.05 for 450 and 630 nm, respectively. A simplified truncation correction, dependent on the scattering Ångström exponent (SAE), was developed to rectify truncation errors of the future A2S2 field measurement data. The σsca and σext measured by the A2S2 show good agreement with the concurrent measured results from the nephelometer and the CAPS particle extinction monitor (CAPS-PMex). The absorption coefficient (σabs) derived through the extinction-minus-scattering (EMS) method by the A2S2 also corresponds with the results obtained from the aethalometer. The A2S2 was successfully deployed during an aircraft measurement campaign (Atmospheric ChemistRy Of the Suburban foreSt – ACROSS) conducted in the vicinity of Paris and the surrounding regions. The average SSA measured during the entire ACROSS flight campaign is 0.86 and 0.88 at 450 and 630 nm, respectively, suggesting that light-absorbing organic aerosols play a significant role. The average SAE and absorption Ångström exponent (AAE) varied due to measurements in various pollution conditions. The results presented in this study indicate that the A2S2 instrument is reliable for measuring aerosol σsca and σext at both blue and red wavelengths, and it stands as a viable substitute for future airborne evaluations of aerosol optical properties.
- Article
(7581 KB) - Full-text XML
-
Supplement
(1261 KB) - BibTeX
- EndNote


Atmospheric aerosols, particularly light-absorbing carbonaceous aerosols and mineral dust, play a significant role in global radiative transfer by scattering and absorbing solar radiation directly, a phenomenon referred to as the direct aerosol effect (Jacobson, 2012; Riemer et al., 2019; Liu et al., 2020). It is known that the radiative forcing impact of aerosols is mainly driven by three important parameters (Haywood and Shine, 1995): the aerosol optical depth (AOD), the single-scattering albedo (SSA) and the asymmetry parameter (g). The AOD is the integration of extinction coefficients over a certain path length, and it represents the optically active concentration fields. The SSA is derived from the ratio between the scattering and extinction. As it quantifies the fraction of the incoming light that is scattered by a particle or substance compared to the portion that gets absorbed, the SSA is the key parameter to determine the overall uncertainty in aerosol direct and semi-direct effects. The g parameter quantifies the preferential directions of light photons that are scattered by particles.
To obtain the aerosol optical properties, various measurements have been conducted by satellites and suborbital instruments in recent decades. Suborbital measurement mainly encompasses airborne and ground-based in situ and remote-sensing measurements. At present, Earth-orbiting satellite networks (e.g. MODIS) provide comprehensive global coverage of AOD distributions. However, the capability of satellites to acquire quantitative aerosol optical properties, specifically the spectral dependence of SSA, is still limited, and the need is evident for new intensive airborne measurements to constrain the aerosol microphysical properties assumption and vertical structure to improve space-based remote-sensing retrieval algorithms (Peers et al., 2019; Kahn et al., 2023). Various in situ techniques exist to derive different aerosol optical properties. For the absorption coefficient (σabs) measurements, the filter-based technique is commonly employed by online measurement instruments such as the aethalometer (Hansen et al., 1984) (e.g. AE33, Magee Scientific, used in this study; Drinovec et al., 2015), the Particle Soot Absorption Photometer (PSAP, Radiance Research) (Bond et al., 1999), the Multi-Angle Absorption Photometer (MAAP, Thermo Scientific) (Petzold and Schönlinner, 2004) and the Tricolor Absorption Photometer (TAP/CLAP) (Ogren et al., 2017). In the filter-based technique, light transmittance of a filter is continuously monitored, and the σabs is derived through the transmittance changes caused by particles deposited onto the filter. A major disadvantage of this method is the non-negligible multi-scattering effect of filter material and the deposited particles, and this issue is related to several factors including relative aerosol loading, humidity and SSA (Moosmüller et al., 2009). For example, the filter-based absorption measurement method utilised by PSAP requires corrections to account for alterations in both scattering aerosol loading and aerosol transmissions (Virkkula et al., 2005; Virkkula, 2010). Moreover, the relatively slow measurement frequency of the filter-based measurement techniques makes them not ideal for the airborne measurements due to their slow time resolution, especially during altitude profiles. The scattering coefficient (σsca) is commonly characterised by the nephelometry technique. The nephelometer analyses the particle scattering intensity collected in a wide but limited range of scattering angles (7–170°), causing the loss of near-forward and near-backward scattering characterisation, a phenomenon commonly referred to as the truncation error (Heintzenberg and Charlson, 1996). Technological advancements have allowed more precise direct measurements of the aerosol extinction coefficient (σext). The extinction coefficient can be characterised by cavity ring-down spectroscopy (CRD) (Moosmüller et al., 2005; Baynard et al., 2007), cavity-attenuated phase-shift (CAPS) (Kebabian et al., 2005; Kebabian et al., 2007) and sun photometry (Karol et al., 2013; Schmid et al., 2003).
In this study, we focus on the development and deployment of a CAPS-based instrument for airborne applications. The CAPS-based instrument employs a light-emitting diode (LED) as its light source, and the σext is derived by quantifying the variations in the phase shift of the distorted waveform caused by the modulated light passing through a highly reflective optical cell. Compared to the custom-built CRD-based instrument, the CAPS-based instrument is compact and robust. The CAPS particle extinction monitor (CAPS-PMex) instrument (Massoli et al., 2010), developed by Aerodyne Inc., utilises the CAPS technique to enable highly sensitive in situ measurements of the extinction coefficient. Based on the same CAPS technique, Aerodyne Inc. introduced the CAPS single-scattering albedo monitor (CAPS-PMSSA) to derive both the extinction and scattering measurements in the same sample cell (Onasch et al., 2015). The CAPS-PMSSA incorporates an integrating sphere, which minimises the bias of the light collections with respect to angle when measuring σsca, and the σabs can also be derived indirectly through the extinction-minus-scattering (EMS) method. Compared to the measurements obtained by combining separate instruments (e.g. one nephelometer for σsca and one filter-based instrument for σabs), the CAPS-PMSSA offers distinct advantages as there is no need to employ different time or wavelength averaging or inlet differences into consideration to derive the aerosol optical properties. The application of CAPS-PMSSA makes significant progress in the characterisation of aerosol optical properties, and the CAPS-PMSSA has been deployed in several different laboratory- and ground-based ambient measurement studies (Han et al., 2017; Zhao et al., 2017; Corbin et al., 2018, 2020, 2022).
The properties, including fast response and compact size, make CAPS-PMSSA an ideal instrument for the airborne measurements of aerosol optical properties. Nevertheless, to address the requirements of aerosol optical property measurement from airborne platforms, an improved flow control system is required to maintain the instrument flows under the reduced-pressure conditions that are common during the airborne measurements. In addition, a crucial requirement is to conduct dual-wavelength measurements within the same sample volume; thus a redesigned inlet was required. In this paper, we describe the modification and characterisation of a new airborne dual CAPS-PMSSA (450 and 630 nm) measurement system, the Aerosol Absorption Spectral Sizer (A2S2), and the validation of its performance through laboratory experiments and in situ airborne measurements within the area around Paris (Île-de-France). The A2S2 measurements are compared to the results from performance-validated instruments. When the A2S2 is provided with vertical profiles of climate-relevant properties such as aerosol single-scattering albedo and aerosol optical depth, its measurement results can play a role in helping the evaluation of the direct and semi-direct radiative effects in modelling studies and contribute to future advancements and validation of aerosol remote-sensing products (Formenti et al., 2018).
2.1 CAPS-PMSSA
The design of the CAPS-PMSSA is described in Onasch et al. (2015), and the diagram of CAPS-PMSSA is presented in Fig. 1a. Briefly, the CAPS-based technique consists of two high-reflectivity mirrors (∼ 99.99 % reflectivity) within the sample cell, and this configuration yields a long effective optical path length. An Aerodyne-manufactured LED light is used as the input light source and is available at multiple wavelengths ranging from 450 to 780 nm. The customised LED input light is square-wave-modulated (typically at 17 kHZ), and the detected waveform is distorted and exhibits a phase shift at the fundamental frequency of the initial modulation. This phase shift is related to various factors including the instrument geometric properties and the presence of optically active aerosol particles. Hence, the σext is determined as changes in the phase shift between the measurement when particles are introduced into the optical cavity and the particle-free baseline measurement. Shown in Fig. 1, an additional integrating sphere with an inner diameter of 10 cm is used to characterise the σsca.
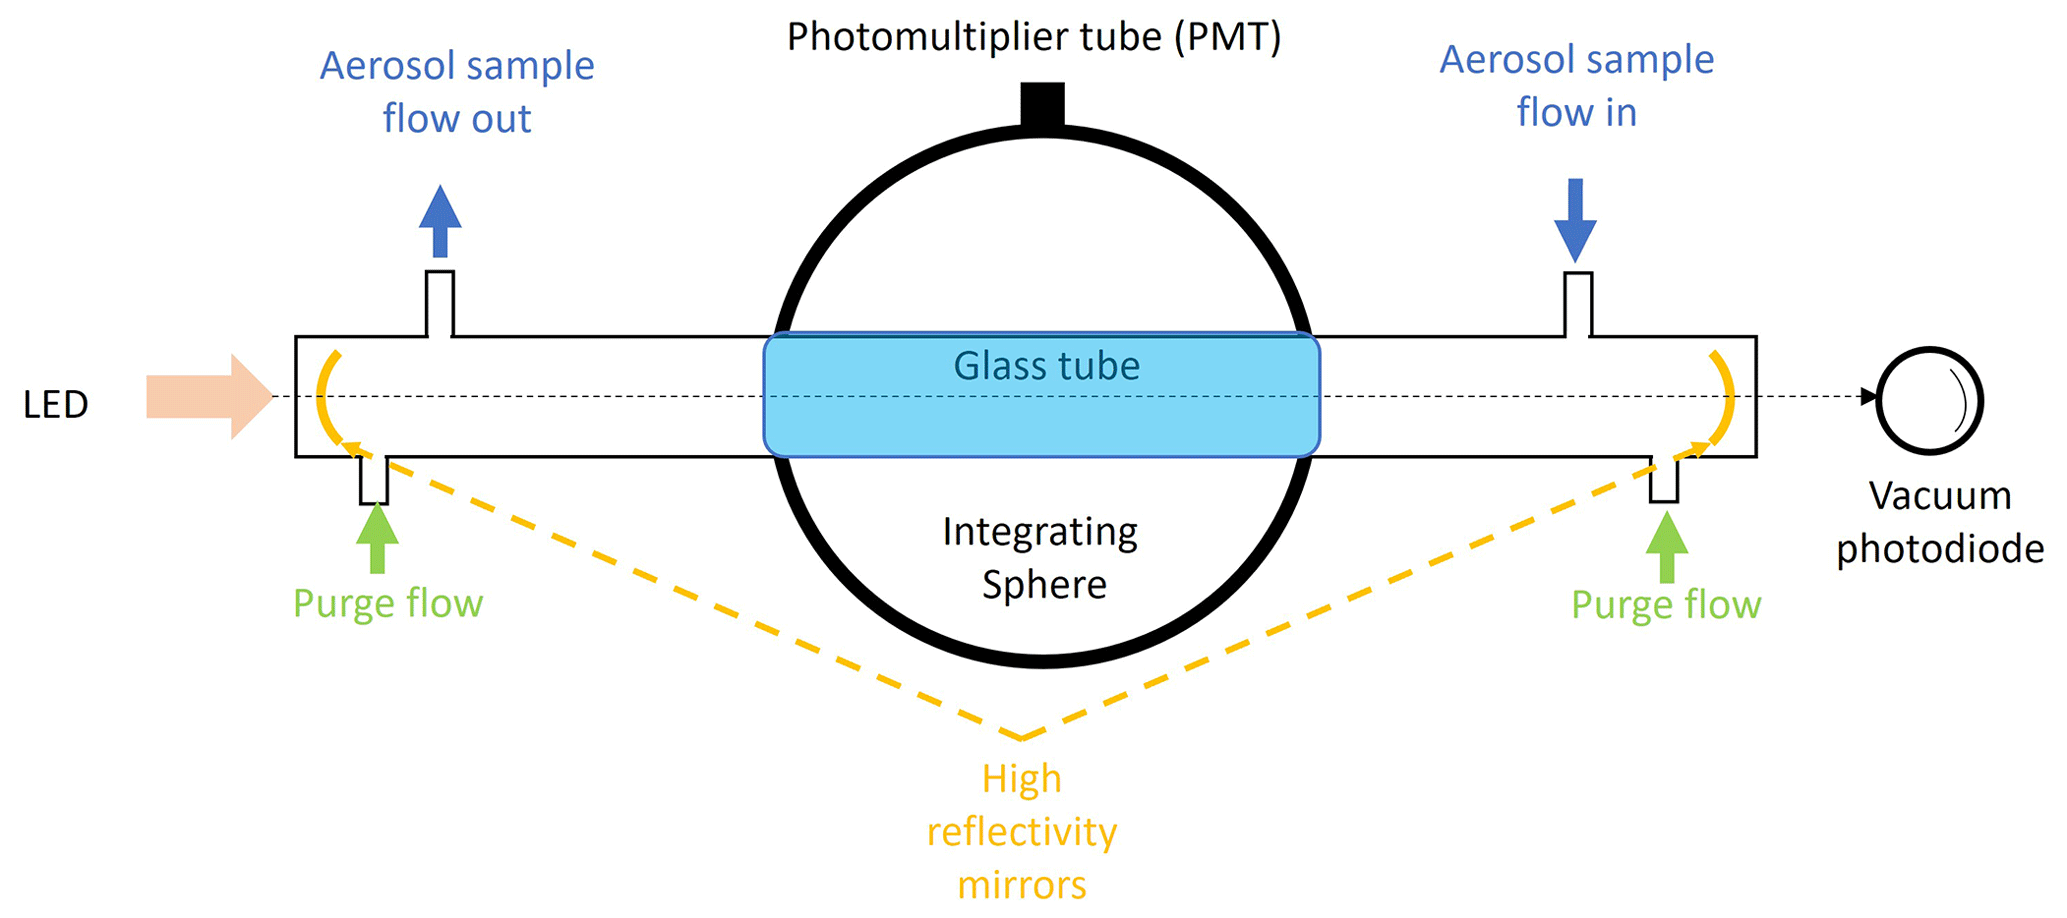
Figure 1The diagram of the sample cell of the CAPS-PMSSA (adapted from Modini et al., 2021).
The inner surface of the sphere is coated with highly reflective material and shows a Lambertian reflectivity efficiency of 98 %. A photomultiplier tube (PMT, Hamamatsu) module is then used to sample the scattered light and output the signal for further processing. The integrating spherical design helps maximise the PMT collection efficiency of scattered light and reduce the measurement bias related to truncation angles.
2.2 Aerosol Absorption Spectral Sizer (A2S2)
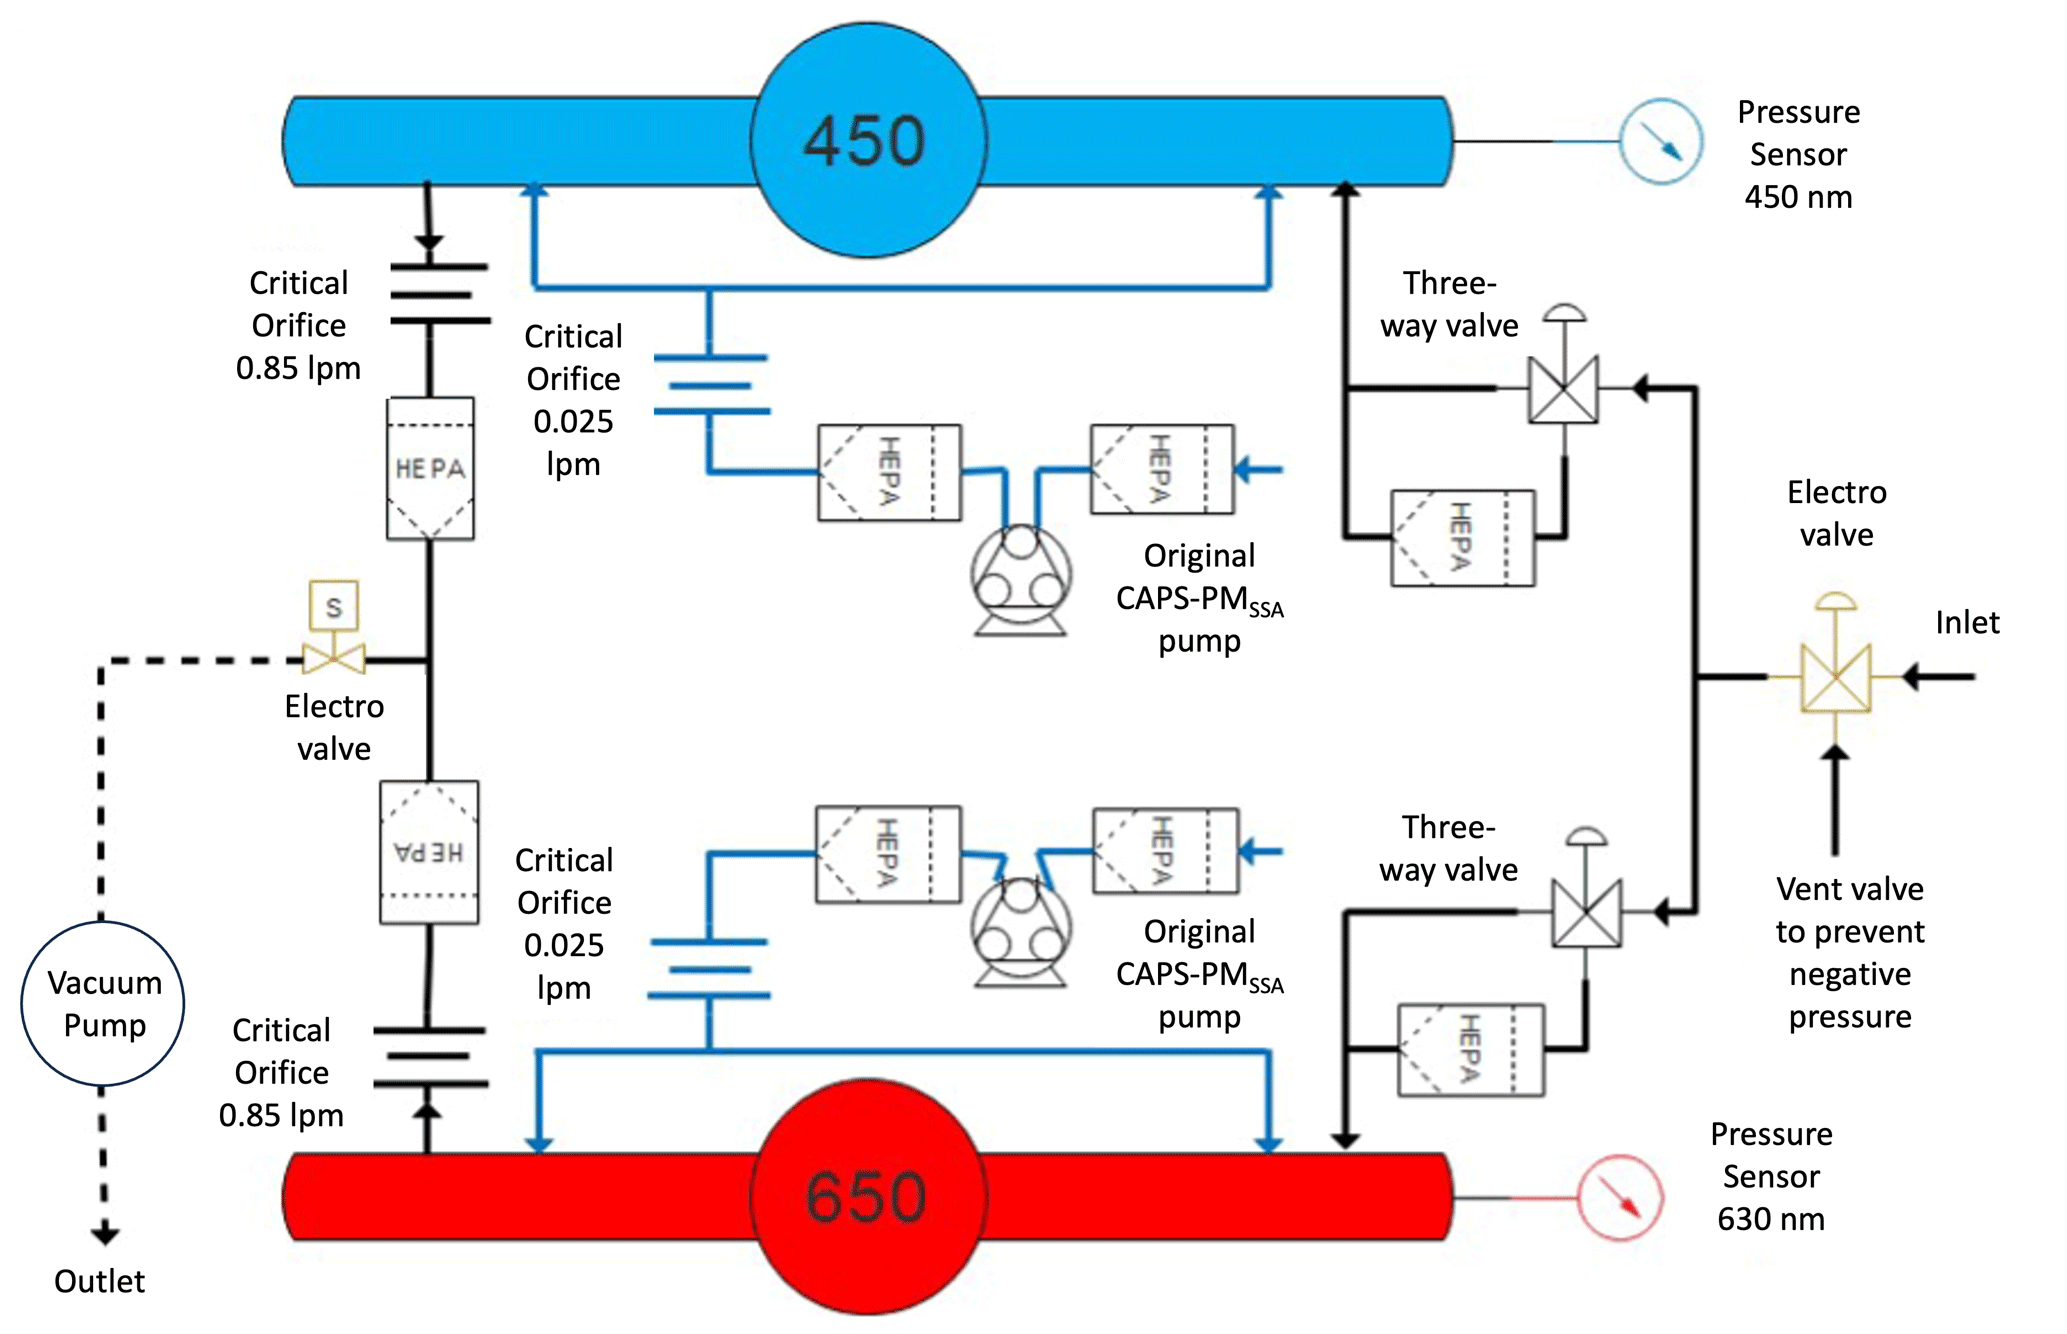
To achieve dual-wavelength measurements of aerosol extinction and scattering at the same time and with airborne capabilities, we integrated two CAPS-PMSSA sample cells (450 and 630 nm, respectively) into a single measurement package that is designated A2S2. The diagram of the A2S2 is shown in Fig. 2. The inlet was redesigned to meet the requirements of dual-wavelength measurements within the same sample volume, and the particle loss rate for the modified inlet system is estimated to be less than 10 % for the particles with diameters up to 4 µm using the simulation method of von der Weiden et al. (2009). The flow system was modified by incorporating a separated sampling pump into the system, and it provides a constant sample flow rate of ∼ 1.7 litres per minute (L min−1) (∼ 0.85 L min−1 for each cell), which is regulated by the critical orifice within each sample cell. A three-way solenoid valve was placed upstream of each sampling cell to enable the instrument to switch between baseline mode and sampling mode. The purge flow is generated by the same diaphragm pump as the original CAPS-PMSSA, providing a continuous flow at a rate of 0.025 L min−1, also regulated by critical orifices which serve to prevent the high-reflectivity mirrors from contamination by deposited particles. Existing temperature and pressure sensors of CAPS-PMSSA were replaced with new temperature (DS18B20 by Maxim Integrated) and pressure (A-10-12719316 by WIKA) sensors, ensuring accurate monitoring of temperature and pressure to detect any leaking during airborne measurements. The new pressure sensor has a measurement range from 0 to 40 000 hPa (within 0.5 % uncertainties), while the range for the new temperature sensor is −55–125 °C (± 0.5 °C). The performance validation tests of the new pressure sensor are presented in the Supplement. A custom software interface was developed to control the entire A2S2 system and output the instrument data including the sensors. The response time of A2S2 is 1 Hz, and it is programmed to carry out a continuous measurement phase for 2 min, which is succeeded by a period of 1 min dedicated to cell flushing and establishing the baseline characteristics.
2.3 Laboratory validation
The laboratory performance validation of A2S2 was performed at the Laboratoire Interuniversitaire des Systèmes Atmosphériques (LISA) in Créteil, France. These tests include the characterisation of signal-to-noise ratio, the performance under reduced pressure and elevated temperature conditions, the angular truncation, and intercomparison with the other optical measurement instruments.
The signal-to-noise ratio was tested by conducting continuous measurements of aerosol-free air for several hours, and this was achieved by sampling the A2S2 though a HEPA filter (TSI). Auto baseline characterisation was disabled throughout the characterisation period. Then the Allan variance (Allan, 1966) was determined to assess the stability and noise characteristics of the measurements over different averaging timescales. Due to the potentially lower aerosol loading from the airborne measurements compared to the ground-based measurements, the Allan variance approach is useful to assess the stability of the A2S2 as modified. The Allan variance is also helpful for selecting the appropriate data filtering or processing approaches to improve the measurement precision.
To validate the performance of the A2S2 under low-pressure conditions at high altitudes and the potentially high temperature environment within the cabin during low-altitude airborne measurements, we conducted an intercomparison study at controlled pressure and temperature levels. This involved connecting both the modified CAPS-PMSSA at 630 nm sampling cell and the original CAPS-PMex at 630 nm (Aerodyne Inc.) to the Multiphase Atmospheric Experimental Simulation Chamber (CESAM). The details of the CESAM facility are described in Wang et al. (2011). The configuration of the experiment is presented in the Supplement. The experiment started with the addition of ammonium sulfate particles (∼ 250 µg) into the chamber at standard pressure (1013.25 hPa), and then the pressure within the chamber was pumped to decrease the pressure stepwise to 900, 800, 700, 550, 400 and 200 hPa. Each pressure level was maintained for least ∼ 30 min. In addition, the CAPS-PMSSA 630 nm was placed in a temperature-controlled box, and the temperature was set to increase gradually from ∼ 300 K (∼ 26.8 °C) to ∼ 315 K (∼ 41.9 °C) to simulate the high-temperature condition within the cabin, while the CAPS-PMex was exposed to the ambient atmosphere. In this experiment, both the modified CAPS-PMSSA 630 nm and the CAPS-PMex 630 nm were set to perform a 12 min duty cycle, which includes 10 min of measurements and 2 min of flushing and baseline characterisation. The results from both CAPS-PMSSA and CAPS-PMex have been corrected to standard temperature (273.15 K) and pressure (1013.25 hPa) conditions using measurements from the modified pressure and temperature sensors for intercomparison. Due to the pumping of the sampling instrument, the chamber dilution is corrected following the description described in Lamkaddam et al. (2017):
where σcorrected(t) is the dilution corrected coefficient at time t, σmeasured(t) is the measured coefficient at time t, Δσmeasured(Δt) is the change of measured coefficient over time Δt, v is the CESAM volume (4200 L) and Qp is the total flow rate of CESAM.
The angular truncation error of the A2S2 is quantified by comparing the measured scattering coefficient with the scattering coefficient derived from Mie theory calculations. The configuration of the truncation characterisation experiment is shown in Fig. 3a. Nebulised and dried polystyrene latex (PSL) spheres with standard particle volume equivalent diameters (Dp) of 200, 350, 500, 600 and 800 nm were selected by an aerodynamic aerosol classifier (AAC; Cambustion). The schematic and validation of the AAC are described in a previous publication (Tavakoli and Olfert, 2013). The AAC can generate monodisperse distributions of particles based on their aerodynamic sizes according to particle relaxation time without needing charging electrostatic elements. In contrast to electrostatic aerosol classifiers, such as the differential mobility analyser (DMA), the AAC can provide monodisperse results that are less affected by particle compositions, morphologies and sizes. The aerodynamic diameter of the PSL particles is converted to volume diameter following the methods described in previous publications (Decarlo et al., 2004; Yu et al., 2022). The particle density and the shape factor of PSL particles were determined to be 1.05 g cm−3 and 1 (perfect sphere), respectively, and the refractive index of PSL particles is 1.59+0i. A condensation particle counter (CPC; TSI 3775) and the A2S2 were placed downstream of the AAC, and the CPC was used to record the total PSL particle number concentration at each AAC-selected size point. The scattering efficiency at 450 and 630 nm over all the angles (0–180°) at selected Dp () is calculated by Mie theory for spherical homogeneous particles following the methods described by Bohren and Huffman (1983). The measured truncation error of the A2S2 is defined as the ratio between the scattering efficiency measured () and that calculated from Mie theory :
where N is the average number concentration over the sampling period measured by CPC.
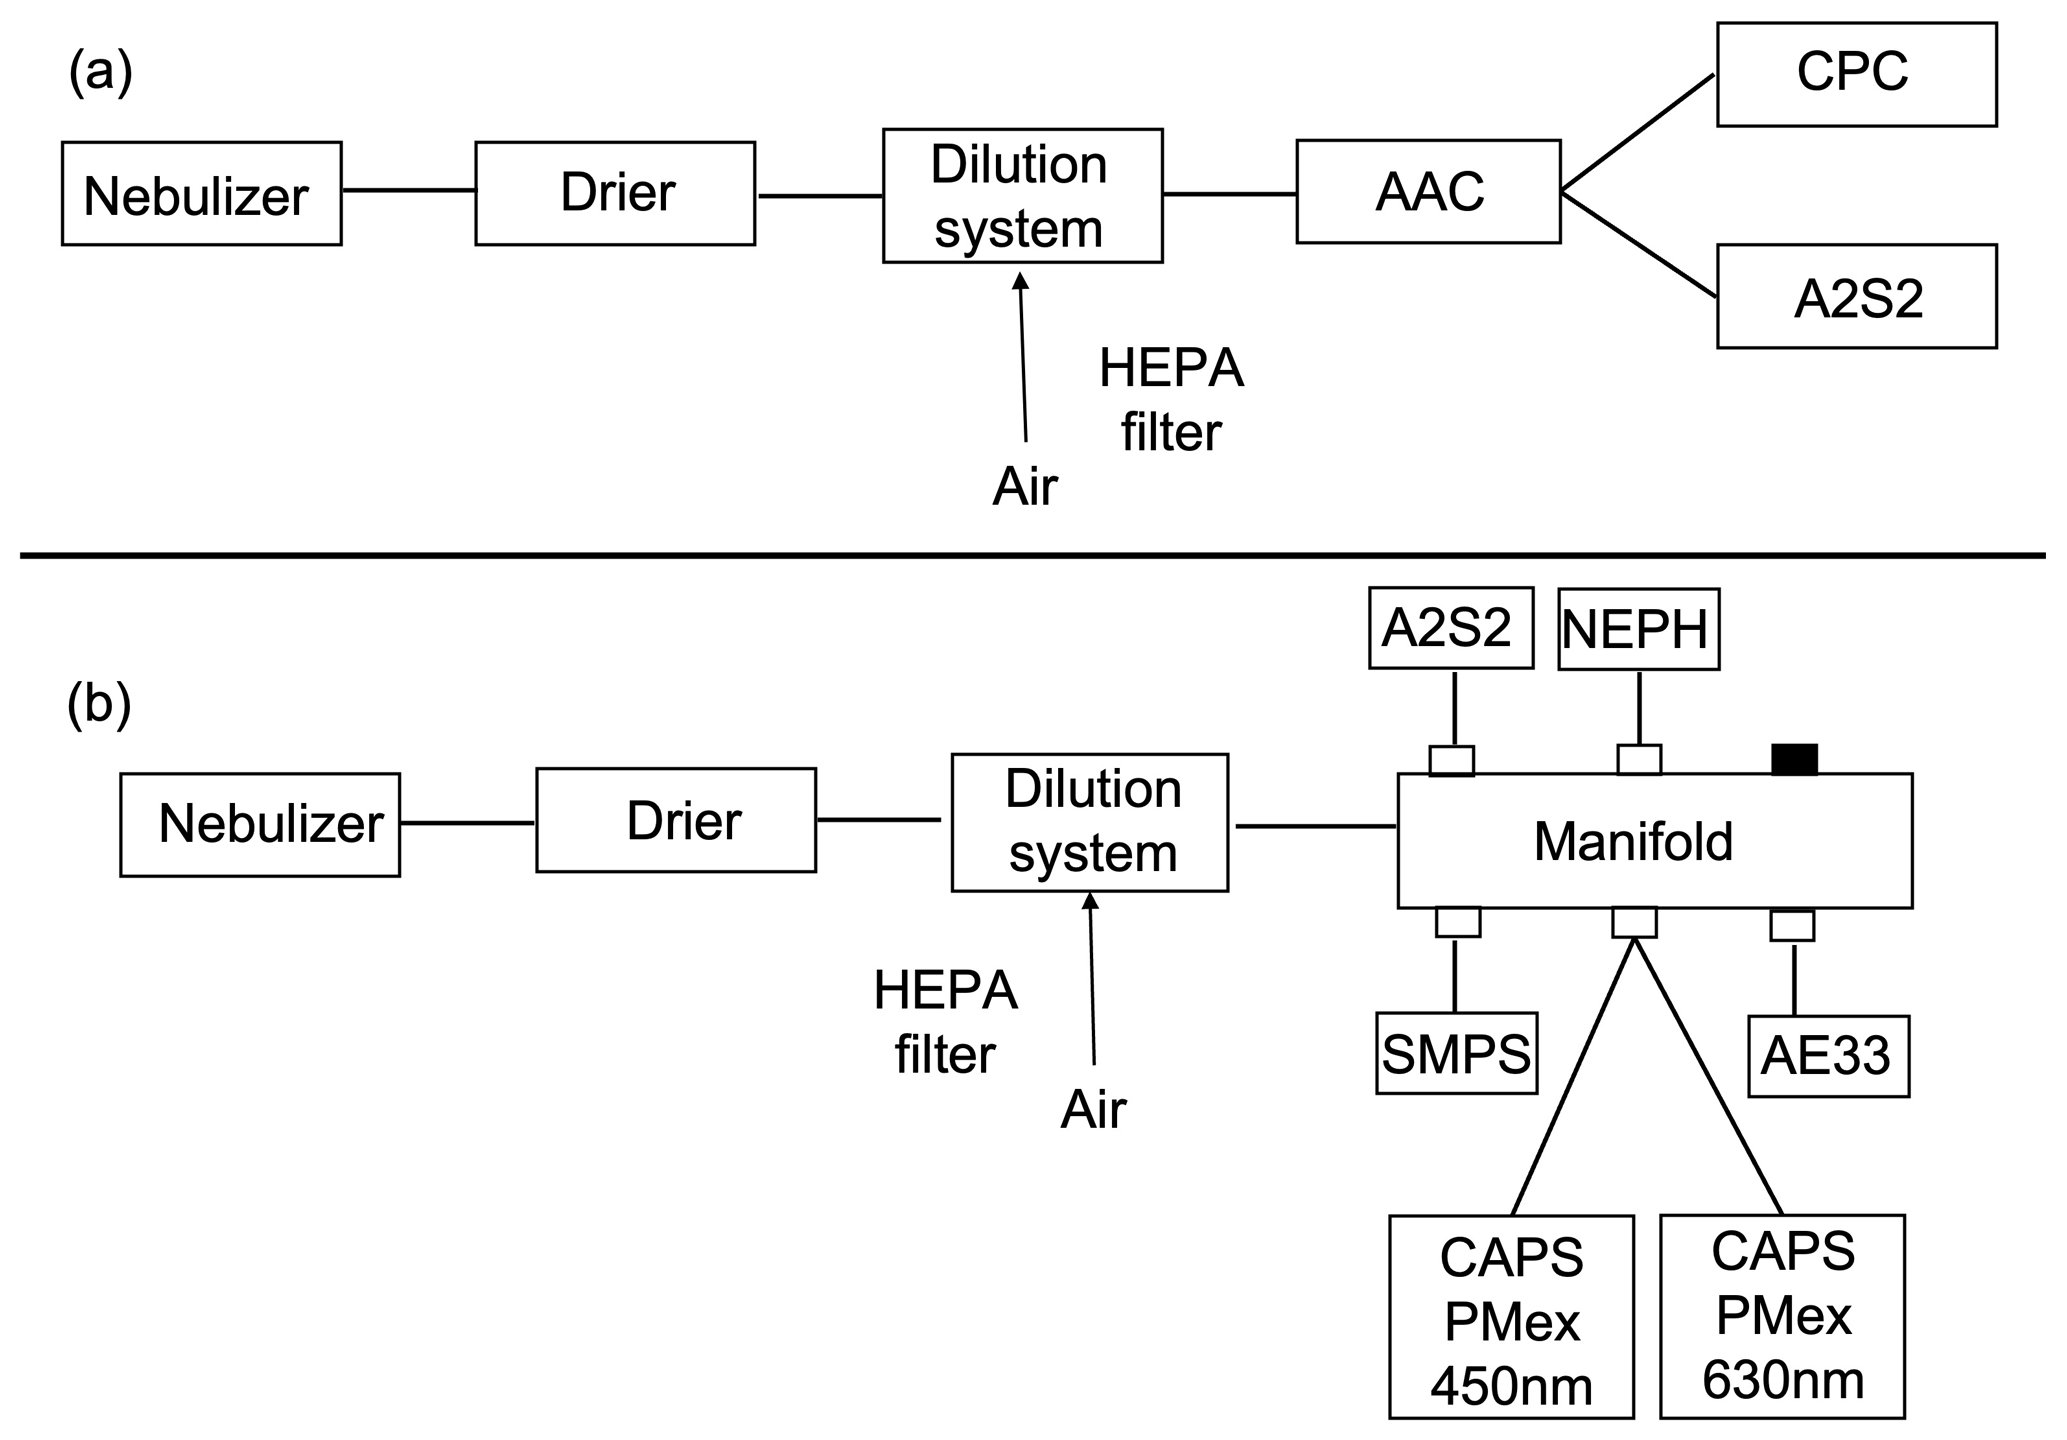
Figure 3Instrument settings for (a) the truncation error characterisation and (b) the intercomparison study.
Table 1Instruments used in the intercomparison experiments performed in the laboratory.
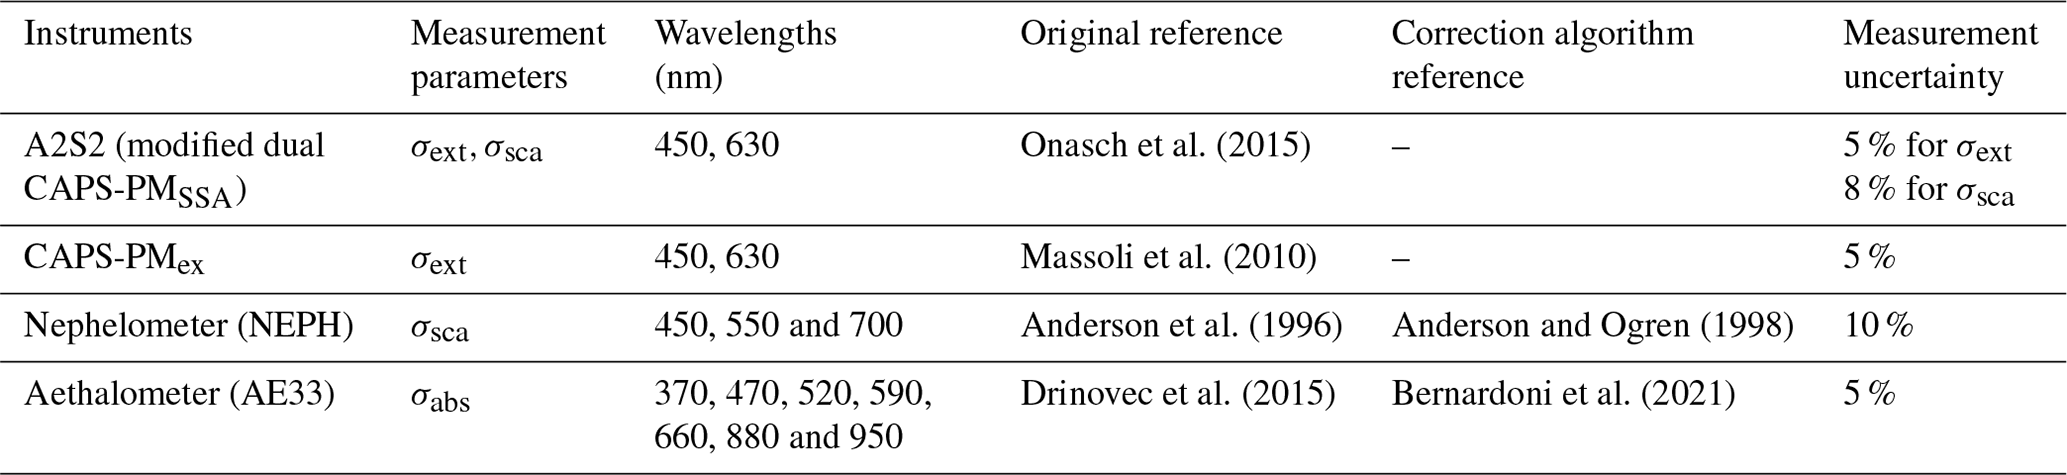
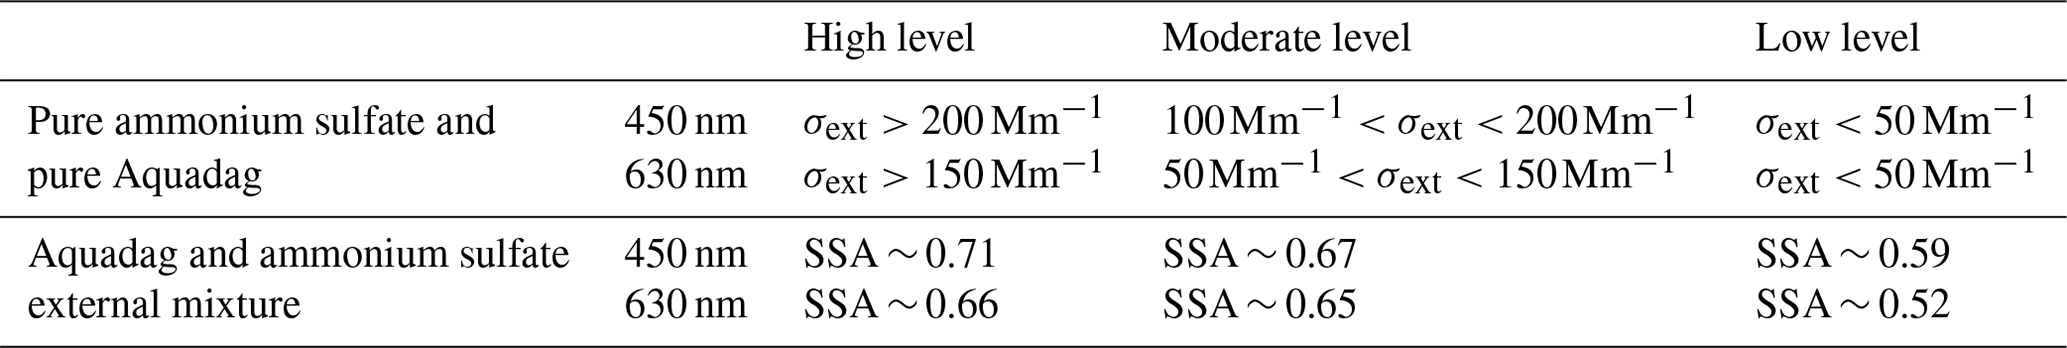
Table 2Expected σext and SSA at varying levels for the pure aerosol and aerosol mixture intercomparison measurement studies, respectively.
Intercomparison of A2S2 with the nephelometer (NEPH; TSI 3563), two CAPS-PMex (450 and 630 nm, Aerodyne Inc.) and Aethalometer-33 (AE33; Magee Scientific) was performed using the nebulised standard particles. In addition, a scanning mobility particle sizer (SMPS; TSI) was used for the aerosol size distribution measurements. The SMPS comprised a DMA (TSI 3081) and a CPC (TSI 3775). A detailed list of the intercomparison instruments and the correction method references are presented in Table 1, and the setting of the intercomparison experiments is shown in Fig. 3b. Briefly, the NEPH measures scattering coefficient at 450, 550 and 700 nm; the AE33 characterises the aerosol absorption coefficient at seven wavelengths ranging from 370 to 950 nm; and the two CAPS-PMex instruments measure the σext at 450 and 630 nm. Three case studies were conducted including pure ammonium sulfate (99.99 %, Merck KGaA), pure Aquadag (Aqueous Deflocculated Acheson Graphite; Acheson Industries Inc.), and an external mixture of Aquadag and ammonium sulfate (as presented in Table 2). Each sampling period had constant σext and σsca levels and was measured for 10 min. The NEPH was calibrated with CO2 before the lab experiments, and the truncation error of NEPH was corrected following the correction algorithm described in Anderson and Ogren (1998). The multiple-scattering correction factor of the AE33 was determined following the polar photometer approach factor introduced by Bernardoni et al. (2021). For comparisons at the appropriate wavelengths, the NEPH and AE33 results have been scaled using the Ångström exponent approach using Eq. (3):
where xAE is the scattering, absorption or extinction Ångström exponent (SAE, AAE, EAE) and and represent the scattering, absorption or extinction coefficient at wavelengths λ1 and λ2, respectively. The absorption or the scattering coefficient (σλ) at a given wavelength (λ) can be derived through Eq. (4):
where is the absorption or scattering coefficient at the wavelength λ0. In this study the scattering coefficient at 630 nm for the NEPH is derived through measurements at 700 nm, and the absorption coefficient at 450 and 630 nm for the AE33 is derived through absorption measurements at 470 and 660 nm, respectively.
The measurement uncertainty is also listed in Table 1. For the A2S2, the uncertainty of the σabs derived from the EMS method is 13 % according to Onasch et al. (2015) and Pfeifer et al. (2020). The uncertainties for the Ångström exponent are derived through the Gaussian error propagations (Weber et al., 2022):
where xAE represents EAE, AAE or SAE and Δσ represents the measurement uncertainty of the extinction, absorption and scattering coefficient measurement at certain wavelengths.
2.4 Airborne measurements
The French environmental research aircraft ATR-42 managed by Service des Avions Français Instruments pour la Recherche en Environnement (SAFIRE) was used to sample urban pollution as part of the Atmospheric ChemistRy Of the Suburban foreSt (ACROSS) project (Cantrell and Michoud, 2022). Airborne measurements were performed between 13 June and 7 July 2022 over the Paris suburban areas (Île-de-France) and surrounding regions, as presented in Fig. 4. Measurements were performed mostly within the boundary layer with an altitude around 300 m above ground level (a.g.l). Altitude profile measurements were carried out by ascending to ∼ 3500 m a.g.l. on 18, 21, 23 and 27 June.
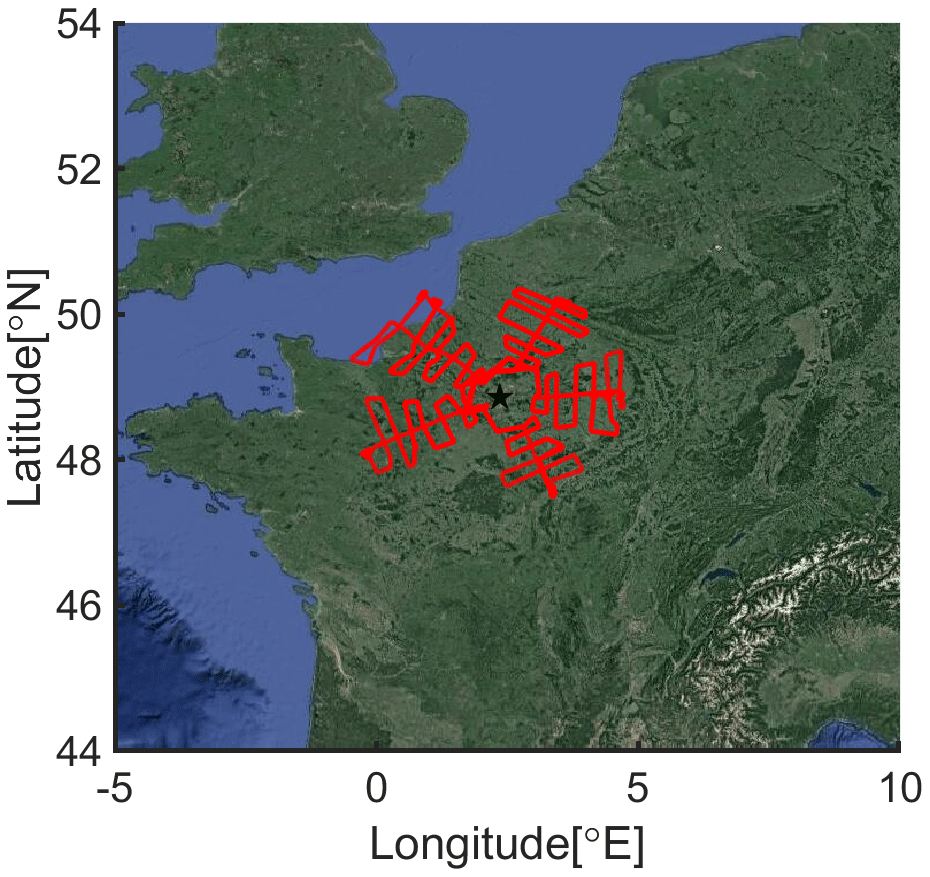
Figure 4Flight patterns utilised during the ACROSS campaign. The red line shows the aircraft flight tracks, and the star symbol shows the location of Paris (from © Google Maps).
On board the aircraft, both the A2S2 and the NEPH were connected to the AVIRAD measurement system. The AVIRAD system consists of an isoaxial and isokinetic inlet which has a collection efficiency of 50 % for particles with 12 µm optical diameters (Formenti et al., 2011), with various sampling instruments connected to the inlet. The AVIRAD has been deployed on multiple airborne projects including dust events and pollution characterisations (Di Biagio et al., 2015, 2016). The NEPH was calibrated with CO2 and corrected for truncation error through the methods described by Anderson and Ogren (1998). Presented later in Fig. 10, the average and median SSA during the ACROSS airborne measurement period exceeded 0.7. Massoli et al. (2009) indicate that the uncertainties associated with applying the truncation correction method, as outlined by Anderson and Ogren (1998), to NEPH scattering are within 5 % when the SSA is greater than 0.7. Due to the complex configuration of the spherical nephelometer within the A2S2, it is challenging to apply the conventional truncation correction approaches (Modini et al., 2021). As an alternative, the A2S2 is corrected based on the average truncation characterisation results obtained in the lab. To enhance the signal-to-noise ratio, the data have been averaged over 10 s for all the flights, and all the data have been corrected to standard temperature (273.15 K) and pressure (1013.25 hPa) for intercomparison. Before the airborne measurement experiments, the scattering channels of A2S2 were calibrated by nebulised polystyrene latex (PSL) spheres of 200 nm (SSA of 1) following the normal CAPS-PMSSA calibration procedure.
3.1 Laboratory instrument validation results
3.1.1 Signal-to-noise ratio
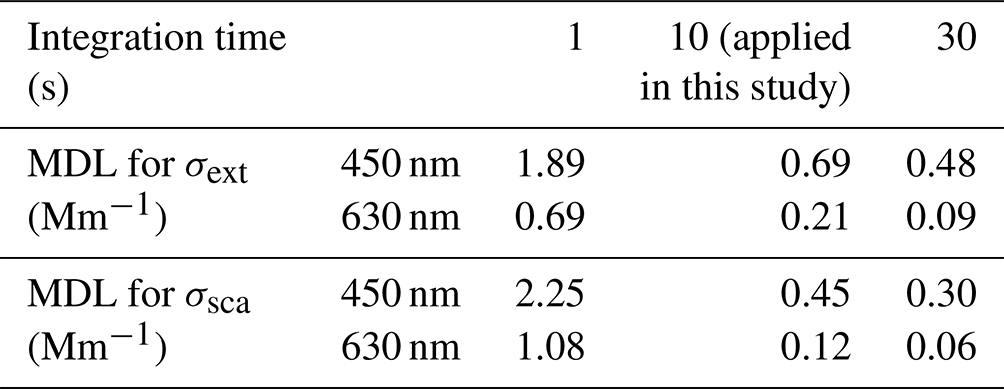
The Allan variance analysis is presented in Fig. 5. The Allan standard deviation for the 450 nm extinction measurement increases with integration time after 40 s. This is due to the σext baseline being assumed to remain constant by the A2S2 over the signal-to-noise experiment period, but the actual contribution of the ambient gas-phase species (mainly NO2) absorption to the total extinction varies with extinction time (Massoli et al., 2010). The uncertainty should be less during ambient measurements if the baseline is characterised more frequently than once per hour in operation. Nonetheless, the previous study by Pfeifer et al. (2020) shows that the variation in the gas-phase σext baseline at 450 nm for the CAPS-PMex may lead to an uncertainty up to around 0.8 for the ambient σext characterisations. To minimise the uncertainty of the baseline variation in CAPS-based instruments, a frequent baseline characterisation is needed. In this study, measurements were conducted at locations distant from the emission sources, and baseline values were measured every 2 min to reduce the influence from the background signal. The Allan standard deviation for the 630 nm extinction and scattering measurements is smaller compared to the 450 nm measurements, and the extinction measurement at 630 nm is less influenced by baseline drift issues. The minimum detection limit (MDL) involves a calculation derived from 3 times the Allan standard deviation, and the detection limit at integration times of 1, 10 and 30 s is presented in Table 3. Our laboratory results show that, at a measurement frequency of 1 Hz, the MDL is 1.89 Mm−1 for σext and 2.25 Mm−1 for σsca at 450 nm. At 630 nm, the MDL is 0.69 Mm−1 for σext and 1.08 Mm−1 for σsca. With the increase in integration time to 10 s, the limits are reduced to 0.69 and 0.21 Mm−1 for σext at 450 and 630 nm, respectively, and to 0.45 and 0.12 Mm−1 for σsca at 450 and 630 nm, respectively. The Allan analysis indicates that the limit of detection reaches its minimum value at an integration time of 30 s. Nevertheless, in the case of ACROSS airborne measurements, there is a requirement for high-frequency results to effectively characterise aerosol optical properties, especially during instances when the research aircraft intercepted with urban plumes or conducted altitude profile measurements. The minimum σext and σsca observed during the ACROSS campaign are both ∼ 1.35 Mm−1 at 450 nm and both ∼ 0.32 Mm−1 at 630 nm. Hence, the detection limit achieved with a 10 s integration time is deemed satisfactory to fulfil the requirements of the ACROSS project measurement.
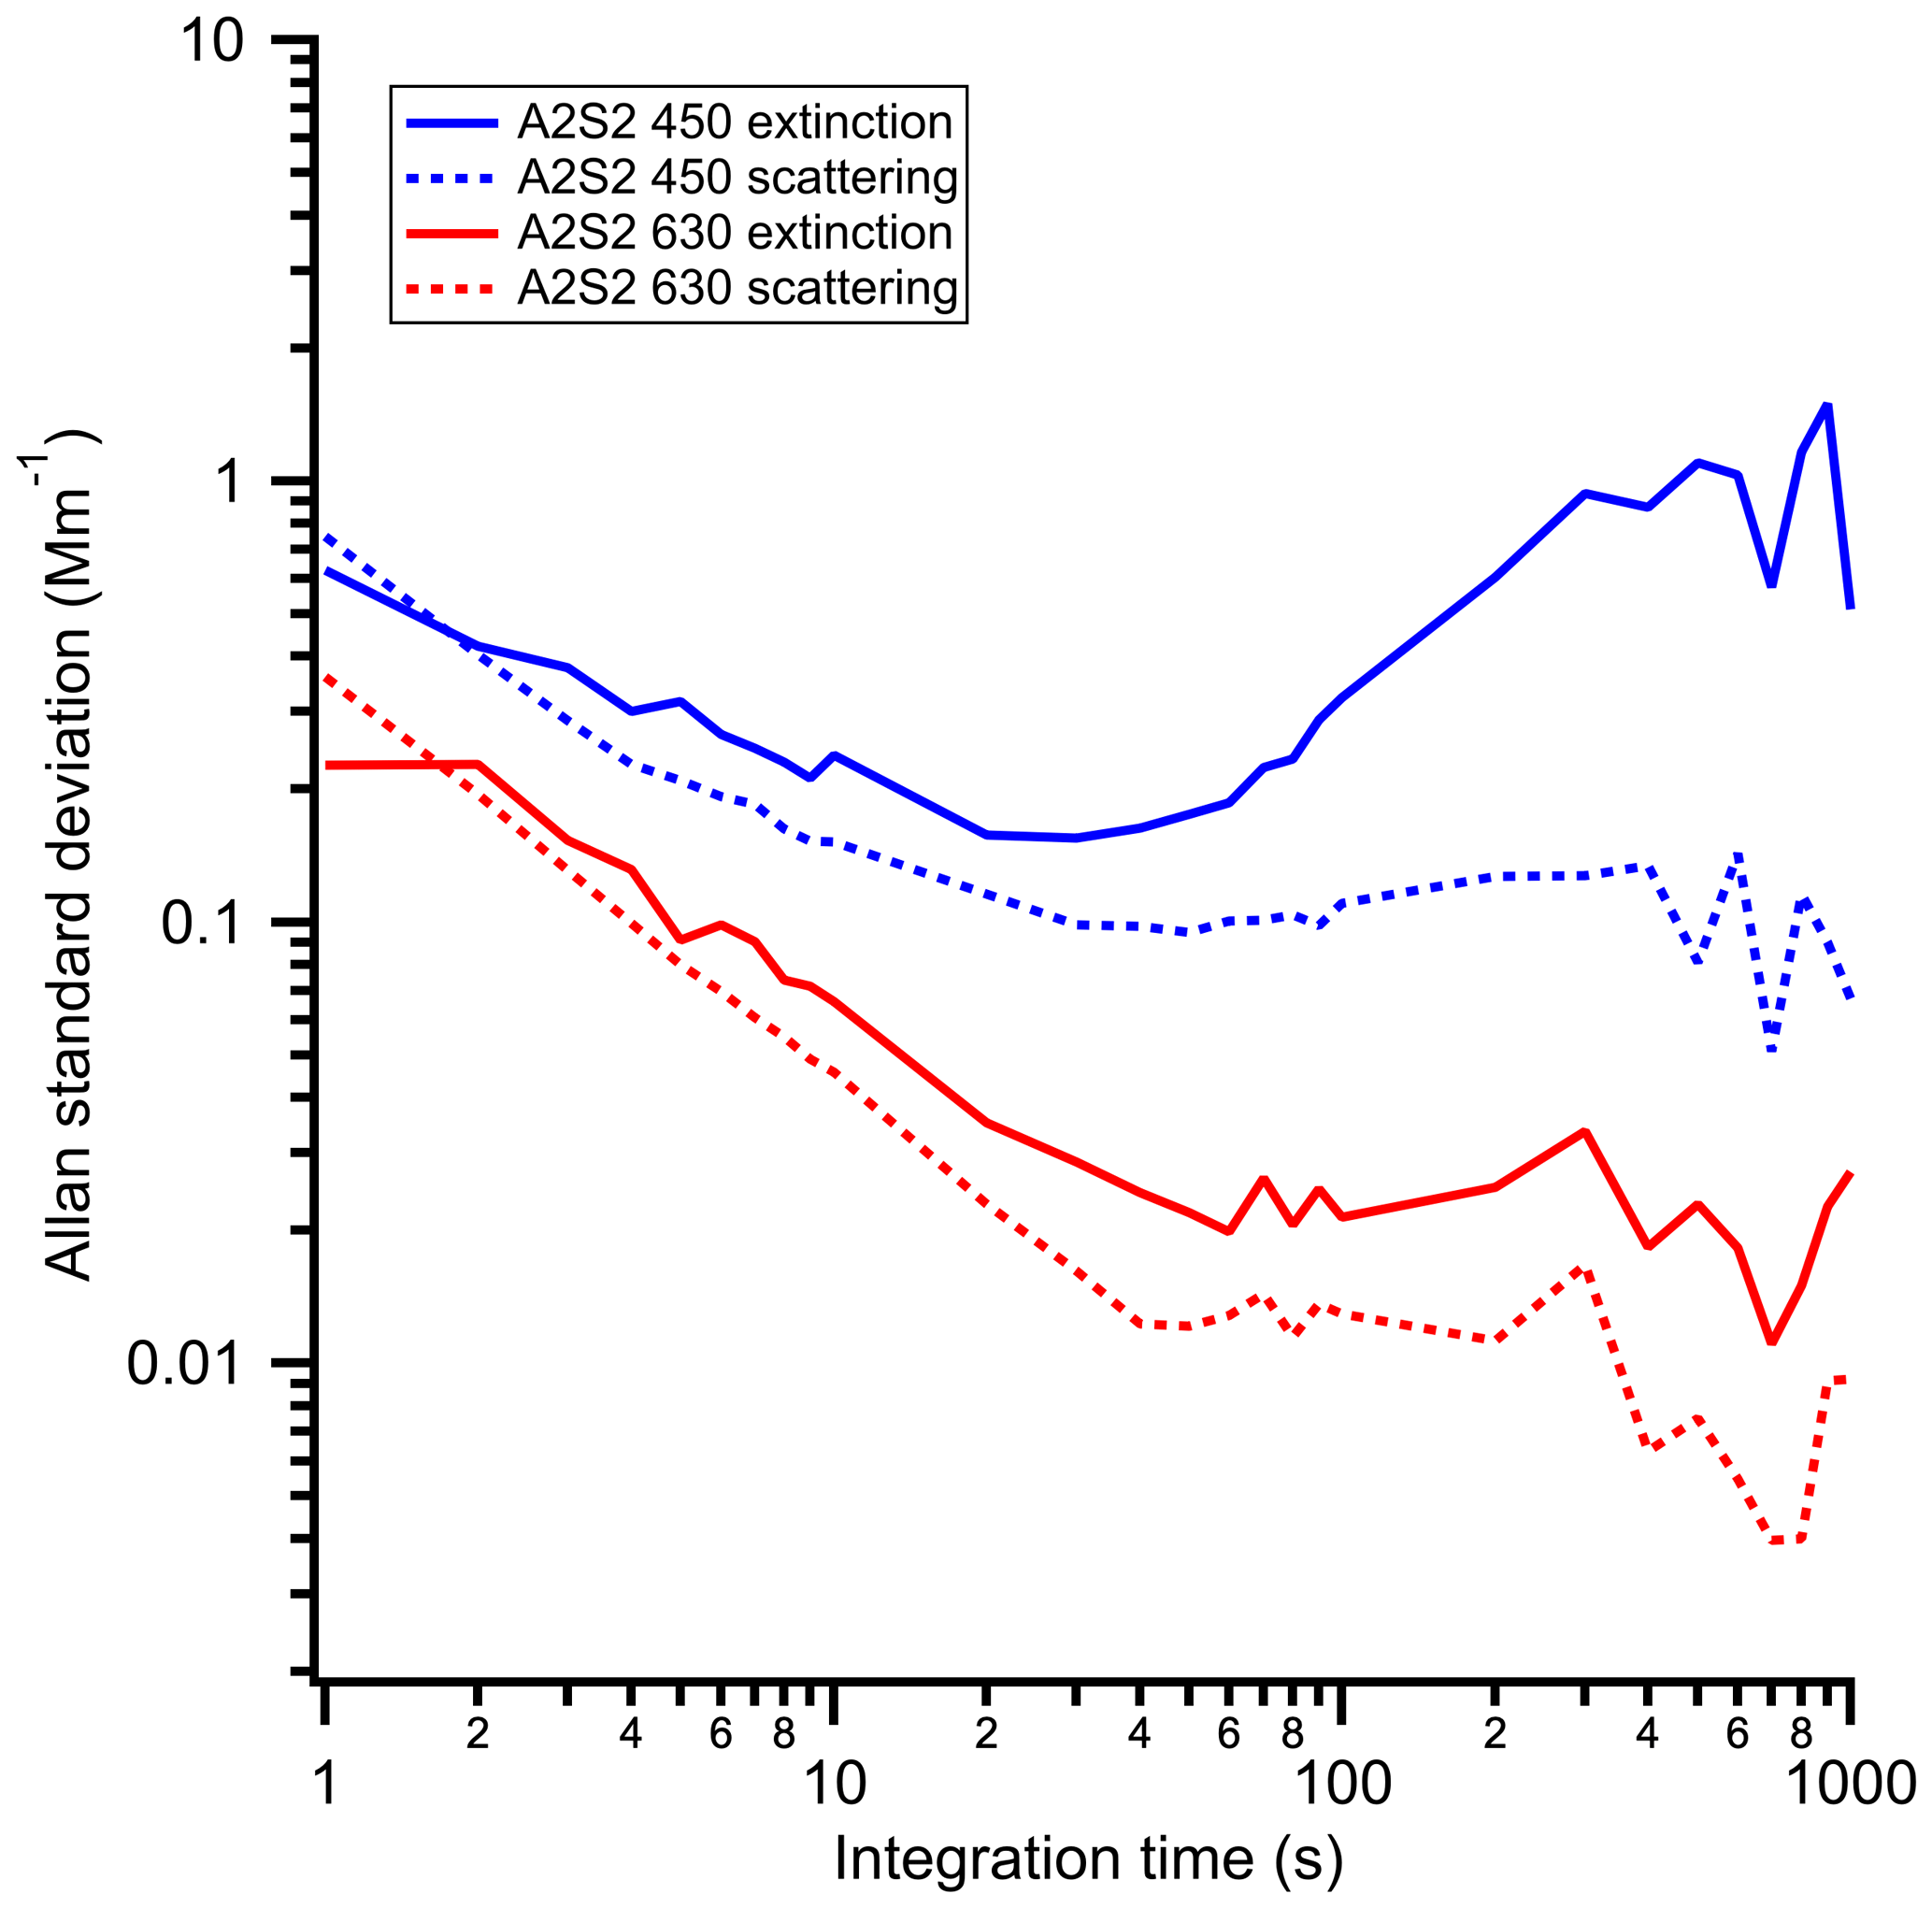
Table 3Minimum detection limit (MDL) of A2S2 at an integration time of 1, 10 and 30 s.
3.1.2 Performance under simulated low-pressure environment
Figure 6 presents the results of the chamber measurements made at various controlled pressure levels, and the temperature of the modified CAPS-PMSSA increased slowly to 315 K after the injection of the ammonium sulfate. The dilution- and STP-corrected σext measured by the original CAPS-PMex unit agrees well with the σext from the modified CAPS-PMSSA at a constant pressure of ∼ 1013.25 and ∼ 900 hPa. However, our original CAPS-PMex unit is unable to deliver an accurate measurement when the pressure within the chamber drops to 800 hPa or less. The σext and σsca reported by the modified CAPS-PMSSA showed minimal impact until the pressure reached ∼ 550 hPa. When the pressure drops further to ∼ 400 hPa, the signal noise level increases. The chamber experiment results validate that our modification to the CAPS-PMSSA can provide accurate measurements with ambient pressures as low as 550 hPa and instrument temperatures as high as 315 K.
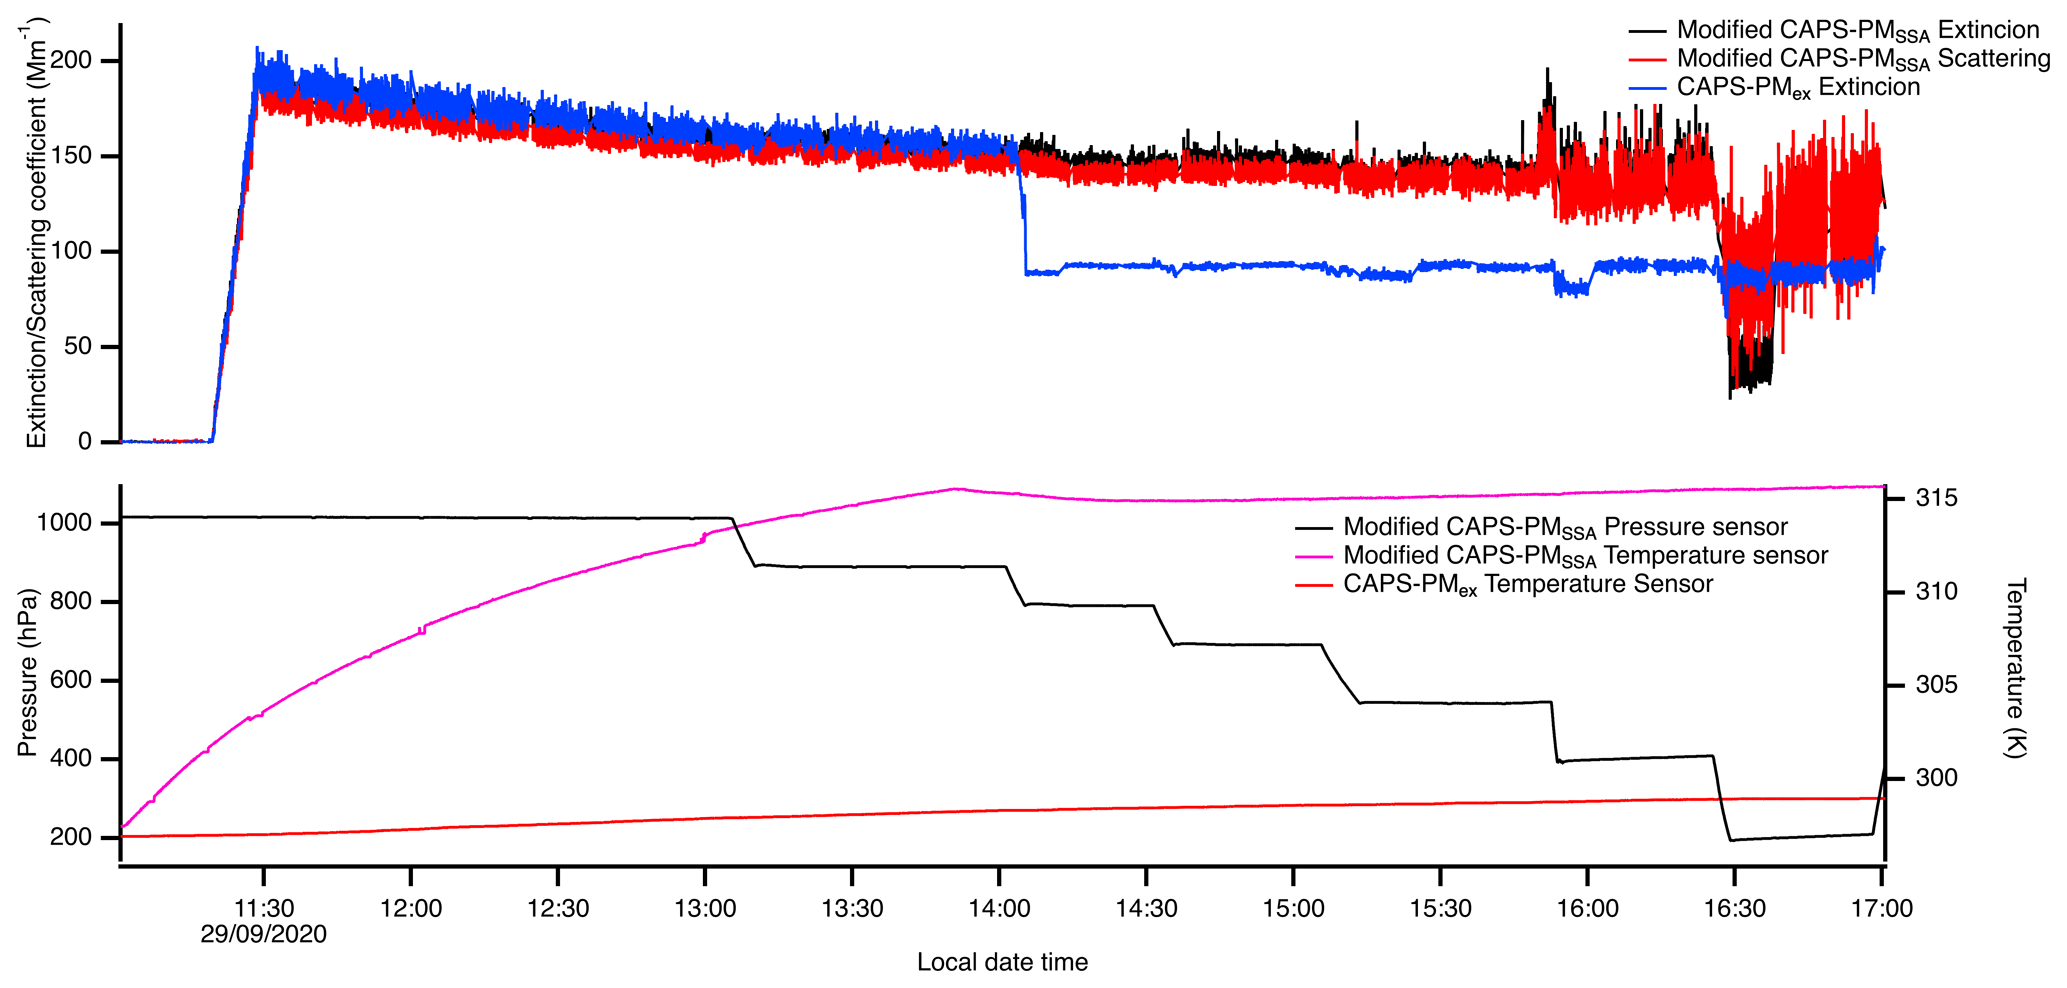
Figure 6σext measured by CAPS-PMex at 630 nm and σext and σsca measured by CAPS-PMSSA at several pressures; the temperature changes were applied to the CAPS-PMSSA.
3.1.3 Angular truncation characterisation and correction
Figure 7 presents the data collected to determine the truncation of the A2S2 instrument at 450 and 630 nm wavelengths. The truncation measured and simulated by Onasch et al. (2015) and Modini et al. (2021) are also included for comparison. Compared to the simulation reported by Onasch et al. (2015) (MieAmigo), Modini et al. (2021) account for the reflection of scattering light from the inner surface of the glass sampling tube within the integrating nephelometer, and this reflection phenomenon is simulated for a path length range of 0 to 4.7 cm. Hence the two simulation methods are referred to as simulation with and without reflection. At both 450 and 630 nm wavelengths, the AAC-selected PSL particle results show that the truncation for particles with Dp up to 200 nm is insignificant, and the truncation uncertainty is less than 10 % for particles with Dp up to 400 nm. For larger submicron particle size (Dp between 400 and 1000 nm), the truncation of 630 nm wavelengths is around 10 %, while the truncation of 450 nm is greater and is around 20 %. This observation is consistent with observations in the Rayleigh scattering regime, where larger particles exhibit near-forward scattering that is not captured by the CAPS-PMSSA. The average truncation error for particles with Dp between 200 and 1000 nm is 0.86 and 0.94 at 450 and 630 nm, respectively.
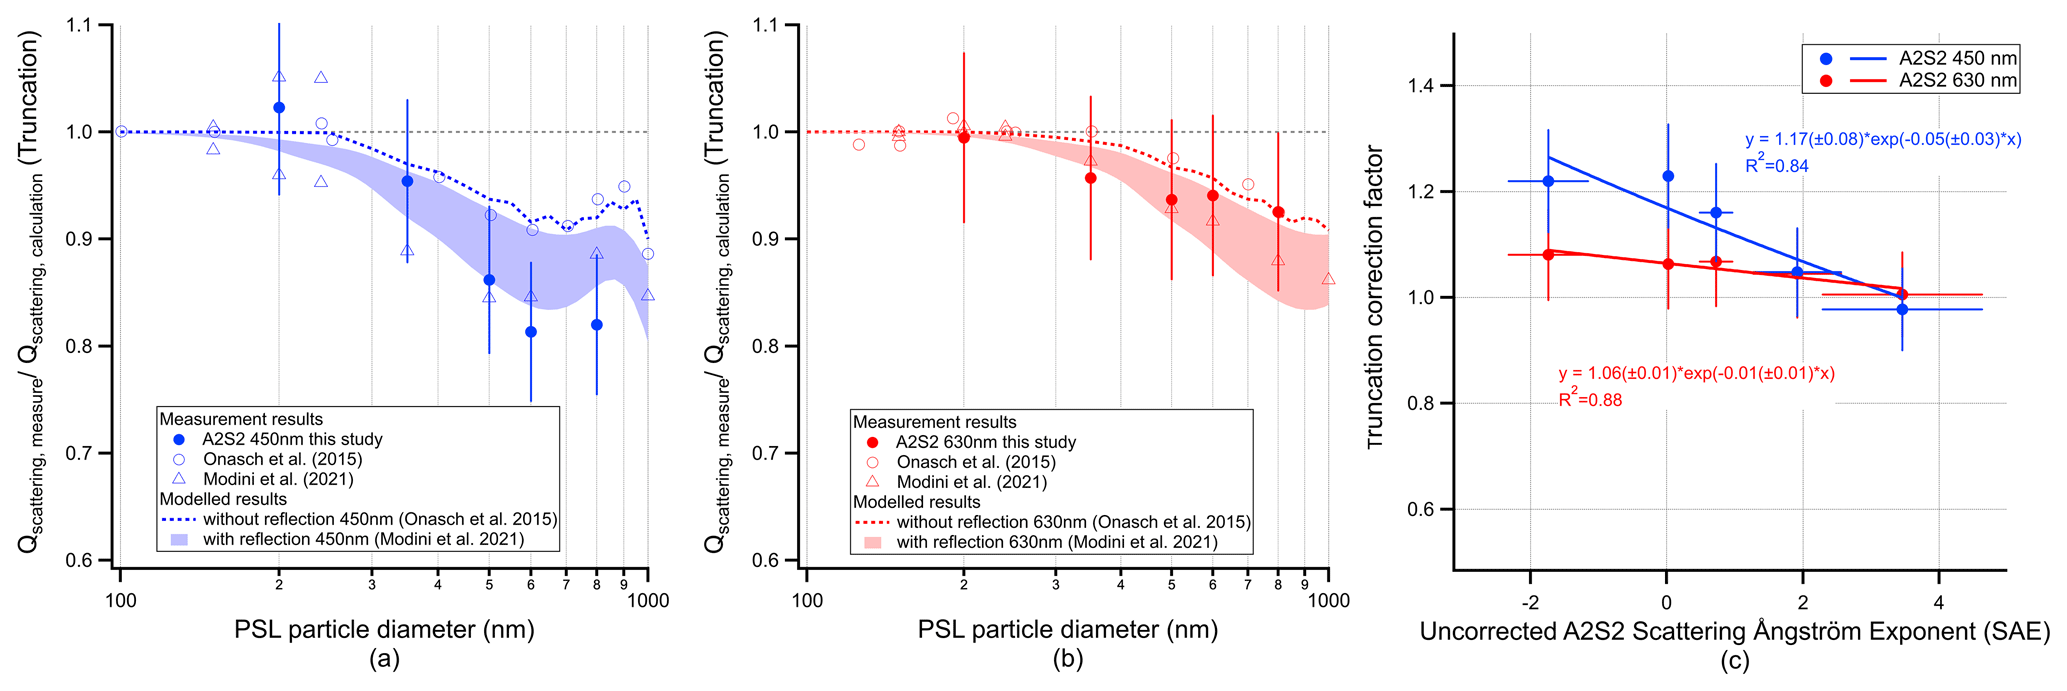
Figure 7Measured and simulated truncation as a function of particle diameter using PSL particles at wavelengths of (a) 450 nm and (b) 630 nm. The simulated truncation follows the results in Onasch et al. (2015) and Modini et al. (2021). (c) Truncation correction factor as a function of measured uncorrected SAE. The error bars in the figure represent measurement precisions of the A2S2.
Compared to the truncation results for the CAPS-PMSSA presented in previous studies, the truncation results of A2S2 in this study at 450 and 630 nm wavelengths are greater than the values reported by Onasch et al. (2015) but are closer to the values reported by Modini et al. (2021). Modini et al. (2021) suggested that the experiments done by Onasch et al. (2015) may be affected by multiply-charged particles, while the AAC source is not influenced by the multi-charging issues since particles are sized by an aerodynamic method. Another possible explanation for the differences could be the slight variations in the configurations of CAPS-PMSSA sample cells from one instrument to another, and our truncation results presented in this study may solely reflect the potential measurement error of our A2S2. The simulated truncation from different methods is also presented in Fig. 7. The truncation simulation of Onasch et al. (2015) shows the smallest correction, which is less than 10 %. However, the simulation that includes reflection done by Modini et al. (2021) shows a larger truncation correction of around 15 %. Though the simulation results of Modini et al. (2021) indicate that the self-reflection of the sampling tube may be another source of the uncertainty, there is no clear evidence that this will lead to significant measurement error, and the largest uncertainty is expected to arise from truncation itself. Overall, our truncation experiment results show a trend similar to the simulated results. The findings indicate that the A2S2 is less affected by truncation for the fine-mode particle measurements. However, for the studies where contributions from coarse-mode particles are present, larger measurement errors from the A2S2 are expected, especially for the 450 nm wavelength.
Based on the characterisation results reported here, we introduce a simplified correction algorithm as a function of measured uncorrected scattering Ångström exponent (SAE) to apply to ambient measurement results. The correction function is presented in Fig. 7c. Derived from the average truncation calculated above, the average correction factors are 1.13 and 1.05 at the wavelengths of 450 and 630 nm, respectively. Subsequently, the truncation is corrected based on the time-resolved measured uncorrected SAE between 450 and 630 nm observed by A2S2: when the SAE falls below 1, indicating the dominance of larger particles, the correction function is applied to the measurement results. Conversely, in situations dominated by fine particles (SAE > 1), there is no need to apply the correction due to the minimal truncation observed during characterisation experiments.
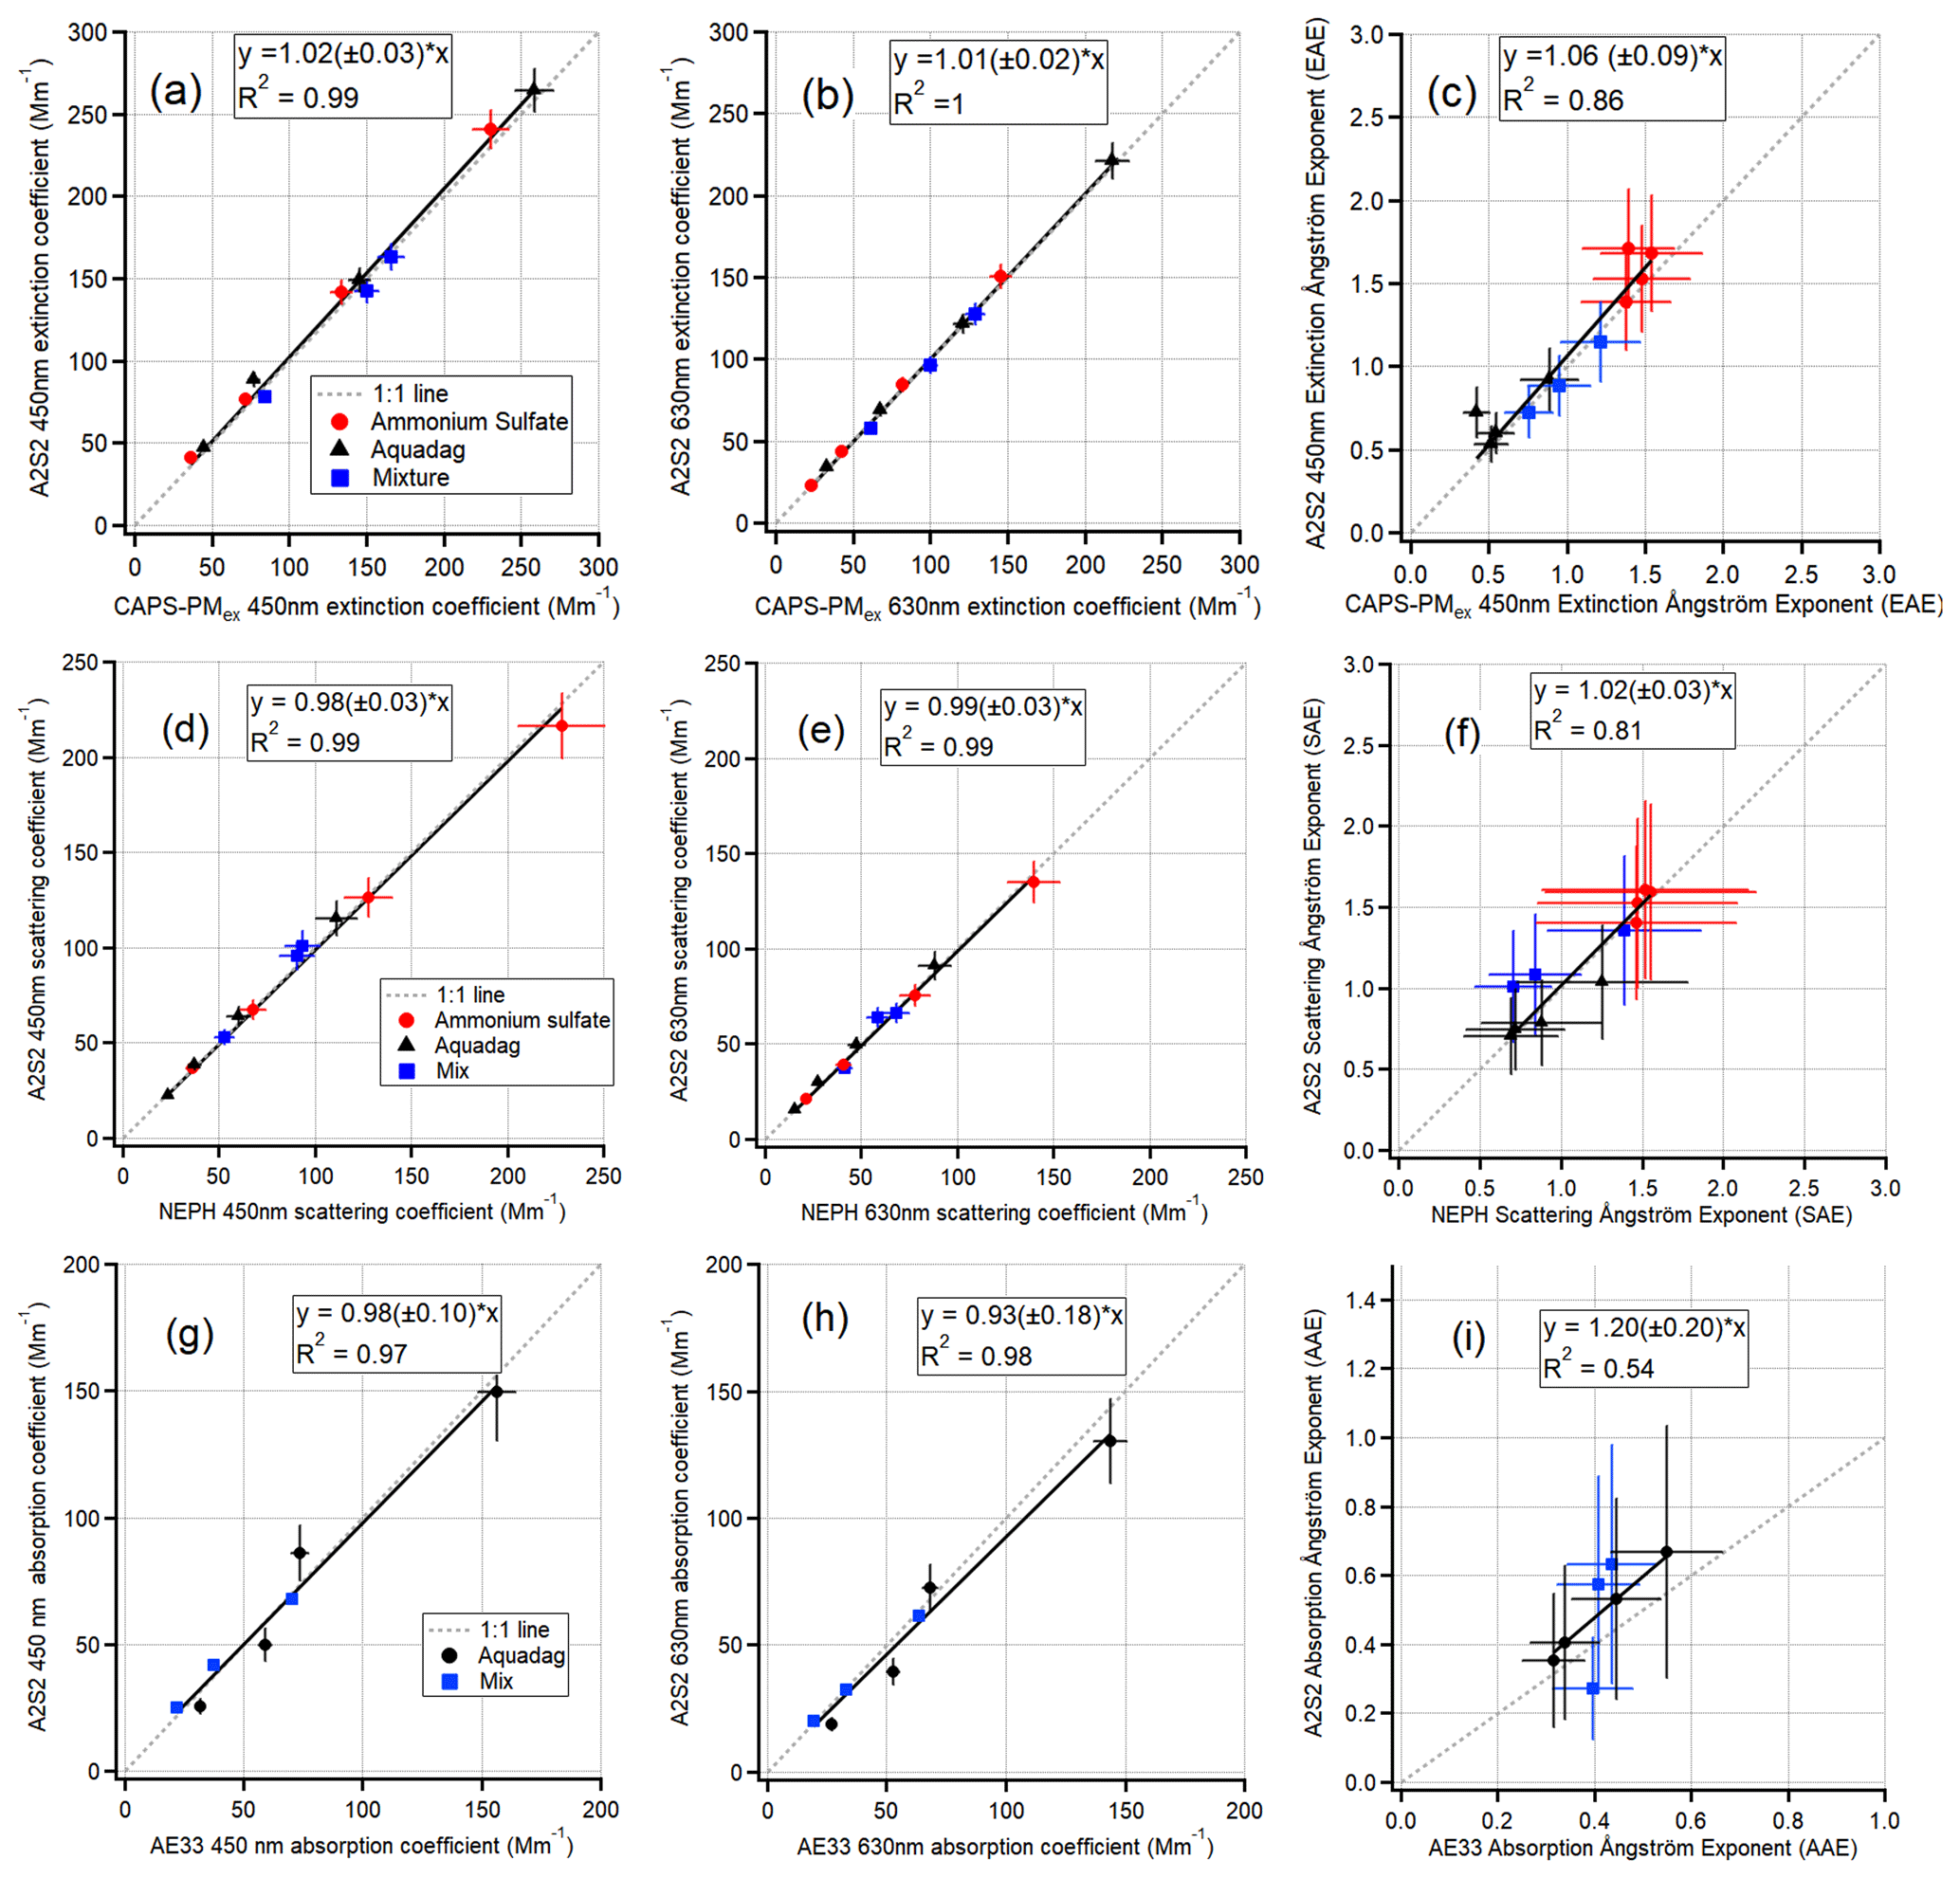
Figure 8Intercomparison (standard least-square fitting) of A2S2 measurements with (a–c) extinction coefficients (σext) and extinction Ångström exponent (EAE) with CAPS-PMex, (d–f) scattering coefficients (σsca) and scattering Ångström exponent (SAE) with NEPH, and (g–i) absorption coefficients (σabs) and absorption Ångström exponent (AAE) with AE33. The error bars in the figure represent instrument measurement precisions.
3.1.4 Instrument intercomparison
Figure 8 shows comparisons between A2S2 and the performance-validated instruments. Panels (a) and (b) are for the CAPS-PMex (σext), panels (c) and (d) use the NEPH (σsca), and panels (e) and (f) use the AE33 (σabs). Each point shown in Fig. 8 represents the average value computed over each measurement period with constant conditions. For the experiments with pure ammonium sulfate and pure Aquadag, the intercomparisons are performed under high (> 200 Mm−1 at 450 nm and > 150 Mm−1 at 630 nm), moderate (∼ 100– ∼ 200 Mm−1 at 450 nm and ∼ 50– ∼ 150 Mm−1 at 630 nm) and low (∼ 50 Mm−1 at 450 nm and < 50 Mm−1 at 630 nm) levels of σext through regulation of the dilution system. In the case of the external mixture of Aquadag and ammonium sulfate, the measurements were conducted under different SSA mixture conditions. The average SSA values determined with the A2S2 are ∼ 0.71 (high SSA), ∼ 0.67 (moderate SSA) and ∼ 0.59 (low SSA) at 450 nm and ∼ 0.66 (high SSA), ∼ 0.65 (moderate SSA) and ∼ 0.52 (low SSA) at 630 nm. The average normalised size distributions measured by SMPS are presented in Fig. 9 (normalised to the total aerosol number concentration for each SMPS scan). The size distribution results show that the median mobility diameter is smaller than 200 nm for all the groups; therefore the truncation correction for the A2S2 data can be ignored. The σext values and EAE measured by the A2S2 agree well with the results measured by two CAPS-PMex instruments, as expected, since they incorporate the same CAPS-based technique. This also confirms that our modified A2S2 monitor has equivalent performances to the currently available commercial CAPS monitors for the aerosol σext measurements. The A2S2 and NEPH instruments also show good agreement in measuring the σsca and SAE across different conditions (differences within 10 %). These results indicate that the measurements obtained from both instruments agree well and that the A2S2 provides consistent results for σsca values under varying temperature and pressure conditions. On the other hand, the average difference of σabs measured by AE33 and CAPS-PMSSA is within 10 %. Large variance was observed for the AAE, which could be attributed to the variation in the contribution of Aquadag. Previous measurements performed by Foster et al. (2019) demonstrated that when Aquadag or standard black carbon (BC) loading drops, the variance in AAE becomes more pronounced from CAPS-PMSSA results. However, the average AAE derived from both A2S2 and AE33 was close to 0.4, which is the expected AAE of the standard Aquadag particles. Our results agree with the findings found in previous laboratory experiments involving the CAPS-PMSSA, for example, where Perim De Faria et al. (2021) demonstrate that the CAPS-PMSSA can achieve measurements of σext and σsca at 630 nm with uncertainties within 10 %, but the measurement of σabs has uncertainties of 4 %–16 %. Our results also agree well with the results from Weber et al. (2022), who found that the relative uncertainties for the σext, σsca and σabs from CAPS-PMSSA at 450 and 630 nm are within 20 %, as suggested by Laj et al. (2020) for the ambient aerosol optical property measurements. In addition, Corbin et al. (2022) also demonstrated good agreement between black carbon (BC) mass concentrations and σabs from CAPS-PMSSA at 660 nm in an engine emission experiment.
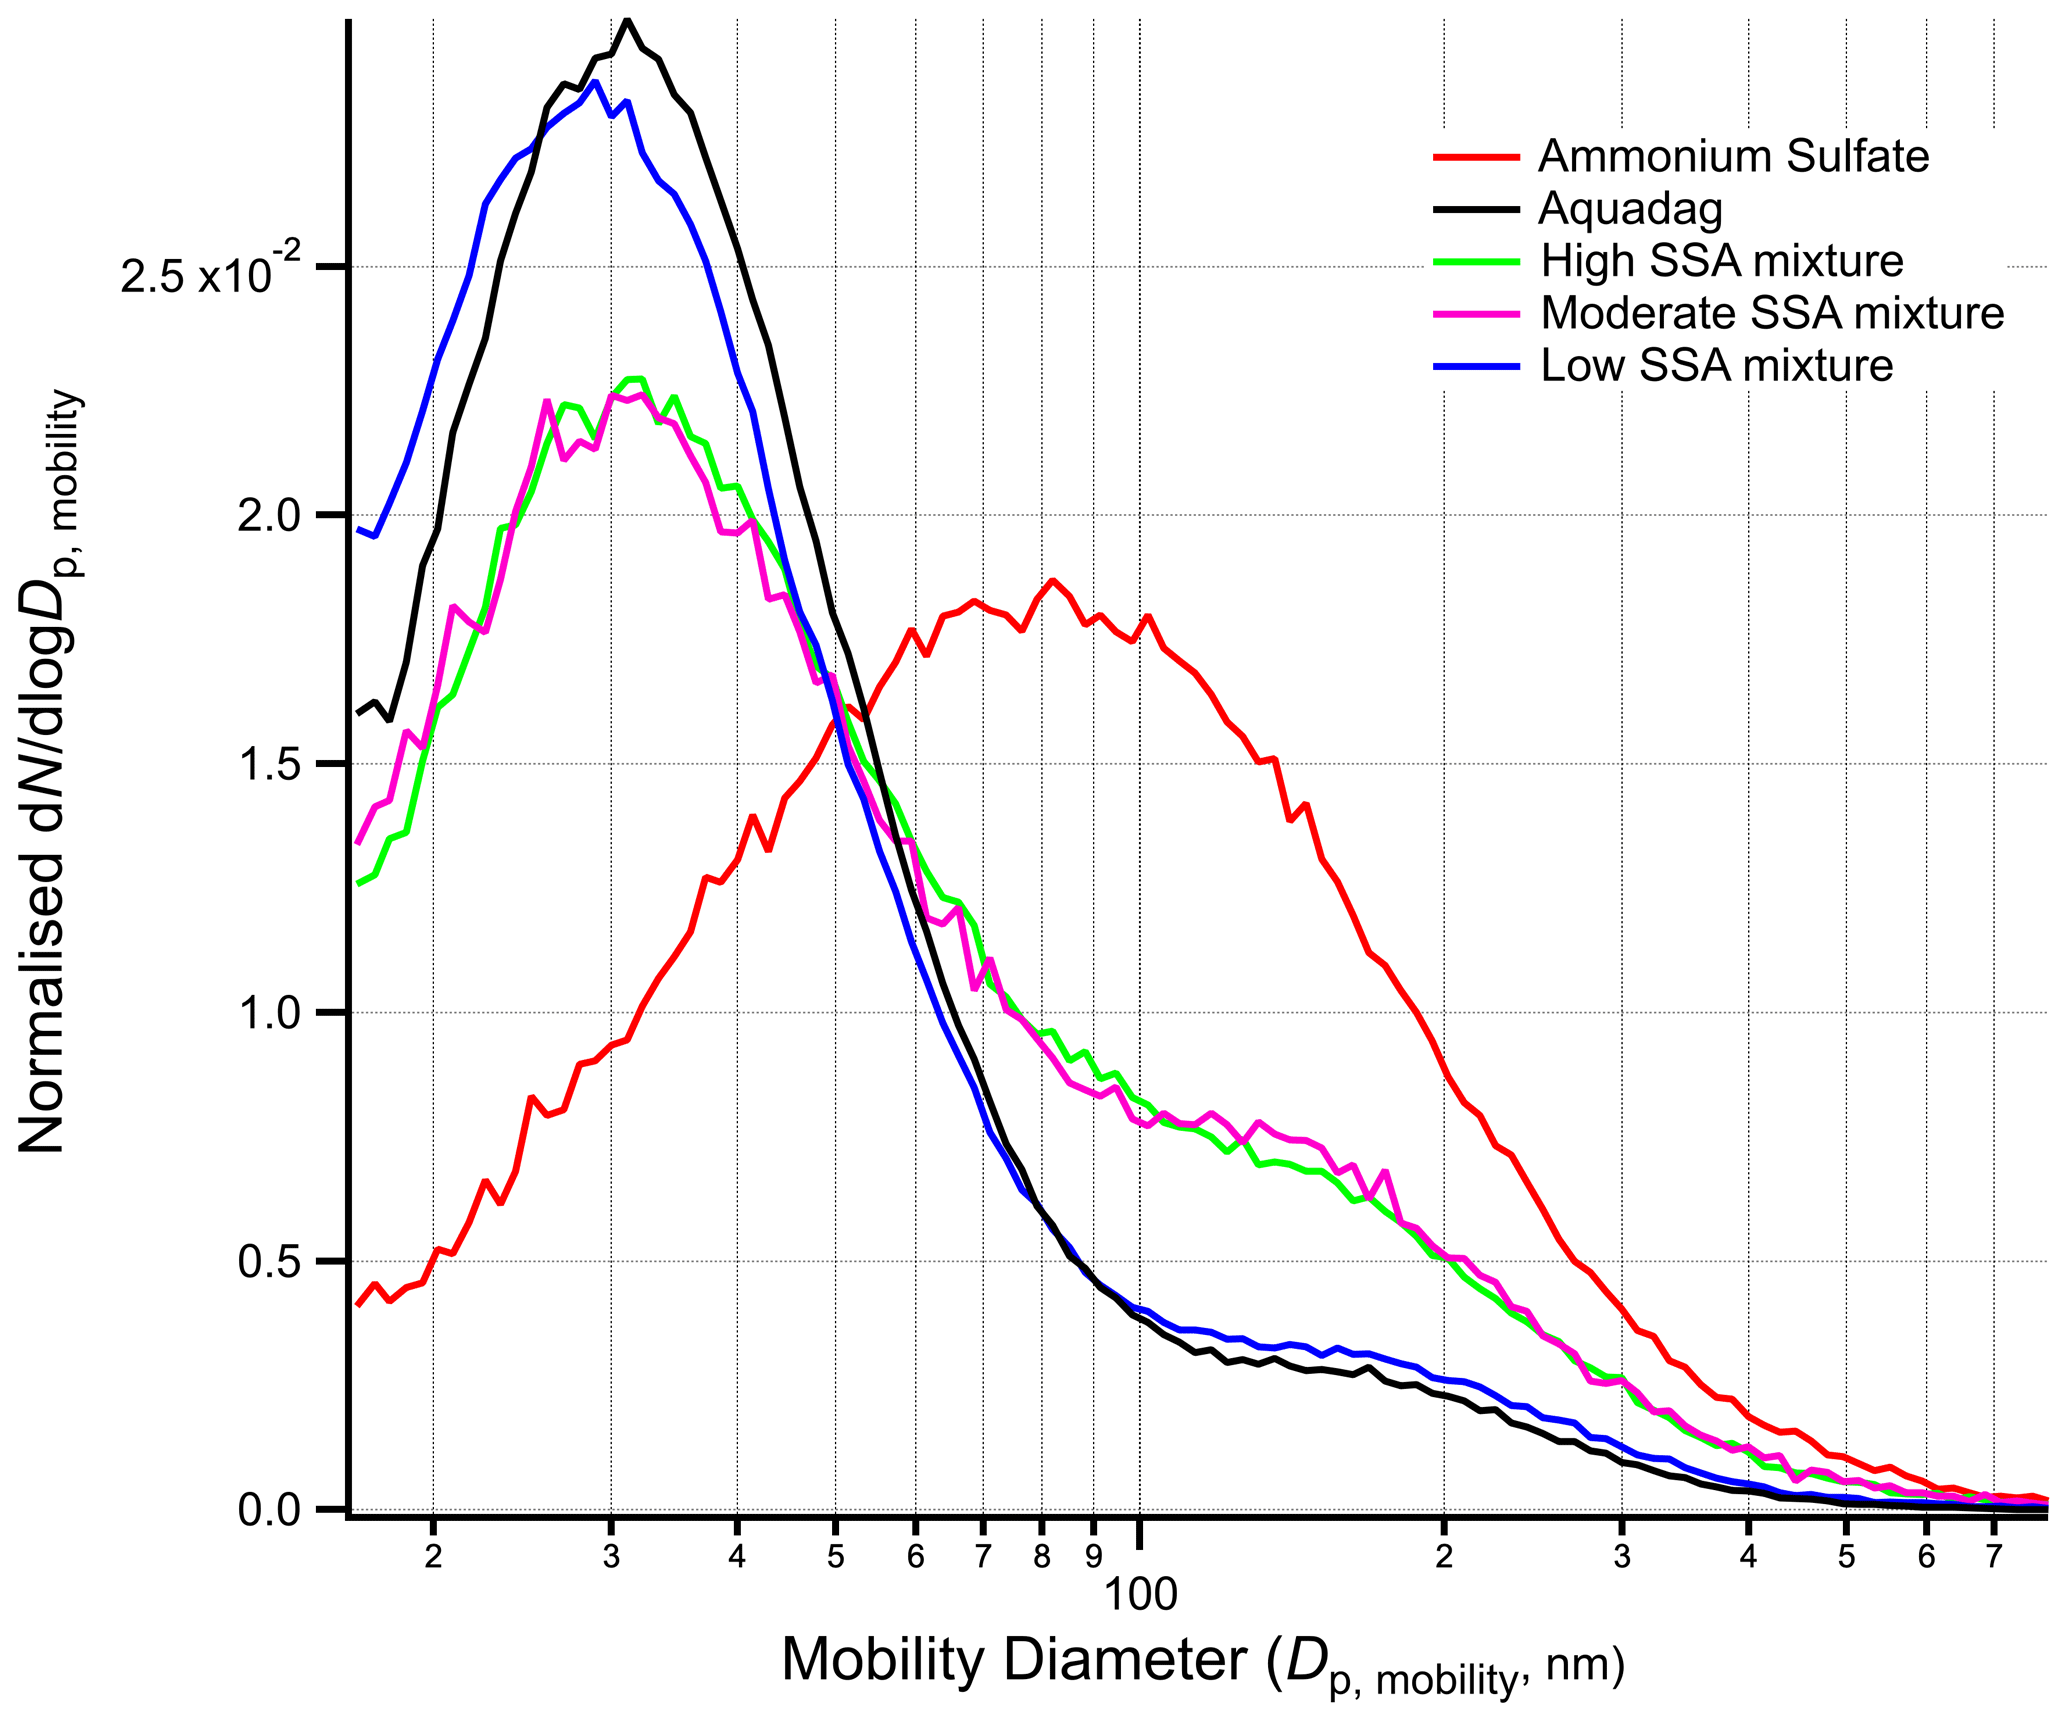
Figure 9Average normalised size distribution of the aerosols for each intercomparison group as measured by SMPS.
3.2 Aircraft measurement results
3.2.1 Urban environment measurement results
The overview of the AOD values retrieved from AERONET observations at 440 and 675 nm during the ACROSS airborne flight campaign period, as measured at a Paris urban site and at a rural site (in the Rambouillet forest), and the AOD measured by the A2S2 as determined by integrating the altitude profile of σext at 450 and 630 nm are presented in Fig. 10a. Figure 10b and c display the SSA and SAE measured by the A2S2 at 450 and 630 nm within the boundary layer for each flight. According to the AERONET reanalysis of AOD results over the same area as the aircraft flight operations, there are two periods during the campaign period: a heavily polluted period with AOD values up to 0.8 between 18 (Flight A025) and 23 June (Flight A028) and light pollution periods with AOD values around 0.2 for the remainder of the flights. The AERONET AOD values at 440 nm retrieved from the Paris urban site are higher than the results from the Rambouillet forest site, whereas the AOD at 675 nm exhibits similar values at both sites. This could be attributed to the elevated concentration of non-refractory particulate matter in the urban area of Paris compared to the rural region. Comparing the AOD integrated from the altitude profiles of σext to the AERONET AOD results, the in situ measured AOD result was lower than the AOD retrieved at the Paris urban AERONET site due to lower pollution levels but is close to the results at the Rambouillet forest site.
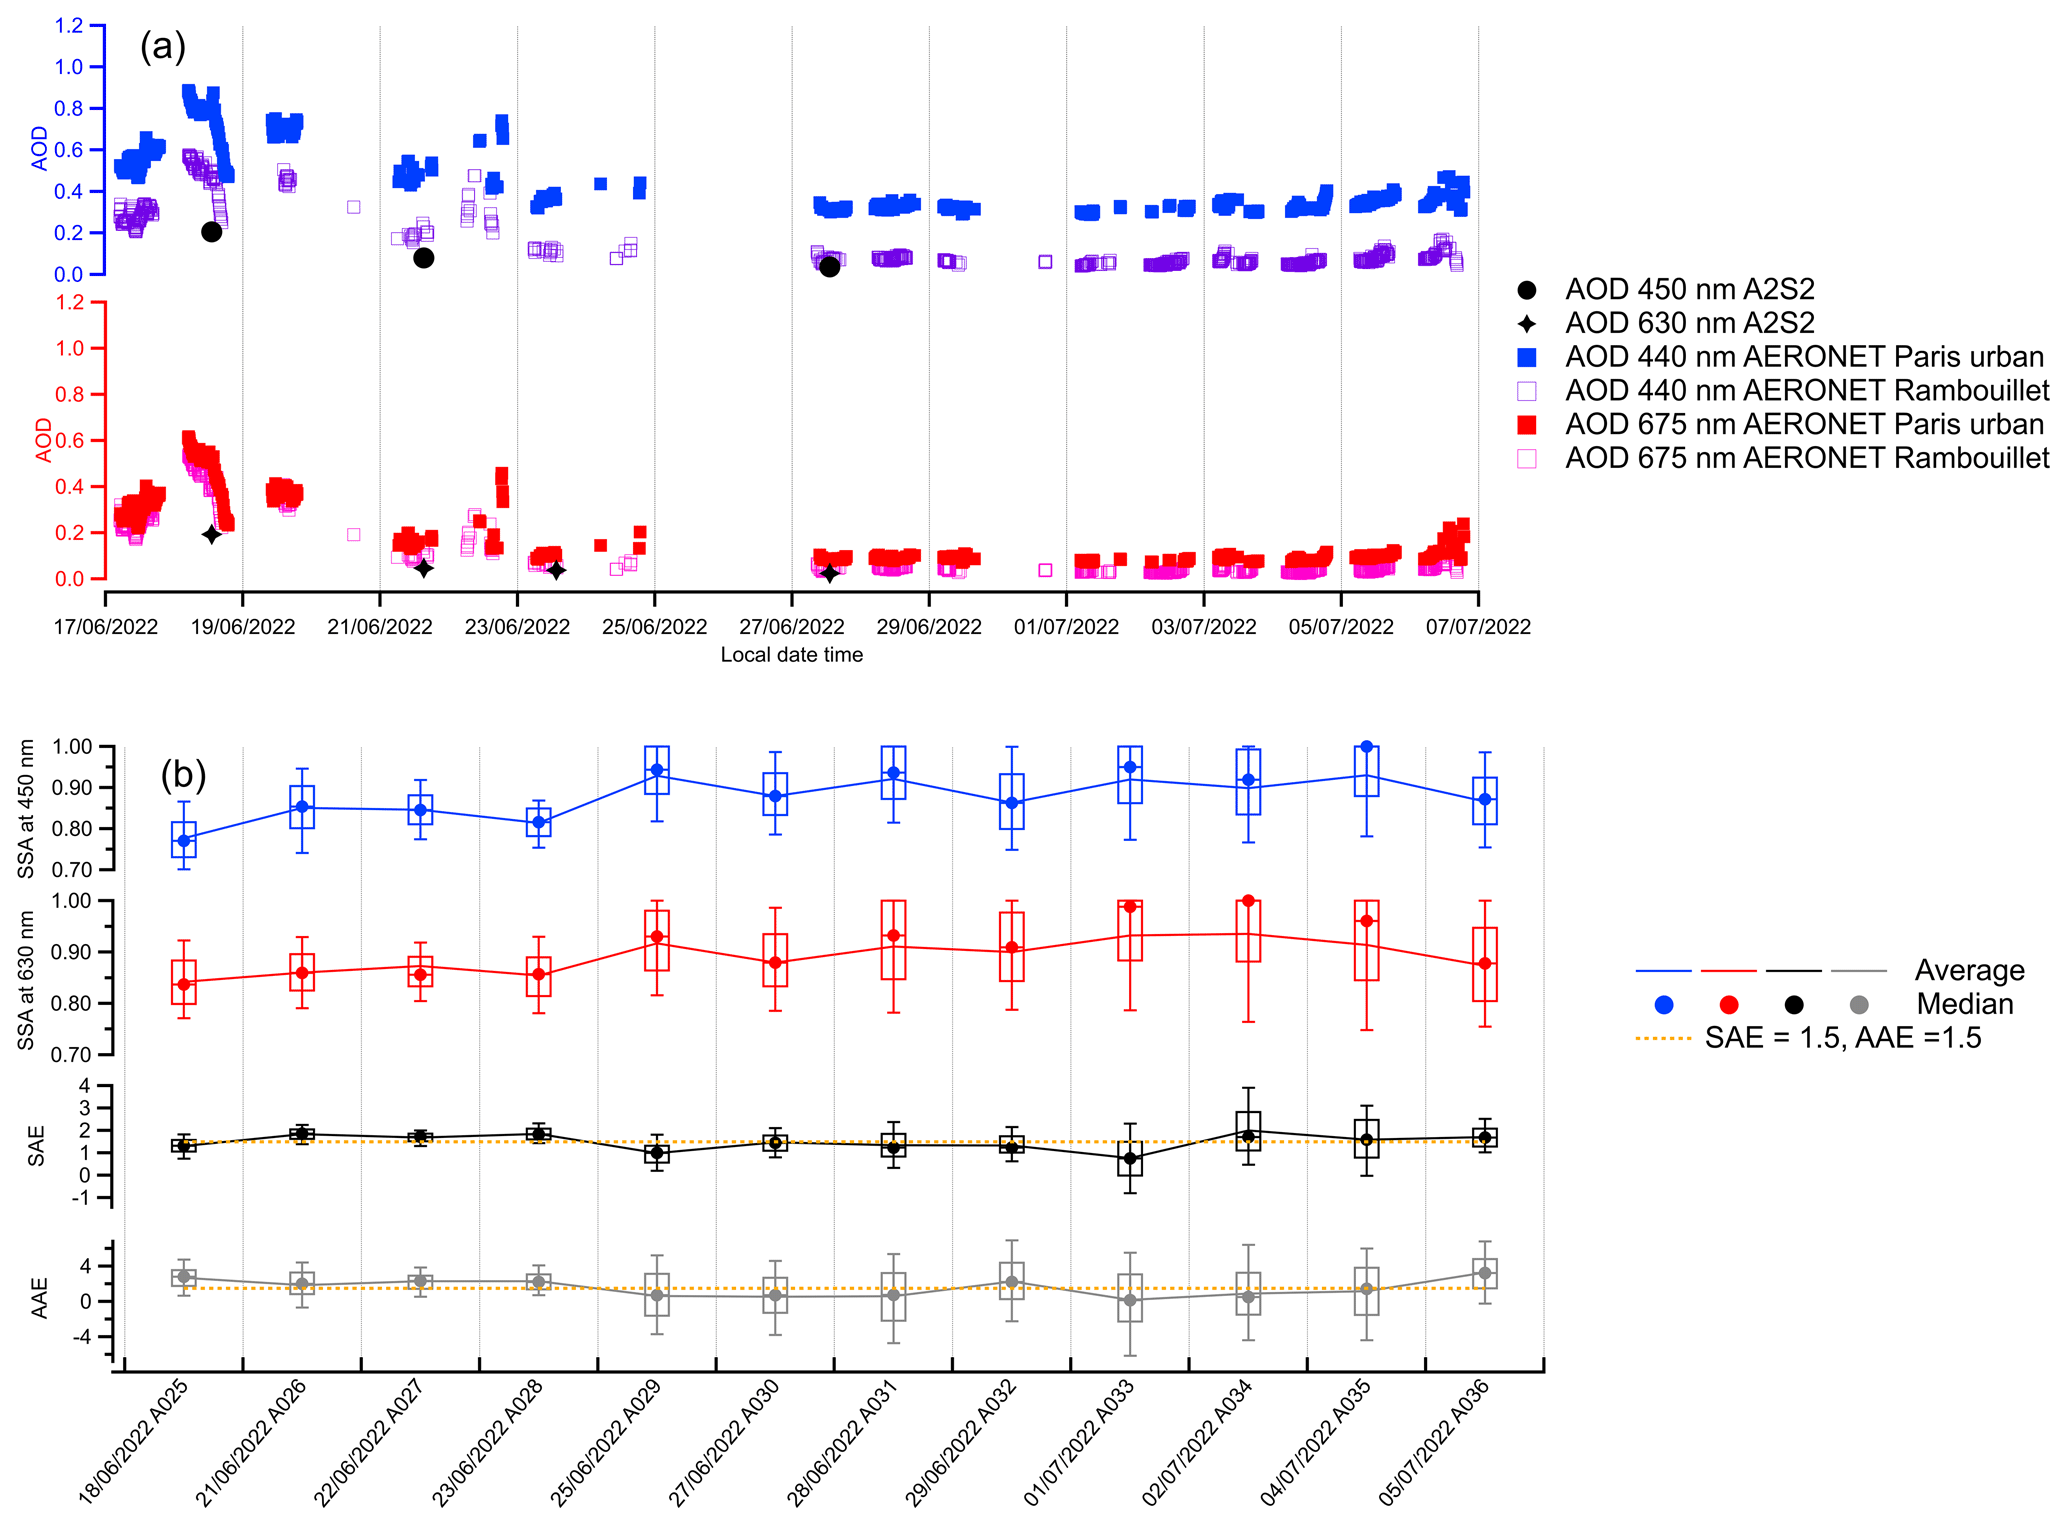
Figure 10Time series of (a) aerosol optical depth (AOD) from AERONET and A2S2 observations and (b) aerosol SSA at 450 and 630 nm and SAE. The box-and-whisker plots represent the average, 10th percentile, 25th percentile, median, 75th percentile and 90th percentile. The dashed yellow line indicates the SAE of 1.5 and AAE of 1.5.
The average SSA within the boundary layer at 450 and 630 nm varied between 0.8 and 0.9 for the entire campaign, and the average SSA during the heavily polluted period (0.82 at 450 nm and 0.85 at 630 nm) is slightly lower than the average SSA during the lightly polluted period (0.87 at 450 nm and 0.90 at 630 nm). Due to the extremely low aerosol levels during the lightly polluted period, the σext and σsca are close to the detection limits of the instrument, which leads to relatively large uncertainties. The measured SSA observed in this study is close to the average SSA reported above the Greater London area in summer (0.89 and 0.88 at 467 and 652 nm, respectively) (Davies et al., 2019). During most flights, the average SAE values range between approximately 1 and 2. However, for flights A025, A029, A032 and A033, the SAE dropped to around 1 due to the influence of larger-sized particles. The average AAE varied between 0 and 3, and this is potentially due to both the complicated emission sources and the low aerosol loading. Previous research has suggested that the stronger absorption at shorter wavelengths (average AAE > 1.5) could arise from either dust events (average SAE < 1.5) or a substantial contribution from brown carbon (BrC) (average SAE > 1.5) (Cappa et al., 2016). Our measurements indicate that dust particles contributed to the overall aerosol loading during flights A025 and A032, while BrC appears to have played a significant role in aerosol absorption during flights A026, A027, A028 and A036.
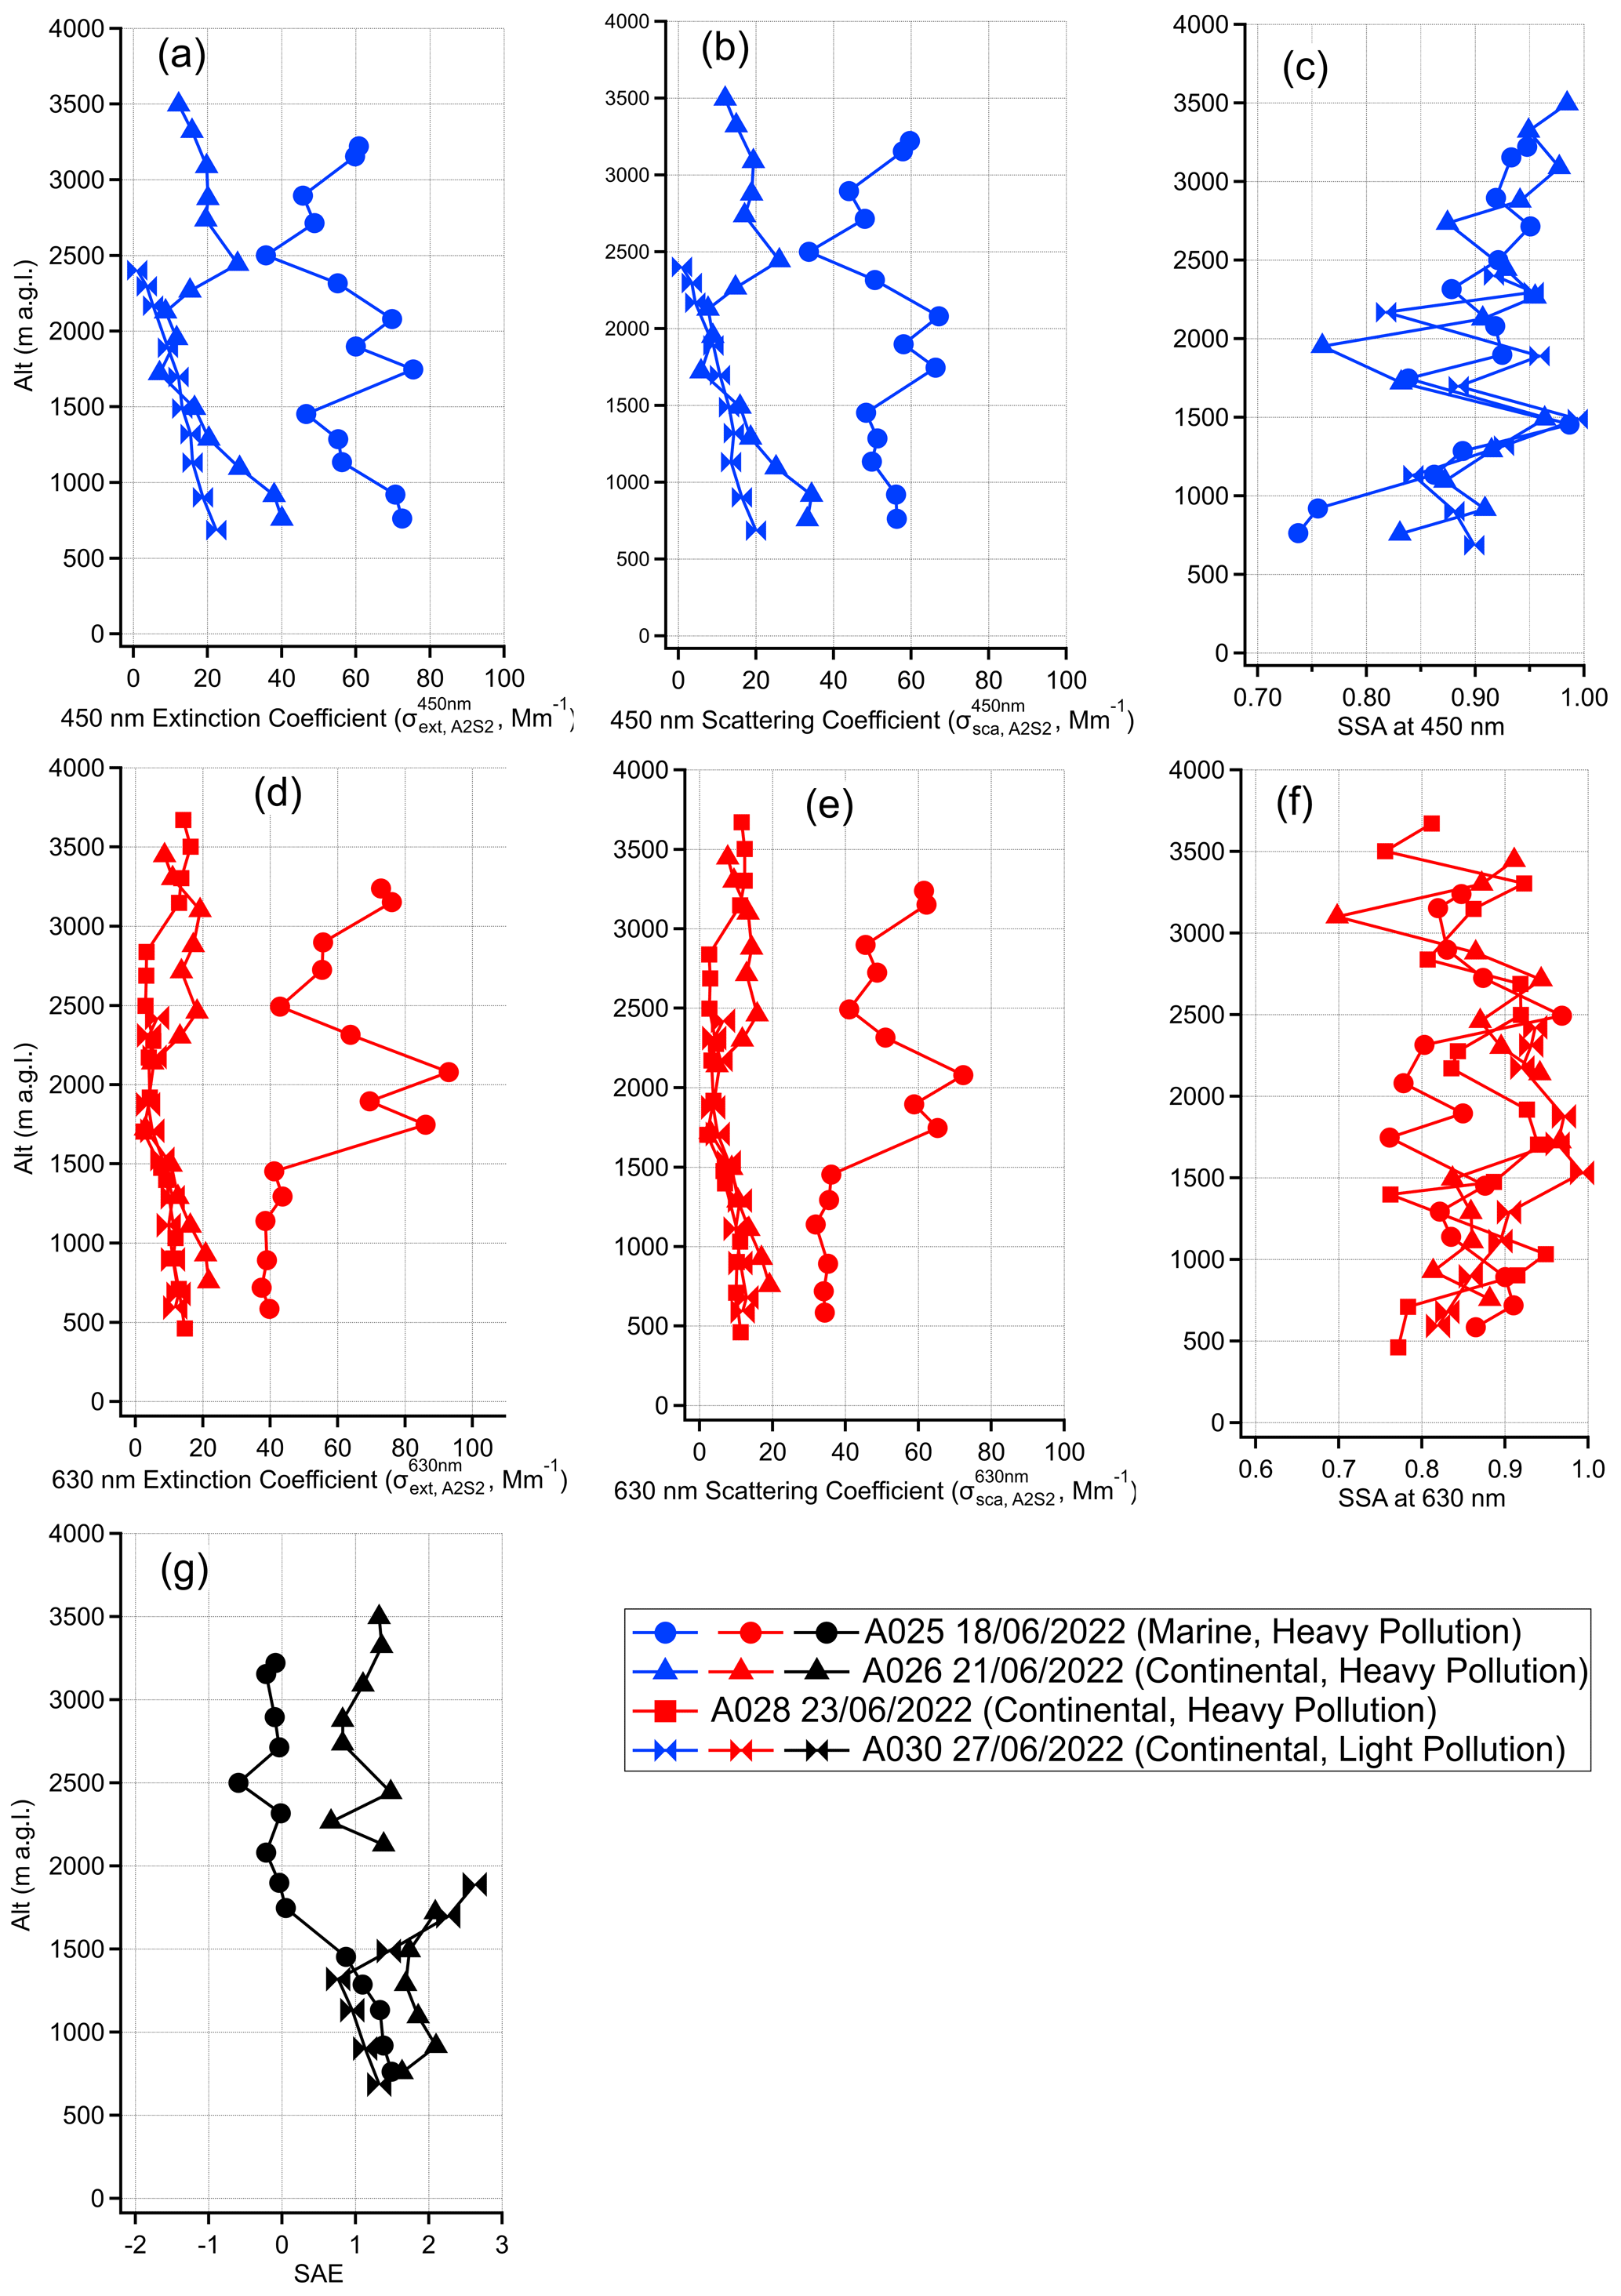
Figure 11Altitude profile results for σext, σsca and SSA (a–c) at 450 nm and (d–f) at 630 nm and (g) SAE during the ACROSS campaign.
The altitude profile results of flights A025, A026, A028 and A030, and the aerosol optical properties above both the marine and continental background environments, are presented in Fig. 11. The results at 450 nm for A028 are not available due to the technical issues. Flight A025 had the highest aerosol extinction and scattering coefficients among the four cases. The sharp decrease in SAE between 1500 and 2500 m indicates the presence of a dust layer, which contributed to the increase in aerosol extinction and scattering at both wavelengths. The SSA is also observed to decrease within the dust layer, which could be caused by the mixture of dust with absorbing carbonaceous components and by the truncation correction errors. Due to the variation in boundary layer conditions, the profile of Flight A026 consists of two separate aerosol layers. One is within the boundary layer up to 1500 m, and the other one is at altitudes above 2000 m. The SAE at the upper layer is slightly less than the SAE at lower layer, and this indicates that the aerosols in the upper layer may be larger than the aerosols in the lower layer. For flights A028 and A030, the σext and σsca values decreased with increasing altitude, and the relatively low σext indicates a relative clean background profile. The increase in SAE from ∼ 1 to ∼ 3 at altitudes above 1200 m for Flight A030 indicates that only fine-mode particles are present at the upper level. The SSA of all the flights varies between 0.8 and 0.9 across the whole column, and there is a slight increase at the top for each flight indicating the reduction in the absorbing aerosols at the top.
3.2.2 Comparison of A2S2 and nephelometer on board the aircraft
The comparisons of measured σsca by A2S2 and NEPH at 450 and 630 nm are presented in Figs. 12 and 13, respectively. For better comparison, the normalised probability density functions (PDFs) of A2S2 and NEPH results for each flight are presented in the Supplement. As discussed previously, there were dust (coarse-mode particles) events present during flights A025, A029, A032 and A033. During flight A025 the poorest agreement (12 % differences) between the A2S2 and the NEPH among all the ACROSS flights was observed, and this could possibly be attributed to the important contributions from dust particles, as indicated by the SAE and AAE results shown in Fig. 10. This agrees with the lab results of the truncation characterisation which indicate that there are larger measurement errors for the A2S2 when measuring σsca at larger particle sizes. After implementing the simple truncation corrections described previously, the discrepancies between the A2S2 and the NEPH results at both wavelengths are reduced to approximately 10 %. For the airborne measurements during the lightly polluted periods, the uncertainty in A2S2-measured σsca increases slightly because even a small change in baseline becomes significant as the σext approaches the detection limit. The relevance of this issue is particularly pronounced at the 450 nm wavelength due to the contribution from gas-phase absorption as described previously. Overall, the A2S2 shows good agreement with the NEPH overall during the entire ACROSS campaign, and this confirmed that the A2S2 can adequately replace the NEPH to obtain reliable measurements of σsca under polluted conditions.
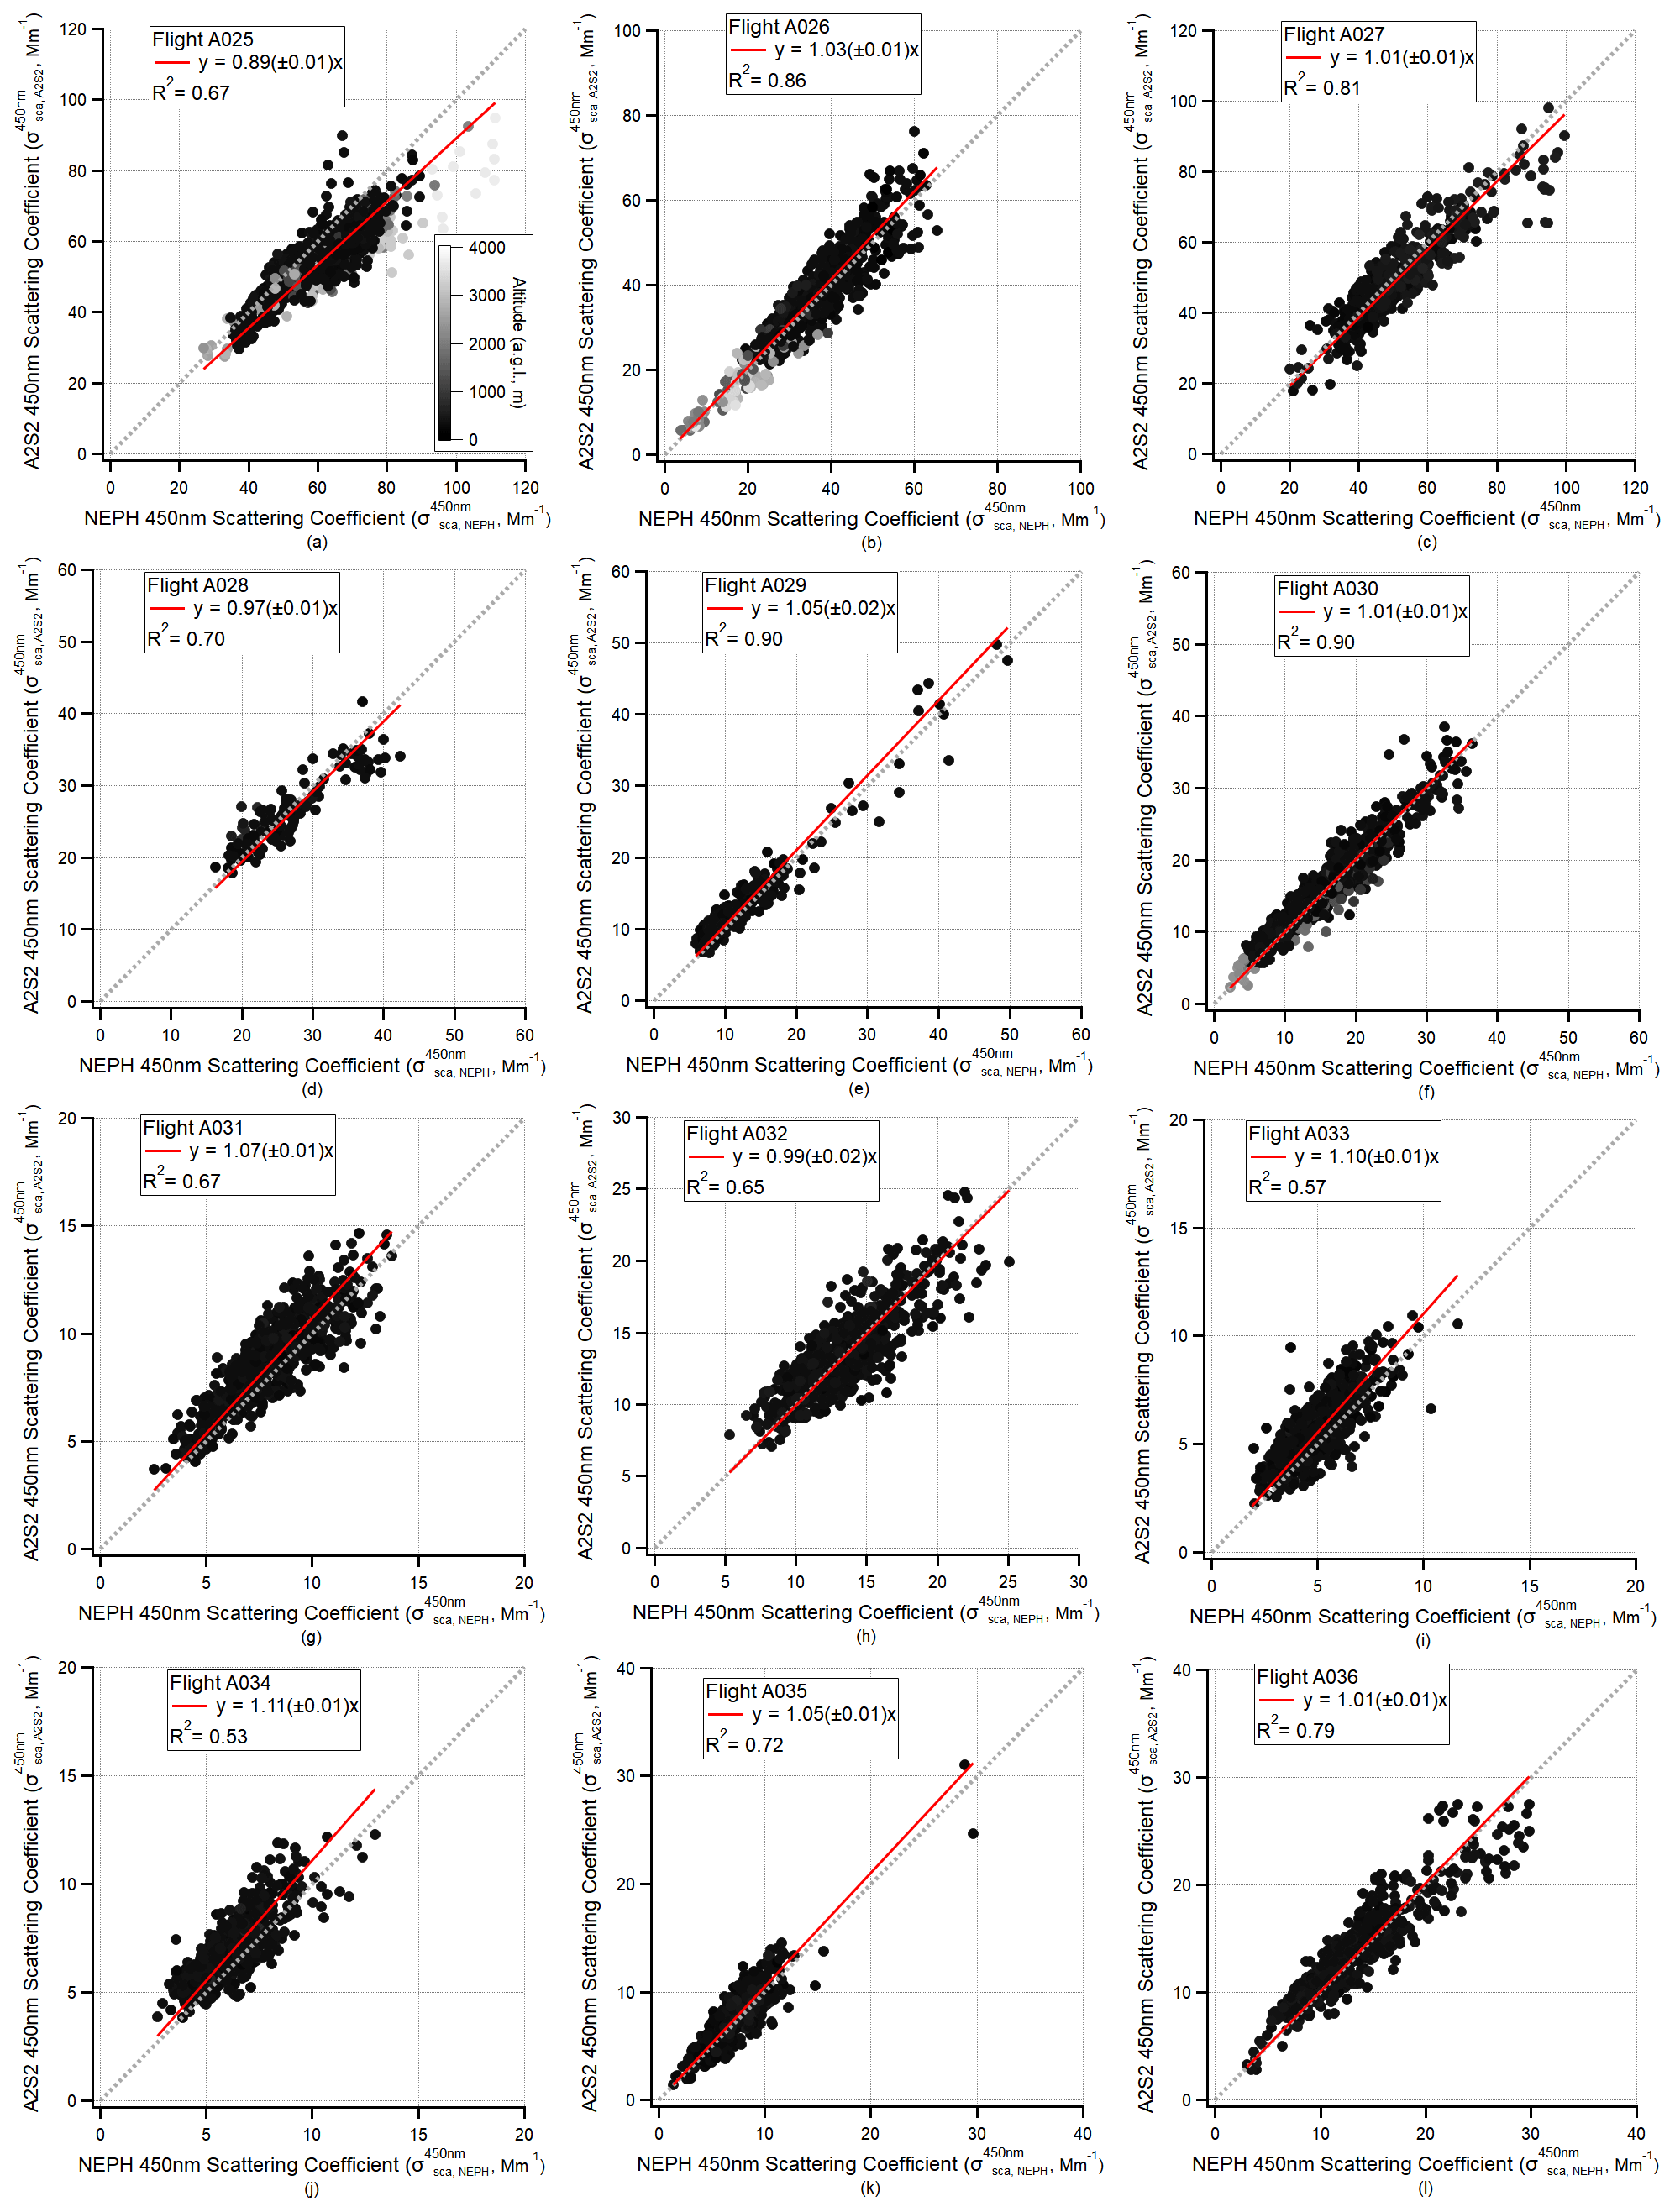
Figure 12Comparison between A2S2 and NEPH at 450 nm of σsca measurements for all the ACROSS flights.
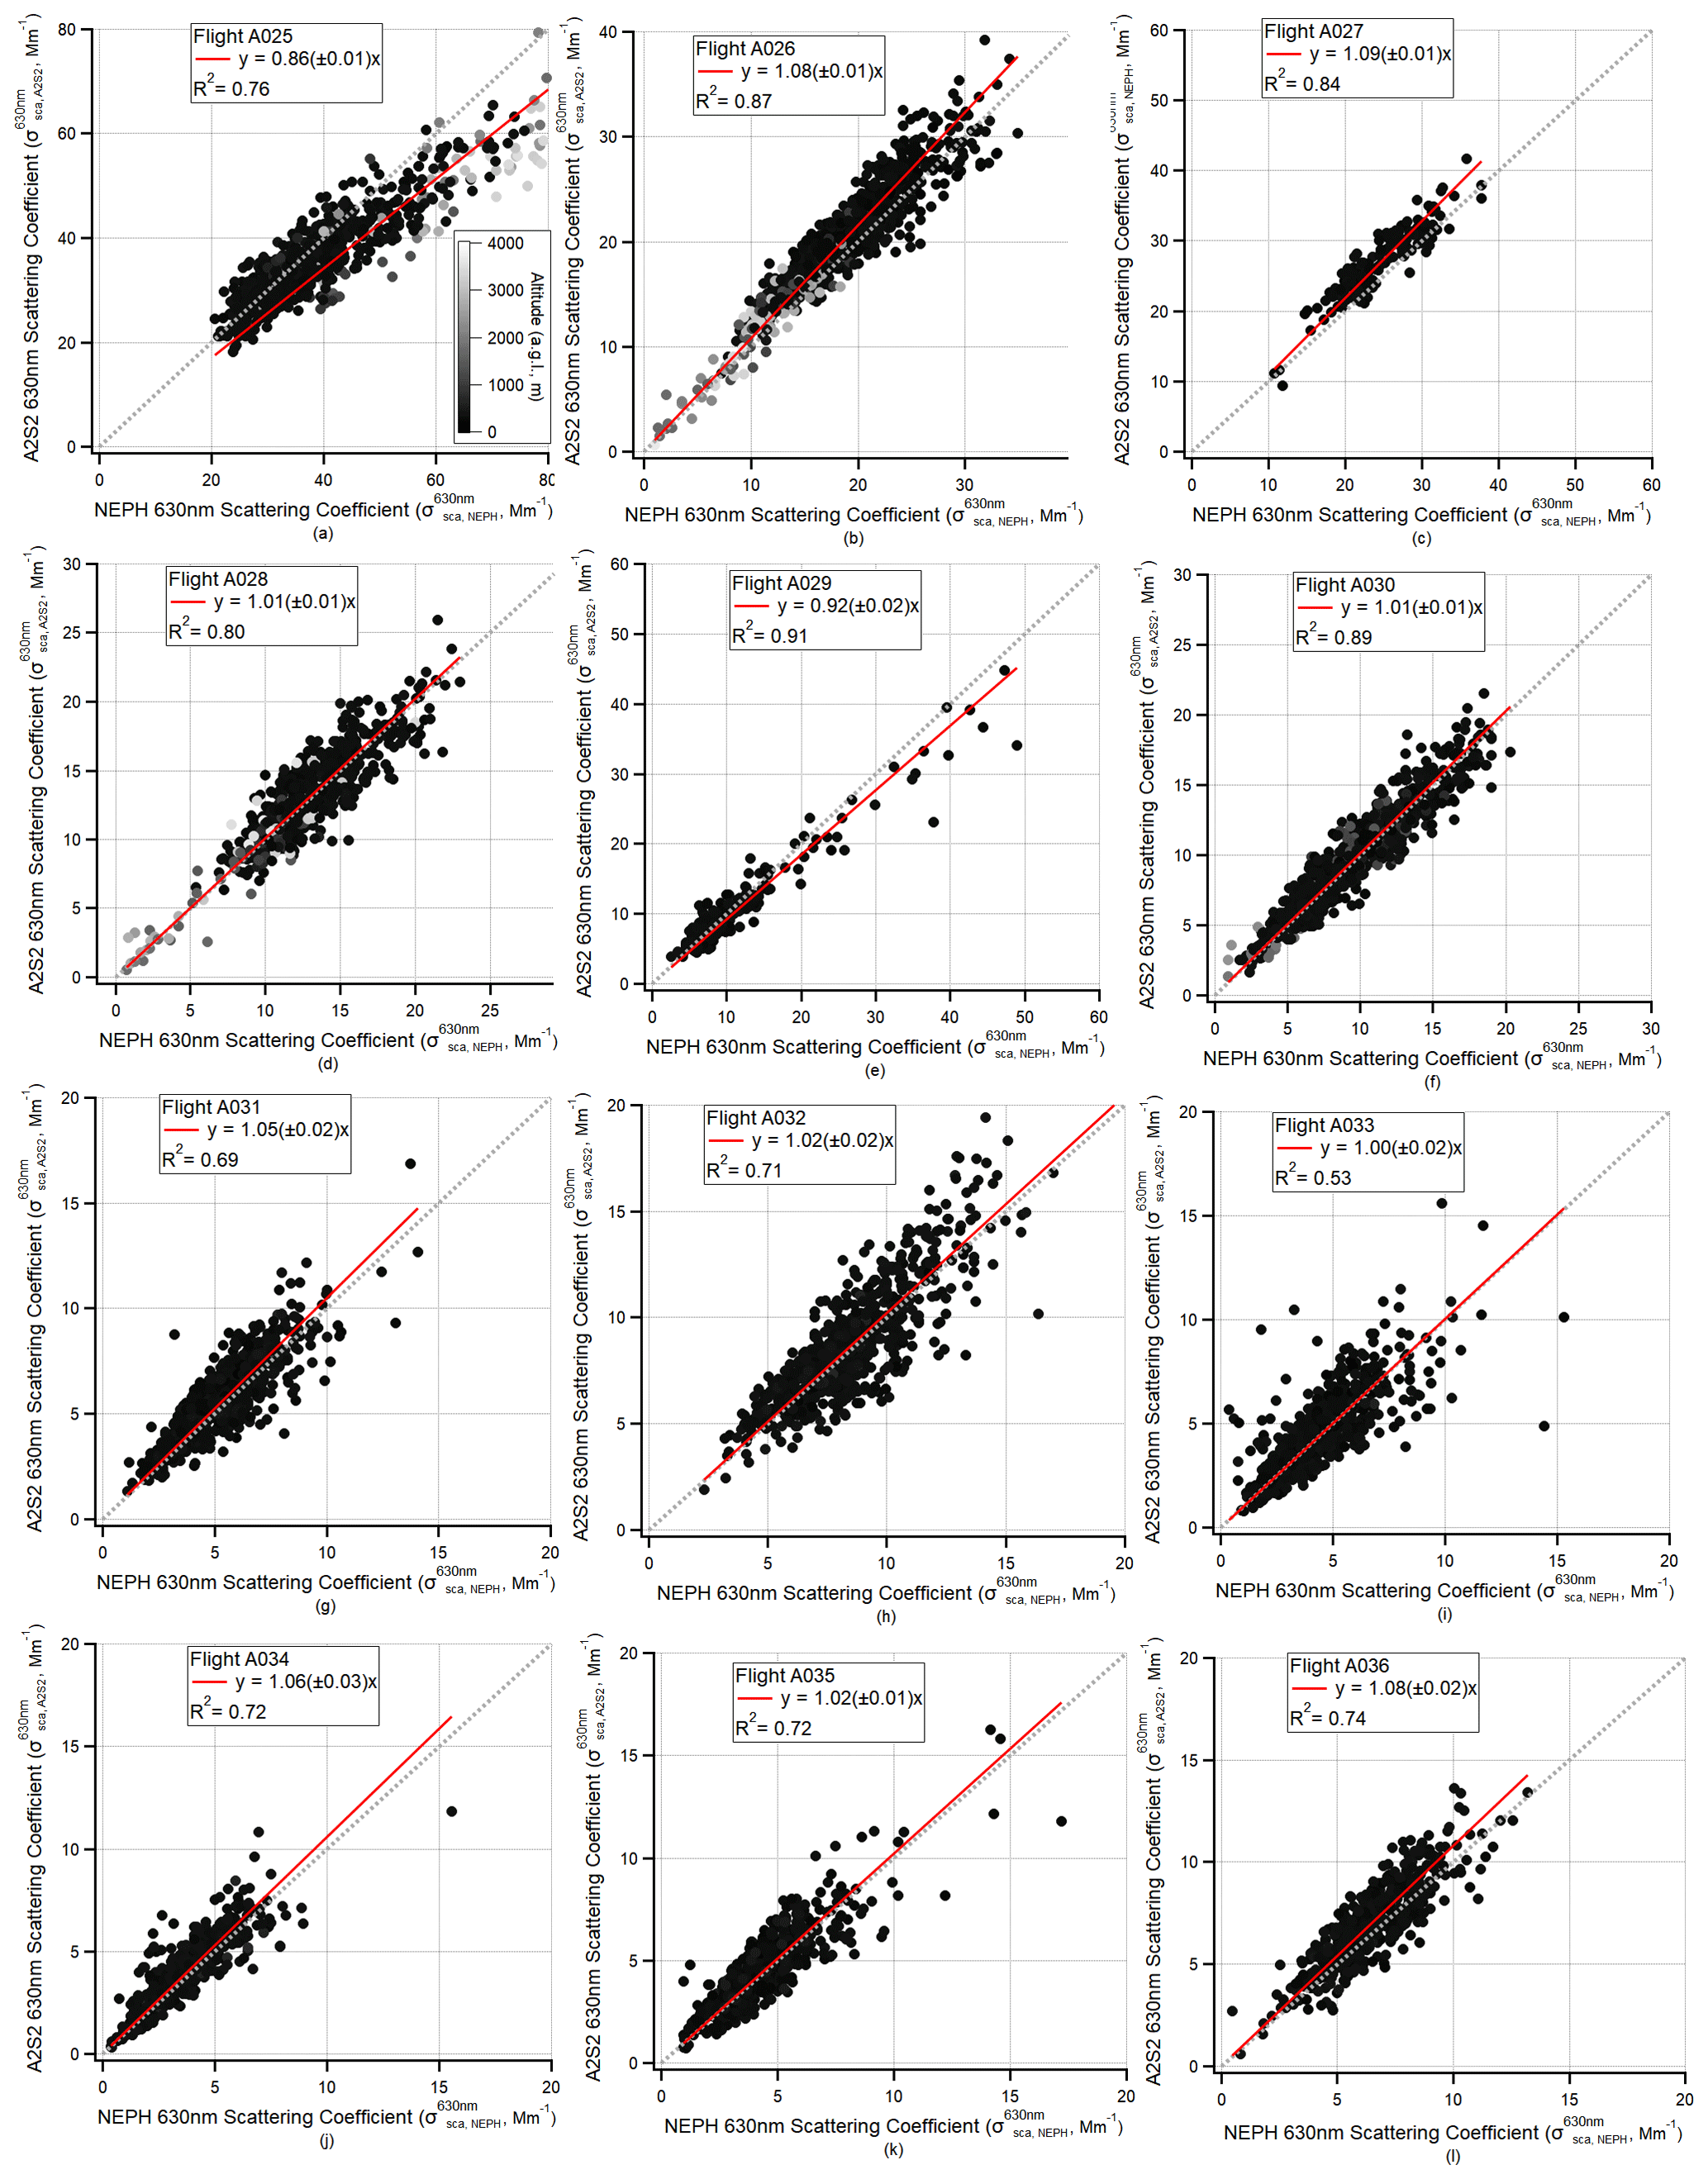
Figure 13Comparison between A2S2 and NEPH at 630 nm of σsca measurements for all the ACROSS flights.
In this study, we introduced a customised version of an airborne dual-wavelength SSA monitor based on the CAPS-PMSSA technique. As we configured it, the A2S2 can be used to conduct continuous measurements under low-pressure conditions down to 550 hPa with limited impact from high cabin temperatures. The truncation effect can be ignored for the particles with Dp smaller than 200 nm, while for larger particles the truncation correction can be up to 20 %. Following the truncation experiment, a truncation correction algorithm has been devised that operates in accordance with SAE principles, and the average truncation correction factors are 1.13 and 1.05 at the wavelengths of 450 and 630 nm, respectively. In order to achieve a balance between signal-to-noise ratio and the high-frequency demands of the ACROSS project, the airborne measurement data, originally captured at 1 Hz, have been integrated over a 10 s period in this study. This adjustment significantly reduces the minimum detection limit (MDL) for σext and σsca measurements by over 60 % at 450 nm and by more than 80 % at 630 nm. The aircraft measurements were conducted in environments with varying levels of anthropogenic pollution in northern France in the summer of 2022. The measurements include both the heavily polluted (AOD ≥ 0.5) and lightly polluted (AOD < 0.5) environments. The SSA within the boundary layer as measured throughout the entire ACROSS flight campaign varied between ∼ 0.8 and ∼ 0.9, and the vertical structure of the aerosol optical properties varied. The SAE observed during the measurement period varied between 1 and 2, which indicates the contributions from different aerosol modes. For the environment dominated by fine-mode particles, A2S2 can provide continuous stable measurements with uncertainties of 10 % compared to the truncation-corrected NEPH measurements. The uncertainty increased when larger dust particles appeared but was still around 10 % after implementing the simplified truncation correction method developed based on the PSL truncation characterisation results. However, both the irregular shape and the variation in refractive indices of the dust particles may cause large uncertainties in the spherical Mie-theory predictions. The refractive indices of dust particles typically range from 1.47 to 1.53 for the real part and 0.001 to 0.005 for the imaginary part in the visible range (Di Biagio et al., 2019). Therefore, it is difficult to accurately validate the truncation correction algorithms applied by either A2S2 or NEPH for these larger dust particles. There is a need for more comprehensive simulations and characterisations with morphology-aware models like T-matrix to make accurate truncation error corrections, particularly under conditions involving super-micron dust particle events. Furthermore, as our truncation characterisation shows the uncertainties of A2S2 are slightly larger than those of the previous study of Onasch et al. (2015) using the CAPS-PMSSA, the potential additional uncertainty source arising from the reflection of the glass tube within the cavity of CAPS-PMSSA may need to be addressed as well (Liu et al., 2018; Modini et al., 2021). Our laboratory and field measurement results validated the A2S2 as reliable for airborne measurements of aerosol scattering and extinction coefficients at both blue and red wavelengths under different ambient conditions. Laj et al. (2020) indicated that the uncertainty of in situ measurement techniques for aerosol SSA characterisation should be less than 20 % to contribute effectively to climate studies. Our results demonstrate that the measurement uncertainties of A2S2 fall within the required uncertainty ranges suggested by Laj et al. (2020). Therefore, the measurement results obtained from A2S2 can significantly contribute to future climate modelling studies.
The data from the laboratory experiment are available through Zenodo: https://doi.org/10.5281/zenodo.10056220 (Yu and Formenti, 2023a). Processed ACROSS flight campaign data and AERONET data are archived at ACROSS AERIS: https://doi.org/10.25326/525 (Yu and Formenti, 2023b) and https://doi.org/10.25326/526 (Yu and Formenti, 2023c).
The supplement related to this article is available online at: https://doi.org/10.5194/amt-17-3419-2024-supplement.
PF designed the project. CY, PF, MC, KT, EP, MF and VM performed the laboratory validation experiments. CY, PF, KT, VM and CC performed the ACROSS airborne experiment. EP, KT, MC, LX and TB contributed to the instrument modification and configuration on board the ATR-42 aircraft. TBO and AF provided suggestions for the instrument modification. MF wrote the new instrument software interface. CC designed the ACROSS-AO aircraft research. CY performed the data analysis. CY and PF wrote the article. All co-authors contributed to the comments on the article.
The contact author has declared that none of the authors has any competing interests.
Publisher's note: Copernicus Publications remains neutral with regard to jurisdictional claims made in the text, published maps, institutional affiliations, or any other geographical representation in this paper. While Copernicus Publications makes every effort to include appropriate place names, the final responsibility lies with the authors.
This article is part of the special issue “Atmospheric Chemistry of the Suburban Forest – multiplatform observational campaign of the chemistry and physics of mixed urban and biogenic emissions”. It is not associated with a conference.
Airborne data were obtained using the aircraft managed by SAFIRE, the French facility for airborne research, an infrastructure of the French National Center for Scientific Research (CNRS), Météo-France and the French National Centre for Space Studies (CNES). Chenjie Yu would like to acknowledge the Marie Skłodowska-Curie COFUND postdoctoral fellowship programme supported by the Paris Region. The authors acknowledge Aerodyne Inc. for their support in the configuration of A2S2. A special thanks goes to Andreas Petzold (Forschungszentrum Jülich GmbH) for his assistance with the early concept of the instrument.
The development of the A2S2 instrument was funded by the Institut National des Sciences de l'Univers du Centre National de la Recherche Scientifique (CNRS INSU). Its airworthiness and integration on the ATR-42 was supported by the ACROSS project, which benefits from French state aid.
This research has been supported by the Centre National de la Recherche Scientifique (grant no. AO-MI-LOURDS-INSU-2017), the Agence Nationale de la Recherche (grant nos. ANR-17-MPGA-0002 and ANR-20-CE01-0010) and the EU Horizon 2020 Marie Skłodowska-Curie Actions (grant no. 945298).
This paper was edited by Hendrik Fuchs and reviewed by two anonymous referees.
Allan, D. W.: Statistics of atomic frequency standards, P. IEEE, 54, 221–230, https://doi.org/10.1109/PROC.1966.4634, 1966.
Anderson, T. L. and Ogren, J. A.: Determining Aerosol Radiative Properties Using the TSI 3563 Integrating Nephelometer, Aerosol Sci. Tech., 29, 57–69, https://doi.org/10.1080/02786829808965551, 1998.
Anderson, T. L., Covert, D. S., Marshall, S. F., Laucks, M. L., Charlson, R. J., Waggoner, A. P., Ogren, J. A., Caldow, R., Holm, R. L., Quant, F. R., Sem, G. J., Wiedensohler, A., Ahlquist, N. A., and Bates, T. S.: Performance Characteristics of a High-Sensitivity, Three-Wavelength, Total Scatter/Backscatter Nephelometer, J. Atmos. Ocean. Tech., 13, 967–986, https://doi.org/10.1175/1520-0426(1996)013<0967:PCOAHS>2.0.CO;2, 1996.
Baynard, T., Lovejoy, E. R., Pettersson, A., Brown, S. S., Lack, D., Osthoff, H., Massoli, P., Ciciora, S., Dube, W. P., and Ravishankara, A. R.: Design and Application of a Pulsed Cavity Ring-Down Aerosol Extinction Spectrometer for Field Measurements, Aerosol Sci. Tech., 41, 447–462, https://doi.org/10.1080/02786820701222801, 2007.
Bernardoni, V., Ferrero, L., Bolzacchini, E., Forello, A. C., Gregorič, A., Massabò, D., Močnik, G., Prati, P., Rigler, M., Santagostini, L., Soldan, F., Valentini, S., Valli, G., and Vecchi, R.: Determination of Aethalometer multiple-scattering enhancement parameters and impact on source apportionment during the winter 2017/18 EMEP/ACTRIS/COLOSSAL campaign in Milan, Atmos. Meas. Tech., 14, 2919–2940, https://doi.org/10.5194/amt-14-2919-2021, 2021.
Bohren, C. F. and Huffman, D. R.: Absorption and scattering of light by small particles, John Wiley & Sons, 82–129, https://doi.org/10.1002/9783527618156.ch4, 1983.
Bond, T. C., Anderson, T. L., and Campbell, D.: Calibration and Intercomparison of Filter-Based Measurements of Visible Light Absorption by Aerosols, Aerosol Sci. Tech., 30, 582–600, https://doi.org/10.1080/027868299304435, 1999.
Cantrell, C. and Michoud, V.: An Experiment to Study Atmospheric Oxidation Chemistry and Physics of Mixed Anthropogenic–Biogenic Air Masses in the Greater Paris Area, B. Am. Meteorol. Soc., 103, 599–603, https://doi.org/10.1175/BAMS-D-21-0115.1, 2022.
Cappa, C. D., Kolesar, K. R., Zhang, X., Atkinson, D. B., Pekour, M. S., Zaveri, R. A., Zelenyuk, A., and Zhang, Q.: Understanding the optical properties of ambient sub- and supermicron particulate matter: results from the CARES 2010 field study in northern California, Atmos. Chem. Phys., 16, 6511–6535, https://doi.org/10.5194/acp-16-6511-2016, 2016.
Corbin, J. C., Pieber, S. M., Czech, H., Zanatta, M., Jakobi, G., Massabò, D., Orasche, J., El Haddad, I., Mensah, A. A., Stengel, B., Drinovec, L., Mocnik, G., Zimmermann, R., Prévôt, A. S. H., and Gysel, M.: Brown and Black Carbon Emitted by a Marine Engine Operated on Heavy Fuel Oil and Distillate Fuels: Optical Properties, Size Distributions, and Emission Factors, J. Geophys. Res.-Atmos., 123, 6175–6195, https://doi.org/10.1029/2017JD027818, 2018.
Corbin, J. C., Peng, W., Yang, J., Sommer, D. E., Trivanovic, U., Kirchen, P., Miller, J. W., Rogak, S., Cocker, D. R., Smallwood, G. J., Lobo, P., and Gagné, S.: Characterization of particulate matter emitted by a marine engine operated with liquefied natural gas and diesel fuels, Atmos. Environ., 220, 117030, https://doi.org/10.1016/j.atmosenv.2019.117030, 2020.
Corbin, J. C., Schripp, T., Anderson, B. E., Smallwood, G. J., LeClercq, P., Crosbie, E. C., Achterberg, S., Whitefield, P. D., Miake-Lye, R. C., Yu, Z., Freedman, A., Trueblood, M., Satterfield, D., Liu, W., Oßwald, P., Robinson, C., Shook, M. A., Moore, R. H., and Lobo, P.: Aircraft-engine particulate matter emissions from conventional and sustainable aviation fuel combustion: comparison of measurement techniques for mass, number, and size, Atmos. Meas. Tech., 15, 3223–3242, https://doi.org/10.5194/amt-15-3223-2022, 2022.
Davies, N. W., Fox, C., Szpek, K., Cotterell, M. I., Taylor, J. W., Allan, J. D., Williams, P. I., Trembath, J., Haywood, J. M., and Langridge, J. M.: Evaluating biases in filter-based aerosol absorption measurements using photoacoustic spectroscopy, Atmos. Meas. Tech., 12, 3417–3434, https://doi.org/10.5194/amt-12-3417-2019, 2019.
DeCarlo, P. F., Slowik, J. G., Worsnop, D. R., Davidovits, P., and Jimenez, J. L.: Particle Morphology and Density Characterization by Combined Mobility and Aerodynamic Diameter Measurements. Part 1: Theory, Aerosol Sci. Tech., 38, 1185–1205, https://doi.org/10.1080/027868290903907, 2004.
Di Biagio, C., Doppler, L., Gaimoz, C., Grand, N., Ancellet, G., Raut, J.-C., Beekmann, M., Borbon, A., Sartelet, K., Attié, J.-L., Ravetta, F., and Formenti, P.: Continental pollution in the western Mediterranean basin: vertical profiles of aerosol and trace gases measured over the sea during TRAQA 2012 and SAFMED 2013, Atmos. Chem. Phys., 15, 9611–9630, https://doi.org/10.5194/acp-15-9611-2015, 2015.
Di Biagio, C., Formenti, P., Doppler, L., Gaimoz, C., Grand, N., Ancellet, G., Attié, J.-L., Bucci, S., Dubuisson, P., Fierli, F., Mallet, M., and Ravetta, F.: Continental pollution in the Western Mediterranean basin: large variability of the aerosol single scattering albedo and influence on the direct shortwave radiative effect, Atmos. Chem. Phys., 16, 10591–10607, https://doi.org/10.5194/acp-16-10591-2016, 2016.
Di Biagio, C., Formenti, P., Balkanski, Y., Caponi, L., Cazaunau, M., Pangui, E., Journet, E., Nowak, S., Andreae, M. O., Kandler, K., Saeed, T., Piketh, S., Seibert, D., Williams, E., and Doussin, J.-F.: Complex refractive indices and single-scattering albedo of global dust aerosols in the shortwave spectrum and relationship to size and iron content, Atmos. Chem. Phys., 19, 15503–15531, https://doi.org/10.5194/acp-19-15503-2019, 2019.
Drinovec, L., Močnik, G., Zotter, P., Prévôt, A. S. H., Ruckstuhl, C., Coz, E., Rupakheti, M., Sciare, J., Müller, T., Wiedensohler, A., and Hansen, A. D. A.: The “dual-spot” Aethalometer: an improved measurement of aerosol black carbon with real-time loading compensation, Atmos. Meas. Tech., 8, 1965–1979, https://doi.org/10.5194/amt-8-1965-2015, 2015.
Formenti, P., Rajot, J. L., Desboeufs, K., Saïd, F., Grand, N., Chevaillier, S., and Schmechtig, C.: Airborne observations of mineral dust over western Africa in the summer Monsoon season: spatial and vertical variability of physico-chemical and optical properties, Atmos. Chem. Phys., 11, 6387–6410, https://doi.org/10.5194/acp-11-6387-2011, 2011.
Formenti, P., Mbemba Kabuiku, L., Chiapello, I., Ducos, F., Dulac, F., and Tanré, D.: Aerosol optical properties derived from POLDER-3/PARASOL (2005–2013) over the western Mediterranean Sea – Part 1: Quality assessment with AERONET and in situ airborne observations, Atmos. Meas. Tech., 11, 6761–6784, https://doi.org/10.5194/amt-11-6761-2018, 2018.
Foster, K., Pokhrel, R., Burkhart, M., and Murphy, S.: A novel approach to calibrating a photoacoustic absorption spectrometer using polydisperse absorbing aerosol, Atmos. Meas. Tech., 12, 3351–3363, https://doi.org/10.5194/amt-12-3351-2019, 2019.
Han, T., Xu, W., Li, J., Freedman, A., Zhao, J., Wang, Q., Chen, C., Zhang, Y., Wang, Z., Fu, P., Liu, X., and Sun, Y.: Aerosol optical properties measurements by a CAPS single scattering albedo monitor: Comparisons between summer and winter in Beijing, China, J. Geophys. Res.-Atmos., 122, 2513–2526, https://doi.org/10.1002/2016JD025762, 2017.
Hansen, A. D. A., Rosen, H., and Novakov, T.: The aethalometer – An instrument for the real-time measurement of optical absorption by aerosol particles, Sci. Total Environ., 36, 191–196, https://doi.org/10.1016/0048-9697(84)90265-1, 1984.
Haywood, J. M. and Shine, K. P.: The effect of anthropogenic sulfate and soot aerosol on the clear sky planetary radiation budget, Geophys. Res. Lett., 22, 603–606, https://doi.org/10.1029/95GL00075, 1995.
Heintzenberg, J. and Charlson, R. J.: Design and Applications of the Integrating Nephelometer: A Review, J. Atmos. Ocean. Tech., 13, 987–1000, https://doi.org/10.1175/1520-0426(1996)013<0987:DAAOTI>2.0.CO;2, 1996.
Jacobson, M. Z.: Investigating cloud absorption effects: Global absorption properties of black carbon, tar balls, and soil dust in clouds and aerosols, J. Geophys. Res.-Atmos., 117, D06205, https://doi.org/10.1029/2011JD017218, 2012.
Kahn, R. A., Andrews, E., Brock, C. A., Chin, M., Feingold, G., Gettelman, A., Levy, R. C., Murphy, D. M., Nenes, A., Pierce, J. R., Popp, T., Redemann, J., Sayer, A. M., da Silva, A. M., Sogacheva, L., and Stier, P.: Reducing Aerosol Forcing Uncertainty by Combining Models With Satellite and Within-The-Atmosphere Observations: A Three-Way Street, Rev. Geophys., 61, e2022RG000796, https://doi.org/10.1029/2022RG000796, 2023.
Karol, Y., Tanré, D., Goloub, P., Vervaerde, C., Balois, J. Y., Blarel, L., Podvin, T., Mortier, A., and Chaikovsky, A.: Airborne sun photometer PLASMA: concept, measurements, comparison of aerosol extinction vertical profile with lidar, Atmos. Meas. Tech., 6, 2383–2389, https://doi.org/10.5194/amt-6-2383-2013, 2013.
Kebabian, P. L., Herndon, S. C., and Freedman, A.: Detection of Nitrogen Dioxide by Cavity Attenuated Phase Shift Spectroscopy, Anal. Chem., 77, 724–728, https://doi.org/10.1021/ac048715y, 2005.
Kebabian, P. L., Robinson, W. A., and Freedman, A.: Optical extinction monitor using cw cavity enhanced detection, Rev. Sci. Instrum., 78, 063102, https://doi.org/10.1063/1.2744223, 2007.
Laj, P., Bigi, A., Rose, C., Andrews, E., Lund Myhre, C., Collaud Coen, M., Lin, Y., Wiedensohler, A., Schulz, M., Ogren, J. A., Fiebig, M., Gliß, J., Mortier, A., Pandolfi, M., Petäja, T., Kim, S.-W., Aas, W., Putaud, J.-P., Mayol-Bracero, O., Keywood, M., Labrador, L., Aalto, P., Ahlberg, E., Alados Arboledas, L., Alastuey, A., Andrade, M., Artíñano, B., Ausmeel, S., Arsov, T., Asmi, E., Backman, J., Baltensperger, U., Bastian, S., Bath, O., Beukes, J. P., Brem, B. T., Bukowiecki, N., Conil, S., Couret, C., Day, D., Dayantolis, W., Degorska, A., Eleftheriadis, K., Fetfatzis, P., Favez, O., Flentje, H., Gini, M. I., Gregorič, A., Gysel-Beer, M., Hallar, A. G., Hand, J., Hoffer, A., Hueglin, C., Hooda, R. K., Hyvärinen, A., Kalapov, I., Kalivitis, N., Kasper-Giebl, A., Kim, J. E., Kouvarakis, G., Kranjc, I., Krejci, R., Kulmala, M., Labuschagne, C., Lee, H.-J., Lihavainen, H., Lin, N.-H., Löschau, G., Luoma, K., Marinoni, A., Martins Dos Santos, S., Meinhardt, F., Merkel, M., Metzger, J.-M., Mihalopoulos, N., Nguyen, N. A., Ondracek, J., Pérez, N., Perrone, M. R., Petit, J.-E., Picard, D., Pichon, J.-M., Pont, V., Prats, N., Prenni, A., Reisen, F., Romano, S., Sellegri, K., Sharma, S., Schauer, G., Sheridan, P., Sherman, J. P., Schütze, M., Schwerin, A., Sohmer, R., Sorribas, M., Steinbacher, M., Sun, J., Titos, G., Toczko, B., Tuch, T., Tulet, P., Tunved, P., Vakkari, V., Velarde, F., Velasquez, P., Villani, P., Vratolis, S., Wang, S.-H., Weinhold, K., Weller, R., Yela, M., Yus-Diez, J., Zdimal, V., Zieger, P., and Zikova, N.: A global analysis of climate-relevant aerosol properties retrieved from the network of Global Atmosphere Watch (GAW) near-surface observatories, Atmos. Meas. Tech., 13, 4353–4392, https://doi.org/10.5194/amt-13-4353-2020, 2020.
Lamkaddam, H., Gratien, A., Pangui, E., Cazaunau, M., Picquet-Varrault, B., and Doussin, J.-F.: High-NOx Photooxidation of n-Dodecane: Temperature Dependence of SOA Formation, Environ. Sci. Technol., 51, 192–201, https://doi.org/10.1021/acs.est.6b03821, 2017.
Liu, D., He, C., Schwarz, J. P., and Wang, X.: Lifecycle of light-absorbing carbonaceous aerosols in the atmosphere, npj Climate and Atmospheric Science, 3, 40, https://doi.org/10.1038/s41612-020-00145-8, 2020.
Liu, F., Snelling, D. R., Thomson, K. A., and Smallwood, G. J.: Estimate of scattering truncation in the cavity attenuated phase shift PMSSA monitor using radiative transfer theory, Aerosol Sci. Tech., 52, 588–596, https://doi.org/10.1080/02786826.2018.1437891, 2018.
Massoli, P., Murphy, D. M., Lack, D. A., Baynard, T., Brock, C. A., and Lovejoy, E. R.: Uncertainty in Light Scattering Measurements by TSI Nephelometer: Results from Laboratory Studies and Implications for Ambient Measurements, Aerosol Sci. Tech., 43, 1064–1074, https://doi.org/10.1080/02786820903156542, 2009.
Massoli, P., Kebabian, P. L., Onasch, T. B., Hills, F. B., and Freedman, A.: Aerosol Light Extinction Measurements by Cavity Attenuated Phase Shift (CAPS) Spectroscopy: Laboratory Validation and Field Deployment of a Compact Aerosol Particle Extinction Monitor, Aerosol Sci. Tech., 44, 428–435, https://doi.org/10.1080/02786821003716599, 2010.
Modini, R. L., Corbin, J. C., Brem, B. T., Irwin, M., Bertò, M., Pileci, R. E., Fetfatzis, P., Eleftheriadis, K., Henzing, B., Moerman, M. M., Liu, F., Müller, T., and Gysel-Beer, M.: Detailed characterization of the CAPS single-scattering albedo monitor (CAPS PMssa) as a field-deployable instrument for measuring aerosol light absorption with the extinction-minus-scattering method, Atmos. Meas. Tech., 14, 819–851, https://doi.org/10.5194/amt-14-819-2021, 2021.
Moosmüller, H., Varma, R., and Arnott, W. P.: Cavity Ring-Down and Cavity-Enhanced Detection Techniques for the Measurement of Aerosol Extinction, Aerosol Sci. Tech., 39, 30–39, https://doi.org/10.1080/027868290903880, 2005.
Moosmüller, H., Chakrabarty, R. K., and Arnott, W. P.: Aerosol light absorption and its measurement: A review, J. Quant. Spectrosc. Ra., 110, 844–878, https://doi.org/10.1016/j.jqsrt.2009.02.035, 2009.
Ogren, J. A., Wendell, J., Andrews, E., and Sheridan, P. J.: Continuous light absorption photometer for long-term studies, Atmos. Meas. Tech., 10, 4805–4818, https://doi.org/10.5194/amt-10-4805-2017, 2017.
Onasch, T. B., Massoli, P., Kebabian, P. L., Hills, F. B., Bacon, F. W., and Freedman, A.: Single Scattering Albedo Monitor for Airborne Particulates, Aerosol Sci. Tech., 49, 267–279, https://doi.org/10.1080/02786826.2015.1022248, 2015.
Peers, F., Francis, P., Fox, C., Abel, S. J., Szpek, K., Cotterell, M. I., Davies, N. W., Langridge, J. M., Meyer, K. G., Platnick, S. E., and Haywood, J. M.: Observation of absorbing aerosols above clouds over the south-east Atlantic Ocean from the geostationary satellite SEVIRI – Part 1: Method description and sensitivity, Atmos. Chem. Phys., 19, 9595–9611, https://doi.org/10.5194/acp-19-9595-2019, 2019.
Perim de Faria, J., Bundke, U., Freedman, A., Onasch, T. B., and Petzold, A.: Laboratory validation of a compact single-scattering albedo (SSA) monitor, Atmos. Meas. Tech., 14, 1635–1653, https://doi.org/10.5194/amt-14-1635-2021, 2021.
Petzold, A. and Schönlinner, M.: Multi-angle absorption photometry – a new method for the measurement of aerosol light absorption and atmospheric black carbon, J. Aerosol Sci., 35, 421–441, https://doi.org/10.1016/j.jaerosci.2003.09.005, 2004.
Pfeifer, S., Müller, T., Freedman, A., and Wiedensohler, A.: The influence of the baseline drift on the resulting extinction values of a cavity attenuated phase shift-based extinction monitor (CAPS PMex), Atmos. Meas. Tech., 13, 2161–2167, https://doi.org/10.5194/amt-13-2161-2020, 2020.
Riemer, N., Ault, A. P., West, M., Craig, R. L., and Curtis, J. H.: Aerosol Mixing State: Measurements, Modeling, and Impacts, Rev. Geophys., 57, 187–249, https://doi.org/10.1029/2018RG000615, 2019.
Schmid, B., Hegg, D. A., Wang, J., Bates, D., Redemann, J., Russell, P. B., Livingston, J. M., Jonsson, H. H., Welton, E. J., Seinfeld, J. H., Flagan, R. C., Covert, D. S., Dubovik, O., and Jefferson, A.: Column closure studies of lower tropospheric aerosol and water vapor during ACE-Asia using airborne Sun photometer and airborne in situ and ship-based lidar measurements, J. Geophys. Res.-Atmos., 108, 8656, https://doi.org/10.1029/2002JD003361, 2003.
Tavakoli, F. and Olfert, J. S.: An Instrument for the Classification of Aerosols by Particle Relaxation Time: Theoretical Models of the Aerodynamic Aerosol Classifier, Aerosol Sci. Tech., 47, 916–926, https://doi.org/10.1080/02786826.2013.802761, 2013.
Virkkula, A.: Correction of the Calibration of the 3-wavelength Particle Soot Absorption Photometer (3λ PSAP), Aerosol Sci. Tech., 44, 706–712, https://doi.org/10.1080/02786826.2010.482110, 2010.
Virkkula, A., Ahlquist, N. C., Covert, D. S., Arnott, W. P., Sheridan, P. J., Quinn, P. K., and Coffman, D. J.: Modification, Calibration and a Field Test of an Instrument for Measuring Light Absorption by Particles, Aerosol Sci. Tech., 39, 68–83, https://doi.org/10.1080/027868290901963, 2005.
von der Weiden, S.-L., Drewnick, F., and Borrmann, S.: Particle Loss Calculator – a new software tool for the assessment of the performance of aerosol inlet systems, Atmos. Meas. Tech., 2, 479–494, https://doi.org/10.5194/amt-2-479-2009, 2009.
Wang, J., Doussin, J. F., Perrier, S., Perraudin, E., Katrib, Y., Pangui, E., and Picquet-Varrault, B.: Design of a new multi-phase experimental simulation chamber for atmospheric photosmog, aerosol and cloud chemistry research, Atmos. Meas. Tech., 4, 2465–2494, https://doi.org/10.5194/amt-4-2465-2011, 2011.
Weber, P., Petzold, A., Bischof, O. F., Fischer, B., Berg, M., Freedman, A., Onasch, T. B., and Bundke, U.: Relative errors in derived multi-wavelength intensive aerosol optical properties using cavity attenuated phase shift single-scattering albedo monitors, a nephelometer, and tricolour absorption photometer measurements, Atmos. Meas. Tech., 15, 3279–3296, https://doi.org/10.5194/amt-15-3279-2022, 2022.
Yu, C. and Formenti, P.: Dataset of the A2S2 laboratory experiment results, Zenodo [data set], https://doi.org/10.5281/zenodo.10056220, 2023a.
Yu, C. and Formenti, P.: ACROSS_LISA_SAFIRE-ATR42_A2S2-Ext-Scatt-630_20220618-20220705, Aeris [data set], https://doi.org/10.25326/525, 2023b.
Yu, C. and Formenti, P.: ACROSS_LISA_SAFIRE-ATR42_A2S2-Ext-Scatt-450_20220618-20220705, Aeris [data set], https://doi.org/10.25326/526, 2023c.
Yu, C., Liu, D., Hu, K., Tian, P., Wu, Y., Zhao, D., Wu, H., Hu, D., Guo, W., Li, Q., Huang, M., Ding, D., and Allan, J. D.: Aerodynamic size-resolved composition and cloud condensation nuclei properties of aerosols in a Beijing suburban region, Atmos. Chem. Phys., 22, 4375–4391, https://doi.org/10.5194/acp-22-4375-2022, 2022.
Zhao, J., Du, W., Zhang, Y., Wang, Q., Chen, C., Xu, W., Han, T., Wang, Y., Fu, P., Wang, Z., Li, Z., and Sun, Y.: Insights into aerosol chemistry during the 2015 China Victory Day parade: results from simultaneous measurements at ground level and 260 m in Beijing, Atmos. Chem. Phys., 17, 3215–3232, https://doi.org/10.5194/acp-17-3215-2017, 2017.