the Creative Commons Attribution 4.0 License.
the Creative Commons Attribution 4.0 License.
 | 05 Jun 2024
Pico-Light H2O: intercomparison of in situ water vapour measurements during the AsA 2022 campaign
Mélanie Ghysels
Georges Durry
Nadir Amarouche
Dale Hurst
Emrys Hall
Kensy Xiong
Jean-Charles Dupont
Jean-Christophe Samake
Fabien Frérot
Raghed Bejjani
Emmanuel D. Riviere
The mid-infrared lightweight tunable diode laser hygrometer, “Pico-Light H2O”, the successor to Pico-SDLA H2O, is presented and its performances are evaluated during the AsA 2022 balloon-borne intercomparison campaign conducted at the CNES Aire-sur-l'Adour (AsA, 43.70° N; 0.25° W) balloon launch facility and the Aeroclub d'Aire-sur-l'Adour in France. The Pico-Light instrument has primarily been developed for sounding of the upper troposphere and stratosphere, although during the AsA 2022 campaign we expand the range of comparison to include additionally the lower troposphere. Three different types of hygrometer and two models of radiosonde were flown, operated by the French Space Agency (CNES) and the NOAA Global Monitoring Laboratory (GML) scientific teams: Pico-Light H2O, the NOAA Frost Point Hygrometer (FPH), the micro-hygrometer (in an early phase of development), and M20 and iMet-4 sondes. Within this framework, we intend to validate measurements of Pico-Light H2O through a first intercomparison with the NOAA FPH instrument. The in situ monitoring of water vapour in the upper troposphere–lower stratosphere continues to be very challenging from an instrumental point of view because of the very small amounts of water vapour to be measured in these regions of the atmosphere. Between the lapse rate tropopause (11–12.3 km) and 20 km, the mean relative difference between water vapour mixing ratio measurements by Pico-Light H2O and NOAA FPH was 4.2 % ± 7.7 %, and the mean tropospheric difference was 3.84 % ± 23.64 %, with differences depending on the altitude range considered. In the troposphere, relative humidity (RH) over water comparisons led to agreement between Pico-Light and NOAA FPH of −0.2 % on average, with excursions of about 30 % RH due to moisture variability. Expanding the comparison to meteorological sondes, the iMet-4 sondes agree well with both Pico-Light and FPH between the ground and 7.5 km (within ± 3 % RH), as do the M20 sondes, up to 13 km, which are wet-biased by 3 % RH and dry-biased by 20 % in cases of saturation.
- Article
(3312 KB) - Full-text XML
- BibTeX
- EndNote


Water vapour plays an important role in the radiative balance on earth since it is the principal source of infrared opacity. Its contribution to the greenhouse effect is about 60 %–75 % (Kiehl and Trenberth, 1997; Schmidt et al., 2010; Lacis et al., 2013). Simulations based on radiative–convective models and observations have demonstrated that the surface warming caused by an increase in greenhouse gases like CO2 could lead to a moistening of the troposphere (Dessler, 2013; Dessler et al., 2008; Dessler and Wong, 2009; Minschwaner and Dessler, 2004; Soden et al., 2005). This coupling could double the warming induced by CO2 only (Banerjee et al., 2019; Dessler et al., 2013). Some models indicate that an increase in tropospheric temperatures could increase stratospheric water vapour (SWV), implying the existence of an SWV feedback coefficient of about +0.3 W m−2 K−1 (Dessler et al., 2013). Therefore, SWV has a great influence on the global radiative and chemical equilibrium. Various studies, based on radiative–chemical models, have shown a correlation between the variations in SWV and the changes in stratospheric ozone, as well as the changes in stratospheric and mean global temperatures (Dvortsov and Solomon, 2001; Riese et al., 2012; Solomon et al., 2010). Stratospheric water vapour is a significant contributor to the radiative equilibrium of the stratosphere and therefore to the global radiative equilibrium. Observational studies have shown that a moistening of the stratosphere could lead to a warming of the mean surface temperature (Forster and Shine, 1999; Wang et al., 2017), with disparities at different latitudes.
In the upper troposphere and stratosphere, mixing ratios of water vapour are found to be between 2 and 5 ppmv. Hence, in this altitude range, water vapour measurements are likely to be corrupted by water vapour outgassing from the instrument or from the balloon envelope. Altitudes higher than 15 km are only probed at high resolution by instruments carried under stratospheric balloons or a selected number of high-altitude aircraft. Satellite-borne observations, such as those carried out by Aura MLS, allow vertical profiling with a vertical resolution scaling from 1.5 to 3 km above 15 km with a high spatial and temporal coverage. Though the large coverage allows one to address large-scale processes, to investigate regional or local processes, the use of in situ instruments remains the only way to proceed. Such is the case for satellite validation activities. Instruments such as the one described here allow vertical resolution of a few metres, allowing us also to capture fine-scale signatures due to processes not being well resolved in global models. Measuring such low abundance remains challenging. The Global Climate Observing System (GCOS) requirements for the measurement of stratospheric profiles carry a 5 % uncertainty. Therefore, the differences between coincident measurements in this region have to agree within the 5 % range. It is recognized that rigorous intercomparisons are of critical importance to allow us a valuable scientific interpretation.
Comparisons between hygrometers have found discrepancies as large as 50 % at the sub-10 ppm level, well above the stated instrumental uncertainties (5 %–10 %). In Vömel et al. (2007), the comparison between Lyman-α hygrometer FLASH-B and the NOAA/CMDL frost point hygrometers in the stratosphere lead to differences within ± 10 % (0.5 ppmv) between 11 and 20 km, and as high as 30 % for altitudes lower than 11 km and higher than 20 km. Rollins et al. (2014) compared aircraft- and balloon-based in situ hygrometers in the upper troposphere–lower stratosphere (UTLS) during the 2011 airborne intercomparison campaign MACPEX. Differences as large as 20 % (0.8 ppmv) were found for mixing ratios below 5 ppmv, depending on the instrument pair considered and the volume mixing ratio probed. Kaufmann et al. (2018) reported stratospheric comparisons of Lyman-alpha FISH and AIMS linear quadrupole mass spectrometer to an average reference value calculated from measurements from AIMS, FISH and the tunable diode laser spectrometers SHARC and HAI. Measurements have been performed on board the HALO aircraft. In the range below 10 ppmv, the mean differences between AIMS, FISH, and the reference value range ±15 %. Deviations as large as 20 % have been found in some cases for which the reason remains unclear. In Ghysels et al. (2016), we compared our former Pico-SDLA H2O hygrometer with the FLASH-B Lyman-α hygrometer in the tropical upper troposphere and stratosphere (15–23 km). The differences between the two instruments ranged from 0.5 % ± 4.5 % to 1.9 % ± 9.0 % (25–100 ppbv) above the cold point tropopause.
In this work, we report on the development of a rugged, lightweight, open-cell, tunable diode laser hygrometer, “Pico-Light H2O”. Such a hygrometer launched on small balloons can make frequent measurements in difficult meteorological conditions and at moderate cost, thereby multiplying flight opportunities. The high resolution and accuracy of such an instrument are invaluable in the investigation of transport processes in the UTLS, where absolute modulation of the local mixing ratio scales are within 10 %–20 % of the typical mixing ratio. Between 2019 and 2022, Pico-Light H2O was tested in seven flights from rubber balloons at the Aire-sur-l'Adour (AsA) CNES balloon facility in southwestern France (43.7° N). In 2022, within the framework of the AsA 2022 campaign (https://www.hemera-h2020.eu/small-sensors-campaign/, last access: 20 March 2024), the resulting measurements of water vapour were compared with those of the NOAA ESRL Frost Point Hygrometer (NOAA FPH), from the ground up to a few kilometres below the balloon burst altitude, and with those of meteorological radiosondes (M20 and iMet-4) in the lower troposphere. Section 2 describes briefly Pico-SDLA H2O, the predecessor of the present Pico-Light H2O hygrometer. Section 3 describes in detail the Pico-Light H2O hygrometer, its performances, and a discussion around instrumental uncertainties. Section 4 describes the NOAA FPH. The M20 sondes are described in Sect. 5. Sections 6 and 7 provide an overview of the data sets and flight conditions, and then Sects. 8 and 9 present the results of the intercomparison of the volume mixing ratio between Pico-Light H2O and NOAA FPH (Sect. 8), as well as of the relative humidity in the troposphere between the in situ hygrometers and meteorological sondes (Sect. 9).
Pico-Light H2O is the lightweight successor to Pico-SDLA H2O (Durry et al., 2008), which we will briefly describe. This balloon-borne spectrometer was tested against other hygrometers, both in flight and in an atmospheric simulation chamber (Behera et al., 2018; Berthet et al., 2013; Durry et al., 2008; Fahey et al., 2014; Ghysels et al., 2016; Korotcenkov, 2018). With the Pico-SDLA, the beam of a 2.63 µm antimonide laser diode was propagated in the open atmosphere over a 1 m distance; absorption spectra were thereby recorded in situ at 1 s intervals. The water vapour mixing ratios were retrieved from the in situ absorption spectra using a molecular model in conjunction with in situ atmospheric pressure and temperature measurements. The laser wavelength was chosen by adjusting the driving current and the temperature of the laser semiconductor (by means of a Peltier thermoelement). The ramping of the driving current allowed the scanning of the laser wavelength over the full molecular line shape of the selected H2O molecular transition (Durry and Megie, 2000). With a weight around 8.5 kg, Pico-SDLA H2O was operated from medium-sized balloons or as a piggyback on board large scientific gondolas. Table 1 compares Pico-SDLA H2O with the new Pico-Light H2O.
Table 1Comparison of Pico-Light H2O with its predecessor Pico-SDLA H2O.
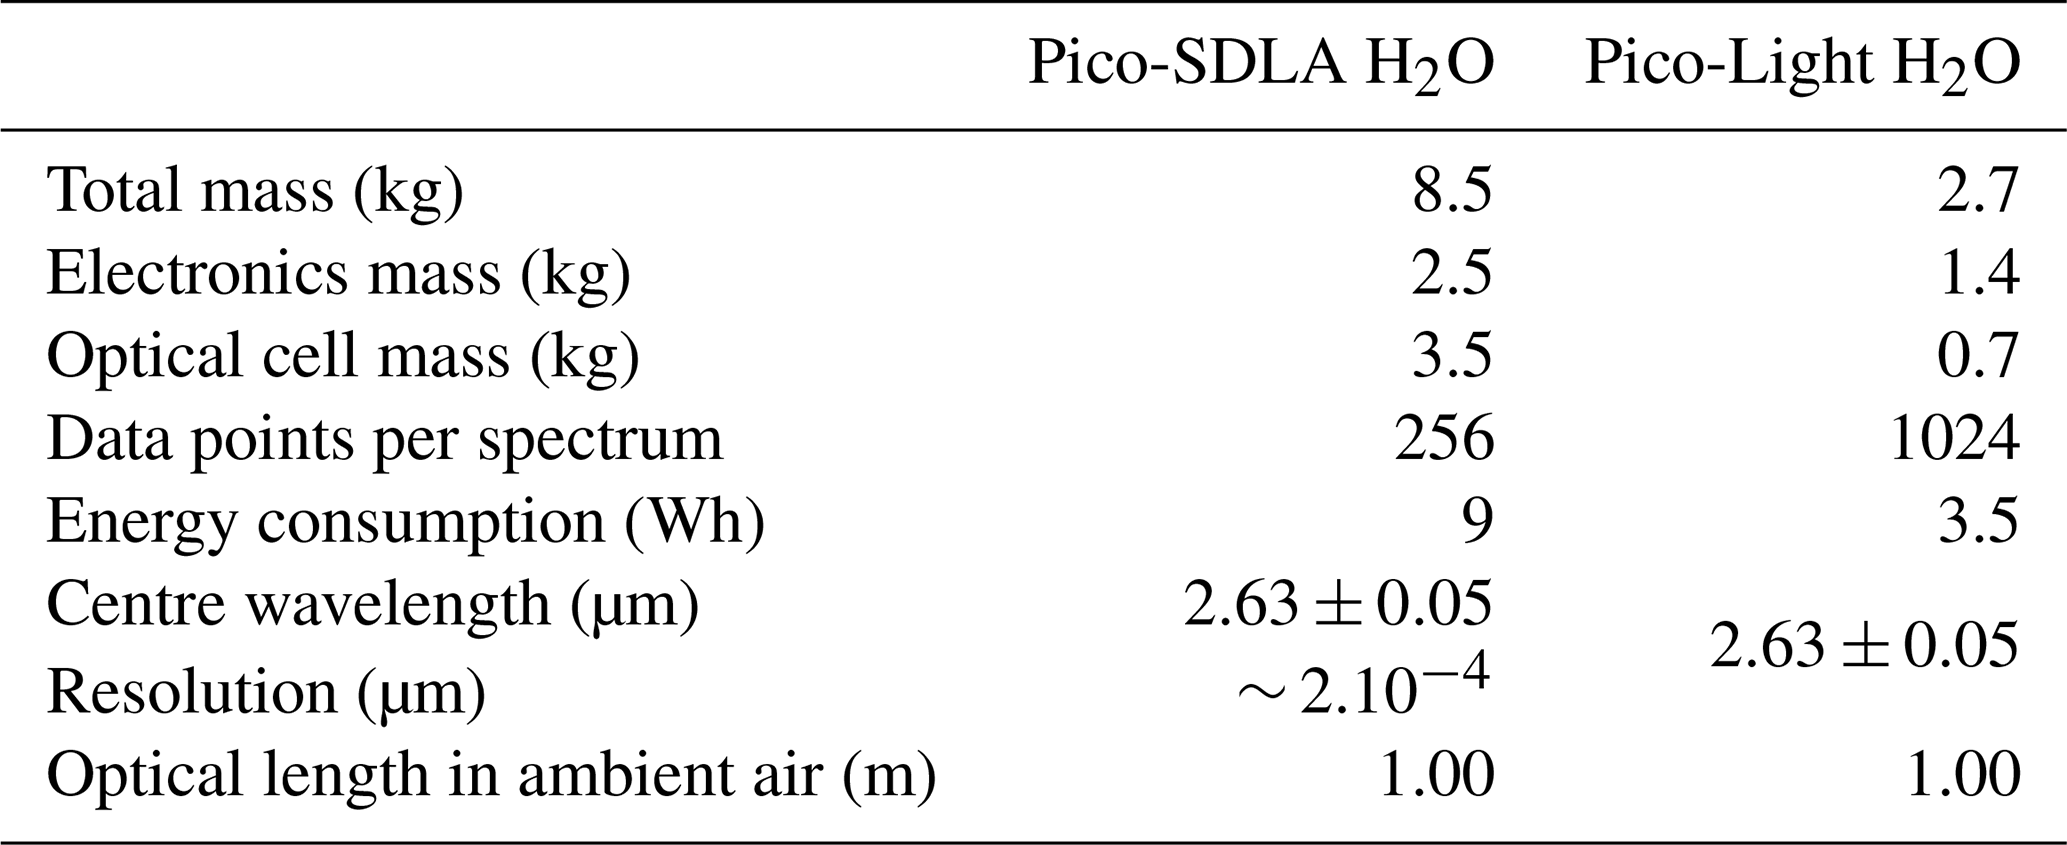
The novelty of Pico-Light H2O lies in its new electronics, lighter weight (2.7 kg), simpler mechanical structure, and improved energy management. The dramatic weight reduction made it possible to fly the instrument from a small rubber weather balloon. The flight duration under such a balloon is about 2 h, while that of a medium-sized balloon is 4–8 h. Thus, the instrument is subjected to low temperatures (down to −70 °C at the tropopause) during a shorter period of time, compared with the Pico-SDLA instrument.
The development of the Pico-Light H2O hygrometer began in 2017 with the support of CNES and CNRS. Figure 1 shows the hygrometer and its launch under a 1200 g Totex rubber balloon from the CNES Aire-sur-l'Adour facility (France). The hygrometer was launched twice in 2019 and five times in 2022. The flights occurred within the HEMERA Work Package 11 (WP11). Pico-Light H2O has primarily been developed for frequent soundings of the UTLS, relying on the optimization of the optical cell design (minimizing contamination of the measurements) and absorption line selection (line intensity and width).
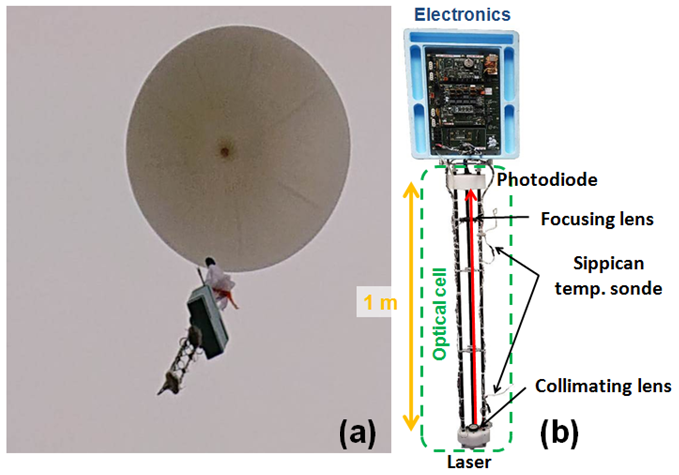
Figure 1Panel (a) shows the Pico-Light H2O during its launch under a 1200 g rubber balloon from the CNES Aire-sur-l'Adour facility in 2019 and 2022 (France), and (b) is a detailed picture of the hygrometer.
The Pico-Light H2O hygrometer offers several advantages compared with closed-cell spectroscopic techniques. The fast acquisition and short response time (typically a few milliseconds) allow the monitoring of fast humidity changes since there is no need for equilibrium with any cell surfaces. The open optical path reduces contamination of the measurements by water desorbed from the walls of a closed cell. Moreover, the technique used is highly selective as a specific water vapour rovibronic transition is swept over by the laser, which is free from overlapping by other molecular species. Like many optical absorption hygrometers, the instrument is highly sensitive, even at low mixing ratios. Finally, the large dynamic range provides the mixing ratio profile from the ground to the burst altitude, unlike other techniques.
3.1 Electronics
The enhanced electronics utilized in the current version are both smaller and more energy efficient compared with those employed in Pico-SDLA. This decrease in power consumption and shorter flight duration have contributed to a significant one-third reduction in the energy budget, now standing at just 3.5 Wh. As a result of these reduced power requirements, we have managed to cut down the battery weight by one-sixth, resulting in a mere 0.4 kg. The shorter flight also means that the electronics box needs less thermal insulation, and its heat capacity is sufficient to keep its temperature above the minimum operating temperature during the entire flight. Using less thermal insulation contributes to the decrease in weight. Figure 2 shows the instrument architecture.
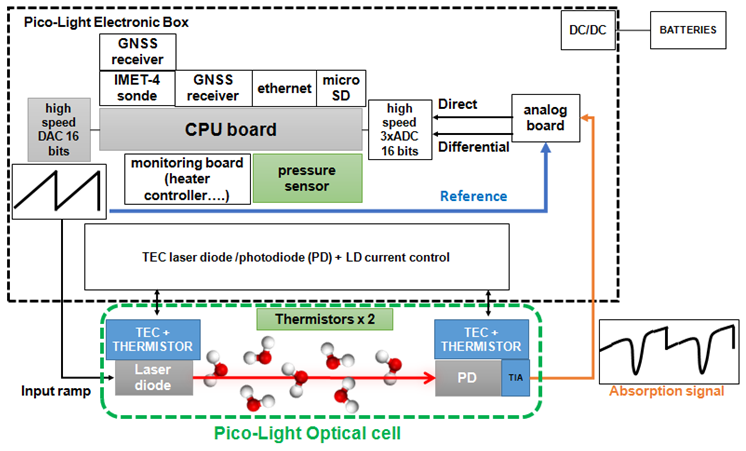
The electronics box includes an environmental sensor (model iMet-4; InterMet). Its temperature and pressure readings are not used, but its humidity measurements provide a useful check on the laser hygrometer's operation in the lower troposphere. The Pico-Light electronics also include a global navigation satellite system (GNSS) that tracks the instrument position throughout the flight. A second GNSS that is included in the environmental sensor can be used if the first one fails. The ambient pressure is measured by an absolute pressure transducer (precision 0.05 % full scale, absolute uncertainty 0.5 hPa; model PPT1; Honeywell). The retrievals are obtained using the Honeywell pressure as an input in the spectrum processing. The pressure measurements allow the software to detect whether the balloon is ascending or descending. Measured parameters, such as pressure, are used in various control loops. If the value of one of the parameters is anomalous, the software turns off the associated loop and sets the parameter back to its initial value.
The acquisition module controls the gains of the analogue signal chain and the temperatures of both the detector and the diode laser. It also generates the laser current ramp. One measurement consists of three signals that are recorded and digitized simultaneously using a 16-bit ADC on a parallel bus interfaced with a microcontroller: (1) the direct atmospheric signal, (2) the ramp signal, and (3) the differential signal. The direct atmospheric signal is the absorption spectrum recorded by the detector, which is a cooled InAS photodiode (Judson Technologies). The ramp signal scans the laser wavelength by modulating its driving current. The ramp is generated by a 16-bit high-speed digital-to-analogue converter controlled by a serial peripheral interface bus. Unfortunately, ramping the laser-driving current also ramps the power of the laser, resulting in a sloping background in the atmospheric spectra. Hence, we record also the analogue difference between the atmospheric signal and the ramp signal (Durry and Megie, 2000; Durry et al., 2000). The relative contribution of the two signals is balanced so as to minimize the sloping background. The differential signal is used to determine the position of the absorption line peak during the flight; any spectral drift is compensated by adjusting the temperature of the laser diode. It has been stressed that only the direct atmospheric signal is used for mixing ratio retrievals.
During the flight, the embedded software operates the instrument with no human control, and no telecommand/telemetry is necessary. The software includes all parameters necessary for the automatic tasks, e.g. the frequency detuning of spectra according to the ambient pressure and the selection of the absorption line according to the altitude. During ascent and descent, the software adjusts the amplitude of the diode current modulation and selects the proper water vapour absorption line based on the ambient pressure. Pico-Light uses two absorption lines for the sounding: the weaker one is used in the lower troposphere and the other (having a line intensity 10 times larger) is used from higher in the atmosphere in order to compensate for the water vapour mole fraction change. The proper diode temperatures, corresponding to each of the two lines, are set on board depending on the measured ambient pressure. The diode laser temperature is stabilized to within 10 mK over one scan. Therefore, the software knows which of the two lines has to be used at one given pressure to optimize the measurement uncertainty. Essential diagnostics and information about the physical environment are stored on a micro-SD drive along with the data, which then require recovery of the instrument following landing.
3.2 Optical cell
The optical cell, shown in Fig. 1, includes the 1 m open structure beneath the electronic enclosure. The mechanical design of Pico-Light H2O differs significantly from that of its predecessor Pico-SDLA H2O. The mechanical structure of Pico-SDLA H2O comprised six carbon fibre composite tubes, with three large braces made of polyvinyl chloride. The structure of Pico-Light H2O comprises only three carbon fibre composite tubes, with three small braces made of aluminium. The high strength-to-weight ratio of the tubes strengthens the instrument against the mechanical stress of a flight and collision damage when landing. These modifications have reduced the weight of the optical cell by a factor of 5, from 3.5 to 0.7 kg.
The ambient temperature is measured using two fast-response temperature sensors (Sippican) with an uncertainty of 0.2 °C rms and a resolution of 0.1 °C. Their uncertainty was improved by an intercomparison programme with the World Meteorological Organization (WMO) (Nash et al., 2011). One sensor is located at each end of the optical cell. Each temperature measurement is the average of 20 readings made during 1 ms, with outliers removed. The time between measurements is sufficiently short so that successive measurements during a flight differ by less than 0.05 °C.
Despite having an innovative reflective coating, the temperature sensors were susceptible to solar and infrared radiation, even though the sun elevation during the descents of the balloon was between 11 and 20°. Therefore, corrections for radiation heating were applied according to the manufacturer's data sheet based on the results of the WMO intercomparison. The temperature value used to analyse the spectra was the coldest one, since it was assumed to be less affected by solar radiation.
The collimating and focusing lenses are heated to avoid the formation of ice or dew.
3.3 Spectra acquisition and laboratory testing
The H2O measurements are taken at 1 s intervals. During that interval, 200 ms are devoted to record the elementary atmospheric spectrum (within this time frame, five spectra are recorded), which comprises 1024 data points. The remaining 800 ms are used to record the atmospheric pressure and temperature, the GPS data, and the status of the instrument (internal temperatures, electronics gains, laser current and temperature, etc.). The average descent speed varies from close to 35 m s−1 at the ceiling altitude down to 5 m s−1 in the lower troposphere. Then, the vertical resolution of the measurements varies accordingly from 35 to 5 m.
During a flight, the temperature gradient encountered during the dynamic phase of the flight is able to cause a drift in the laser wavelength, leading to the acquisition of unusable spectra. To overcome this issue, the laser diode is mounted into a thermally insulated enclosure equipped with a heater and a thermistor. This temperature-controlled enclosure is able to stabilize the laser wavelength despite the severe temperature range encountered during a flight (from +30 °C at ground level to −70 °C at the tropopause). The photodiode enclosure has a similar temperature control. The appropriate laser current and temperature are determined from both room temperature and cold-environment calibration in an environmental chamber. During a flight, the onboard software uses the measured atmospheric temperature to further stabilize the temperatures of both the photodiode and the laser, achieving a stability better than 5 mK.
3.4 Spectroscopy
The mixing ratio is extracted from the atmospheric absorption spectrum using a non-linear least-squares fitting algorithm applied to the full line shape, based on the Beer–Lambert law and in conjunction with in situ pressure and temperature measurements (Durry and Megie, 1999). The molecular line shape is modelled using a Voigt profile (VP). Fitting the VP to the measured spectrum yielded residuals consistent with the instrument noise. No systematic residuals caused by higher-order line shape effects were observed at stratospheric pressures (our main region of interest), or at higher pressures, in the middle troposphere. For a water vapour line broadened by air, collision-induced fine effects can cause the VP to be inadequate in some spectral regions. These effects are observed for other molecular species also. Some of these effects have been reported in spectroscopic studies (Delahaye et al., 2019; Devi et al., 2007b, a; Galatry, 1961; Ghysels et al., 2013, 2014; Hartmann et al., 2009; Joubert et al., 2002; Lamouroux et al., 2015; Lance et al., 1997; Lisak et al., 2003, 2015). The impact of such inadequacy on the uncertainty budget depends on the signal-to-noise ratio (SNR) of the spectra. An advanced line profile will improve the retrievals if the SNR is sufficient to extract the additional line parameters. In the present case, for the lines considered, and due to the spectra SNR, such high-order effects are not noticeable in our region of interest, and therefore the induced bias remains impossible to estimate. However, the line area is the predominant factor in the determination of the mixing ratio since the full line shape is used in the fit. The two water vapour lines used here are isolated (i.e. not affected by line mixing; Hartmann et al., 1996) and have limited interference with neighbouring lines. Possible non-Voigt effects include Dicke narrowing, having its largest influence at low pressures, and speed dependence of the collisional width, having its largest influence at high pressures. The uncertainty related to these high-order effects ranges at the sub-percent level (∼ 0.1 %). Neither effect is discernible in the residuals, unlike for our carbon dioxide and methane sensors, where more advanced line shapes are used together with spectroscopic parameters previously determined in laboratory.
From the ground to the balloon burst altitude, the water vapour mixing ratio varies by several orders of magnitude, from about 4 ppmv in the stratosphere to several thousand parts per million by volume at ground level. Therefore, two spectroscopic transitions are needed to probe both troposphere and stratosphere: the 202←101 and the 413←414 lines, each of them suitable for a given range of concentration. The selected rotation–vibration H2O transitions are the same as for the former Pico-SDLA instrument. For measurements from the ground to around 260 hPa, the 413←414 HO line at 3802.96561 cm−1 is used. Above the 260 hPa level, the 202←101HO line at 3801.41863 cm−1 is used. Both sets of line parameters are obtained from a laboratory study (Durry et al., 2008). The uncertainty of each line intensity is 0.85 % and 0.95 %, respectively, for the 202←101HO line and the 413←414 line.
The spectra processing is divided into four steps: (1) the search for offline data points used for baseline interpolation, (2) construction of the absolute frequency axis of the spectra, (3) determination of a first approximation of the mixing ratio based on peak absorbance, and (4) non-linear least-squares fitting of atmospheric spectra. The selection of the offline data points is realized by calculating the first derivative of the signal. The minimum and maximum of the derivative give the positions of the points at the line half maximum. The points used for baseline interpolation are those located away from the line centre by three times the full width at half maximum. In the stratosphere, the probed line is well isolated. At pressures higher than 350 hPa, the wings of the 202←101HO line have a significant contribution to the measured transmittance of the 413←414 HO line. This contribution is therefore included in the fitting procedure. The transmittance of these lines is calculated based on the measured pressure and temperature, as well as the retrieved mixing ratio. In the considered spectral range, the contribution of other greenhouse gases is negligible since line intensities are below 10−23 cm−1 molecule1− cm2, which is 2–3 orders of magnitude smaller than the line intensities of the probe lines. A fourth-order polynomial function is then used to interpolate the spectrum baseline on a first approximation. Dividing the atmospheric spectrum by this polynomial baseline allows one to calculate an approximate transmittance and to estimate a first approximation of the mixing ratio (using the peak absorbance value), which will be used as an input of the non-linear least-squares fitting procedure. The absolute frequency axis of the spectrum is calculated using spectroscopy: the spectrum peak position coincides with the absolute line centre frequency found in the HITRAN spectroscopic database (Gordon et al., 2017). Knowing the ambient pressure and temperature, and using the first approximation of the volume mixing ratio, allows one to simulate a synthetic spectrum from which the absolute frequencies of the points at the half maximum are known. The frequency step between each data point is then equal to the absolute frequency width at half maximum (obtained from the synthetic spectrum) divided by the number of experimental points at half maximum (estimated from the approximate experimental transmittance, as describe above). The absolute frequency step is assumed to be constant over the full scan.
During the spectra processing, the standard deviation of the fitting residuals is calculated. This acts as a criterion of the quality of the fit. Only the retrievals associated with a standard deviation within the measurement noise are conserved.
3.5 Uncertainties
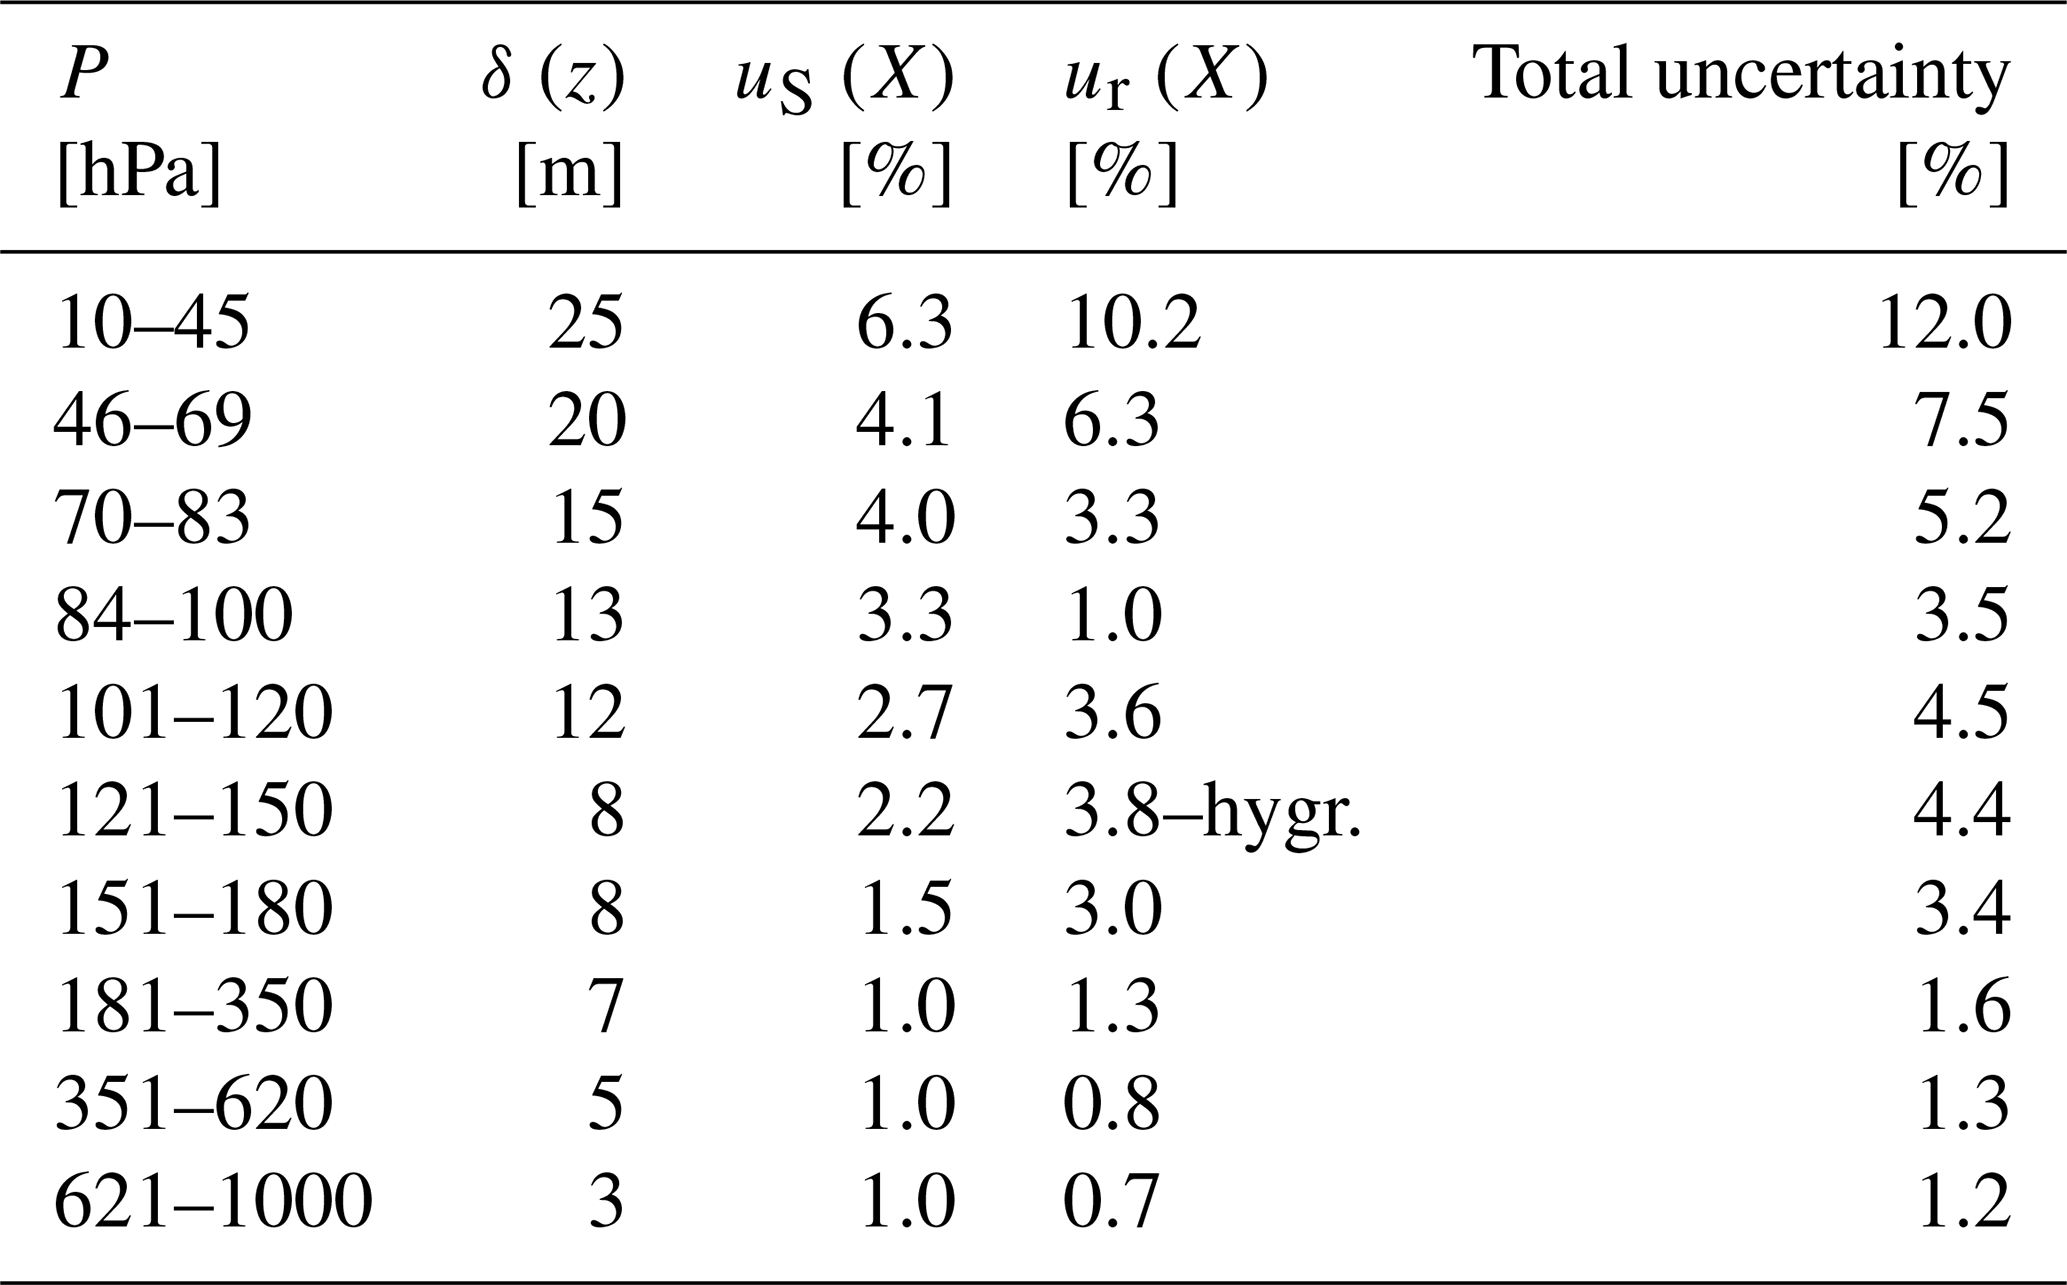
Table 2 lists the vertical resolution and the measurement uncertainties in Pico-Light H2O per level from the ground up to the balloon burst altitude.
The noise of one spectrum is about in absorption units. The corresponding signal-to-noise ratio in the stratosphere is about 2000. The uncertainty is calculated at each pressure from the standard deviation of the fit at a given pressure level. Using unitary spectra (no averaging), the standard deviation of the mixing ratio in the stratosphere, and therefore the precision, is about ± 277 ppbv. For a 1 s averaging time, the precision is ± 130 ppbv (co-addition of five spectra). By comparison, frost control instabilities of the NOAA FPH dominate the measurement uncertainty budget (±2σ), ranging from ±10 % in the lower troposphere to ±2 % (± 100 ppbv) in the stratosphere (Hall et al., 2016).
Random uncertainties are dominated by spectrum deformations due to mechanical vibrations, especially at high altitudes, where the absorbance of the probing line is the smallest. To limit this effect, the simple and robust design of the optical cell minimizes mechanical vibrations during the flight, thereby limiting strong variations of the spectra baseline. Still, the more severe deformations are observed after the balloon bursts, when the vertical speed is the fastest and the mechanical vibrations of the instrument structure are the strongest. In this range, the random uncertainty can reach up to ±10 %, leading to larger dispersion of the measurements seen down to few kilometres below the balloon burst altitude. It quickly decreases as the balloon continues to descend.
A second area of significant distortion is found where winds are strong above the hygropause. In this range, the volume mixing ratio is within its lowest values and mechanical vibrations are becoming important. Wind speed is found above 17 m s−2. In this case, the random uncertainty is on average 3.5 %, the largest uncertainty being found at the hygropause (3.8 % in Table 2). Below the hygropause, while the mixing ratio is increasing, the distortions induced in cases of strong winds see their influence quickly diminishing. In any case, the random uncertainty induced by the baseline variability is variable, its influence depending on the line absorbance and the severity of the baseline deformation.
Systematic errors are dominated by uncertainties in the estimation of the peak absorbance of the spectrum as well as the line intensities (∼ 1 %). Systematic errors due to the error in the peak absorbance dominates the budget down to 120 hPa (15.3 km). Two absorption lines are used for the measurements, as stated in Sect. 3.4. For pressure levels higher than 260 hPa (upper troposphere and stratosphere, altitudes higher than 10 km), for a characteristic mixing ratio of about 5 ppmv, at 50 hPa, the absorption depth is about 0.013. The subsequent systematic uncertainty is about 3.9 %. At 260 hPa (about 10 km), where the mixing ratio increases up to a few hundred parts per million by volume, the absorption depth is about 0.46. The subsequent systematic uncertainty is reduced to 0.1 %. For altitudes below 10 km, a second absorption line is used instead, having a line strength 10 times smaller than the “stratospheric” line. This is to compensate for the dramatic increase in water vapour mixing ratio. In the lower troposphere, where mixing ratios quickly increase up to several hundred thousand parts per million by volume, the molecular absorption is always larger than 0.15. At 7 km (pressure level: 430 hPa), the absorption depth of the selected line is about 0.20. The subsequent systematic uncertainty is about 0.3 %. Decreasing in altitude, where mixing ratios dramatically increase, the systematic uncertainty decreases. From about 15 km, the systematic uncertainty due to spectroscopy starts to dominate the budget and is kept as a constant uncertainty.
Biases in the environment's pressure and temperature measurements generate additional minor systematic errors.
The maximum uncertainties in the pressure and temperature measurements are 0.5 hPa and 0.2 K, respectively. Pressure measurements are obtained by averaging the instantaneous pressure measurements, from the Honeywell PPT1 sensor on board, over 0.5 s. This process allows one to improve the pressure measurement's uncertainty. The subsequent systematic uncertainty on the retrieved mixing ratio ranges from 0.03 % at ground level to as much as 0.3 % at the float altitude. The influence of pressure on the systematic uncertainty decreases quickly between the burst altitude and about 100 hPa (about 16.5 km). Taking into account errors in the estimation of the baseline and the frequency axis, the global systematic uncertainty increases from 0.4 % at ground level to as much as 0.7 % on average in the middle stratosphere.
The total systematic uncertainty is obtained by summing all the above-cited uncertainties in quadrature. The systematic uncertainty varies from 1.0 % at ground level (fixed to line intensity uncertainty) to as much as 6.3 % at 45 hPa and above. Random uncertainty varies from 0.02 % at ground to as much as 10 % in the stratosphere.
Table 2Systematic (uS) and random (ur) uncertainties on mixing ratio X made by Pico-Light H2O. Also shown is the resolution δ(z) of the height z. The “hygr.” label indicates the altitude range of the hygropause in this case.
The NOAA FPH (see Fig. 3) is a balloon-borne instrument that makes in situ measurements of atmospheric water vapour vertical profiles up to altitudes of ∼ 28 km. The basic measurement principle and calibration method have remained unchanged since 1980, although the instruments have been significantly modernized over the years (Hall et al., 2016). The chilled mirror principle relies on creating and maintaining a thin, stable layer of condensed-phase water (dew or frost) on a highly reflective mirror through rapid feedback temperature control of the mirror. Constant cooling of the mirror is provided by a copper cold finger immersed in liquid cryogen (R23). At the other end of the cold finger is the chilled mirror which extends into the path of air flowing at 3–6 m s−1 through the instrument. Intermittent heating of the mirror is provided by an electrified nichrome wire wrapped around the narrow shaft of the mirror. An infrared LED and photodiode serve as the optical source and detector, respectively, for rapid measurements of the mirror's reflectivity that is affected by the amount of condensate on its surface. When too little (much) light is reflected, the amount of condensate on the mirror is reduced (increased) by heating (cooling) it. A calibrated thermistor embedded in the mirror accurately measures the frost (dew) point temperature when the condensate layer is stable, indicative of equilibrium between the mirror's condensate layer and the water vapour in the air flowing over it. The partial pressure of water vapour in the flowing air is determined from the frost (dew) point temperature and then divided by the ambient atmospheric pressure to calculate the water vapour volume mixing ratio. Conceptually, frost point hygrometry allows water vapour mixing ratios to be determined from high-accuracy temperature measurements, eliminating the need for water vapour calibration scales or gas standards, which are notoriously difficult to maintain over decadal timescales (Hurst et al., 2011, 2016).
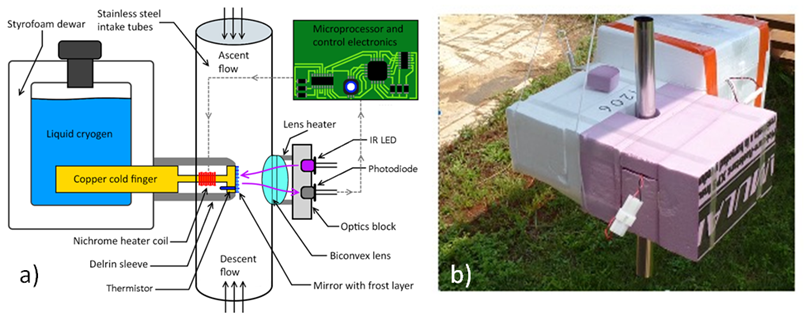
Figure 3Panel (a) is a schematic of the NOAA FPH (Fig. 1 of Hall et al., 2016) and (b) is a picture of the NOAA FPH with an ozone sonde.
Balloon-borne FPH soundings over Boulder (Colorado) during the past 42 years have produced the longest continuous record of stratospheric water vapour in the world. This “Boulder record”, based on FPH data from 557 individual soundings, indicates considerable inter-annual variability in SWV and a net increase of ∼ 0.8 ppmv (20 %) since 1980. Profiles of SWV from NOAA FPH soundings at three sites – Boulder, Hilo (Hawaii), and Lauder (New Zealand) – have been routinely compared with those produced by the microwave limb sounder (MLS) aboard the Aura satellite. The MLS has provided daily, near-global (82° S–82° N) measurements of SWV and other trace gases since August 2004. After 2010, the comparisons at all three sites began to show divergences between the FPH and MLS version 4.2 (v4) data sets that were increasing with time. In 2021, the MLS science team produced a new version 5.1 (v5) data set with the intention of reducing the positive (wet) MLS biases relative to the FPH. In all cases, the transition from MLS v4 to v5 retrievals resulted in the MLS now having a negative (dry) bias relative to the FPH.
The M20 is one of the radiosondes developed and sold by Meteomodem (Ury, France). The M20 was released in 2021 and is fully compatible with the SR10 receiver system and the Meteomodem software. Its dimensions are 98 × 63 × 42 mm and it weighs just 36 g with a lithium battery. The M20 is composed of a capacitive humidity sensor (RH absolute accuracy: 3 %) covered by an innovative metal-coated shield that allows good ventilation while protecting the sensor from direct radiation and freezing water droplets. A temperature sensor measures the air temperature and is positioned at the very end of the sensor boom. A GNSS provides measurements of the position, from which the pressure, vertical velocity, wind speed, and direction are derived. The capacitive humidity sensor is composed of three primary components: a basic layer that acts as an electrode, a dielectric material whose characteristics are a function of relative humidity, and a fast-response porous electrode that acts as the second electrode of the capacitor. A second thermistor is located under the protective shield close to the humidity sensor in order to have an approximative measurement of the temperature of the capacitive humidity sensor. (UPSI, a French company, is the subcontractor for this capacitive humidity sensor, and these sensors are made specifically and exclusively for Meteomodem.) Meteomodem radiosonde technology is used in 28 countries. All Meteomodem stations installed since 2011 use the M10 and M20 technology. Before 2011, sites used the former version of M10 (M2K2), and by now all are using the M10/M20 technology. Most of these sites produce two M10 or M20 radiosoundings per day (Dupont et al., 2020).
The water vapour data sets originate from three different types of instruments: an optical hygrometer (Pico-Light H2O) and a frost point hygrometer (NOAA FPH), with both able to provide reliable measurements of water vapour up to the middle stratosphere, and meteorological radiosonde sondes iMet-4 and M20, which provide accurate RH measurements up to about 6–13 km, respectively.
Flight chain schematics are shown in Fig. 4. The Pico-Light hygrometer is able to provide reliable measurements during the balloon ascent (to about 14 km) and the descent under parachute. The flight chain separates the instrument from the balloon by 17 m. In this case, the ascent measurements become affected by outgassing from the balloon envelope and other elements on the flight chain (major source) and instrument electronics (minor source) at about 14 km. Below, measurements from the ascent and the descent of Pico-Light agree to within 3 %. These differences observed between the ascent and the descent arise from the rapid, natural changes in water vapour that are observed in the troposphere. In the stratosphere, the variability in water vapour is dramatically reduced; thus, the ascent and descent stratospheric vertical profiles are expected to be identical, except that the ascent profile is often corrupted by water vapour outgassing from the balloon envelope. Nevertheless, the descent measurements allow one to reliably probe water vapour continuously from the lower troposphere up to a few kilometres below the balloon burst altitude. The NOAA FPH served as the reference instrument for our study, providing measurements during both ascent and descent. Indeed, the flight chain “unreeler” we used puts a distance of about 36 m between the balloon and the instrument, dramatically reducing the influence of balloon outgassing to corrupt the ascent measurements up to an altitude of about 26 km. The FPH flight chain normally includes a pressure-activated valve that releases helium from the balloon in the middle stratosphere, allowing the instrument and unburst balloon to slowly descend and make contamination-free measurements (Hall et al., 2016). This valve was used only for the FPH flight of 19 September (Table 3) because it greatly increased the distance of balloon travel from Aire-sur-l'Adour (Fig. 5), making payload recovery more difficult.
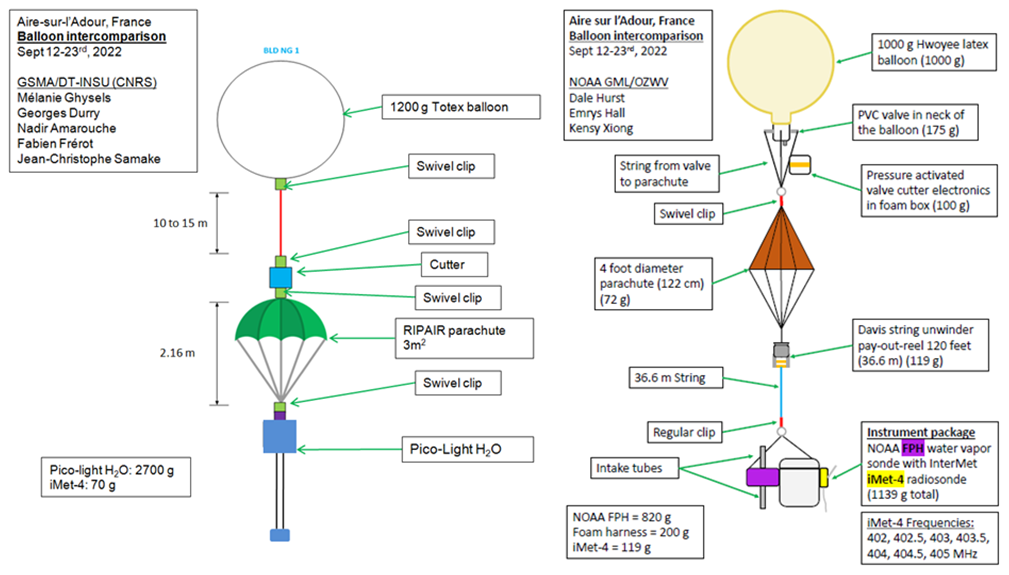
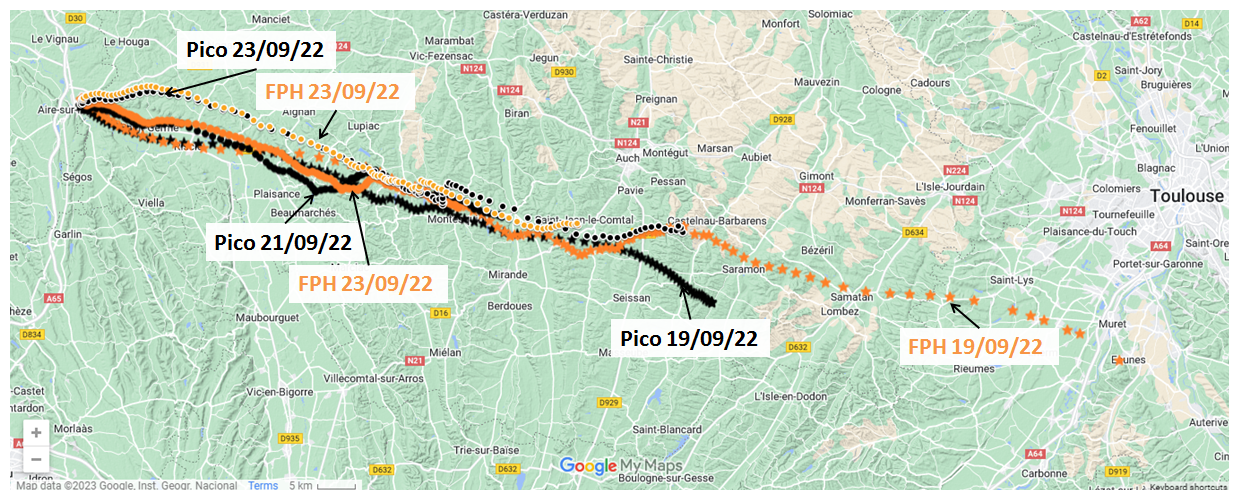
Figure 5Trajectories of balloons carrying Pico-Light H2O and NOAA FPH during the campaign.
Radiosonde pressure, temperature, and horizontal wind (from GPS) measurements are accurate up to balloon burst (> 30 km), but the relative humidity measurements often lack the precision and accuracy necessary for stratospheric research and are therefore most useful in the low to mid-troposphere. On board Pico-Light, as a backup in case of failure in the GNSS system, an iMet-4 meteorological sonde provides measurements of the instrument's position during the ascent and the descent. On the other hand, the M20 radiosondes, launched under their own balloons, provide measurements during ascent and descent.
The campaign occurred from 12 to 23 September 2022 from the CNES Aire-sur-l'Adour facility and from the Aéroclub d'Aire-sur-l'Adour in southern France. The NOAA FPH was launched from the Aéroclub launch pad and the Pico-Light hygrometer (with iMet-4 attached) and M20 sondes were launched from the CNES launch facility, 600 m away. In total, 15 flights were realized, spread over four sessions of three to four balloons launched within 30 min. In this study, we focus on three sessions which occurred on 19, 21, and 23 September 2022. On these dates, both Pico-Light H2O and NOAA FPH were launched, and therefore an intercomparison is possible.
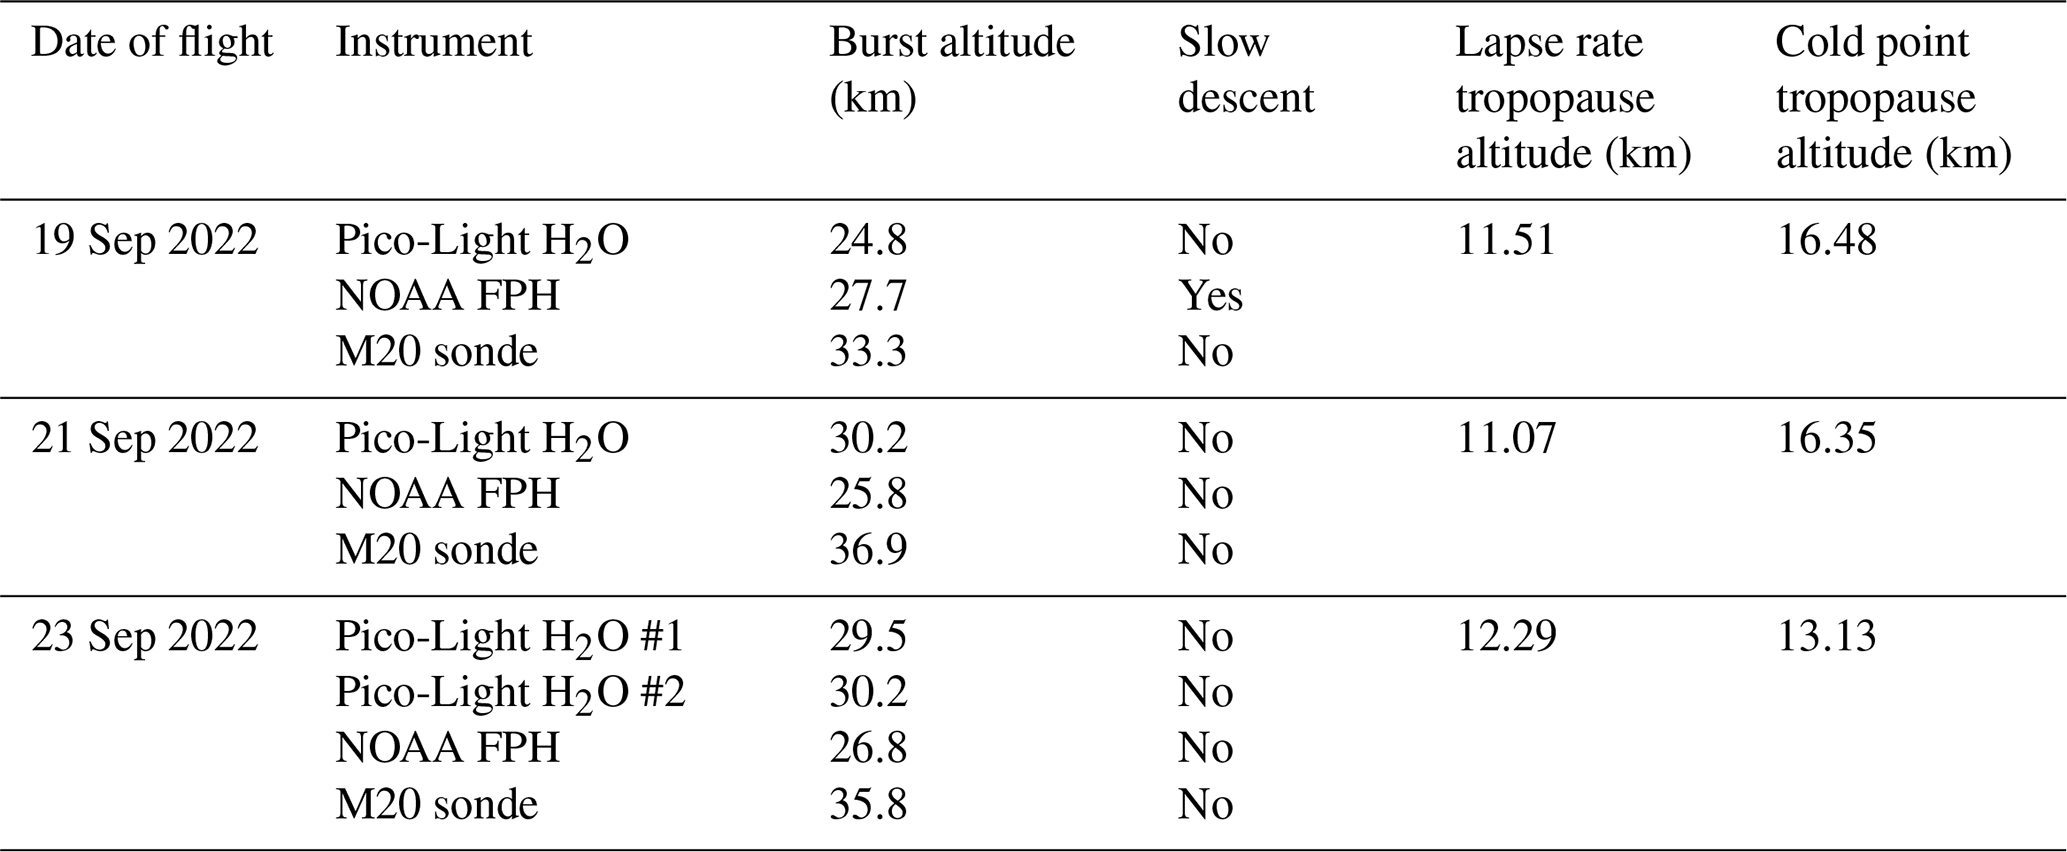
Table 3 lists the balloon burst altitude and the descent conditions for each flight. On 21 and 23 September, due to strong winds in the stratosphere, a slow (valved) descent was not permissible for the NOAA FPH balloons. For each landing of Pico-Light H2O and NOAA FPH, we found no damage to the recovered instruments, and therefore they were flown again on subsequent flights. However, if the Pico-Light H2O or FPH instruments were to land in water, this would require replacement of the laser diode module and photodiode (Pico), as well as the frost control electronics (FPH). For dry landings, the instruments are budget-friendly because, given the rugged optical and electronic components, only the mechanical structures would need repair.
The trajectories of each instrument, for the flights used here for intercomparison (i.e. 19, 21, and 23 September), are shown in Fig. 5. For the flights on 21 and 23 September, both Pico-Light and NOAA FPH balloon trajectories remained within the same area and the distance between the balloons was less than 15 km. On 19 September, the slow (valved) descent of the NOAA balloon brought the instrument to land near Toulouse, 50 km away.
From 19 to 23 September, upper-tropospheric and stratospheric conditions above southwestern France changed quickly. During 19 and 21 September, a double tropopause structure was observed with a lapse rate tropopause height of ∼ 11.5 km and a cold point tropopause height of 16.4 km. Between 21 and 23 September, the tropopause structure changed to a single level with the lapse rate tropopause at 12.3 km and the cold point tropopause at 13.1 km.
In general, for all flights, structures on vertical profiles are observed by both the Pico-Light H2O and the NOAA FPH water vapour measurements. Figure 6 is an illustration of the good agreement between the two instruments, although contamination from outgassing is observed from 18 to 21 km on Pico-Light measurements. (A discussion about the outgassing contamination is given later.) A moist layer of 5.9 ppmv is observed by both instruments between 14 and 17 km on 21 September, whereas on 19 September, the mean mixing ratio varies from 4.5 to 5 ppmv. An exception is found at 15.6 km where a thin 500 m-thick hydrated layer is also visible on 19 September, again by both instruments at the same altitude, which is not seen in European reanalyses, i.e. ERA-5 (Fig. 7), due to ERA-5 coarse vertical resolution. ERA-5 is the latest climate reanalysis produced by ECMWF, providing hourly data on 137 vertical levels. Here, we use potential vorticity as a dynamical tracer in the upper troposphere and stratosphere.
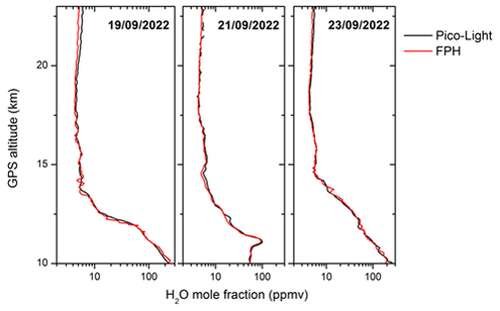
Figure 6Vertical profiles of water vapour on 19, 21, and 23 September 2022 from Pico-Light H2O (black line) and NOAA FPH (red line).
In Fig. 7, on 21 September 2022, the observed hydrated layer between 14 and 17 km is associated with a filamentary structure originating from the subtropics. The relatively thick (∼ 3 km) structure is seen by the ERA-5 reanalysis (not shown) at pressure levels of 100, 125, and 150 hPa (16.4, 15, and 14 km).
On 19 and 23 September, a large tongue of moist subtropical air was present at 225 hPa (11.4 km) over Aire-sur-l'Adour. This translates into a similar volume mixing ratio on both dates while a difference of about 18 ppmv is observed at 175 hPa (∼ 13 km). Figure 7 shows vertical profiles from Pico-Light H2O on 19, 21, and 23 September 2022, compared with maps of potential vorticity from the ERA-5 reanalysis at 175 and 225 hPa on 19 and 23 September. The balloon position is marked with a black circle. This large intrusion is seen by ERA-5. At 175 hPa, a thin filament of high potential vorticity is seen by ERA-5 over Aire-sur-l'Adour on 19 September but not anymore on the 23 September, which explains the 18 ppmv difference observed between the two dates.
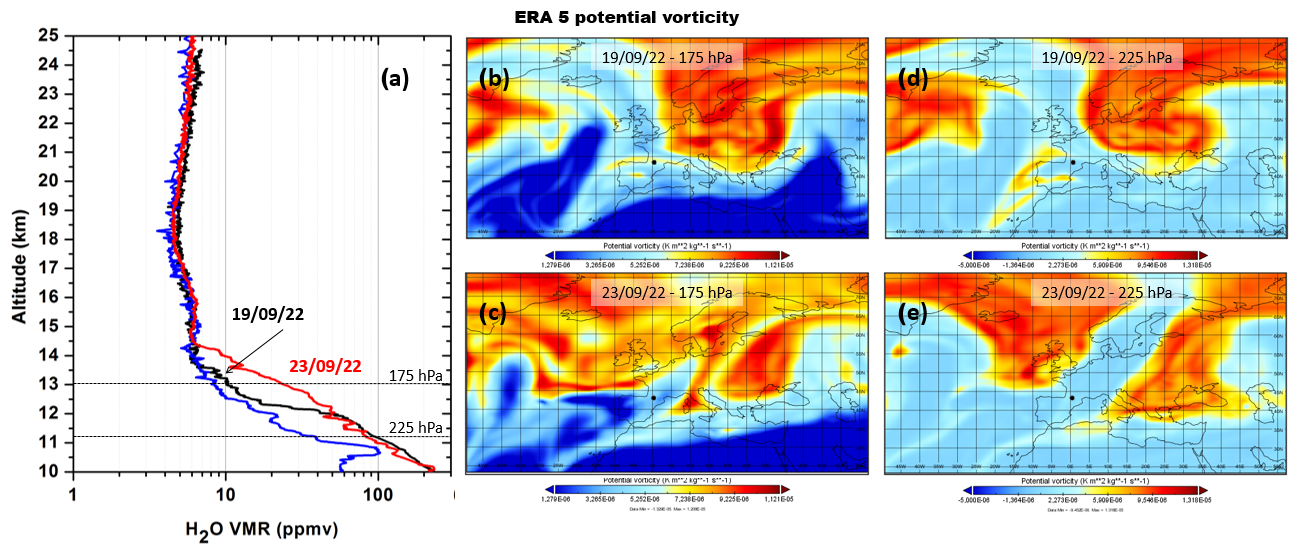
Figure 7Panel (a) shows water vapour vertical profiles from descent measurements of Pico-Light H2O on 19 (black), 21 (blue), and 23 (red) September 2022. Panels (b–e) are maps of potential vorticity from the ERA-5 reanalysis at 175 and 225 hPa both on 19 September(b, d) and 23 September (c, e). The location of Aire-sur-l'Adour is indicated by a black circle.
Going further into quantitative comparison, the comparison between Pico-Light H2O and NOAA FPH was performed within three distinct layers between the ground and a few kilometres below the balloon burst altitude, where Pico-Light measurements are free from contamination: the troposphere, spanning altitudes between the ground and the lapse rate tropopause; the tropopause region (TR) between the lapse rate tropopause (LRT) and the cold point tropopause (CPT); and the stratosphere, defined here by a water vapour mixing ratio between 3.5 and 6.5 ppmv. In this last layer, we expect the lowest influence from the dynamics in the TR, limiting the variability in the local water vapour content.
Table 4Mean relative difference and average standard deviations between in situ water vapour mixing ratios from Pico-Light H2O and NOAA on 19, 21, and 23 September 2022. The volume mixing ratios were averaged over altitude bins of ±100 m around Pico-Light and FPH altitudes. Flights originated from Aire-sur-l'Adour (France).
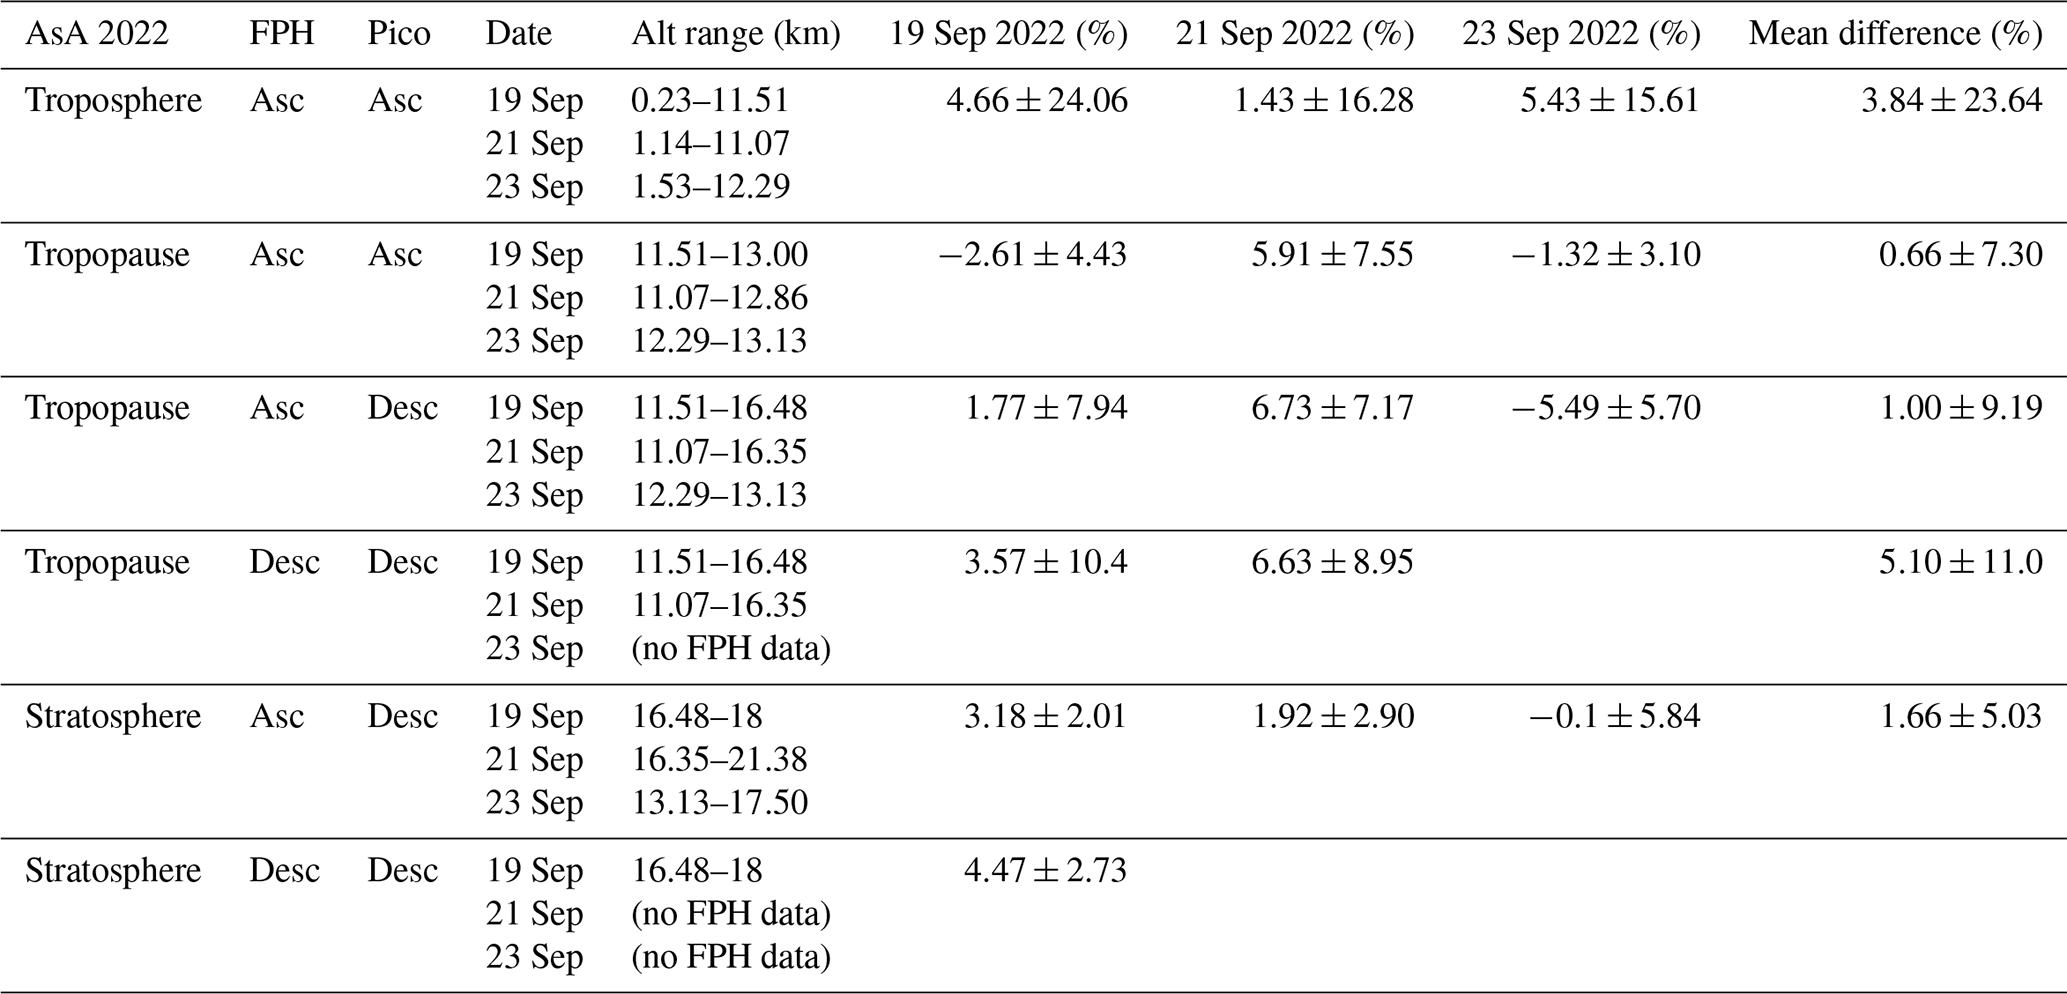
Table 4 summarizes the relative differences between measurements from Pico-Light H2O and NOAA FPH during three flights of the AsA 2022 campaign, when both sensors were launched within a 30 min time interval. The data from Pico-Light and FPH data are both averaged over bins with an altitude of ± 100 m. In highly stable stratosphere, such averaging is not expected to significantly influence the comparison. In the case of tropospheric comparison, it is intended to reduce the influence of environment variability on the comparison. Indeed, Pico-Light and FPH have been flown under separated balloons: in such cases, the tropospheric dynamics induce small-scale mole fraction variabilities which have a large impact on the comparison.
The relative difference is calculated as
The average standard deviation is calculated as
χpico and χFPH are the average mole fractions from Pico-Light and FPH over the ± 100 m altitude bins; nk is the sample size for the kth group, which includes the data within the ±100 m interval; sk is the standard deviation of water vapour mole fractions within the kth group; and k is the total number of groups.
We consider pairs of profiles comprising the ascent and descent profiles for a given day of flight. Since ascent data from Pico-Light suffer from outgassing above 13–14 km, only tropospheric comparisons are obtained in this case. During the descent, due to the short flight chain, the altitude above which outgassing affects measurement is variable from one given flight to another, ranging from 18 to 21.4 km. The saturation relative humidity (SRH) from Pico-Light measurements is shown in Fig. 8. Relative humidity over water (RH) and relative humidity over ice (RHi) are shown in full black and grey lines respectively. On the flights of 19 and 23 September, thick saturated layers are found (RH or RHi is greater than SRH). Particularly on 23 September, between 8 and 9 km, a layer of RH greater than SRH is found. Additionally, a thick layer of air saturated over ice expands from 8 to 13 km, though it brings less contamination to the measurements compared with the case of RH saturation (found between 8 and 9 km). In this case, both Pico-Light and FPH have flown through a mixed-phase cloud between 8 and 9 km. For this flight, the outgassing contamination is the largest during the ascent and affects measurements down to 20 km during the descent. This is due to liquid droplets and/or ice particles (to a lesser extent) sticking to the balloon and parachute while ascending through the cloud, which then evaporated or sublimated during the rest of the ascent. Similar behaviour is observed for the flight of 19 September, but to a lesser extent. In the case of that flight, the balloon flew through a thick layer between 9.5 and 11.6 km, where the RH is above the SRH. Between 6 and 12 km, the RHi is above the SRH (RHi > 100 %). In this case, both Pico-Light and FPH have flown through a thick ice cloud within which mixed-phase layers are found. The presence of such a thick cloud is confirmed by EUMETSAT (not shown) cloud-top observations (as is the case for 19 September). EUMETSAT has observed cloud tops near 11.5 km. The situation on 21 September is dramatically different, with only a thin layer where the RHi is above the SRH (altitude between 11 and 11.3 km). On that date, flights have been realized under clear-sky conditions. In this case, the contamination effect on Pico-Light is reduced by a large amount, with a top altitude free of contamination around 21.4 km. In general, the NOAA FPH instrument is not affected by outgassing during ascent, except on 19 September (from 24.5 km only), since the distance between the parachute, balloon, and instrument is 36 m, i.e. 21 m longer than for Pico-Light. For the next flights of Pico-Light we intend to increase the distance between the instrument and balloon/parachute to reduce the potential for contamination.
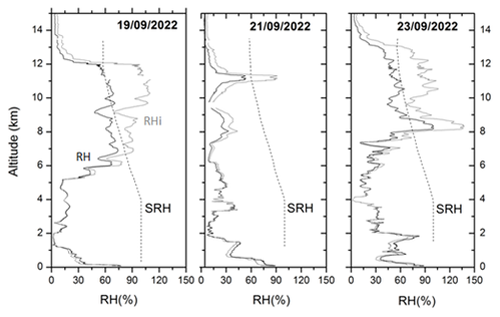
Figure 8Profiles of RH (black) and RHi (grey) for the flights of 19, 21, and 23 September 2022, from Aire-sur-l'Adour (France). Dotted lines are the calculated saturation relative humidity (SRH).
Considering only portions of the profile which are free of corrupted measurements, the differences between the two instruments in general follow the same behaviour with rising altitude and are consistent from one flight to another. The differences decrease with altitude, as does the variability in the water vapour. Considering pairs of profiles from the same flight segment (i.e. ascent or descent) should reduce the differences.
In the troposphere, we only consider ascent data sets since both instruments were flown under their own balloons. The relative difference in mixing ratio is highly variable. It is strongly correlated with vertical structures and therefore to the variability in tropospheric water vapour. The mean tropospheric relative difference average is 3.84 % ± 23.64 %.
The comparison between Pico-Light H2O and the NOAA FPH above the LRT is illustrated in Fig. 9.
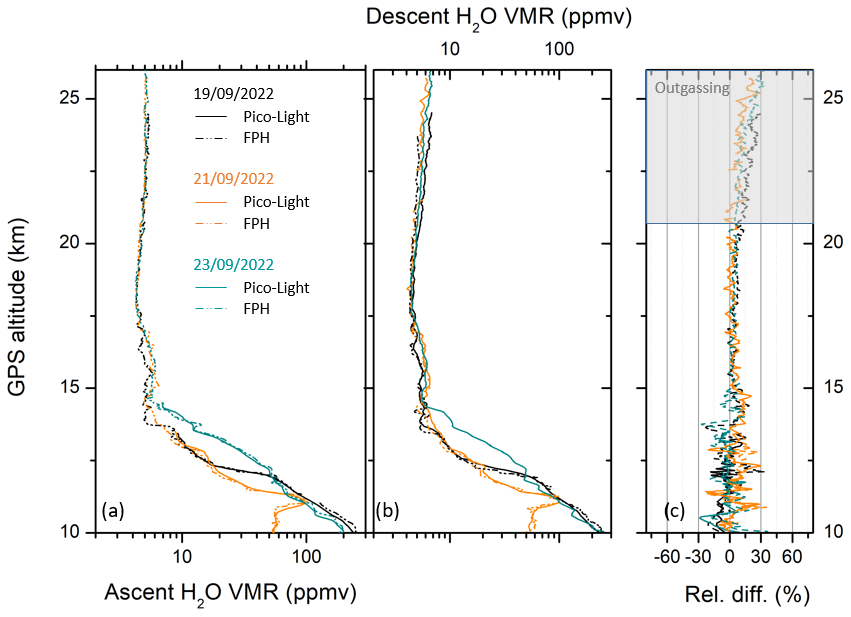
Figure 9Panels (a) and (b) show vertical profiles of water vapour mixing ratios during the ascent (a) and descent (b) from Pico-Light (solid lines) and FPH (dashed lines on 19, 21, and 23 September 2022, from Aire-sur-l'Adour (France). Panel (c) shows relative differences between Pico-Light and FPH during ascent and descent (solid and dashed lines, respectively).
In the TR, for an altitude range between the lapse rate tropopause (around 11.5 km) and the cold point tropopause (around 16.5 km), the mean relative difference is about 1.90 % ± 8.70 %, considering all pairs of comparison. In the stratosphere, the relative difference between Pico-Light H2O and NOAA FPH is relatively constant. On average, the relative difference is about 2.37 % ± 4.60 %, within the total uncertainty of Pico-Light in this altitude range, ranging from 3.5 % to 7.5 %. Considering the altitude range from the LRT up to 20 km, the mean relative difference is 4.20 % ± 2.70 %, still within the Pico-Light total uncertainty. In the TR, the largest differences are found slightly above the hygropause, where the random uncertainty, induced by the spectrum baseline variability, is the largest. In this altitude range, the random uncertainty is about 3.8 %, thereby being the largest contributor to the observed differences.
The differences found here are in line with other recently published studies. In the UTLS, Singer et al. (2022) compared aircraft in situ measurements from FLASH (Lyman-α; Sitnikov et al., 2007), ChiWIS (OA-ICOS; Sarkozy et al., 2020), and FISH (Lyman-α; Meyer et al., 2015) between 14.7 and 20 km during the StratoClim campaign, with mixing ratios varying from 4 to 10 ppmv. Per flight, the relative differences between the FLASH and ChiWIS hygrometers below 10 ppmv varied from −4.9 % to 3.1 %. Between FISH and FLASH, in clear-sky conditions, relative differences ranged from −10.1 % to 11.5 %. Considering all six flights, Singer et al. (2022) reported average relative differences varying from −0.4 % to 1.9 %.
Kaufmann et al. (2018) reported intercomparisons in the UTLS between in situ aircraft hygrometers during the ML-CIRRUS campaign: FISH, HAI (Buchholz et al., 2017), SHARC, and AIMS (Kaufmann et al., 2016; Thornberry et al., 2013). The relative difference between each instrument was calculated against a reference value which was calculated using the average of measurements from a combination of several of these instruments, varying according to atmospheric conditions. In the range 4–10 ppmv, the relative differences varied from ±1 % (around 10 ppmv) to ±7 % (around 5 ppmv) for the AIMS and FISH instruments, the only ones capable of measuring such low mixing ratios. The global agreement was found within ±15 %.
The differences in measured pressure from Pico-Light and iMet-4 radiosonde flown with the FPH stay within ±1.2 hPa below the LRT and within ±1 hPa above and do not have a significant influence on the water vapour mixing ratio differences. As discussed in Sect. 3.4, the pressure error has only a minor influence on the overall error budget. Air temperature differences are the largest in the lower troposphere, reaching as high as 4 °C in the first 500 m of altitude before rapidly decreasing to within the ±0.5 °C range where it remains constant from 3.5 km. Comparing pairs of ascent profiles, the temperature differences do not have a visible impact on the observed relative differences, i.e. at least no clear correlation is found. However, a moderate correlation is found below the LRT while considering pairs of FPH ascent/Pico-Light descent profiles. This mainly indicates that some of the mixing ratio relative differences observed in this case are related, to some extent, to local variability in air moisture, though it does not preclude instrumental differences. Indeed, for some fine vertical structures, it remains difficult to estimate the contribution of local moisture variability and instrumental errors in the mixing ratio differences observed.
Figure 10 shows the correlations between Pico-Light H2O and the NOAA FPH measurements between 3.5 and 13 000 ppmv. The inset focuses on the range 3.5–7 ppmv found above the LRT. Considering the data from the three flights, the linear correlation slope is 1.018 ± 0.002 between 3.5 and 13 000 ppmv with an r2 of 0.95. Restricting the comparison to the TR and stratosphere (mixing ratio from 3.5 to 100 ppmv), the linear correlation slope is 1.008 ± 0.002 with an r2 of 0.974.
In Singer et al. (2022), the reported linear correlation slope coefficients are about 0.930 in the range 2–10 ppmv. Restraining our comparison to the same altitude and volume mixing ratio ranges, Pearson's r coefficient is 0.975 and the associated r2 coefficient is 0.998, similar to those reported in Singer et al. (2022) and Kaufmann et al. (2016). In Kaufmann et al. (2018), the reported r2 values y range from 0.948 to 0.996, depending on the instrument pair considered and environmental conditions, in the 1–1000 ppmv range.
Table 5Relative differences in relative humidity between meteorological sondes iMet-4 and M20, as well as standard deviations, compared with Pico-Light and FPH retrievals from the ground to 13 km.
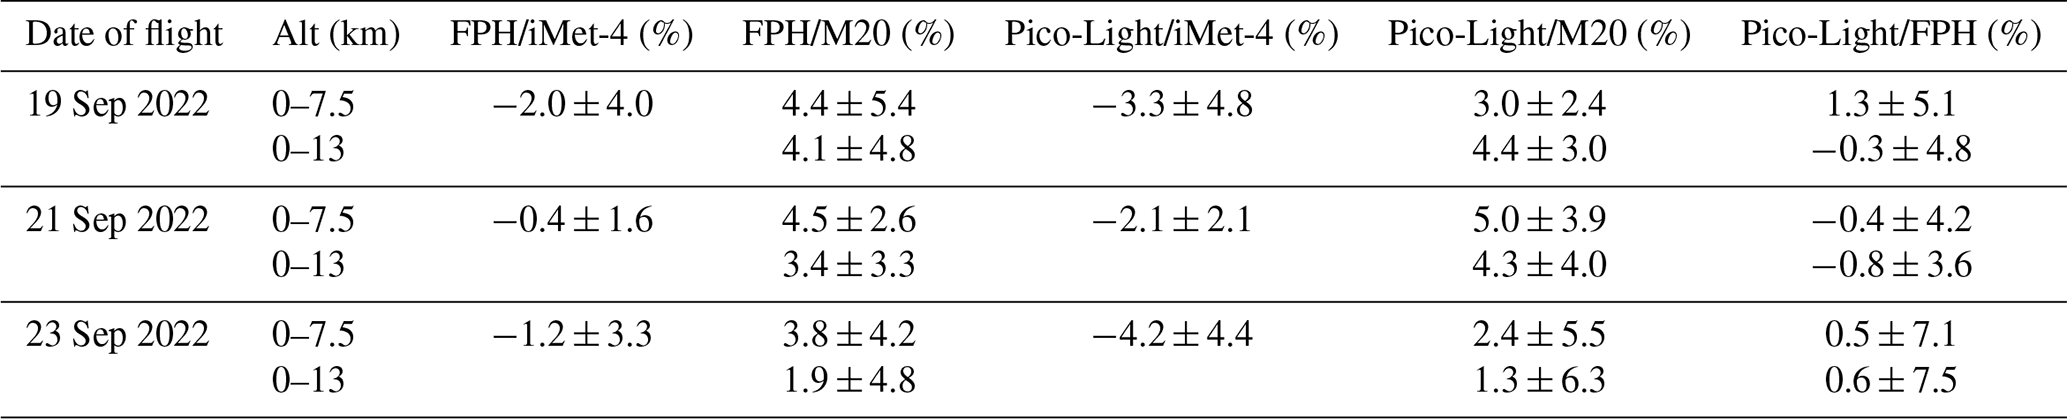
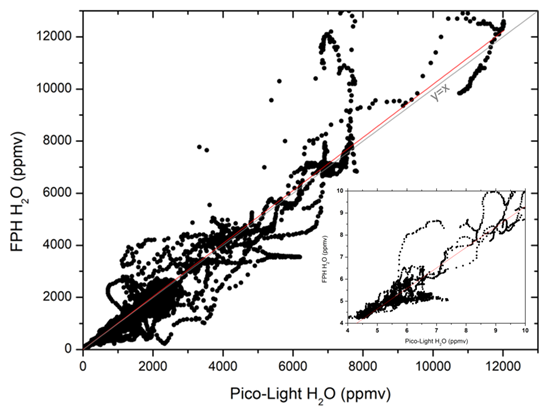
Figure 10Correlations between Pico-Light H2O and NOAA FPH retrievals in the range 3.5–13 000 ppmv. The inset shows correlations in the range 4–7 ppmv for altitudes higher than 14.5 km.
Measurements from Pico-Light H2O enable the calculation of volume mixing ratios (mole fractions) of water vapour. To compare with meteorological sondes, we calculated relative humidity from Pico-Light data using the Hyland and Wexler (1983) equation for saturation over liquid water and the Goff–Gratch (1984) equation (List, 1984) for saturation over ice. In the case of a comparison with meteorological sondes, only the RH over water is calculated. For a comparison between Pico-Light and FPH, the threshold for the selection of RH or RHi is the altitude above which ice is detected on the FPH mirror. Below this altitude, we calculate the RH over water. Above, we calculate the RH over ice. Both the Pico-Light and FPH instruments were flown with an iMet-4 sonde on board. For each flight of both instruments, a new iMet-4 sonde was used because, in the previous one, the batteries had been drained and the sensors had been damaged.
A summary of the comparison is given in Table 6. The RH difference between the sonde and the Pico-Light or FPH (hereafter, scientific instruments) is obtained by the following equation:
In the range 0–7.5 km, RH values measured by iMet-4 sondes compare really well with RH values calculated from FPH and Pico-Light measurements if the T (predominantly) and P measurements used for the calculation of RH come from the IMet sonde on board. Larger discrepancies are found otherwise. Then, within the framework of the RH comparisons, the RH values calculated for Pico-Light are obtained using the IMet-4 P and T measurements on board. In the altitude range from 0 to 7.5 km, the mean difference between iMet-4 and FPH is −1.2 % RH and is −3.2 % RH between IMet-4 and Pico-Light. Comparing Pico-Light and FPH, the average difference is 0.5 % RH in the same altitude range. Expanding the altitude limit to 13 km, the average difference becomes −0.2 % ± 0.7 % RH.
Above 7.5 km, the discrepancies in RH between IMet-4 and the scientific hygrometers increase to as much as 50 % RH near 12 km. Above this altitude, IMet-4 measurements begin to show unrealistic values. Differences are noticeable between the comparisons with FPH and Pico-Light, mainly attributed to the implementation of RH corrections in iMet sondes on board FPH.
M20 sondes from Meteomodem were launched at Aire-sur-l'Adour a few minutes apart from other instruments. Figure 11 shows a comparison of RH measurements from M20 to Pico-Light and FPH. M20 sondes perform well up to about 13 km and stay within the ±10 % RH range of differences, except for some cases in which saturation values are found (e.g. at 8 km on 21 September), where M20 sondes underestimate the RH by about 20 %. On average, the differences between M20 and FPH between 1 and 13 km is about 3.1 % ± 1.1 % RH. The mean difference with Pico-Light is 3.3 % ± 1.8 % RH, within the stated uncertainty. Then, M20 have a small wet bias of about 3 % RH on average, compared with the scientific instruments, and a dry bias of about 20 % RH in cases of saturation.
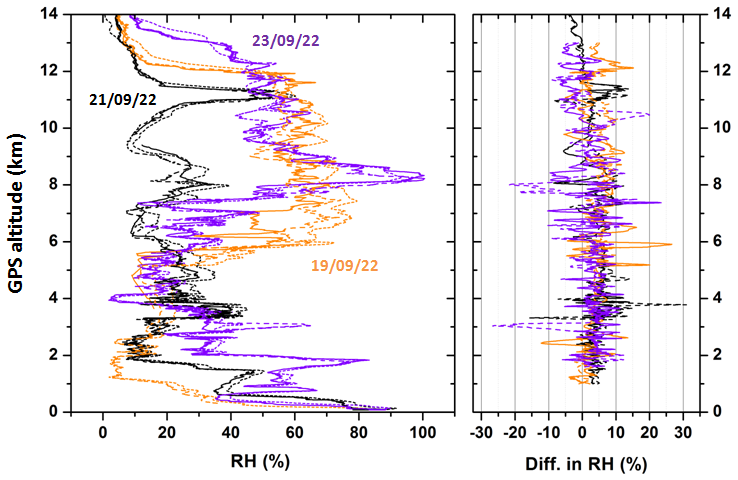
Figure 11The left panel shows a comparison between relative humidity profiles from FPH (solid black line: 19 September; solid orange line: 21 September; solid blue line: 23 September), Pico-Light (dashed lines, same corresponding colours), and M20 (double dashed lines, same corresponding colours) in the altitude range from 1 to 13 km. The right panel shows the differences in RH between M20 and FPH (solid lines, same corresponding colours), as well as between M20 and Pico-Light (dashed lines, same corresponding colours).
Pico-Light H2O is an in situ tunable diode laser hygrometer developed during 2017–2019 to measure water vapour. It is intended for use primarily in the upper troposphere and the stratosphere, though it has performed well also in the lower troposphere. It is the lightweight successor to the former Pico-SDLA H2O hygrometer. Pico-Light H2O was flown from the Aire-sur-l'Adour CNES balloon facility six times between 2019 and 2022. Within the framework of the AsA 2022 campaign in 2022, measurements by the hygrometer have been compared with in situ measurements by the NOAA FPH, resulting in a mean difference of 2.37 % ± 4.60 % in water vapour volume mixing ratios in the stratosphere (mixing ratio below 6.5 ppmv), within the retrieval uncertainty of Pico-Light in this altitude range. In the tropopause region (mixing ratio between 7 and 100 ppmv), the mean relative difference is about 1.90 % ± 8.70 %. Tropospheric comparisons reveal a 3.84 % ± 23.64 % mean difference (mixing ratio above 100 ppmv) and a mean difference in calculated RH values of about −0.2 % ± 0.7 %. During this campaign, iMet-4 radiosondes were installed on all balloons carrying the Pico-Light and FPH instruments. M20 sondes were launched on their own balloons within 30 min of the in situ instruments and a comparison of tropospheric RH values from Pico-Light H2O and FPH was performed. Between 0 and 7.5 km altitude, iMet-4 sondes were in agreement to within ±2 % RH with FPH and to within ±4.2 % RH with Pico-Light. M20 sondes are wet-biased to about 3 % RH compared with FPH and Pico-Light, and they underestimate RH by about 20 % in cases of saturation. However, the agreement up to 13 km remains impressive.
The Pico-Light and NOAA FPH water vapour data sets will be publicly available in the AERIS data center.
Observational data were obtained during the participation of the GSMA/CNRS team (MG, GD, EDR, and RB), the DT-INSU team (NA, JCS, and FF), and the NOAA team (DH, EH, and KX) in the AsA 2022 balloon campaign. The GSMA/CNRS processed the atmospheric spectra and performed the scientific analysis of the Pico-Light measurements. The NOAA team operated the FPH hygrometer and performed the associated data processing and analysis. JCD provided M20 sondes to the CNES for launches during the AsA 2022 campaign. MG prepared the manuscript with contributions from the co-authors.
The contact author has declared that none of the authors has any competing interests.
Publisher's note: Copernicus Publications remains neutral with regard to jurisdictional claims made in the text, published maps, institutional affiliations, or any other geographical representation in this paper. While Copernicus Publications makes every effort to include appropriate place names, the final responsibility lies with the authors.
This work is based on observations with Pico-Light H2O under a balloon operated by CNES. The CNES staff at Aire-sur-l'Adour are highly acknowledged for their efficiency and valuable support in the organization and performance of the AsA 2022 campaign. The Aerodrome staff are also acknowledged for granting access to their facility, thereby permitting the launch of the NOAA FPH balloons very close to the CNES balloon launch facility in Aire-sur-l'Adour. Finally, we thank the DIRSU/CNRS for their support in the process of obtaining flight authorizations from Aire-sur-l'Adour.
This research has been supported under the agreement between CNES and CNRS/INSU, within the WP11 of the European project HEMERA H2020 (“Integrated access to balloon-borne platforms for innovative research and technology”). The FPH team that participated in this campaign was supported by the NASA Upper Atmospheric Composition Observations programme.
This paper was edited by Hartwig Harder and reviewed by two anonymous referees.
Banerjee, A., Chiodo, G., Previdi, M., Ponater, M., Conley, A. J., and Polvani, L. M.: Stratospheric water vapor: an important climate feedback, Clim. Dynam., 53, 1697–1710, https://doi.org/10.1007/s00382-019-04721-4, 2019.
Behera, A. K., Rivière, E. D., Marécal, V., Rysman, J.-F., Chantal, C., Sèze, G., Amarouche, N., Ghysels, M., Khaykin, S. M., Pommereau, J.-P., Held, G., Burgalat, J., and Durry, G.: Modeling the TTL at Continental Scale for a Wet Season: An Evaluation of the BRAMS Mesoscale Model Using TRO-Pico Campaign, and Measurements From Airborne and Spaceborne Sensors, J. Geophys. Res.-Atmos., 123, 2491–2508, https://doi.org/10.1002/2017JD027969, 2018.
Berthet, G., Renard, J.-B., Ghysels, M., Durry, G., Gaubicher, B., and Amarouche, N.: Balloon-borne observations of mid-latitude stratospheric water vapour: comparisons with HALOE and MLS satellite data, J. Atmos. Chem., 70, 197–219, https://doi.org/10.1007/s10874-013-9264-7, 2013.
Buchholz, B., Afchine, A., Klein, A., Schiller, C., Krämer, M., and Ebert, V.: HAI, a new airborne, absolute, twin dual-channel, multi-phase TDLAS-hygrometer: background, design, setup, and first flight data, Atmos. Meas. Tech., 10, 35–57, https://doi.org/10.5194/amt-10-35-2017, 2017.
Delahaye, T., Ghysels, M., Hodges, J. T., Sung, K., Armante, R., and Tran, H.: Measurement and Modeling of Air-Broadened Methane Absorption in the MERLIN Spectral Region at Low Temperatures, J. Geophys. Res.-Atmos., 124, 3556–3564, https://doi.org/10.1029/2018JD028917, 2019.
Dessler, A. E.: Observations of Climate Feedbacks over 2000–10 and Comparisons to Climate Models, J. Climate, 26, 333–342, https://doi.org/10.1175/JCLI-D-11-00640.1, 2013.
Dessler, A. E. and Wong, S.: Estimates of the Water Vapor Climate Feedback during El Niño–Southern Oscillation, J. Climate, 22, 6404–6412, https://doi.org/10.1175/2009JCLI3052.1, 2009.
Dessler, A. E., Zhang, Z., and Yang, P.: Water-vapor climate feedback inferred from climate fluctuations, 2003–2008, Geophys. Res. Lett., 35, L20704, https://doi.org/10.1029/2008GL035333, 2008.
Dessler, A. E., Schoeberl, M. R., Wang, T., Davis, S. M., and Rosenlof, K. H.: Stratospheric water vapor feedback, P. Natl. Acad. Sci. USA, 110, 18087–18091, https://doi.org/10.1073/pnas.1310344110, 2013.
Devi, V. M., Benner, D. C., Brown, L. R., Miller, C. E., and Toth, R. A.: Line mixing and speed dependence in CO2 at 6227.9 cm−1: Constrained multispectrum analysis of intensities and line shapes in the 30013 ← 00001 band, J. Mol. Spectrosc., 245, 52–80, https://doi.org/10.1016/j.jms.2007.05.015, 2007a.
Devi, V. M., Benner, D. C., Brown, L. R., Miller, C. E., and Toth, R. A.: Line mixing and speed dependence in CO2 at 6348 cm−1: Positions, intensities, and air- and self-broadening derived with constrained multispectrum analysis, J. Mol. Spectrosc., 242, 90–117, https://doi.org/10.1016/j.jms.2007.02.018, 2007b.
Dupont, J.-C., Haeffelin, M., Badosa, J., Clain, G., Raux, C., and Vignelles, D.: Characterization and Corrections of Relative Humidity Measurement from Meteomodem M10 Radiosondes at Midlatitude Stations, J. Atmos. Ocean. Tech., 37, 857–871, https://doi.org/10.1175/JTECH-D-18-0205.1, 2020.
Durry, G. and Megie, G.: Atmospheric CH4 and H2O monitoring with near-infrared InGaAs laser diodes by the SDLA, a balloonborne spectrometer for tropospheric and stratospheric in situ measurements, Appl. Optics, 38, 7342–7354, 1999.
Durry, G. and Megie, G.: In situ measurements of H2O from a stratospheric balloon by diode laser direct-differential absorption spectroscopy at 1.39 µm, Appl. Optics, 39, 5601–5608, https://doi.org/10.1364/AO.39.005601, 2000.
Durry, G., Pouchet, I., Amarouche, N., Danguy, T., and Megie, G.: Shot-noise-limited dual-beam detector for atmospheric trace-gas monitoring with near-infrared diode lasers, Appl. Optics, 39, 5609–5619, https://doi.org/10.1364/AO.39.005609, 2000.
Durry, G., Amarouche, N., Joly, L., Liu, X., Parvitte, B., and Zéninari, V.: Laser diode spectroscopy of H2O at 2.63 µm for atmospheric applications, Appl. Phys. B, 90, 573–580, https://doi.org/10.1007/s00340-007-2884-3, 2008.
Dvortsov, V. L. and Solomon, S.: Response of the stratospheric temperatures and ozone to past and future increases in stratospheric humidity, J. Geophys. Res., 106, 7505–7514, https://doi.org/10.1029/2000JD900637, 2001.
Fahey, D. W., Gao, R.-S., Möhler, O., Saathoff, H., Schiller, C., Ebert, V., Krämer, M., Peter, T., Amarouche, N., Avallone, L. M., Bauer, R., Bozóki, Z., Christensen, L. E., Davis, S. M., Durry, G., Dyroff, C., Herman, R. L., Hunsmann, S., Khaykin, S. M., Mackrodt, P., Meyer, J., Smith, J. B., Spelten, N., Troy, R. F., Vömel, H., Wagner, S., and Wienhold, F. G.: The AquaVIT-1 intercomparison of atmospheric water vapor measurement techniques, Atmos. Meas. Tech., 7, 3177–3213, https://doi.org/10.5194/amt-7-3177-2014, 2014.
Forster, P. M. de F. and Shine, K. P.: Stratospheric water vapour changes as a possible contributor to observed stratospheric cooling, Geophys. Res. Lett., 26, 3309–3312, https://doi.org/10.1029/1999GL010487, 1999.
Galatry, L.: Simultaneous Effect of Doppler and Foreign Gas Broadening on Spectral Lines, Phys. Rev., 122, 1218–1223, https://doi.org/10.1103/PhysRev.122.1218, 1961.
Ghysels, M., Durry, G., and Amarouche, N.: Pressure-broadening and narrowing coefficients and temperature dependence measurements of CO2 at 2.68 µm by laser diode absorption spectroscopy for atmospheric applications, Spectrochim. Acta A, 107, 55–61, https://doi.org/10.1016/j.saa.2013.01.042, 2013.
Ghysels, M., Gomez, L., Cousin, J., Tran, H., Amarouche, N., Engel, A., Levin, I., and Durry, G.: Temperature dependences of air-broadening, air-narrowing and line-mixing coefficients of the methane ν3 R(6) manifold lines – Application to in-situ measurements of atmospheric methane, J. Quant. Spectrosco. Ra., 133, 206–216, https://doi.org/10.1016/j.jqsrt.2013.08.003, 2014.
Ghysels, M., Riviere, E. D., Khaykin, S., Stoeffler, C., Amarouche, N., Pommereau, J.-P., Held, G., and Durry, G.: Intercomparison of in situ water vapor balloon-borne measurements from Pico-SDLA H2O and FLASH-B in the tropical UTLS, Atmos. Meas. Tech., 9, 1207–1219, https://doi.org/10.5194/amt-9-1207-2016, 2016.
Gordon, I. E., Rothman, L. S., Hill, C., Kochanov, R. V., Tan, Y., Bernath, P. F., Birk, M., Boudon, V., Campargue, A., Chance, K. V., Drouin, B. J., Flaud, J.-M., Gamache, R. R., Hodges, J. T., Jacquemart, D., Perevalov, V. I., Perrin, A., Shine, K. P., Smith, M.-A. H., Tennyson, J., Toon, G. C., Tran, H., Tyuterev, V. G., Barbe, A., Császár, A. G., Devi, V. M., Furtenbacher, T., Harrison, J. J., Hartmann, J.-M., Jolly, A., Johnson, T. J., Karman, T., Kleiner, I., Kyuberis, A. A., Loos, J., Lyulin, O. M., Massie, S. T., Mikhailenko, S. N., Moazzen-Ahmadi, N., Müller, H. S. P., Naumenko, O. V., Nikitin, A. V., Polyansky, O. L., Rey, M., Rotger, M., Sharpe, S. W., Sung, K., Starikova, E., Tashkun, S. A., Auwera, J. V., Wagner, G., Wilzewski, J., Wcisło, P., Yu, S., and Zak, E. J.: The HITRAN2016 molecular spectroscopic database, J. Quant. Spectrosc. Ra., 203, 3–69, https://doi.org/10.1016/j.jqsrt.2017.06.038, 2017.
Hall, E. G., Jordan, A. F., Hurst, D. F., Oltmans, S. J., Vömel, H., Kühnreich, B., and Ebert, V.: Advancements, measurement uncertainties, and recent comparisons of the NOAA frost point hygrometer, Atmos. Meas. Tech., 9, 4295–4310, https://doi.org/10.5194/amt-9-4295-2016, 2016.
Hartmann, J. M., Nguyen-Van-Thanh, Brodbeck, C., Benidar, A., LeDoucen, R., Regalia, L., and Barbe, A.: Simple modeling of line-mixing effects in IR bands. II. Nonlinear molecules applications to O3 and CHClF2, J. Chem. Phys., 104, 2185–2191, https://doi.org/10.1063/1.470974, 1996.
Hartmann, J.-M., Tran, H., and Toon, G. C.: Influence of line mixing on the retrievals of atmospheric CO2 from spectra in the 1.6 and 2.1 μm regions, Atmos. Chem. Phys., 9, 7303–7312, https://doi.org/10.5194/acp-9-7303-2009, 2009.
Hurst, D. F., Oltmans, S. J., Vömel, H., Rosenlof, K. H., Davis, S. M., Ray, E. A., Hall, E. G., and Jordan, A. F.: Stratospheric water vapor trends over Boulder, Colorado: Analysis of the 30 year Boulder record, J. Geophys. Res.-Atmos., 116, D02306, https://doi.org/10.1029/2010JD015065, 2011.
Hurst, D. F., Read, W. G., Vömel, H., Selkirk, H. B., Rosenlof, K. H., Davis, S. M., Hall, E. G., Jordan, A. F., and Oltmans, S. J.: Recent divergences in stratospheric water vapor measurements by frost point hygrometers and the Aura Microwave Limb Sounder, Atmos. Meas. Tech., 9, 4447–4457, https://doi.org/10.5194/amt-9-4447-2016, 2016.
Hyland, R. W. and Wexler, A.: Formulations for the thermodynamic properties of the saturated phases of H2O from 173.15 K to 473.15 K, Ashrae Transactions, 89, 500–519, 1983.
Joubert, P., Hoang, P. N. M., Bonamy, L., and Robert, D.: Speed-dependent line-shape model analysis from molecular-dynamics simulations: The collisional confinement narrowing regime, Phys. Rev. A, 66, 042508, https://doi.org/10.1103/PhysRevA.66.042508, 2002.
Kaufmann, S., Voigt, C., Jurkat, T., Thornberry, T., Fahey, D. W., Gao, R.-S., Schlage, R., Schäuble, D., and Zöger, M.: The airborne mass spectrometer AIMS – Part 1: AIMS-H2O for UTLS water vapor measurements, Atmos. Meas. Tech., 9, 939–953, https://doi.org/10.5194/amt-9-939-2016, 2016.
Kaufmann, S., Voigt, C., Heller, R., Jurkat-Witschas, T., Krämer, M., Rolf, C., Zöger, M., Giez, A., Buchholz, B., Ebert, V., Thornberry, T., and Schumann, U.: Intercomparison of midlatitude tropospheric and lower-stratospheric water vapor measurements and comparison to ECMWF humidity data, Atmos. Chem. Phys., 18, 16729–16745, https://doi.org/10.5194/acp-18-16729-2018, 2018.
Kiehl, J. T. and Trenberth, K. E.: Earth's Annual Global Mean Energy Budget, B. Am. Meteorol. Soc., 78, 197–208, https://doi.org/10.1175/1520-0477(1997)078<0197:EAGMEB>2.0.CO;2, 1997.
Korotcenkov, G.: Handbook of Humidity Measurement, Volume 1: Spectroscopic Methods of Humidity Measurement, CRC Press, 626 pp., ISBN-13 9780367571887, 2018.
Lacis, A. A., Hansen, J. E., Russell, G. L., Oinas, V., and Jonas, J.: The role of long-lived greenhouse gases as principal LW control knob that governs the global surface temperature for past and future climate change, Tellus B, 65, 19734, https://doi.org/10.3402/tellusb.v65i0.19734, 2013.
Lamouroux, J., Régalia, L., Thomas, X., Vander Auwera, J., Gamache, R. R., and Hartmann, J.-M.: CO2 line-mixing database and software update and its tests in the 2.1 µm and 4.3 µm regions, J. Quant. Spectrosc. Ra., 151, 88–96, https://doi.org/10.1016/j.jqsrt.2014.09.017, 2015.
Lance, B., Blanquet, G., Walrand, J., and Bouanich, J. P.: On the Speed-Dependent Hard Collision Lineshape Models: Application to C2H2 Perturbed by Xe, J. Mol. Spectrosc., 185, 262–271, https://doi.org/10.1006/jmsp.1997.7385, 1997.
Lisak, D., Bielski, A., Ciuryło, R., Domysławska, J., Trawiński, R. S., and Szudy, J.: On the role of Dicke narrowing in the formation of atomic line shapes in the optical domain, J. Phys. B, 36, 3985, https://doi.org/10.1088/0953-4075/36/19/009, 2003.
Lisak, D., Cygan, A., Wcisło, P., and Ciuryło, R.: Quadratic speed dependence of collisional broadening and shifting for atmospheric applications, J. Quant. Spectrosc. Ra., 151, 43–48, https://doi.org/10.1016/j.jqsrt.2014.08.016, 2015.
List, R. J.: Smithsonian Meteorological Tables, Smithsonian Institution Press, Washington, USA, Volume 114, 6th Edn., https://ia802601.us.archive.org/20/items/smithsonianmisce1141949smit/smithsonianmisce1141949smit.pdf (last access: 24 March 2024) 1984.
Meyer, J., Rolf, C., Schiller, C., Rohs, S., Spelten, N., Afchine, A., Zöger, M., Sitnikov, N., Thornberry, T. D., Rollins, A. W., Bozóki, Z., Tátrai, D., Ebert, V., Kühnreich, B., Mackrodt, P., Möhler, O., Saathoff, H., Rosenlof, K. H., and Krämer, M.: Two decades of water vapor measurements with the FISH fluorescence hygrometer: a review, Atmos. Chem. Phys., 15, 8521–8538, https://doi.org/10.5194/acp-15-8521-2015, 2015.
Minschwaner, K. and Dessler, A. E.: Water Vapor Feedback in the Tropical Upper Troposphere: Model Results and Observations, J. Climate, 17, 1272–1282, https://doi.org/10.1175/1520-0442(2004)017<1272:WVFITT>2.0.CO;2, 2004.
Nash, J., Oakley, T., Vömel, H., Wei, L., and World Meteorological Organization (WMO): WMO Intercomparison of High Quality Radiosonde Systems (12 July–3 August 2010), IOM Report, 107, WMO Intercomparison of High Quality Radiosonde Systems, WMO, Geneva, 249 pp., WMO/TD-No. 1580, https://library.wmo.int/idurl/4/50499 (last access: 24 March 2024), 2011.
Riese, M., Ploeger, F., Rap, A., Vogel, B., Konopka, P., Dameris, M., and Forster, P.: Impact of uncertainties in atmospheric mixing on simulated UTLS composition and related radiative effects, J. Geophys. Res.-Atmos., 117, D16305, https://doi.org/10.1029/2012JD017751, 2012.
Rollins, A. W., Thornberry, T. D., Gao, R. S., Smith, J. B., Sayres, D. S., Sargent, M. R., Schiller, C., Krämer, M., Spelten, N., Hurst, D. F., Jordan, A. F., Hall, E. G., Vömel, H., Diskin, G. S., Podolske, J. R., Christensen, L. E., Rosenlof, K. H., Jensen, E. J., and Fahey, D. W.: Evaluation of UT/LS hygrometer accuracy by intercomparison during the NASA MACPEX mission, J. Geophys. Res.-Atmos., 119, 2013JD020817, https://doi.org/10.1002/2013JD020817, 2014.
Sarkozy, L. C., Clouser, B. W., Lamb, K. D., Stutz, E. J., Saathoff, H., Möhler, O., Ebert, V., and Moyer, E. J.: The Chicago Water Isotope Spectrometer (ChiWIS-lab): A tunable diode laser spectrometer for chamber-based measurements of water vapor isotopic evolution during cirrus formation, Rev. Sci. Instr., 91, 045120, https://doi.org/10.1063/1.5139244, 2020.
Schmidt, G. A., Ruedy, R. A., Miller, R. L., and Lacis, A. A.: Attribution of the present-day total greenhouse effect, J. Geophys. Res.-Atmos., 115, D20106, https://doi.org/10.1029/2010JD014287, 2010.
Singer, C. E., Clouser, B. W., Khaykin, S. M., Krämer, M., Cairo, F., Peter, T., Lykov, A., Rolf, C., Spelten, N., Afchine, A., Brunamonti, S., and Moyer, E. J.: Intercomparison of upper tropospheric and lower stratospheric water vapor measurements over the Asian Summer Monsoon during the StratoClim campaign, Atmos. Meas. Tech., 15, 4767–4783, https://doi.org/10.5194/amt-15-4767-2022, 2022.
Sitnikov, N. M., Yushkov, V. A., Afchine, A. A., Korshunov, L. I., Astakhov, V. I., Ulanovskii, A. E., Kraemer, M., Mangold, A., Schiller, C., and Ravegnani, F.: The FLASH instrument for water vapor measurements on board the high-altitude airplane, Instrum. Exp. Tech., 50, 113–121, https://doi.org/10.1134/S0020441207010174, 2007.
Soden, B. J., Jackson, D. L., Ramaswamy, V., Schwarzkopf, M. D., and Huang, X.: The Radiative Signature of Upper Tropospheric Moistening, Science, 310, 841–844, https://doi.org/10.1126/science.1115602, 2005.
Solomon, S., Rosenlof, K. H., Portmann, R. W., Daniel, J. S., Davis, S. M., Sanford, T. J., and Plattner, G.-K.: Contributions of Stratospheric Water Vapor to Decadal Changes in the Rate of Global Warming, Science, 327, 1219–1223, https://doi.org/10.1126/science.1182488, 2010.
Thornberry, T. D., Rollins, A. W., Gao, R. S., Watts, L. A., Ciciora, S. J., McLaughlin, R. J., Voigt, C., Hall, B., and Fahey, D. W.: Measurement of low-ppm mixing ratios of water vapor in the upper troposphere and lower stratosphere using chemical ionization mass spectrometry, Atmos. Meas. Tech., 6, 1461–1475, https://doi.org/10.5194/amt-6-1461-2013, 2013.
Vömel, H., Yushkov, V., Khaykin, S., Korshunov, L., Kyrö, E., and Kivi, R.: Intercomparisons of Stratospheric Water Vapor Sensors: FLASH-B and NOAA/CMDL Frost-Point Hygrometer, J. Atmos. Ocean. Tech., 24, 941–952, https://doi.org/10.1175/JTECH2007.1, 2007.
Wang, Y., Su, H., Jiang, J. H., Livesey, N. J., Santee, M. L., Froidevaux, L., Read, W. G., and Anderson, J.: The linkage between stratospheric water vapor and surface temperature in an observation-constrained coupled general circulation model, Clim. Dynam., 48, 2671–2683, https://doi.org/10.1007/s00382-016-3231-3, 2017.
- Abstract
- Introduction
- Predecessor instrument, Pico-SDLA H2O
- Pico-Light H2O
- The NOAA frost point hygrometer
- M20 sondes from Meteomodem
- Descriptions of the compared data sets
- Flight conditions
- Comparison between Pico-Light H2O and NOAA FPH
- Comparisons of relative humidity in the troposphere
- Conclusions
- Data availability
- Author contributions
- Competing interests
- Disclaimer
- Acknowledgements
- Financial support
- Review statement
- References