the Creative Commons Attribution 4.0 License.
the Creative Commons Attribution 4.0 License.
 | 18 Jun 2024
A near-global multiyear climate data record of the fine-mode and coarse-mode components of atmospheric pure dust
Antonis Gkikas
Thanasis Georgiou
Anna Kampouri
Eleni Drakaki
Claire L. Ryder
Franco Marenco
Eleni Marinou
Vassilis Amiridis
A new four-dimensional, multiyear, and near-global climate data record of the fine-mode (submicrometer in terms of diameter) and coarse-mode (supermicrometer in terms of diameter) components of atmospheric pure dust is presented. The separation of the two modes of dust in detected atmospheric dust layers is based on a combination of (1) the total pure-dust product provided by the well-established European Space Agency (ESA) “LIdar climatology of Vertical Aerosol Structure” (LIVAS) database and (2) the coarse-mode component of pure dust provided by the first step of the two-step POlarization LIdar PHOtometer Networking (POLIPHON) technique, developed in the framework of the European Aerosol Research Lidar Network (EARLINET). Accordingly, the fine-mode component of pure dust is extracted as the residual between the LIVAS total pure dust and the coarse-mode component of pure dust. Intermediate steps involve the implementation of regionally dependent lidar-derived lidar ratio values and AErosol RObotic NETwork (AERONET)-based climatological extinction-to-volume conversion factors, facilitating conversion of dust backscatter into extinction and subsequently extinction into mass concentration. The decoupling scheme is applied to observations from the Cloud–Aerosol Lidar and Infrared Pathfinder Satellite Observations (CALIPSO) at 532 nm. The final products consist of the fine mode and coarse mode of atmospheric pure dust, quality-assured profiles of backscatter coefficient at 532 nm, extinction coefficient at 532 nm, and mass concentration for each of the two components. The datasets are established primarily with the original L2 horizontal (5 km) and vertical (60 m) resolution of the Cloud–Aerosol Lidar with Orthogonal Polarization (CALIOP) along the CALIPSO orbit path and secondly in averaged profiles of seasonal–temporal resolution, 1° × 1° spatial resolution, and the original vertical resolution of CALIPSO, focusing on the latitudinal band extending between 70° S and 70° N and covering more than 15 years of Earth observations (June 2006–December 2021). The quality of the CALIPSO-based fine-mode and coarse-mode dust products is assessed through the use of AERONET fine-mode and coarse-mode aerosol optical thickness (AOT) interpolated to 532 nm and the AERosol properties – Dust (AER-D) campaign airborne in situ particle size distributions (PSDs) as reference datasets during atmospheric conditions characterized by dust presence. The near-global fine-mode and coarse-mode pure-dust climate data record is considered unique with respect to a wide range of potential applications, including climatological, time series, and trend analysis over extensive geographical domains and temporal periods, validation of atmospheric dust models and reanalysis datasets, assimilation activities, and investigation of the role of airborne dust in radiation and air quality.
- Article
(16320 KB) - Full-text XML
- BibTeX
- EndNote


Mineral dust particles dispersed in the atmosphere play a key role in the Earth's radiation budget, climate system, environmental conditions, and human health. Constituting a major component of the global aerosol mass burden (Gliß et al., 2021; Kok et al., 2017), airborne dust perturbs the Earth's radiative budget through scattering and absorption of solar shortwave and longwave radiation (Tegen and Lacis, 1996; Ramanathan et al., 2001; Adebiyi and Kok, 2020; Ito et al., 2021), an instantaneous process known as the direct radiative effect (Sokolik and Toon, 1996). Moreover, depending on the chemical composition and atmospheric conditions, dust aerosols serve as effective cloud condensation nuclei (CCN; Hatch et al., 2008) and/or ice-nucleating particles (INPs; DeMott et al., 2009; Marinou et al., 2019). Through the induced indirect and semi-direct effects on the radiation balance, airborne dust aerosols modify clouds' microphysical, macrophysical, and optical properties (e.g., albedo), precipitation patterns, atmospheric stability, cloud formation, lifetime, and coverage (Twomey, 1977; Albrecht, 1989; Rosenfeld et al., 2008), with adverse effects on weather and eventually climate (Haywood and Bucher, 2000; Huang et al., 2006). However, the impact of atmospheric dust extends beyond the Earth's energy balance. The aeolian transport of dust particles over large distances (van der Does et al., 2018; Drakaki et al., 2022) uniquely influences both marine and terrestrial ecosystems. Through wet and dry deposition of mineral nutrients, iron, and phosphorus (Okin et al., 2004), dust regulates oceanic productivity, affects the ecosystems' biogeochemical cycles, and in addition affects the carbon dioxide budget (Jickells et al., 2005; Li et al., 2018). Dust is related to a wide range of anthropogenic economic activities, including, among others, agriculture (Stefanski and Sivakumar, 2009), solar energy production (Kosmopoulos et al., 2018; Masoom et al., 2021; Papachristopoulou et al., 2022), and aviation safety (Papagiannopoulos et al., 2020; Ryder et al., 2023). Finally, atmospheric dust and human health are closely linked. More specifically, depending on particle size distribution (PSD) and mass concentration over inhabited areas and within the planetary boundary layer (PBL), airborne dust is associated with degradation of air quality (Kanakidou et al., 2011; Dione et al., 2022) and negative impacts on human health (Du et al., 2015).
The intensity of these effects depends strongly on the complex nature of mineral dust, related to large uncertainties not fully determined and known. According to the Intergovernmental Panel on Climate Change Fourth Assessment Report (IPCC, 2013), the “natural variability” of aerosols is a significant factor of uncertainty in climate change predictions. Despite the considerable progress by the scientific community in observing and modeling climate-relevant aerosol properties in the following years (IPCC, 2014) and until today (Forster et al., 2021), the overall aerosol uncertainties, although better quantified and with an improved confidence level, remain high. Moreover, in addition to natural dust, anthropogenic dust is estimated to contribute about 25 % to the global atmospheric dust load (Ginoux et al., 2012), a component that consists of an additional important source of uncertainty.
Towards reducing these uncertainties, proper consideration and better understanding of the different contributing factors of dust life cycle, from dust emission to transport and eventually deposition, are required. Regarding mineral dust natural mobilization mechanisms, they involve dust devils (Koch and Renno, 2005; Ansmann et al., 2009), “haboobs” (Knippertz et al., 2007), pressure gradients (Klose et al., 2010), and low-level jets (LLJs; Fiedler et al., 2013) developed over hyper-arid, arid, and semi-arid regions (Fig. 1) of easily erodible dry soils or areas of little vegetation (Prospero et al., 2002), triggering dust emission and suspension into the atmosphere (Marticoreìna, 2014). Uncertainties related to emission and mobilization mechanisms, inhomogeneous in both time and space and of variable production strength (Knippertz et al., 2009, 2011), propagate into our understanding of the mineral dust role in the climate system, environmental conditions, and human health. In addition, mineral dust originating from different regions is characterized by substantially different chemical composition (Krueger et al., 2004) and thus of different scattering and absorption properties (Müller et al., 2007a; Nisantzi et al., 2015). Therefore, to better assess, understand, and model the complex role of atmospheric dust in the climate system and its impact on the environment, accurate information on the highly variable temporal evolution and three-dimensional distribution of dust is required, with particular focus on profiling.
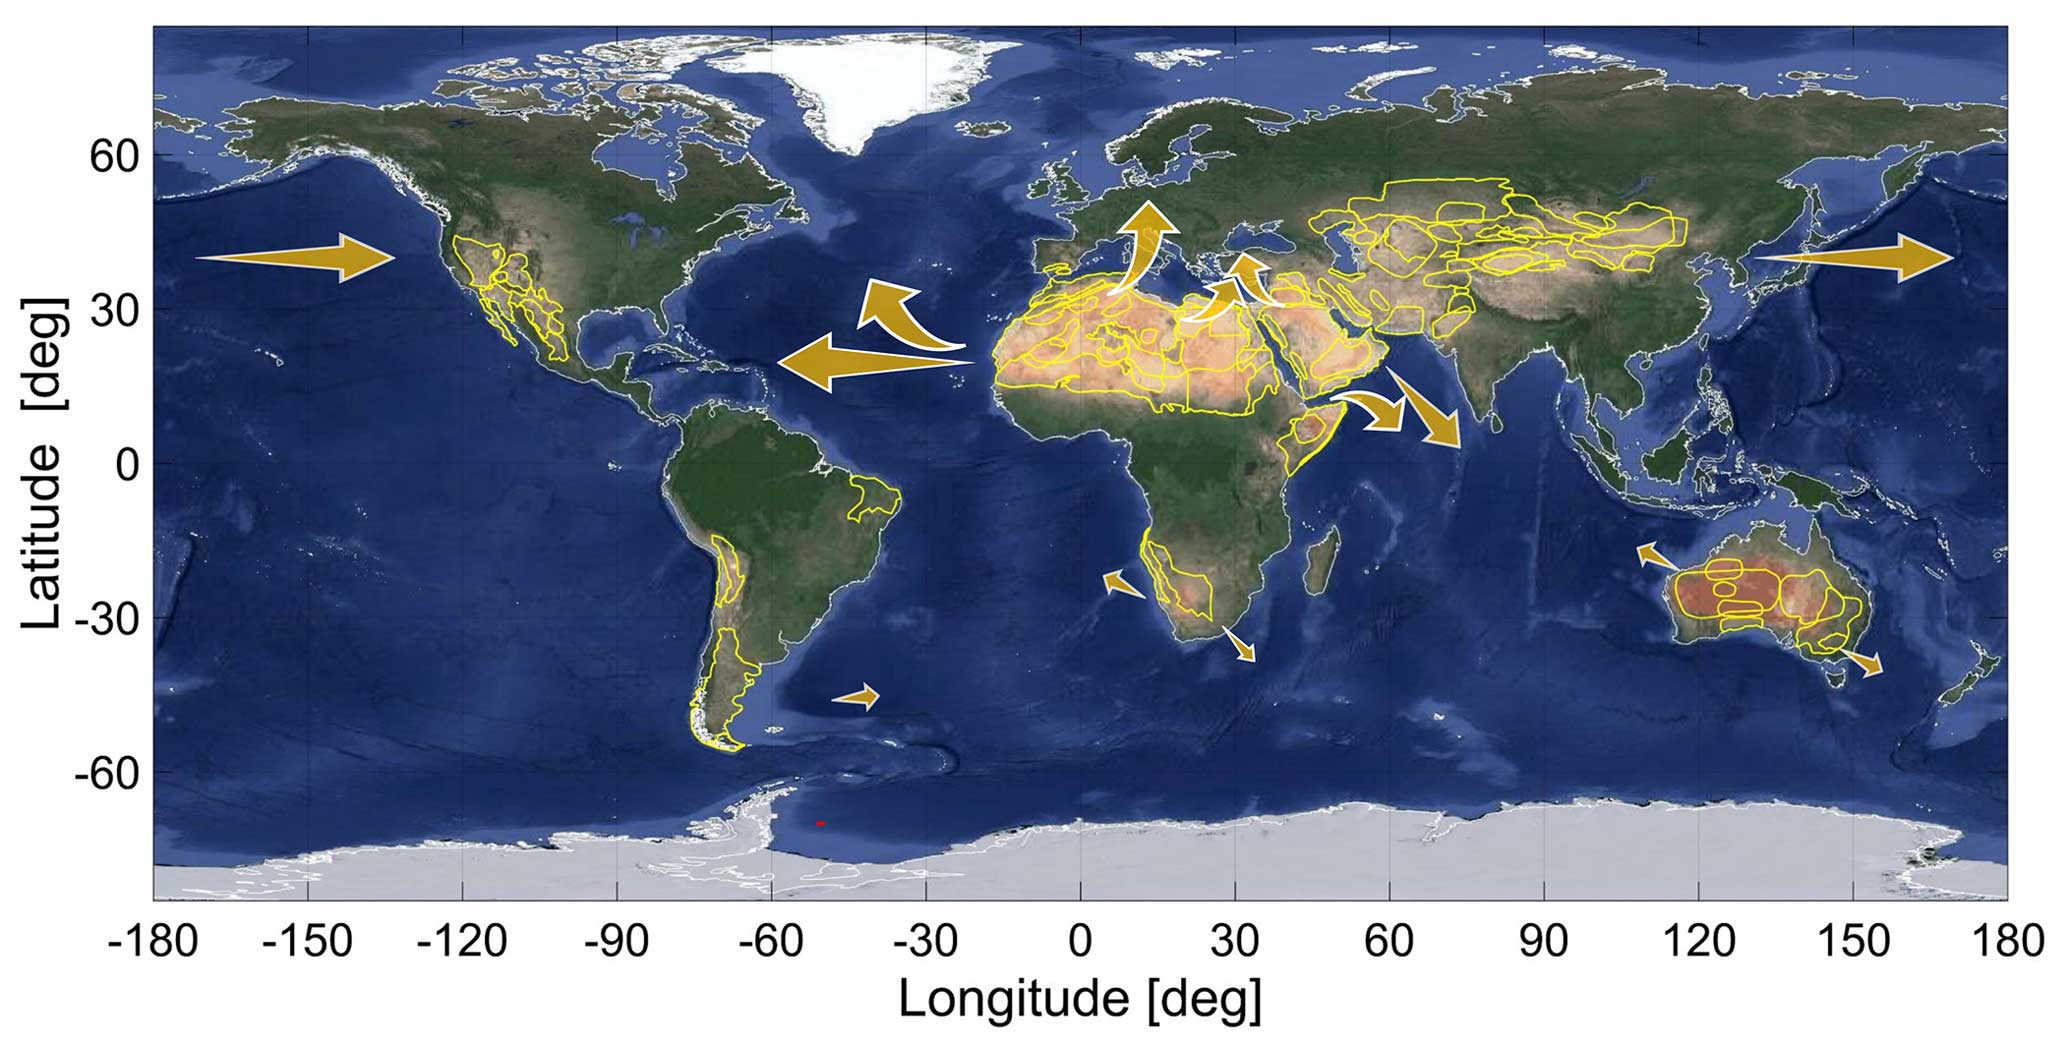
Figure 1Hyper-arid, arid, and semi-arid regions of easily erodible dry soils or areas of little vegetation (areas in yellow color) and main aeolian dust transport pathways (source: Natural Earth Data: https://www.naturalearthdata.com/; last access: 3 July 2023). Layer background: © Google Maps.
Of particular interest is the fact that dust-associated properties are associated with the particle size distribution. Upon entering the free troposphere the lifetime of atmospheric dust transport highly depends on the particles' size, with coarse mineral particles more efficiently removed through dry deposition (e.g., gravitational settling) close to the source regions (Schepanski et al., 2009) and fine dust particles more prominent to long-range transport prior to their removal via dry deposition or wet scavenging (Ginoux et al., 2004). Recent studies, however, stress the still not fully understood impact of dust size distribution on transport, the longer atmospheric lifetime of giant dust particles prior to removal (van der Does et al., 2018; Drakaki et al., 2022), and the substantial underestimation of dust transport range simulated by state-of-the-art climate models (Adebiyi and Kok, 2020). Dust vertical distribution, dust particle size distribution, and dust transport are intimately interlinked and a poor characterization of one of these aspects in a model has direct repercussions on the other two: for this reason, spaceborne datasets of the vertical dust distribution can fill a crucial observational gap (O'Sullivan et al., 2020). Moreover, dust optical depth is controlled by both the fine-mode and coarse-mode dust components, while at the same time, optical properties, such as scattering and linear particle depolarization ratio, are also subject to the size distribution (Sakai et al., 2010; Järvinen et al., 2016). Regarding the Earth's energy balance, not all dust modes contribute to aerosol radiative forcing in the same way in sign and magnitude, with warming and cooling effects reported for dust particles larger and smaller than 5 µm in diameter, respectively (Miller et al., 2006; Kok et al., 2017). Furthermore, coarse dust particles act more efficiently as CCN and/or INPs than fine-mode dust particles (DeMott et al., 2009; Adebiyi et al., 2023; He et al., 2023), while the effect of dust on health is widely controlled by the fine-mode of dust particles (Goudie, 2014). To address these multiple uncertainties, observing, monitoring, modeling, and quantifying the spatial, vertical, and temporal distribution of mineral dust suspended in the atmosphere, with the potential to further distinguish between the fine mode and coarse mode over extended regions and temporal periods, are important steps towards a more realistic understanding of the complex role of dust in Earth's system and human health and towards better constraints in dust models (Konsta et al., 2018).
Light detection and ranging (lidar) is among the most prominent and powerful techniques for remote sensing of atmospheric aerosols. The technique is able to provide the vertical structure of the aerosol field and related optical properties at high vertical resolution. In particular, lidar systems employing polarization measurements greatly contribute to our knowledge of atmospheric dust, as irregular particles perturb the polarization state of lidar-emitted polarized light pulses (Freudenthaler et al., 2009). Moreover, when individual ground-based multiwavelength Raman polarization lidars are assembled under a network architecture, the on-parallel operation greatly expands the capacity of aerosol remote sensing in both time and space on a regular basis or even continually (e.g., Ansmann et al., 2003; Amiridis et al., 2005; Mona et al., 2006; Mattis et al., 2008; Papayannis et al., 2008). Motivated by the lidar capability of profiling aerosol optical properties with high vertical resolution and the distinct signature of non-spherical dust particles on the particle linear depolarization ratio, comprehensive efforts have been made to implement lidars to develop sophisticated methodologies for identifying, and accordingly decoupling, the pure-dust component from the total atmospheric aerosol load. To date, the Lidar–Radiometer Inversion Code (LIRIC; Chaikovsky et al., 2016) and the Generalized Aerosol Retrieval from Radiometer and Lidar Combined data (GARRLiC; Lopatin et al., 2013) algorithms implement coincident elastic backscatter lidar measurements synergistically with the sun–sky-scanning radiometer observations obtained by the global Aerosol Robotic Network (AERONET; https://aeronet.gsfc.nasa.gov/; last access: 3 July 2023; Holben et al., 1998) for the retrieval of vertically resolved aerosol properties, including differentiation between the fine-mode and coarse-mode contributions. In addition to the LIRIC and GARRLiC algorithms and under the European Aerosol Research Lidar Network (EARLINET) efforts of aerosol characterization, a polarization-based algorithm for decoupling the atmospheric pure-dust component from the total aerosol load has been developed, initially established by Shimizu et al. (2004) and accordingly expanded through the one-step POlarization LIdar PHOtometer Networking (one-step POLIPHON; Tesche et al., 2009; Ansmann et al., 2012) advancements. The technique consists of a stand-alone lidar polarization-dependent approach capable of decoupling the pure-dust and non-dust aerosol components during both daytime and nighttime illumination conditions and even under the presence of thin clouds. Moreover, a multistep extension of the one-step POLIPHON, namely the two-step POLIPHON, allows for further decoupling between the fine-mode and coarse-mode components of atmospheric dust (Mamouri and Ansmann, 2014, 2017) based on the observation that these two components of the total dust load have distinct characteristic particle depolarization ratio properties.
Observation and characterization of atmospheric dust highly depend on lidar systems employing polarization measurements. To date, a significant number of polarization lidar systems have been deployed for both services and aerosol research purposes to permanent locations around the globe, frequently operating as integral components of ground-based lidar networks. Presently, lidar networks of continental scale contributing to the dust observational efforts include, among others, the pioneering European Aerosol Research Lidar Network (EARLINET; http://www.earlinet.org/; last access: 3 July 2023; Pappalardo et al., 2014), PollyNET (http://polly.tropos.de/; last access: 3 July 2023; Baars et al., 2016), the (East) Asian Dust and Aerosol Lidar Observation Network (AD-NET; https://www-lidar.nies.go.jp/AD-Net/; last access: 3 July 2023; Shimizu et al., 2017), the Latin America Lidar Network (LALINET; http://lalinet.org/; last access: 3 July 2023; Antuña-Marrero et al., 2017), the Micro-Pulse Lidar Network (MPLNET; http://mplnet.gsfc.nasa.gov; last access: 3 July 2023; Welton et al., 2001), and NOAA's Cooperative Remote Sensing Science and Technology Lidar Network (CREST-CLN; https://www.cessrst.org/about-us/, last access: 29 May 2024). The ground-based lidar networks are further organized as a network of lidar networks under the Global Atmosphere Watch (GAW) Aerosol Lidar Observation Network (GALION). However, harmonized global vertically resolved observation of the atmospheric aerosol components collected via ground-based lidar systems still remains challenging. Among the significant challenges are the different instrumental designs, the manually researcher- and user-dependent operation (e.g., EARLINET three times per week; Pappalardo et al., 2014), the need for continuous provision of atmospheric observations (e.g., PollyNET; Baars et al., 2016; Engelmann et al., 2016), and automatic data processing chains and quality assurance and calibration procedures to harmonize lidar measurements (e.g., efforts towards the EARLINET single calculus chain; D'Amico et al., 2015). Furthermore, due to the Earth's surface being ∼ 70 % covered by water, the geographical coverage of deployed lidar systems is mainly over land and low.
To date, the challenges of ground-based lidar networks have been addressed with spaceborne lidar systems, especially by CALIOP (Cloud–Aerosol Lidar with Orthogonal Polarization), the primary instrument on board the satellite CALIPSO (Cloud–Aerosol Lidar and Infrared Pathfinder Satellite Observation; Winker et al., 2009). More specifically, CALIPSO provided multiyear observations of aerosol and cloud optical properties (i.e., attenuated backscatter and volume depolarization ratio at 532 nm), operating on a near-global scale (i.e., 82° S and 82° N) and nearly continuously, between June 2006 and August 2023. As such CALIPSO has provided an unprecedented long-term Earth observation (EO) dataset of atmospheric aerosols. In addition, due to the distinct signature of dust on the particulate depolarization ratio (Gobbi et al., 2000; Freudenthaler et al., 2009), the long-term CALIPSO vertically resolved polarization measurements have allowed for global monitoring and quantification of the horizontal, vertical, and temporal distribution of the mineral dust aerosol component (Amiridis et al., 2013; Marinou et al., 2017; Proestakis et al., 2018).
Here we present the first attempt to adapt and apply the general concept of the two-step POLIPHON method to CALIOP polarization lidar measurements. The study is motivated by laboratory studies reporting on the distinct light-depolarizing properties of fine-mode and coarse-mode dust (Sakai et al., 2010; Järvinen et al., 2016), accordingly expanded in the framework of EARLINET (Mamouri and Ansmann, 2014, 2017). The overarching objective of the present study consists of the separation of the pure-dust submicrometer (fine-mode) and supermicrometer (coarse-mode) components of the dust aerosol load in order to provide an accurate near-global and multiyear description of (1) the temporal distribution, (2) the three-dimensional spatial and vertical distribution, and (3) the seasonal and spatial transition of fine- and coarse-mode dust transport pathways in terms of range, height, and intensity (Fig. 1). Moreover, this study aims to contribute to the next generation of dust air quality geo-information products, with the overarching objective to advance our EO-based capacity to provide the PBL fine-mode component of dust at a near-global scale and over long-term periods.
The paper is organized as follows. Section 2 provides a description of the implemented datasets (Sect. 2.1) and an overview of the applied methodology (Sect. 2.2) in order to realize the overarching technical and scientific objectives of the study. In Sect. 3 the quality of the CALIPSO-based fine-mode and coarse-mode pure-dust products is addressed against long-term AERONET observations (Sect. 3.1) and airborne in situ measurements (Sect. 3.2) as reference datasets. Section 4 provides an overview of the four-dimensional (4D) reconstruction of the atmosphere in terms of fine-mode and coarse-mode pure-dust components at a near-global scale and based on more than 15 years of EO. Finally, Sect. 5 provides a summary of the study along with the main concluding remarks.
2.1 Datasets
The following subsections discuss the datasets implemented in the framework of the study to facilitate the realization of its overarching objectives. More specifically, Sect. 2.1.1 provides an overview of the CALIPSO–CALIOP mission and products, the cornerstone of the near-global fine-mode and coarse-mode pure-dust climate data record. In addition, towards establishing the accuracy of the products and consistency checks, the study utilizes ISS-CATS (International Space Station, Cloud–Aerosol Transport System) optical products (Sect. 2.1.2) and AERONET retrievals (Sect. 2.1.3).
2.1.1 CALIPSO–CALIOP
The Cloud–Aerosol Lidar and Infrared Pathfinder Satellite Observation (CALIPSO) mission (Winker et al., 2010) was a joint satellite project developed, operated, and maintained in collaboration between the National Aeronautics and Space Administration (NASA), the United States space agency, and the Centre National D'Études Spatiales (CNES), the French space agency. The satellite CALIPSO was launched on 28 April 2006 and integrated in the Afternoon-Train (A-Train) constellation of sun-synchronous polar-orbit satellites (Stephens et al., 2018), hosting a suite of three Earth-observing instruments, in a near-nadir-looking configuration: a single-channel 645 wide field-of-view camera (WFC), a three-channel (8.65, 10.6, 12.05 µm) imaging infrared radiometer (IIR; Garnier et al., 2017), and the primal payload, the Cloud–Aerosol Lidar with Orthogonal Polarization (CALIOP) (Hunt et al., 2009). CALIOP was a dual-wavelength polarization-sensitive elastic backscatter Nd:YAG lidar capable of transmitting linear polarized light pulses at 532 and 1064 nm and performing range-resolved measurements of the backscattered signals by atmospheric features, specifically of the parallel and perpendicular components of the backscattered photons at 532 nm with respect to the polarization plane of the CALIOP emitted beam and the total backscatter intensity at 1064 nm (Winker et al., 2009).
CALIOP measurements and products are provided in different levels of processing. The received measurements of attenuated backscatter from molecules and particles are provided at km horizontal and 30 m vertical resolution and reported in CALIOP level 1 (L1). Subsequently, CALIOP L1 measurements are processed to CALIOP level 2 (L2) products, following a sophisticated chain of algorithms (Winker et al., 2009) that performs a sequence of functions, including the fundamental calibration for the retrieval's daytime and nighttime calibration of the three receiver channels (Powell et al., 2009; Getzewich et al., 2018; Kar et al., 2018; Vaughan et al., 2019), layer detection (Vaughan et al., 2009) and cloud–aerosol discrimination (Liu et al., 2009, 2019; Zeng et al., 2019). In addition, in the process of retrieving particulate extinction profiles (Young and Vaughan, 2009), an intermediate aerosol classification and lidar ratio (LR) selection algorithm for feature detection classifies atmospheric features between clear air, tropospheric aerosol, stratospheric aerosol, cloud, surface, subsurface, totally attenuated, and aerosol and cloud features of low/no confidence. The algorithm modules further classify atmospheric features categorized as tropospheric aerosol between marine, dust, polluted continental/smoke, clean continental, polluted dust, elevated smoke, and dusty marine (Omar et al., 2009; Kim et al., 2018). In the case of stratospheric aerosol a distinction is made between PSC aerosol, volcanic ash, and sulfate/other (Kar et al., 2019).
CALIOP L2 profiles of aerosols (APro) and clouds (CPro) provided continuous, vertically resolved measurements of optical and geometrical properties of atmospheric features, detected along the CALIPSO orbit path on a near-global scale at uniform 5 km horizontal and 60 m vertical resolution over the altitude range from −0.5 to 20.2 km and 180 m from 20.2 to 30 km height a.m.s.l. In this study, we use CALIPSO Version 4.2 (V4.2) L2 profiles of altitude-resolved aerosol backscatter coefficient and particulate depolarization ratio at 532 nm, profile descriptors (e.g., longitude, latitude, time), the provided quality assurance flags (e.g., cloud–aerosol discrimination – CAD – score), and the assigned atmospheric classification products between June 2006 and December 2021 to develop the CALIPSO-based three-dimensional multiyear global fine-mode and coarse-mode pure-dust products.
The quality screening procedures used here to generate the quality-assured CALIPSO-based lever 2 and level 3 fine-mode and coarse-mode pure-dust aerosol products follow the quality control procedures used to generate the official CALIPSO level 3 aerosol products (Winker et al., 2013; Tackett et al., 2018) and subsequent developments (Amiridis et al., 2013; Marinou et al., 2017). More specifically, the quality screening methods are initially applied to CALIOP L2 backscatter coefficient profiles at 532 nm prior to decoupling the pure-dust, fine-mode pure-dust, and coarse-mode pure-dust components from the total aerosol load. The approach is conservative, weighting the removal of a significant number of erroneous features and retrievals over preservation of the dataset, to avoid introducing inconsistencies, weighting effects, and unrealistic shape of profiles due to significant reduction of the dataset.
Table 1Quality control procedures and filtering applied to CALIPSO data.
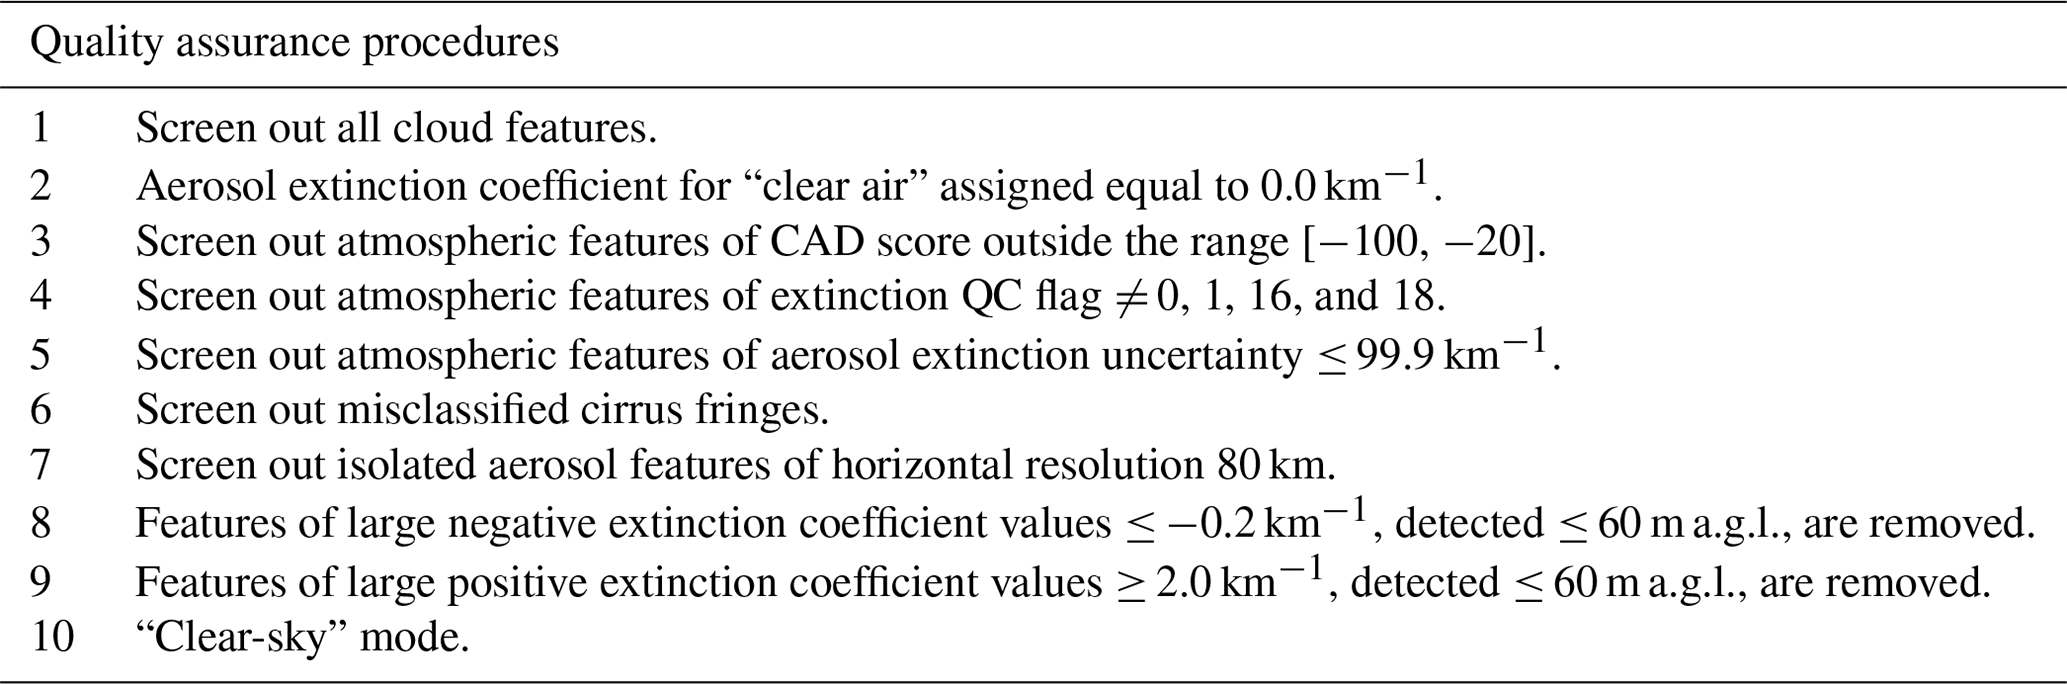
With respect to quality assurance procedures, the most aggressive quality control check is considered the cloud-free condition, applied in an entire profile removal approach when cloud features are detected at the CALIPSO profile level at 5 km, resulting in minimizing detection, classification and retrieval errors, and eventually avoiding attenuation and weighting effects (Tackett et al., 2018). Moreover, in the process of quality screening controls, the backscatter coefficient of atmospheric features classified as “clear air” is assumed to be equal to 0.0 km−1 sr−1. Aerosol layers detected at 80 km horizontal averaging resolution, due to low signal-to-noise ratio (SNR), and not in contact with other quality-assured aerosol layers are rejected. To account for clouds misclassified as aerosol, and vice versa, aerosol features of CAD score in the range [−100, −20] are accepted, rejecting aerosol layers of CAD score outside this range due to high probability of erroneous feature classification. In addition, aerosol layers above 4 km a.m.s.l., adjacent to ice clouds of top temperature below 0 °C, are also rejected as cirrus fringes misclassified as aerosols. The series of quality assurance procedures include rejection of the backscatter coefficient at 532 nm in cases of low quality in the retrieval of the corresponding extinction coefficient at 532 nm profiles. Level 2 aerosol features of extinction QC flags not equal to 0 (lidar ratio unchanged), 1 (lidar ratio measured), 16 (layer is opaque and the lidar ratio value unchanged), or 18 (layer is opaque and the lidar ratio value is reduced) are rejected, while in terms of random and systematic errors, aerosols with extinction uncertainty less than or equal to 99.99 km−1 are also rejected. Finally, the sequence of backscatter coefficient at 532 nm quality assurance controls accounts for large signal anomalies in cases of surface-attached aerosol layers; those reporting either a significant negative (less than −0.2 km−1) or large positive (higher than 2.0 km−1) extinction coefficient at 532 nm, within 60 m a.g.l., are removed. Overall, the quality filtering methods and control procedures (Table 1) are applied to counteract and reduce the impact of noise and of clouds misclassified as aerosols, systematic and random errors and artifacts, and retrieval issues, while at the same time affecting CALIPSO aerosol profiles by the smallest amount possible and maintaining a high-quality extended dataset suitable for study cases and longer-scale studies. Accordingly, the sequence of quality assurance procedures iterates through all CALIOP L2 cloud-free profiles to generate the fine-mode and coarse-mode pure-dust products along the CALIPSO orbit path.
2.1.2 ISS-CATS
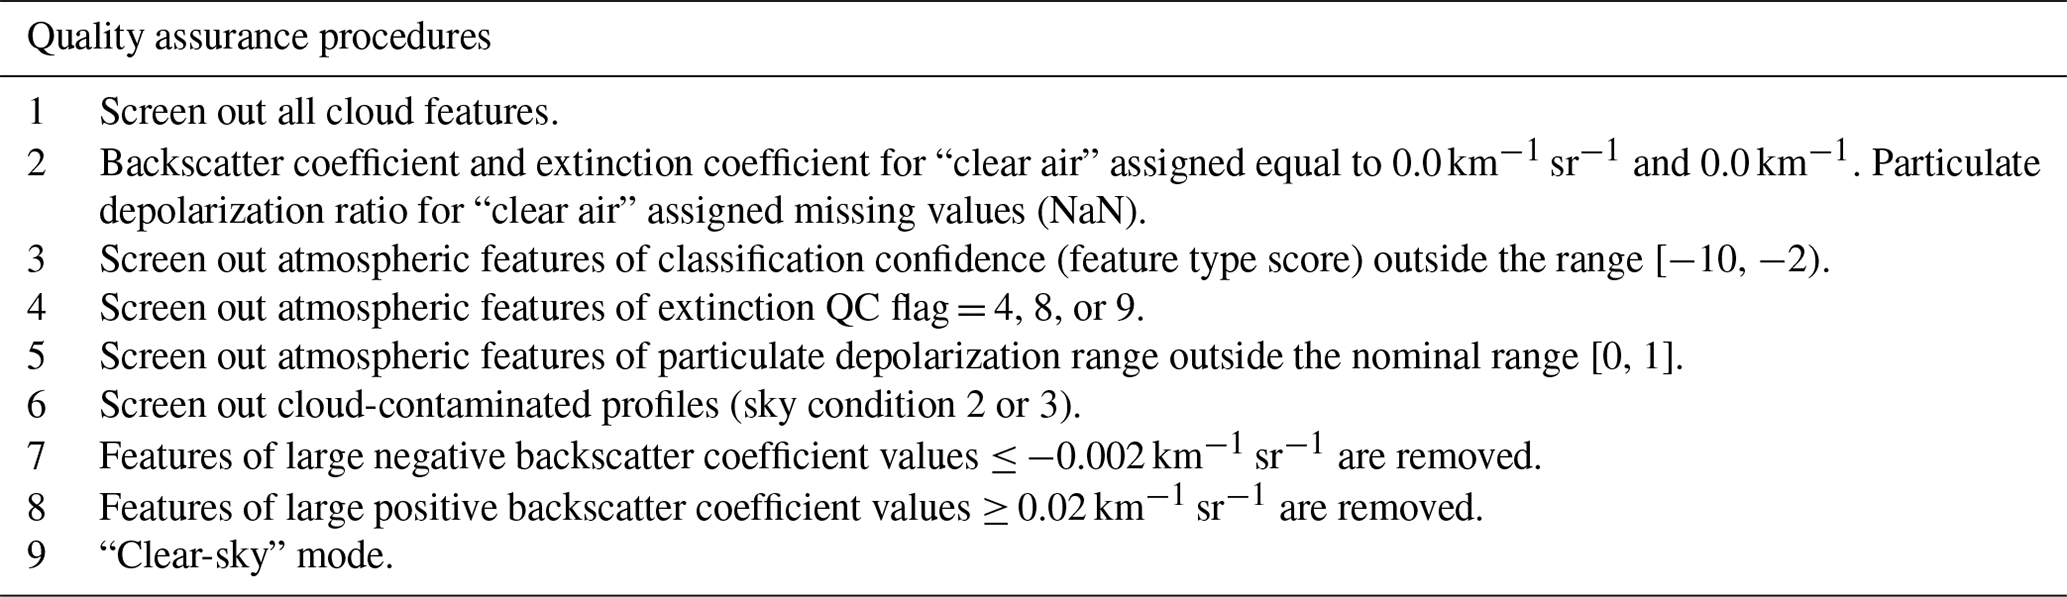
The Cloud–Aerosol Transport System (CATS) was a multiwavelength (355, 532, and 1064 nm) lidar system developed at NASA's Goddard Space Flight Center, operated as a scientific payload to the Japanese Experiment Module–Exposed Facility (JEM-EF) on the International Space Station (ISS). Due to technical issues, CATS operated primarily in Mode 2 (forward field of view – FFOV) to acquire near-real-time profile measurements of attenuated total backscatter and linear volume depolarization ratio at 1064 nm in the Earth's atmosphere (Yorks et al., 2016). CATS range-resolved observations of aerosol and cloud optical properties along the ISS orbit track extended between 10 February 2015 and 30 October 2017, when the system suffered an unrecoverable power failure. CATS products are provided at different levels of processing. McGill et al. (2015) and Yorks et al. (2016) provide a comprehensive overview of CATS instrument and scientific goals, while the CATS processing algorithms and validation of the L1 and L2 products are comprehensively provided by Yorks et al. (2016), Pauly et al. (2019), and Proestakis et al. (2019), as well as in the CATS Data Release Notes, Quality Statements, and Theoretical Basis Documentation (https://search.earthdata.nasa.gov/search?q=CATS, last access: 29 May 2024). In this study, we use CATS Version 3.01 (V3.01) L2 profiles of altitude-resolved backscatter coefficient and particulate depolarization ratio at 1064 nm, including the available quality assurance flags and atmospheric classification products (i.e., feature type, aerosol subtype, classification confidence), provided with vertical and horizontal resolution of 60 m and 5 km (along-track), respectively. Table 2 provides the procedures applied to generate quality-assured profiles of backscatter coefficient and particulate depolarization ratio at 1064 nm. In the framework of the study, CATS is utilized to demonstrate the performance of the methodology when applied to a satellite-based lidar system and to establish the performance of the fine-mode and coarse-mode pure-dust products in terms of mass concentration against highly collocated airborne remote sensing and in situ measurements conducted on 7 August 2015 (Sect. 3.2).
Table 2Quality control procedures and filtering applied to CATS data.
2.1.3 The AERONET product
The quality and validity of the methodology applied to the spaceborne retrievals for the decomposition of the total dust load to its size-related (i.e., fine and coarse) components are established by utilizing the AERONET optical products as a reference. Ground-based measurements suitable for the purposes of the current study are those derived via the Spectral Deconvolution Algorithm (SDA; O'Neill et al., 2001a, b, 2003), initially implemented by Eck et al. (1999). In principle, SDA utilizes sun-direct measurements of aerosol optical thickness (AOT) and the Ångström exponent, and it tries to reproduce, via an iterative process, the parameters of the lognormal aerosol-speciated size distribution which gives the best agreement between modeled and measured AOTs. The two primary SDA products are the fine and coarse AOT at 500 nm, which along with the Ångström exponent (expressing the spectral variation of AOT) have been processed to derive the corresponding AOTs at 532 nm (CALIOP–CALIPSO). In the SDA, the decomposition of total AOT to its fine and coarse counterparts is defined optically under the assumption of a bimodal aerosol particle size distribution (PSD) and the approximation of a neutral coarse-mode spectral variation. In our study, we analyze the level 2.0 data (quality-assured and cloud-screened) from the most updated version (Version 3; Giles et al., 2019; Sinyuk et al., 2020). Moreover, we use the AERONET data stored in the “all points” files, thus making feasible the optimum temporal collocation between ground-based and spaceborne retrievals. At each AERONET site we define a circle of 80 km radius and we average the CALIOP–CALIPSO vertical profiles of the extinction coefficient residing within the area. Then, the ground-based retrievals acquired within a time window of 60 min centered at the satellite overpass time are averaged in temporal terms. In the framework of the study, AERONET retrievals of fine-mode and coarse-mode AOTs converted at 532 nm are utilized to evaluate the CALIPSO-based fine-mode and coarse-mode dust optical depth (DOD) products at 532 nm (Sect. 3.1).
2.2 Methodology
The present work aims to decouple the fine-mode (particles with diameter less than 1 µm) and coarse-mode (particles with diameter greater than 1 µm) components of atmospheric pure dust, which is in turn is a component of the total aerosol mixture, at a near-global scale. The decoupling methodology follows the series of well-established polarization-based algorithms for decoupling the atmospheric pure-dust component from the total aerosol load, initially established by Shimizu et al. (2004) and accordingly expanded through the family of the POLIPHON algorithms. More specifically, the study is based on the one-step POLIPHON (Tesche et al., 2009) methodology for decoupling the pure-dust component from the total aerosol load (Shimizu et al., 2004) and accordingly on the conceptual approach of the two-step POLIPHON (Mamouri and Ansmann, 2014) for extracting the coarse-mode pure-dust component from the total aerosol load. Finally, in the framework of the present study, the submicrometer (fine-mode) component of pure dust is extracted as the residual between the total pure dust (one-step POLIPHON) and the supermicrometer (coarse-mode) component of pure dust (first step of the two-step POLIPHON). The retrieval scheme is applicable to single-wavelength lidar observations, as long as profiling of calibrated linear-polarization is included. The methodology is applied to CALIPSO backscatter coefficient and particulate depolarization ratio profiles at 532 nm (Sect. 2.1.1), with the overarching objective to provide the fine-mode and coarse-mode pure-dust atmospheric components at near-global scale for the temporal period extending between June 2006 and December 2021. Section 2.2.1 presents the decoupling methodology of the fine-mode and coarse-mode components of pure dust in terms of backscatter coefficient at 532 nm, extinction coefficient at 532 nm, and mass concentration, while Sect. 2.2.3 discusses the uncertainties of the established products.
2.2.1 Pure-dust, coarse-dust, and fine-dust backscatter coefficient profiles at 532 nm
The algorithm applied to decouple an external aerosol mixture of particles with distinct depolarizing properties (e.g., dust and non-dust, with δdust>δnon-dust), thoroughly discussed in Shimizu et al. (2004) and Tesche et al. (2009), starts from the equation for particle depolarization ratio δλ,p(z) (Eq. 1) and the consideration that the backscattered signal by an external aerosol mixture in a lidar system βλ,p(z) corresponds to the summation of the cross and parallel return signals from the different aerosol types (Eq. 2).
In Eq. (1) the parameters and (k = “d” for dust particles or “nd” for non-dust particles) correspond to the cross and parallel backscatter coefficient components, respectively, of the two aerosol subtypes with different depolarizing optical properties, given as functions of wavelength λ and height z. Based on Eqs. (1) and (2), and can be expressed as functions of the total particle backscatter coefficient βλ,k(z) and the corresponding particle depolarization δλ,k(z).
Through Eqs. (3) and (4) and considering βλ,nd(z) as in Eq. (1), the pure-dust backscatter coefficient component βλ,d(z) is expressed by Eq. (5).
In Eq. (5), under the special cases of and , we set and , respectively, accounting for the cases of negligible and dominant contribution of dust to the total aerosol mixture, respectively. However, for a proper implementation of Eq. (5) and to facilitate accurate quantification of the atmospheric pure-dust aerosol component, proper definition of the non-dust and dust light depolarization characteristics, thus of δnd and δd, is a prerequisite.
For dust δd, typical particle depolarization ratios of lofted dust-dominated aerosol layers, measured in the framework of field activities conducted in the proximity of the Sahara (Esselborn et al., 2009; Freudenthaler et al., 2009; Ansmann et al., 2011), Middle East (Mamouri et al., 2013; Filioglou et al., 2020), and Asian (Sugimoto et al., 2003; Hofer et al., 2017) dust sources, show similar values ranging between 29 % and 35 %. These findings agree with lidar measurements of the particle depolarization ratio of airborne dust, studied during mid-range and long-range transport across Europe (Wiegner et al., 2011; Baars et al., 2016), the North Atlantic Ocean (Groß et al., 2011a, 2015; Tesche et al., 2011; Veselovskii et al., 2016; Haarig et al., 2017b), and the Pacific Ocean (Sakai et al., 2003; Shimizu et al., 2004). The studies corroborate the assumption that desert dust is characterized by a particle depolarization ratio around 0.31 ± 0.04 at 532 nm, a characteristic property close to the emission sources of dust and following long-range atmospheric transport.
However, accurate implementation of the pure-dust decoupling methodology (Eq. 5) requires, in addition to dust depolarization features (δd), proper consideration of the depolarization features of the non-dust aerosol subtypes composing the aerosol mixture (δnd). Broader aerosol subtype categories include sea salt, biomass burning smoke, pollen, and volcanic ash. Regarding marine aerosol, the particle linear depolarization ratio increases from 2 % to 3 % at 532 nm for wet spherical sea salt particles in marine environments of high relative humidity to about 10 % to 15 % at 532 nm for dry cubic-like sea salt particles close to the marine boundary layer (MBL)–free troposphere (FT) entrainment zone (Haarig et al., 2017a). The presence of sea salt in the FT is considered negligible. Other aerosol subtypes frequently encountered in both the planetary boundary layer (PBL) and the FT include urban haze and biomass burning smoke, with depolarizing effects of 1 %–4 % at 532 nm (Müller et al., 2007b; Nicolae et al., 2013). However, it should be noted that recent outcomes provided by Veselovskii et al. (2022), based on a combination of fluorescence and Mie–Raman lidar observations, further reveal the high variability of the “pollen”, “urban”, and “smoke” aerosol subtype classes. More specifically, the authors report a depolarization ratios between 2 % and 10 % for smoke and between 1 % and 10 % for urban aerosol subtypes. The pollen aerosol category relates to depolarization ratio in the range of 4 %–6 % at 532 nm, although in extreme cases of significantly large particles (diameter ≥ 50 µm) this effect may reach significantly higher values (at 532 nm ∼ 15 % – Noh et al., 2013; ∼ 30 % at 532 nm – Veselovskii et al., 2022; ∼ 38 % – Bohlmann et al., 2021). The presence of pollen is usually confined within the PBL and manifests high seasonality, with higher values evident during spring and during atmospheric convection conditions. However, these values correspond to the upper and lower limits of the aerosol layer observations. Finally, a less frequently observed aerosol category is volcanic ash, with a depolarization ratio effect ranging between 30 % and 40 % at 532 nm, as reported by EARLINET observational activities in the case of Eyjafjallajökull in 2010 (Ansmann et al., 2010; Groß et al., 2012). Here, and based on the above discussion, for the non-dust aerosol subtype category δnd equal to 0.05 ± 0.02 at 532 nm is assumed (Tesche et al., 2009, Mamouri and Ansmann, 2014, 2016; Marinou et al., 2017; Proestakis et al., 2018).
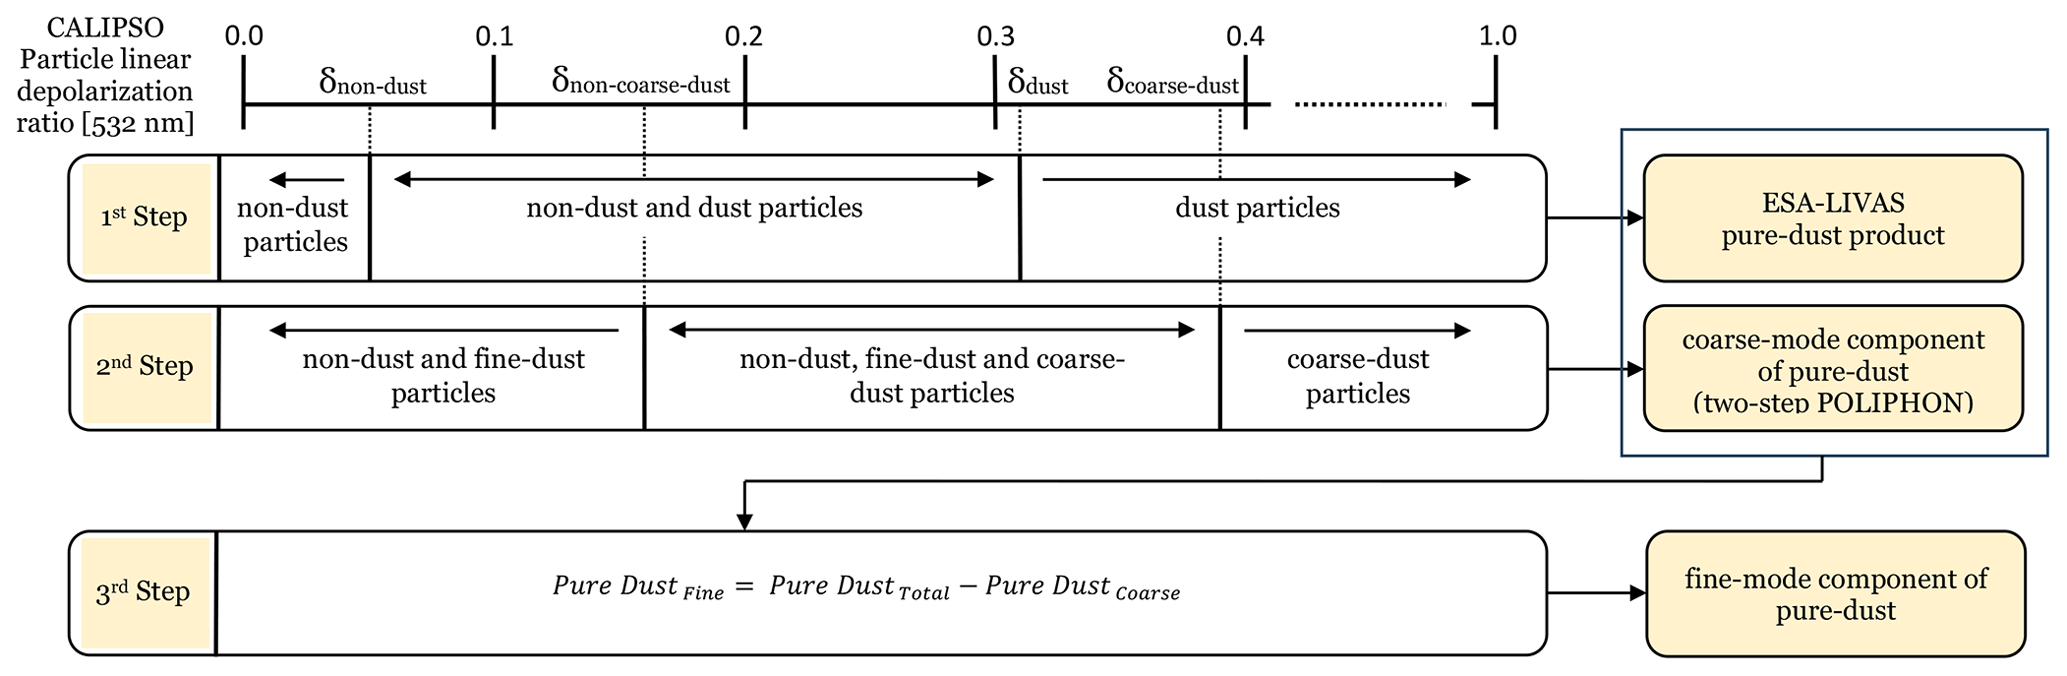
Figure 2Illustration of the conceptual approach applied for the derivation of the CALIPSO-based fine-mode and coarse-mode components of the total aerosol load at a near-global scale. Step 1 includes implementation of the CALIPSO-based ESA-LIVAS pure-dust global product. Step 2 provides the coarse-mode pure-dust atmospheric component through implementation of the first step of the two-step POLIPHON method. Step 3 provides the fine-mode pure-dust component as the residual between the ESA-LIVAS pure-dust product and the coarse-mode component of pure dust. Moreover, the figure reports δd, δnd, δcd, and δncd depolarization at 532 nm threshold values considered here, equal to 0.31, 0.05, 0.39, and 0.16, respectively.
To date, the pure-dust decoupling methodology (Shimizu et al., 2004; Tesche et al., 2009) has been applied to create a robust global pure-dust product, established in the framework of the ESA LIdar climatology of Vertical Aerosol Structure for space-based lidar simulation studies activity (LIVAS; Amiridis et al., 2015). The CALIPSO-based pure-dust product implements suitable geographically dependent extinction-to-backscatter ratios for dust aerosols, while its performance has been established against AERONET collocated measurements in the Saharan desert broader region (Amiridis et al., 2013). The ESA-LIVAS pure-dust product constitutes a cornerstone dataset of the present study (Fig. 2 – “1st step”).
As extensively and thoroughly discussed in Mamouri and Ansmann (2014, 2017), two successive POLIPHONs are required in order to extract the fine-mode and coarse-mode components of pure dust. The two-step POLIPHON technique assumes that the backscattered signal by an external aerosol mixture βλ,p(z) corresponds to the summation of the cross and parallel return signals from the non-dust, the fine-mode dust, and the coarse-mode dust aerosol components (Eq. 6).
In Eq. (6), βλ,ncd(z) and βλ,cd(z) correspond to the non-coarse-mode aerosol (i.e., non-dust and fine-mode dust) and the coarse-mode dust components of the total aerosol mixture, respectively. Accordingly, βλ,cd(z) is expressed by
For a proper implementation of Eq. (7), and towards the accurate determination of the atmospheric coarse-mode dust component, proper knowledge of the non-coarse-mode aerosol and coarse-mode dust light depolarization characteristics, thus of δncd and δcd, is required. In Eq. (7), under the special cases of and , we set and , respectively, accounting for the cases of negligible and dominant contribution of coarse-mode dust to the total aerosol mixture.
Sakai et al. (2010) performed extensive chamber laboratory experiments with the overarching objective of determining the dependence of the near-backscattering linear depolarization ratio of Saharan and Asian dust on particle size distribution. The authors reported on the significantly different polarization properties of the fine-mode and coarse-mode dust populations, with the submicrometer-dominated aerosol sample yielding depolarization ratios around 0.16 ± 0.03 at 532 nm and the supermicrometer-dominated aerosol sample resulting in depolarization ratios of 0.39 ± 0.04 at 532 nm. The laboratory findings of Sakai et al. (2010) were to an extent confirmed by size-segregated polarization measurements performed by Järvinen et al. (2016) for a large variety of desert dust samples of Asian, African, and American origin. The authors were able to inject well-constrained mono-modal dust populations into an aerosol laboratory chamber and, based on near-backscatter polarization measurements at 488 and 552 nm, reported the dependence of the dust linear depolarization ratio on dust size distribution. More specifically, Järvinen et al. (2016) experimentally showed the distinct linear depolarization effects of the submicrometer and supermicrometer dust modes, with depolarization ratios of the fine mode accumulating in the same region as reported by Sakai et al. (2010) and coarse mode no lower than 0.18 with a mean value of 0.27. Therefore, according to the published laboratory studies we assume mean linear depolarization effects of δncd and δcd equal to 0.16 ± 0.02 and 0.39 ± 0.03, respectively, at 532 nm (Fig. 2 – “2nd step”).
It should be noted that collecting samples of airborne dust for laboratory experiments is challenging. In recent years, efforts have been made to simulate dust optical properties, including the dependance of the particle linear depolarization ratio at 532 nm in the 180° backscatter direction on particle size, shape, and roughness (e.g., Gasteiger et al., 2011; Bi et al., 2018; Saito and Yang, 2021; Kong et al., 2022). However, these modeling studies are extremely complex, computationally expensive, and thus at present still limited, particularly with respect to the maximum particle size. It should be mentioned that the selection of δλ,ncd is one of the main assumptions and challenges of the present study, assumed equal to 0.16 ± 0.02 for two main reasons. The first one relates to Järvinen et al. (2016) and the laboratory chamber experiments with near-backscattering linear depolarization ratios of fine-mode dust, reporting that δfd greatly varies between 0.05 for dust particles of diameter around to 0.5 µm to values as high as 0.41 in the case of submicrometer particles with diameter close to 1 µm. The second one also conceptually follows the Järvinen et al. (2016) experimental measurements, reporting coarse-mode dust linear depolarization ratio values not lower than 0.18. In this case, implementation of δλ,ncd(z) equal to 0.16 is in closer agreement with the basic assumption that cases of should yield .
In the present study, and as a final step, the fine-mode component of pure dust is estimated as the residual between the ESA-LIVAS pure-dust product, extracted from the total aerosol load based on the pure-dust decoupling methodology (Shimizu et al., 2004; Tesche et al., 2009), and the coarse-mode component of pure dust, extracted from the total aerosol load based on the first step of the two-step POLIPHON (Mamouri and Ansmann, 2014, 2017) (Eq. 8), with both algorithm branches applied to CALIOP optical products (Sect. 2.1.1, Fig. 2 – “3rd step”).
It should be noted that the size of mineral dust particles suspended into the atmosphere spans more than 3 orders of magnitude, from less than 0.1 µm to more than 100 µm in diameter (Mahowald et al., 2014; Ryder et al., 2019). This extended range of airborne dust size distribution is closely related to widespread inconsistencies in the terminology of dust size classes. The general consensus is that the size classification has to follow the broad modes apparent in the aerosol size distribution, defining a fine-mode and a coarse-mode component (Seinfeld and Pandis, 2006; Whitby, 1978). However, significant inconsistencies are observed in the definition of the boundary diameter separating the two modes. To date, studies have applied a boundary separating diameter of 1 µm (Mahowald et al., 2014; Mamouri and Ansmann, 2014, 2017; Ansmann et al., 2017), 2 µm (Spurny, 1998; Whitby, 1978; Willeke and Whitby, 1975), 2.5 µm (Seinfeld and Pandis, 2006; Zhang et al., 2013; Pérez García-Pando et al., 2016), 4 µm (Rajot et al., 2008), and even 5 µm (Kok et al., 2017; Adebiyi and Kok, 2020). To this end, Adebiyi et al. (2023) reviewed related dust size distribution studies and proposed a uniform classification for atmospheric dust particles, including the fine, coarse, super-coarse, and giant (sand-sized) dust classes, with dust separation boundary geometric diameters of 2.5, 10, and 62.5 µm, respectively. However, the definition of the fine-mode class as submicrometer (including the Aitken and accumulation modes) and the coarse-mode class as supermicrometer (including the coarse, super-coarse, and giant dust subclasses of Adebiyi et al., 2023), corresponding to a boundary diameter separating the two modes of 1 µm, is related to and enforced by the experimental techniques, outcomes, and parameterizations of the Sakai et al. (2010) and Järvinen et al. (2016) laboratory experiments, and thus the parameterization and methodology cannot be adapted to separate the dust size distribution into classes of different boundary diameters between the two modes.
Mamouri and Ansmann (2014) used AERONET observations and the HYSPLIT transport and dispersion model to determine a lower-boundary δλ,ncd(z) equal to 0.12 that would yield more accurate two-step POLIPHON separation of the fine-mode and coarse-mode dust components for an intense event of Middle East dust advection over Limassol, Cyprus, on 28 September 2011. In addition, the high quality of the two-step POLIPHON technique, when multi-wavelength lidar polarization measurements are applied, has been demonstrated in the case of a 3 km deep Saharan dust layer over Barbados, observed in the framework of the Saharan Aerosol Long Range Transport and Aerosol–Cloud Interaction Experiment (SALTRACE; Weinzierl et al., 2016) on 20 June 2014 (Mamouri and Ansmann, 2017). However, application of the discussed methodology to CALIPSO optical products with the objective of decoupling the fine-mode and coarse-mode pure-dust atmospheric components on a near-global scale would require additional considerations, since the CALIOP configuration provides neither dual-wavelength polarization lidar profiling of the atmosphere nor concurrent sun-photometer observations. More specifically, consideration of AERONET AOTf, AOTc, and FMF with the objectives of constraining the decoupling approach through assumptions on δλ,ncd(z), the lidar ratio, or the percentages of the fine and coarse mode in the total aerosol load on a near-global scale would result in uncertainties related to (1) the comparison of fine-mode dust optical depth with AOTf, an AERONET product including non-dust fine-mode aerosol subtypes (e.g., biomass burning and urban haze); (2) the comparison of coarse-mode dust optical depth with AOTc, an AERONET product including non-dust coarse-mode aerosol subtypes (e.g., marine, pollen, volcanic ash); and (3) the fact that AERONET retrievals constrain the particle size to less than 30 µm diameter (Dubovik and King, 2000; Dubovik et al., 2000), thus missing the super-coarse and giant modes. Moreover, such implementation of AERONET would require extended assumptions further increasing the induced uncertainties (e.g., CALIPSO–AERONET collocation criteria, atmospheric homogeneity and topographical characteristics, different SNR between daytime and nighttime illumination conditions, AERONET geographical coverage, nighttime observations).
In the ESA-LIVAS pure-dust climate data record uncertainties resulting from the impact of the non-dust aerosol components on the total aerosol load (e.g., δλ,ncd(z)) are counter-balanced through the CALIPSO algorithm of classifying detected atmospheric aerosol features. More specifically, CALIOP's V4 L2 tropospheric aerosol subtype classification algorithm uses an approximate particle depolarization ratio , 532 nm integrated attenuated backscatter, layer top Ztop, layer base Zbase, and information on the underlining Earth surface type and location to differentiate seven tropospheric aerosol subtypes (Omar et al., 2009; Kim et al., 2018). While CALIOP's tropospheric aerosol subtype classification may lead to distinction ambiguities, especially in cases of aerosol mixtures (Burton et al., 2013), the use of the aerosol intensive property provides reliable information about the presence or absence of dust in identified atmospheric features (Liu et al., 2012). Thus, following the approach established in the framework of the ESA-LIVAS pure-dust product (Amiridis et al., 2013, 2015), the fine-mode and coarse-mode dust separation technique is applied only to the dust, polluted dust, and dusty marine aerosol subtypes, while the marine, polluted continental/smoke, clean continental, and elevated smoke atmospheric layers are neglected.
Finally, it must be mentioned that for decoupling the pure-dust component from the total aerosol mixture, the developed methodology assumes the dust, polluted dust, and dusty marine classified atmospheric layers to be external mixtures of dust and non-dust aerosol components. The external aerosol mixture assumption does not account for coating effects, possibly altering the polarization properties of the observed aerosol subtypes, resulting in misclassification and further uncertainties. However, recent laboratory chamber experiments provide evidence that dust depolarization optical properties may not be significantly influenced by a thin coating of sulfuric acid, secondary organics, humidity, or aging processes (Järvinen et al., 2016). This is of particular importance for the separation of fine-mode and coarse-mode dust on a global scale, as it suggests that the lower polarization properties of dust layers at large distances downstream from the emission sources likely relate to gravitational settling of larger dust particles along the path and not to alterations of the polarization characteristics of dust.
Table 3Overview of pure-dust lidar-based LR values (sr) classified under specific geographical regions of interest (Fig. 3).
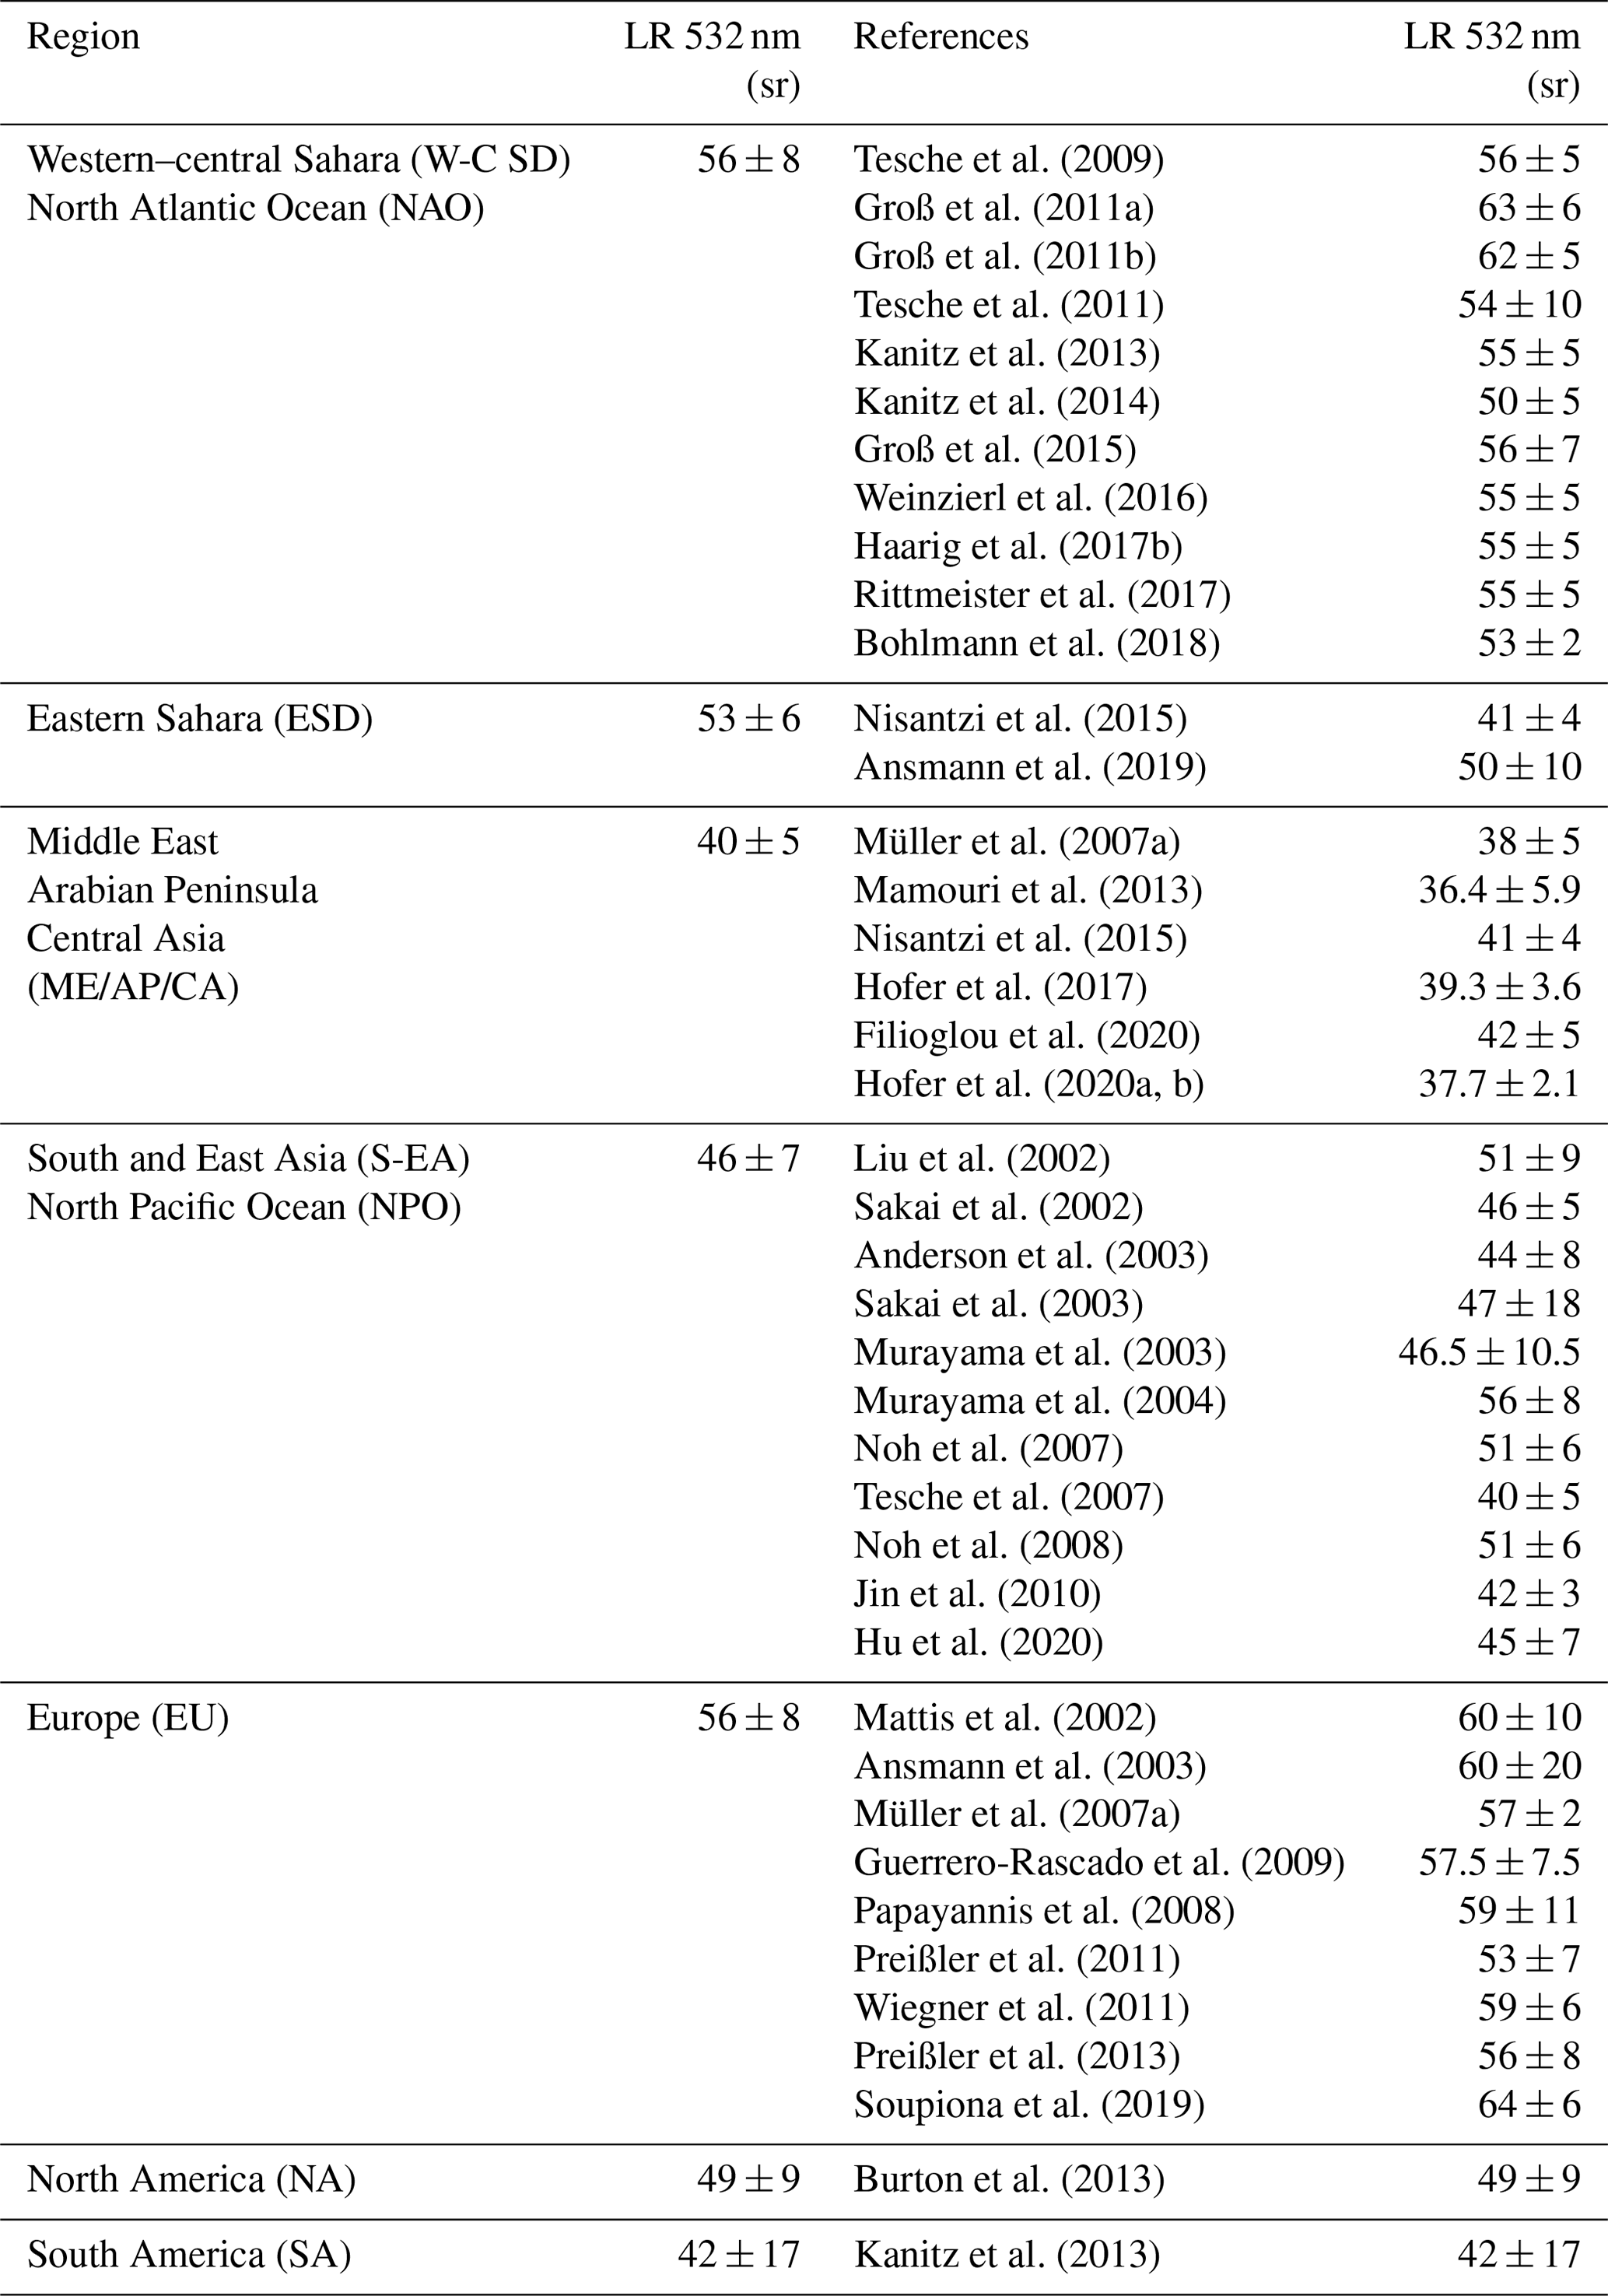
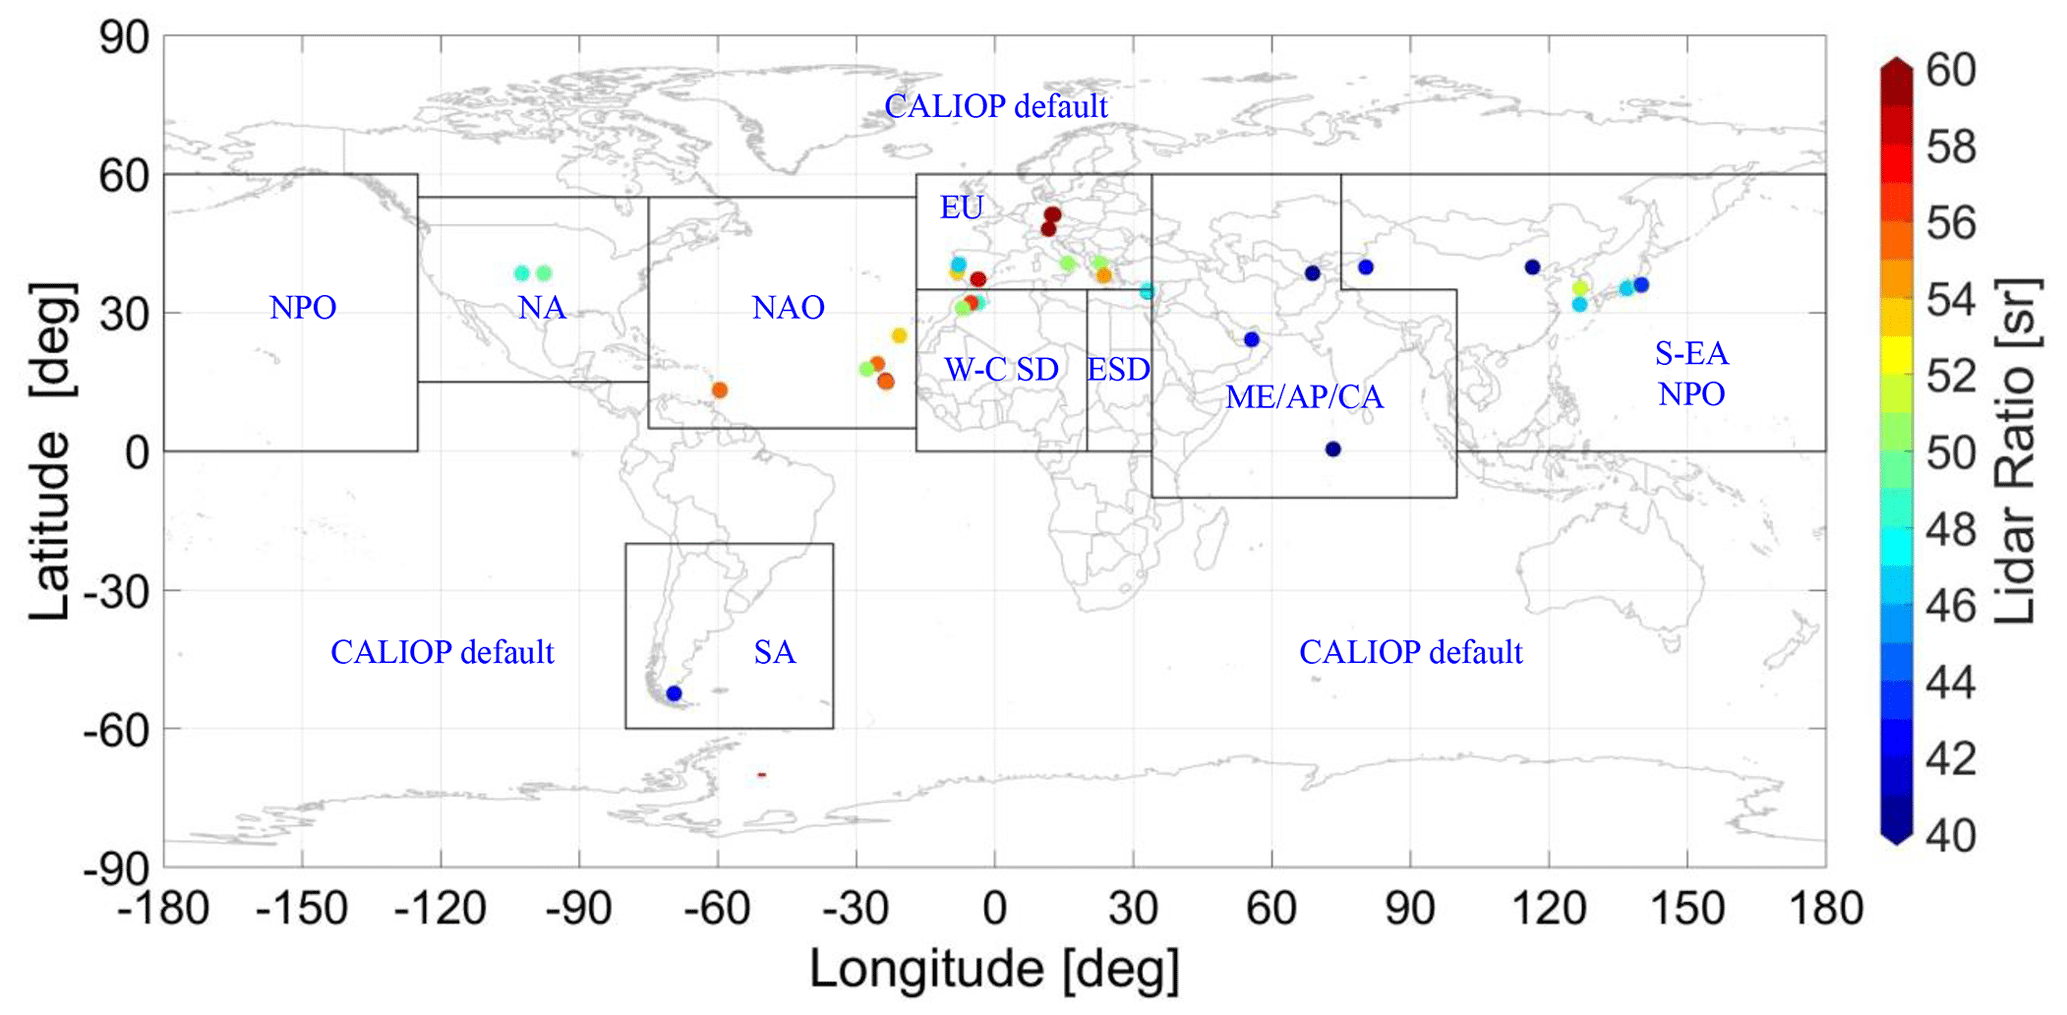
Figure 3Illustration of the regional classification of pure-dust LR values applied in the present study. Domain abbreviations are provided in Table 3.
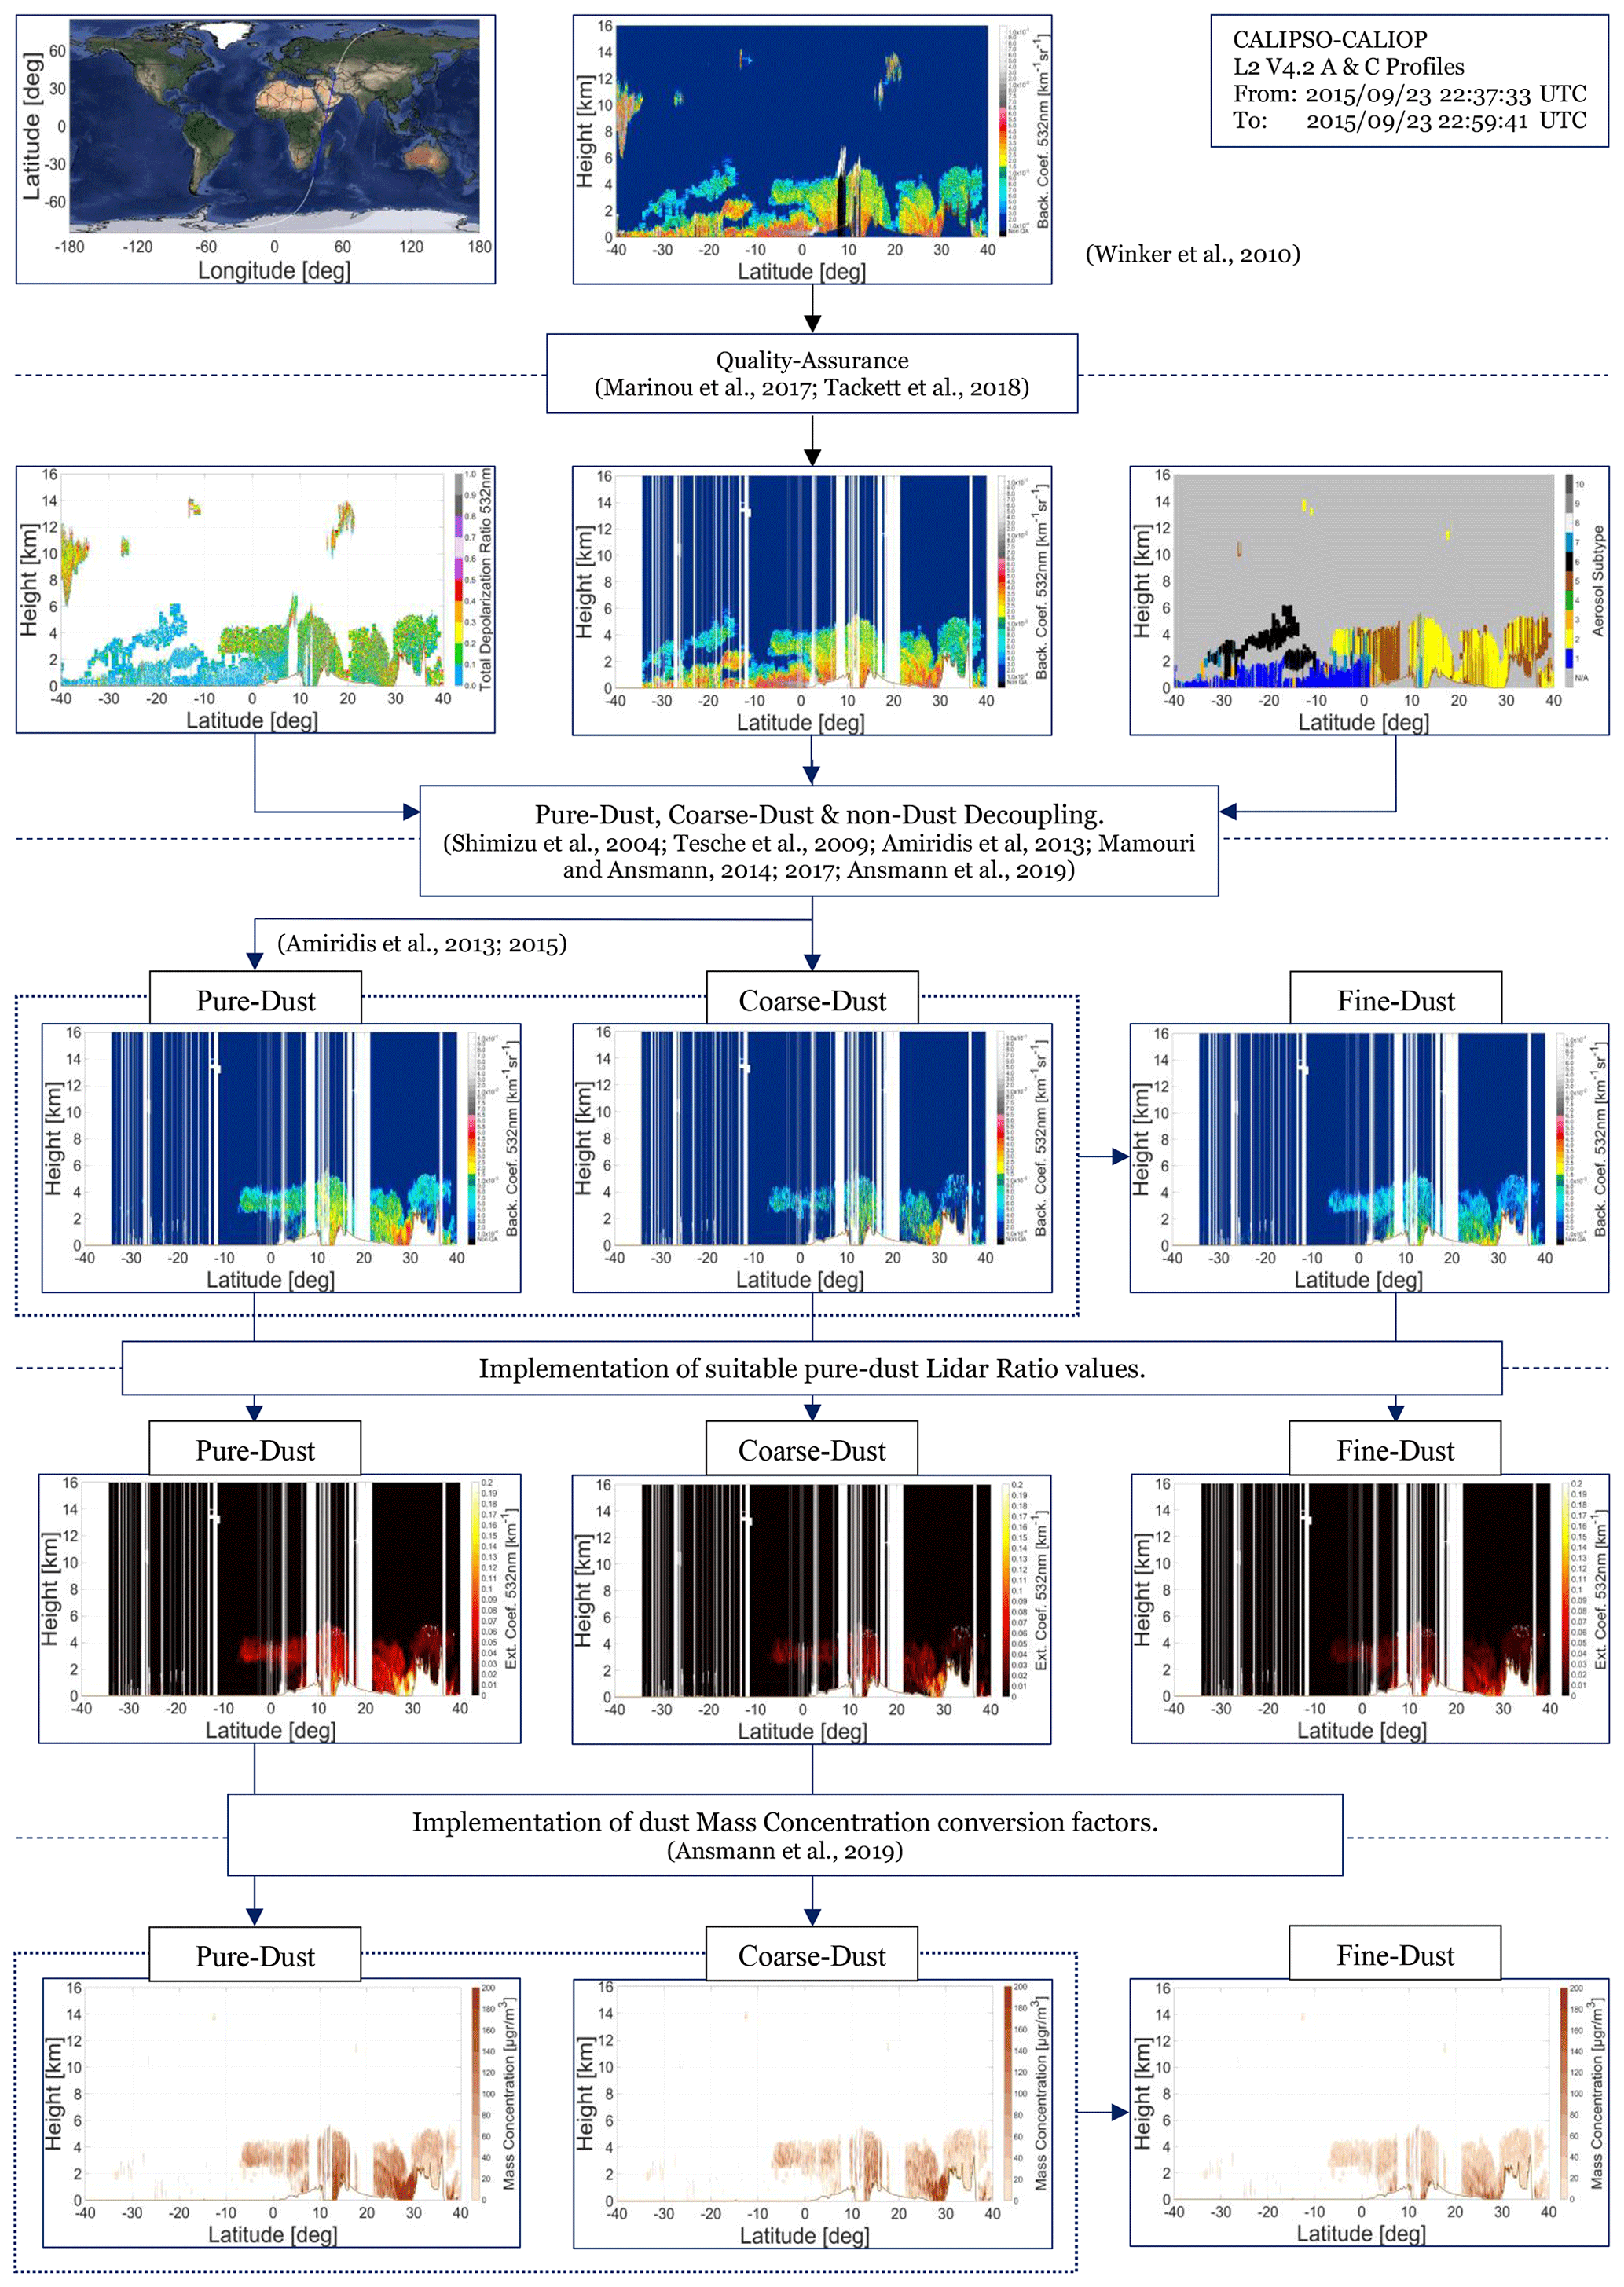
Figure 4Illustration of the methodology for quality assurance of the backscatter coefficient at 532 nm, extinction coefficient at 532 nm, mass concentration separation and conversion steps of the fine-mode and coarse-mode components of atmospheric pure dust, and the components of the total aerosol load for an indicative CALIPSO Middle East overpass case on 23 September 2015. Layer background: © Google Maps.
The basic outcomes of our approach – to this point – include CALIOP-based profiles of the backscatter coefficient at 532 nm of fine-mode pure-dust (βλ,fd(z)), coarse-mode pure-dust (βλ,cd(z)), and total pure-dust (βλ,d(z)) components of the total aerosol load along the CALIPSO orbit path at uniform 5 km horizontal and 60 m vertical resolution (Fig. 4). To convert the obtained total, fine-mode, and coarse-mode dust backscatter coefficient profiles into respective extinction coefficient profiles, characteristic values of the total, fine-mode, and coarse-mode pure-dust lidar ratio (LR) at 532 nm are implemented (Eq. 9a–c). In the absence of extended observational and laboratory studies on the dependence of pure-dust extinction-to-backscatter ratios on the dust size distribution, we follow one of the basic assumptions of the two-step POLIPHON, that of equal LRs for total, fine-mode, and coarse-mode pure-dust LRs (Mamouri and Ansmann, 2014, 2017). Regionally characteristic pure-dust LRs at 532 nm are taken from the literature, following the ESA-LIVAS regional classification (Amiridis et al., 2013, 2015; Marinou et al., 2017; Proestakis et al., 2018), in order to facilitate implementation of the fine-coarse mode decoupling methodology (Fig. 2) without introducing ambiguities (Table 3; Fig. 3). We should note though that according to performed modeling studies (Gasteiger et al., 2011; Kemppinen et al., 2015a, b), such an assumption of equal LRs for total, fine-mode, and coarse-mode pure-dust LRs (Mamouri and Ansmann, 2014, 2017) may result in fine-mode and coarse-mode extinction coefficient as well as DOD underestimation and overestimation, respectively. Moreover, it must be mentioned that the selected approach of applying regionally dependent pure-dust LRs (Amiridis et al., 2013, 2015; Marinou et al., 2017; Proestakis et al., 2018) and not a universal pure-dust LR value is expected to reduce biases in regional studies but at the expense of introduced uncertainties due to long-range transport of dust and discontinuities in the region borders (Kim et al., 2018).
In Eq. (9a–c), βλ,d(z), βλ,fd(z), and βλ,cd(z) correspond to the total, fine-mode, and coarse-mode pure-dust backscatter coefficient at 532 nm, LRλ,d(z) is the pure-dust lidar ratio at 532 nm (Table 3), and aλ,d(z), aλ,fd(z), and aλ,cd(z) correspond to the total, fine-mode, and coarse-mode pure-dust extinction coefficient at 532 nm.
Table 4Conversion factors for the geographically dependent extinction coefficient at 532 nm to volume concentration for total (cv,d) and coarse-mode (cv,cd) pure dust (in 10−12 Mm) used in the present study, as established and provided by Ansmann et al. (2019) based on long-term AERONET observations and retrievals of dust optical and microphysical properties.
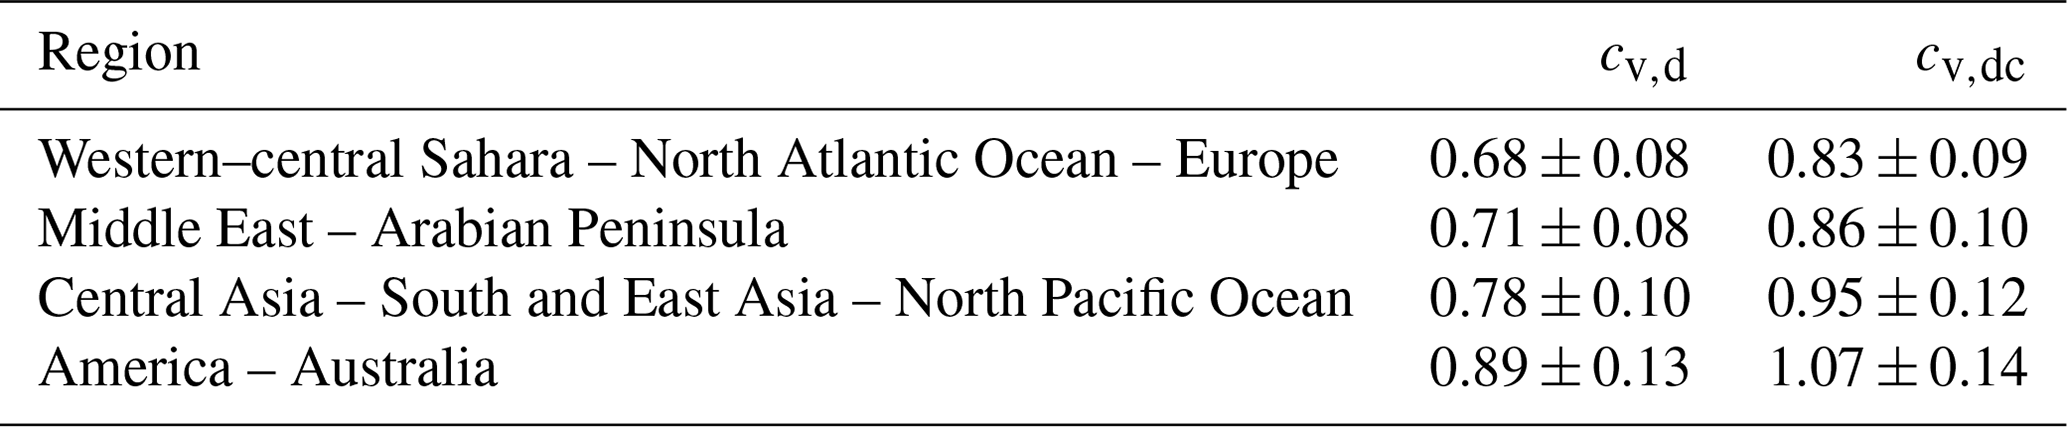
Through the implementation of suitable geographically dependent pure-dust LR values, the CALIOP-based profiles of the backscatter coefficient at 532 nm of fine-mode pure dust (βλ,fd(z)), coarse-mode pure dust (β(z)), and total pure dust (βλ,d(z)) are converted to profiles of the extinction coefficient at 532 nm of fine-mode pure dust (aλ,fd(z)), coarse-mode pure dust (a(z)), and total pure dust (aλ,d(z)) along the CALIPSO orbit path at uniform 5 km horizontal and 60 m vertical resolution (Fig. 4). To convert the obtained total and coarse-mode extinction coefficient profiles into respective mass concentration (MC) profiles characteristic total (cv,d) and coarse-mode (cv,cd) volume concentration conversion factors at 532 nm (Ansmann et al., 2019) are implemented (Eq. 10a, b). More specifically, Ansmann et al. (2019) explored dust optical and microphysical properties based on long-term AERONET observations and retrievals and established a near-global set of climatologically representative extinction-to-volume conversion factors (Table 4). Here we utilize the Ansmann et al. (2019) total (cv,d) and coarse-mode (cv,cd) volume concentration conversion factors at 532 nm and typical pure-dust particle density (ρd) of 2.6 g cm−3 (Ansmann et al., 2012) to obtain the total and coarse-mode pure-dust mass concentration profiles along the CALIPSO orbit path. Accordingly, in the framework of the present study, the fine-mode pure-dust mass concentration profiles are extracted as the residual between the total pure-dust mass concentration profiles and the coarse-mode pure-dust mass concentration profiles (Eq. 10c) (Fig. 4).
2.2.2 Total, fine-mode, and coarse-mode pure-dust product uncertainties: backscatter coefficient 532 nm, extinction coefficient 532 nm, and mass concentration
Uncertainties in the retrieval of fine-mode and coarse-mode pure-dust products, in terms of the backscatter coefficient, extinction coefficient, and mass concentration, are attributed mainly to three sources: (a) uncertainties in the CALIPSO L2 optical products (i.e., of backscatter coefficient and particulate depolarization ratio at 532 nm, the feature type, aerosol subtype classification), (b) uncertainties in the total, coarse-mode, and fine-mode pure-dust decoupling methodology (i.e., of characteristic particulate depolarization ratio of pure dust δd, coarse dust δcd, non-dust δnd aerosol categories), and (c) uncertainties in the assumption of constants, conversion factors, and constraints (i.e., of LR, extinction-to-mass-concentration conversion factors).
The uncertainties in the CALIPSO L2 backscatter coefficient, extinction coefficient, and aerosol optical depth (AOD) are calculated in the Selective Iterated Boundary Locator (SIBYL), scene classification algorithms (SCAs), and hybrid extinction retrieval algorithms (HERAs) (Vaughan et al., 2009; Winker et al., 2009) based on the assumption that the uncertainties are random, uncorrelated, and produced no biases. In QA atmospheric layers (Sect. 2.1.1) classified as dust, polluted dust, or dusty marine, CALIPSO L2 V4 uncertainties in the backscatter coefficient at 532 nm are typically of the same order of magnitude, while the corresponding uncertainties in the particulate depolarization ratio are typically > 100 %. Additional uncertainties arise from the assumptions in CALIOP aerosol subtype algorithm (Omar et al., 2009; Kim et al., 2018) and the deficiency of CALIOP in detecting tenuous aerosol layers (Kacenelenbogen et al., 2011; Rogers et al., 2014). Burton et al. (2013), based on NASA B200 HSRL-1 and CALIOP coincident measurements, reported on the high performance of the CALIPSO V3 aerosol classification algorithm in the case of dust mixtures (∼ 80 %). The agreement is not as good in the case of polluted dust (∼ 35 %). Despite the improvements made in CALIPSO V4 (Kim et al., 2018), erroneous classification of dusty atmospheric aerosol features results in layers not processed in the pure-dust, fine-mode, and coarse-mode decoupling chain (Sect. 2.2.1). Moreover, CALIOP deficiency in detecting tenuous aerosol layers results in nighttime and daytime negative biases of ∼ 0.02 and < 0.1, respectively, in terms of AOD, attributed mainly to CALIOP minimum detection nighttime and daytime thresholds of 0.012 and 0.067 km−1, respectively (Toth et al., 2018). Overall, assumptions on the aerosol subtype algorithm may result in both positive and negative biases, while undetected tenuous layers result in negative biases.
The overall uncertainties induced from the application of pure-dust decoupling algorithms are extensively discussed by Shimizu et al. (2004), Tesche et al. (2009, 2011), Mamouri and Ansmann (2014, 2017), and Ansmann et al. (2019). Moreover, Amiridis et al. (2013) and Marinou et al. (2017) carried out a detailed analysis of the uncertainties in the framework of the EARLINET-optimized CALIPSO-based pure-dust product. The uncertainties induced from the pure-dust depolarization-based separation method range between 5 %–10 % in strong dust events and 20 %–30 % in less pronounced dust layers (Tesche et al., 2009, 2011; Ansmann et al., 2012; Mamouri et al., 2013). The corresponding uncertainties are mainly attributed to the assumed characteristic particulate depolarization ratio values of pure dust δd, coarse dust δcd, and non-dust δnd aerosol categories, with standard deviations considered to be the basic source of information in the uncertainty analysis (Mamouri and Ansmann, 2017), as in the present study. Moreover, extensive assessment of the effect of the variations of the fine-mode pure-dust depolarization ratio implemented in the two-step POLIPHON approach is provided by Mamouri and Ansmann (2014, 2017), considering a value of 0.12 to be the optimal selection. Performed simulations and sensitivity studies demonstrated the relatively low effect of the corresponding variations of from 0.08 to 0.16, with relative errors induced in the fine-mode and coarse-mode pure-dust products of the order of 10 %. The estimated uncertainties are in agreement with Marinou et al. (2017), reporting uncertainties in the EARLINET-optimized CALIPSO dust product as high as 8 %, increasing at downwind areas and distant areas from the major dust sources, attributed to the effect of pure-dust and non-dust depolarization ratio parameters.
Additional relative uncertainties of the order of 15 %–25 % arise in the successive conversion of the decoupled backscatter coefficient profiles of pure dust (total, fine mode, and coarse mode) to corresponding extinction coefficient profiles (Eq. 9a–c) by applying suitable geographically dependent dust lidar ratios (Tesche et al., 2009; Amiridis et al., 2013; Mamouri and Ansmann, 2014, 2017; Marinou et al., 2017). It must be noted that although modeling simulation studies report different LR values for fine-mode and coarse-mode dust (Gasteiger et al., 2011), in the absence of extended pure-dust laboratory LR experiments, similar LRs for the total, coarse-mode, and fine-mode pure-dust components are assumed (Mamouri and Ansmann, 2014, 2017). Finally, additional relative uncertainties of the order of 10 %–15 % arise in the successive conversion of extinction coefficient profiles of pure dust (total, fine mode, and coarse mode) to corresponding mass concentration profiles (Table 4: Eq. 10a–c) based on appropriate mass concentration conversion factors provided and discussed by Ansmann et al. (2019).
Overall, through the successive steps in the computation of fine-mode and coarse-mode pure-dust products, starting from the backscatter coefficient profiles and moving to extinction coefficient profiles and eventually to mass concentrations profiles, the relative uncertainties increase at each intermediate step due to the corresponding uncertainties that must be considered. The pure-dust decoupling uncertainties reported in the literature, in the case of ground-based Raman and polarization lidar studies for moderate and high dust concentrations, range between 10 % and 30 % in terms of backscatter coefficient, between 15 % and 50 % in terms of extinction coefficient, and between 20 % and 60 % in terms of mass concentration (Mamouri and Ansmann, 2017; Ansmann et al., 2019). However, in the case of the CALIPSO-based pure-dust products (total, coarse mode, fine mode) the driving factors in the uncertainties are the CALIPSO L2 backscatter coefficient and particulate depolarization ratio uncertainties, typically of the same order of magnitude as the corresponding optical products, resulting in overall uncertainties extending between 100 % and 150 % (Marinou et al., 2017; Proestakis et al., 2018).
3.1 Coarse-dust and fine-dust optical depth product comparison with AERONET observations
This section aims to evaluate the CALIPSO-based DODcoarse and DODfine at 532 nm products through the extensive implementation of AERONET AOTcoarse and AOTfine retrievals at 532 nm, taking into consideration the unique characteristics of CALIOP and sun-photometer measurements and products, the quality assurance criteria, and the synchronization and collocation requirements. More specifically, CALIOP L2 reports aerosol and cloud measurements and products in near-vertical “sheets” of near-zero swath (∼ 100 m footprint) on the Earth's surface along the CALIPSO orbit track with 5 km horizontal resolution. On the contrary, AERONET instruments are characterized by an approximately 1.2° full-angle field of view, resulting in columnar pencil-like multiwavelength measurements of aerosol optical thickness between the solar disc and the sun–sky photometers (Holben et al., 1998; Omar et al., 2009). Consequently, given the natural atmospheric inhomogeneity of the aerosol fields in both time and space, CALIOP and AERONET rarely probe the same air volumes of the atmosphere. Hence, to extensively compare CALIOP and AERONET columnar observations, implementation of a set of constraints and criteria is a prerequisite to ensure a robust comparison and thus to establish the quality of the CALIPSO-based DODcoarse and DODfine at 532 nm products against AERONET AOTcoarse and AOTfine retrievals at 532 nm.
One of the major factors driving comparison discrepancies in the correlative observational dataset relates to the high spatial and temporal inhomogeneity of the aerosol fields. In this study, we adopt the CALIPSO–AERONET collocation criteria established in satellite-based lidar studies, though the collocation criteria vary from study to study depending on the scope and requirements (Amiridis et al., 2013; Anderson et al., 2003; Omar et al., 2013; Pappalardo et al., 2010; Proestakis et al., 2019; Schuster et al., 2012). The spatial and temporal collocation criteria applied in the framework of the present study require CALIPSO maximum overpass distance less than 80 km from the AERONET site and AERONET AOD acquisition measurements within ±60 min of the CALIPSO overpass. The selection of the spatial matching distance of CALIPSO L2 profiles within an 80 km radius of the AERONET sites is justified in terms of the CALIPSO feature detection algorithms. The CALIOP L2 Selective Iterated BoundarY Locator (SIBYL) processing module detects atmospheric features with L1 profile horizontal averaging of 5, 20, and 80 km along the CALIPSO orbit track (Vaughan et al., 2009). Thus, the maximum 80 km along-track averaging resolution in the detection of atmospheric layers performed by SIBYL prohibits observations of the same atmospheric air masses by CALIOP and AERONET photometers, even in cases of the CALIPSO orbit track directly over the AERONET stations (Schuster et al., 2012). Consideration of CALIPSO distance closer than 80 km, although reported to result in slight improvement in CALIOP–AERONET absolute biases, would be performed at the expense of larger errors due to reduction of the sample size of synchronized measurements. Accordingly, the temporal collocation criterion between CALIOP and AERONET observations of 60 min (Δt ≤ 60 min) is justified in terms of the mesoscale natural variability of aerosol in the lower troposphere (Anderson et al., 2003; Pappalardo et al., 2010).
CALIPSO AODs at 532 nm are computed as vertical integration of the mean CALIOP extinction coefficient at 532 nm profile with respect to height between TOA and the elevation height of AERONET sun photometers, thus not considering atmospheric aerosol fields possibly accumulating below the AERONET sites (Amiridis et al., 2013; Schuster et al., 2012). Regarding the negative effects of clouds in the comparison cases, the use of CALIOP L2 profiles of cloud optical depth equal to zero (0) and atmospheric features of CAD score lower than −20 ensures the lowest possible contamination of CALIPSO AODs by cloud features. It must be noted that the CALIPSO–AERONET overpasses may result in non-representative CALIPSO AODs in cases of extensive presence of clouds due to reduction of the considered CALIPSO L2 profiles over the area (Sect. 2.1.1). To minimize the negative impact of clouds in the analysis, cases with extensive presence of clouds detected in CALIPSO L2 measurements are not considered in the comparison by applying a lower acceptable threshold of at least eight CALIPSO L2 5 km cloud-free profiles (∼ 80 km) within the 80 km distance from the AERONET stations. Accordingly, at least two AERONET L2 AOD measurements are required to have been performed in the CALIPSO overpass ±60 min temporal window for accepting an AERONET case.
The evaluation of the CALIPSO-based DODcoarse and DODfine products against AERONET AOTcoarse and AOTfine products should be performed in cases characterized by dust presence. The AERONET Ångström exponent (AE) cannot be used because the implementation of low AE to establish correlative CALIPSO–AERONET cases dominated by larger particles would drive the comparison towards excluding from the analysis submicrometer-dominated pure-dust cases. The CALIPSO aerosol subtype cannot be used either as an appropriate dust identifier, since it provides only qualitative information on the presence of dust. More specifically, implementation of CALIPSO aerosol subtyping as a proxy for high dust presence would result in underestimations of CALIPSO DODcoarse (DODfine) extracted from layers classified as dusty marine (polluted dust) upon comparison against AERONET AOTcoarse (AOTfine), since the retrievals would be based on columnar measurements of both dust and marine (smoke) aerosols. Finally, the CALIOP particulate depolarization ratio at 532 nm cannot be used as a proxy for the identification of dust cases, since this optical parameter is implemented in the process of extracting the CALIPSO-based fine-mode and coarse-mode pure-dust components, and thus the parameter does not constitute an independent identifier. Thus, to facilitate the evaluation of the CALIPSO-based DODcoarse and DODfine with AERONET AOTcoarse and AOTfine, only for cases of dust presence in the atmosphere, we implement the pure-dust product developed in the framework of the ESA-LIVAS activity (Amiridis et al., 2013, 2015) under the quantitative assumption that at least 50 % of the observed AERONET AOT is related to the presence of dust, as provided by the LIVAS DOD at 532 nm product ( ≤ 50 %). Finally, the comparison between the CALIPSO-based DODcoarse and DODfine at 532 nm products and AERONET AOTcoarse and AOTfine at 532 nm retrievals is performed only for the cases of both CALIPSO AOD at 532 nm and AERONET AOT at 532 nm at least equal to 0.01.
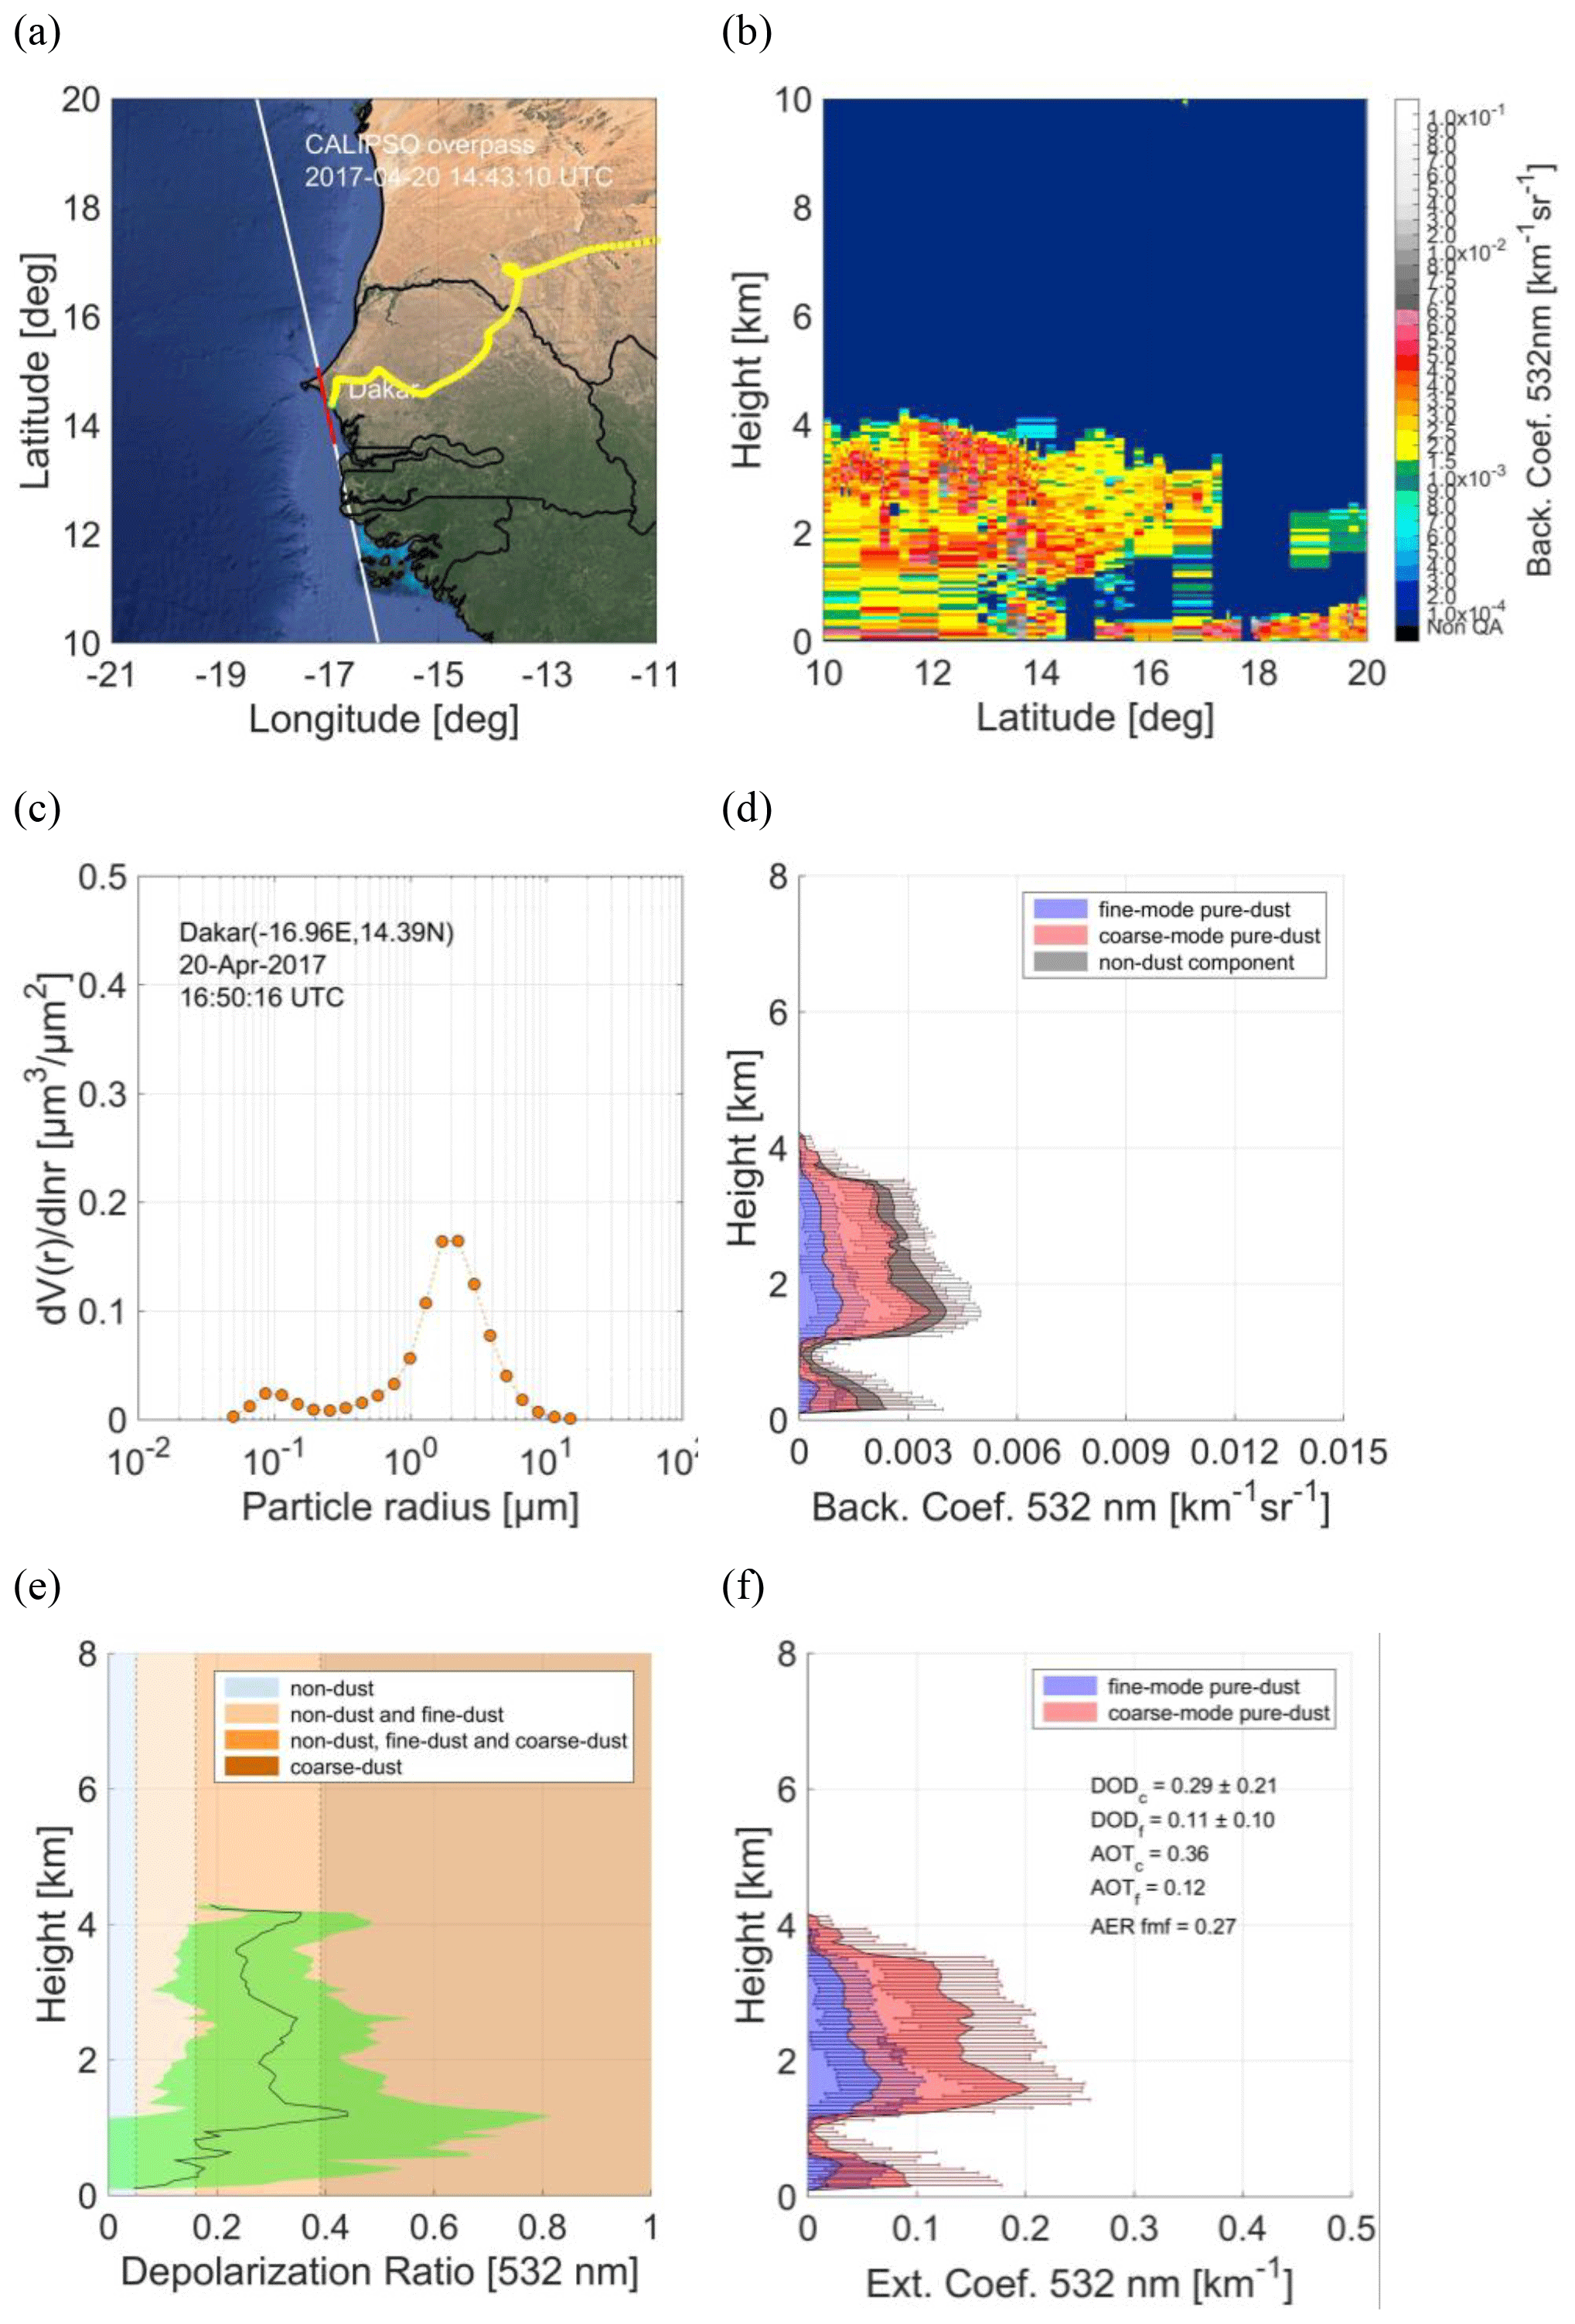
Figure 5Major Saharan dust outbreak moving westwards over Dakar on 20 April 2017 at ∼ 14:43 UTC, including the CALIPSO overpass in proximity to the AERONET Dakar station (red line) and FLEXPART 6 d back trajectories at 2 km in the area of interest (lat: 14.39°, long: −16.95°) denoting the Saharan desert origin of the advected air masses (yellow line) (a). CALIPSO L2 5 km backscatter coefficient at 532 nm cross-section (b). Column-integrated particle volume concentration as a function of particle radius observed with the AERONET sun photometer over Dakar, Senegal (c). Backscatter coefficient at 532 nm profiles of the coarse-mode pure-dust (red shaded area), fine-mode pure-dust (blue shaded area), and non-dust (gray shaded area) components of the total aerosol load (d). Particulate depolarization ratio at 532 nm profile used for the decoupling of the coarse-mode pure-dust, fine-mode pure-dust, and non-dust components of the total aerosol load, as provided in panels (d) and (e). Extinction coefficient at 532 nm profiles of the coarse-mode pure-dust (red shaded area) and fine-mode pure-dust (blue shaded area) components of the total aerosol load (f).
Figure 5 provides an overview of the comparison for the case of a Saharan dust outbreak reaching Dakar on 20 April 2017 (Fig. 5a). FLEXPART v10.4 (FLEXible PARTicle) Lagrangian dispersion model (Stohl et al., 2005; Pisso et al., 2019) 6 d air masses back trajectories at 2 km in the area of interest (lat: 14.39°, long: −16.95°) are performed. The initial and boundary conditions for the FLEXPART runs are produced with 3-hourly meteorological data from the National Centers for Environmental Prediction (NCEP) Global Forecast System (GFS) provided at 0.5° × 0.5° spatial resolution and 41 model pressure levels. FLEXPART has been used in a large number of similar studies on long-range atmospheric transport (Stohl et al., 2005; Solomos et al., 2019; Kampouri et al., 2021). According to the back trajectories, the advected air masses were of north-northwestern Saharan origin (Fig. 5a – yellow line). According to the CALIPSO overpass (Fig. 5a – red line) in the vicinity of the AERONET Dakar sun photometer (Fig. 5c), the observed aerosol layer extended vertically between 1 and 4 km a.m.s.l. and was dominated by the presence of Saharan dust, as corroborated by both the cross-section of backscatter coefficient at 532 nm (Fig. 5b) and the mean particulate depolarization ratio at 532 nm profile (Fig. 5e). Figure 5d provides the pure-dust coarse-mode (red shaded area) and fine-mode (blue shaded area) components, following decoupling from the total aerosol load, including the non-dust aerosol component (gray shaded area) in terms of profiles of backscatter coefficient at 532 nm. Columnar-integrated pure-dust coarse-mode (red shaded area) and fine-mode (blue shaded area) extinction coefficient at 532 nm profiles yield CALIPSO-based DODcoarse and DODfine at 532 nm equal to 0.29 ± 0.21 and 0.11 ± 0.1, respectively, and optical depth values in good agreement with AERONET Dakar AOTcoarse and AOTfine of 0.36 and 0.12, respectively (Fig. 5f).
Table 5Requirements for the comparison between the CALIPSO-based DODcoarse and DODfine at 532 nm products and AERONET AOTcoarse and AOTfine at 532 nm retrievals.
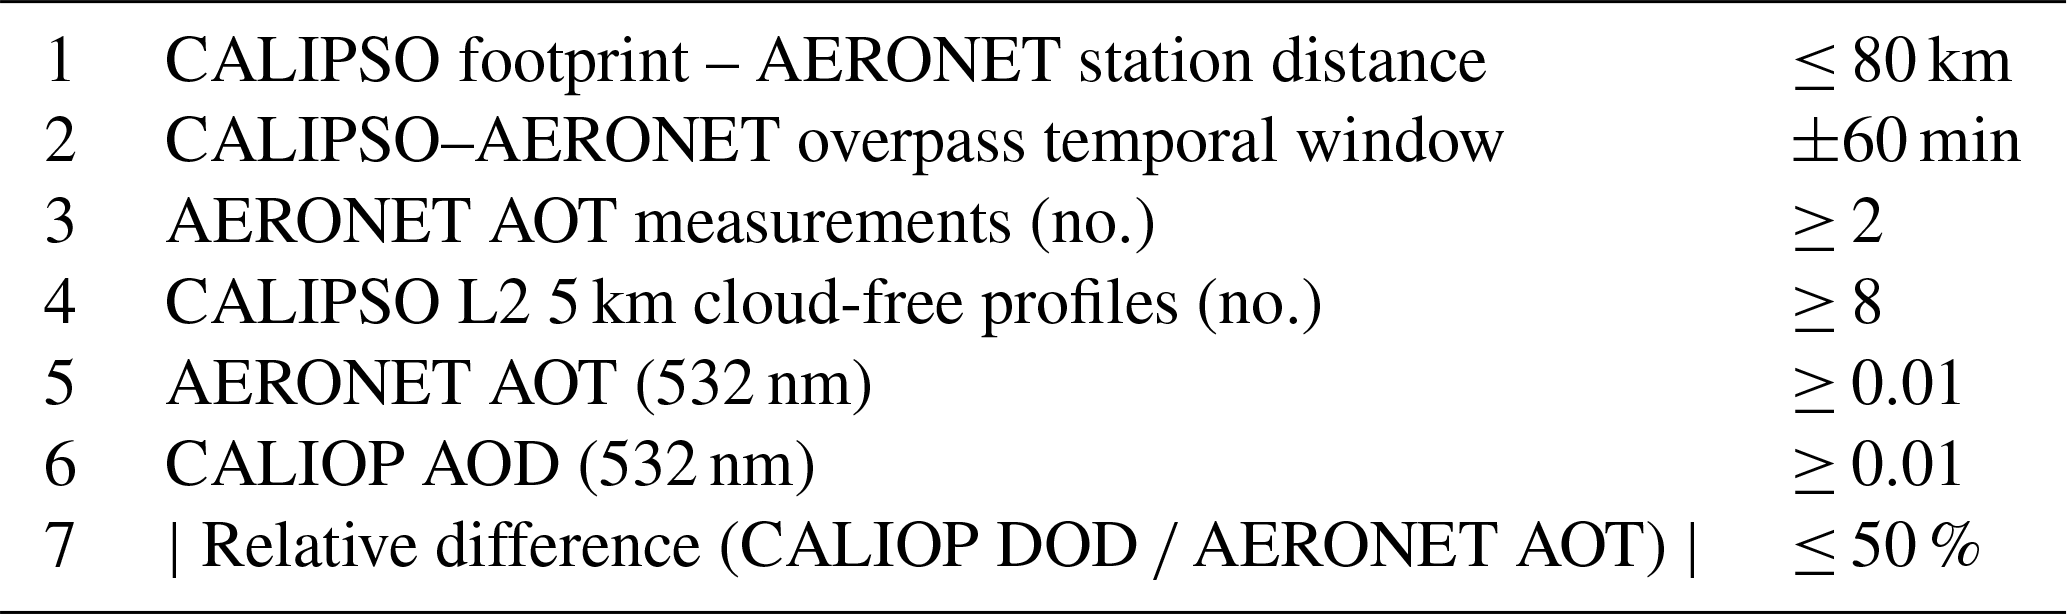
Enforcing the collocation criteria and constraints described above (Table 5) to account for the spatiotemporal atmospheric homogeneity and sampling differences between the two systems yields 1737 CALIPSO–AERONET coincidences fulfilling the requirements over the globe for a 14-year period (June 2006–May 2019). The CALIPSO–AERONET coincidences, extracted under the condition of dust presence in the atmosphere, mainly populate the arid areas of the globe and downwind of the source region areas. In this section we provide an assessment of the derived CALIPSO-based fine-mode and coarse-mode DODs at 532 nm against the corresponding AERONET fine-mode and coarse-mode AOTs at 532 nm, retrieved as discussed in Sect. 2.2.2–2.2.3 and as presented above, for CALIPSO–AERONET in Dakar on 20 April 2017 (Fig. 5).
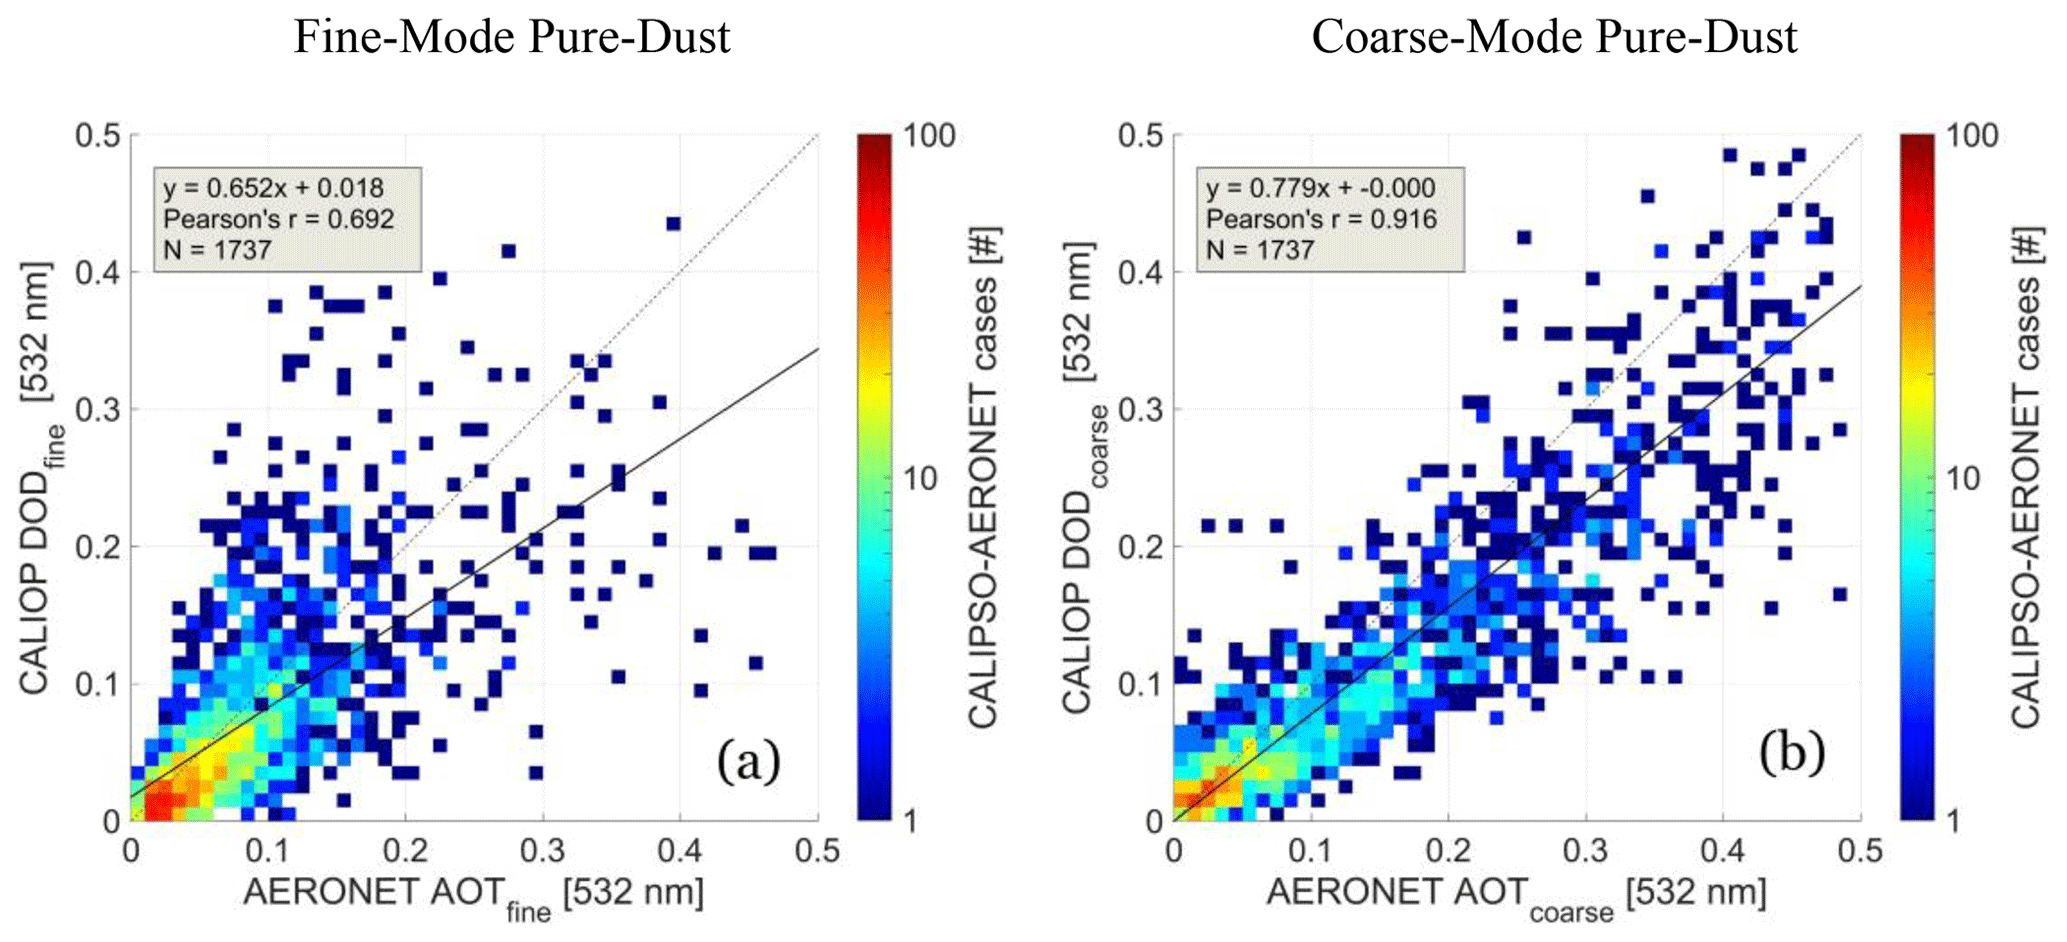
Figure 6Evaluation of the CALIPSO-based DODfine and DODcoarse at 532 nm products against AERONET AOTfine and AOTcoarse at 532 nm retrievals, respectively, in the form of 2D histogram density scatterplots. Layer background: Google Maps.
Table 6CALIPSO-based fine-mode (submicrometer) and coarse-mode (supermicrometer) DOD at 532 nm overall statistic metrics established on the basis of the reference AERONET fine-mode and coarse-mode AOTs at 532 nm, including absolute biases (Babs), relative biases (Brel), and root mean square error (RMSE), as well as the correlation coefficient, slope (Sfit), and intercept (Ifit) of a liner regression fit.
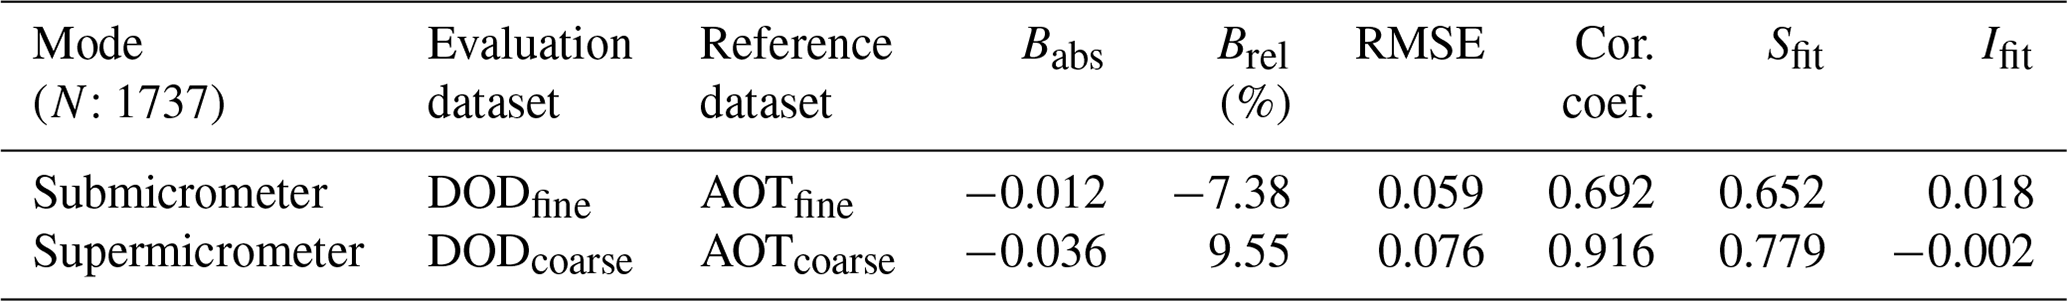
Figure 6 evaluates the total dataset of correlative CALIPSO-based fine-mode and coarse-mode DODs and AERONET-based fine-mode and coarse-mode AOTs in the form of 2D histogram density scatterplots with a bin step equal to 0.01, while the overall evaluation intercomparison metrics are summarized in Table 6. Data pairs delineated by the black one-to-one dashed line correspond to perfect optical depth agreement between the CALIPSO-based fine and coarse DOD modes and the respective AERONET fine and coarse AOT modes. Linear regression (solid black line) for the submicrometer category reveals good agreement between the two datasets, with slope 0.652, offset 0.018, and Pearson's correlation coefficient of the order of 0.692, though there is a tendency to deviate from the one-to-one line with increasing aerosol load (i.e., underestimation). With respect to the coarse-mode category the agreement between the two datasets improves substantially, with linear fit of slope 0.779, intercept close to −0.002, and Pearson's correlation coefficient equal to 0.916. An apparent feature revealed through the evaluation of the CALIPSO-based fine-mode and coarse-mode DODs at 532 nm products against the AERONET retrievals in fine-mode and coarse-mode AOTs at 532 nm is the increase of the degree of dispersion with increasing AERONET AOT values (Fig. 6). More specifically, the general tendency is for data pairs to be closer to the AERONET axis, resulting in an overall CALIPSO fine and coarse DOD underestimation compared to the respective AERONET fine and coarse AOT modes.
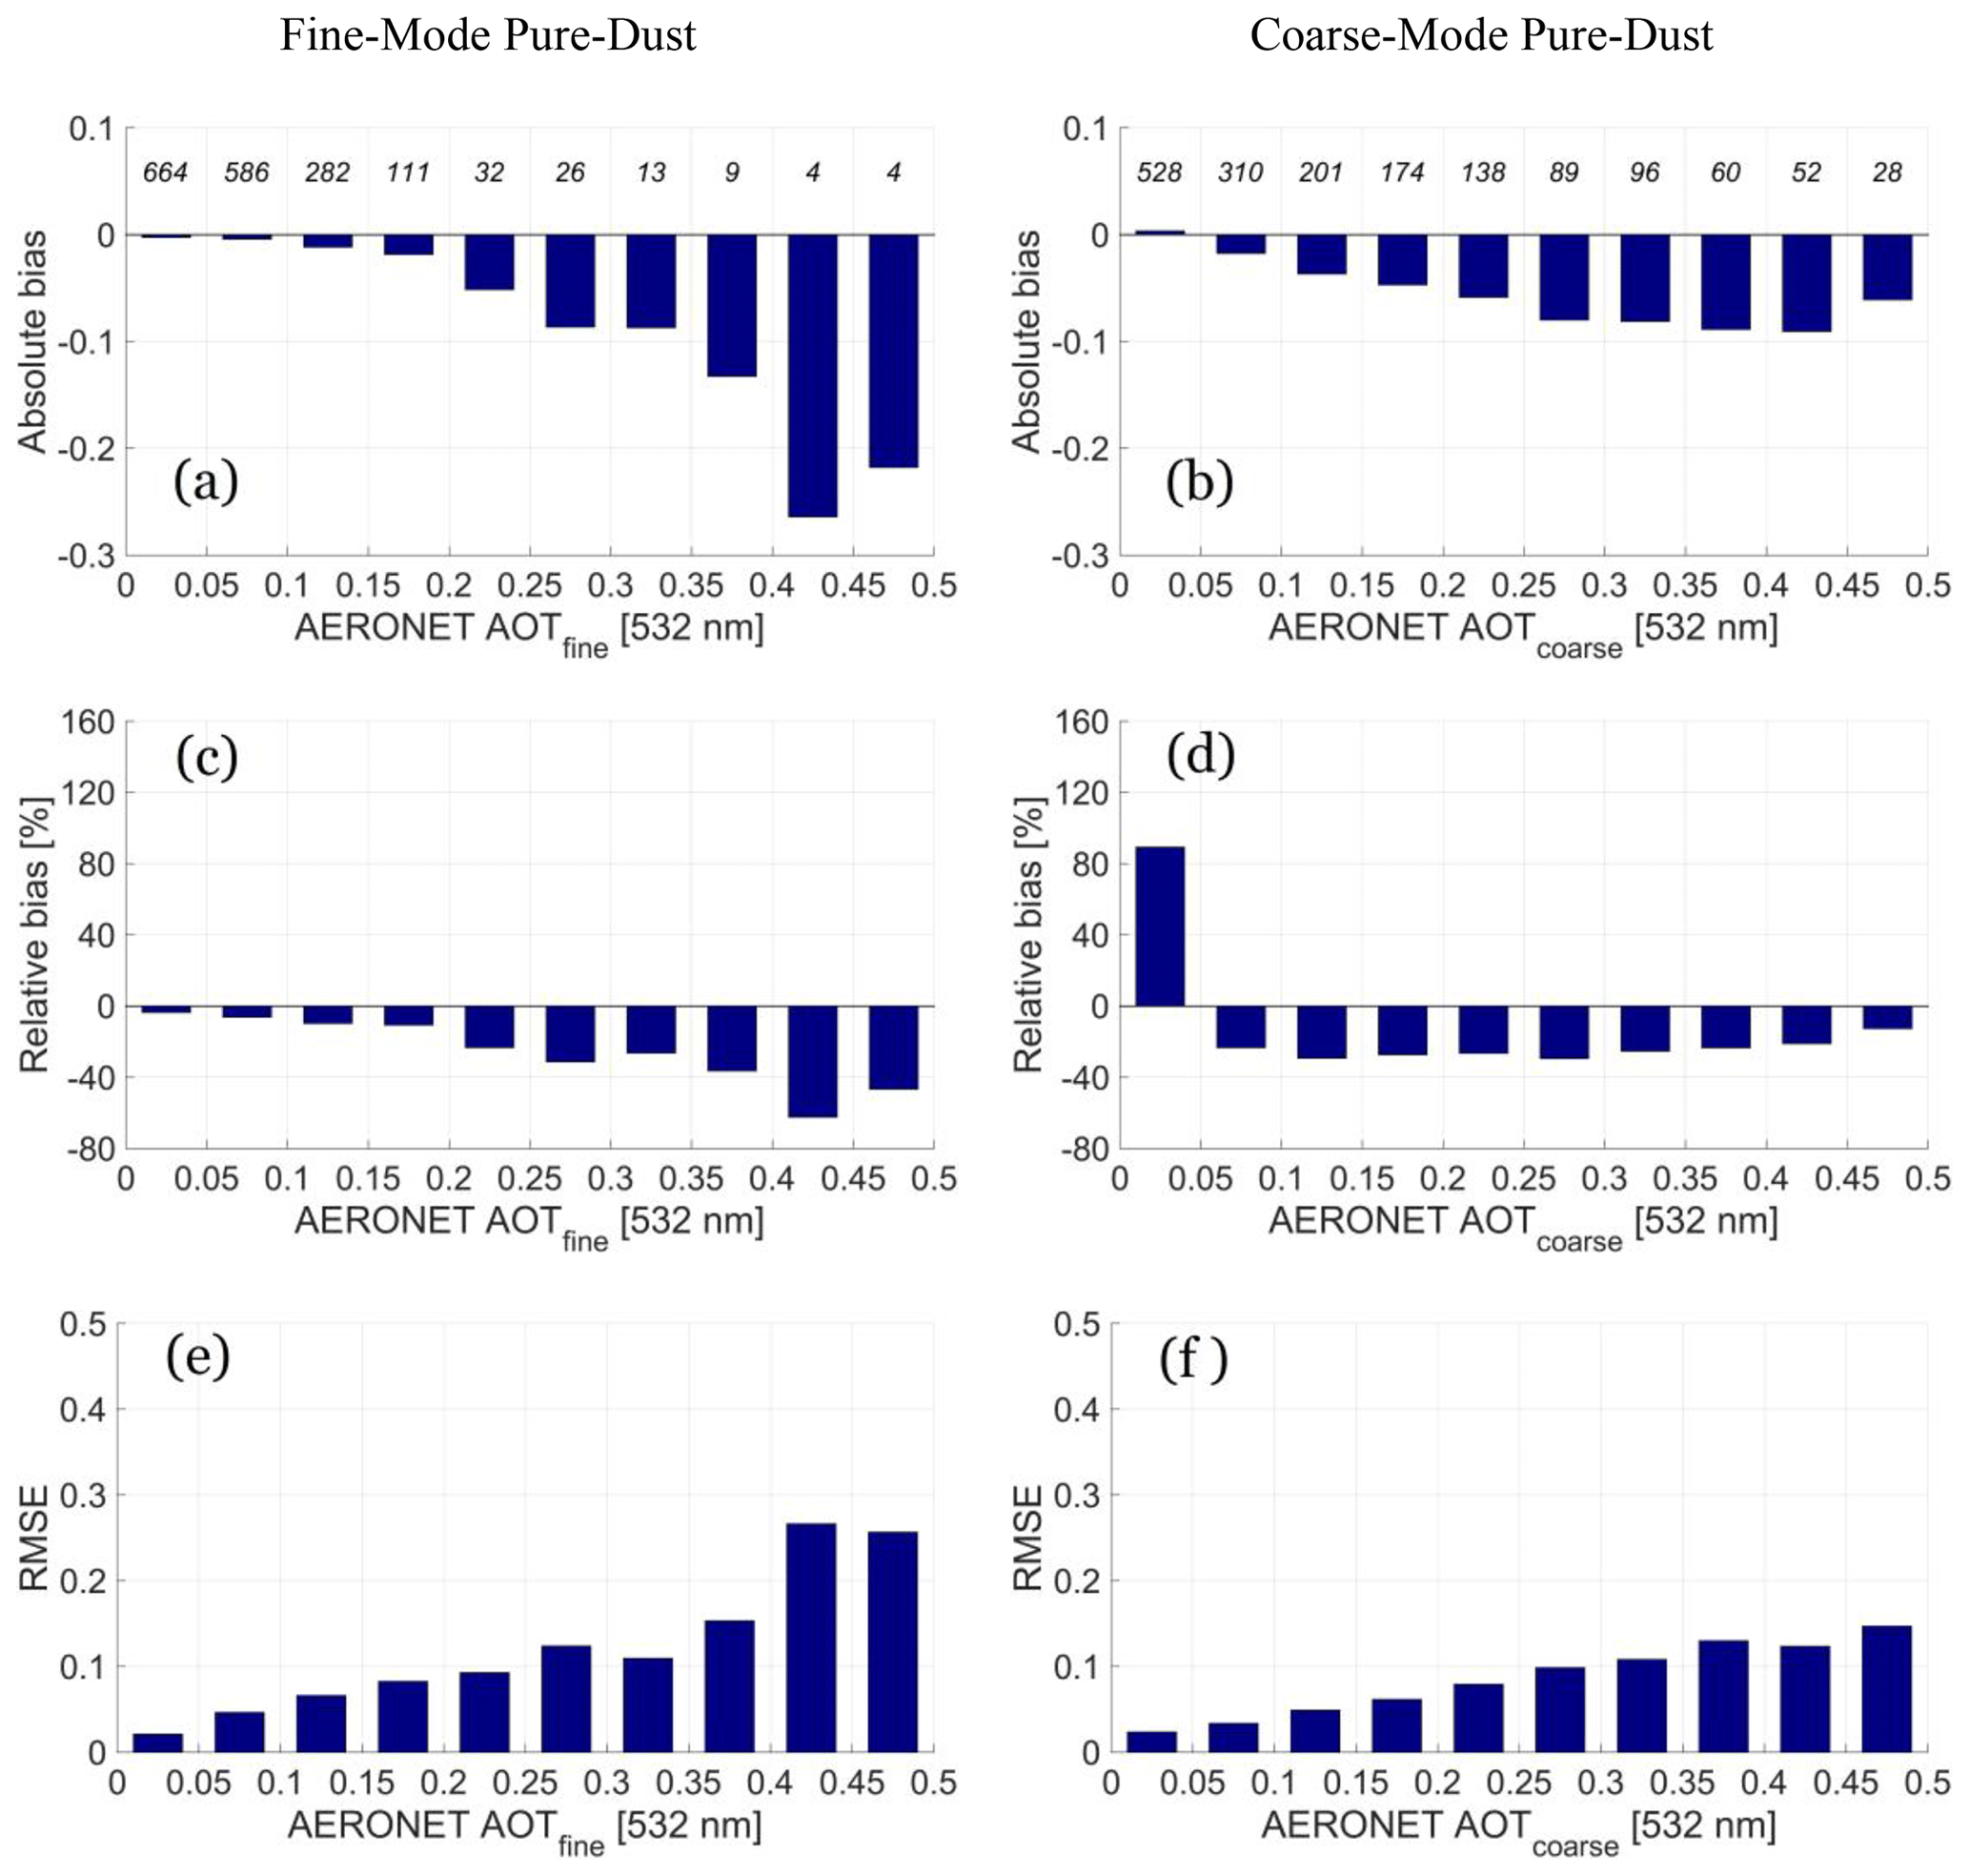
Figure 7CALIPSO-based fine-mode (a, c, e) and coarse-mode (b, d, f) DOD at 532 nm in terms of absolute biases (a, b), relative biases (c, d), and root mean square errors (RMSEs) (e, f) compared to the AERONET fine-mode and coarse-mode AOT for the 532 nm class of equal increment steps of 0.05 for the AOT at 532 nm in the range extending between 0 and 0.5.
Figure 7 quantitatively provides the CALIPSO-based fine-mode and coarse-mode DOD at 532 nm absolute biases (Fig. 7a, b), relative biases (Fig. 7c, d), and root mean square errors (RMSEs) (Fig. 7e, f) compared to the AERONET fine-mode and coarse-mode AOT for the 532 nm class of equal increment steps of 0.05 for the AOT at 532 nm range extending between 0 and 0.5. Overall, with respect to the CALIPSO-based fine-mode DOD at 532 nm, the evaluation reveals negative mean absolute biases (−0.012), mean relative biases (−7.38 %), and RMSE (0.059). Overall, with respect to the CALIPSO-based coarse-mode DOD at 532 nm, the evaluation reveals negative mean absolute biases (−0.036), positive mean relative biases (9.55 %), and RMSE (0.076). With respect to the CALIPSO-based coarse-mode DOD at 532 nm it must be noted though that the mean relative bias is driven positive by the observed patterns in the range of small DOD values (0–0.05), while for EARLINET AOT classes larger than 0.05 negative relative biases are observed (Fig. 7d). Moreover, the analysis shows that the CALIPSO-based fine-mode and coarse-mode DOD absolute biases (Fig. 7a, b) are more clearly affected for larger AOD values (increasing), while mean relative absolute biases demonstrate significantly less variability, remaining relatively constant (Fig. 7c, d).
It must be noted that the revealed CALIPSO fine- and coarse-mode DOD at 532 nm underestimation constitutes an expected feature. More specifically, it is well-documented that a discrepancy – underestimation – exists in CALIPSO extinction coefficient profiles and AODs at 532 nm, as established against correlative observations by Aqua-MODIS AODs (e.g., Kacenelenbogen et al., 2011; Kittaka et al., 2011; Redemann et al., 2012; Kim et al., 2013; Ma et al., 2013), AERONET-derived AOTs (Schuster et al., 2012; Omar et al., 2013; Amiridis et al., 2013; Toth et al., 2018), and airborne lidar observations (Rogers et al., 2014). These studies attribute the apparent CALIPSO AOD at 532 nm underestimation to a number of factors, including – among others – misclassification of cloud layers as aerosol (and vice versa), erroneous subclassification of the classified atmospheric layers as aerosol, incorrect selection of the aerosol subtype lidar ratios, limited or restricted penetration and/or attenuation of the CALIOP beam within thick aerosol layers, and profiles frequently populated with retrieval fill values (RFVs) due to failure to detect diffuse and tenuous aerosol layers of SNR below CALIOP minimum detection thresholds. The CALIPSO fine- and coarse-mode DOD at 532 nm underestimation with respect to AERONET AOT at 532 nm is further enhanced by the fine-mode, coarse-mode, and total pure-dust decoupling algorithm (Sect. 2.2.1). The apparent underestimation features relate to an extent to the evaluation of DODfine with AOTf, to an AERONET retrieval including non-dust fine-mode aerosol subtypes (e.g., biomass burning and urban haze), and to the evaluation of DODcoarse with AOTc, an AERONET product including non-dust coarse-mode aerosol subtypes (e.g., marine, pollen, volcanic ash).
Overall, the CALIPSO-based DOD–AERONET AOT evaluation comparison corroborates on the good performance of the lidar-based algorithms developed with the objective of decoupling the fine-mode, coarse-mode, and total pure-dust components of the total aerosol load (Shimizu et al., 2004; Mamouri and Ansmann, 2014, 2017; Tesche et al., 2009), the high quality of the already established ESA-LIVAS pure-dust database that is the cornerstone of the present study (Amiridis et al., 2013, 2015; Marinou et al., 2017; Proestakis et al., 2018), and the quality of the established CALIPSO-based products of fine-mode and coarse-mode pure-dust atmospheric components in terms of extinction coefficient profiles and DODs at 532 nm.
3.2 Total, fine-mode, and coarse-mode pure-dust mass concentration product – validation against airborne in situ measurements
In August 2015 a large-scale collaborative field campaign, the “Ice in Clouds Experiment – Dust” (ICE–D), including a subcomponent, the “AERosol properties – Dust” (AER–D) experiment, was conducted over the eastern tropical Atlantic Ocean in the broader region extending between Cabo Verde and the Canary Islands. The main science objective of the AER–D campaign evolved around a better characterization of airborne mineral dust optical and microphysical properties (Marenco et al., 2018), while ICE–D aimed at studying dust–cloud interactions and the efficiency of airborne mineral dust to act as CCN and IN (Liu et al., 2018). In the framework of AER-D and ICE-D 16 research flights were carried out with the Facility for Airborne Atmospheric Measurements (FAAM) BAe-146 research aircraft. Research flight b920 conducted on 7 August 2015 aimed to perform highly spatially and temporarily coordinated measurements with CATS on board the ISS, targeting the thorough validation of CATS products (McGill et al., 2015; Pauly et al., 2019; Yorks et al., 2016).
AER–D and ICE–D FAAM flights deployed remote sensing and in situ instrumentation. Remote sensing measurements were conducted, amongst others, by a Leosphere ALS450 elastic backscatter lidar system, designed to acquire vertical profiles of aerosol and clouds at 355 nm in a nadir-viewing geometry. The system specifications are provided by Marenco et al. (2011) and Chazette et al. (2012), and the processing algorithms, starting from the level of the lidar beam returns to the determination of the lidar ratio, the derivation of the extinction coefficient profiles, and the corresponding AOD values, are described in Marenco (2013), Marenco et al. (2014), and O'Sullivan et al. (2020). In situ measurements are described in Ryder et al. (2018) and include aerosol size distribution measurements using a combination of a wing-mounted PCASP (passive cavity aerosol spectrometer probe; Rosenberg et al., 2012), a CDP (cloud droplet probe; Lance et al., 2010), and a 2DS (two-dimensional stereo probe), sampling a combined size distribution from 0.1 to 100 µm in diameter. Here we use airborne lidar measurements carried out during straight FAAM flights performed at a constant altitude between two locations (“runs” – R) and in situ aerosol size distribution measurements from aircraft ascents and descents (“profiles” – P).
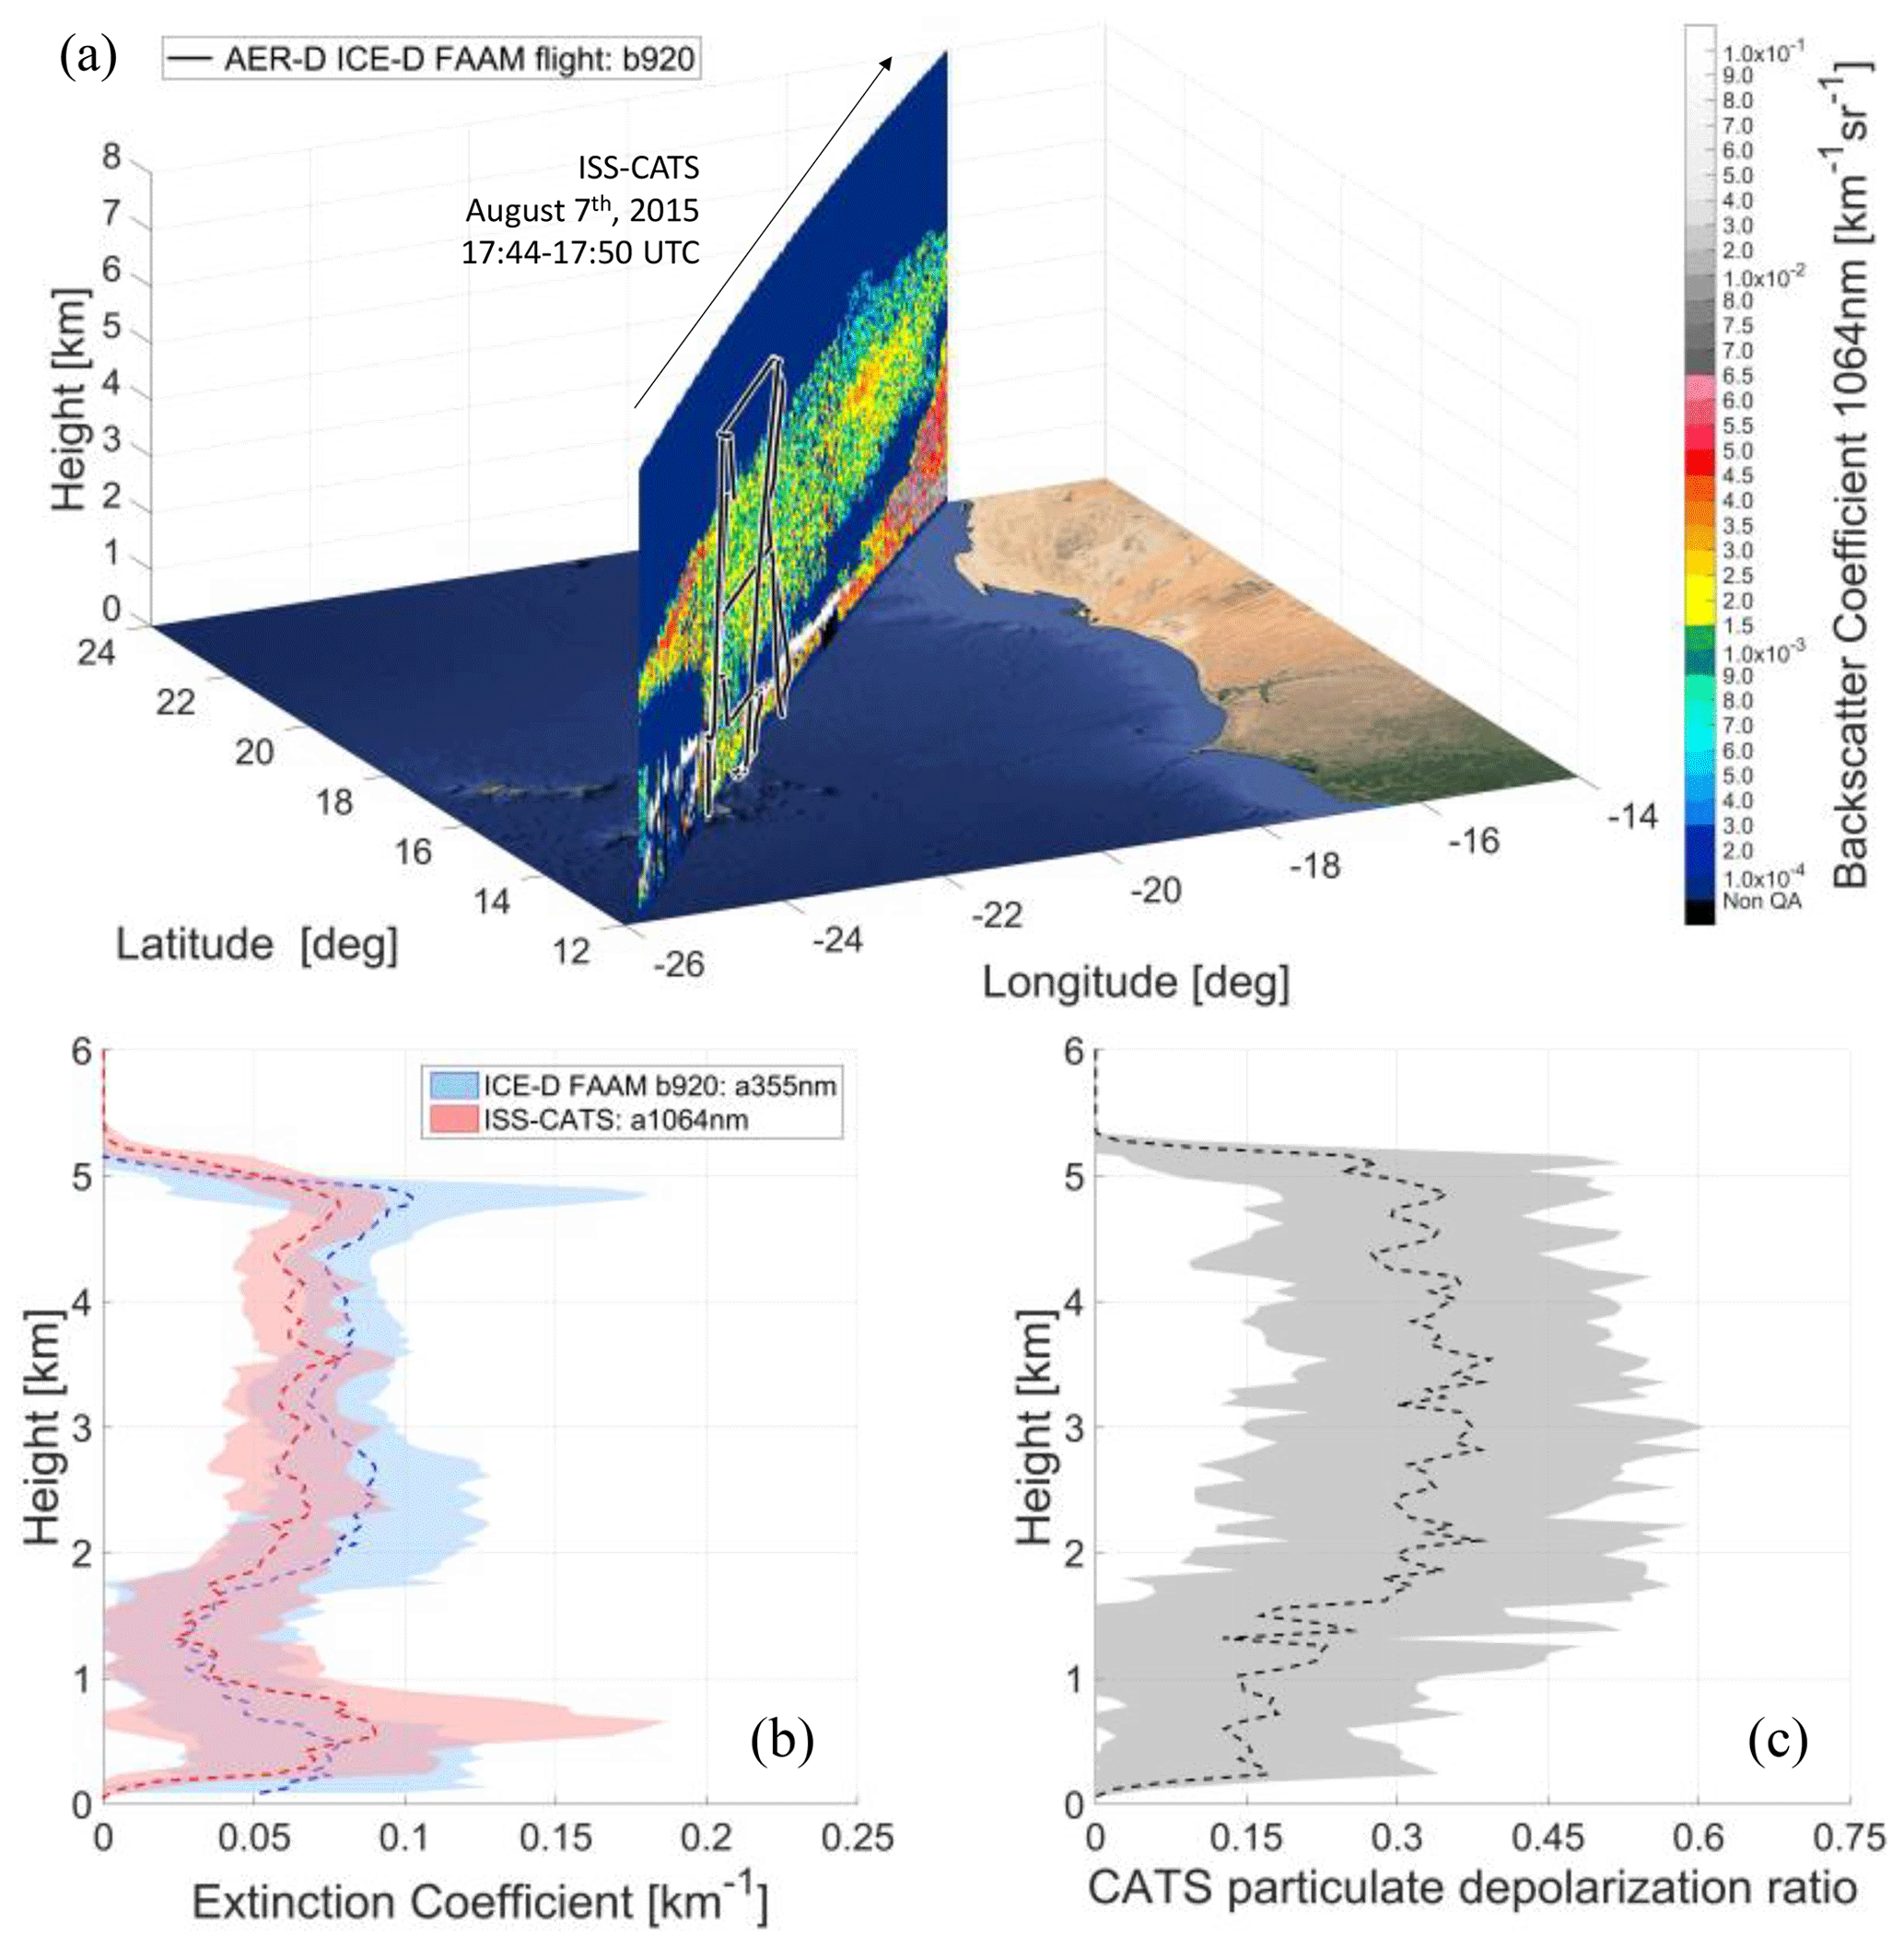
Figure 8FAAM b920–ISS-CATS underflight on 7 August 2015 in the vicinity of Praia, Cabo Verde (a), FAAM b920 lidar and ISS-CATS mean extinction coefficient profiles at 355 m and 1064 nm, respectively (b), and ISS-CATS mean particulate depolarization ratio profile at 1064 nm (c). In panel (a) the aircraft track is shown in black. Layer background: © Google Maps.
Figure 8a shows the flight track of b920 (black line), demonstrating the both spatially and temporarily highly coordinated flight trajectory to the ISS orbit track. The flight performed both airborne lidar measurements and air mass sampling at different altitudes. In addition, Fig. 8a provides the structure of the atmospheric aerosol scene in the broader area extending between Cabo Verde and the Canary Islands on 7 August 2015, as probed by ISS-CATS and based on L2 5 km backscatter coefficient at 1064 nm profiles (17:44–17:50 UTC). With respect to the vertical structure of the aerosol layers, the profiles of extinction coefficient obtained by the airborne lidar at 355 nm and by CATS at 1064 nm, in terms extinction coefficient, are in good agreement. Both extinction coefficient profiles report values in the range between 0.03 and 0.08 km−1, with FAAM lidar values well within the variability of the atmospheric scene as observed by ISS-CATS. The aerosol observed by both the airborne and spaceborne lidar systems was dominated by dust, extending between 2 and 5 km a.m.s.l. in the Saharan Air Layer (SAL), originating from convective activity over central Algeria, while a mixture of dust and marine and broken clouds was present within the marine boundary layer (MBL). The CATS mean particulate depolarization ratio at 1064 nm lies in the range between 0.3 and 0.4, confirming through the highly depolarizing optical properties of the non-spherical dust particles the presence of dust aerosols in the atmosphere (Fig. 8c). Thus, it is evident that the FAAM b920 and ISS-CATS collocated measurements were performed in the presence of a deep dust layer within the Saharan Air Layer (SAL), transported westwards by the predominantly easterly winds. The FAAM flight on 7 August 2015 therefore provides an ideal case for establishing the quality of the satellite-based lidar fine-mode and coarse-mode pure-dust mass concentration products due to (1) the implementation of both remote sensing and in situ airborne measurements, (2) the highly collocated FAAM underflight of the ISS orbit track, and (3) the significant presence of atmospheric dust within the SAL.
Towards the accurate derivation of the fine-mode and coarse-mode pure-dust mass concentration profiles, based on the CATS backscatter coefficient and particulate depolarization ratio at 1064 nm, the implementation of suitable decoupling parameters (Eqs. 5 and 7) and conversion factors (Eqs. 9 and 10) at the wavelength of 1064 nm is required. Towards this objective, the pure-dust δd, coarse-mode pure-dust δcd, and non-dust δnd particulate depolarization ratio values at 1064 nm are set equal to 0.27, 0.28, and 0.05, respectively (Freudenthaler et al., 2009; Haarig et al., 2017b; Mamouri and Ansmann, 2017). CATS L2 5 km quality-assured profiles between latitudes 14.61 and 17.92° N, following the latitudinal geographical coverage of the FAAM b920 flight, were used. Accordingly, height profiles of the pure-dust and coarse-mode pure-dust extinction coefficient at 1064 nm are obtained (Eq. 9a–c) by multiplying the pure-dust and coarse-mode pure-dust backscatter coefficient profiles at 1064 nm with a dust lidar ratio of 67 sr (Mamouri and Ansmann, 2017). To convert the obtained profiles of pure-dust and coarse-mode pure-dust extinction coefficient at 1064 nm into mass concentration profiles, conversion factors cv,d and equal to 0.73 and 0.72 are utilized, as calculated for Cabo Verde and Barbados in Mamouri and Ansmann (2017). As a final step, the profiles of fine-mode pure-dust mass concentration are estimated as the residual between the profiles of total pure-dust mass concentration and the coarse-mode pure-dust mass concentration (Eq. 10a–c). Accordingly, the airborne in situ mean aerosol size distribution in terms of mass concentration for aerosol particles with diameter between 0.1 and 100 µm is averaged based on P2 and P7 of the FAAM b920 flight, selected on the basis of the vertical extent, covering the full range of the SAL.
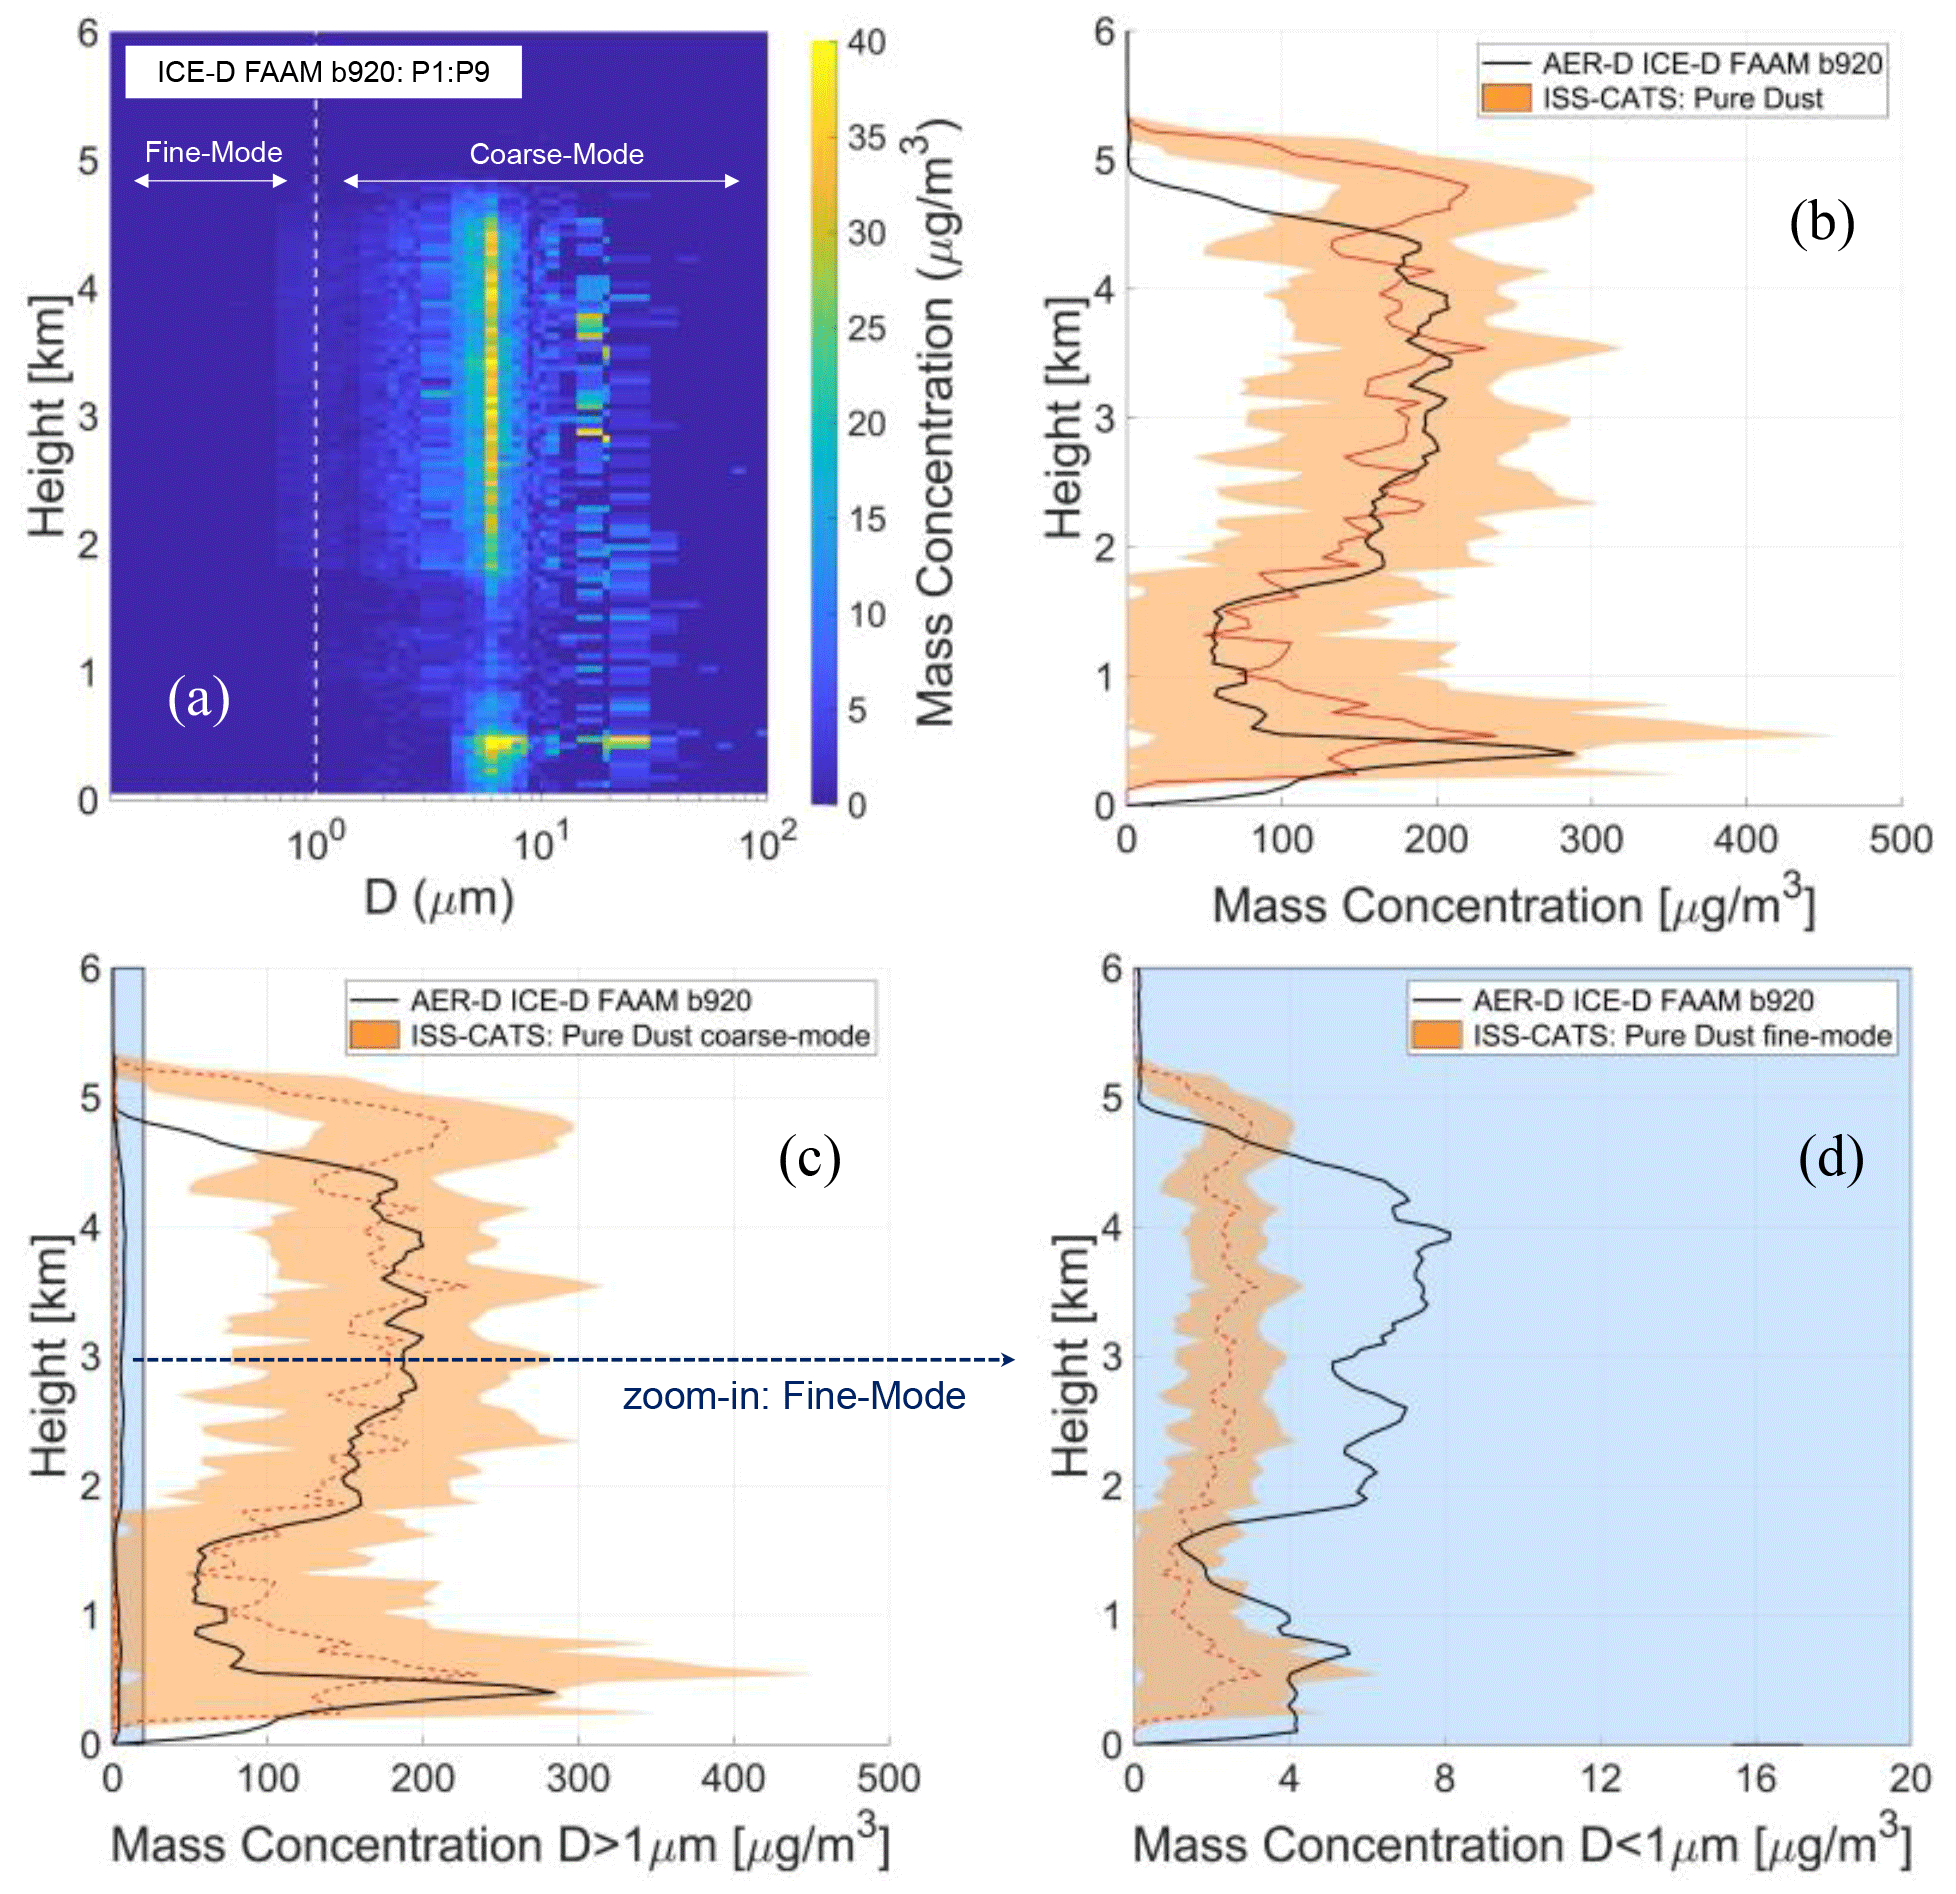
Figure 9FAAM b920 airborne in situ measurements of mass concentration in the vicinity of Praia on 7 August 2015 based on (averaged) P2 and P7 (a). FAAM b920 in situ (black line) and ISS-CATS (orange line) mass concentration profiles are provided for the total (b), supermicrometer (c), and submicrometer atmospheric aerosol classes (d).
Here, the fine-mode and coarse-mode pure-dust mass concentration profiles obtained based on the ISS-CATS backscatter coefficient and particulate depolarization ratio at 1064 nm profiles through the separation technique (Sect. 2.2) are validated against the FAAM b920 airborne in situ full aerosol size distribution (Fig. 9). From the airborne in situ measurements it is evident that the dust layer is dominated by particles of supermicrometer diameter, consisting of ∼ 99.73 % by mass (Fig. 9a). Moreover, it is evident that CATS total pure-dust mass concentration and the airborne in situ mass concentration profiles are in good agreement, both in the vertical extent and quantitatively, with values extending between 150 and 170 µg m−3 within the SAL and reaching as high as 250-300 µg m−3 within the MBL (Fig. 9b). The comparison is allowed even though the airborne in situ measurements consist of both dust and non-dust aerosols due to the dominant dust presence, as is confirmed by the CATS particulate depolarization ratio at 1064 nm observations (Fig. 8c). The high agreement between the CATS total pure-dust mass concentration and the airborne in situ mass concentration profiles is crucial, since discrepancies would not allow further intercomparison between the airborne fine-mode and coarse-mode profiles of mass concentration and the corresponding satellite-derived fine-mode pure-dust and coarse-mode pure-dust profiles of mass concentration (Fig. 8c–d).
The CATS-estimated coarse-mode pure-dust concentration (163.3 ± 31.8 µg m−3; averaged over the altitude range 1.5 to 5 km a.m.s.l.) and the in situ supermicrometer mass concentration (149.4 ± 55.2 µg m−3) are within 10 % (Fig. 9c), and very close to the total in situ mass concentration measured (154.8 ± 57.1 µg m−3). However, the CATS fine-mode pure-dust concentration is underestimated (2.3 ± 0.4 µg m−3; averaged over the altitude range 0 to 1.5 km a.m.s.l.) at ∼ 58 % lower than the airborne in situ fine-mode mass concentration (5.4 ± 2.1 µg m−3) in SAL, although the performance increases significantly in the MBL region (Fig. 9d). According to Ryder et al. (2018) and the provided size-resolved composition in both the SAL and the MBL for b920, no dust at sizes d < 0.5 µm was present in the atmosphere between Cabo Verde and the Canary Islands on 7 August 2015. However, the fine-mode and coarse-mode dust decoupling algorithm is established on the basis of a boundary diameter separating the two modes of 1 µm; thus, the low dust fine-mode concentrations apparent in both the SAL and the MBL for b920 most probably correspond to dust of diameter between 0.5 and 1 µm. Overall, CATS fine-mode pure-dust mass concentration underestimation may be partially attributed to the natural atmospheric inhomogeneity of the aerosol fields and partially to CATS deficiency in detecting tenuous aerosol layers during sunlight illumination conditions due to a low signal-to-noise ratio (CATS 7.2 daytime minimum detectable backscatter 1064 nm: 1.30 × 10⁻³ ± 0.24 × 10⁻³ km−1 sr−1 for cirrus clouds; Yorks et al., 2016), introducing negative biases of the order of 20 %–30 % for daytime observations (Proestakis et al., 2019). However, the overall good performance of the fine-mode and coarse-mode pure-dust decoupling methodology is corroborated by the fine-mode to total mass concentration fractions, being in good agreement and of the same order of magnitude (CATS: ∼ 1.4 %, b920 in situ: ∼ 3.5 %). Finally, both the spaceborne-lidar-derived and the airborne fine and coarse modes are in good agreement with respect to the vertical extent of the probed dust layer, characterized by similar profile characteristics in the SAL and MBL.
The primary products of the present study consist of the fine-mode and coarse-mode components of atmospheric pure dust, provided in quality-assured vertical profiles of the (1) backscatter coefficient at 532 nm, (2) extinction coefficient at 532 nm, and (3) mass concentration, with the original L2 horizontal (5 km) and vertical (60 m) resolution of CALIPSO, respectively (Sect. 2.2.1, Fig. 4). However, further processing of all L2 granules makes feasible the provision of an advanced four-dimensional (4D) reconstruction of the total aerosol load, along with its components, at a near-global scale and over a long-term period. As such, the present section aims, through the long-term horizontal, vertical, and temporal distributions of the two dust modes, to demonstrate this potential of the geo-information products established with the objective to allow for further advancements of our EO-based capacity to observe and understand the submicrometer and supermicrometer modes of pure dust in the atmosphere.
4.1 Horizontal distribution
With respect to the horizontal distribution of aerosol, the optical depth is the parameter most frequently used by spaceborne passive sensors to quantify the columnar aerosol load under cloud-free sky conditions. Since CALIOP is not a passive sensor but an active system, in order to process the L2 extinction coefficient profiles into optical depth, specific steps have to be taken. More specifically, initially and for the needs of the present study, a near-global uniform grid of 1° latitude by 1° longitude is established (between 70° S and 70° N). Accordingly, the L3 processing algorithm iterates through all the CALIPSO L2 overpass granules within each grid and for the period between June 2006 and December 2021. As a next step, temporal averaging is accomplished by averaging all the grid-aggregated quality-screened L2 extinction coefficient at 532 nm profiles within each grid of spatial resolution 1° × 1° over a time period of interest (e.g., of annual, seasonal, or monthly temporal resolution). Finally, the mean AOD, DOD, DODfine-mode, and DODcoarse-mode at 532 nm are computed by vertical integration of the gridded mean total aerosol, pure-dust, fine-mode pure-dust, and coarse-mode pure-dust extinction coefficient at 532 nm profiles, respectively. Figure 10 demonstrates the outcomes of these processing steps, more specifically the near-global annual mean horizontal distribution of the CALIPSO-based AOD at 532 nm at 1° × 1° spatial resolution (Fig. 10a), the ESA-LIVAS DOD at 532 nm product (Amiridis et al., 2013, 2015; Marinou et al., 2017; Proestakis et al., 2018; Fig. 10b), and the coarse-mode (Fig. 10c) and fine-mode (Fig. 10d) components of DOD at 532 nm. Moreover, Fig. 10 provides the coarse-mode pure-dust fraction (CMF; coarse-mode pure-dust optical depth to total pure-dust optical depth fraction; Fig. 10e) and the fine-mode pure-dust fraction (FMF; fine-mode pure-dust optical depth to total pure-dust optical depth fraction; Fig. 10f) for areas of annual mean DOD at 532 nm greater than 0.01.
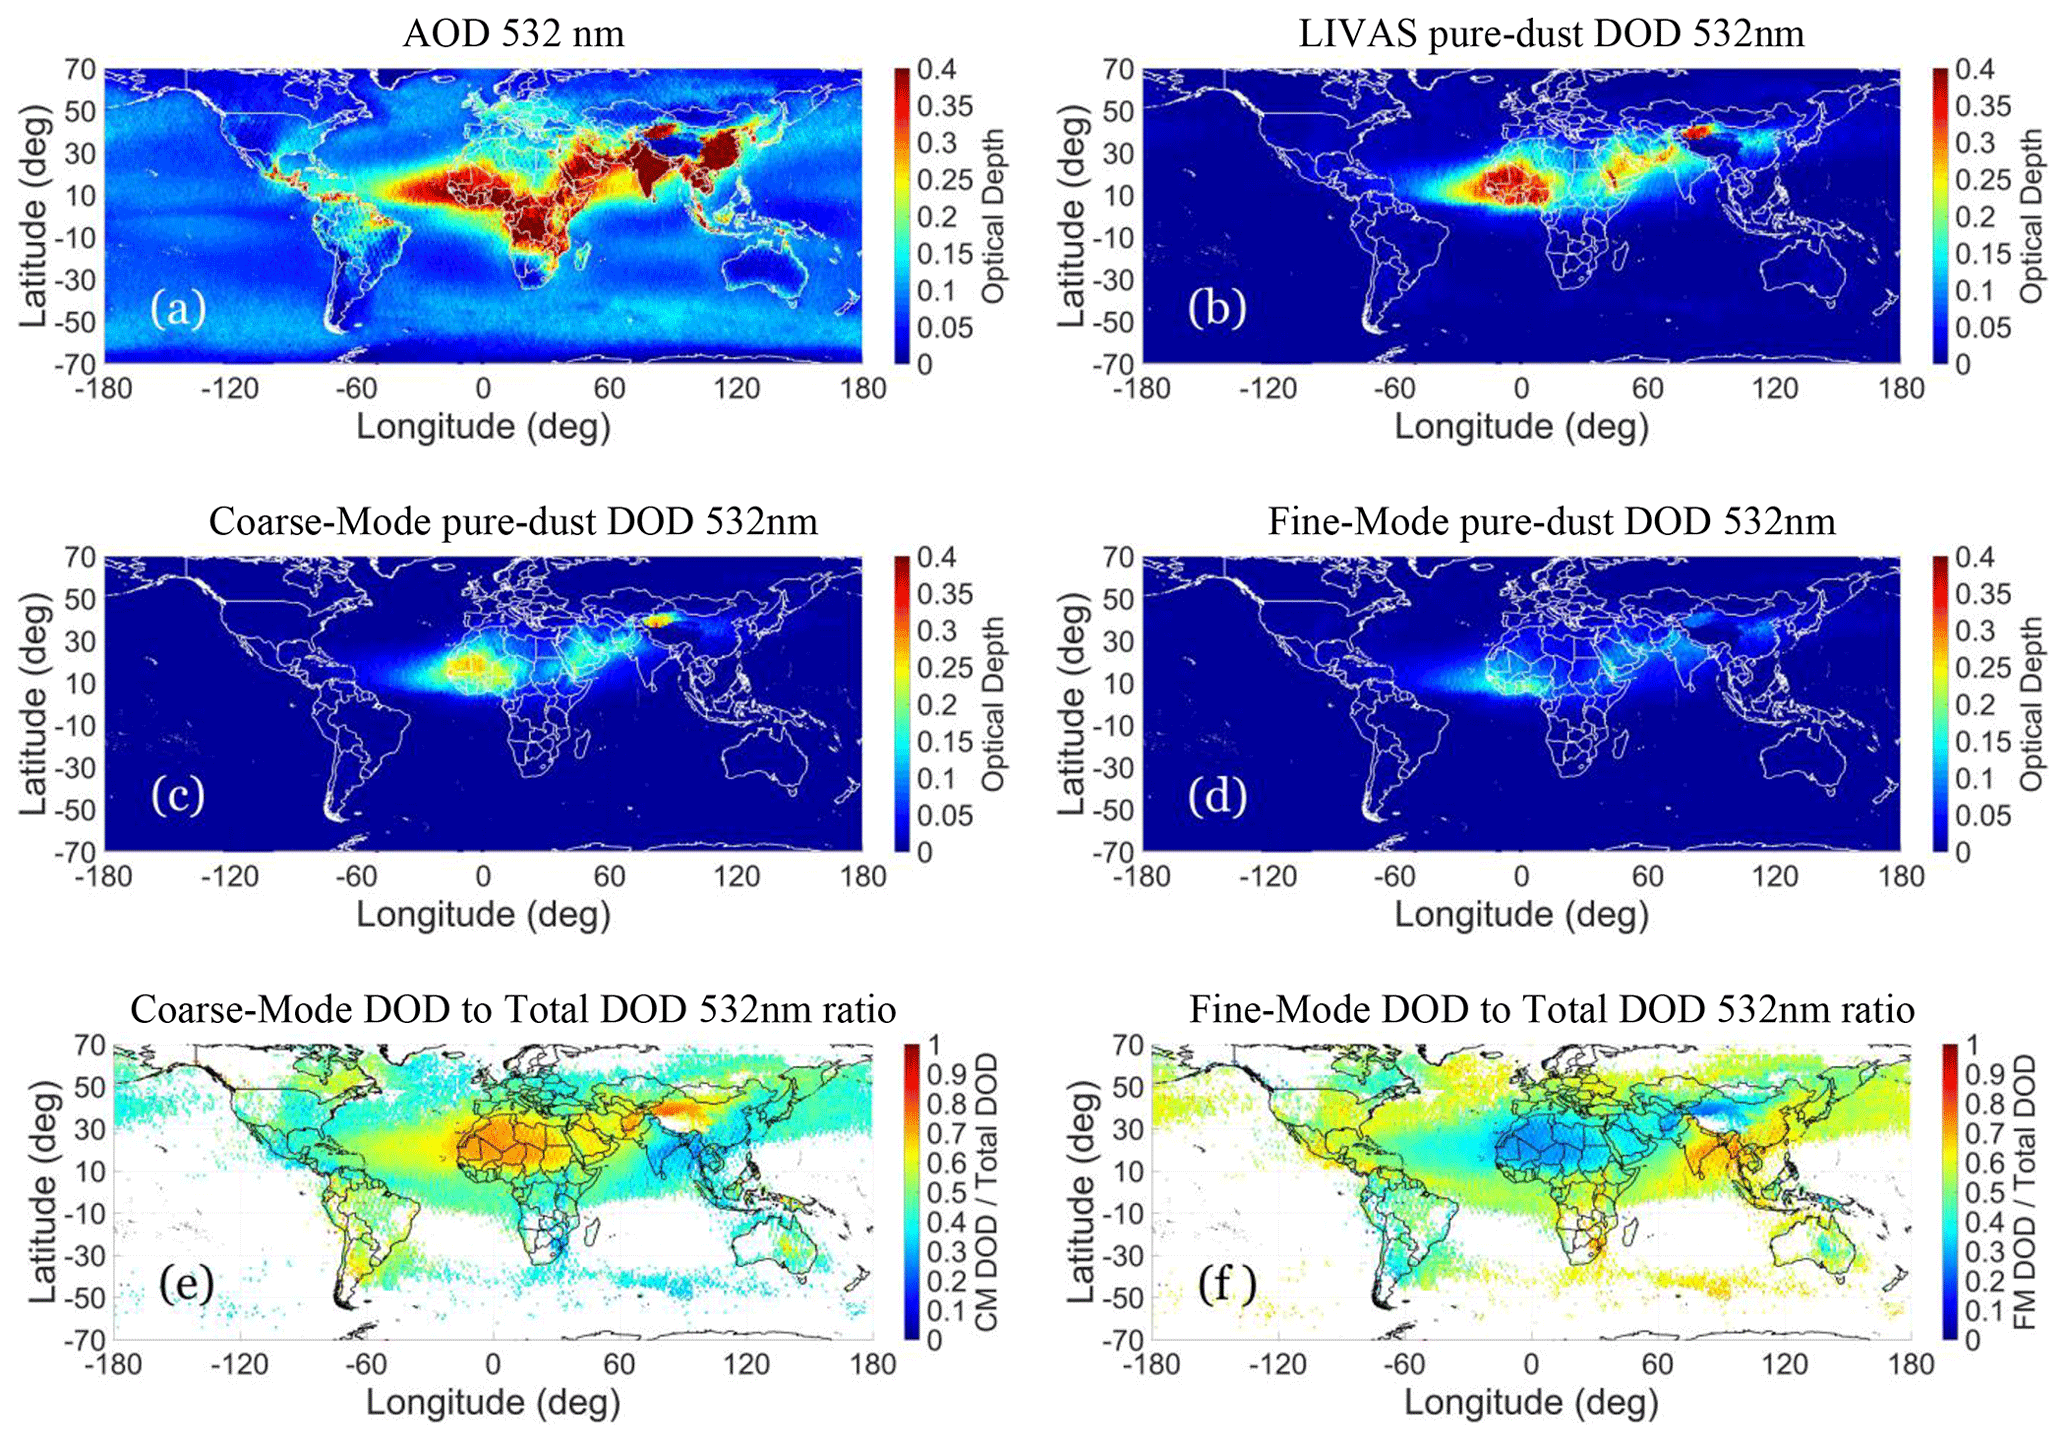
Figure 10Near-global annual mean horizontal distribution of the CALIPSO-based AOD at 532 nm (a), the ESA-LIVAS DOD at 532 nm product (b), the coarse-mode DOD at 532 nm (c), the fine-mode DOD at 532 nm (d), the coarse-mode pure-dust fraction (e), and the fine-mode pure-dust fraction (f), provided at 1° × 1° spatial resolution and for the period June 2006–December 2021. In (e) and (f) cases of DOD at 532 nm with a load lower than 0.01 are not shown.
With respect to the optical depth outcomes, we begin with an examination of the near-global long-term horizontal distribution of CALIOP AOD at 532 nm to initially provide the generic characteristics of the net effect of dust and non-dust aerosol subtypes in the atmosphere (Fig. 10a). According to the observed AOD features, significant spatial variability is evident, especially over land and the Northern Hemisphere, where major sources of natural aerosol and major sources of anthropogenic aerosol are present (Winker et al., 2013). More specifically, mineral dust particles emitted from the vast arid and semi-arid regions of the planet (i.e., Saharan, Arabian, Taklimakan, Gobi deserts), biomass burning aerosols from tropical grasslands and forests (i.e., Amazonian region, sub-Sahel, Gulf of Guinea), volcanic emissions, sea salt marine particles, and aerosol emissions related to anthropogenic activity, especially over major urban, densely populated, and heavily industrialized areas of the planet (i.e., East Asia, Indo-Gangetic Plain), result in high annual mean AOD values frequently exceeding 0.6, apparent not only over the source regions, but also over distances of thousands of kilometers downwind.
The effect of dust aerosol on optical depth, decoupled and isolated from the effect of all non-dust aerosol subtypes, is provided by the well-established ESA-LIVAS pure-dust product (Fig. 10b). Overall, the pure-dust product of the ESA-LIVAS database has verified and demonstrated capacity to fully reveal the sources of dust, to quantitatively describe the three-dimensional evolution of dust in the atmosphere from source to sink, and to efficiently provide the seasonality of activation of dust source regions and the four-dimensional transition of dust transport pathways (Amiridis et al., 2013; Marinou et al., 2017; Proestakis et al., 2018; Aslanoğlu et al., 2022).
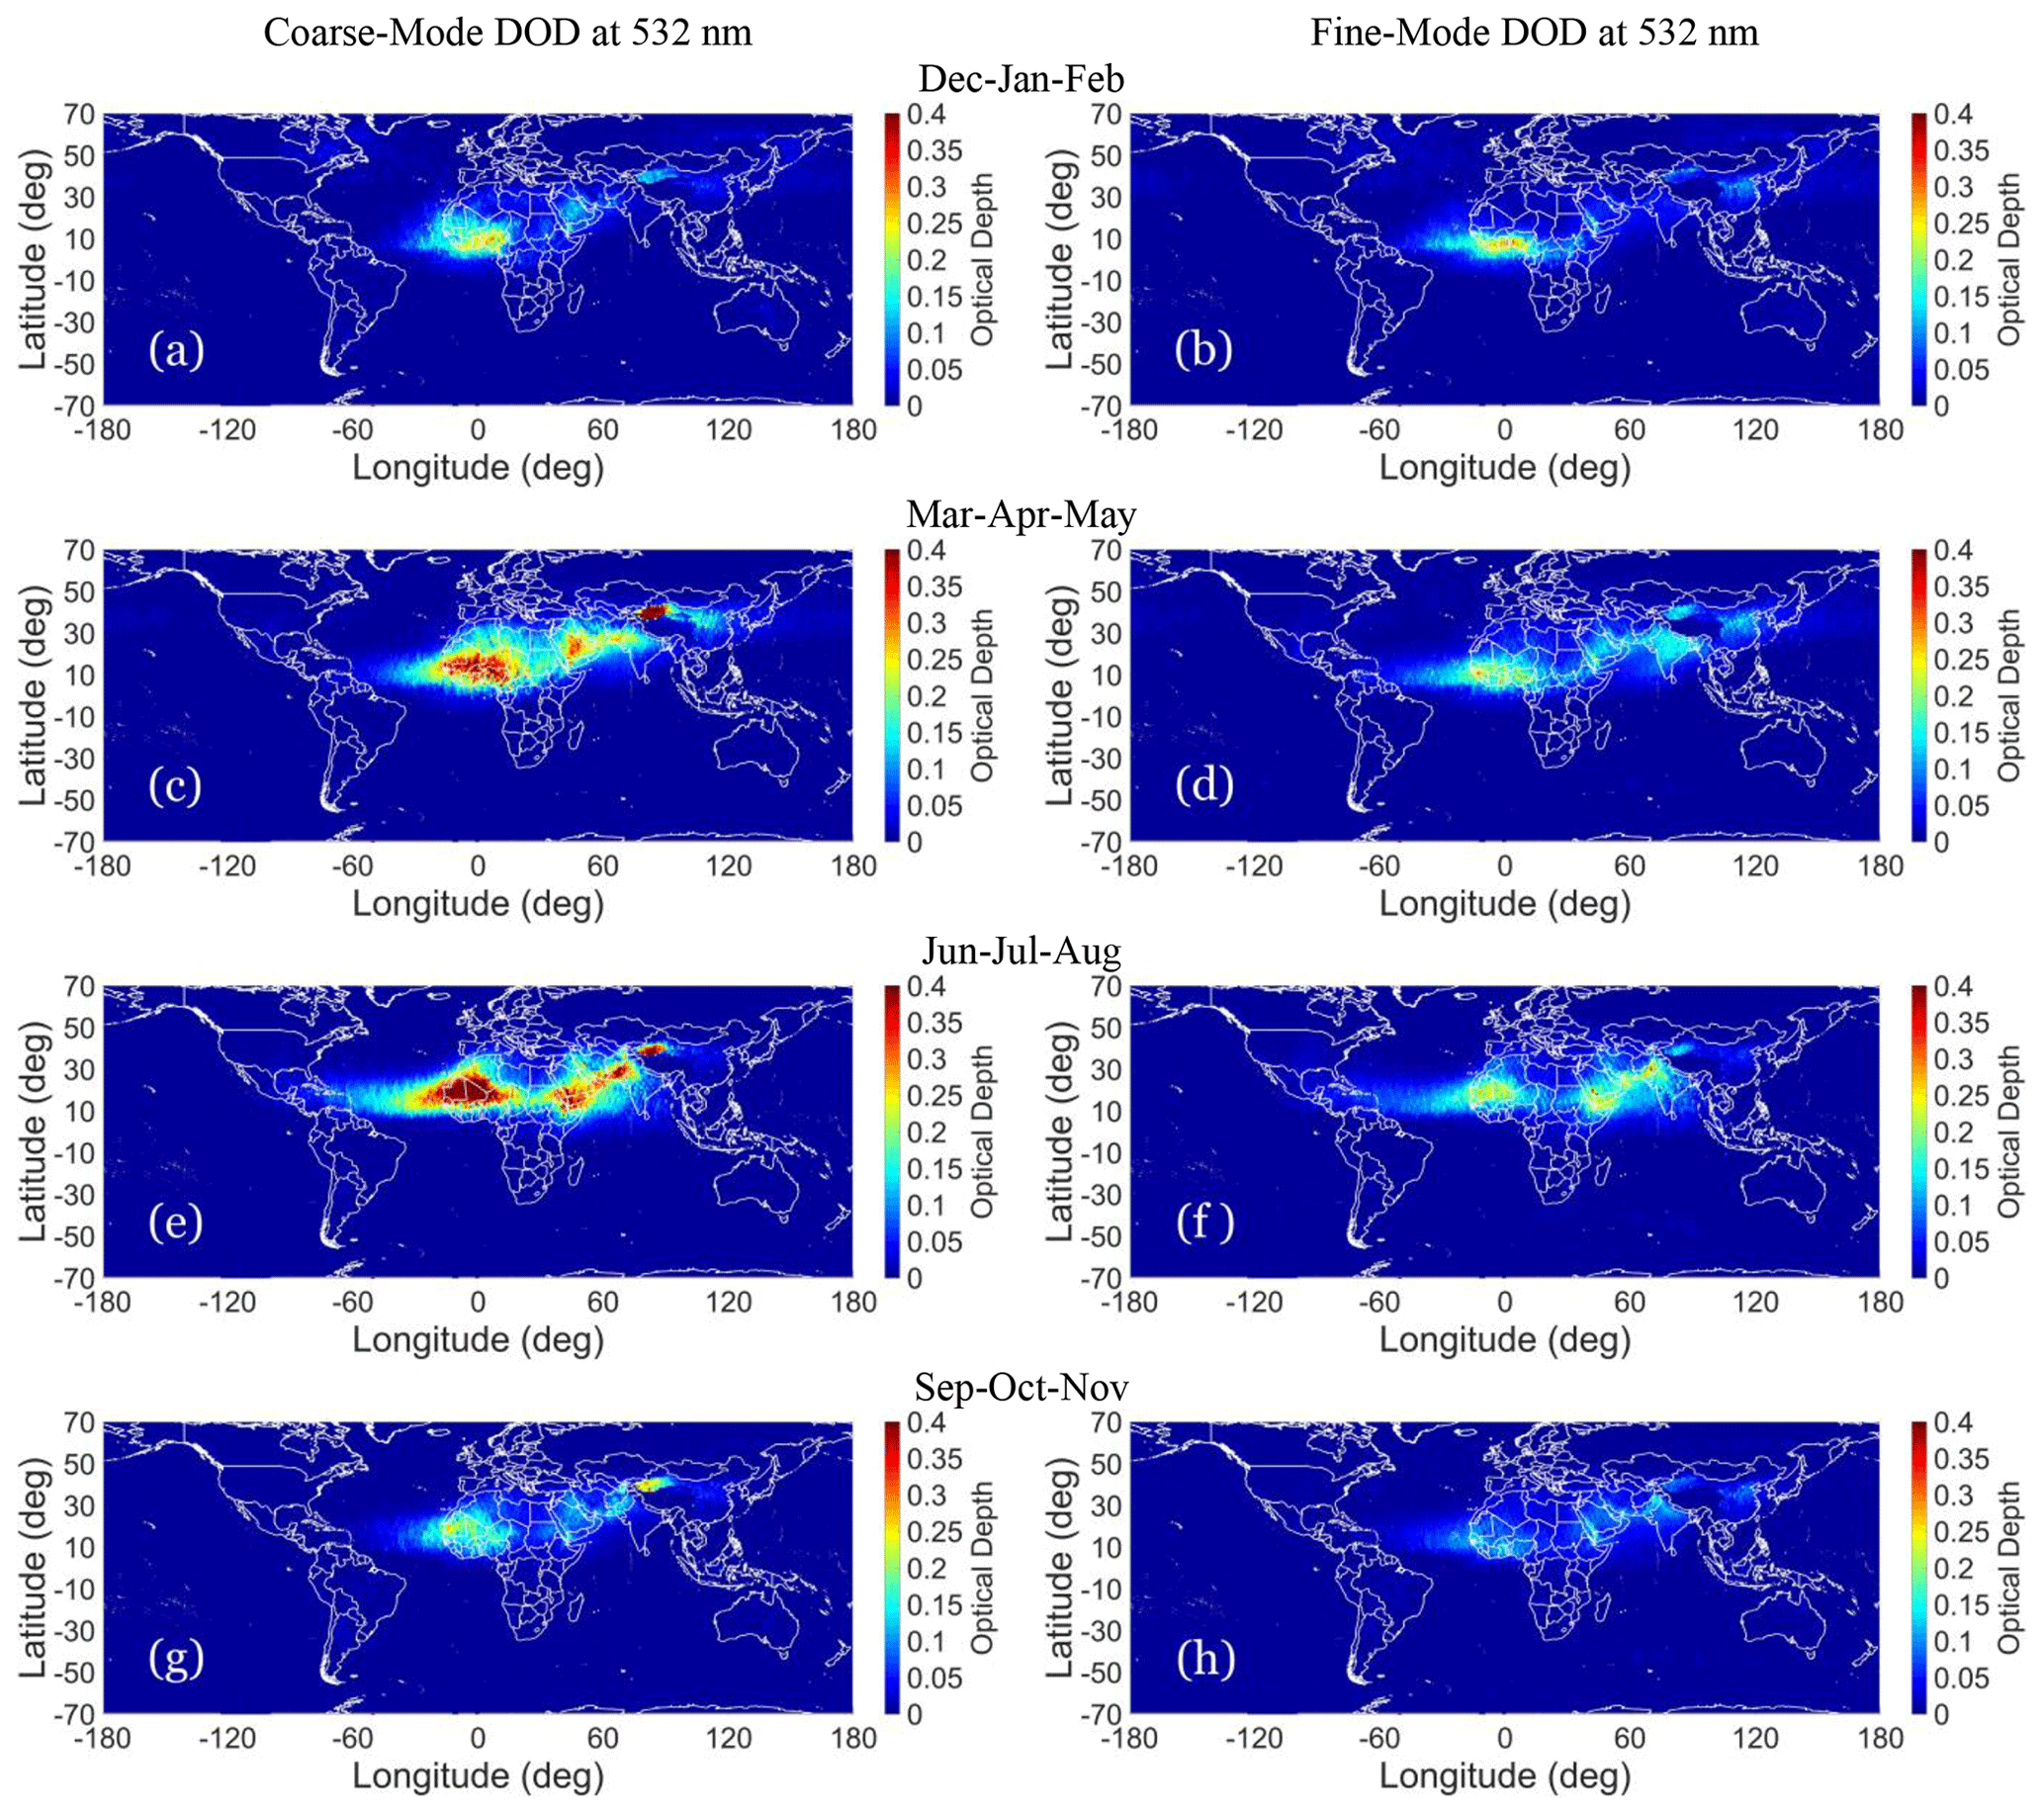
Figure 11Seasonal coarse-mode (left column) and fine-mode (right column) components of DOD at 532 nm, grouped for December–January–February (DJF) (a, b), March–April–May (MAM) (c, d), June–July–August (JJA) (e, f), and September–October–November (SON) (g, h).
Towards these objectives, a generic apparent feature is that the horizontal distributions of both the DODcoarse-mode and DODfine-mode are capable of efficiently delineating both the sources of dust and the dust transport pathways (Fig. 10c, d). Overall, well-documented geographical patterns are evident in all four seasons, and although between the fine-mode and coarse-mode DODs few differences in terms of spatial distribution are revealed, the observed features significantly vary in magnitude. In general, the most intense values of the coarse-mode and fine-mode components of DOD at 532 nm are observed over the desert areas of the planet and especially over the dust belt, though the extent of the observed features highly varies with regional meteorology and seasonality (Fig. 11).
The effects of the coarse-mode and fine-mode components of pure dust on optical depth, decoupled and isolated from the effect of all non-dust aerosol subtypes, are illustrated in Fig. 10c and d, respectively. In addition, Fig. 11 provides the seasonal coarse-mode (left column) and fine-mode (right column) components of DOD at 532 nm, grouped for December–January–February (DJF) (Fig. 11a, b), March–April–May (MAM) (Fig. 11c, d), June–July–August (JJA) (Fig. 11e, f), and September–October–November (SON) (Fig. 11g, h). The objective here is to provide and discuss, through the coarse-mode and fine-mode pure-dust products, characteristics of dust sources and transport, reporting at the same time noticeable features of the datasets.
With respect to the desert areas, the Sahara is characterized by particularly intense loads of dust persistently present in the atmosphere throughout the year, though of remarkable spatial and intra-annual variability. The expected west-to-east DOD gradient is apparent in both the DODcoarse-mode and DODfine-mode products, with higher values evident to the west and lower values to the east of the domain. More specifically, over the central and western parts of the desert substantially high annual mean DODcoarse-mode (∼ 0.3) and DODfine-mode (∼ 0.12) values are observed, while over the central-eastern parts of the desert significantly lower annual mean DODcoarse-mode (∼ 0.14) and DODfine-mode (∼ 0.06) values are evident (Fig. 10c, d). With respect to seasonality, remarkably intense loads of dust are observed primarily during JJA, as high as DODcoarse-mode ∼ 0.6 and DODfine-mode ∼ 0.25 (Fig. 11e, f), and secondarily during MAM, as high as DODcoarse-mode ∼ 0.39 and DODfine-mode ∼ 0.17 (Fig. 11c, d). In contrast, during DJF (Fig. 11a, b) and SON (Fig. 11g, h) remarkably less dust activity is evident, almost uniformly over the entire Saharan desert, with DODcoarse-mode and DODfine-mode values not exceeding ∼ 0.25 and ∼ 0.15, respectively. The particularly intense loads of dust observed over the Sahara, especially between March and August, are mainly attributed to the Saharan heat low and the West African monsoon system in spring and summer (Schepanski et al., 2017). At the same time, the latitudinal migration of the Intertropical Convergence Zone (ITCZ; Schneider et al., 2014) and the intensification of the trade winds (easterlies) favor the long-distance transport of massive loads of mineral dust aerosol across the tropical Atlantic Ocean within the SAL (Kanitz et al., 2014) as far as the Caribbean Sea (Prospero, 1999), as evident by both DODcoarse-mode and DODfine-mode products. Short-distance transport of fine-mode and coarse-mode dust layers originating from the Saharan desert is also evident, especially over the Mediterranean Sea (Gkikas et al., 2013, 2015, 2016, 2022; Marinou et al., 2017; Aslanoğlu et al., 2022) under the impact of cyclone formation at the Gulf of Genoa–North African coast (e.g., Trigo et al., 1999; Maheras et al., 2001), over the Gulf of Guinea in the south (Ben-Ami et al., 2009), and over the Red Sea in the east (Banks et al., 2017; Li et al., 2018).
With respect to the Middle East and central Asia, dust activity is more pronounced in the dust-belt region extending between the eastern parts of the Sahara and the Himalaya orographic barrier, a zone encompassing several major natural sources of dust, including the great Arabian Desert, the Thar Desert, and the arid and semi-arid regions of Ethiopia, Somalia, Iran, Iraq, and Afghanistan (Ginoux et al., 2012; Hamidi et al., 2013; Proestakis et al., 2018). These desert areas are clearly mapped through systematically high annual mean DODcoarse-mode (∼ 0.16) and DODfine-mode (∼ 0.11) values (Fig. 10c, d), though the observed features are subject to high spatial and intra-annual variability (Fig. 11). With respect to seasonality, remarkably intense loads of dust are observed primarily during JJA, as high as DOD coarse mode at ∼ 0.35 and DOD fine mode at ∼ 0.23 (Fig. 11e, f), and secondarily during MAM, as high as DOD coarse mode at ∼ 0.3 and DOD fine mode at ∼ 0.15 (Fig. 11c, d), although the activation mechanisms of the desert regions in the area differ (Prospero et al., 2002). More specifically, dust emission and transport over the Arabian Desert, Thar Desert, and the deserts of Ethiopia and Somalia are mainly attributed to west Indian monsoon activity (Vinoj et al., 2014), while the relatively limited emission and transport of dust layers over Dasht-e Lut Desert and the arid areas of Iran, Iraq, and Afghanistan are mainly attributed to convective episodes (Karami et al., 2017). With respect to the spatial variability, this zone is characterized by extensive inhomogeneities in the observed fine-mode and coarse-mode dust aerosol loads. Higher annual mean values are evident over the Arabian Peninsula and the Middle East mainland (DODcoarse-mode ∼ 0.15 and DODfine-mode ∼ 0.09), with lower values over the mainland of Southeast Asia and the broader Bay of Bengal (DODcoarse-mode ∼ 0.03 and DODfine-mode ∼ 0.04). In addition, the expected and evident west-to-east gradient in the pure-dust products is attributed primarily to increased wet deposition of dust aerosol particles during the monsoon season of the year and secondarily to gravitational settling (Lau et al., 1988). The long-range transport of dust is more evident during MAM (Fig. 11c, d) and JJA (Fig. 11e, f) pre-monsoon seasons (Dey et al., 2004), when dust plumes emitted into the atmosphere are carried as far as the Indo-Gangetic Plain and exceptionally as far as the Bay of Bengal (Mao et al., 2011; Proestakis et al., 2018; Ramaswamy et al., 2018).
To the east of the Himalaya orographic barrier, the dominant natural sources of mineral dust delineated by the fine-mode and coarse-mode pure-dust products are the very arid Taklimakan Desert in northwestern China (Liu et al., 2008; Ge et al., 2014) and the vast semi-arid Gobi Desert located eastwards in the same latitudinal band across northern China and Mongolia (Prospero et al., 2002; Gong et al., 2006; Proestakis et al., 2018). Over this zone of the dust belt, the favorable topographical features of the Tarim Basin and the strong midlatitude cyclonic systems which develop over the Mongolian Plateau (Bory et al., 2003; Yu et al., 2008) mobilize dust emission sources, resulting in uplift and formation of elevated dust layers, especially during the spring and summer seasons (Proestakis et al., 2018), evident also by the high values of DODcoarse-mode (∼ 0.3) and DODfine-mode (∼ 0.1). The dust layers suspended in the atmosphere are accordingly captured by the strong westerly jet in the upper troposphere and transported over the eastern Asia region (Zhang et al., 2003; Yu et al., 2019), across the broader northern Pacific Ocean (Duce et al., 1980; Shaw, 1980; Yu et al., 2008), and exceptionally as far as the western coast of the United States (Husar et al., 2001). In contrast, during DJF (Fig. 11a, b) and SON (Fig. 11g, h) remarkably more limited dust activity is evident, almost uniformly over the entire East Asia region, as also shown by the pure-dust products, with DODcoarse-mode and DODfine-mode values not exceeding ∼ 0.25 and ∼ 0.14, respectively.
In addition to the dust-belt arid and semi-arid areas stretching from the Sahara through the Middle East and central Asia to the Taklimakan and Gobi deserts of East Asia, several other natural sources of dust are delineated and revealed by the pure-dust products, though of lower dust emission strength comparable to the major deserts of the planet. Such areas include the Mojave and Sonoran deserts in the southwestern United States–northwestern Mexico (Hand et al., 2017), and the Australian (Prospero et al., 2002), as well as southern Africa (Bryant et al., 2007) and South America (Gassó and Torres, 2019) desert areas located in the Southern Hemisphere. In contrast to the major sources of dust, over these areas remarkably more limited dust load is observed, with annual mean DODcoarse-mode and DODfine-mode values not exceeding ∼ 0.03 and ∼ 0.02, respectively.
Finally, two more noticeable features are worth mentioning. The first one relates to the preferential removal of larger dust particles during long-range transport, evident in both the CMF (Fig. 10e) and the FMF (Fig. 10f). In terms of optical depth, close to the major natural dust sources, the supermicrometer component contributes ∼ 70 % of the total dust load, falling to ∼ 40 % following removal processes during long-range transport of dust layers over distances of thousands of kilometers. This apparent feature corroborates outcomes of the SALTRACE campaign, reporting that the fraction of removed dust particles is size-dependent, shape-dependent, and increases with increasing particle size (Weinzierl et al., 2016). The second one relates to the sharp decrease (increase) in the CMF (FMF) over densely populated and heavily industrialized areas of the globe (i.e., Indian Peninsula, China, and the broader South and East Asia region). Although subject to extended scientific discussion and hard to quantify, the current consensus is that atmospheric dust is composed of natural dust (∼ 75 %) and anthropogenic dust (∼ 25 %), a categorization established on the basis of dust sources and emission mechanisms (Penner et al., 1994; Tegen and Fung, 1995; Ginoux et al., 2012). More specifically, anthropogenic activity over erodible soils or areas of little vegetation results in locally emitted anthropogenic dust into the atmosphere, mainly confined within the PBL. The contribution of anthropogenic dust over areas of major anthropogenic activity results in perturbations of atmospheric dust accumulation load compared to the surrounding areas affected mainly by long-range transport of dust, a feature apparent in the modification of the fine-mode and coarse-mode to pure-dust fractions over the regions of extensive anthropogenic activity (Fig. 10e, f).
4.2 Vertical distribution and temporal evolution
Emphasis in this climatology of the established products, however, is not only on the horizontal distribution of the fine-mode and coarse-mode components of pure dust, as provided in terms of DODfine-mode and DODcoarse-mode at 532 nm, respectively (Figs. 10 and 11). The most unique information provided by CALIOP is the vertical structure of atmospheric constituents detected along the CALIPSO orbit path. Vertically averaging all the CALIPSO-based L2 grid-aggregated quality-screened backscatter coefficients at 532 nm, extinction coefficients at 532 nm, and mass concentration profiles of the two modes within each grid of spatial resolution 1° × 1° over a time period of interest (e.g., of annual, seasonal, or monthly temporal resolution) provides, in addition to the horizontal distribution, the vertical distribution and temporal evolution of the two modes and allows the datasets to be established under a four-dimensional database. This capacity of the established products is illustrated in Fig. 12 based on the case study of the broader Indian subcontinent and the New Delhi megacity area. More specifically, Fig. 12 provides the vertical structure of the coarse-mode (left column) and fine-mode (right column) components of atmospheric pure dust through long-term (15.5 years) annual mean mass concentration cross-sections over the Indian Peninsula (Fig. 12a, b) and time series of the temporal evolution of the coarse-mode (Fig. 12c) and fine-mode (Fig. 12d) pure-dust components in terms of seasonal mean mass concentration profiles over the New Delhi megacity area for the period June 2006–December 2021. Based on the four-dimensional (4D) reconstruction of the atmosphere in terms of fine-mode and coarse-mode pure-dust components, as illustrated in Fig. 12, several interesting characteristics of atmospheric dust are revealed, especially with respect to emission sources and transport in both the FT and the PBL.
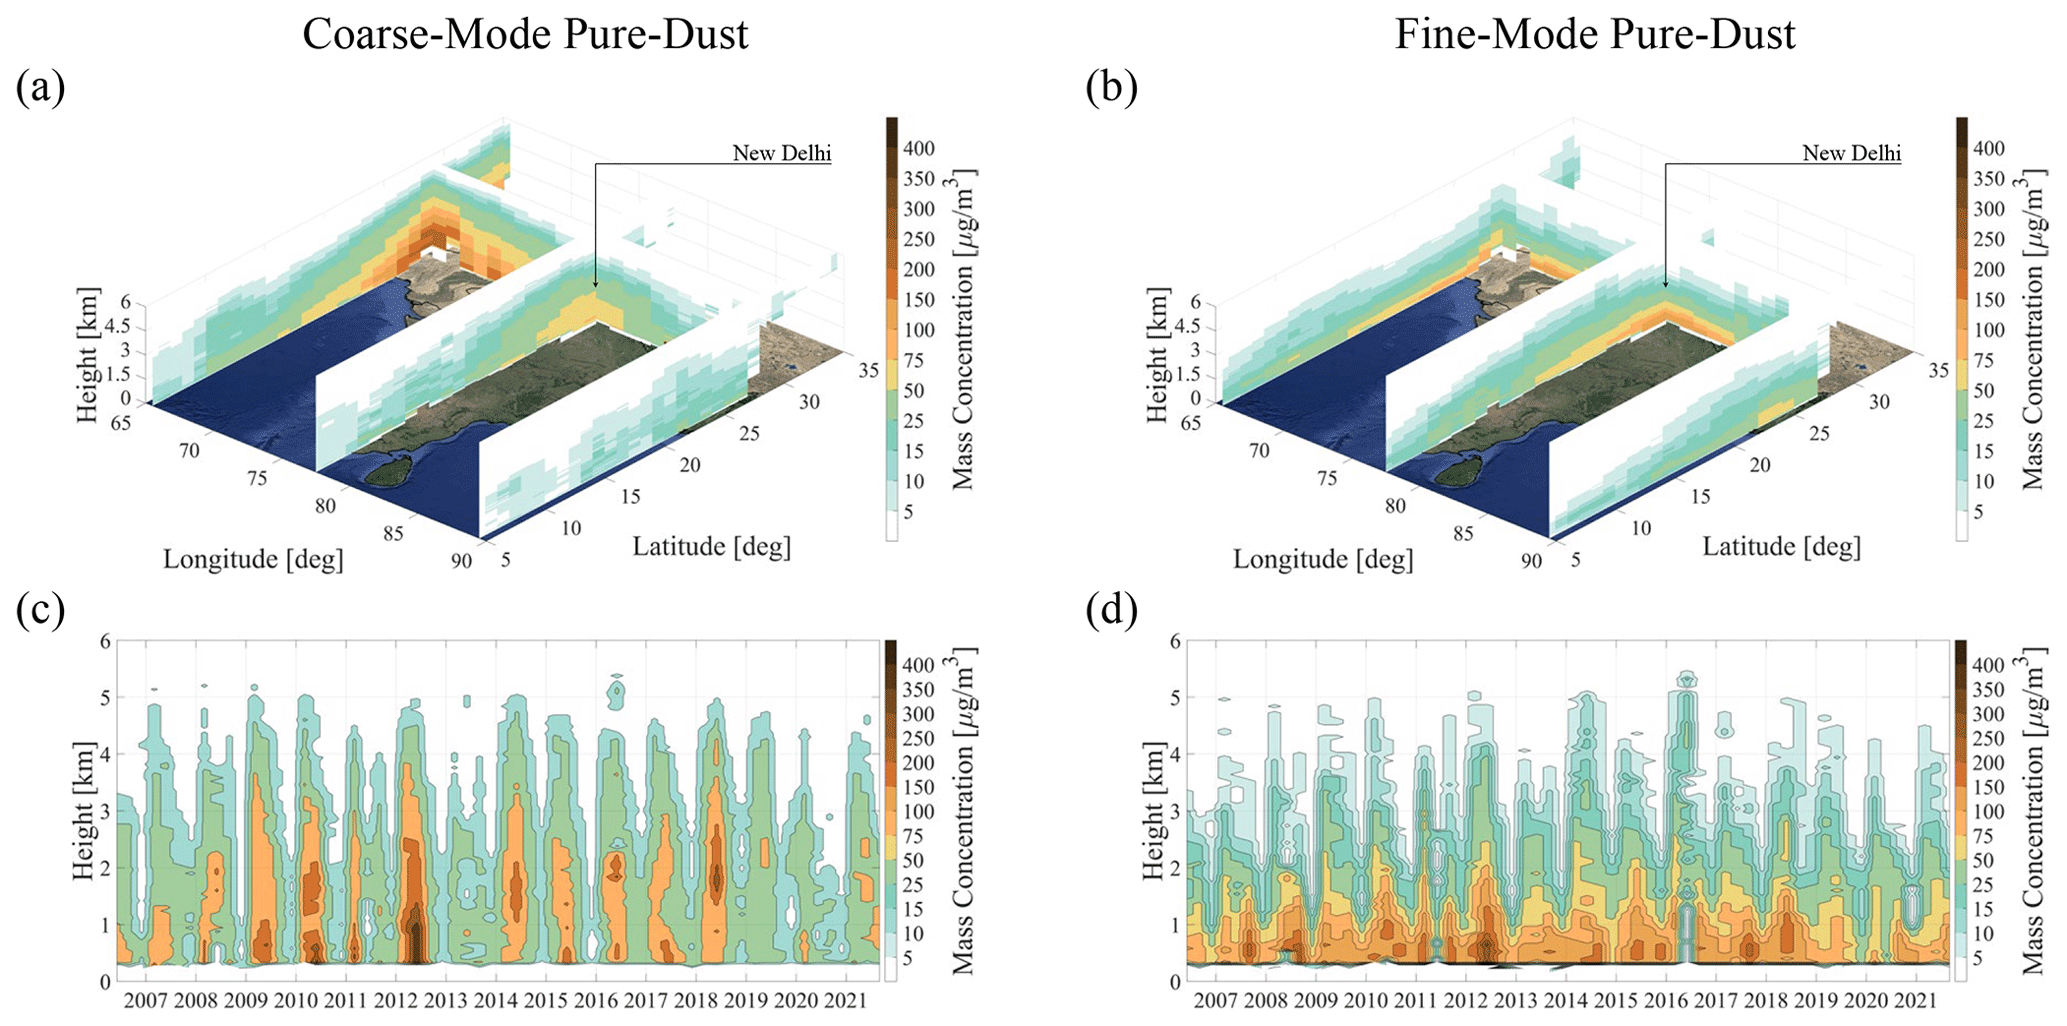
Figure 12Coarse-mode (a) and fine-mode (b) pure-dust annual mean mass concentration cross-sections over the Indian Peninsula (lat: 28.5° N – long: 76.5° E – June 2006–December 2021) and seasonal mean mass concentration time series over the New Delhi megacity area (lat: 27–29° N – long: 76–78° E) for the coarse mode (c) and fine mode (d). Layer background: © Google Maps.
With respect to dust layers in the free troposphere, the Indian subcontinent is largely affected by the major sources of dust located to the west of the peninsula, including, among others, the great Arabian, Dasht-e Lut, and Thar deserts (Hamidi et al., 2013; Proestakis et al., 2018; Gkikas et al., 2022). The layers of dust in the free troposphere are mainly observed during the pre-monsoon season (Dey et al., 2004), more specifically during MAM (Fig. 11c, d) and JJA (Fig. 11e, f), mainly attributed to west Indian pre-monsoon activity (Vinoj et al., 2014) when dust plumes emitted into the atmosphere are carried as far as the Indo-Gangetic Plain and exceptionally as far as the Bay of Bengal (Mao et al., 2011; Proestakis et al., 2018; Ramaswamy et al., 2018). This seasonality of long-range transport of dust layers over India, originating from the major deserts located to the west of the peninsula, is revealed by both the supermicrometer and the supermicrometer modes of atmospheric pure dust in terms of seasonal mean mass concentration profiles over the New Delhi megacity area, with higher values observed during the pre-monsoon period (Fig. 12c, d). However, in the case of the coarse-mode pure-dust product, an almost clear wave-like seasonal variation is revealed (Fig. 12c). Moreover, due to the proximity of the New Delhi area to the major desert dust sources to the west, primarily the Thar Desert and secondarily Dasht-e Lut, dust aerosol transport over this area is revealed to take place not only in the free troposphere but also in the PBL. In addition, although the long-range transport of dust layers of natural origin occurs mainly in the free troposphere, a fraction of this dust due to gravitational settling is expected to enter the PBL. Overall, the coarse-mode pure-dust product yields an annual mean mass concentration of 53.94 ± 16.98 µg m−3 for the New Delhi megacity area, as computed based on the lower 1500 m of the atmosphere. Similarly computed, the coarse-mode pure-dust mass concentration over the New Delhi area is estimated for DJF to be equal to 19.08 ± 5.36 µg m−3, for MAM 86.88 ± 18.72 µg m−3, for JJA 114.11 ± 11.35 µg m−3, and for SON 47.44 ± 10.15 µg m−3 (Table 7).
Table 7Annual and seasonal mean, median, and SD of the coarse-mode and fine-mode components of pure dust within the lowest 1.5 km of the atmosphere in the New Delhi megacity area, including the percentage of cases in which the pure-dust fine-mode mean mass concentration exceeds WHO AQGs for the PM2.5 24 h mean.
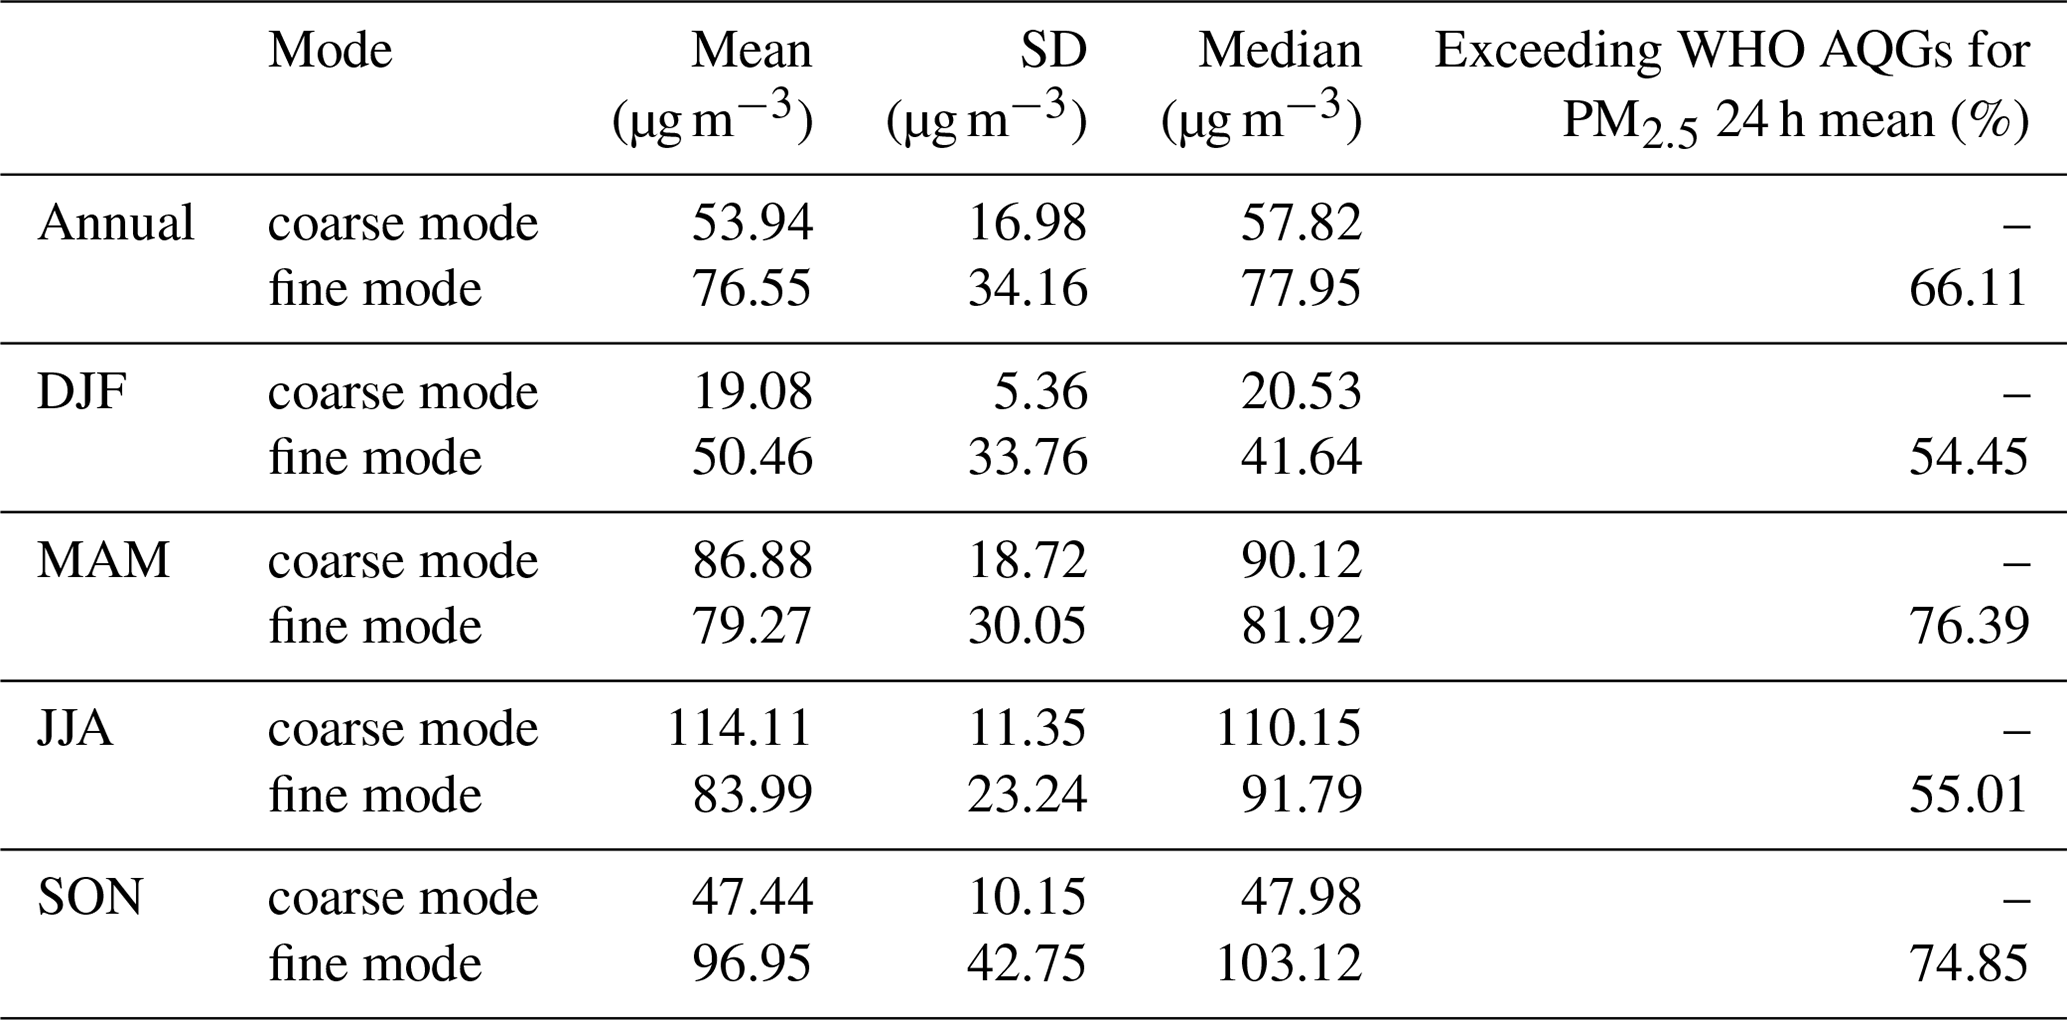
With respect to dust layers in the PBL, however, atmospheric dust is the net contribution of dust particles emitted and transported from areas outside the region of interest and dust particles emitted from within the region of interest, resulting in increased complexity with respect to atmospheric aerosol features. More specifically, the current consensus is that atmospheric dust is categorized into natural dust and anthropogenic dust, a classification established on the basis of dust sources and emission mechanisms (Penner et al., 1994; Tegen and Fung, 1995). Natural dust is suspended in the atmosphere by mechanisms that involve dust devils (Koch and Renno, 2005), haboobs (Knippertz et al., 2007), pressure gradients (Klose et al., 2010), and low-level jets (LLJs; Fiedler et al., 2013), developed over dry and unvegetated desert regions (Prospero et al., 2002). Anthropogenic dust is related directly and/or indirectly to human activity, involving, among others, transportation, infrastructure, building and road construction (Moulin and Chiapello, 2006; Chen et al., 2018), deterioration of extended soil surfaces, and changes in land use due to deforestation, grazing (Ginoux et al., 2012), urbanization, and agriculture (Tegen et al., 1996). According to studies, the magnitude of atmospheric dust classified as anthropogenic is significant. Ginoux et al. (2012) reported that on a global scale ∼ 25 % of the total dust load is of anthropogenic origin. Recent studies report that over densely populated and heavily industrialized urban areas of developing countries anthropogenic dust accounts for as much as ∼ 70 % of the total dust load (Huang et al., 2015; Chen et al., 2019). Over the Indian Peninsula, the presence of anthropogenic dust is corroborated by long-term near-surface in situ measurements of PM2.5 conducted in the framework of the Surface PARTiculate mAtter Network (SPARTAN; https://www.spartan-network.org/; last access: 14 August 2023). More specifically, SPARTAN measurements over several megacities in the broader region of the Indian Peninsula (Delhi and Kanpur, India; Dhaka, Bangladesh) report crustal material of high zinc (Zn) to aluminum (Al) ratios present in PM2.5 in situ measurements (Snider et al., 2015, 2016). Zn is mainly of anthropogenic origin (Councell et al., 2004; Begum et al., 2010), whereas Al is mainly of natural origin (Zhang et al., 2006). As such, the high Zn : Al ratios detected in crustal materials are a clear indicator that a high percentage of fine-mode dust suspended within the PBL is of anthropogenic origin (Snider et al., 2015, 2016).
Overall, the fine-mode pure-dust product yields an annual mean mass concentration of 76.55 ± 34.16 µg m−3, for the New Delhi megacity area, as computed based on the lower 1500 m of the atmosphere and based on more than 15 years of Earth observations. Similarly computed, the fine-mode pure-dust mass concentration over the New Delhi area is estimated for DJF to be equal to 50.46 ± 33.76 µg m−3, for MAM 79.27 ± 30.05 µg m−3, for JJA 83.99 ± 23.24 µg m−3, and for SON 96.95 ± 42.75 µg m−3 (Table 7). Moreover, it is estimated that in the New Delhi area the fine-mode pure-dust mass concentration values – approximately 2 d out of 3 – exceed the World Health Organization (WHO) Air Quality Guidelines (AQGs) for the PM2.5 24 h mean (https://www.who.int/publications-detail-redirect/WHO-SDE-PHE-OEH-06-02, last access: 23 August 2023).
The reported two-mode pure-dust mass concentration product tackles several challenges, especially with respect to potential applications in addressing the impact of dust on human health. To date, studies aiming to explore the negative effects of dust on air quality and human health frequently rely on passive remote sensing (De Longueville et al., 2010; Deroubaix et al., 2013; Katra et al., 2014; Prospero et al., 2014). However, it is considered particularly challenging to retrieve the elevation and extent of dust aerosol layers residing in the atmosphere by means of passive remote sensing, hampering the ability to resolve the dust load within the PBL with high accuracy, where the main anthropogenic activity takes place. Even more significant is the fact that the majority of dust-related health disorders and their intensity depend primarily on dust PSD and secondarily on the total load of dust. More specifically, only the fine mode of dust particles is inhalable deep into the lungs and alveoli, increasing morbidity and mortality rates among populations (Brook et al., 2010; Martinelli et al., 2013; Goudie, 2014). Recent studies reveal that the size distribution of airborne dust particles ranges from 0.1 to more than 100 µm in diameter (Weinzierl et al., 2016; Ryder et al., 2018), also reflecting the limitations of addressing the impact of dust on induced health disorders by means of integrated parameters corresponding to the entire PSD, since only the inhalable component of dust is of high significance for air quality. Finally, atmospheric aerosol models extensively used to provide supporting spatiotemporal information on dust emission, transport, deposition, and vertical structure (Textor et al., 2006; Astitha et al., 2012; Randles et al., 2017; Inness et al., 2019) usually employ static land cover types to classify arid and semi-arid regions as dust sources (Ginoux et al., 2001). However, the implementation of static emission inventories leads to large uncertainties, especially with regard to non-considered anthropogenic dust emission fluxes (Ginoux et al., 2012) over highly industrialized and densely populated regions of the Earth, leading to underestimations of the risk factor of dust impact on human health. Thus, the fine-mode pure-dust product established here is considered of paramount importance, since it offers pure observational evidence on the fine-mode component of dust residing within the PBL and over extended geographical regions and temporal periods, thus enhancing our EO-based capacity to assess and understand the complex role of inhalable dust particles in induced disorders on human health.
A new multiyear and near-global reconstruction of the Earth's atmosphere, in terms of fine-mode and coarse-mode components of atmospheric pure dust, is provided. The primary datasets consist of the submicrometer (particles with diameter less than 1 µm) and supermicrometer (particles with diameter greater than 1 µm) modes of atmospheric pure dust, provided in quality-assured profiles of (1) backscatter coefficient at 532 nm, (2) extinction coefficient at 532 nm, and (3) mass concentration, with the original L2 horizontal (5 km) and vertical (60 m) resolution of CALIOP along the CALIPSO orbit path (Winker et al., 2009). Further processing of all CALIPSO-based L2 quality-screened profiles of the backscatter coefficient at 532 nm, extinction coefficient at 532 nm, and mass concentration of fine-mode and coarse-mode pure dust within a pre-defined grid (e.g., here of spatial resolution 1° × 1°) and over a selected time period of interest (e.g., here of annual and seasonal temporal resolution) allows the primary datasets to be established under a four-dimensional climate data record and synergistically to provide the horizontal distribution, vertical distribution, and temporal evolution of the two modes of atmospheric pure dust.
There are three main enablers that lie behind the established fine-mode and coarse-mode pure-dust database. The first one lies in laboratory studies reporting on the distinct light-depolarizing properties of the submicrometer and supermicrometer modes of pure dust (Sakai et al., 2010; Järvinen et al., 2016) and that allows the separation of the two components from depolarization lidar. The second one lies in the well-established family of POLIPHON algorithms, more specifically the potential of the one-step POLIPHON method to decouple the pure-dust component from the total aerosol load (Shimizu et al., 2004; Tesche et al., 2009) and the potential of the two-step POLIPHON method to decouple the two modes of pure dust (Mamouri and Ansmann, 2014, 2017; Ansmann et al., 2019). The third and final one lies in the simplicity of the pure-dust retrieval algorithms. Straightforward and applicable to single-wavelength lidar observations, the algorithms can be utilized in satellite-based EO as long as the profiles of backscatter coefficient and particulate depolarization ratio are provided. To date, the pure-dust decoupling methodology (Shimizu et al., 2004; Tesche et al., 2009) has been applied to the development of a robust, multiyear, four-dimensional, and near-global pure-dust dataset, established in the framework of the ESA-LIVAS database (Amiridis et al., 2013, 2015; Marinou et al., 2017; Proestakis et al., 2018), demonstrating the feasibility of applying polarization-based algorithms to satellite-based EO products.
Motivated by these studies, the present work provides, for the first time, a multiyear near-global four-dimensional representation of the fine-mode and coarse-mode components of atmospheric pure dust. To this point, the work includes an overview of the methodology, assumptions, and adaptations made, primarily in order to facilitate the applicability of the technique to CALIPSO–CALIOP and ISS-CATS optical products and special characteristics and secondarily to allow the implementation of the ESA-LIVAS pure-dust product without introducing ambiguities to the developed datasets. Overall, the core concept of the applied methodology evolves around the assumption that the fine-mode pure-dust backscatter coefficient at 532 nm is the residual between the ESA-LIVAS pure-dust backscatter coefficient at 532 nm (Amiridis et al., 2013, 2015; Marinou et al., 2017; Proestakis et al., 2018), decoupled from the total aerosol load based on the pure-dust decoupling methodology (Shimizu et al., 2004; Tesche et al., 2009), and the pure-dust coarse-mode backscatter coefficient at 532 nm, decoupled from the total aerosol load based on the first-step of the two-step POLIPHON (Mamouri and Ansmann, 2014, 2017). Accordingly, the study implements suitable regionally dependent lidar-derived pure-dust LRs to convert the total, fine-mode, and coarse-mode pure-dust profiles of backscatter coefficient at 532 nm to total, fine-mode, and coarse-mode pure-dust profiles of extinction coefficient at 532 nm along the CALIPSO orbit path at uniform 5 km horizontal and 60 m vertical resolution. As a follow-up step, the obtained total and coarse-mode extinction coefficient profiles are converted into respective mass concentration profiles through the implementation of characteristic regionally dependent volume concentration conversion factors (Ansmann et al., 2019). As a final step, the fine-mode pure-dust mass concentration profiles are extracted as the residual between the total pure-dust mass concentration profiles and the coarse-mode pure-dust mass concentration profiles.
The quality of the dust products is established by using AERONET fine-mode and coarse-mode AOTs converted at 532 nm and AER-D campaign airborne in situ aerosol size distributions as reference datasets during atmospheric conditions characterized by dust presence. More specifically, match-up reference datasets used as a basis to ensure the assessment of the range of validity and robustness of the products include both existing climatologies and in situ field campaign observations. As a first step, the CALIPSO-based DODcoarse and DODfine at 532 nm products were evaluated against AERONET AOTcoarse and AOTfine at 532 nm retrievals. Evaluation was conducted for identified cases dominated by the presence of dust, as reported by the ESA-LIVAS pure-dust product. With respect to the submicrometer category, fairly good agreement between the two datasets was revealed (slope: 0.652, offset: 0.018, Pearson's correlation coefficient: 0.692), although a strong tendency of increasing fine-mode pure-dust underestimation with increasing dust aerosol load was also apparent. With respect to the supermicrometer category, the analysis revealed substantially better agreement between the two datasets (slope: 0.779, intercept: −0.002, Pearson's correlation coefficient: 0.916). As a second step, the AER-D FAAM b920 research flight conducted on 7 August 2015 with the objective of performing highly spatially and temporarily coordinated measurements with the CATS lidar on board the ISS was utilized. The case is ideal for establishing the quality of the satellite-based lidar fine-mode and coarse-mode pure-dust mass concentration products and assessing their accuracy due to (1) the implementation of both remote sensing and in situ airborne measurements by FAAM b920, (2) the collocated FAAM underflight of the ISS orbit track, and (3) the significant presence of atmospheric dust within the SAL. The comparison against the airborne in situ PSD revealed that the developed fine-mode and coarse-mode mass concentration profile products have the capacity to provide, both qualitatively and quantitatively, the structure of atmospheric dust layers in terms of the two dust modes. With respect to the supermicrometer category, agreement within 10 % (and well within the uncertainties) was revealed between the coarse-mode pure-dust mass concentration product (163.3 ± 31.8 µg m−3) and the reference in situ supermicrometer mass concentration (149.4 ± 55.2 µg m−3). With respect to the submicrometer category, the fine-mode pure-dust mass concentration product was underestimated (2.3 ± 0.4 µg m−3) at ∼ 58 % lower than the airborne in situ fine-mode mass concentration (5.4 ± 2.1 µg m−3) in the SAL, while the performance was substantially better in the MBL region. The overall good performance of the decoupling methodology is further corroborated by the fine-mode to total mass concentration fraction, being in good agreement and of the same order of magnitude (CATS: ∼ 1.4, b920 in situ: ∼ 3.5).
The demonstration of the fine-mode and coarse-mode climatological database involved two main discussion aspects. The first one aimed to present and briefly discuss the capacity of the established database to provide the horizontal distribution of the fine-mode and coarse-mode components of pure dust in terms of optical depth. Towards this objective, the annual and seasonal DODcoarse-mode and DODfine-mode patterns at a near-global scale (70° S–70° N) and for the period extending between June 2006 and December 2021 were discussed. The second one aimed to illustrate the potential of the established datasets to reveal the full four-dimensional structure of the two modes of dust (horizontal, vertical, temporal) based on the Delhi megacity as part of the broader Indian Peninsula. For this purpose, annual mean cross-sections and the seasonal mean temporal evolution of the two modes of pure dust, in terms of mass concentration profiles, were discussed. Overall, the cases demonstrated the potential of the fine-mode and coarse-mode pure-dust products (1) to reveal the natural and anthropogenic sources of dust, (2) to both qualitatively and quantitatively describe the three-dimensional evolution of dust in the atmosphere from source to sink, (3) to efficiently provide the seasonal activation cycle of dust source regions, and (4) to show the seasonal shift and four-dimensional transition of dust transport pathways.
The present work aims, through the presented fine-mode and coarse-mode pure-dust datasets, to contribute to the next generation of atmospheric aerosol geo-information products. Future work includes further optimization of the fine-mode and coarse-mode pure-dust climate database through revision of the basic assumptions (i.e., DeLiAn database; Floutsi et al., 2023), while the long-term overarching objective is the development of a novel and unprecedented climate data record of the two modes of dust suspended in the atmosphere through the integration of the fine-mode and coarse-mode dust products derived by future Earth Explorer satellite missions (i.e., ESA EarthCARE and NASA AOS I1/I2/P1). At present, the CALIPSO-based near-global datasets cover a multiyear period spanning between June 2006 and December 2021. Exploitation of the dust datasets facilitates – among others – dust climatological studies, time series, and trend analysis over extensive geographical domains, validation of atmospheric dust models and reanalysis datasets, assimilation activities, investigation of the role of airborne dust in radiation, quantification and decoupling of the natural-anthropogenic dust system, and an advanced database to address the effect of the inhalable component of airborne dust on air quality. Overall, the present database envisages providing a support system that will allow advancements in our EO-based capacity to assess and understand the impact of dust on climate, environmental conditions, and human health under ongoing climate change.
The CALIPSO lidar level 1B and level 2 data products are publicly available from the Atmospheric Science Data Center at NASA Langley Research Center (https://earthdata.nasa.gov/eosdis/daacs/asdc, Earthdata, 2023). The FAAM aircraft datasets collected during the AER-D campaign are available from the British Atmospheric Data Centre, Centre for Environmental Data Analysis (http://www.ceda.ac.uk/, CEDA, 2023). CATS browsed images and data products are freely distributed via the CATS website at https://search.earthdata.nasa.gov/search?q=CATS (Earthdata, 2024). The LIVAS pure-dust database is available upon personal communication with Emmanouil Proestakis (proestakis@noa.gr), Eleni Marinou (elmarinou@noa.gr), and/or Vassilis Amiridis (vamoir@noa.gr). The L2 pure-dust fine-mode and coarse-mode dataset is available at https://doi.org/10.5281/zenodo.10389741 (Proestakis, 2023).
EP designed the study. AG treated AERONET data and provided assistance on interpretation of the validation outcomes. TG provided critical assistance in algorithm development and processing. AK provided FLEXPART back-trajectory analysis and interpretation of outcomes. ED provided assistance in the treatment of airborne observations. CLR and FM provided the data from the airborne in situ measurements. VA, EM, and EP provided the LIVAS dataset and helped in interpretation of the results. EP wrote the paper. EP, AG, and TG developed the codes. EP and AG analyzed the results. AG, TG, AK, ED, CLR, FM, EM, and VA provided critical feedback and reviewed and edited the paper.
At least one of the (co-)authors is a member of the editorial board of Atmospheric Measurement Techniques. The peer-review process was guided by an independent editor, and the authors also have no other competing interests to declare.
Publisher's note: Copernicus Publications remains neutral with regard to jurisdictional claims made in the text, published maps, institutional affiliations, or any other geographical representation in this paper. While Copernicus Publications makes every effort to include appropriate place names, the final responsibility lies with the authors.
Emmanouil Proestakis acknowledges support by the AXA Research Fund for postdoctoral researchers under the project entitled “Earth Observation for Air-Quality – Dust Fine-Mode (EO4AQ-DustFM)”. We would like to thank the NASA CALIPSO team and NASA, LaRC, and ASDC for making the CALIPSO products available, which have been extensively used in the present study. We would like to thank the ESA for supporting the LIVAS developments (contract no. 4000104106/11/NL/FF/fk). We thank the PANhellenic GEophysical observatory of Antikythera (PANGEA) for providing access to the LIVAS data used in this study and their computational center. Claire L. Ryder was funded by NERC grant NE/M018288/1. Antonis Gkikas acknowledges support by the Hellenic Foundation for Research and Innovation (H.F.R.I.) under the “2nd Call for H.F.R.I. Research Projects to support Post-Doctoral Researchers” (project acronym: ATLANTAS, project number: 544). Airborne data were obtained using the United Kingdom BAe-146 Atmospheric Research Aircraft, which at the time was flown by Directflight Ltd., managed by the Facility for Airborne Atmospheric Measurements (FAAM), and was a joint entity of the Natural Environment Research Council (NERC) and the Met Office. The staff of the Met Office Observation-Based Research team, the universities of Leeds, Manchester, and Hertfordshire, FAAM, Directflight Ltd., Avalon Engineering, and BAE Systems are thanked for their dedication in making AER-D a success.
This research has been supported by the AXA Research Fund (Earth Observation for Air-Quality – Dust Fine-Mode (EO4AQ-DustFM)), ESA (contract no. 4000104106/11/NL/FF/fk), NERC (grant no. NE/M018288/1), and the Hellenic Foundation for Research and Innovation (H.F.R.I.) under the “2nd Call for H.F.R.I. Research Projects to support Post-Doctoral Researchers” (project acronym: ATLANTAS, project number: 544).
This paper was edited by Ulla Wandinger and reviewed by two anonymous referees.
Adebiyi, A., Kok, J. F., Murray, B. J., Ryder, C. L., Stuut, J.-B. W., Kahn, R. A., Knippertz, P., Formenti, P., Mahowald, N. M., Pérez García-Pando, C., Klose, M., Ansmann, A., Samset, B. H., Ito, A., Balkanski, Y., Di Biagio, C., Romanias, M. N., Huang, Y., and Meng, J.: A review of coarse mineral dust in the Earth system, Aeolian Res., 60, 100849, https://doi.org/10.1016/j.aeolia.2022.100849, 2023.
Adebiyi, A. A. and Kok, J. F.: Climate models miss most of the coarse dust in the atmosphere, Sci. Adv., 6, eaaz9507, https://doi.org/10.1126/sciadv.aaz9507, 2020.
Albrecht, B. A.: Aerosols, Cloud Microphysics, and Fractional Cloudiness, Science, 245, 1227–1230, https://doi.org/10.1126/science.245.4923.1227, 1989.
Amiridis, V., Balis, D. S., Kazadzis, S., Bais, A., Giannakaki, E., Papayannis, A., and Zerefos, C.: Four-year aerosol observations with a Raman lidar at Thessaloniki, Greece, in the framework of European Aerosol Research Lidar Network (EARLINET), J. Geophys. Res.-Atmos., 110, D21203, https://doi.org/10.1029/2005JD006190, 2005.
Amiridis, V., Wandinger, U., Marinou, E., Giannakaki, E., Tsekeri, A., Basart, S., Kazadzis, S., Gkikas, A., Taylor, M., Baldasano, J., and Ansmann, A.: Optimizing CALIPSO Saharan dust retrievals, Atmos. Chem. Phys., 13, 12089–12106, https://doi.org/10.5194/acp-13-12089-2013, 2013.
Amiridis, V., Marinou, E., Tsekeri, A., Wandinger, U., Schwarz, A., Giannakaki, E., Mamouri, R., Kokkalis, P., Binietoglou, I., Solomos, S., Herekakis, T., Kazadzis, S., Gerasopoulos, E., Proestakis, E., Kottas, M., Balis, D., Papayannis, A., Kontoes, C., Kourtidis, K., Papagiannopoulos, N., Mona, L., Pappalardo, G., Le Rille, O., and Ansmann, A.: LIVAS: a 3-D multi-wavelength aerosol/cloud database based on CALIPSO and EARLINET, Atmos. Chem. Phys., 15, 7127–7153, https://doi.org/10.5194/acp-15-7127-2015, 2015.
Anderson, T. L., Masonis, S. J., Covert, D. S., Ahlquist, N. C., Howell, S. G., Clarke, A. D., and McNaughton, C. S.: Variability of aerosol optical properties derived from in-situ aircraft measurements during ACE-Asia, J. Geophys. Res.-Atmos., 108, 8647, https://doi.org/10.1029/2002JD003247, 2003.
Ansmann, A., Bösenberg, J., Chaikovsky, A., Comerón, A., Eckhardt, S., Eixmann, R., Freudenthaler, V., Ginoux, P., Komguem, L., Linné, H., Márquez, M. Á. L., Matthias, V., Mattis, I., Mitev, V., Müller, D., Music, S., Nickovic, S., Pelon, J., Sauvage, L., Sobolewsky, P., Srivastava, M. K., Stohl, A., Torres, O., Vaughan, G., Wandinger, U., and Wiegner, M.: Long-range transport of Saharan dust to northern Europe: The 11–16 October 2001 outbreak observed with EARLINET, J. Geophys. Res.-Atmos., 108, 4783, https://doi.org/10.1029/2003JD003757, 2003.
Ansmann, A., Tesche, M., Knippertz, P., Bierwirth, E., Althausen, D., Müller, D., and Schulz, O.: Vertical profiling of convective dust plumes in southern Morocco during SAMUM, Tellus B, 61, 340–353, https://doi.org/10.1111/j.1600-0889.2008.00384.x, 2009.
Ansmann, A., Tesche, M., Groß, S., Freudenthaler, V., Seifert, P., Hiebsch, A., Schmidt, J., Wandinger, U., Mattis, I., Müller, D., and Wiegner, M.: The 16 April 2010 major volcanic ash plume over central Europe: EARLINET lidar and AERONET photometer observations at Leipzig and Munich, Germany, Geophys. Res. Lett., 37, L13810, https://doi.org/10.1029/2010GL043809, 2010.
Ansmann, A., Petzold, A., Kandler, K., Tegen, I., Wendisch, M., Müller, D., Weinzierl, B., Müller, T., and Heintzenberg, J.: Saharan Mineral Dust Experiments SAMUM–1 and SAMUM–2: what have we learned?, Tellus B, 63, 403–429, https://doi.org/10.1111/j.1600-0889.2011.00555.x, 2011.
Ansmann, A., Seifert, P., Tesche, M., and Wandinger, U.: Profiling of fine and coarse particle mass: case studies of Saharan dust and Eyjafjallajökull/Grimsvötn volcanic plumes, Atmos. Chem. Phys., 12, 9399–9415, https://doi.org/10.5194/acp-12-9399-2012, 2012.
Ansmann, A., Rittmeister, F., Engelmann, R., Basart, S., Jorba, O., Spyrou, C., Remy, S., Skupin, A., Baars, H., Seifert, P., Senf, F., and Kanitz, T.: Profiling of Saharan dust from the Caribbean to western Africa – Part 2: Shipborne lidar measurements versus forecasts, Atmos. Chem. Phys., 17, 14987–15006, https://doi.org/10.5194/acp-17-14987-2017, 2017.
Ansmann, A., Mamouri, R.-E., Hofer, J., Baars, H., Althausen, D., and Abdullaev, S. F.: Dust mass, cloud condensation nuclei, and ice-nucleating particle profiling with polarization lidar: updated POLIPHON conversion factors from global AERONET analysis, Atmos. Meas. Tech., 12, 4849–4865, https://doi.org/10.5194/amt-12-4849-2019, 2019.
Antuña-Marrero, J. C., Landulfo, E., Estevan, R., Barja, B., Robock, A., Wolfram, E., Ristori, P., Clemesha, B., Zaratti, F., Forno, R., Armandillo, E., Bastidas, Á. E., Baraja, Á. M. de F., Whiteman, D. N., Quel, E., Barbosa, H. M. J., Lopes, F., Montilla-Rosero, E., and Guerrero-Rascado, J. L.: LALINET: The First Latin American–Born Regional Atmospheric Observational Network, B. Am. Meteorol. Soc., 98, 1255–1275, https://doi.org/10.1175/BAMS-D-15-00228.1, 2017.
Aslanoğlu, S. Y., Proestakis, E., Gkikas, A., Güllü, G., and Amiridis, V.: Dust Climatology of Turkey as a Part of the Eastern Mediterranean Basin via 9-Year CALIPSO-Derived Product, Atmosphere, 13, 733, https://doi.org/10.3390/atmos13050733, 2022.
Astitha, M., Lelieveld, J., Abdel Kader, M., Pozzer, A., and de Meij, A.: Parameterization of dust emissions in the global atmospheric chemistry-climate model EMAC: impact of nudging and soil properties, Atmos. Chem. Phys., 12, 11057–11083, https://doi.org/10.5194/acp-12-11057-2012, 2012.
Baars, H., Kanitz, T., Engelmann, R., Althausen, D., Heese, B., Komppula, M., Preißler, J., Tesche, M., Ansmann, A., Wandinger, U., Lim, J.-H., Ahn, J. Y., Stachlewska, I. S., Amiridis, V., Marinou, E., Seifert, P., Hofer, J., Skupin, A., Schneider, F., Bohlmann, S., Foth, A., Bley, S., Pfüller, A., Giannakaki, E., Lihavainen, H., Viisanen, Y., Hooda, R. K., Pereira, S. N., Bortoli, D., Wagner, F., Mattis, I., Janicka, L., Markowicz, K. M., Achtert, P., Artaxo, P., Pauliquevis, T., Souza, R. A. F., Sharma, V. P., van Zyl, P. G., Beukes, J. P., Sun, J., Rohwer, E. G., Deng, R., Mamouri, R.-E., and Zamorano, F.: An overview of the first decade of PollyNET: an emerging network of automated Raman-polarization lidars for continuous aerosol profiling, Atmos. Chem. Phys., 16, 5111–5137, https://doi.org/10.5194/acp-16-5111-2016, 2016.
Banks, J. R., Brindley, H. E., Stenchikov, G., and Schepanski, K.: Satellite retrievals of dust aerosol over the Red Sea and the Persian Gulf (2005–2015), Atmos. Chem. Phys., 17, 3987–4003, https://doi.org/10.5194/acp-17-3987-2017, 2017.
Begum, B. A., Biswas, S. K., Markwitz, A., and Hopke, P. K.: Identification of Sources of Fine and Coarse Particulate Matter in Dhaka, Bangladesh, Aerosol Air Qual. Res., 10, 345–353, https://doi.org/10.4209/aaqr.2009.12.0082, 2010.
Ben-Ami, Y., Koren, I., and Altaratz, O.: Patterns of North African dust transport over the Atlantic: winter vs. summer, based on CALIPSO first year data, Atmos. Chem. Phys., 9, 7867–7875, https://doi.org/10.5194/acp-9-7867-2009, 2009.
Bi, L., Lin, W., Liu, D., and Zhang, K.: Assessing the depolarization capabilities of nonspherical particles in a super-ellipsoidal shape space, Opt. Express, 26, 1726–1742, https://doi.org/10.1364/OE.26.001726, 2018.
Bohlmann, S., Baars, H., Radenz, M., Engelmann, R., and Macke, A.: Ship-borne aerosol profiling with lidar over the Atlantic Ocean: from pure marine conditions to complex dust–smoke mixtures, Atmos. Chem. Phys., 18, 9661–9679, https://doi.org/10.5194/acp-18-9661-2018, 2018.
Bohlmann, S., Shang, X., Vakkari, V., Giannakaki, E., Leskinen, A., Lehtinen, K. E. J., Pätsi, S., and Komppula, M.: Lidar depolarization ratio of atmospheric pollen at multiple wavelengths, Atmos. Chem. Phys., 21, 7083–7097, https://doi.org/10.5194/acp-21-7083-2021, 2021.
Bory, A. J. M., Biscaye, P. E., and Grousset, F. E.: Two distinct seasonal Asian source regions for mineral dust deposited in Greenland (NorthGRIP), Geophys. Res. Lett., 30, 1167, https://doi.org/10.1029/2002GL016446, 2003.
Brook, R. D., Rajagopalan, S., Pope, C. A., Brook, J. R., Bhatnagar, A., Diez-Roux, A. V., Holguin, F., Hong, Y., Luepker, R. V., Mittleman, M. A., Peters, A., Siscovick, D., Smith, S. C., Whitsel, L., and Kaufman, J. D.: Particulate Matter Air Pollution and Cardiovascular Disease, Circulation, 121, 2331–2378, https://doi.org/10.1161/CIR.0b013e3181dbece1, 2010.
Bryant, R. G., Bigg, G. R., Mahowald, N. M., Eckardt, F. D., and Ross S. G.: Dust emission response to climate in southern Africa, J. Geophys. Res., 112, D09207, https://doi.org/10.1029/2005JD007025, 2007.
Burton, S. P., Ferrare, R. A., Vaughan, M. A., Omar, A. H., Rogers, R. R., Hostetler, C. A., and Hair, J. W.: Aerosol classification from airborne HSRL and comparisons with the CALIPSO vertical feature mask, Atmos. Meas. Tech., 6, 1397–1412, https://doi.org/10.5194/amt-6-1397-2013, 2013.
Centre for Environmental Data Analysis (CEDA): FAAM aircraft datasets, British Atmospheric Data Centre, Centre for Environmental Data Analysis, http://www.ceda.ac.uk/, last access: 24 August 2023.
Chaikovsky, A., Dubovik, O., Holben, B., Bril, A., Goloub, P., Tanré, D., Pappalardo, G., Wandinger, U., Chaikovskaya, L., Denisov, S., Grudo, J., Lopatin, A., Karol, Y., Lapyonok, T., Amiridis, V., Ansmann, A., Apituley, A., Allados-Arboledas, L., Binietoglou, I., Boselli, A., D'Amico, G., Freudenthaler, V., Giles, D., Granados-Muñoz, M. J., Kokkalis, P., Nicolae, D., Oshchepkov, S., Papayannis, A., Perrone, M. R., Pietruczuk, A., Rocadenbosch, F., Sicard, M., Slutsker, I., Talianu, C., De Tomasi, F., Tsekeri, A., Wagner, J., and Wang, X.: Lidar-Radiometer Inversion Code (LIRIC) for the retrieval of vertical aerosol properties from combined lidar/radiometer data: development and distribution in EARLINET, Atmos. Meas. Tech., 9, 1181–1205, https://doi.org/10.5194/amt-9-1181-2016, 2016.
Chazette, P., Dabas, A., Sanak, J., Lardier, M., and Royer, P.: French airborne lidar measurements for Eyjafjallajökull ash plume survey, Atmos. Chem. Phys., 12, 7059–7072, https://doi.org/10.5194/acp-12-7059-2012, 2012.
Chen, S., Jiang, N., Huang, J., Xu, X., Zhang, H., Zang, Z., Huang, K., Xu, X., Wei, Y., Guan, X., Zhang, X., Luo, Y., Hu, Z., and Feng, T.: Quantifying contributions of natural and anthropogenic dust emission from different climatic regions, Atmos. Environ., 191, 94–104, https://doi.org/10.1016/j.atmosenv.2018.07.043, 2018.
Chen, S., Jiang, N., Huang, J., Zang, Z., Guan, X., Ma, X., Luo, Y., Li, J., Zhang, X., and Zhang, Y.: Estimations of indirect and direct anthropogenic dust emission at the global scale, Atmos. Environ., 200, 50–60, https://doi.org/10.1016/j.atmosenv.2018.11.063, 2019.
Councell, T. B., Duckenfield, K. U., Landa, E. R., and Callender, E.: Tire-Wear Particles as a Source of Zinc to the Environment, Environ. Sci. Technol., 38, 4206–4214, https://doi.org/10.1021/es034631f, 2004.
D'Amico, G., Amodeo, A., Baars, H., Binietoglou, I., Freudenthaler, V., Mattis, I., Wandinger, U., and Pappalardo, G.: EARLINET Single Calculus Chain – overview on methodology and strategy, Atmos. Meas. Tech., 8, 4891–4916, https://doi.org/10.5194/amt-8-4891-2015, 2015.
De Longueville, F., Hountondji, Y.-C., Henry, S., and Ozer, P.: What do we know about effects of desert dust on air quality and human health in West Africa compared to other regions?, Sci. Total Environ., 409, 1–8, https://doi.org/10.1016/j.scitotenv.2010.09.025, 2010.
DeMott, P. J., Sassen, K., Poellot, M. R., Baumgardner, D., Rogers, D. C., Brooks, S. D., Prenni, A. J., and Kreidenweis, S. M.: Correction to “African dust aerosols as atmospheric ice nuclei,” Geophys. Res. Lett., 36, L07808, https://doi.org/10.1029/2009GL037639, 2009.
Deroubaix, A., Martiny, N., Chiapello, I., and Marticorena, B.: Suitability of OMI aerosol index to reflect mineral dust surface conditions: Preliminary application for studying the link with meningitis epidemics in the Sahel, Remote Sens. Environ., 133, 116–127, https://doi.org/10.1016/j.rse.2013.02.009, 2013.
Dey, S., Tripathi, S. N., Singh, R. P., and Holben, B. N.: Influence of dust storms on the aerosol optical properties over the Indo-Gangetic basin, J. Geophys. Res.-Atmos., 109, 1–10, https://doi.org/10.1029/2004jd004924, 2004.
Dione, C., Talib, J., Bwaka, A. M., Kamga, A. F., Bita Fouda, A. A., Hirons, L., Latt, A., Thompson, E., Lingani, C., Savatia Indasi, V., Adefisan, E. A., and Woolnough, S. J.: Improved sub-seasonal forecasts to support preparedness action for meningitis outbreak in Africa, Clim. Serv., 28, 100326, https://doi.org/10.1016/j.cliser.2022.100326, 2022.
Drakaki, E., Amiridis, V., Tsekeri, A., Gkikas, A., Proestakis, E., Mallios, S., Solomos, S., Spyrou, C., Marinou, E., Ryder, C. L., Bouris, D., and Katsafados, P.: Modeling coarse and giant desert dust particles, Atmos. Chem. Phys., 22, 12727–12748, https://doi.org/10.5194/acp-22-12727-2022, 2022.
Du, Y., Xu, X., Chu, M., Guo, Y., and Wang, J.: Air particulate matter and cardiovascular disease: the epidemiological, biomedical and clinical evidence, J. Thor. Disease, 8, E8–E19, https://doi.org/10.3978/j.issn.2072-1439.2015.11.37, 2015.
Dubovik, O. and King, M. D.: A flexible inversion algorithm for retrieval of aerosol optical properties from Sun and sky radiance measurements, J. Geophys. Res., 105, 20673–20696, 2000.
Dubovik, O., Smirnov, A., Holben, B. N., King, M. D., Kaufman, Y. J., Eck, T. F., and Slutsker, I.: Accuracy assessment of aerosol optical properties retrieval from AERONET sun and sky radiance measurements, J. Geophys. Res., 105, 9791–9806, 2000.
Duce, R., Unni, C., Ray, B., Prospero, J., and Merrill, J.: Long-Range Atmospheric Transport of Soil Dust from Asia to the Tropical North Pacific – Temporal Variability, Science, 209, 1522–1524, https://doi.org/10.1126/science.209.4464.1522, 1980.
Earthdata: Atmospheric Science Data Center (ASDC), NASA Langley Research Center, https://earthdata.nasa.gov/eosdis/daacs/asdc, last access: 24 August 2023.
Earthdata: CATS browsed images and data products, NASA Langley Research Center [data set], https://search.earthdata.nasa.gov/search?q=CATS (last access: 29 May 2024.
Eck, T. F., Holben, B. N., Reid, J. S., Dubovik, O., Smirnov, A., O'Neill, N. T., Slutsker, I., and Kinne, S.: Wavelength dependence of the optical depth of biomass burning, urban and desert dust aerosols, J. Geophys. Res., 104, 31333–31350, 1999.
Engelmann, R., Kanitz, T., Baars, H., Heese, B., Althausen, D., Skupin, A., Wandinger, U., Komppula, M., Stachlewska, I. S., Amiridis, V., Marinou, E., Mattis, I., Linné, H., and Ansmann, A.: The automated multiwavelength Raman polarization and water-vapor lidar PollyXT: the neXT generation, Atmos. Meas. Tech., 9, 1767–1784, https://doi.org/10.5194/amt-9-1767-2016, 2016.
Esselborn, M., Wirth, M., Fix, A., Weinzierl, B., Rasp, K., Tesche, M., and Petzold, A.: Spatial distribution and optical properties of Saharan dust observed by airborne high spectral resolution lidar during SAMUM 2006, Tellus B, 61, 131–143, https://doi.org/10.1111/j.1600-0889.2008.00394.x, 2009.
Fiedler, S., Schepanski, K., Heinold, B., Knippertz, P., and Tegen, I.: Climatology of nocturnal low-level jets over North Africa and implications for modeling mineral dust emission, J. Geophys. Res.-Atmos., 118, 6100–6121, https://doi.org/10.1002/jgrd.50394, 2013.
Filioglou, M., Giannakaki, E., Backman, J., Kesti, J., Hirsikko, A., Engelmann, R., O'Connor, E., Leskinen, J. T. T., Shang, X., Korhonen, H., Lihavainen, H., Romakkaniemi, S., and Komppula, M.: Optical and geometrical aerosol particle properties over the United Arab Emirates, Atmos. Chem. Phys., 20, 8909–8922, https://doi.org/10.5194/acp-20-8909-2020, 2020.
Floutsi, A. A., Baars, H., Engelmann, R., Althausen, D., Ansmann, A., Bohlmann, S., Heese, B., Hofer, J., Kanitz, T., Haarig, M., Ohneiser, K., Radenz, M., Seifert, P., Skupin, A., Yin, Z., Abdullaev, S. F., Komppula, M., Filioglou, M., Giannakaki, E., Stachlewska, I. S., Janicka, L., Bortoli, D., Marinou, E., Amiridis, V., Gialitaki, A., Mamouri, R.-E., Barja, B., and Wandinger, U.: DeLiAn – a growing collection of depolarization ratio, lidar ratio and Ångström exponent for different aerosol types and mixtures from ground-based lidar observations, Atmos. Meas. Tech., 16, 2353–2379, https://doi.org/10.5194/amt-16-2353-2023, 2023.
Forster, P., Storelvmo, T., Armour, K., Collins, W., Dufresne, J.-L., Frame, D., Lunt, D. J., Mauritsen, T., Palmer, M. D., Watanabe, M., Wild, M., and Zhang, H.: The Earth's Energy Budget, Climate Feedbacks, and Climate Sensitivity, in: Climate Change 2021: The Physical Science Basis. Contribution of Working Group I to the Sixth Assessment Report of the Intergovernmental Panel on Climate Change, edited by: Masson-Delmotte, V., Zhai, P., Pirani, A., Connors, S. L., Péan, C., Berger, S., Caud, N., Chen, Y., Goldfarb, L., Gomis, M. I., Huang, M., Leitzell, K., Lonnoy, E., Matthews, J. B. R., Maycock, T. K., Waterfield, T., Yelekçi, O., Yu, R., and Zhou, B., Cambridge University Press, Cambridge, United Kingdom and New York, NY, USA, 923–1054, https://doi.org/10.1017/9781009157896.009, 2021.
Freudenthaler, V., Esselborn, M., Wiegner, M., Heese, B., Tesche, M., Ansmann, A., Mueller, D., Althausen, D., Wirth, M., Fix, A., Ehret, G., Knippertz, P., Toledano, C., Gasteiger, J., Garhammer, M., and Seefeldner, A.: Depolarization ratio profiling at several wavelengths in pure Saharan dust during SAMUM 2006, Tellus B, 61, 165–179, https://doi.org/10.1111/j.1600-0889.2008.00396.x, 2009.
Garnier, A., Scott, N. A., Pelon, J., Armante, R., Crépeau, L., Six, B., and Pascal, N.: Long-term assessment of the CALIPSO Imaging Infrared Radiometer (IIR) calibration and stability through simulated and observed comparisons with MODIS/Aqua and SEVIRI/Meteosat, Atmos. Meas. Tech., 10, 1403–1424, https://doi.org/10.5194/amt-10-1403-2017, 2017.
Gassó, S. and Torres, O.: Temporal characterization of dust activity in the Central Patagonia desert (years 1964–2017), J. Geophys. Res.-Atmos., 124, 3417–3434, https://doi.org/10.1029/2018JD030209, 2019.
Gasteiger, J., Wiegner, M., Groß, S., Freudenthaler, V., Toledano, C., Tesche, M., and Kandler, K.: Modelling lidar-relevant optical properties of complex mineral dust aerosols, Tellus B, 63, 725–741, https://doi.org/10.1111/j.1600-0889.2011.00559.x, 2011.
Ge, J. M., Huang, J. P., Xu, C. P., Qi, Y. L., and Liu, H. Y.: Characteristics of Taklimakan dust emission and distribution: a satellite and reanalysis field perspective, J. Geophys. Res.-Atmos., 119, 11772–11783, https://doi.org/10.1002/2014JD022280, 2014.
Getzewich, B. J., Vaughan, M. A., Hunt, W. H., Avery, M. A., Powell, K. A., Tackett, J. L., Winker, D. M., Kar, J., Lee, K.-P., and Toth, T. D.: CALIPSO lidar calibration at 532 nm: version 4 daytime algorithm, Atmos. Meas. Tech., 11, 6309–6326, https://doi.org/10.5194/amt-11-6309-2018, 2018.
Giles, D. M., Sinyuk, A., Sorokin, M. G., Schafer, J. S., Smirnov, A., Slutsker, I., Eck, T. F., Holben, B. N., Lewis, J. R., Campbell, J. R., Welton, E. J., Korkin, S. V., and Lyapustin, A. I.: Advancements in the Aerosol Robotic Network (AERONET) Version 3 database – automated near-real-time quality control algorithm with improved cloud screening for Sun photometer aerosol optical depth (AOD) measurements, Atmos. Meas. Tech., 12, 169–209, https://doi.org/10.5194/amt-12-169-2019, 2019.
Ginoux, P., Chin, M., Tegen, I., Prospero, J. M., Holben, B., Dubovik, O., and Lin, S.-J.: Sources and distributions of dust aerosols simulated with the GOCART model, J. Geophys. Res.-Atmos., 106, 20255–20273, https://doi.org/10.1029/2000JD000053, 2001.
Ginoux, P., Prospero, J. M., Torres, O., and Chin, M.: Long-term simulation of global dust distribution with the GOCART model: correlation with North Atlantic Oscillation, Environ. Modell. Softw., 19, 113–128, https://doi.org/10.1016/S1364-8152(03)00114-2, 2004.
Ginoux, P., Prospero, J. M., Gill, T. E., Hsu, N. C., and Zhao, M.: Global-Scale Attribution of Anthropogenic and Natural Dust Sources and Their Emission Rates Based on Modis Deep Blue Aerosol Products, Rev. Geophys., 50, RG3005, https://doi.org/10.1029/2012RG000388, 2012.
Gkikas, A., Hatzianastassiou, N., Mihalopoulos, N., Katsoulis, V., Kazadzis, S., Pey, J., Querol, X., and Torres, O.: The regime of intense desert dust episodes in the Mediterranean based on contemporary satellite observations and ground measurements, Atmos. Chem. Phys., 13, 12135–12154, https://doi.org/10.5194/acp-13-12135-2013, 2013.
Gkikas, A., Houssos, E. E., Lolis, C. J., Bartzokas, A., Mihalopoulos, N., and Hatzianastassiou, N.: Atmospheric circulation evolution related to desert-dust episodes over the Mediterranean, Q. J. Roy. Meteor. Soc., 141, 1634–1645, https://doi.org/10.1002/qj.2466, 2015.
Gkikas, A., Basart, S., Hatzianastassiou, N., Marinou, E., Amiridis, V., Kazadzis, S., Pey, J., Querol, X., Jorba, O., Gassó, S., and Baldasano, J. M.: Mediterranean intense desert dust outbreaks and their vertical structure based on remote sensing data, Atmos. Chem. Phys., 16, 8609–8642, https://doi.org/10.5194/acp-16-8609-2016, 2016.
Gkikas, A., Proestakis, E., Amiridis, V., Kazadzis, S., Di Tomaso, E., Marinou, E., Hatzianastassiou, N., Kok, J. F., and García-Pando, C. P.: Quantification of the dust optical depth across spatiotemporal scales with the MIDAS global dataset (2003–2017), Atmos. Chem. Phys., 22, 3553–3578, https://doi.org/10.5194/acp-22-3553-2022, 2022.
Gliß, J., Mortier, A., Schulz, M., Andrews, E., Balkanski, Y., Bauer, S. E., Benedictow, A. M. K., Bian, H., Checa-Garcia, R., Chin, M., Ginoux, P., Griesfeller, J. J., Heckel, A., Kipling, Z., Kirkevåg, A., Kokkola, H., Laj, P., Le Sager, P., Lund, M. T., Lund Myhre, C., Matsui, H., Myhre, G., Neubauer, D., van Noije, T., North, P., Olivié, D. J. L., Rémy, S., Sogacheva, L., Takemura, T., Tsigaridis, K., and Tsyro, S. G.: AeroCom phase III multi-model evaluation of the aerosol life cycle and optical properties using ground- and space-based remote sensing as well as surface in situ observations, Atmos. Chem. Phys., 21, 87–128, https://doi.org/10.5194/acp-21-87-2021, 2021.
Gobbi, G. P., Barnaba, F., Giorgi, R., and Santacasa, A.: Altitude-resolved properties of a Saharan dust event over the Mediterranean, Atmos. Environ., 34, 5119–5127, https://doi.org/10.1016/S1352-2310(00)00194-1, 2000.
Gong, S. L., Zhang, X. Y., Zhao, T. L., Zhang, X. B., Barrie, L. A., McKendry, I. G., and Zhao, C. S.: A simulated climatology of Asian dust aerosol and its trans-Pacific transport, Part II: Interannual variability and climate connections, J. Climate, 19, 104–122, https://doi.org/10.1175/JCLI3606.1, 2006.
Goudie, A. S.: Desert dust and human health disorders, Environ. Int., 63, 101–113, https://doi.org/10.1016/j.envint.2013.10.011, 2014.
Groß, S., Tesche, M., Freudenthaler, V., Toledano, C., Wiegner, M., Ansmann, A., Althausen, D., and Seefeldner, M.: Characterization of Saharan dust, marine aerosols and mixtures of biomass-burning aerosols and dust by means of multi-wavelength depolarization and Raman lidar measurements during SAMUM 2, Tellus B, 63, 706–724, https://doi.org/10.1111/j.1600-0889.2011.00556.x, 2011a.
Groß, S., Wiegner, M., Freudenthaler, V., and Toledano, C.: Lidar ratio of Saharan dust over Cape Verde Islands: Assessment and error calculation, J. Geophys. Res.-Atmos., 116, D15203, https://doi.org/10.1029/2010JD015435, 2011b.
Groß, S., Freudenthaler, V., Wiegner, M., Gasteiger, J., Geiss, A., and Schnell, F.: Dual-wavelength linear depolarization ratio of volcanic aerosols: Lidar measurements of the Eyjafjallajokull plume over Maisach, Germany, Atmos. Environ., 48, 85–96, https://doi.org/10.1016/j.atmosenv.2011.06.017, 2012.
Groß, S., Freudenthaler, V., Schepanski, K., Toledano, C., Schäfler, A., Ansmann, A., and Weinzierl, B.: Optical properties of long-range transported Saharan dust over Barbados as measured by dual-wavelength depolarization Raman lidar measurements, Atmos. Chem. Phys., 15, 11067–11080, https://doi.org/10.5194/acp-15-11067-2015, 2015.
Guerrero-Rascado, J. L., Olmo, F. J., Avilés-Rodríguez, I., Navas-Guzmán, F., Pérez-Ramírez, D., Lyamani, H., and Alados Arboledas, L.: Extreme Saharan dust event over the southern Iberian Peninsula in september 2007: active and passive remote sensing from surface and satellite, Atmos. Chem. Phys., 9, 8453–8469, https://doi.org/10.5194/acp-9-8453-2009, 2009.
Haarig, M., Ansmann, A., Gasteiger, J., Kandler, K., Althausen, D., Baars, H., Radenz, M., and Farrell, D. A.: Dry versus wet marine particle optical properties: RH dependence of depolarization ratio, backscatter, and extinction from multiwavelength lidar measurements during SALTRACE, Atmos. Chem. Phys., 17, 14199–14217, https://doi.org/10.5194/acp-17-14199-2017, 2017a.
Haarig, M., Ansmann, A., Althausen, D., Klepel, A., Groß, S., Freudenthaler, V., Toledano, C., Mamouri, R.-E., Farrell, D. A., Prescod, D. A., Marinou, E., Burton, S. P., Gasteiger, J., Engelmann, R., and Baars, H.: Triple-wavelength depolarization-ratio profiling of Saharan dust over Barbados during SALTRACE in 2013 and 2014, Atmos. Chem. Phys., 17, 10767–10794, https://doi.org/10.5194/acp-17-10767-2017, 2017b.
Hamidi, M., Kavianpour, M. R., and Shao, Y.: Synoptic analysis of dust storms in the Middle East, Asia-Pacific J. Atmos. Sci., 49, 279–286, https://doi.org/10.1007/s13143-013-0027-9, 2013.
Hand, J. L., Gill, T. E., and Schichtel, B. A.: Spatial and seasonal variability in fine mineral dust and coarse aerosol mass at remote sites across the United States, J. Geophys. Res.-Atmos.,122, 3080–3097, https://doi.org/10.1002/2016jd026290, 2017.
Hatch, C. D., Gierlus, K. M., Schuttlefield, J. D., and Grassian, V. H.: Water adsorption and cloud condensation nuclei activity of calcite and calcite coated with model humic and fulvic acids, Atmos. Environ., 42, 5672–5684, https://doi.org/10.1016/j.atmosenv.2008.03.005, 2008.
Haywood, J. and Boucher, O.: Estimates of the direct and indirect radiative forcing due to tropospheric aerosols: A review, Rev. Geophys., 38, 513–543, https://doi.org/10.1029/1999RG000078, 2000.
He, Y., Yin, Z., Ansmann, A., Liu, F., Wang, L., Jing, D., and Shen, H.: POLIPHON conversion factors for retrieving dust-related cloud condensation nuclei and ice-nucleating particle concentration profiles at oceanic sites, Atmos. Meas. Tech., 16, 1951–1970, https://doi.org/10.5194/amt-16-1951-2023, 2023.
Hofer, J., Althausen, D., Abdullaev, S. F., Makhmudov, A. N., Nazarov, B. I., Schettler, G., Engelmann, R., Baars, H., Fomba, K. W., Müller, K., Heinold, B., Kandler, K., and Ansmann, A.: Long-term profiling of mineral dust and pollution aerosol with multiwavelength polarization Raman lidar at the Central Asian site of Dushanbe, Tajikistan: case studies, Atmos. Chem. Phys., 17, 14559–14577, https://doi.org/10.5194/acp-17-14559-2017, 2017.
Hofer, J., Ansmann, A., Althausen, D., Engelmann, R., Baars, H., Abdullaev, S. F., and Makhmudov, A. N.: Long-term profiling of aerosol light extinction, particle mass, cloud condensation nuclei, and ice-nucleating particle concentration over Dushanbe, Tajikistan, in Central Asia, Atmos. Chem. Phys., 20, 4695–4711, https://doi.org/10.5194/acp-20-4695-2020, 2020a.
Hofer, J., Ansmann, A., Althausen, D., Engelmann, R., Baars, H., Fomba, K. W., Wandinger, U., Abdullaev, S. F., and Makhmudov, A. N.: Optical properties of Central Asian aerosol relevant for spaceborne lidar applications and aerosol typing at 355 and 532 nm, Atmos. Chem. Phys., 20, 9265–9280, https://doi.org/10.5194/acp-20-9265-2020, 2020b.
Holben, B. N., Eck, T. F., Slutsker, I., Tanre, D., Buis, J. P., Setzer, A., Vermote, E., Reagan, J. A., Kaufman, Y. J., Nakajima, T., Lavenu, F., Jankowiak, I., and Smirnov, A.: AERONET – A federated instrument network and data archive for aerosol characterization, Remote Sens. Environ., 66, 1–16, https://doi.org/10.1016/S0034-4257(98)00031-5, 1998.
Hu, Q., Wang, H., Goloub, P., Li, Z., Veselovskii, I., Podvin, T., Li, K., and Korenskiy, M.: The characterization of Taklamakan dust properties using a multiwavelength Raman polarization lidar in Kashi, China, Atmos. Chem. Phys., 20, 13817–13834, https://doi.org/10.5194/acp-20-13817-2020, 2020.
Huang, J., Lin, B., Minnis, P., Wang, T., Wang, X., Hu, Y., Yi, Y., and Ayers, J. K.: Satellite-based assessment of possible dust aerosols semi-direct effect on cloud water path over East Asia, Geophys. Res. Lett., 33, L19802, https://doi.org/10.1029/2006GL026561, 2006.
Huang, J. P., Liu, J. J., Chen, B., and Nasiri, S. L.: Detection of anthropogenic dust using CALIPSO lidar measurements, Atmos. Chem. Phys., 15, 11653–11665, https://doi.org/10.5194/acp-15-11653-2015, 2015.
Hunt, W. H., Winker, D. M., Vaughan, M. A., Powell, K. A., Lucker, P. L., and Weimer, C.: CALIPSO Lidar Description and Performance Assessment, J. Atmos. Ocean. Technol., 26, 1214–1228, https://doi.org/10.1175/2009JTECHA1223.1, 2009.
Husar, R. B., Tratt, D. M., Schichtel, D. M., Falke, S. R., Li, F., Jaffe, D., Gassó, S., Gill, T., Laulainen, N. S., Lu, F., Reheis, M. C., Chun, Y., Westphal, D., Holben, B. N., Gueymard, C., McKendry, I., Kuring, N., Feldman, G. C., McClain, C., Frouin, R. J., Merrill, J., DuBois, D., Vignola, F., Murayama, T., Nickovic, S., Wilson, W. E., Sassen, K., Sugimoto, N., and Malm, W. C.: Asian dust events of April 1998, J. Geophys. Res., 106, 18317–18330, https://doi.org/10.1029/2000JD900788, 2001.
Inness, A., Ades, M., Agustí-Panareda, A., Barré, J., Benedictow, A., Blechschmidt, A.-M., Dominguez, J. J., Engelen, R., Eskes, H., Flemming, J., Huijnen, V., Jones, L., Kipling, Z., Massart, S., Parrington, M., Peuch, V.-H., Razinger, M., Remy, S., Schulz, M., and Suttie, M.: The CAMS reanalysis of atmospheric composition, Atmos. Chem. Phys., 19, 3515–3556, https://doi.org/10.5194/acp-19-3515-2019, 2019.
IPCC: Climate Change 2013: The Physical Science Basis, Contribution of Working Group I to the Fifth Assessment Report of the Intergovernmental Panel on Climate Change, edited by: Stocker, T. F., Qin, D., Plattner, G.-K., Tignor, M., Allen, S. K., Boschung, J., Nauels, A., Xia, Y., Bex, V., and Midgley, P. M., Cambridge University Press, Cambridge, United Kingdom and New York, NY, USA, https://doi.org/10.1017/CBO9781107415324, 2013.
IPCC: Climate Change 2014: Synthesis Report. Contribution of Working Groups I, II and III to the Fifth Assessment Report of the Intergovernmental Panel on Climate Change, edited by: Core Writing Team, Pachauri, R. K. and Meyer, L. A., IPCC, Geneva, Switzerland, 151 pp., ISBN 978-92-9169-143-2, 2014.
Ito, A., Adebiyi, A. A., Huang, Y., and Kok, J. F.: Less atmospheric radiative heating by dust due to the synergy of coarser size and aspherical shape, Atmos. Chem. Phys., 21, 16869–16891, https://doi.org/10.5194/acp-21-16869-2021, 2021.
Järvinen, E., Kemppinen, O., Nousiainen, T., Kociok, T., Möhler, O., Leisner, T., and Schnaiter, M.: Laboratory investigations of mineral dust near-backscattering depolarization ratios, J. Quant. Spectrosc. Ra., 178, 192–208, https://doi.org/10.1016/j.jqsrt.2016.02.003, 2016.
Jickells, T. D., An, Z. S., Andersen, K. K., Baker, A. R., Bergametti, G., Brooks, N., Cao, J. J., Boyd, P. W., Duce, R. A., Hunter, K. A., Kawahata, H., Kubilay, N., laRoche, J., Liss, P. S., Mahowald, N., Prospero, J. M., Ridgwell, A. J., Tegen, I., and Torres, R.: Global Iron Connections Between Desert Dust, Ocean Biogeochemistry, and Climate, Science, 308, 67–71, https://doi.org/10.1126/science.1105959, 2005.
Jin, Y., Kai, K., Shibata, T., Zhang, K., and Zhou, H.: Validation of the Dust Layer Structure over the Taklimakan Desert, China by the CALIOP Space-Borne Lidar Using Ground-Based Lidar, Sola, 6, 121–124, https://doi.org/10.2151/sola.2010-031, 2010.
Kacenelenbogen, M., Vaughan, M. A., Redemann, J., Hoff, R. M., Rogers, R. R., Ferrare, R. A., Russell, P. B., Hostetler, C. A., Hair, J. W., and Holben, B. N.: An accuracy assessment of the CALIOP/CALIPSO version 2/version 3 daytime aerosol extinction product based on a detailed multi-sensor, multi-platform case study, Atmos. Chem. Phys., 11, 3981–4000, https://doi.org/10.5194/acp-11-3981-2011, 2011.
Kampouri, A., Amiridis, V., Solomos, S., Gialitaki, A., Marinou, E., Spyrou, C., Georgoulias, A. K., Akritidis, D., Papagiannopoulos, N., Mona, L., Scollo, S., Tsichla, M., Tsikoudi, I., Pytharoulis, I., Karacostas, T., and Zanis, P.: Investigation of Volcanic Emissions in the Mediterranean: “The Etna–Antikythera Connection”, Atmosphere, 12, 40, https://doi.org/10.3390/atmos12010040, 2021.
Kanakidou, M., Mihalopoulos, N., Kindap, T., Im, U., Vrekoussis, M., Gerasopoulos, E., Dermitzaki, E., Unal, A., Kocak, M., Markakis, K., Melas, D., Kouvarakis, G., Youssef, A. F., Richter, A., Hatzianastassiou, N., Hilboll, A., Ebojie, F., Wittrock, F., von Savigny, C., Burrows, J. P., Ladstaetter-Weissenmayer, A., and Moubasher, H.: Megacities as hot spots of air pollution in the East Mediterranean, Atmos. Environ., 45, 1223–1235, https://doi.org/10.1016/j.atmosenv.2010.11.048, 2011.
Kanitz, T., Ansmann, A., Engelmann, R., and Althausen, D.: North-south cross sections of the vertical aerosol distribution over the Atlantic Ocean from multiwavelength Raman/polarization lidar during Polarstern cruises, J. Geophys. Res.-Atmos., 118, 2643–2655, https://doi.org/10.1002/jgrd.50273, 2013.
Kanitz, T., Engelmann, R., Heinold, B., Baars, H., Skupin, A., and Ansmann, A.: Tracking the Saharan Air Layer with shipborne lidar across the tropical Atlantic, Geophys. Res. Lett., 41, 1044–1050, https://doi.org/10.1002/2013GL058780, 2014.
Kar, J., Vaughan, M. A., Lee, K.-P., Tackett, J. L., Avery, M. A., Garnier, A., Getzewich, B. J., Hunt, W. H., Josset, D., Liu, Z., Lucker, P. L., Magill, B., Omar, A. H., Pelon, J., Rogers, R. R., Toth, T. D., Trepte, C. R., Vernier, J.-P., Winker, D. M., and Young, S. A.: CALIPSO lidar calibration at 532 nm: version 4 nighttime algorithm, Atmos. Meas. Tech., 11, 1459–1479, https://doi.org/10.5194/amt-11-1459-2018, 2018.
Kar, J., Lee, K.-P., Vaughan, M. A., Tackett, J. L., Trepte, C. R., Winker, D. M., Lucker, P. L., and Getzewich, B. J.: CALIPSO level 3 stratospheric aerosol profile product: version 1.00 algorithm description and initial assessment, Atmos. Meas. Tech., 12, 6173–6191, https://doi.org/10.5194/amt-12-6173-2019, 2019.
Karami, S., Ranjbar, A., Mohebalhojeh, A. R., and Moradi, M.: A rare case of haboob in Tehran: observational and numerical study, Atmos. Res., 185, 169–185, https://doi.org/10.1016/j.atmosres.2016.10.010, 2017.
Katra, I., Arotsker, L., Krasnov, H., Zaritsky, A., Kushmaro, A., and Ben-Dov, E.: Richness and Diversity in Dust Stormborne Biomes at the Southeast Mediterranean, Sci. Rep., 4, 5265, https://doi.org/10.1038/srep05265, 2014.
Kemppinen, O., Nousiainen, T., and Jeong, G. Y.: Effects of dust particle internal structure on light scattering, Atmos. Chem. Phys., 15, 12011–12027, https://doi.org/10.5194/acp-15-12011-2015, 2015a.
Kemppinen, O., Nousiainen, T., and Lindqvist, H.: The impact of surface roughness on scattering by realistically shaped wavelength-scale dust particles, J. Quant. Spectrosc. Ra., 150, 55–67, https://doi.org/10.1016/j.jqsrt.2014.05.024, 2015b.
Kim, M.-H., Kim, S.-W., Yoon, S.-C., and Omar, A. H.: Comparison of aerosol optical depth between CALIOP and MODIS-Aqua for CALIOP aerosol subtypes over the ocean, J. Geophys. Res.-Atmos., 118, 13241–13252, https://doi.org/10.1002/2013JD019527, 2013.
Kim, M.-H., Omar, A. H., Tackett, J. L., Vaughan, M. A., Winker, D. M., Trepte, C. R., Hu, Y., Liu, Z., Poole, L. R., Pitts, M. C., Kar, J., and Magill, B. E.: The CALIPSO version 4 automated aerosol classification and lidar ratio selection algorithm, Atmos. Meas. Tech., 11, 6107–6135, https://doi.org/10.5194/amt-11-6107-2018, 2018.
Kittaka, C., Winker, D. M., Vaughan, M. A., Omar, A., and Remer, L. A.: Intercomparison of column aerosol optical depths from CALIPSO and MODIS-Aqua, Atmos. Meas. Tech., 4, 131–141, https://doi.org/10.5194/amt-4-131-2011, 2011.
Klose, M., Shao, Y., Karremann, M. K., and Fink, A. H.: Sahel dust zone and synoptic background, Geophys. Res. Lett., 37, L09802, https://doi.org/10.1029/2010GL042816, 2010.
Knippertz, P., Deutscher, C., Kandler, K., Mueller, T., Schulz, O., and Schuetz, L.: Dust mobilization due to density currents in the Atlas region: Observations from the Saharan Mineral Dust Experiment 2006 field campaign, J. Geophys. Res.-Atmos., 112, D21109, https://doi.org/10.1029/2007JD008774, 2007.
Knippertz, P., Ansmann, A., Althausen, D., Mueller, D., Tesche, M., Bierwirth, E., Dinter, T., Mueller, T., Von Hoyningen-Huene, W., Schepanski, K., Wendisch, M., Heinold, B., Kandler, K., Petzold, A., Schuetz, L., and Tegen, I.: Dust mobilization and transport in the northern Sahara during SAMUM 2006 – a meteorological overview, Tellus B, 61, 12–31, https://doi.org/10.1111/j.1600-0889.2008.00380.x, 2009.
Knippertz, P., Tesche, M., Heinold, B., Kandler, K., Toledano, C., and Esselborn, M.: Dust mobilization and aerosol transport from West Africa to Cape Verde-a meteorological overview of SAMUM-2, Tellus B, 63, 430–447, https://doi.org/10.1111/j.1600-0889.2011.00544.x, 2011.
Koch, J. and Renno, N. O.: The role of convective plumes and vortices on the global aerosol budget, Geophys. Res. Lett., 32, L18806, https://doi.org/10.1029/2005GL023420, 2005.
Kok, J. F., Ridley, D. A., Zhou, Q., Miller, R. L., Zhao, C., Heald, C. L., Ward, D. S., Albani, S., and Haustein, K.: Smaller desert dust cooling effect estimated from analysis of dust size and abundance, Nat. Geosci., 10, 274–278, https://doi.org/10.1038/ngeo2912, 2017.
Kong, S., Sato, K., and Bi, L.: Lidar ratio–depolarization ratio relations of atmospheric dust aerosols: The super-spheroid model and High Spectral Resolution Lidar observations, J. Geophys. Res.-Atmos., 127, e2021JD035, https://doi.org/10.1029/2021JD035629, 2022.
Konsta, D., Binietoglou, I., Gkikas, A., Solomos, S., Marinou, E., Proestakis, E., Basart, S., Perez Garcia-Pando, C., El-Askary, H., and Amiridis, V.: Evaluation of the BSC-DREAM8b regional dust model using the 3D LIVAS-CALIPSO product, Atmos. Environ., 195, 46–62, https://doi.org/10.1016/j.atmosenv.2018.09.047, 2018.
Kosmopoulos, P. G., Kazadzis, S., El-Askary, H., Taylor, M., Gkikas, A., Proestakis, E., Kontoes, C., and El-Khayat, M. M.: Earth-Observation-Based Estimation and Forecasting of Particulate Matter Impact on Solar Energy in Egypt, Remote Sens., 10, 1870, https://doi.org/10.3390/rs10121870, 2018.
Krueger, B. J., Grassian, V. H., Cowin, J. P., and Laskin, A.: Heterogeneous chemistry of individual mineral dust particles from different dust source regions: the importance of particle mineralogy, Atmos. Environ., 38, 6253–6261, https://doi.org/10.1016/j.atmosenv.2004.07.010, 2004.
Lance, S., Brock, C. A., Rogers, D., and Gordon, J. A.: Water droplet calibration of the Cloud Droplet Probe (CDP) and in-flight performance in liquid, ice and mixed-phase clouds during ARCPAC, Atmos. Meas. Tech., 3, 1683–1706, https://doi.org/10.5194/amt-3-1683-2010, 2010.
Lau, K.-M., Yang, G. J., and Shen, S. H.: Seasonal and Intraseasonal Climatology of Summer Monsoon Rainfall over East Asia, Mon. Weather Rev., 116, 18–37, https://doi.org/10.1175/1520-0493(1988)116<0018:SAICOS>2.0.CO;2, 1988.
Li, W., El-Askary, H., Qurban, M. A., Proestakis, E., Garay, M. J., Kalashnikova, O. V., Amiridis, V., Gkikas, A., Marinou, E., Piechota, T., and Manikandan, K. P.: An Assessment of Atmospheric and Meteorological Factors Regulating Red Sea Phytoplankton Growth, Remote Sens., 10, 673, https://doi.org/10.3390/rs10050673, 2018.
Liu, D., Wang, Z., Liu, Z., Winker, D., and Trepte, C.: A height resolved global view of dust aerosols from the first year CALIPSO lidar measurements, J. Geophys. Res.-Atmos., 113, D16214, https://doi.org/10.1029/2007JD009776, 2008.
Liu, D., Taylor, J. W., Crosier, J., Marsden, N., Bower, K. N., Lloyd, G., Ryder, C. L., Brooke, J. K., Cotton, R., Marenco, F., Blyth, A., Cui, Z., Estelles, V., Gallagher, M., Coe, H., and Choularton, T. W.: Aircraft and ground measurements of dust aerosols over the west African coast in summer 2015 during ICE-D and AER-D, Atmos. Chem. Phys., 18, 3817–3838, https://doi.org/10.5194/acp-18-3817-2018, 2018.
Liu, Z., Vaughan, M., Winker, D., Kittaka, C., Getzewich, B., Kuehn, R., Omar, A., Powell, K., Trepte, C., and Hostetler, C.: The CALIPSO Lidar Cloud and Aerosol Discrimination: Version 2 Algorithm and Initial Assessment of Performance, J. Atmos. Ocean. Technol., 26, 1198–1213, https://doi.org/10.1175/2009JTECHA1229.1, 2009.
Liu, Z., Kar, J., Zeng, S., Tackett, J., Vaughan, M., Avery, M., Pelon, J., Getzewich, B., Lee, K.-P., Magill, B., Omar, A., Lucker, P., Trepte, C., and Winker, D.: Discriminating between clouds and aerosols in the CALIOP version 4.1 data products, Atmos. Meas. Tech., 12, 703–734, https://doi.org/10.5194/amt-12-703-2019, 2019.
Liu, Z. Y., Sugimoto, N., and Murayama, T.: Extinction-to-backscatter ratio of Asian dust observed with high-spectral-resolution lidar and Raman lidar, Appl. Opt., 41, 2760–2767, https://doi.org/10.1364/AO.41.002760, 2002.
Lopatin, A., Dubovik, O., Chaikovsky, A., Goloub, P., Lapyonok, T., Tanré, D., and Litvinov, P.: Enhancement of aerosol characterization using synergy of lidar and sun-photometer coincident observations: the GARRLiC algorithm, Atmos. Meas. Tech., 6, 2065–2088, https://doi.org/10.5194/amt-6-2065-2013, 2013.
Ma, X., Bartlett, K., Harmon, K., and Yu, F.: Comparison of AOD between CALIPSO and MODIS: significant differences over major dust and biomass burning regions, Atmos. Meas. Tech., 6, 2391–2401, https://doi.org/10.5194/amt-6-2391-2013, 2013.
Maheras, P., Flocas, H. a., Patrikas, I., and Anagnostopoulou, Chr.: A 40 year objective climatology of surface cyclones in the Mediterranean region: spatial and temporal distribution, Int. J. Climatol., 21, 109–130, https://doi.org/10.1002/joc.599, 2001.
Mahowald, N., Albani, S., Kok, J. F., Engelstaeder, S., Scanza, R., Ward, D. S., and Flanner, M. G.: The size distribution of desert dust aerosols and its impact on the Earth system, Aeolian Res., 15, 53–71, https://doi.org/10.1016/j.aeolia.2013.09.002, 2014.
Mamouri, R. E. and Ansmann, A.: Fine and coarse dust separation with polarization lidar, Atmos. Meas. Tech., 7, 3717–3735, https://doi.org/10.5194/amt-7-3717-2014, 2014.
Mamouri, R.-E. and Ansmann, A.: Potential of polarization lidar to provide profiles of CCN- and INP-relevant aerosol parameters, Atmos. Chem. Phys., 16, 5905–5931, https://doi.org/10.5194/acp-16-5905-2016, 2016.
Mamouri, R.-E. and Ansmann, A.: Potential of polarization/Raman lidar to separate fine dust, coarse dust, maritime, and anthropogenic aerosol profiles, Atmos. Meas. Tech., 10, 3403–3427, https://doi.org/10.5194/amt-10-3403-2017, 2017.
Mamouri, R. E., Ansmann, A., Nisantzi, A., Kokkalis, P., Schwarz, A., and Hadjimitsis, D.: Low Arabian dust extinction-to-backscatter ratio, Geophys. Res. Lett., 40, 4762–4766, https://doi.org/10.1002/grl.50898, 2013.
Mao, R., Ho, C.-H., Shao, Y., Gong, D.-Y., and Kim, J.: Influence of arctic oscillation on dust activity over northeast Asia, Atmos. Environ., 45, 326–337, https://doi.org/10.1016/j.atmosenv.2010.10.020, 2011.
Marenco, F.: Nadir airborne lidar observations of deep aerosol layers, Atmos. Meas. Tech., 6, 2055–2064, https://doi.org/10.5194/amt-6-2055-2013, 2013.
Marenco, F., Johnson, B., Turnbull, K., Newman, S., Haywood, J., Webster, H., and Ricketts, H.: Airborne lidar observations of the 2010 Eyjafjallajokull volcanic ash plume, J. Geophys. Res.-Atmos., 116, D00u05, https://doi.org/10.1029/2011jd016396, 2011.
Marenco, F., Amiridis, V., Marinou, E., Tsekeri, A., and Pelon, J.: Airborne verification of CALIPSO products over the Amazon: a case study of daytime observations in a complex atmospheric scene, Atmos. Chem. Phys., 14, 11871–11881, https://doi.org/10.5194/acp-14-11871-2014, 2014.
Marenco, F., Ryder, C., Estellés, V., O'Sullivan, D., Brooke, J., Orgill, L., Lloyd, G., and Gallagher, M.: Unexpected vertical structure of the Saharan Air Layer and giant dust particles during AER-D, Atmos. Chem. Phys., 18, 17655–17668, https://doi.org/10.5194/acp-18-17655-2018, 2018.
Marinou, E., Amiridis, V., Binietoglou, I., Tsikerdekis, A., Solomos, S., Proestakis, E., Konsta, D., Papagiannopoulos, N., Tsekeri, A., Vlastou, G., Zanis, P., Balis, D., Wandinger, U., and Ansmann, A.: Three-dimensional evolution of Saharan dust transport towards Europe based on a 9-year EARLINET-optimized CALIPSO dataset, Atmos. Chem. Phys., 17, 5893–5919, https://doi.org/10.5194/acp-17-5893-2017, 2017.
Marinou, E., Tesche, M., Nenes, A., Ansmann, A., Schrod, J., Mamali, D., Tsekeri, A., Pikridas, M., Baars, H., Engelmann, R., Voudouri, K.-A., Solomos, S., Sciare, J., Groß, S., Ewald, F., and Amiridis, V.: Retrieval of ice-nucleating particle concentrations from lidar observations and comparison with UAV in situ measurements, Atmos. Chem. Phys., 19, 11315–11342, https://doi.org/10.5194/acp-19-11315-2019, 2019.
Marticoreìna, B.: Mineral Dust – A key player in the Earth system, Chapter 5: Dust production mechanisms, Springer, 93–120, ISBN 978-94-017-8977-6, https://doi.org/10.1007/978-94-017-8978-3, 2014.
Martinelli, N., Olivieri, O., and Girelli, D.: Air particulate matter and cardiovascular disease: A narrative review, Eur. J. Intern. Med., 24, 295–302, https://doi.org/10.1016/j.ejim.2013.04.001, 2013.
Masoom, A., Kosmopoulos, P., Bansal, A., Gkikas, A., Proestakis, E., Kazadzis, S., and Amiridis, V.: Forecasting dust impact on solar energy using remote sensing and modeling techniques, Solar Energy, 228, 317–332, https://doi.org/10.1016/j.solener.2021.09.033, 2021.
Mattis, I., Ansmann, A., Muller, D., Wandinger, U., and Althausen, D.: Dual-wavelength Raman lidar observations of the extinction-to-backscatter ratio of Saharan dust, Geophys. Res. Lett., 29, 1306, https://doi.org/10.1029/2002GL014721, 2002.
Mattis, I., Mueller, D., Ansmann, A., Wandinger, U., Preissler, J., Seifert, P., and Tesche, M.: Ten years of multiwavelength Raman lidar observations of free-tropospheric aerosol layers over central Europe: Geometrical properties and annual cycle, J. Geophys. Res.-Atmos., 113, D20202, https://doi.org/10.1029/2007JD009636, 2008.
McGill, M. J., Yorks, J. E., Scott, V. S., Kupchock, A. W., and Selmer, P. A.: The Cloud Aerosol Transport System (CATS): A technology demonstration on the International Space Station, Proc. SPIE 9612, Lidar Remote Sensing for Environmental Monitoring XV, 96120A, https://doi.org/10.1117/12.2190841, 2015.
Miller, R. L., Cakmur, R. V., Perlwitz, J., Geogdzhayev, I. V., Ginoux, P., Koch, D., Kohfeld, K. E., Prigent, C., Ruedy, R., Schmidt, G. A., and Tegen, I.: Mineral dust aerosols in the NASA goddard institute for Space Sciences ModelE atmospheric general circulation model, J. Geophys. Res.-Atmos., 111, D06208, https://doi.org/10.1029/2005JD005796, 2006.
Mona, L., Amodeo, A., Pandolfi, M., and Pappalardo, G.: Saharan dust intrusions in the Mediterranean area: Three years of Raman lidar measurements, J. Geophys. Res.-Atmos., 111, D16203, https://doi.org/10.1029/2005JD006569, 2006.
Moulin, C. and Chiapello, I.: Impact of human-induced desertification on the intensification of Sahel dust emission and export over the last decades, Geophys. Res. Lett., 33, L18808, https://doi.org/10.1029/2006GL025923, 2006.
Müller, D., Ansmann, A., Mattis, I., Tesche, M., Wandinger, U., Althausen, D., and Pisani, G.: Aerosol-type-dependent lidar ratios observed with Raman lidar, J. Geophys. Res.-Atmos., 112, D16202, https://doi.org/10.1029/2006JD008292, 2007a.
Müller, D., Mattis, I., Ansmann, A., Wandinger, U., Ritter, C., and Kaiser, D.: Multiwavelength Raman lidar observations of particle growth during long-range transport of forest-fire smoke in the free troposphere, Geophys. Res. Lett., 34, L05803, https://doi.org/10.1029/2006GL027936, 2007b.
Murayama, T., Masonis, S. J., Redemann, J., Anderson, T. L., Schmid, B., Livingston, J. M., Russell, P. B., Huebert, B., Howell, S. G., McNaughton, C. S., Clarke, A., Abo, M., Shimizu, A., Sugimoto, N., Yabuki, M., Kuze, H., Fukagawa, S., Maxwell-Meier, K., Weber, R. J., Orsini, D. A., Blomquist, B., Bandy, A., and Thornton, D.: An intercomparison of lidar-derived aerosol optical properties with airborne measurements near Tokyo during ACE-Asia, J. Geophys. Res.-Atmos., 108, 8651, https://doi.org/10.1029/2002JD003259, 2003.
Murayama, T., Müller, D., Wada, K., Shimizu, A., Sekiguchi, M., and Tsukamoto, T.: Characterization of Asian dust and Siberian smoke with multi-wavelength Raman lidar over Tokyo, Japan in spring 2003, Geophys. Res. Lett., 31, L23103, https://doi.org/10.1029/2004GL021105, 2004.
Nicolae, D., Nemuc, A., Müller, D., Talianu, C., Vasilescu, J., Belegante, L., and Kolgotin, A.: Characterization of fresh and aged biomass burning events using multiwavelength Raman lidar and mass spectrometry, J. Geophys. Res.-Atmos., 118, 2956–2965, https://doi.org/10.1002/jgrd.50324, 2013.
Nisantzi, A., Mamouri, R. E., Ansmann, A., Schuster, G. L., and Hadjimitsis, D. G.: Middle East versus Saharan dust extinction-to-backscatter ratios, Atmos. Chem. Phys., 15, 7071–7084, https://doi.org/10.5194/acp-15-7071-2015, 2015.
Noh, Y. M., Kim, Y. J., Choi, B. C., and Murayama, T.: Aerosol lidar ratio characteristics measured by a multi-wavelength Raman lidar system at Anmyeon Island, Korea, Atmos. Res., 86, 76–87, https://doi.org/10.1016/j.atmosres.2007.03.006, 2007.
Noh, Y. M., Kim, Y. J., and Müller, D.: Seasonal characteristics of lidar ratios measured with a Raman lidar at Gwangju, Korea in spring and autumn, Atmos. Environ., 42, 2208–2224, https://doi.org/10.1016/j.atmosenv.2007.11.045, 2008.
Noh, Y. M., Müller, D., Lee, H., and Choi, T. J.: Influence of biogenic pollen on optical properties of atmospheric aerosols observed by lidar over Gwangju, South Korea, Atmos. Environ., 69, 139–147, https://doi.org/10.1016/j.atmosenv.2012.12.018, 2013.
Okin, G. S., Mahowald, N., Chadwick, O. A., and Artaxo, P.: Impact of desert dust on the biogeochemistry of phosphorus in terrestrial ecosystems, Global Biogeochem. Cy., 18, GB2005, https://doi.org/10.1029/2003GB002145, 2004.
Omar, A. H., Winker, D. M., Vaughan, M. A., Hu, Y., Trepte, C. R., Ferrare, R. A., Lee, K.-P., Hostetler, C. A., Kittaka, C., Rogers, R. R., Kuehn, R. E., and Liu, Z.: The CALIPSO Automated Aerosol Classification and Lidar Ratio Selection Algorithm, J. Atmos. Ocean. Tech., 26, 1994–2014, https://doi.org/10.1175/2009JTECHA1231.1, 2009.
Omar, A. H., Winker, D. M., Tackett, J. L., Giles, D. M., Kar, J., Liu, Z., Vaughan, M. A., Powell, K. A., and Trepte, C. R.: CALIOP and AERONET aerosol optical depth comparisons: One size fits none, J. Geophys. Res.-Atmos., 118, 4748–4766, https://doi.org/10.1002/jgrd.50330, 2013.
O'Neill, N. T., Eck, T. F., Holben, B. N., Smirnov, A., Dubovik, O., and Royer, A.: Bimodal size distribution influences on the variation of Angstrom derivatives in spectral and optical depth space, J. Geophys. Res., 106, 9787–9806, 2001a.
O'Neill, N. T., Dubovik, O., and Eck, T. F.: A modified Angstrom coefficient for the characterization of sub-micron aerosols, App. Opt., 40, 2368–2374, 2001b.
O'Neill, N. T., Eck, T. F., Smirnov, A., Holben, B. N., and Thulasiraman, S.: Spectral discrimination of coarse and fine mode optical depth, J. Geophys. Res., 108, 4559–4573, https://doi.org/10.1029/2002JD002975, 2003.
O'Sullivan, D., Marenco, F., Ryder, C. L., Pradhan, Y., Kipling, Z., Johnson, B., Benedetti, A., Brooks, M., McGill, M., Yorks, J., and Selmer, P.: Models transport Saharan dust too low in the atmosphere: a comparison of the MetUM and CAMS forecasts with observations, Atmos. Chem. Phys., 20, 12955–12982, https://doi.org/10.5194/acp-20-12955-2020, 2020.
Papachristopoulou, K., Fountoulakis, I., Gkikas, A., Kosmopoulos, P. G., Nastos, P. T., Hatzaki, M., and Kazadzis, S.: 15-Year Analysis of Direct Effects of Total and Dust Aerosols in Solar Radiation/Energy over the Mediterranean Basin, Remote Sens., 14, 1535, https://doi.org/10.3390/rs14071535, 2022.
Papagiannopoulos, N., D'Amico, G., Gialitaki, A., Ajtai, N., Alados-Arboledas, L., Amodeo, A., Amiridis, V., Baars, H., Balis, D., Binietoglou, I., Comerón, A., Dionisi, D., Falconieri, A., Fréville, P., Kampouri, A., Mattis, I., Mijić, Z., Molero, F., Papayannis, A., Pappalardo, G., Rodríguez-Gómez, A., Solomos, S., and Mona, L.: An EARLINET early warning system for atmospheric aerosol aviation hazards, Atmos. Chem. Phys., 20, 10775–10789, https://doi.org/10.5194/acp-20-10775-2020, 2020.
Papayannis, A., Amiridis, V., Mona, L., Tsaknakis, G., Balis, D., Boesenberg, J., Chaikovski, A., De Tomasi, F., Grigorov, I., Mattis, I., Mitev, V., Mueller, D., Nickovic, S., Perez, C., Pietruczuk, A., Pisani, G., Ravetta, F., Rizi, V., Sicard, M., Trickl, T., Wiegner, M., Gerding, M., Mamouri, R. E., D'Amico, G., and Pappalardo, G.: Systematic lidar observations of Saharan dust over Europe in the frame of EARLINET (2000–2002), J. Geophys. Res.-Atmos., 113, D10204, https://doi.org/10.1029/2007JD009028, 2008.
Pappalardo, G., Wandinger, U., Mona, L., Hiebsch, A., Mattis, I., Amodeo, A., Ansmann, A., Seifert, P., Linné, H., Apituley, A., Alados Arboledas, L., Balis, D., Chaikovsky, A., D'Amico, G., De Tomasi, F., Freudenthaler, V., Giannakaki, E., Giunta, A., Grigorov, I., Iarlori, M., Madonna, F., Mamouri, R.-E., Nasti, L., Papayannis, A., Pietruczuk, A., Pujadas, M., Rizi, V., Rocadenbosch, F., Russo, F., Schnell, F., Spinelli, N., Wang, X., and Wiegner, M.: EARLINET correlative measurements for CALIPSO: First intercomparison results, J. Geophys. Res.-Atmos., 115, D00H19, https://doi.org/10.1029/2009JD012147, 2010.
Pappalardo, G., Amodeo, A., Apituley, A., Comeron, A., Freudenthaler, V., Linné, H., Ansmann, A., Bösenberg, J., D'Amico, G., Mattis, I., Mona, L., Wandinger, U., Amiridis, V., Alados-Arboledas, L., Nicolae, D., and Wiegner, M.: EARLINET: towards an advanced sustainable European aerosol lidar network, Atmos. Meas. Tech., 7, 2389–2409, https://doi.org/10.5194/amt-7-2389-2014, 2014.
Pauly, R. M., Yorks, J. E., Hlavka, D. L., McGill, M. J., Amiridis, V., Palm, S. P., Rodier, S. D., Vaughan, M. A., Selmer, P. A., Kupchock, A. W., Baars, H., and Gialitaki, A.: Cloud-Aerosol Transport System (CATS) 1064 nm calibration and validation, Atmos. Meas. Tech., 12, 6241–6258, https://doi.org/10.5194/amt-12-6241-2019, 2019.
Penner, J. E., Charlson, R. J., Hales, J. M., Laulainen, N. S., Leifer, R., Novakov, T., Ogren, J., Radke, L. F., Schwartz, S. E., and Travis, L.: Quantifying and Minimizing Uncertainty of Climate Forcing by Anthropogenic Aerosols, B. Am. Meteorol. Soc., 75, 375–400, https://doi.org/10.1175/1520-0477(1994)075<0375:QAMUOC>2.0.CO;2, 1994.
Pérez García-Pando, C., Miller, R. L., Perlwitz, J. P., Rodríguez, S., and Prospero, J. M.: Predicting the mineral composition of dust aerosols: Insights from elemental composition measured at the Izaña Observatory, Geophys. Res. Lett., 43, 10520–10529, https://doi.org/10.1002/2016GL069873, 2016.
Pisso, I., Sollum, E., Grythe, H., Kristiansen, N. I., Cassiani, M., Eckhardt, S., Arnold, D., Morton, D., Thompson, R. L., Groot Zwaaftink, C. D., Evangeliou, N., Sodemann, H., Haimberger, L., Henne, S., Brunner, D., Burkhart, J. F., Fouilloux, A., Brioude, J., Philipp, A., Seibert, P., and Stohl, A.: The Lagrangian particle dispersion model FLEXPART version 10.4, Geosci. Model Dev., 12, 4955–4997, https://doi.org/10.5194/gmd-12-4955-2019, 2019.
Powell, K. A., Hostetler, C. A., Vaughan, M. A., Lee, K.-P., Trepte, C. R., Rogers, R. R., Winker, D. M., Liu, Z., Kuehn, R. E., Hunt, W. H., and Young, S. A.: CALIPSO Lidar Calibration Algorithms. Part I: Nighttime 532-nm Parallel Channel and 532-nm Perpendicular Channel, J. Atmos. Ocean. Technol., 26, 2015–2033, https://doi.org/10.1175/2009JTECHA1242.1, 2009.
Preißler, J., Wagner, F., Pereira, S. N., and Guerrero-Rascado, J. L.: Multi-instrumental observation of an exceptionally strong Saharan dust outbreak over Portugal, J. Geophys. Res.-Atmos., 116, D24204, https://doi.org/10.1029/2011JD016527, 2011.
Preißler, J., Wagner, F., Guerrero-Rascado, J. L., and Silva, A. M.: Two years of free-tropospheric aerosol layers observed over Portugal by lidar, J. Geophys. Res.-Atmos., 118, 3676–3686, https://doi.org/10.1002/jgrd.50350, 2013.
Proestakis, E.: A four-dimensional, multiyear, and near-global climate data record of the fine-mode (sub-micrometer in terms of diameter) and coarse-mode (super-micrometer in terms of diameter) components of atmospheric pure-dust, (Version 1), Zenodo [data set], https://doi.org/10.5281/zenodo.10389741, 2023.
Proestakis, E., Amiridis, V., Marinou, E., Georgoulias, A. K., Solomos, S., Kazadzis, S., Chimot, J., Che, H., Alexandri, G., Binietoglou, I., Daskalopoulou, V., Kourtidis, K. A., de Leeuw, G., and van der A, R. J.: Nine-year spatial and temporal evolution of desert dust aerosols over South and East Asia as revealed by CALIOP, Atmos. Chem. Phys., 18, 1337–1362, https://doi.org/10.5194/acp-18-1337-2018, 2018.
Proestakis, E., Amiridis, V., Marinou, E., Binietoglou, I., Ansmann, A., Wandinger, U., Hofer, J., Yorks, J., Nowottnick, E., Makhmudov, A., Papayannis, A., Pietruczuk, A., Gialitaki, A., Apituley, A., Szkop, A., Muñoz Porcar, C., Bortoli, D., Dionisi, D., Althausen, D., Mamali, D., Balis, D., Nicolae, D., Tetoni, E., Liberti, G. L., Baars, H., Mattis, I., Stachlewska, I. S., Voudouri, K. A., Mona, L., Mylonaki, M., Perrone, M. R., Costa, M. J., Sicard, M., Papagiannopoulos, N., Siomos, N., Burlizzi, P., Pauly, R., Engelmann, R., Abdullaev, S., and Pappalardo, G.: EARLINET evaluation of the CATS Level 2 aerosol backscatter coefficient product, Atmos. Chem. Phys., 19, 11743–11764, https://doi.org/10.5194/acp-19-11743-2019, 2019.
Prospero, J. M.: Long-range transport of mineral dust in the global atmosphere: Impact of African dust on the environment of the southeastern United States, P. Natl. Acad. Sci. USA, 96, 3396–3403, 1999.
Prospero, J. M., Ginoux, P., Torres, O., Nicholson, S. E., and Gill, T. E.: Environmental Characterization of Global Sources of Atmospheric Soil Dust Identified with the Nimbus 7 Total Ozone Mapping Spectrometer (toms) Absorbing Aerosol Product, Rev. Geophys., 40, 2-1–2-31, https://doi.org/10.1029/2000RG000095, 2002.
Prospero, J. M., Collard, F.-X., Molinié, J., and Jeannot, A.: Characterizing the annual cycle of African dust transport to the Caribbean Basin and South America and its impact on the environment and air quality, Global Biogeochem. Cy., 28, 757–773, https://doi.org/10.1002/2013GB004802, 2014.
Rajot, J. L., Formenti, P., Alfaro, S., Desboeufs, K., Chevaillier, S., Chatenet, B., Gaudichet, A., Journet, E., Marticorena, B., Triquet, S., Maman, A., Mouget, N., and Zakou, A.: AMMA dust experiment: An overview of measurements performed during the dry season special observation period (SOP0) at the Banizoumbou (Niger) supersite, J. Geophys. Res.-Atmos., 113, D00C14, https://doi.org/10.1029/2008JD009906, 2008.
Ramanathan, V., Crutzen, P. J., Lelieveld, J., Mitra, A. P., Althausen, D., Anderson, J., Andreae, M. O., Cantrell, W., Cass, G. R., Chung, C. E., Clarke, A. D., Coakley, J. A., Collins, W. D., Conant, W. C., Dulac, F., Heintzenberg, J., Heymsfield, A. J., Holben, B., Howell, S., Hudson, J., Jayaraman, A., Kiehl, J. T., Krishnamurti, T. N., Lubin, D., McFarquhar, G., Novakov, T., Ogren, J. A., Podgorny, I. A., Prather, K., Priestley, K., Prospero, J. M., Quinn, P. K., Rajeev, K., Rasch, P., Rupert, S., Sadourny, R., Satheesh, S. K., Shaw, G. E., Sheridan, P., and Valero, F. P. J.: Indian Ocean Experiment: An integrated analysis of the climate forcing and effects of the great Indo-Asian haze, J. Geophys. Res.-Atmos., 106, 28371–28398, https://doi.org/10.1029/2001JD900133, 2001.
Ramaswamy, V. P., Muraleedharan, M., and Prakash Babu, C.: Mid-troposphere transport of Middle-East dust over the Arabian Sea and its effect on rainwater composition and sensitive ecosystems over India, Sci. Rep.-UK, 7, 13676, https://doi.org/10.1038/s41598-017-13652-1, 2018.
Randles, C. A., Silva, A. M. da, Buchard, V., Colarco, P. R., Darmenov, A., Govindaraju, R., Smirnov, A., Holben, B., Ferrare, R., Hair, J., Shinozuka, Y., and Flynn, C. J.: The MERRA-2 Aerosol Reanalysis, 1980 Onward. Part I: System Description and Data Assimilation Evaluation, J. Climate, 30, 6823–6850, https://doi.org/10.1175/JCLI-D-16-0609.1, 2017.
Redemann, J., Vaughan, M. A., Zhang, Q., Shinozuka, Y., Russell, P. B., Livingston, J. M., Kacenelenbogen, M., and Remer, L. A.: The comparison of MODIS-Aqua (C5) and CALIOP (V2 & V3) aerosol optical depth, Atmos. Chem. Phys., 12, 3025–3043, https://doi.org/10.5194/acp-12-3025-2012, 2012.
Rittmeister, F., Ansmann, A., Engelmann, R., Skupin, A., Baars, H., Kanitz, T., and Kinne, S.: Profiling of Saharan dust from the Caribbean to western Africa – Part 1: Layering structures and optical properties from shipborne polarization/Raman lidar observations, Atmos. Chem. Phys., 17, 12963–12983, https://doi.org/10.5194/acp-17-12963-2017, 2017.
Rogers, R. R., Vaughan, M. A., Hostetler, C. A., Burton, S. P., Ferrare, R. A., Young, S. A., Hair, J. W., Obland, M. D., Harper, D. B., Cook, A. L., and Winker, D. M.: Looking through the haze: evaluating the CALIPSO level 2 aerosol optical depth using airborne high spectral resolution lidar data, Atmos. Meas. Tech., 7, 4317–4340, https://doi.org/10.5194/amt-7-4317-2014, 2014.
Rosenberg, P. D., Dean, A. R., Williams, P. I., Dorsey, J. R., Minikin, A., Pickering, M. A., and Petzold, A.: Particle sizing calibration with refractive index correction for light scattering optical particle counters and impacts upon PCASP and CDP data collected during the Fennec campaign, Atmos. Meas. Tech., 5, 1147–1163, https://doi.org/10.5194/amt-5-1147-2012, 2012.
Rosenfeld, D., Lohmann, U., Raga, G. B., O'Dowd, C. D., Kulmala, M., Fuzzi, S., Reissell, A., and Andreae, M. O.: Flood or Drought: How Do Aerosols Affect Precipitation?, Science, 321, 1309–1313, https://doi.org/10.1126/science.1160606, 2008.
Ryder, C. L., Marenco, F., Brooke, J. K., Estelles, V., Cotton, R., Formenti, P., McQuaid, J. B., Price, H. C., Liu, D., Ausset, P., Rosenberg, P. D., Taylor, J. W., Choularton, T., Bower, K., Coe, H., Gallagher, M., Crosier, J., Lloyd, G., Highwood, E. J., and Murray, B. J.: Coarse-mode mineral dust size distributions, composition and optical properties from AER-D aircraft measurements over the tropical eastern Atlantic, Atmos. Chem. Phys., 18, 17225–17257, https://doi.org/10.5194/acp-18-17225-2018, 2018.
Ryder, C. L., Highwood, E. J., Walser, A., Seibert, P., Philipp, A., and Weinzierl, B.: Coarse and giant particles are ubiquitous in Saharan dust export regions and are radiatively significant over the Sahara, Atmos. Chem. Phys., 19, 15353–15376, https://doi.org/10.5194/acp-19-15353-2019, 2019.
Ryder, C. L., Bézier, C., Dacre, H. F., Clarkson, R., Amiridis, V., Marinou, E., Proestakis, E., Kipling, Z., Benedetti, A., Parrington, M., Rémy, S., and Vaughan, M.: Aircraft Engine Dust Ingestion at Global Airports, EGUsphere [preprint], https://doi.org/10.5194/egusphere-2023-662, 2023.
Saito, M. and Yang, P.: Advanced Bulk Optical Models Linking the Backscattering and Microphysical Properties of Mineral Dust Aerosol, Geophys. Res. Lett., 48, e2021GL095121, https://doi.org/10.1029/2021GL095121, 2021.
Sakai, T., Shibata, T., Iwasaka, Y., Nagai, T., Nakazato, M., Matsumura, T., Ichiki, A., Kim, Y. S., Tamura, K., Troshkin, D., and Hamdi, S.: Case study of Raman lidar measurements of Asian dust events in 2000 and 2001 at Nagoya and Tsukuba, Japan, Atmos. Environ., 36, 5479–5489, https://doi.org/10.1016/S1352-2310(02)00664-7, 2002.
Sakai, T., Nagai, T., Nakazato, M., Mano, Y., and Matsumura, T.: Ice clouds and Asian dust studied with lidar measurements of particle extinction-to-backscatter ratio, particle depolarization, and water-vapor mixing ratio over Tsukuba, Appl. Opt., 42, 7103–7116, https://doi.org/10.1364/AO.42.007103, 2003.
Sakai, T., Nagai, T., Zaizen, Y., and Mano, Y.: Backscattering linear depolarization ratio measurements of mineral, sea-salt, and ammonium sulfate particles simulated in a laboratory chamber, Appl. Opt., 49, 4441–4449, https://doi.org/10.1364/AO.49.004441, 2010.
Schepanski, K., Tegen, I., and Macke, A.: Saharan dust transport and deposition towards the tropical northern Atlantic, Atmos. Chem. Phys., 9, 1173–1189, https://doi.org/10.5194/acp-9-1173-2009, 2009.
Schepanski, K., Heinold, B., and Tegen, I.: Harmattan, Saharan heat low, and West African monsoon circulation: modulations on the Saharan dust outflow towards the North Atlantic, Atmos. Chem. Phys., 17, 10223–10243, https://doi.org/10.5194/acp-17-10223-2017, 2017.
Schneider, T., Bischoff, T., and Haug, G. H.: Migrations and dynamics of the intertropical convergence zone, Nature, 513, 45–53, https://doi.org/10.1038/nature13636, 2014.
Schuster, G. L., Vaughan, M., MacDonnell, D., Su, W., Winker, D., Dubovik, O., Lapyonok, T., and Trepte, C.: Comparison of CALIPSO aerosol optical depth retrievals to AERONET measurements, and a climatology for the lidar ratio of dust, Atmos. Chem. Phys., 12, 7431–7452, https://doi.org/10.5194/acp-12-7431-2012, 2012.
Seinfeld, J. H. and Pandis, S. N.: Atmospheric chemistry and physics: from air pollution to climate change, John Wiley & Sons, ISBN 978-1-118-94740-1, 2006.
Shaw, G. E.: Transport of Asian Desert Aerosol to the Hawaiian Islands, J. Appl. Meteorol. Climatol., 19, 1254–1259, https://doi.org/10.1175/1520-0450(1980)019<1254:TOADAT>2.0.CO;2, 1980.
Shimizu, A., Sugimoto, N., Matsui, I., Arao, K., Uno, I., Murayama, T., Kagawa, N., Aoki, K., Uchiyama, A., and Yamazaki, A.: Continuous observations of Asian dust and other aerosols by polarization lidars in China and Japan during ACE-Asia, J. Geophys. Res.-Atmos., 109, D19S17, https://doi.org/10.1029/2002JD003253, 2004.
Shimizu, A., Nishizawa, T., Jin, Y., Kim, S.-W., Wang, Z., Batdorj, D., and Sugimoto, N.: Evolution of a lidar network for tropospheric aerosol detection in East Asia, Opt. Eng., 56, 031219, https://doi.org/10.1117/1.OE.56.3.031219, 2017.
Sinyuk, A., Holben, B. N., Eck, T. F., Giles, D. M., Slutsker, I., Korkin, S., Schafer, J. S., Smirnov, A., Sorokin, M., and Lyapustin, A.: The AERONET Version 3 aerosol retrieval algorithm, associated uncertainties and comparisons to Version 2, Atmos. Meas. Tech., 13, 3375–3411, https://doi.org/10.5194/amt-13-3375-2020, 2020.
Snider, G., Weagle, C. L., Martin, R. V., van Donkelaar, A., Conrad, K., Cunningham, D., Gordon, C., Zwicker, M., Akoshile, C., Artaxo, P., Anh, N. X., Brook, J., Dong, J., Garland, R. M., Greenwald, R., Griffith, D., He, K., Holben, B. N., Kahn, R., Koren, I., Lagrosas, N., Lestari, P., Ma, Z., Vanderlei Martins, J., Quel, E. J., Rudich, Y., Salam, A., Tripathi, S. N., Yu, C., Zhang, Q., Zhang, Y., Brauer, M., Cohen, A., Gibson, M. D., and Liu, Y.: SPARTAN: a global network to evaluate and enhance satellite-based estimates of ground-level particulate matter for global health applications, Atmos. Meas. Tech., 8, 505–521, https://doi.org/10.5194/amt-8-505-2015, 2015.
Snider, G., Weagle, C. L., Murdymootoo, K. K., Ring, A., Ritchie, Y., Stone, E., Walsh, A., Akoshile, C., Anh, N. X., Balasubramanian, R., Brook, J., Qonitan, F. D., Dong, J., Griffith, D., He, K., Holben, B. N., Kahn, R., Lagrosas, N., Lestari, P., Ma, Z., Misra, A., Norford, L. K., Quel, E. J., Salam, A., Schichtel, B., Segev, L., Tripathi, S., Wang, C., Yu, C., Zhang, Q., Zhang, Y., Brauer, M., Cohen, A., Gibson, M. D., Liu, Y., Martins, J. V., Rudich, Y., and Martin, R. V.: Variation in global chemical composition of PM2.5: emerging results from SPARTAN, Atmos. Chem. Phys., 16, 9629–9653, https://doi.org/10.5194/acp-16-9629-2016, 2016.
Sokolik, I. N. and Toon, O. B.: Direct radiative forcing by anthropogenic airborne mineral aerosols, Nature, 381, 681–683, https://doi.org/10.1038/381681a0, 1996.
Solomos, S., Gialitaki, A., Marinou, E., Proestakis, E., Amiridis, V., Baars, H., Komppula, M., and Ansmann, A.: Modeling and remote sensing of an indirect Pyro-Cb formation and biomass transport from Portugal wildfires towards Europe, Atmos. Environ., 206, 303–315, https://doi.org/10.1016/j.atmosenv.2019.03.009, 2019.
Soupiona, O., Samaras, S., Ortiz-Amezcua, P., Boeckmann, C., Papayannis, A., Moreira, G. A., Benavent-Oltra, J. A., Guerrero-Rascado, J. L., Bedoya-Velasquez, A. E., Olmo, F. J., Roman, R., Kokkalis, P., Mylonaki, M., Alados-Arboledas, L., Papanikolaou, C. A., and Foskinis, R.: Retrieval of optical and microphysical properties of transported Saharan dust over Athens and Granada based on multi-wavelength Raman lidar measurements: Study of the mixing processes, Atmos. Environ., 214, 116824, https://doi.org/10.1016/j.atmosenv.2019.116824, 2019.
Spurny, K. R.: Methods of Aerosol Measurement before the 1960s, Aerosol Sci. Technol., 29, 329–349, https://doi.org/10.1080/02786829808965573, 1998.
Stefanski, R. and Sivakumar, M. V. K.: Impacts of sand and dust storms on agriculture and potential agricultural applications of a SDSWS, IOP Conf. Ser.: Earth Environ. Sci., 7, 012016, https://doi.org/10.1088/1755-1307/7/1/012016, 2009.
Stephens, G., Winker, D., Pelon, J., Trepte, C., Vane, D., Yuhas, C., L'Ecuyer, T., and Lebsock, M.: CloudSat and CALIPSO within the A-Train: Ten Years of Actively Observing the Earth System, B. Am. Meteorol. Soc., 99, 569–581, https://doi.org/10.1175/BAMS-D-16-0324.1, 2018.
Stohl, A., Forster, C., Frank, A., Seibert, P., and Wotawa, G.: Technical note: The Lagrangian particle dispersion model FLEXPART version 6.2, Atmos. Chem. Phys., 5, 2461–2474, https://doi.org/10.5194/acp-5-2461-2005, 2005.
Sugimoto, N., Uno, I., Nishikawa, M., Shimizu, A., Matsui, I., Dong, X., Chen, Y., and Quan, H.: Record heavy Asian dust in Beijing in 2002: Observations and model analysis of recent events, Geophys. Res. Lett., 30, 1194, https://doi.org/10.1029/2002GL016349, 2003.
Tackett, J. L., Winker, D. M., Getzewich, B. J., Vaughan, M. A., Young, S. A., and Kar, J.: CALIPSO lidar level 3 aerosol profile product: version 3 algorithm design, Atmos. Meas. Tech., 11, 4129–4152, https://doi.org/10.5194/amt-11-4129-2018, 2018.
Tegen, I. and Fung, I.: Contribution to the atmospheric mineral aerosol load from land surface modification, J. Geophys. Res., 100, 18707–18726, https://doi.org/10.1029/95jd02051, 1995.
Tegen, I. and Lacis, A. A.: Modeling of particle size distribution and its influence on the radiative properties of mineral dust aerosol, J. Geophys. Res.-Atmos., 101, 19237–19244, https://doi.org/10.1029/95JD03610, 1996.
Tegen, I., Lacis, A. A., and Fung, I.: The influence on climate forcing of mineral aerosols from disturbed soils, Nature, 380, 419–422, https://doi.org/10.1038/380419a0, 1996.
Tesche, M., Ansmann, A., Müller, D., Althausen, D., Engelmann, R., Hu, M., and Zhang, Y.: Particle backscatter, extinction, and lidar ratio profiling with Raman lidar in south and north China, Appl. Opt., 46, 6302–6308, https://doi.org/10.1364/AO.46.006302, 2007.
Tesche, M., Ansmann, A., Müller, D., Althausen, D., Engelmann, R., Freudenthaler, V., and Groß, S.: Vertically resolved separation of dust and smoke over Cape Verde using multiwavelength Raman and polarization lidars during Saharan Mineral Dust Experiment 2008, J. Geophys. Res.-Atmos., 114, D13202, https://doi.org/10.1029/2009JD011862, 2009.
Tesche, M., Gross, S., Ansmann, A., Müller, D., Althausen, D., Freudenthaler, V., and Esselborn, M.: Profiling of Saharan dust and biomass-burning smoke with multiwavelength polarization Raman lidar at Cape Verde, Tellus B, 63, 649–676, https://doi.org/10.1111/j.1600-0889.2011.00548.x, 2011.
Textor, C., Schulz, M., Guibert, S., Kinne, S., Balkanski, Y., Bauer, S., Berntsen, T., Berglen, T., Boucher, O., Chin, M., Dentener, F., Diehl, T., Easter, R., Feichter, H., Fillmore, D., Ghan, S., Ginoux, P., Gong, S., Grini, A., Hendricks, J., Horowitz, L., Huang, P., Isaksen, I., Iversen, I., Kloster, S., Koch, D., Kirkevåg, A., Kristjansson, J. E., Krol, M., Lauer, A., Lamarque, J. F., Liu, X., Montanaro, V., Myhre, G., Penner, J., Pitari, G., Reddy, S., Seland, Ø., Stier, P., Takemura, T., and Tie, X.: Analysis and quantification of the diversities of aerosol life cycles within AeroCom, Atmos. Chem. Phys., 6, 1777–1813, https://doi.org/10.5194/acp-6-1777-2006, 2006.
Toth, T. D., Campbell, J. R., Reid, J. S., Tackett, J. L., Vaughan, M. A., Zhang, J., and Marquis, J. W.: Minimum aerosol layer detection sensitivities and their subsequent impacts on aerosol optical thickness retrievals in CALIPSO level 2 data products, Atmos. Meas. Tech., 11, 499–514, https://doi.org/10.5194/amt-11-499-2018, 2018.
Trigo, I. F., Davies, T. D., and Bigg, G. R.: Objective Climatology of Cyclones in the Mediterranean Region, J. Climate, 12, 1685–1696, https://doi.org/10.1175/1520-0442(1999)012<1685:OCOCIT>2.0.CO;2, 1999.
Twomey, S.: The influence of pollution on the shortwave albedo of clouds, J. Atmos. Sci., 34, 1149–1152, 1977.
van der Does, M., Knippertz, P., Zschenderlein, P., Harrison, R. G., and Stuut, J.-B. W.: The mysterious long-range transport of giant mineral dust particles, Sci. Adv., 4, eaau2768, https://doi.org/10.1126/sciadv.aau2768, 2018.
Vaughan, M., Garnier, A., Josset, D., Avery, M., Lee, K.-P., Liu, Z., Hunt, W., Pelon, J., Hu, Y., Burton, S., Hair, J., Tackett, J. L., Getzewich, B., Kar, J., and Rodier, S.: CALIPSO lidar calibration at 1064 nm: version 4 algorithm, Atmos. Meas. Tech., 12, 51–82, https://doi.org/10.5194/amt-12-51-2019, 2019.
Vaughan, M. A., Powell, K. A., Winker, D. M., Hostetler, C. A., Kuehn, R. E., Hunt, W. H., Getzewich, B. J., Young, S. A., Liu, Z., and McGill, M. J.: Fully Automated Detection of Cloud and Aerosol Layers in the CALIPSO Lidar Measurements, J. Atmos. Ocean. Technol., 26, 2034–2050, https://doi.org/10.1175/2009JTECHA1228.1, 2009.
Veselovskii, I., Goloub, P., Podvin, T., Bovchaliuk, V., Derimian, Y., Augustin, P., Fourmentin, M., Tanre, D., Korenskiy, M., Whiteman, D. N., Diallo, A., Ndiaye, T., Kolgotin, A., and Dubovik, O.: Retrieval of optical and physical properties of African dust from multiwavelength Raman lidar measurements during the SHADOW campaign in Senegal, Atmos. Chem. Phys., 16, 7013–7028, https://doi.org/10.5194/acp-16-7013-2016, 2016.
Veselovskii, I., Hu, Q., Goloub, P., Podvin, T., Barchunov, B., and Korenskii, M.: Combining Mie–Raman and fluorescence observations: a step forward in aerosol classification with lidar technology, Atmos. Meas. Tech., 15, 4881–4900, https://doi.org/10.5194/amt-15-4881-2022, 2022.
Vinoj, V., Rasch, P. J., Wang, H., Yoon, J.-H., Ma, P.-L., Landu, K., and Singh, B.: Short-term modulation of Indian summer monsoon rainfall by West Asian dust, Nat. Geosci., 7, 308–313, https://doi.org/10.1038/ngeo2107, 2014.
Weinzierl, B., Ansmann, A., Prospero, J. M., Althausen, D., Benker, N., Chouza, F., Dollner, M., Farrell, D., Fomba, W. K., Freudenthaler, V., Gasteiger, J., Groß, S., Haarig, M., Heinold, B., Kandler, K., Kristensen, T. B., Mayol-Bracero, O. L., Müller, T., Reitebuch, O., Sauer, D., Schäfler, A., Schepanski, K., Spanu, A., Tegen, I., Toledano, C., and Walser, A.: The Saharan Aerosol Long-Range Transport and Aerosol–Cloud-Interaction Experiment: Overview and Selected Highlights, B. Am. Meteor. Soc., 98, 1427–1451, https://doi.org/10.1175/BAMS-D-15-00142.1, 2016.
Welton, E. J., Campbell, J. R., Spinhirne, J. D., and Iii, V. S. S.: Global monitoring of clouds and aerosols using a network of micropulse lidar systems, in Lidar Remote Sensing for Industry and Environment Monitoring, Vol. 4153, 151–158, International Society for Optics and Photonics., 2001.
Whitby, K. T.: The physical characteristics of sulfur aerosols, Atmos. Environ., 12, 135–159, https://doi.org/10.1016/0004-6981(78)90196-8, 1978.
Wiegner, M., Groß, S., Freudenthaler, V., Schnell, F., and Gasteiger, J.: The May/June 2008 Saharan dust event over Munich: Intensive aerosol parameters from lidar measurements, J. Geophys. Res.-Atmos., 116, D23213, https://doi.org/10.1029/2011JD016619, 2011.
Willeke, K. and Whitby, K. T.: Atmospheric Aerosols: Size Distribution Interpretation, J. Air Pollut. Control Assoc., 25, 529–534, https://doi.org/10.1080/00022470.1975.10470110, 1975.
Winker, D. M., Vaughan, M. A., Omar, A., Hu, Y., Powell, K. A., Liu, Z., Hunt, W. H., and Young, S. A.: Overview of the CALIPSO Mission and CALIOP Data Processing Algorithms, J. Atmos. Ocean. Technol., 26, 2310–2323, https://doi.org/10.1175/2009JTECHA1281.1, 2009.
Winker, D. M., Pelon, J., Coakley, J. A., Ackerman, S. A., Charlson, R. J., Colarco, P. R., Flamant, P., Fu, Q., Hoff, R. M., Kittaka, C., Kubar, T. L., Le Treut, H., Mccormick, M. P., Mégie, G., Poole, L., Powell, K., Trepte, C., Vaughan, M. A., and Wielicki, B. A.: The CALIPSO MissionA Global 3D View of Aerosols and Clouds, B. Am. Meteor. Soc., 91, 1211–1230, https://doi.org/10.1175/2010BAMS3009.1, 2010.
Winker, D. M., Tackett, J. L., Getzewich, B. J., Liu, Z., Vaughan, M. A., and Rogers, R. R.: The global 3-D distribution of tropospheric aerosols as characterized by CALIOP, Atmos. Chem. Phys., 13, 3345–3361, https://doi.org/10.5194/acp-13-3345-2013, 2013.
Yorks, J. E., McGill, M. J., Palm, S. P., Hlavka, D. L., Selmer, P. A., Nowottnick, E. P., Vaughan, M. A., Rodier, S. D., and Hart, W. D.: An overview of the CATS level 1 processing algorithms and data products, Geophys. Res. Lett., 43, 4632–4639, https://doi.org/10.1002/2016GL068006, 2016.
Young, S. A. and Vaughan, M. A.: The Retrieval of Profiles of Particulate Extinction from Cloud-Aerosol Lidar Infrared Pathfinder Satellite Observations (CALIPSO) Data: Algorithm Description, J. Atmos. Ocean. Technol., 26, 1105–1119, https://doi.org/10.1175/2008JTECHA1221.1, 2009.
Yu, H., Remer, L. A., Chin, M., Bian, H., Kleidman, R. G., and Diehl, T.: A satellite-based assessment of transpacific transport of pollution aerosol, J. Geophys. Res.-Atmos., 113, D14S12, https://doi.org/10.1029/2007JD009349, 2008.
Yu, Y., Kalashnikova, O. V., Garay, M. J., and Notaro, M.: Climatology of Asian dust activation and transport potential based on MISR satellite observations and trajectory analysis, Atmos. Chem. Phys., 19, 363–378, https://doi.org/10.5194/acp-19-363-2019, 2019.
Zeng, S., Vaughan, M., Liu, Z., Trepte, C., Kar, J., Omar, A., Winker, D., Lucker, P., Hu, Y., Getzewich, B., and Avery, M.: Application of high-dimensional fuzzy k-means cluster analysis to CALIOP/CALIPSO version 4.1 cloud–aerosol discrimination, Atmos. Meas. Tech., 12, 2261–2285, https://doi.org/10.5194/amt-12-2261-2019, 2019.
Zhang, L., Kok, J. F., Henze, D. K., Li, Q., and Zhao, C.: Improving simulations of fine dust surface concentrations over the western United States by optimizing the particle size distribution, Geophys. Res. Lett., 40, 3270–3275, https://doi.org/10.1002/grl.50591, 2013.
Zhang, W.-J., Sun, Y.-L., Zhuang, G.-S., and Xu, D.-Q.: Characteristics and seasonal variations of PM2.5, PM10, and TSP aerosol in Beijing, Biomed. Environ. Sci., 19, 461–468, 2006.
Zhang, X. Y., Gong, S. L., Shen, Z. X., Mei, F. M., Xi, X. X., Liu, L. C., Zhou, Z. J., Wang, D., Wang, Y. Q., and Cheng, Y.: Characterization of soil dust aerosol in China and its transport and distribution during 2001 ACE-Asia: 1. network observations, J. Geophys. Res.-Atmos., 108, 4261, https://doi.org/10.1029/2002JD002632, 2003.
- Abstract
- Introduction
- Datasets and methodology
- Consistency check
- Three-dimensional distribution and temporal evolution of the fine-mode and coarse-mode components of atmospheric dust
- Summary and conclusions
- Data availability
- Author contributions
- Competing interests
- Disclaimer
- Acknowledgements
- Financial support
- Review statement
- References