the Creative Commons Attribution 4.0 License.
the Creative Commons Attribution 4.0 License.
 | 23 Jul 2024
First atmospheric aerosol-monitoring results from the Geostationary Environment Monitoring Spectrometer (GEMS) over Asia
Yeseul Cho
Sujung Go
Mijin Kim
Seoyoung Lee
Minseok Kim
Heesung Chong
Won-Jin Lee
Dong-Won Lee
Omar Torres
Sang Seo Park
Aerosol optical properties have been provided by the Geostationary Environment Monitoring Spectrometer (GEMS), the world's first geostationary-Earth-orbit (GEO) satellite instrument designed for air quality monitoring. This study describes improvements made to the GEMS aerosol retrieval (AERAOD) algorithm, including spectral binning, surface reflectance estimation, cloud masking, and post-processing, along with validation results. These enhancements aim to provide more accurate and reliable aerosol-monitoring results for Asia. The adoption of spectral binning in the lookup table (LUT) approach reduces random errors and enhances the stability of satellite measurements. In addition, we introduced a new high-resolution database for surface reflectance estimation based on the minimum-reflectance method, which was adapted to the GEMS pixel resolution. Monthly background aerosol optical depth (BAOD) values were used to estimate hourly GEMS surface reflectance consistently. Advanced cloud-removal techniques have been implemented to significantly improve the effectiveness of cloud detection and enhance aerosol retrieval quality. An innovative post-processing correction method based on machine learning has been introduced to address artificial diurnal biases in aerosol optical depth (AOD) observations. In this study, we investigated selected aerosol events, highlighting the capability of GEMS in monitoring and providing insights into hourly aerosol optical properties during various atmospheric events. The performance of the GEMS AERAOD products was validated against the Aerosol Robotic Network (AERONET) and Cloud-Aerosol Lidar with Orthogonal Polarization (CALIOP) data for the period from November 2021 to October 2022. GEMS AOD at 443 nm demonstrated a strong correlation with AERONET AOD at 443 nm (R = 0.792). However, it exhibited biased patterns, including the underestimation of high AOD values and overestimation of low-AOD conditions. Different aerosol types (highly absorbing fine aerosols, dust aerosols, and non-absorbing aerosols) exhibited distinct validation results. The retrievals of GEMS single-scattering albedo (SSA) at 443 nm agreed well with the AERONET SSA at 440 nm within reasonable error ranges, with variations observed among aerosol types. For GEMS AOD at 443 nm exceeding 0.4 (1.0), 42.76 % (56.61 %) and 67.25 % (85.70 %) of GEMS SSA data points fell within the ±0.03 and ±0.05 error bounds, respectively. Model-enforced post-processing correction improved GEMS AOD and SSA performance, thereby reducing the diurnal variation in the biases. The validation of the retrievals of GEMS aerosol layer height (ALH) against the CALIOP data demonstrates good agreement, with a mean bias of −0.225 km and 55.29 % (71.70 %) of data points falling within ±1 km (1.5 km).
- Article
(11045 KB) - Full-text XML
-
Supplement
(2100 KB) - BibTeX
- EndNote


The regional and global monitoring of aerosol optical properties (AOPs) was conducted using satellite measurements. Low-Earth-orbit (LEO) instruments, such as the Advanced Very High Resolution Radiometer (AVHRR), Moderate Resolution Imaging Spectroradiometer (MODIS), Multi-angle Imaging SpectroRadiometer (MISR), Visible Infrared Imaging Radiometer Suite (VIIRS), and Sea-viewing Wide Field-of-view Sensor (SeaWiFS), can provide daily aerosol properties for the global domain (Hsu et al., 2004, 2006, 2017, 2019; Jackson et al., 2013; Jethva et al., 2007; Levy et al., 2013; Lyapustin et al., 2018; Lee et al., 2012; Martonchik et al., 2009; Remer et al., 2005). Although significant diurnal variations in AOPs have been observed at daily and local scales (Kassianov et al., 2013; Kuang et al., 2015), emphasizing the importance of geostationary-satellite measurements for both air quality and climate studies, the temporal resolution of LEO satellites (typically one satellite per day) has limitations in terms of investigating the diurnal variation in and transboundary transportation of aerosols (Lennartson et al., 2018; Y. Zhang et al., 2016). Geostationary-Earth-orbit (GEO) instruments, such as the Advanced Baseline Imager (ABI), Geostationary Ocean Color Imager (GOCI), GOCI-II, Meteorological Imager (MI), and Advanced Himawari Imager (AHI), have contributed to the operational monitoring of the continuous spatiotemporal variations in AOPs at continental spatial scales, with temporal resolutions ranging from minutes to hours, using visible and near-infrared channels (Choi et al., 2018; Kim et at., 2016, 2014; Kondragunta et al., 2020; Lee et al., 2023; Yoshida et al., 2018).
In addition to spatial and temporal resolutions, channel specification is another critical consideration for satellite aerosol retrieval. All instruments except the GOCI-II used only visible (Vis) and near-infrared channels. However, the near-ultraviolet (UV) spectral region uniquely leverages its sensitivity to aerosol absorption. Therefore, this study provides valuable insights into the optical properties of aerosols. A significant advantage of near-UV measurements is that surface reflectance in the near-UV region is darker than in the visible region. This enables the derivation of AOPs over a bright surface, typically aerosol source regions. In addition, observations from the UV region are sensitive to information regarding aerosol radiative absorption and aerosol layer height (ALH). The contribution of Rayleigh scattering to the total top-of-the-atmosphere (TOA) reflectance enhancement is reduced below the aerosol layer due to aerosol attenuation (Kayetha et al., 2022; Torres et al., 2005).
The Ozone Monitoring Instrument (OMI) serves as an example of an LEO sensor that utilizes UV wavelengths for aerosol retrievals. Since 2004, it has measured radiances in the 270–500 nm spectral range and offered global coverage at a spatial resolution of 13 × 24 km at nadir (Levelt et al., 2018). The OMI employs two aerosol algorithms. The first one, the OMI multi-wavelength aerosol retrieval (OMAERO) algorithm (Curier et al., 2008), developed and maintained by the Royal Netherlands Meteorological Institute (KNMI), is a multi-wavelength algorithm that relies on spectral fitting procedures to derive aerosol properties. The other is the OMI near-UV aerosol retrieval (OMAERUV) algorithm, which focuses on retrieving key atmospheric aerosol properties, including aerosol optical depth (AOD), single-scattering albedo (SSA), and the Absorbing Aerosol Index (AAI) (Torres et al., 2007).
The OMAERUV algorithm is based on the aerosol retrieval algorithm of the Total Ozone Mapping Spectrometer (TOMS). It uses reflectance measurements at 354 and 388 nm to determine AOD and single-scattering albedo (SSA) using the two-channel inversion method (Torres et al., 2002, 2007). Global statistics reported by Ahn et al. (2014) indicate a correlation coefficient (R) of 0.81. However, the OMAERUV algorithm provided a lower R value (0.63) over Central and East Asia (W. Zhang et al., 2016). In addition, the Tropospheric Monitoring Instrument (TROPOMI) aerosol algorithm (TropOMAER) was developed as an adaptation of the OMAERUV algorithm. A comparison between Aerosol Robotic Network (AERONET) and TropOMAER AOD at 12 locations yielded an R value of 0.82 and a root mean square error (RMSE) of 0.19 (Torres et al., 2020).
The Geostationary Environment Monitoring Spectrometer (GEMS) is the first UV–Vis hyperspectral satellite instrument in GEO. It is onboard the Geostationary Korea Multi-Purpose Satellite-2B (GEO-KOMPSAT-2B or GK-2B), launched on 19 February 2020 (Kim et al., 2020). The objective of the GEMS mission is to monitor hourly air quality in Asia (5–45° N, 75–145° E) with a fine spatial resolution (3.5 × 7.7 km2 in Seoul, Republic of Korea). The GEMS provides hyperspectral measurements covering 300–500 nm with a spectral sampling of 0.2 nm and a full-width-at-half-maximum (FWHM) spectral resolution of 0.6 nm. The GEMS retrieval domain coverage changes with time due to the varying GEMS scan patterns with the solar zenith angle (SZA). The GEMS aerosol retrieval (AERAOD) algorithm is based on the OMAERUV algorithm and the optimal estimation (OE) method; it determines the optimized values of AOD, SSA, and ALH from GEMS measurements at six wavelengths (354, 388, 412, 443, 477, and 490 nm). This algorithm employs the two-channel inversion method used in the OMAERUV algorithm to retrieve AOD and SSA in order to overcome the challenge posed by the limited degrees of freedom for signals in the GEMS wavelength range. Accordingly, these retrievals were used as initial estimates for the OE method (Kim et al., 2018). The six wavelengths in the UV–Vis region contained information regarding aerosol absorption in the UV region and the absorption bands of the oxygen dimer (O2–O2) at 477 nm. Before the GEMS was launched, this method was first tested using OMI Level-1 data and was used to derive key aerosol parameters, including AOD, SSA, ALH, the UV aerosol index (UVAI), and the visible aerosol index (VisAI) (Jeong et al., 2016; Kim et al., 2018; Go et al., 2020a, b). Kim et al. (2018) reported that a comparison between AERONET and GEMS AOD at 26 locations in Asia yielded an R value of 0.71 and a root mean square error (RMSE) of 0.46. The percentage of GEMS SSA within the expected error range of the AERONET inversion data (±0.03) was 27.54 %. Spectral variations in aerosol absorption in the UV–Vis region, as investigated by Go et al. (2020a), were applied to the GEMS aerosol algorithm to improve AOP retrieval. This adjustment accounts for the spectral dependence of aerosol absorption, which had previously been treated as independent of wavelength. GEMS AOD demonstrated a strong correlation with AERONET AOD (R = 0.847 and RMSE = 0.285), and the percentage of GEMS SSA within the expected error range of ±0.03 increased to 41.64 % (Go et al., 2020a). To improve the accuracy of the GEMS aerosol retrieval, Go et al. (2020b) tested the use of cloud mask information from MODIS infrared (IR) channels to remove cirrus and subpixel cloud contamination, as well as the total dust confidence index for the classification of aerosol types. The limitations associated with the UV–Vis regions of the GEMS were overcome using the IR channels of other satellites, leading to research being conducted on the synergistic use of hyperspectral satellite instruments and broadband meteorological imagers.
However, because the testbed for the GEMS algorithm was on the LEO platform, a time-dependent retrieval bias was not previously observed. The diurnal variations in the satellite-retrieved AOPs may differ from the actual diurnal variations. This discrepancy can be explained by the different patterns of bias observed over time among different GEO satellites and retrieval algorithms (Choi et al., 2018; Lennartson et al., 2018; Wei et al., 2019; Zhang et al., 2020). This diurnal bias in AOP measurements can originate from various factors, such as errors in the surface reflectance assumption used in the retrieval algorithm, calibration issues in the Level-1 data, or the presence of short light paths at noon (Ceamanos et al., 2023).
To address this, Zhang et al. (2020) developed an empirical AOD-bias-correction algorithm that utilized the lowest AOD values observed within a 30 d period in conjunction with background AOD to obtain a smoothed bias curve for each pixel of the ABI AOD data. This approach helps mitigate the impact of diurnal bias in satellite AOD retrievals to improve accuracy by removing artifacts from the retrieval. By applying bias-correction methods, more reliable diurnal variations in AOD can be explained. In addition to traditional statistical methods, bias-correction methods based on machine learning have also been proposed. Model-enforced post-processing correction involves the use of a machine-learning-based model to predict errors in conventional aerosol retrievals (Lipponen et al., 2021, 2022). This method was developed to identify the relationship between the input parameters of satellite measurements and the associated retrieval errors. This approach provides a practical and effective method for enhancing the accuracy of aerosol retrieval without requiring extensive modifications to existing retrieval algorithms. It leverages machine learning capabilities to improve the reliability and precision of hourly aerosol measurements obtained from GEO satellite observations.
In this study, we report on AOPs, including AOD, SSA, and ALH, derived from GEMS operational observations using the GEMS aerosol retrieval algorithm. The remainder of this paper is organized as follows. Section 2 describes the GEMS data and aerosol retrieval algorithm. It also highlights the algorithm updates made after the GEMS in-orbit test (IOT) period. Section 3 discusses the post-processing correction for near-real-time retrievals. Section 4 discusses the GEMS aerosol-monitoring results for dust, biomass burning, and absorbing-aerosol events over Asia. Section 5 presents an evaluation of the GEMS AOD, SSA, and ALH retrievals against AERONET and Cloud-Aerosol Lidar with Orthogonal Polarization (CALIOP) data and discusses directions for future work. Finally, Sect. 6 presents a summary.
2.1 Data description
2.1.1 GEMS normalized radiance
The National Institute of Environmental Research (NIER) in Korea provides the GEMS Level-1C (L1C) dataset, which includes various auxiliary variables necessary for retrieval to improve the efficiency of the Level-2 algorithm. In this study, the aerosol retrieval algorithm used radiances only with the quality flags of 0 (good) or 2 (interpolated radiances), determined by the “bad_pixel_mask” variable. Instead of employing the GEMS irradiance, we used the KNMI solar reference spectrum to calculate the GEMS normalized radiance (Dobber et al., 2008). The GEMS irradiance is within the range of −5 % to −20 % compared with the KNMI solar reference spectrum. Further improvements in Level-1 (L1) processing are ongoing. The KNMI solar reference spectrum was convolved with a GEMS spectral-response function (Kang et al., 2020). GEMS-measured irradiances will be employed when the NIER releases an improved version of the Sun L1C product.
Normalized radiances are defined in the following equation:
where I, E, ESD, and λ are the GEMS radiance, KNMI solar reference spectrum, Earth–Sun distance correction factor, and wavelength (354, 388, 412, 443, 477, and 490 nm), respectively. Spectral radiance and irradiance were spectrally binned and averaged within ±2.2 nm of each wavelength to enhance the measurement signals. Additionally, Earth–Sun distance correction was used to calculate the normalized radiance.
2.1.2 AERONET
AERONET is a global ground-based remote sensing network that measures aerosol optical, microphysical, and radiative properties (Giles et al., 2019; Holben et al., 1998; Sinyuk et al., 2020). The measurement systems use Cimel Sun photometers to measure solar irradiance at eight wavelengths ranging from 340 to 1020 nm and sky radiances at four wavelengths ranging from 440 to 1020 nm. The AERONET data provide global aerosol information, including spectral AOD and inversion products, such as SSA, aerosol size distribution, and the refractive index. The uncertainties in AODs are dependent on wavelength – approximately 0.01 (Vis) to 0.02 (near-UV) for direct Sun measurements (Dubovik et al., 2000). The uncertainty in SSA is ±0.03 when AOD exceeds 0.4 at 440 nm (Dubovik et al., 2000). For the evaluation of GEMS AOD and SSA data from November 2021 to October 2022, we used AERONET V3 Level-2.0 data for AOD and AERONET V3 Level-2.0 hybrid-inversion data for SSA from all sites within the entire GEMS domain, ensuring higher quality compared to Level 1.5. However, we used AERONET V3 Level-1.5 data for AOD and AERONET V3 Level-1.5 hybrid-inversion data for SSA for post-processing correction to ensure a sufficient volume of data during the modeling and near-real-time processing.
2.1.3 CALIOP
The CALIOP instrument is a two-wavelength polarization-sensitive lidar onboard the Cloud-Aerosol Lidar and Infrared Pathfinder Satellite Observation (CALIPSO) satellite. It was launched on 28 April 2006 (Winker et al., 2009). The CALIOP instrument monitors the global vertical profiles of aerosols and clouds by measuring two signals: backscatter intensity at 1064 nm and the orthogonally polarized components of the backscattered signal at 532 nm.
Quantitative scattering information from the CALIOP instruments was used as reference data to validate the ALH obtained from passive sensors (Xu et al., 2017, 2019; Nanda et al., 2020; Park et al., 2023). We used data from the CALIPSO Lidar Level-2 Aerosol Profile (V3-41) to validate the GEMS ALH. CALIOP profiles of the extinction coefficient (β) at the 532 nm channel were utilized to calculate the CALIOP ALH using the following equation:
where (i) is the CALIOP profile of the 532 nm extinction coefficient at height H(i) and n is the number of layers.
2.2 The GEMS AERAOD algorithm
2.2.1 AOP retrieval algorithm for GEMS
The GEMS AERAOD algorithm produces AOD, SSA, and ALH data using the OE method. An early version of the GEMS AERAOD algorithm was developed using OMI Level-1B (L1B) normalized radiance (Kim et al., 2018; Go et al., 2020a, b). After the launch, the algorithm was tested using GEMS observations during the IOT period, and several parts of the algorithm were updated. This section briefly describes the GEMS AERAOD algorithm, AERAOD Level-2 (L2) data, and updates, including the lookup table (LUT), the cloud-masking procedure, surface reflectance estimation, and post-processing after the IOT period. The general flow of the GEMS AERAOD algorithm is illustrated in Fig. 1.
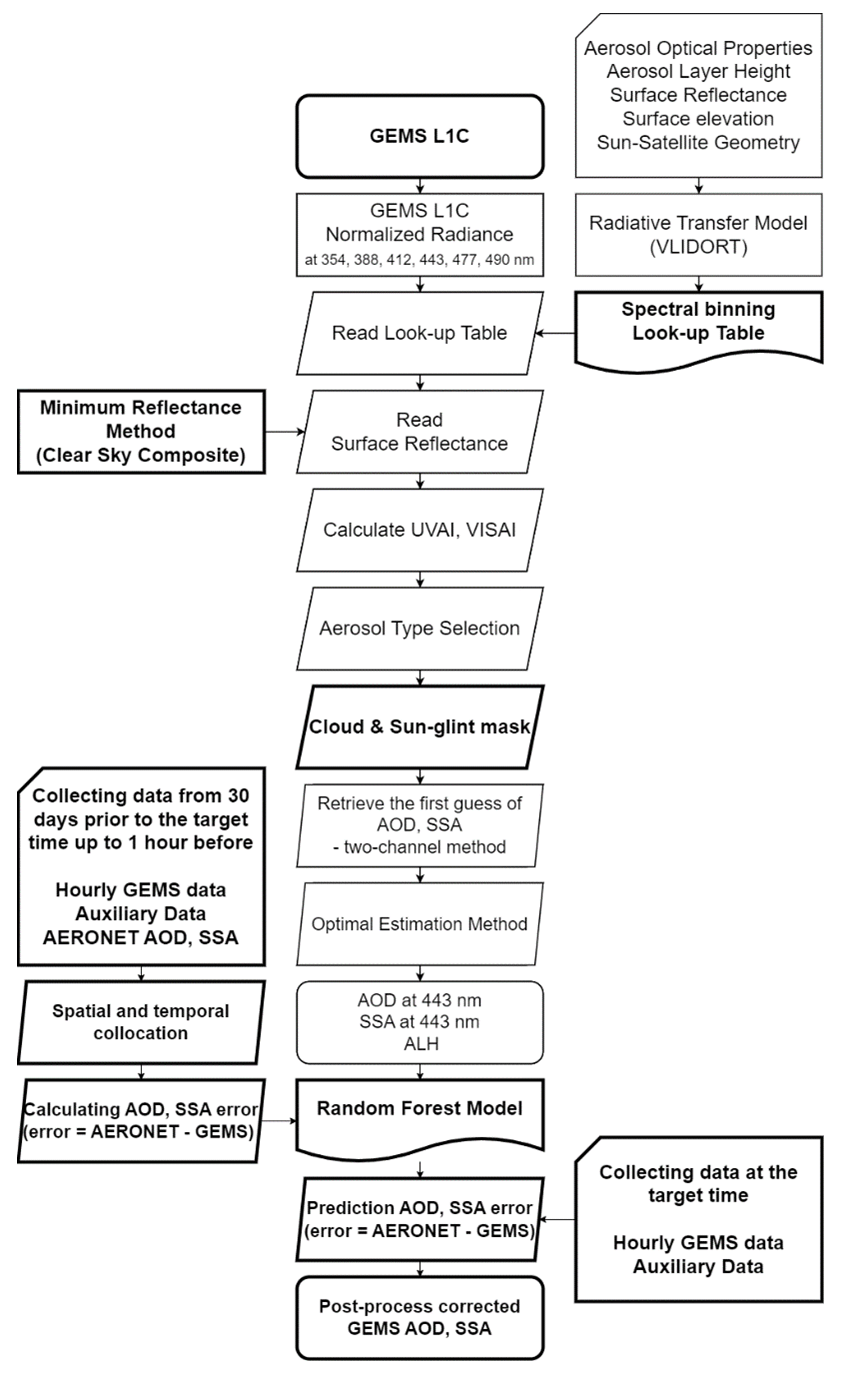
Figure 1A flowchart illustrating the GEMS AERAOD and the modifications made in the study (shown in the bolded boxes).
The GEMS algorithm adopts an LUT approach to optimize computation efficiency. The LUT was calculated assuming the AOPs of three aerosol types using a radiative-transfer model (RTM), specifically the Vector Linearized Discrete Ordinate Radiative Transfer (VLIDORT) code (Spurr, 2006). The highly absorbing fine (HAF) aerosols, dust aerosols, and non-absorbing (NA) aerosols are integrated from the AERONET inversion data and applied to the RTM simulation. The details of the updated LUT are described in Sect. 2.1.2. The preliminary algorithm used the OMI Lambertian-equivalent reflectance (OMLER v003) datasets for surface reflectance (Kleipool et al., 2008). However, for the GEMS AERAOD algorithm, GEMS L2 surface reflectances at 354, 388, 412, 443, 477, and 490 nm were obtained using the minimum-reflectance method. The details of the surface reflectance estimation are described in Sect. 2.1.3.
The GEMS AERAOD algorithm provides UV and visible AIs to indicate qualitative radiative absorptivity and particle size information, respectively (Torres et al., 2002). The GEMS UV aerosol index (UVAI) and visible aerosol index (VisAI) were calculated using the following equation:
where and represent the normalized radiances for the 354 and 388 nm (477 and 490 nm) wavelength pair for the UVAI and VisAI, respectively. The subscripts “meas” and “calc” represent the measured and calculated normalized radiances, respectively.
The HAF, dust, and NA aerosol types were selected using the UVAI and VisAI. A negative UVAI value was detected for the NA type. The dust and HAF types were distinguished using the VisAI. The HAF type was selected when the UVAI was positive and the VisAI was negative. The dust type was selected when both AIs were positive. Sun glint and cloud masking ensure that only pixels suitable for aerosol retrieval are left. The glint mask was applied for glint angles less than 35°. The details of the cloud-masking procedure are described in Sect. 2.1.4. The a priori states of AOD and SSA at 443 nm were obtained through two-channel inversion using neighboring wavelengths (354 and 388 nm) over both land and ocean, while a priori states of ALH were based on the climatology of CALIOP ALH. The a priori states of AOD and SSA were supplied to solve the Levenberg–Marquardt equation (Rodgers, 2000). The optimal ALH was determined by fitting the normalized radiance between the measured and calculated values for the OE routine. Details of the GEMS aerosol inversion procedure are described in Kim et al. (2018).
To improve the accuracy of near-real-time GEMS AOD retrieval, a model-enforced post-processing correction step was implemented using a random forest (RF) model. By combining GEMS aerosol retrieval with this post-processing correction model, more reliable and accurate near-real-time AOD estimates can be obtained.
2.2.2 LUT calculation
In this study, the AOPs were determined using the method described by Kim et al. (2018) and Go et al. (2020a). However, the dimensions of the LUT varied from those in Kim et al. (2018; Table 1). The nodes for the 412 nm SSA for the NA type were added. In addition, the nodes for AOD in the LUT were extended to include the values at 5.0 and 10.0°, enabling the retrieval of exceptionally severe aerosol events during GEMS observations. The early version of the GEMS AERAOD algorithm utilized normalized radiance at six specific monochromatic wavelengths (354, 388, 412, 443, 477, and 490 nm). However, satellite measurements averaged over a specific wavelength range produce more stable values than those obtained at individual monochromatic wavelengths, which is due to the averaging of random errors (i.e., instrument noise).
Table 1Dimension of the LUT in the GEMS aerosol algorithm. VZA: viewing zenith angle. RAA: relative azimuth angle.
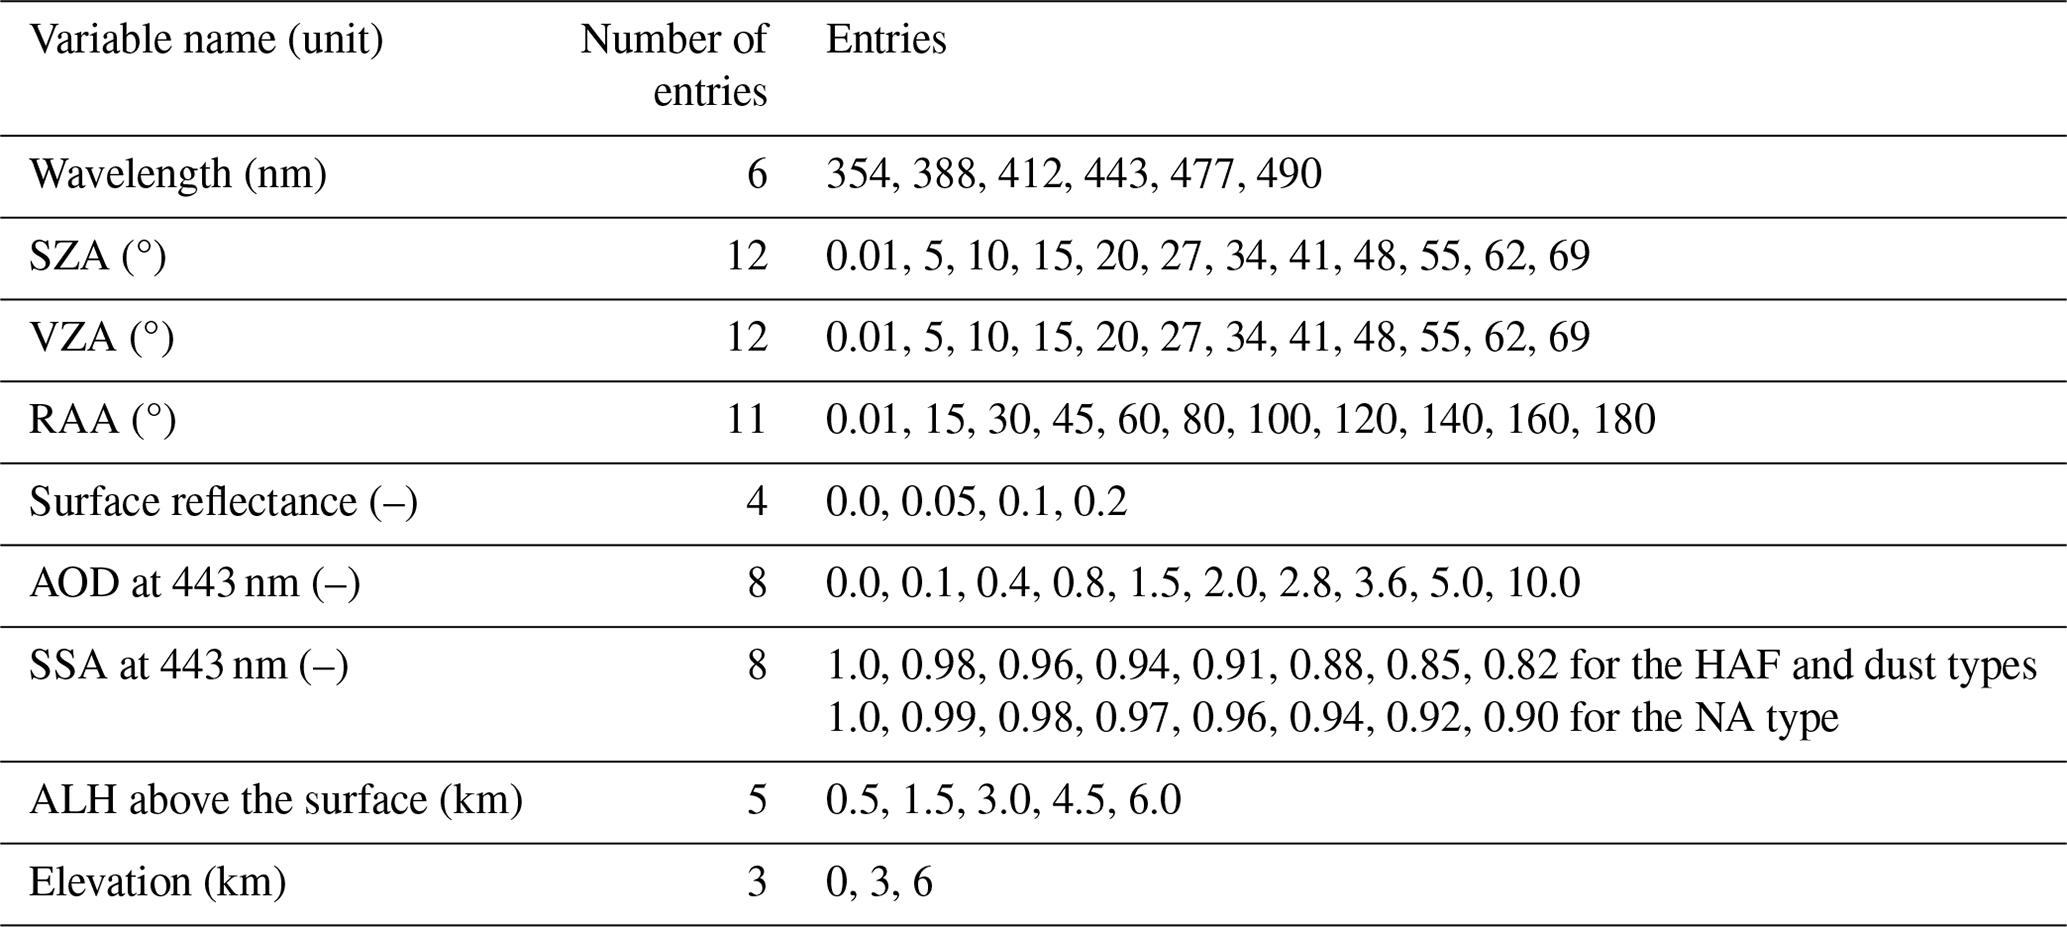
Consequently, a spectral-binning LUT approach was employed to reduce random errors and improve measurement stability. This enabled more reliable and consistent observations. Compared to monochromatic wavelengths, the spectral-binning method is computationally intensive. Therefore, the calculations were performed using a forward RTM coupled with Mie theory. The aerosol parameters used to generate the LUT included the mean radii and standard deviations of the fine and coarse modes of the aerosol bimodal number size distribution, the fine-mode particle fraction with respect to the total number concentration, and the real part of the refractive index (Kim et al., 2018).
The spectral-binning LUT approach in the GEMS aerosol algorithm involves three steps. (1) A reference spectrum is generated using an RTM, which provides a spectral interval of 0.1 nm. (2) The calculated spectrum is convolved with the GEMS spectral response function and resampled to the target spectral grids with a resolution of 0.2 nm (Kang et al., 2020). (3) The resampled spectrum is averaged at intervals of ±2.2 nm at six central wavelengths (354, 388, 412, 443, 477, and 490 nm) and saved in the LUT. Intervals of ±2.2 nm are selected to account for the calculation capacity and reduce the impact of random errors. During the retrieval process, the GEMS L1C normalized radiances, after being averaged at intervals of ±2.2 nm at six central wavelengths, are compared with the calculated spectrum in the LUT. Through these steps, the spectral-binning LUT aims to generate more stable retrieval results for aerosol properties.
2.2.3 Surface reflectance estimation
Several improvements were introduced in this study, including an updated GEMS surface reflectance estimation method. An early version of the GEMS AERAOD algorithm used the OMI surface reflectance climatology data product (OMLER v003) (Kleipool et al., 2008), with a spatial resolution of 0.5 × 0.5°, which is too coarse compared with the GEMS pixel size, resulting in discontinuities in the GEMS AOPs. The updated GEMS surface reflectance had a finer spatial resolution (0.1 × 0.1°) to address this limitation, aligning closely with the pixel resolution of the GEMS. This enhancement enabled more accurate aerosol retrieval at the pixel level. The compiled hourly surface reflectance data indirectly reflect the effect of the bidirectional reflectance distribution function (BRDF). In addition, a new hourly surface reflectance database was generated using the minimum-reflectance method based on GEMS data (Herman and Celarier, 1997; Hsu et al., 2004). The algorithm adopts the climatological minimum-reflectance method for each pixel over a ±15 d window spanning 2 years. Several tests were performed to evaluate different time windows and methods for constructing accurate surface reflectance. These tests evaluated the effectiveness of using a ±15 d window as well as alternative options, such as a previous 30 d window. In addition, different methods, including the minimum-reflectance and second-minimum-reflectance approaches, were evaluated to determine the most suitable method for generating appropriate surface reflectance values (not included in this study).
Background AOD (BAOD) was considered in the retrieval algorithm. BAOD represents the baseline level of AOD that is consistently present in a region. This was then used to derive the surface reflectance dataset. Rayleigh scattering, gaseous absorption, and BAOD were corrected during the process of atmospheric correction to create a surface reflectance dataset. Recent studies have shown that incorporating BAOD into an algorithm can reduce the uncertainty associated with satellite-based AOD retrieval (Kim et al., 2014, 2021). H. Zhang et al. (2016) estimated BAOD as corresponding to the lowest fifth percentile of AERONET AOD over 2 years and improved the performance of the VIIRS aerosol algorithm. It has been observed that Asia experiences relatively high BAOD values with seasonal variation. For example, at the Dhaka University site, monthly BAOD over the past 2 years has varied from a minimum of 0.124 in August to a maximum of 0.685 in April. Therefore, considering seasonal variations in BAOD for atmospheric correction can help mitigate the uncertainty in satellite-derived AOD retrieval, particularly over Asia. The monthly BAODs were calculated using the following equation for each 0.1 × 0.1° box from November 2020 to October 2021:
where (insert variable) is the interpolated BAOD at 443 nm at (lat, long) in month m; Wi is the inverse distance-weighting function; (lat, long) is the distance between the AERONET site and the GEMS pixel and is a constant; and is the lowest fifth percentile of AERONET AOD over 2 years at AERONET site i in month m.
Figure S1 in the Supplement shows the monthly BAOD data obtained based on AERONET AOD data. Additionally, the fifth percentiles of the values of AERONET AOD at 443 nm at each AERONET site are plotted as circles for reference. It is evident that regions such as India exhibit a high BAOD of approximately 0.15 throughout the year, regardless of the month. However, seasonal variations in BAOD occurred over the Indo-Chinese Peninsula, Korea, and China. These areas experience heavy pollution as a result of biomass burning during the dry season and dust events from deserts. Both of these factors contribute to increased atmospheric aerosol concentrations. These enhancements, including the use of hourly GEMS surface reflectance and the incorporation of monthly BAOD, can improve aerosol retrieval.
2.2.4 Cloud-masking procedure
The GEMS aerosol algorithm only retrieved AOPs for cloud-free pixels. Clouds exhibit spatial inhomogeneity and higher brightness than aerosols. This study aimed to enhance the cloud-masking process in the GEMS aerosol algorithm by addressing the limitations of previous simple cloud-masking techniques. The previous method relied on a fixed threshold for reflectance at 477 nm (step 1) and a standard-deviation test of reflectance at 477 nm within an area measuring 3 × 3 pixels (step 2). An additional cloud-removal technique was introduced in this study to improve cloud-masking performance. These tests included the following steps. Step 3 comprised a 470 and 477 nm normalized-radiance ratio test. This involved a threshold test for the ratio of the normalized-radiance values at 470 and 477 nm. This method contrasts with detecting the presence of clouds using O2–O2 absorption bands as there is a decrease in O2–O2 absorption at 477 nm in the presence of clouds (step 4; Kim et al., 2024). The difference between the hourly surface reflectance database and the calculated scene reflectivity at 412 nm indicates the presence of clouds (Torres et al., 2013). Step 5 involves a standard deviation at 477 nm within an area measuring 3 × 3 pixels, where the standard deviation is greater than f(latitude); the threshold for this test can vary based on the latitude to account for the regional differences in cloud characteristics. Step 6 involves a standard deviation at 477 nm within an area measuring 3 × 3 pixels, where the standard deviation is greater than f(latitude, number of cloud pixels); the threshold for this test can vary based on the latitude and number of pixels detected as clouds in steps 1 to 4. A final cloud mask is applied after aerosol retrieval. Step 7 involves filtering out high AOD over the ocean, where the AOD is greater than f(number of cloud pixels); this threshold is a function of the number of cloud pixels detected as clouds from steps 1 to 6 in a window measuring 11 × 11 pixels (Lyapustin et al., 2021). This helps remove residual clouds over the ocean. By implementing these new methods, the proposed algorithm aims to improve the effectiveness of cloud detection and removal in GEMS pixels.
Quantitative analysis was performed to assess the impact of these improvements in each section on the retrieval results of GEMS AOD at 443 nm (Table S1). We analyzed the influence of each update factor on the AOD validation results. The validation periods were January, April, and July 2022. The statistics included R; the RMSE; the mean bias error (MBE); the slope; the y offset; and the Q value, which indicates the percentage of AOD retrievals falling within the uncertainty envelope of 0.1 (or ±30 % of the AOD error range). Additionally, the Global Climate Observing System (GCOS) requirement is defined as the percentage of AOD retrievals falling within the uncertainty envelope of 0.03 (or ±10 % of the AOD error range). The early version of the GEMS AERAOD had an MBE of 0.36, indicating an overestimation of GEMS AOD. By using KNMI irradiance instead of GEMS irradiance and changing to the spectral-binning LUT approach, set 1 achieved an MBE of −0.074 (closer to zero) and an increased Q value of 50.63 %, approximately 30 % higher than observed in the results of the early version of the GEMS AERAOD. Set 2 was the result of the analysis that used GEMS surface reflectance rather than OMI climatology values as the surface reflectance (Sect. 2.1.3). Set 2 showed a slight decrease in the R value but an improvement in the Q value by over 7 %. Finally, introducing a new cloud-removal method (set 3) increased the R value and decreased the RMSE, leading to an increase in the Q value compared to that in set 2.
GEMS AOD exhibits a diurnal bias pattern that fluctuates throughout the day. It forms a “U” shape with a minimum at 03:00 UTC (as demonstrated in Sect. 5.1). A model-enforced post-processing correction step was implemented using the random forest (RF) model proposed by Lipponen et al. (2021) to improve the accuracy of near-real-time GEMS AOD retrieval.
This concept was developed to identify the relationship between hourly GEMS data and AOD errors (GEMS–AERONET AOD) and to predict AOD errors at the target time. The proposed method consists of two main parts: modeling and prediction for enabling near-real-time retrieval. In the modeling part, the input data for the RF model included GEMS data – i.e., normalized radiances at six wavelengths; the scattering angle; the viewing zenith angle (VZA); the relative azimuth angle (RAA); the SZA UVAI and VisAI; the aerosol type; AOD values; and a clear fraction (ClearFrac), which is the ratio of clear-sky pixels to total pixels within a 0.25° radius from the pixel center. The data also included auxiliary information, such as time, land–sea mask, and elevation data. The target data for training comprised the AOD errors, which were calculated as the difference between GEMS AOD and AERONET AOD at the single GEMS pixel corresponding to the location of the AERONET site. AERONET data were temporally matched within a ±10 min window of the GEMS measurement time. Data from three AERONET sites with severe subpixel cloud contamination (i.e., Sorong, Jambi, and BMKG_GAW_PALU) were excluded from the modeling process to ensure cloud-contaminated pixels were not included in said process. The predictors and target variables were collected for a time window ranging from N d to 1 d before the target time. After conducting several tests, N d was determined to be 30 d. In the prediction part, the input variables, including the GEMS data and auxiliary information pertaining to the target time, were used for the pretrained RF model. Using these inputs, the model predicted the error in GEMS AOD in real time. This predicted error value was then applied to the first GEMS AOD value retrieved using the retrieval algorithm. This resulted in the production of post-processed GEMS AOD.
To investigate the performance in areas without AERONET data, we followed the leave-one-out cross-validation method. This principle involves excluding data from one site and training the model using data from all other sites. The performance of the model was evaluated using data from excluded sites. The station selected for evaluation was excluded from the model-fitting process. For the period from 30 d prior to the current day to 1 h before the target day, modeling was conducted with data from all sites except the excluded one. The predictive accuracy of the model was evaluated for one site on the target day. Figure S2 shows the statistical maps illustrating the results of the leave-one-out cross-validation method for post-processing-corrected GEMS AOD for the year from 1 November 2021 to 31 October 2022. In Northeast Asia, there were notably high R values, indicating a strong relationship among the AERONET data. However, sites closer to the Equator tended to exhibit lower R values (around 0.5). The RMSE followed a similar pattern, with lower values found in densely populated Northeast Asia, reflecting a better fit between the predicted values and AERONET values in this region. The MBE in Northeast Asia tended to be close to zero, suggesting minimal bias in the predictions. In contrast, the Indian region shows negative MBE values, indicating an underestimation, whereas Southeast Asia shows positive values, signifying an overestimation.
A variable-importance analysis for post-processing correction of GEMS AOD was conducted (Fig. S3). GEMS AOD emerged as the most crucial variable, emphasizing its direct influence on the correction process. The VZA and elevation were also highly important. Nevertheless, their significance can be attributed not only to their inherent properties but also to their role in conveying AERONET-location-related information. The aerosol type appeared to be less significant in the RF models. This result contrasts with the notable importance of the GEMS UVAI and VisAI. This discrepancy can be attributed to the inaccurate aerosol type classification in the GEMS aerosol algorithm.
In addition, the diurnal bias pattern in the GEMS SSA values exhibited fluctuations throughout the day, forming a bell shape with a minimum at 03:45 UTC, as discussed in Sect. 5.2. The post-processing method adopted was similar to that used for AOD. This method was developed to determine the relationship between hourly GEMS data and SSA errors (the difference between GEMS SSA at 443 nm and AERONET SSA at 440 nm) and to predict SSA errors at the target time. The key difference between the RF model predicting AOD errors and said model predicting SSA errors is as follows. The second model includes GEMS SSA as an input variable as well. A variable-importance analysis for the post-processing correction of the GEMS SSA values was conducted (Fig. S4). GEMS SSA was the most critical variable in the correction process. GEMS AOD also emerged as a highly influential variable in the RF models with respect to GEMS SSA post-processing correction. In addition, the aerosol types appeared to have relatively low significance within the RF models regarding SSA correction.
Unlike with AOD and SSA, post-processing of ALH using an RF model is inherently limited by the fact that the CALIOP instrument is an LEO satellite and that pixels co-located with GEMS ALH data are only available from 03:45 to 07:45 UTC. This renders it inaccessible as an hourly reference dataset for the 22:45–02:45 UTC time period. In contrast to AERONET, the use of data from ground-based lidars is severely constrained by the limited number of observation stations and the restricted geographical areas in which the lidars are deployed.
4.1 Dust aerosol event (8 April 2022)
Figure 2 presents an example of hourly maps of the GEMS aerosol product, including AOD, SSA, and ALH, for 8 April 2022. Note that these results pertain to GEMS AOD, SSA, and ALH before post-processing. A GEMS false-color red–green–blue (RGB) image is shown using R (477 nm), G (412 nm), and B (354 nm) bands that are similar to those of the OMI false-color RGB method (Levelt et al., 2006).
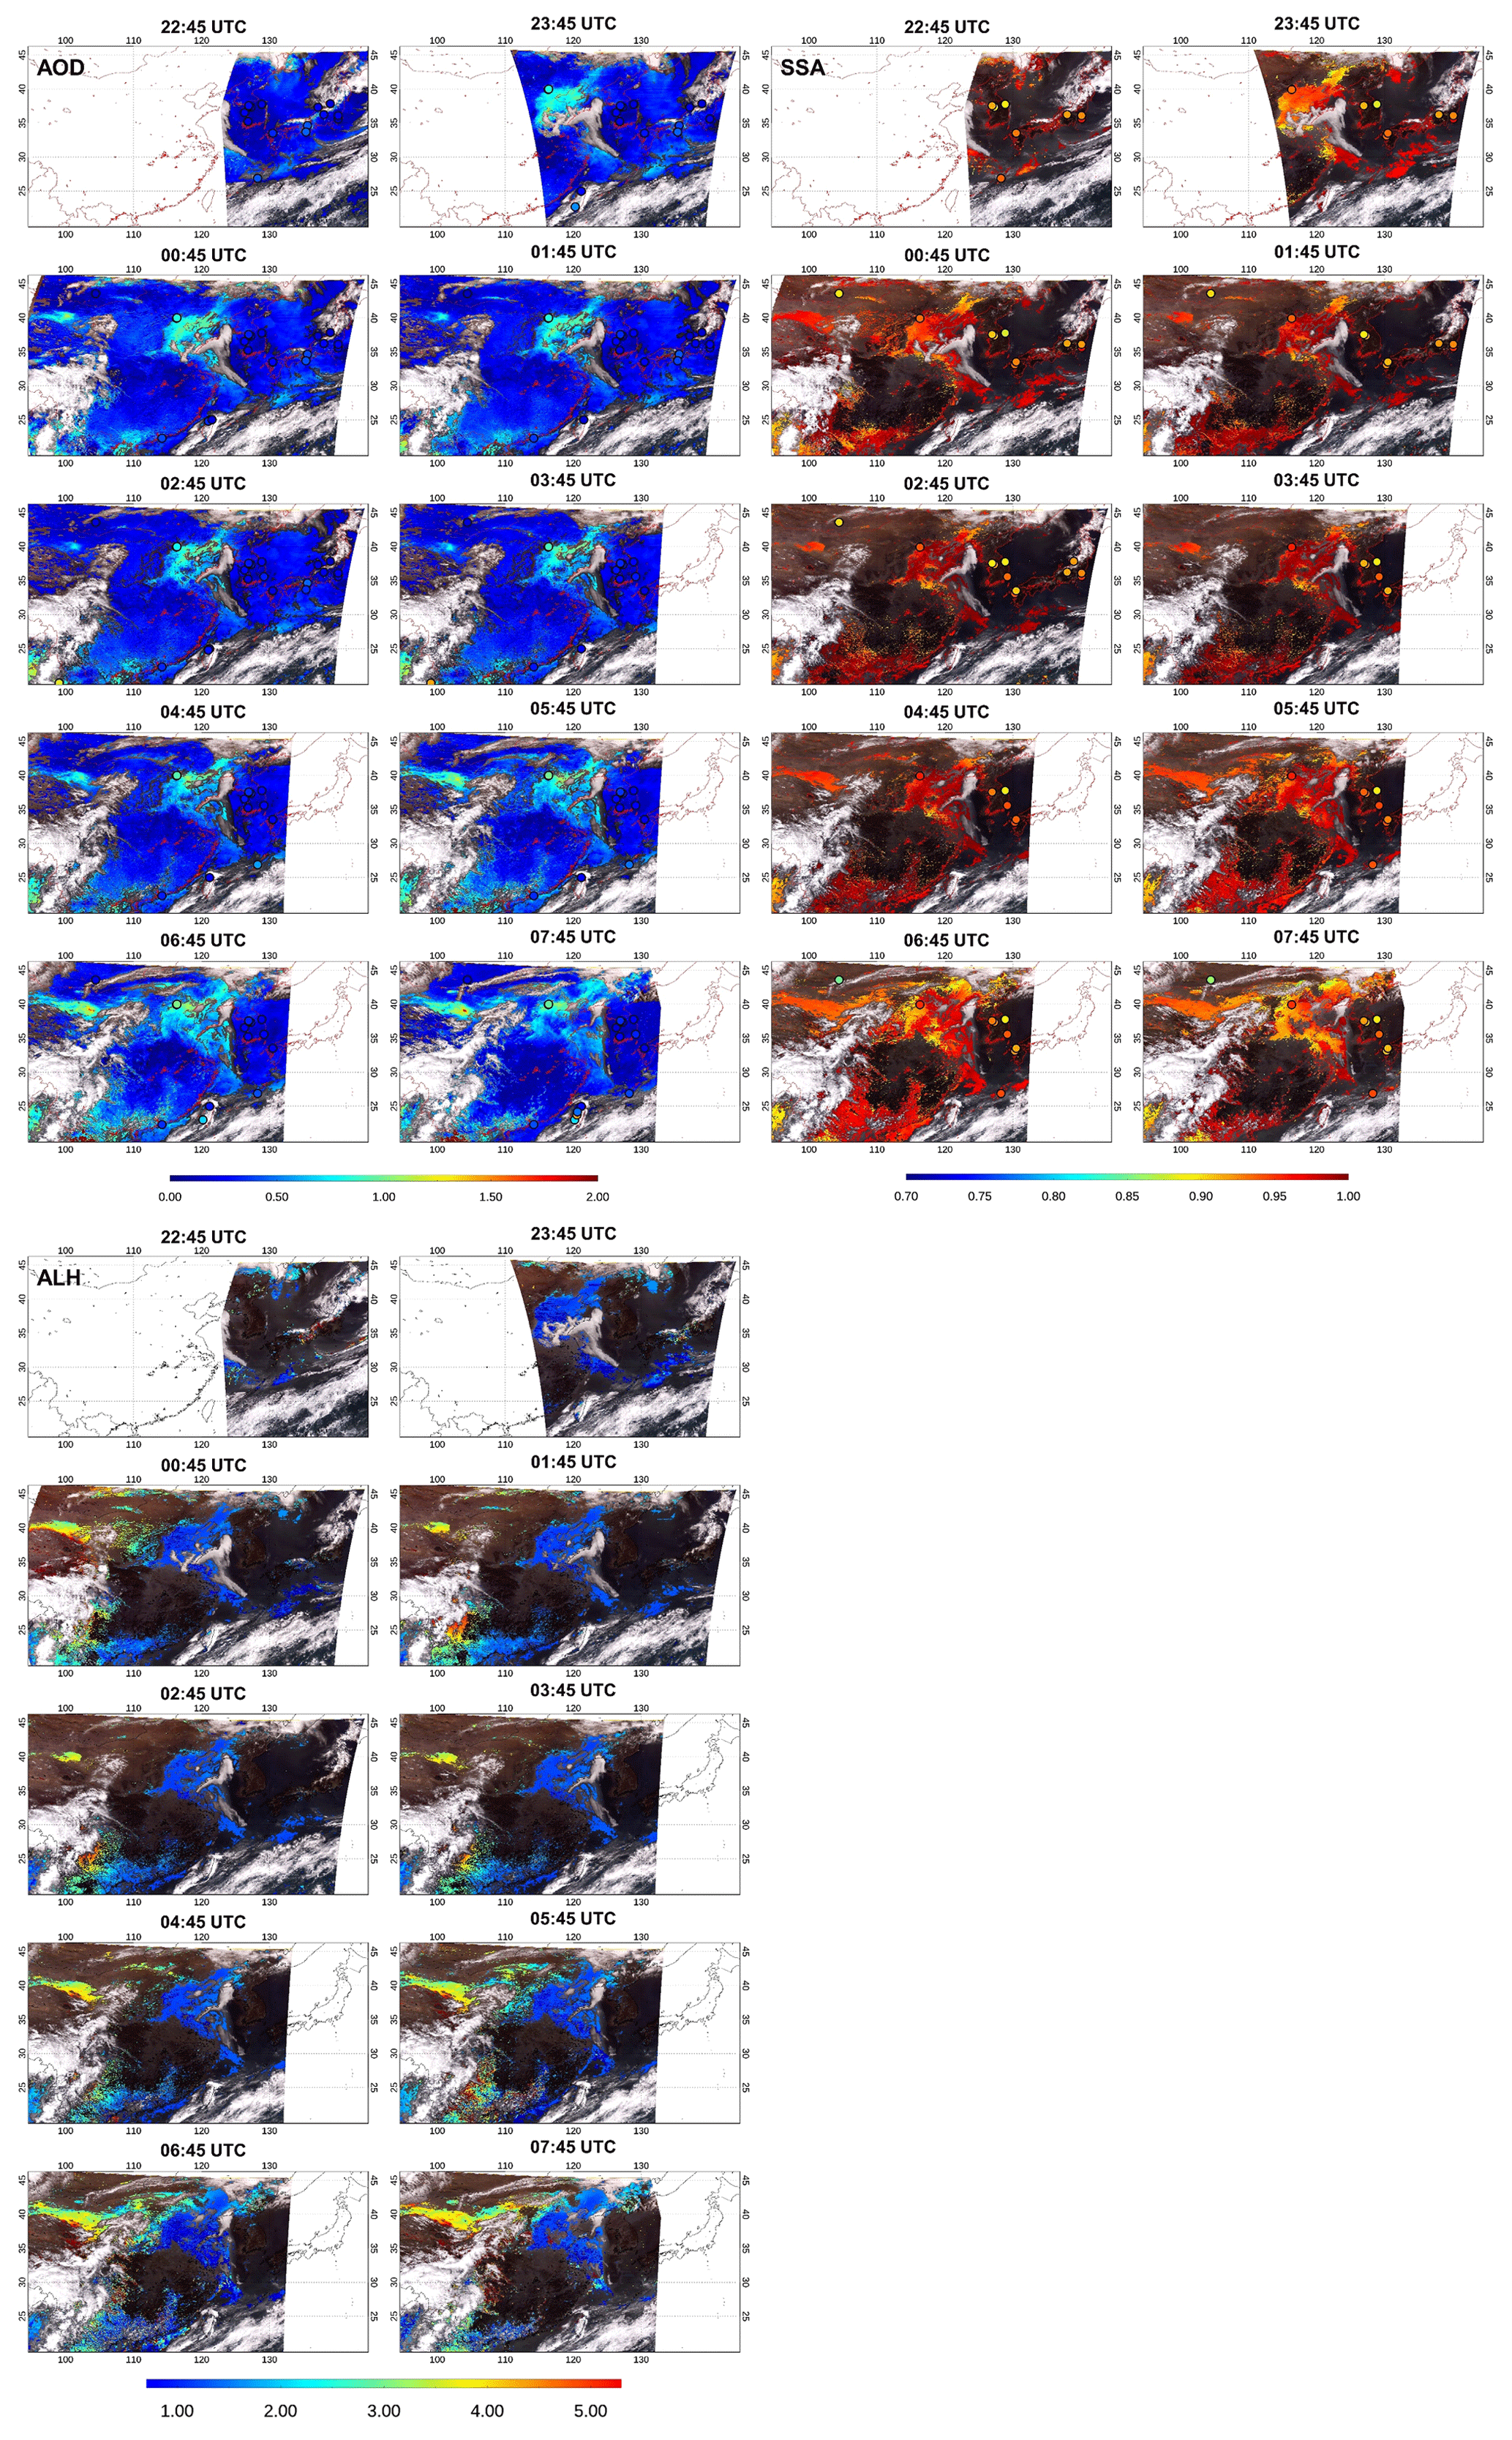
Figure 2Hourly GEMS aerosol products for the dust case on 8 April 2022 over northwestern China. Time series maps illustrating AOD at 443 nm, SSA at 443 nm, and ALH (km) from 22:45 to 07:45 UTC. Each circle represents an AERONET station, and the color of the circle indicates AERONET AOD and SSA values at 443 nm in the AOD and SSA columns. GEMS SSA and ALH only are displayed when GEMS AOD > 0.2.
As shown in Fig. 2, the GEMS retrieval domain coverage changed with time due to varying GEMS scan patterns with the SZA. Overall, GEMS AOD showed significantly good agreement with the AERONET AOD measurements, capturing higher values in the Beijing–Hebei–Tianjin (BTH) region and lower values in the Republic of Korea and Japan. High GEMS AOD values were evident along the dust plume, reaching 2.0 at 06:45 UTC. Regarding SSA, the retrieval results demonstrated relatively lower accuracy (notably in the BTH region) compared to AOD. In general, from 22:45 to 05:45 UTC, the SSA values displayed good agreement with both the AERONET and GEMS SSA values. However, from 06:45–07:45 UTC, the SSA numbers did not match those for Beijing. Compared with the Beijing region, the results were more consistent for the dust plume. The SSA values remained relatively stable over time, ranging from approximately 0.92 to 0.96. However, the GEMS SSA values tended to exhibit a positive bias compared with the AERONET values, as discussed in Sect. 5.2. The GEMS ALHs were ∼ 3–4 km for the dust plume over the Taklamakan Desert and ∼ 1.0 km over the Beijing region. The GEMS ALH values exhibited continuous spatial and temporal patterns.
4.2 Biomass-burning event (19 March 2022)
Figure 3 shows maps of the GEMS aerosol product at 06:45 UTC on 19 March 2022, representing a biomass-burning event in mainland Southeast Asia. These results were obtained for GEMS AOD and SSA before post-processing. Fine pollution particles are prevalent in this region during the dry season (Yin et al., 2019). GEMS AOD exceeded 1.6, indicating significant aerosol loading and enhancement during the event. GEMS SSA was approximately 0.88, indicating aerosol absorption during this event. The ALH values ranged from 2 to 3 km within the biomass-burning plume. The GEMS ALH was not retrieved along the east-to-west straight line at ∼ 22.5° N, which corresponds to a bad pixel in the CCD. The GEMS UVAI revealed hotspots and fine features associated with this event, capturing the aerosol absorption in the ultraviolet spectrum. The GEMS VisAI did not clearly show signals from small particles caused by biomass burning, indicating that signals from the surface were not completely removed. There may be limitations with respect to considering aerosol size information using the GEMS VisAI (Go et al., 2020b). This case study demonstrates that the GEMS provides valuable insights into aerosol properties during specific events, such as biomass burning, and can capture temporal and spatial variations in AOD, SSA, ALH, the UVAI, and the VisAI.
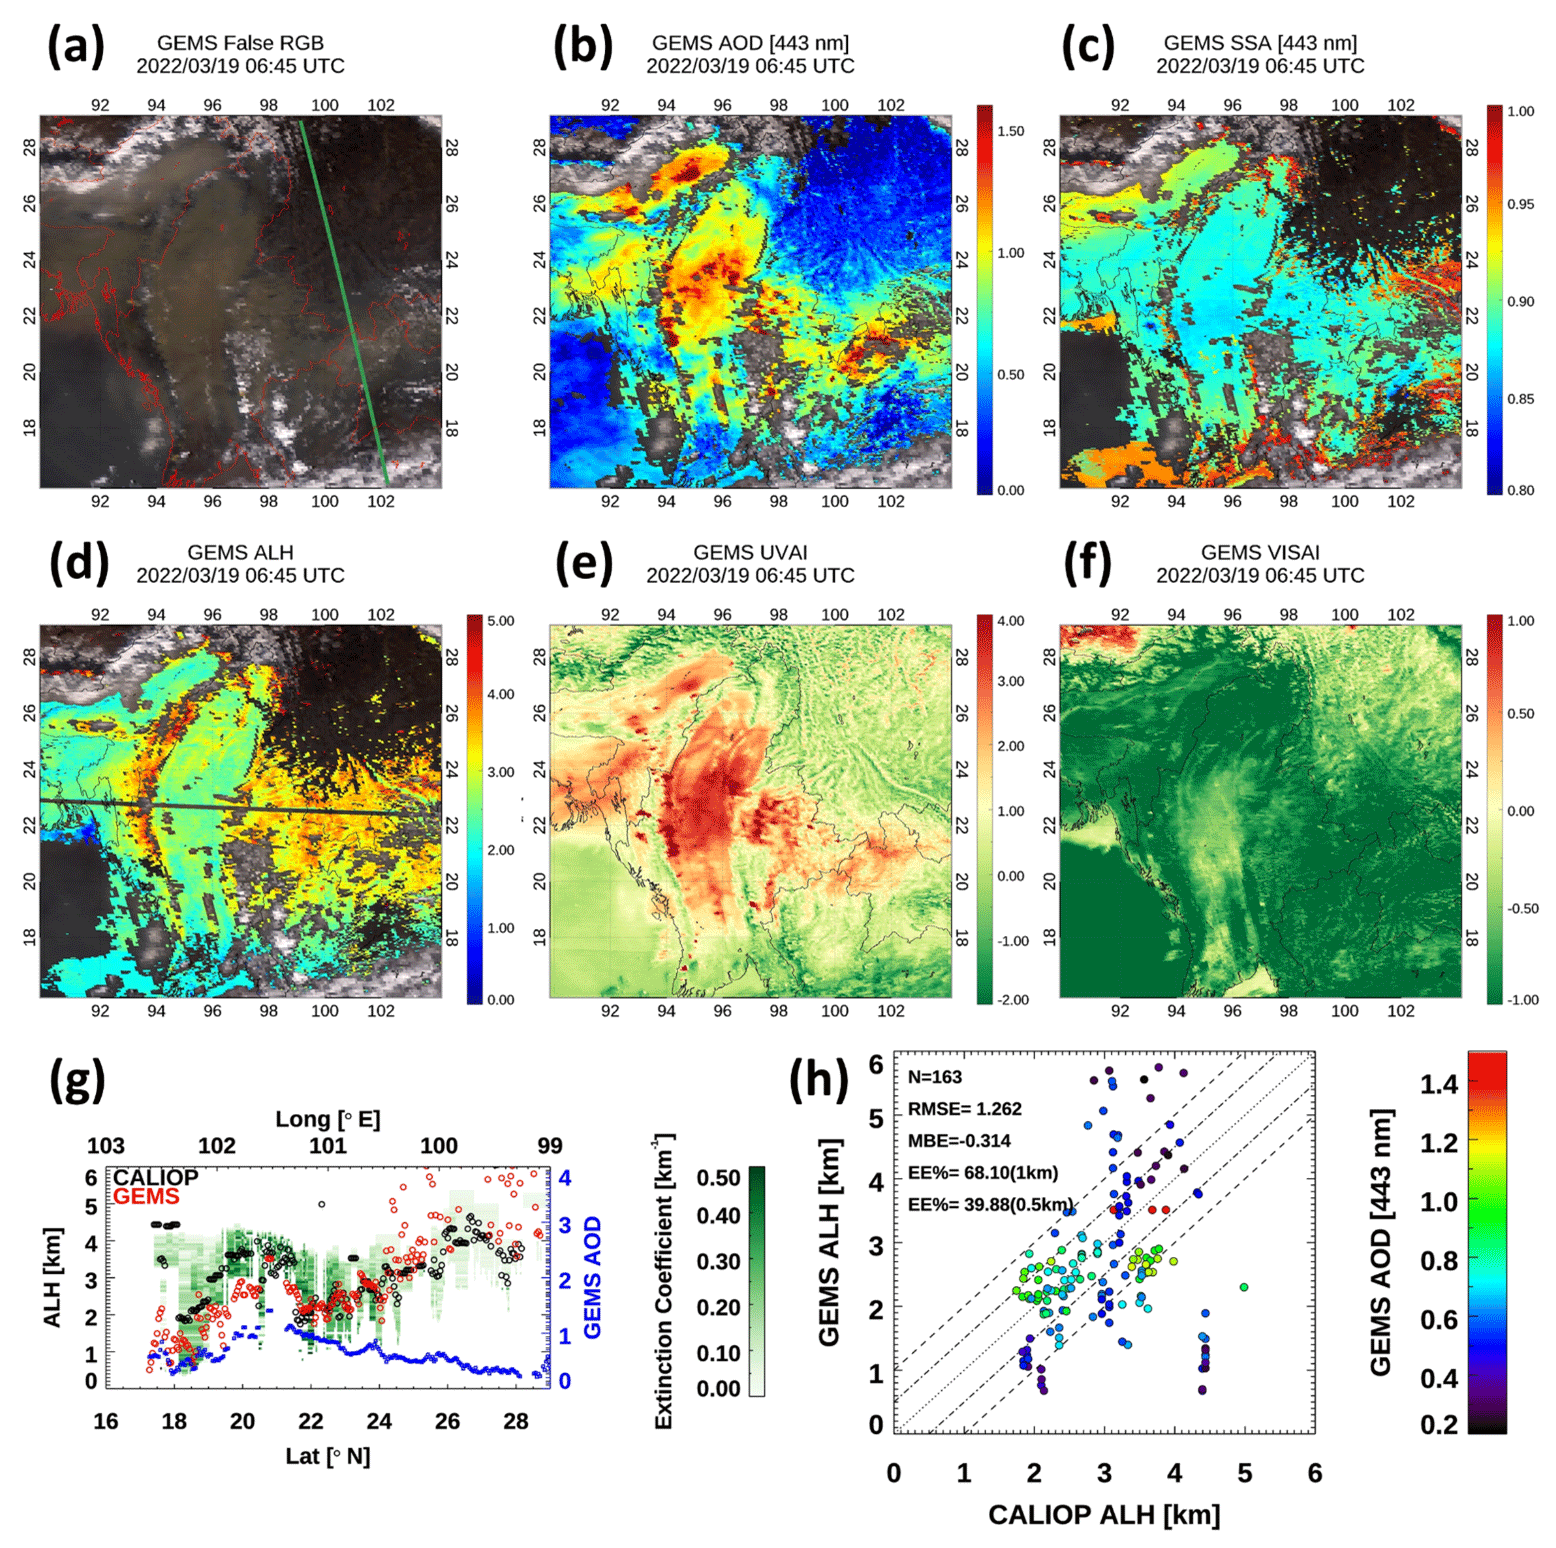
Figure 3An example of GEMS aerosol products for biomass burning over mainland Southeast Asia. The maps illustrate (a) GEMS false-color RGB, (b) AOD, (c) SSA, (d) ALH, (e) the UVAI, and (f) the VisAI. The green line in the GEMS false-color RGB image indicates the overpass path of the CALIOP instrument. GEMS SSA and ALH are displayed only when GEMS AOD is over 0.2. (g) GEMS ALH compared with CALIOP extinction coefficient in the domain. The background color represents the CALIOP extinction coefficient. The black-outlined circles denote the CALIOP ALH values, whereas the red-outlined circles represent the GEMS ALH values. The blue squares represent GEMS AOD. (h) Comparison of GEMS ALH and CALIOP ALH when GEMS AOD > 0.2. The dashed and dash-dotted lines indicate an uncertainty envelope of ±1 and ±0.5 km, respectively, in ALH values. The dotted lines represent the 1 : 1 lines. The various colors of the circles represent different GEMS AOD values. EE: expected error.
Figure 3g shows a comparison of the CALIOP extinction coefficients at 532 nm, the CALIOP ALH values, and the GEMS ALH values along the CALIOP path (green line in the GEMS false-color RGB image in Fig. 3a). Figure 3g illustrates the precise relationship between the GEMS AOD values and the accuracy of the GEMS ALH values. Accurate retrieval of ALH requires a sufficient amount of aerosol in the atmosphere. The GEMS ALH values closely followed the latitudinal variation in the CALIOP ALH values. As the latitude increased from 18 to 21° N, the GEMS ALH values followed the CALIOP ALH values and exhibited an increase in altitude. In the latitude range of 24–28° N, as GEMS AOD decreased, GEMS ALH exhibited scattered variations due to weaker signals. In the scatterplot comparing CALIOP ALH and GEMS ALH (Fig. 3h), 39.88 % of the pixels fall within the expected error range of 0.5 km, and 68.10 % of the pixels are within the expected error range of 1 km. As the GEMS AOD values decreased, the likelihood of the GEMS ALH pixels falling outside the expected error range increased.
4.3 Absorbing-aerosol event (4 December 2021 and 23 December 2021)
Figure 4 shows examples of GEMS AOD before and after post-processing for an absorbing-aerosol case over the Indo-Gangetic Plain (IGP) at 04:45 UTC on 4 December 2021. Atmospheric haze is prevalent in this region during the winter (Ram et al., 2012). Recent studies have shown that primary aerosols and precursors of secondary aerosols emitted from fossil fuel combustion and biomass burning are released into the atmosphere (Singh et al., 2021). Figure 4a shows a GEMS false-color RGB image with the AERONET stations represented by circles. The colors indicate AERONET AOD values. Two distinct aerosol plumes were observed. The northwestern plume showed an AOD of approximately 0.8, whereas the southeastern plume showed a value of approximately 1.3. Figure 4b shows the GEMS AOD data. The spatial distribution of GEMS AOD was similar to that of AERONET AOD, as shown in Fig. 4a, although the values were marginally lower than the AERONET AOD values. However, the post-processed AOD values were elevated, particularly in the original moderate AOD range (∼ 0.7), bringing the GEMS AOD values closer to the AERONET AOD values (Fig. 4c). Specifically, at the Gandhi College site (25.871° N, 84.128° E) and the Lahore site (31.480° N, 74.264° E), post-processing resulted in more reasonable values.
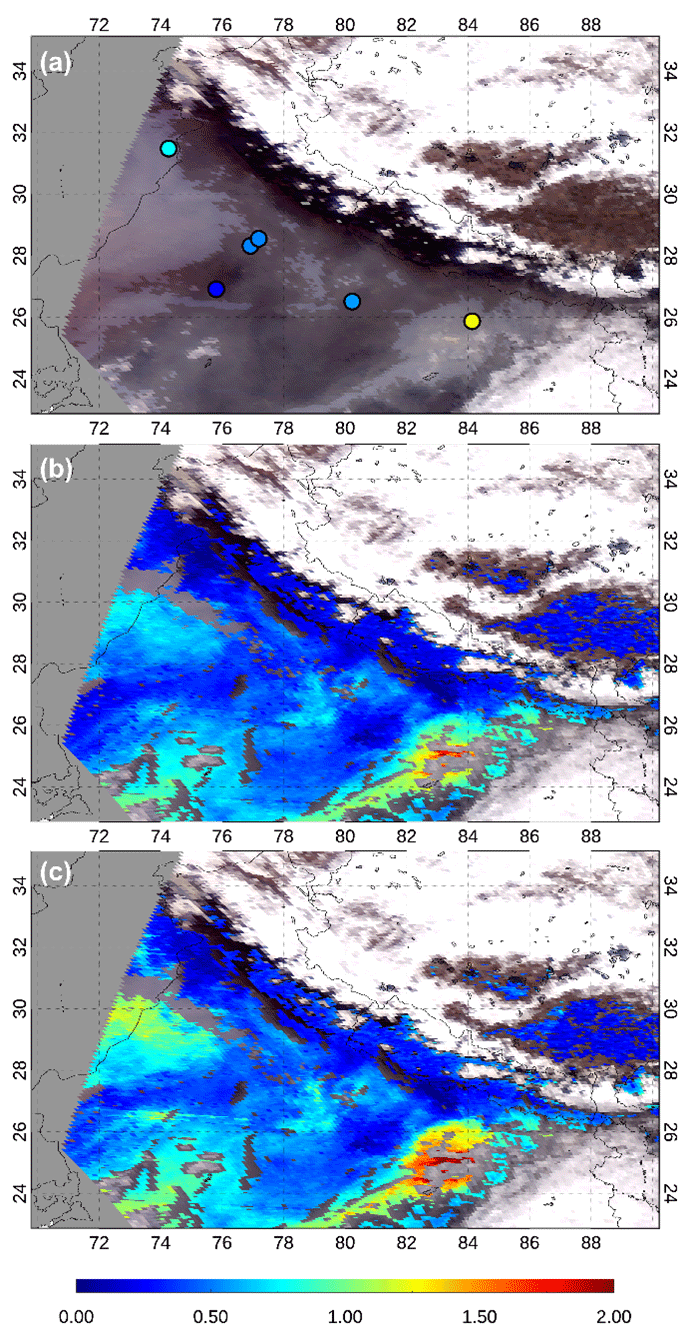
Figure 4Examples of GEMS AOD before and after post-processing for an absorbing-aerosol case over the Indo-Gangetic Plain at 04:45 UTC on 4 December 2021. (a) A GEMS false-color RGB image. The circles denote AERONET stations, and the color of each circle indicates the AERONET AOD value at 443 nm. (b) GEMS AOD and (c) GEMS AOD after post-processing correction.
Figure 5 shows maps illustrating GEMS SSA and GEMS SSA after post-processing for an absorbing-aerosol case over India, Bangladesh, and mainland Southeast Asia at 03:45 UTC on 23 December 2021. The GEMS false-color RGB image featuring AERONET stations, represented by circles, is shown in Fig. 5a. The colors of the circles indicate the AERONET SSA values at 440 nm. The AERONET SSA values are ∼ 0.9 in India and Bangladesh and ∼ 0.93 in Thailand. Before post-processing, the GEMS SSA values reached ∼ 0.96 in the Indian region and ∼ 1.0 in other areas. However, after post-processing, the GEMS SSA values converged and became more similar to the AERONET SSA values. Nonetheless, a marginal tendency towards overestimation remained.
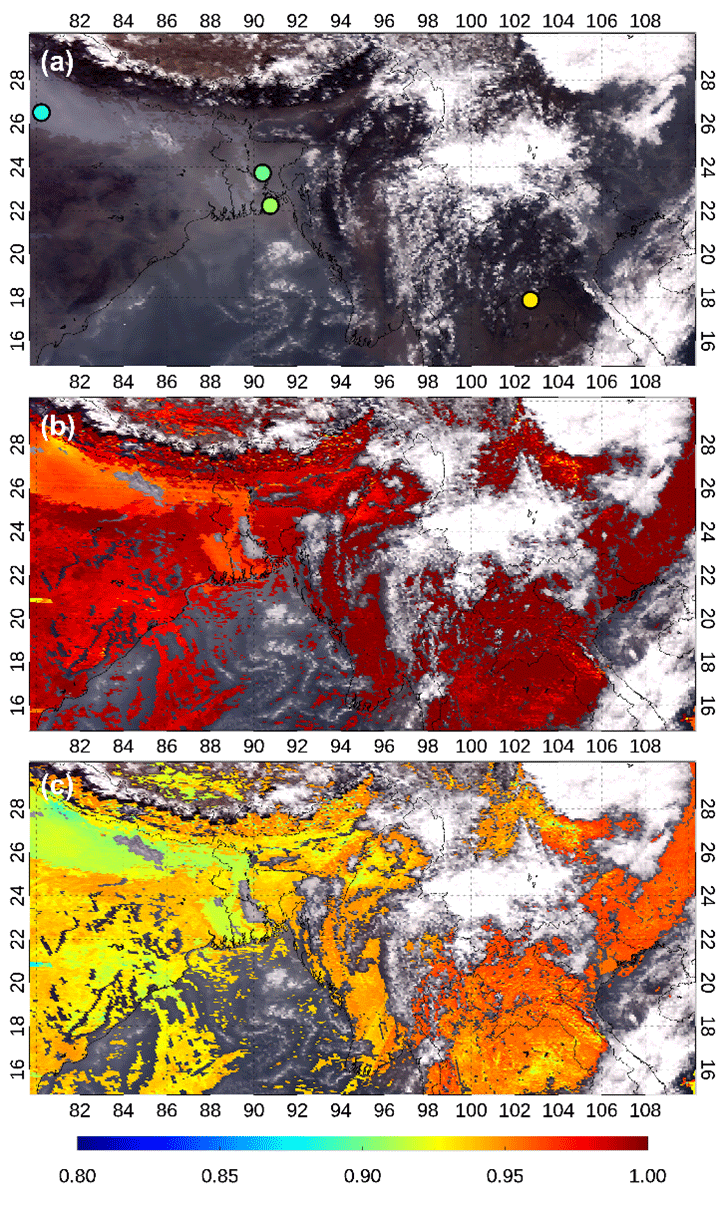
Figure 5Examples of GEMS SSA and GEMS SSA after post-processing for an absorbing-aerosol case over India, Bangladesh, and mainland Southeast Asia at 03:45 UTC on 23 December 2021. (a) A GEMS false-color RGB image. The circles denote AERONET stations, and the color of each circle indicates the AERONET SSA value at 440 nm. (b) GEMS SSA and (c) GEMS SSA after post-processing correction.
This section evaluates GEMS AOD and SSA at 443 nm according to the aerosol type and measurement time using AERONET data across the entire GEMS domain. We used data from AERONET Version 3 Level 2.0 to validate the AOD and SSA values as they are quality-assured data. Figure 6 illustrates a map of the AERONET sites used for GEMS AOD and SSA validation, along with site-specific data counts. The AERONET AOD data generally showed higher counts in the Republic of Korea and Taiwan. Sites in South Asia and Southeast Asia typically had fewer data points. The distribution of AERONET SSA data points was similar to that of the AOD values. In addition, we retrieved the GEMS ALH values and compared them with the CALIPSO Level-2 extinction coefficient profiles at 532 nm, as well as with the CALIOP ALH values defined in Eq. (2).
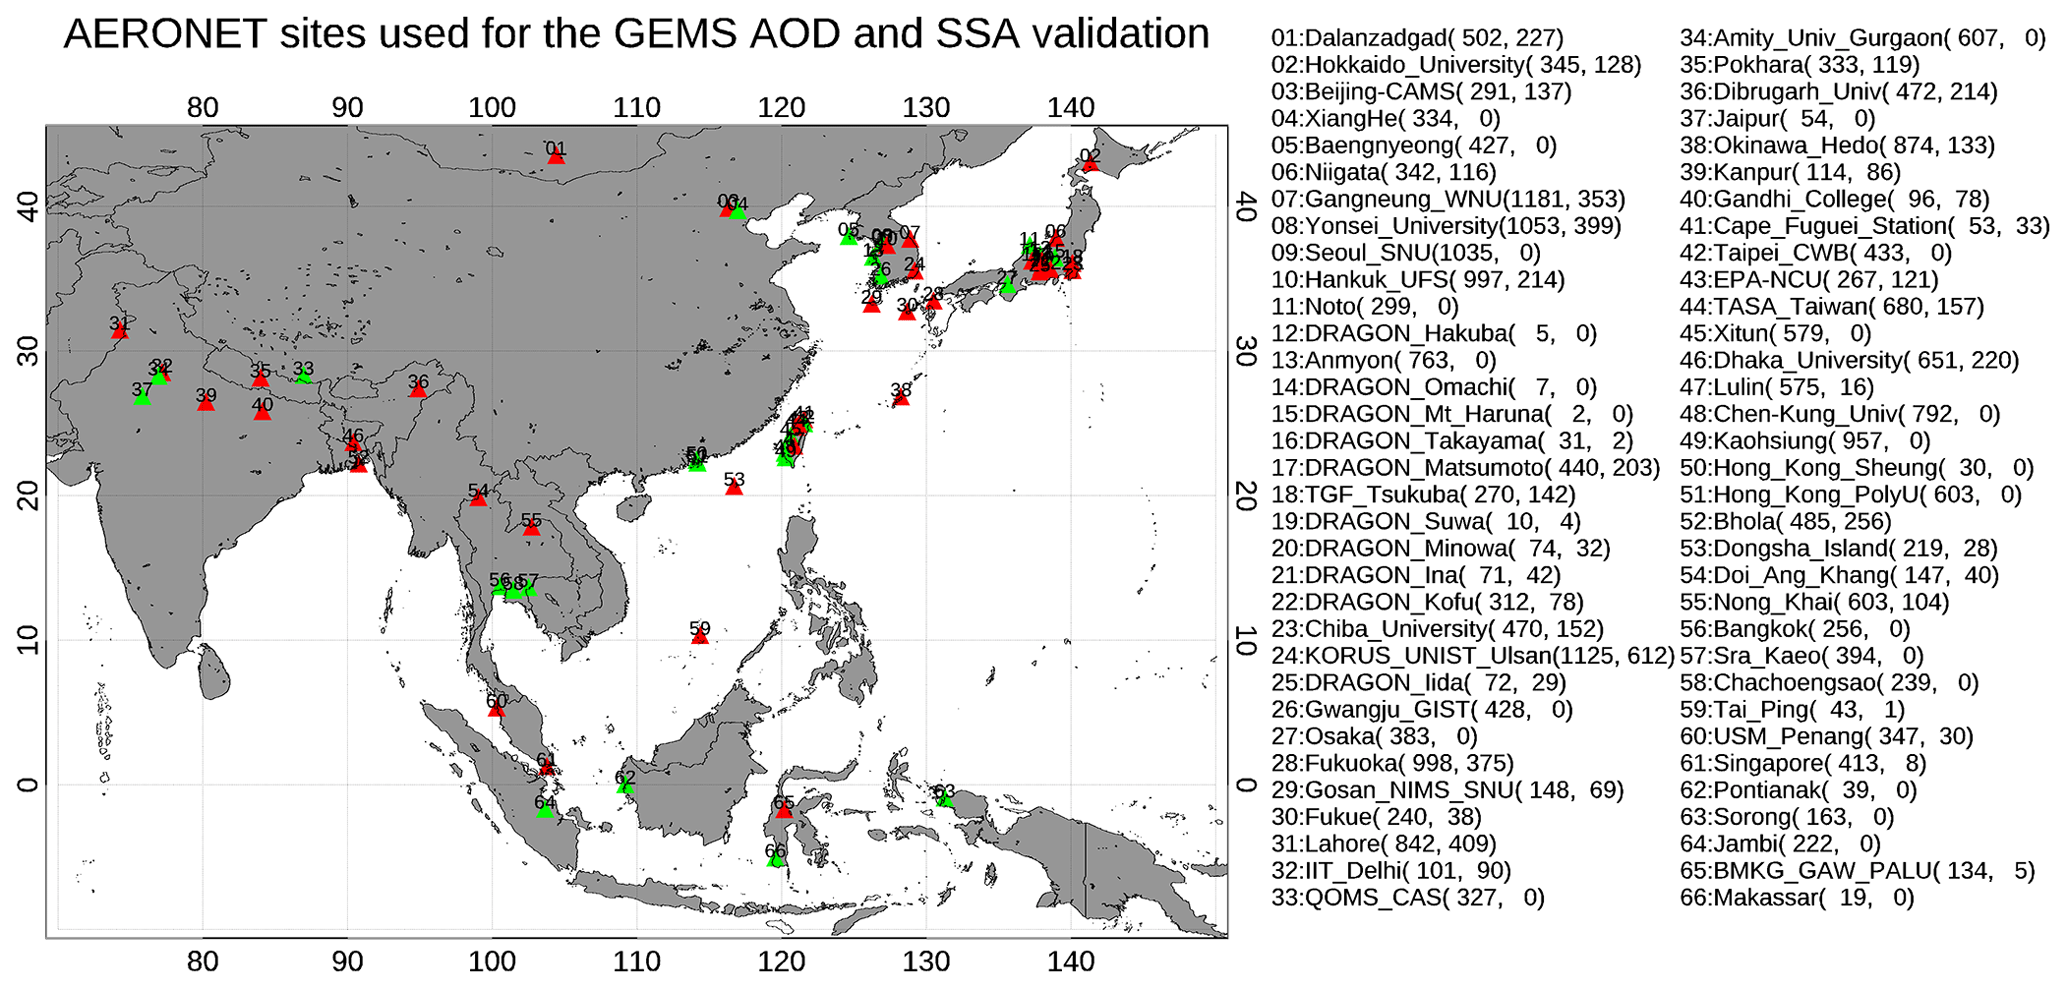
Figure 6AERONET sites used for the GEMS AOD and SSA validation. The red-colored triangles indicate the sites where validation points exist for both AOD and SSA. The green-colored triangles indicate the sites where validation points exist only for AOD. The list of station names is shown in conjunction with the number of AERONET AOD and SSA data points used for validation at each station.
5.1 Aerosol optical depth
In this section, GEMS AOD at 443 nm was validated against AERONET data across the entire GEMS domain from 1 November 2021 to 31 October 2022. The GEMS AOD data were spatially collocated within a 0.25° radius of the AERONET stations and temporally collocated within a 30 min window of the GEMS measurement time. When a specific aerosol type in the GEMS was present in more than 90 % of the pixels within the validation radius, aerosol type validation was conducted.
Figure 7 presents the results for all pixels and each aerosol type (HAF, dust, and NA). The total GEMS AOD values demonstrated a good correlation with the AERONET AOD values, with an R value of 0.781, an RMSE of 0.221, and an MBE of 0.047 (Fig. 7a). The Q value was calculated as 52.93 %, with 18.17 % of the AOD values satisfying the GCOS requirements. However, the slope and y intercept were 0.572 and 0.202, respectively. This indicates an overestimation of low AERONET AOD values and an underestimation of high AERONET AOD values. There is evidence of cloud contamination effects in the case of low AERONET AOD. This results in an overestimation of the retrieved GEMS AOD.
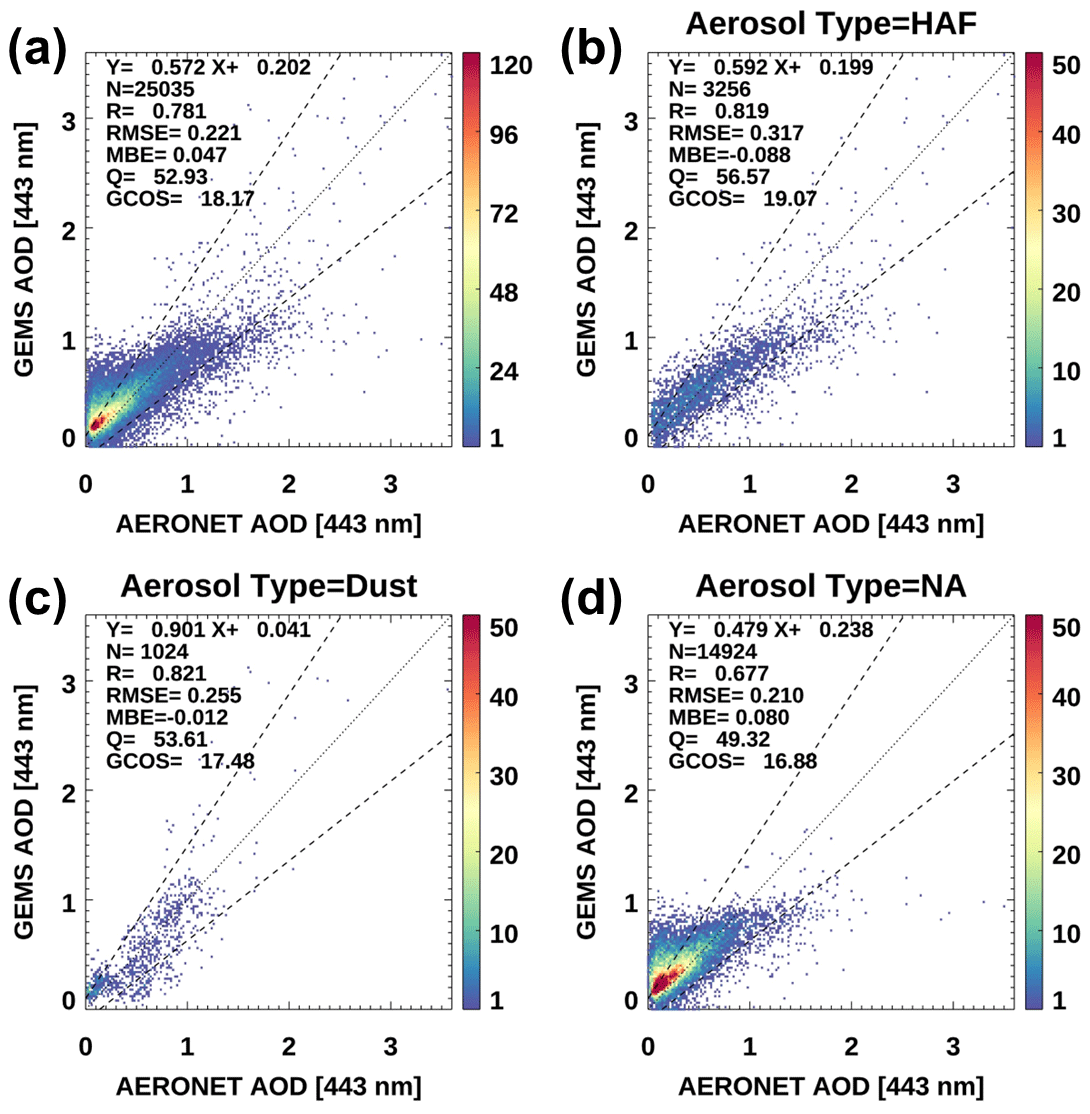
Figure 7Comparison of GEMS AOD and AERONET AOD for (a) all aerosol types and (b–d) individual aerosol types (HAF, dust, and NA, respectively). The dashed lines indicate an uncertainty envelope of up to 0.1 (or 30 %) in the AOD values. The dotted lines represent the 1 : 1 lines. Data from 1 November 2021 to 31 October 2022 are used for comparison.
The validation showed differences according to aerosol type. The HAF type showed the highest R and Q values compared with the other aerosol types (Fig. 7b). Pixels that deviated beyond the error range due to GEMS AOD underestimation were notably observed in two main categories: sites in the Indian region (which still showed bias despite the consideration of BAOD) and sites located in Beijing with an AERONET AOD value of approximately 2.0 and a GEMS AOD value of approximately 1.0. Among the three aerosol types, the dust type had the fewest samples, accounting for of the NA type (Fig. 7c). The R value was 0.821, and the slope was the highest among the three types. Pixels that deviated beyond the error range due to GEMS AOD underestimation were primarily observed in the Indian region. In contrast, pixels exceeding the error range due to GEMS AOD overestimation were located in Northeast Asia. Currently, the GEMS uses the same aerosol model (i.e., the same number size distribution parameters and refractive index) over the entire domain for each aerosol type. However, given the varying bias patterns observed in the dust types, it is necessary to consider regional variations in the GEMS aerosol model (and, thus, the LUT) in future studies. The NA type was selected most frequently among the three aerosol types (Fig. 7d). Figure 7d shows that a significant number of pixels were influenced by cloud contamination, which was particularly evident in regions with low AOD values for the NA type. The GEMS aerosol cloud-masking process requires further improvement, particularly over the ocean. The current cloud-masking process may not effectively distinguish small clouds (i.e., broken clouds) near the equatorial regions. This has resulted in an overestimation of the AOD values due to cloud contamination. This phenomenon has frequently been observed at AERONET stations located near the Equator. The underestimation of high AOD values by the GEMS aerosol algorithm can be attributed to the effects of the current aerosol model assumptions used in the algorithm. This emphasizes the importance of understanding AOPs to better characterize them in the atmosphere, particularly in the UV region.
Table 2Statistics illustrating the hourly comparison of the GEMS AOD and AERONET AOD values shown in Fig. S5.
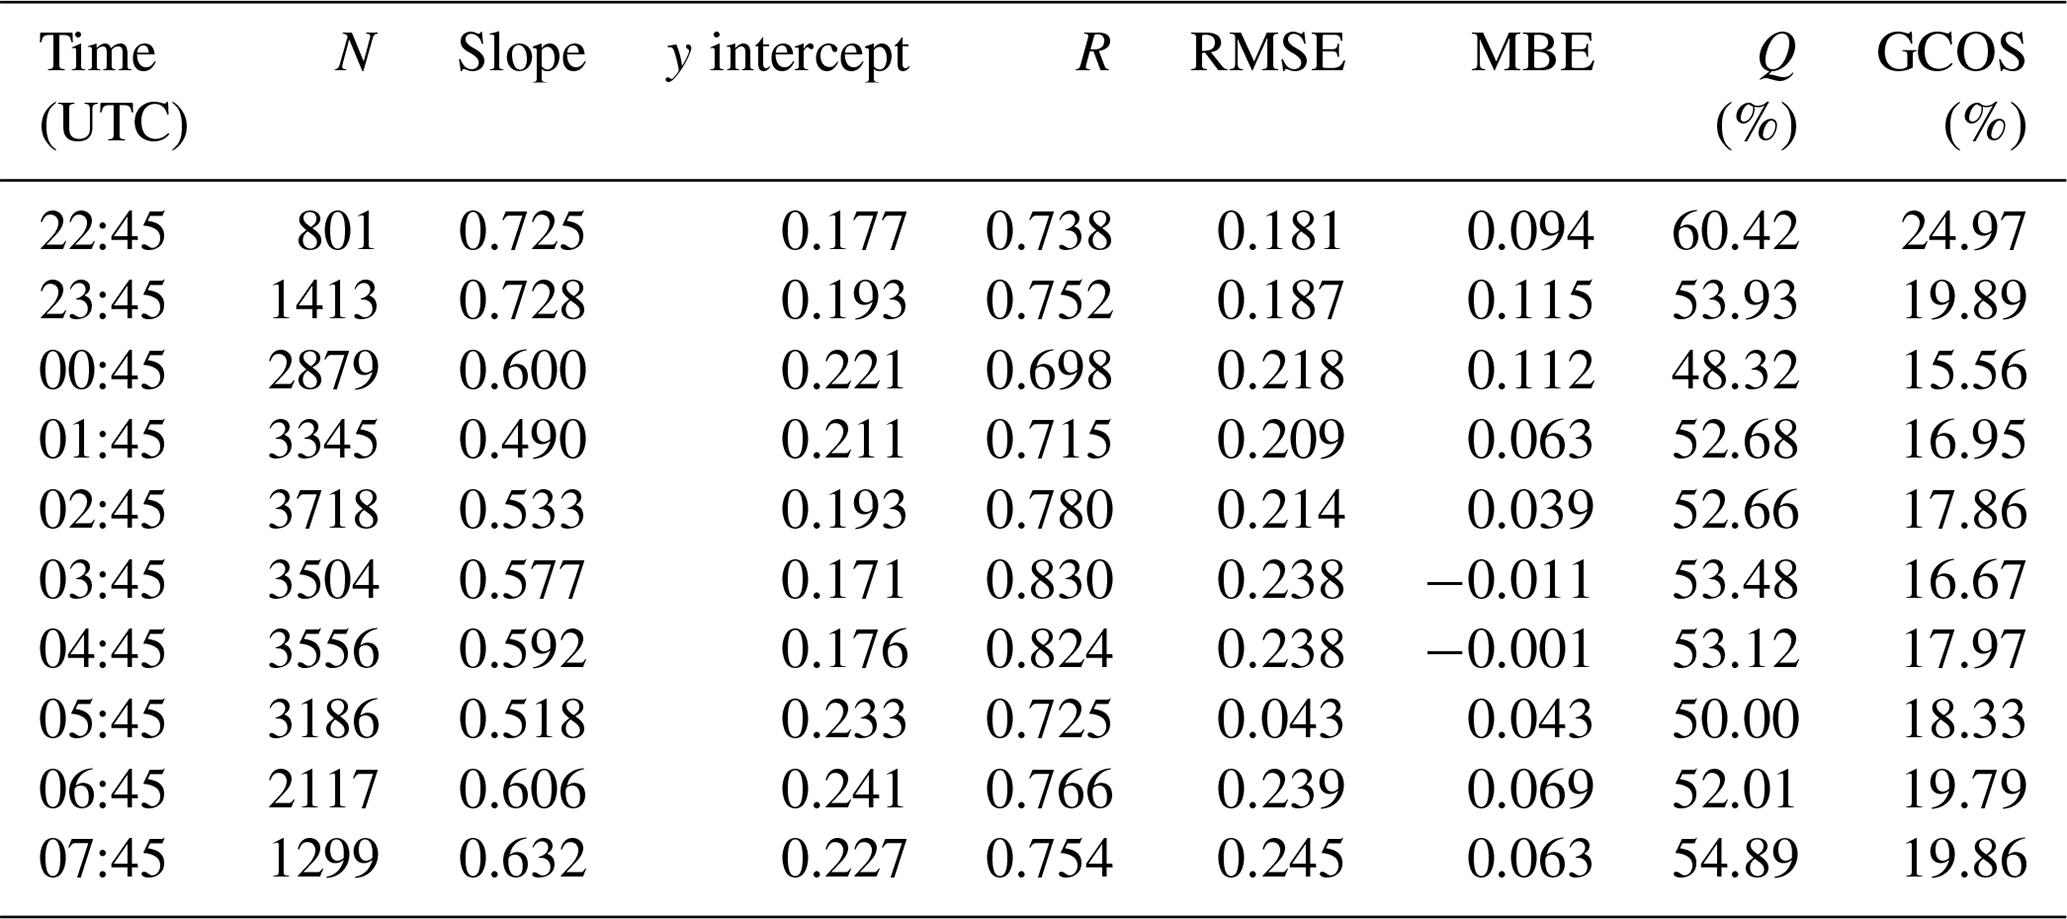
Figure S5 and Table 2 present the hourly AOD validation results and statistical metrics for N, R, the slope, the y intercept, the RMSE, the MBE, Q, and the GCOS. It is important to note that the E–W scan profile of the GEMS varied depending on the SZA. Therefore, the sites used for the validation may not have remained consistent over time. For example, the AERONET stations around 22:45 and 23:45 UTC were mainly used for validation in the eastern region of the GEMS, whereas those around 06:45 and 07:45 UTC were expected to be located in the western region of the GEMS. A systematic error analysis is planned for future studies. Nevertheless, the hourly validation results of GEMS AOD provide significant insights. The hourly slopes of GEMS AOD exhibited diurnal variations, starting with an initial value of 0.725 at 22:45 UTC, decreasing to 0.490 and 0.533 at 01:45 and 02:45 UTC, respectively, and subsequently increasing to 0.606 and 0.632 at 06:45 and 7:45 UTC, respectively. However, the R values remained relatively stable over time. Most time intervals exhibited R values of approximately 0.7 or higher except at 00:45 UTC. Figure S5 and Table 2 show that the diurnal variation in GEMS AOD does not precisely reflect the actual diurnal AOD variation. Thus, it is necessary to correct and produce a consistent dataset over time to investigate diurnal variations in aerosol properties. A machine learning model using RF was employed to train the error characteristics that vary hourly, remove artifacts from the retrieval processes, and maintain the physical signals.
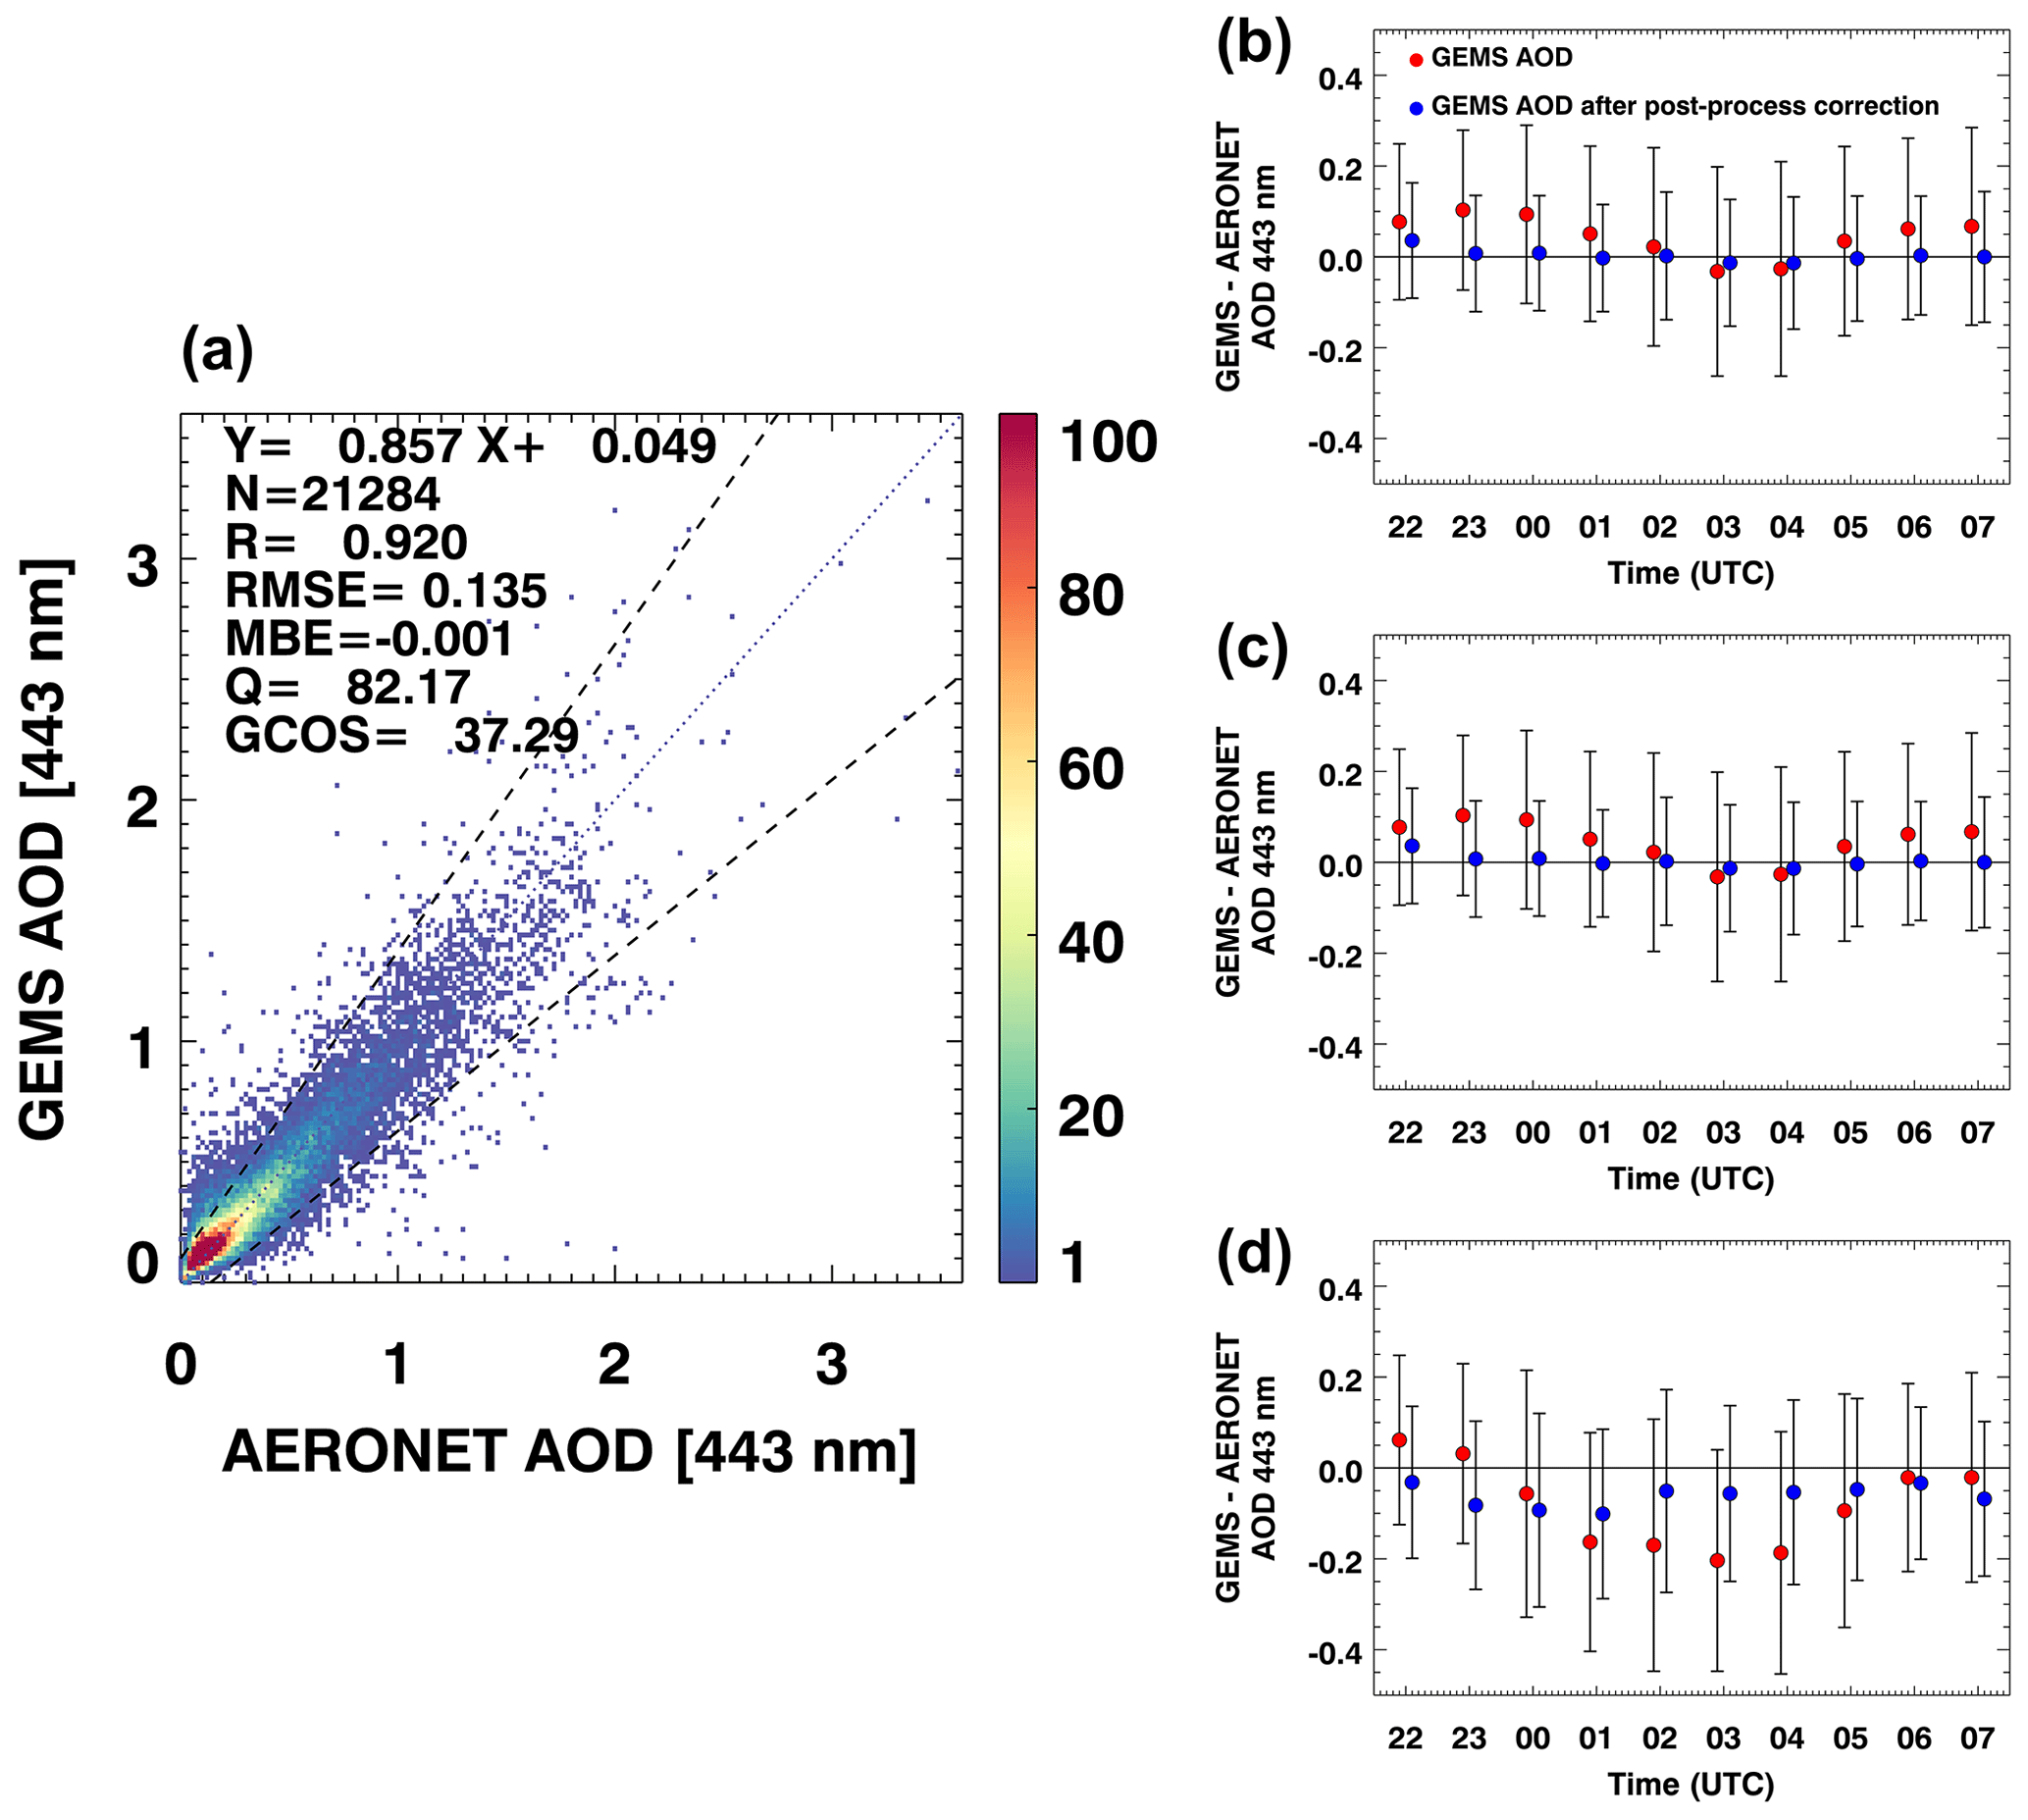
Figure 8(a) Comparison of GEMS AOD after undergoing machine-learning-based post-processing correction with AERONET AOD. The dashed lines indicate an uncertainty envelope exceeding 0.1 (or ±30 %) in the AOD values. The dotted lines represent the 1 : 1 lines. The difference between GEMS AOD and AERONET AOD over time for (b) all pixels, (c) pixels when AERONET AOD < 0.4, and (d) pixels when AERONET AOD > 0.4. The red circles represent GEMS AOD, and the blue circles represent GEMS AOD after post-processing correction. The error bars correspond to the standard deviation. Data from 1 November 2021 to 31 October 2022 are used for comparison.
Figure 8a shows the comparison results for GEMS AOD after model-enforced post-processing correction with AERONET data was applied. Figure 8a shows that all statistical metrics improved. In particular, the slope was closer to 1 at 0.857, and the y intercept was closer to zero at 0.049. Additionally, R, the RMSE, and the MBE were 0.920, 0.135, and −0.001, respectively. The Q value and GCOS requirements improved by 82.17 % and 37.29 %, respectively. The bias near low AOD values of approximately zero was significantly reduced. Furthermore, high AOD values were closer to the 1 : 1 line. Figure 8b shows the bias of GEMS AOD values before and after post-processing correction with respect to time for all AOD pixels. After applying the model-enforced post-processing correction to the GEMS AOD data, significant improvements in bias were observed over the diurnal cycle. The original GEMS AOD exhibited a bias that varied hourly. It formed a U shape, with a minimum value near noon at 03:45 UTC. However, with the implementation of model-enforced post-processing correction, the diurnal bias was effectively mitigated. This resulted in a bias value close to zero throughout the day and decreased standard deviation. Figure 8c illustrates the diurnal variation in the bias of low AOD (AERONET AOD < 0.4). GEMS AOD (red circles) exhibited a positive bias of ∼ 0.1. It was mainly corrected to values close to zero after post-processing (blue circles). However, a positive bias was observed at approximately 22:45, 23:45, 06:45, and 07:45 UTC. Figure 8d shows the diurnal variation in the bias of high AOD (AERONET AOD > 0.4). The diurnal variation in GEMS AOD (red circles) shows a clear U-shaped pattern with a maximum negative bias of approximately −0.2 at 03:45 UTC. However, after post-processing, the bias was still negative but less than −0.1, which is significantly closer to zero. By incorporating the predicted error, we obtain an improved GEMS AOD value that considers the uncertainties and biases inherent in the retrieval process. This approach helps reduce these biases, including the overestimation of low AOD values, the underestimation of high AOD values, and artificial diurnal bias in near-real-time AOD retrievals. A reduction in artifactual diurnal bias is crucial for ensuring the reliability of hourly GEMS AOD data. This eliminates time-dependent discrepancies and provides a more representative hourly aerosol distribution. Users can now rely on corrected GEMS AOD data for various applications without the influence of diurnal variations in the original measurements.
5.2 Single-scattering albedo
This section presents a comparison of GEMS SSA at 443 nm with AERONET SSA at 440 nm over the entire GEMS domain. The validation period and collocation criteria for the AERONET sites were identical to those used for GEMS AOD. Similar to the approach for AOD, when a particular aerosol type in the GEMS was detected in over 90 % of the pixels within a 0.25° radius, we performed aerosol type validation. Figure 9 and Table 3 show the validation results for all pixels and each aerosol type. Statistics, including N values and percentages, were within the expected error ranges (0.03 and 0.05). The uncertainty in the SSA values was ±0.03 when AERONET AOD at 440 nm was over 0.4 (Dubovik et al., 2000). The dashed gray lines indicate an uncertainty envelope of ±0.03 in the SSA values, whereas the dashed black lines indicate an uncertainty envelope of ±0.05 in the SSA values. These reference lines help to assess the agreement between the GEMS SSA and AERONET data within a reasonable error range. Capturing SSA signals from satellite observations is challenging when atmospheric aerosols are not abundant. Therefore, for validation, separate analyses were conducted for cases where GEMS AOD exceeded 0.4 (indicated by the red circles) and GEMS AOD exceeded 1.0 (as indicated by the blue circles). Despite the significant uncertainties associated with the satellite measurements, the GEMS aerosol product showed good overall agreement with the AERONET SSA values. When GEMS AOD exceeded 0.4, the percentage of GEMS SSA values within the expected error range of ±0.03 was 34.22 %, and the percentage within the expected error range of ±0.05 was 61.38 %. When the aerosol signal was strong (when GEMS AOD exceeded 1.0), the percentage of GEMS SSA values within the expected error of ±0.03 (0.05) increased to 48.85 % (84.48 %). However, the percentages within the expected error range and scatterplots varied depending on the aerosol type. For the HAF type, SSAs exhibited the largest spread, indicating a lower accuracy. This is likely a result of ineffective aerosol type selection (red circles). However, when the AOD values exceeded 1.0, they tended to approach the 1 : 1 line (blue circles). Moreover, the percentage of values falling within the expected error range of ±0.03 increases significantly. For the dust type, the GEMS SSA values exhibited a positive bias of approximately 0.04 compared with the AERONET SSA values (red circles). Similarly, when the AOD values exceeded 1.0, these biases decreased, approaching the 1 : 1 line (blue circles). However, the systematic bias observed in the GEMS SSA values for the dust type indicates a need to refine the assumed dust AOPs in the LUT. The NA type in the GEMS was observed to exhibit significantly lower variability than the AERONET SSA values. The GEMS SSA values were close to 1 compared to the AERONET data. According to Lee et al. (2010), the NA type is identified when the SSA value is above 0.95. However, many NA-type pixels were observed as having AERONET SSA values below 0.9. This indicates potential inaccuracies in the classification of the absorbing and NA GEMS aerosol types. However, when AOD was high (blue circles), these classification errors tended to decrease. This resulted in values closer to AERONET SSA values.
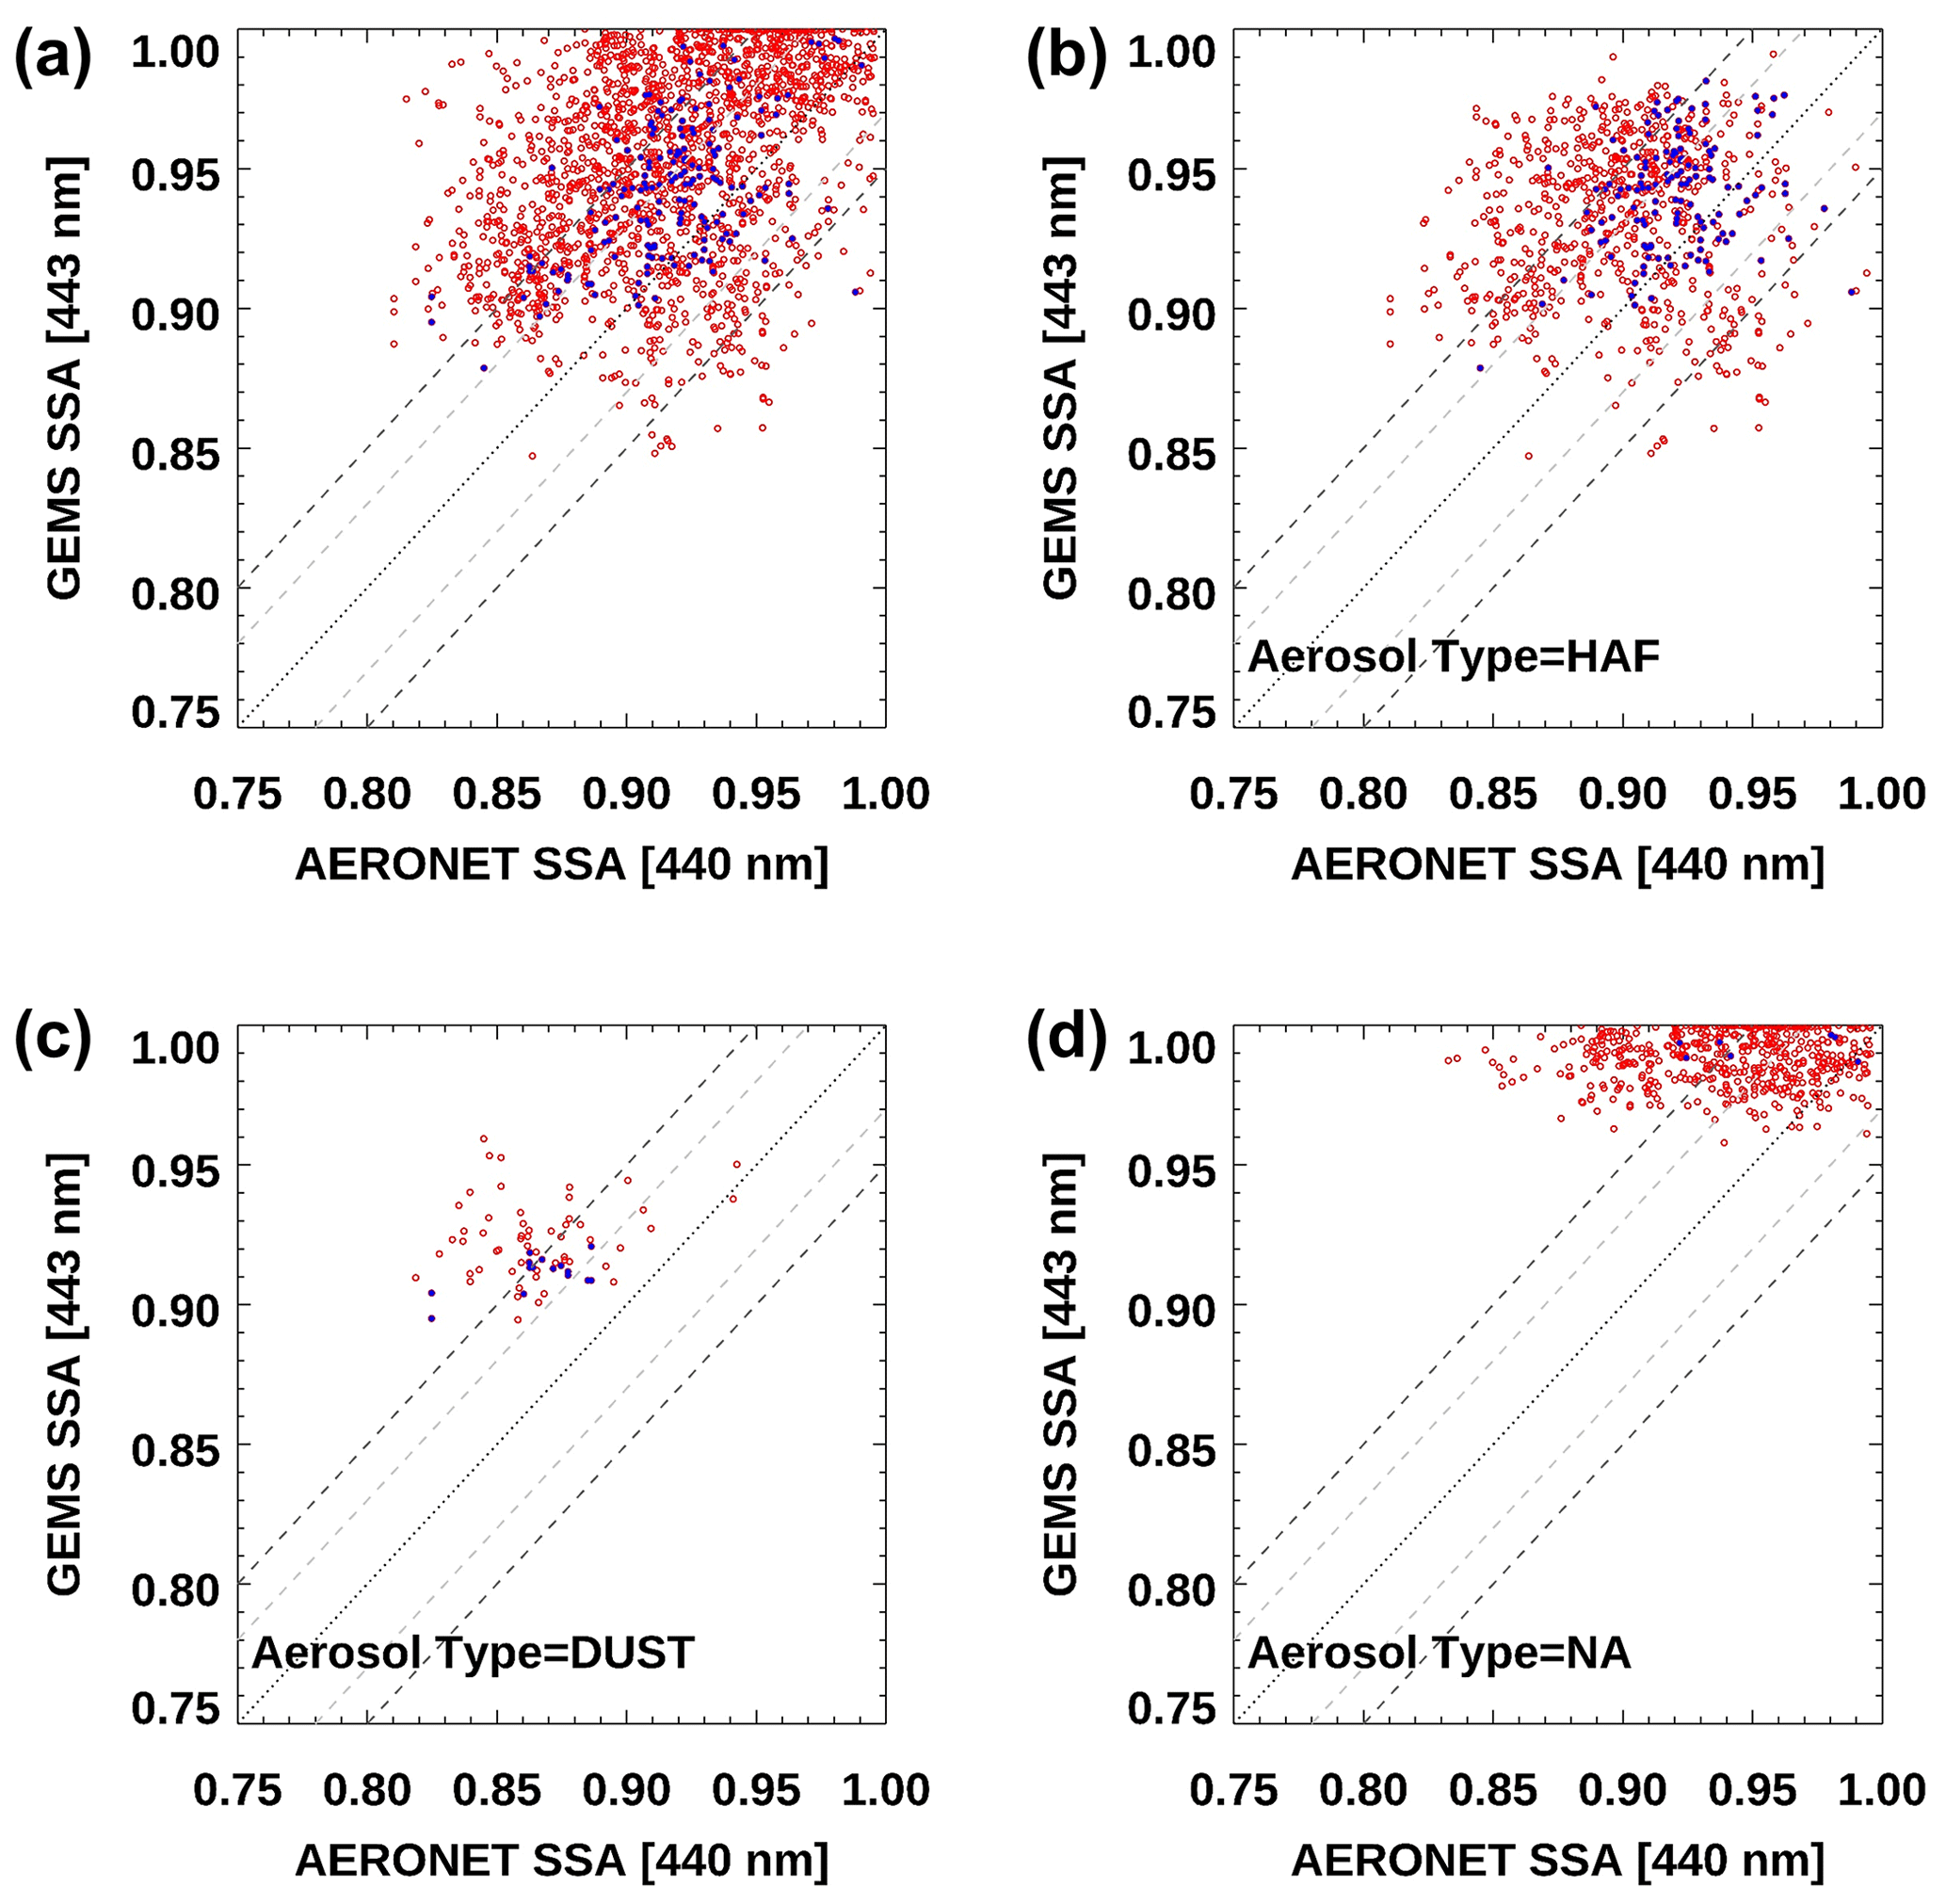
Figure 9Comparison of GEMS SSA and AERONET SSA for (a) all aerosol types and (b–d) individual aerosol types (HAF, dust, and NA, respectively). The red circles represent the pixels when AOD > 0.4, and the blue circles represent the pixels when AOD > 1.0. The dashed gray lines indicate an uncertainty envelope of ±0.03 in the SSA values, the dashed black lines indicate an uncertainty envelope of ±0.05 in the SSA values, and the dotted lines represent the 1 : 1 lines. Data from 1 November 2021 to 31 October 2022 are used for comparison.
Table 3Comparison of GEMS SSA and AERONET SSA for the different aerosol types shown in Fig. 9. N represents the number of data points, and EE% denotes the percentage of data points within the expected error range of ±0.03 (±0.05).
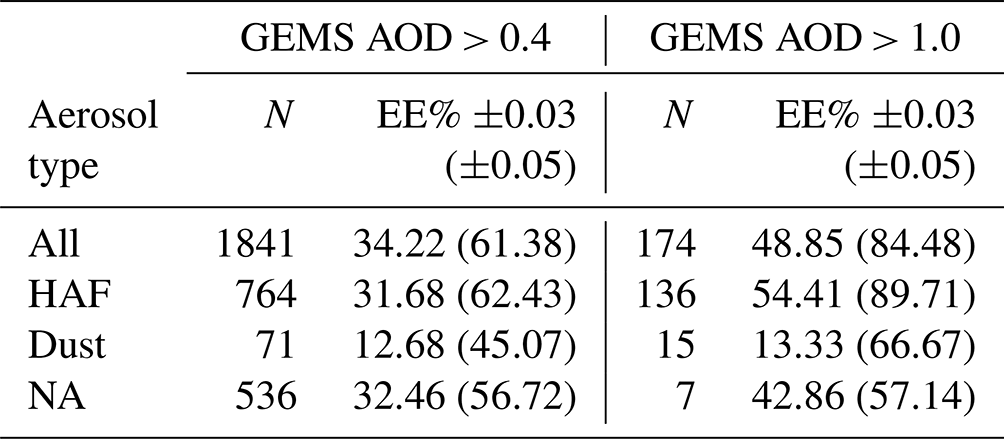
Figure S6 and Table 4 present the hourly SSA validation results and statistic metrics, including the N values and percentages within the expected error range of ±0.03 (±0.05). GEMS SSA and AERONET SSA exhibited varying distributions over time. The difference between GEMS SSA and AERONET SSA was most significant at 03:45 and 04:45 UTC, showing a positive bias. This difference decreased at 22:45, 23:45, 05:45, and 06:45 UTC (Fig. S6). Similar to GEMS AOD, the GEMS SSA exhibited diurnal variations. These values are also reflected in the EE % values shown in Table 4. At 22:45 and 23:45 UTC, the percentage within the expected error range of ±0.03 exceeded 64. However, it decreased to less than 19 % at 03:45 UTC before rising to 23 % at 04:45 UTC and subsequently increasing further. Further studies are required to understand the bias and accuracy variations in the SSA values and improve the retrieval results. These variations can also be attributed to the shorter path length in the observation geometry when the influence of surface reflectance increases, similar to the behavior seen in AODs.
Table 4Statistics illustrating the comparison of GEMS SSA and AERONET SSA shown in Fig. S6.
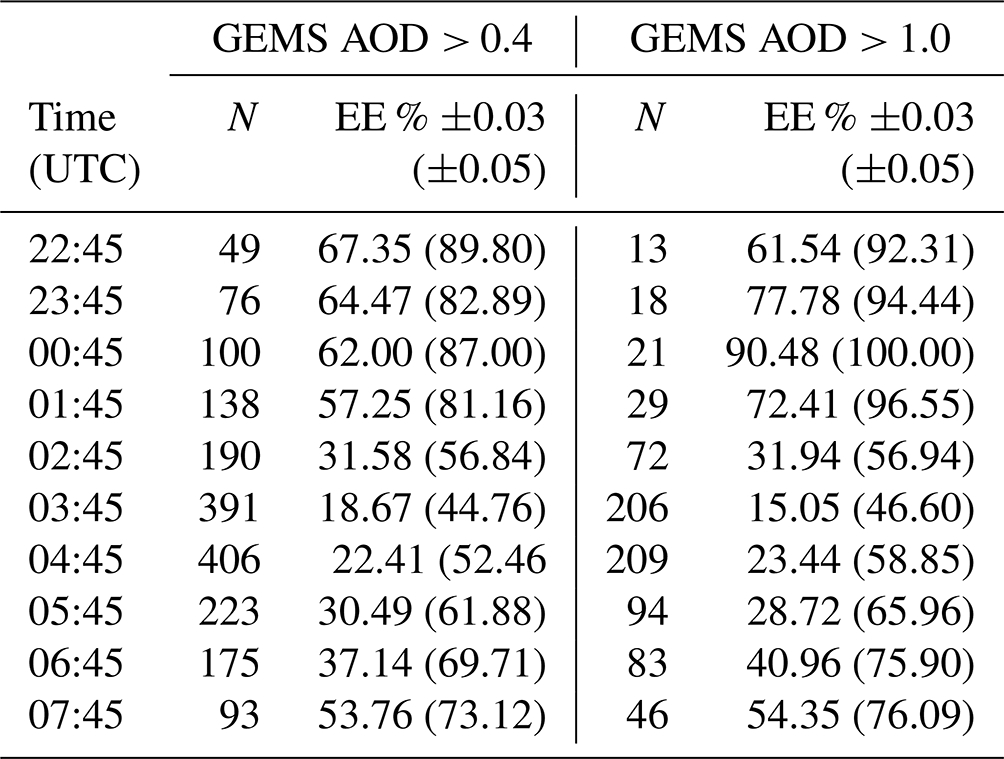
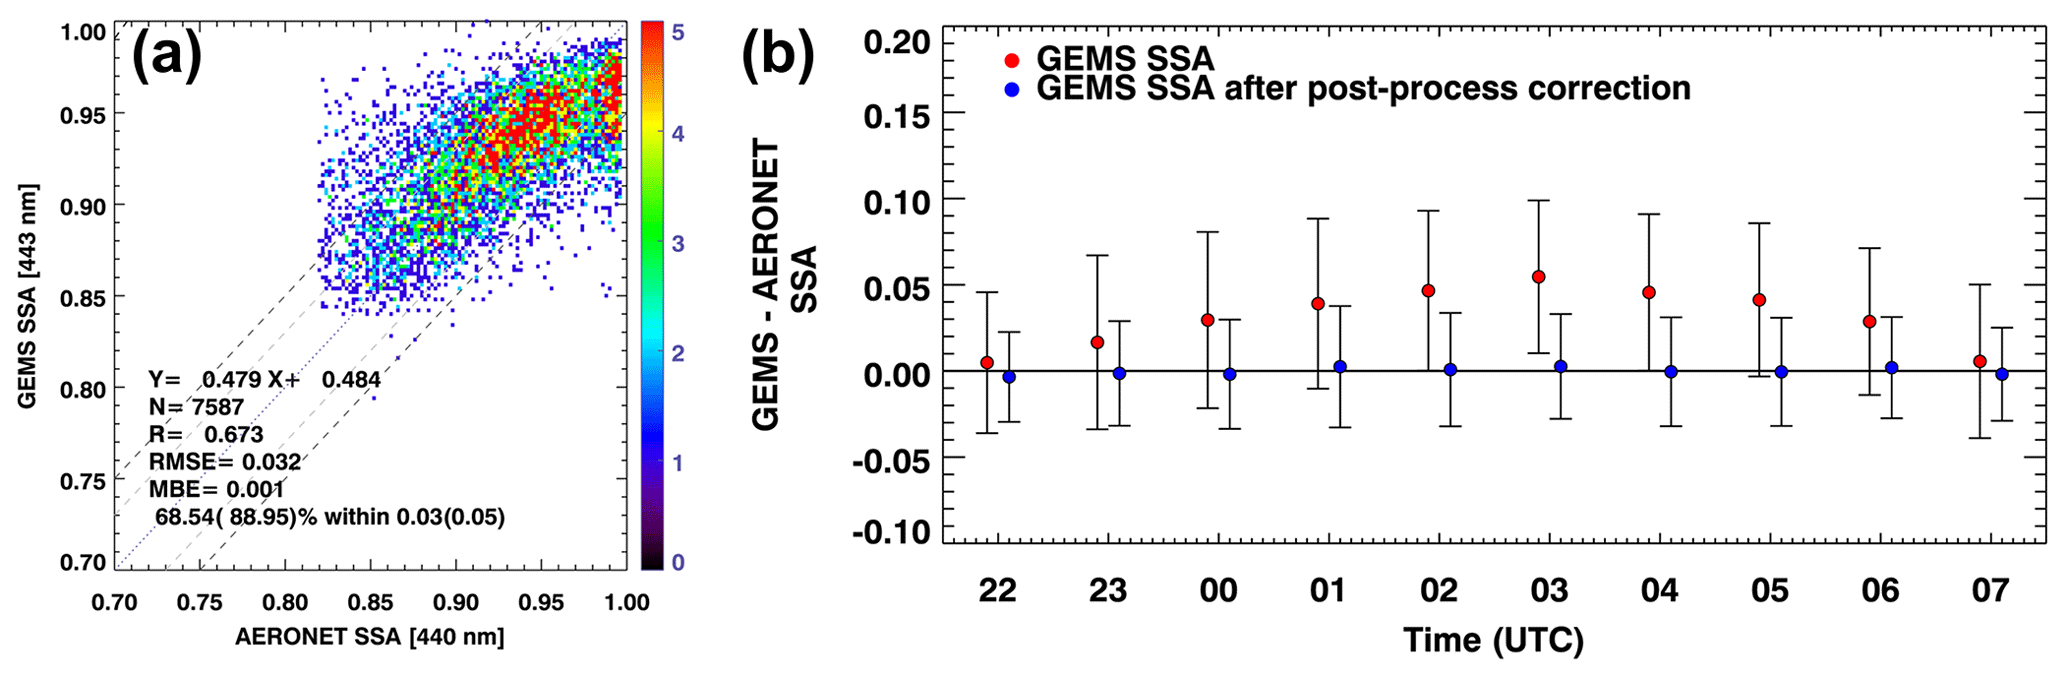
Figure 10(a) Comparison of GEMS SSA after undergoing post-processing correction and AERONET SSA. The dashed gray lines indicate an uncertainty envelope of ±0.03 in the SSA values, the dashed black lines indicate an uncertainty envelope of ±0.05 in the SSA values, and the dotted lines represent the 1 : 1 lines. (b) The difference between GEMS SSA and AERONET SSA over time. Data from 1 November 2021 to 31 October 2022 are used for comparison.
Figure 10a presents the comparison results for the GEMS SSA values after post-processing correction and the AERONET data. The validation period was from 1 November 2021, to 31 October 2022. Notably, all statistical metrics demonstrated improvements. Specifically, the percentage of GEMS SSA values falling within the expected error range of ±0.03 was 68.54 %, whereas the percentage within the range of ±0.05 was 88.95 %. Furthermore, SSA exhibited closer alignment with the 1 : 1 line. Figure 10b depicts the difference between GEMS SSA and AERONET SSA over the measurement time. Notably, the bias pattern observed in the GEMS SSA values exhibited artifactual characteristics, forming a bell-shaped curve. In particular, during the time interval from 01:45 to 05:45 UTC, the mean bias of GEMS SSA consistently surpassed the expected error range of ±0.03. However, the implementation of model-enforced post-processing correction was highly effective in mitigating this artificial diurnal bias. This correction methodology significantly improved the GEMS SSA values within the expected error range. Therefore, it enhanced the overall accuracy of the SSA retrieval.
5.3 Aerosol layer height
From 1 November 2021 to 31 October 2022, the GEMS and CALIOP data were co-located for comparison. In this section, Level-2 aerosol extinction coefficients at 532 nm were used to calculate the CALIOP ALH values. This is expressed in Eq. (2). GEMS ALH pixels within a 0.05° radius surrounding each CALIOP pixel were averaged and compared with the CALIOP ALH values within a time window of 1 h of the GEMS observation time. Validation was conducted when the GEMS AOD values were greater than 0.2. This is because the error in ALH retrieval increased when the presence of aerosols in the atmosphere was insufficient. Figure 11a shows a histogram illustrating the differences between GEMS ALH and CALIOP ALH. The total number of co-located data points is 77 318, and the mean difference is −0.225 km. The median difference is −0.167 km. This indicates that the histogram illustrating the differences follows a Gaussian distribution, although it is marginally skewed in the positive direction. Figure 11b shows a comparison between GEMS ALH and CALIOP ALH. These were distributed predominantly at altitudes of less than 2 km. The percentage of data points falling within the expected error of ±1 km was 55.3 %, and the percentage falling within the expected error range of ±1.5 km was 71.7 %. The variability in GEMS ALH was comparable to that in CALIOP ALH.
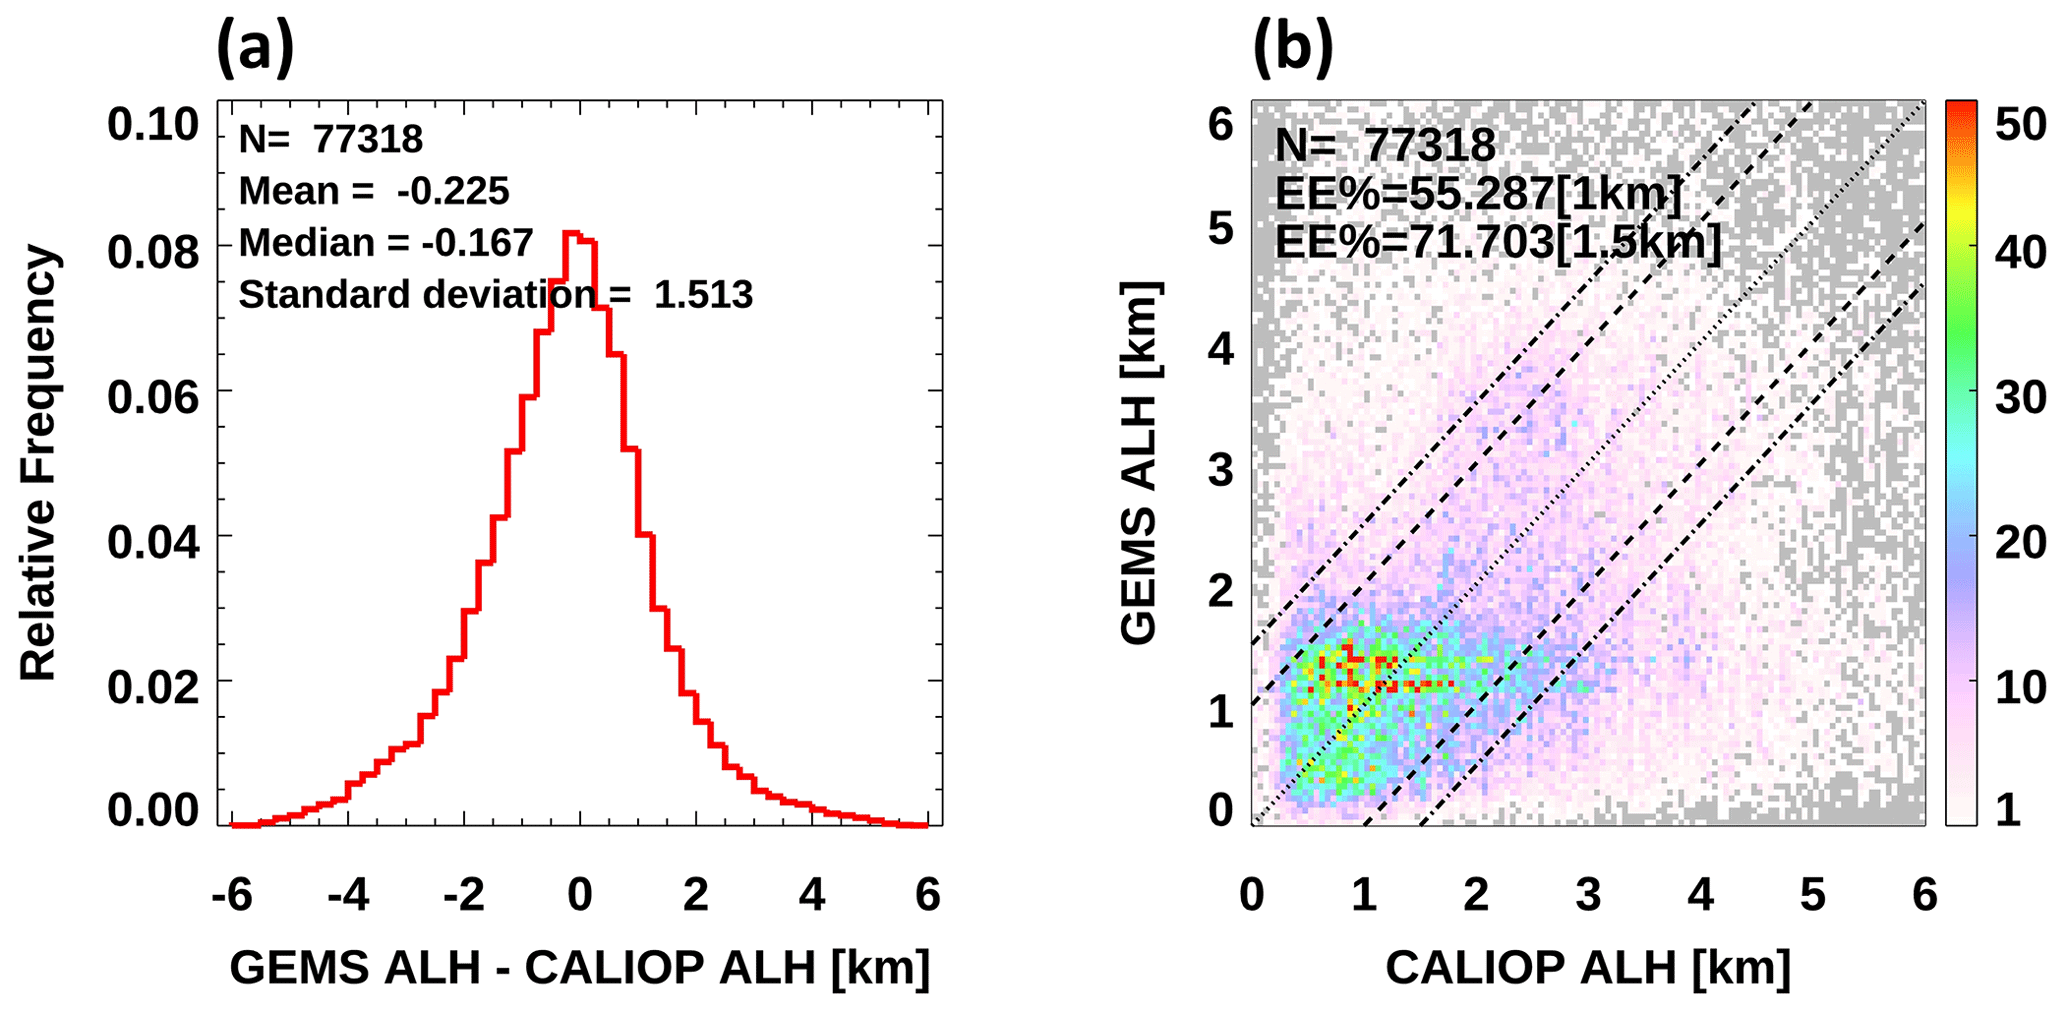
Figure 11(a) Histogram illustrating the difference between GEMS ALH and CALIOP ALH. (b) Comparison of GEMS ALH and CALIOP ALH. The dashed lines indicate an uncertainty envelope of ±1 km in the ALH values. The dash-dotted lines indicate an uncertainty envelope of ±1.5 km in the ALH values. The dotted lines represent the 1 : 1 lines. Data from 1 November 2021 to 31 October 2022 are used for comparison.
5.4 Limitations of the current GEMS AOPs and future work
Figure S7 shows seasonal and regional variations as functions of time (UTC) for each of the following four regions: Korea (33–39° N and 124–132° E), North China (33–34° N and 110–124° E), South China (21–33° N and 110–122° E), and Indo-China Peninsula (8–22° N and 92–110° E). The Indian region was excluded from the regional analysis because the observable area within the entire region of India varied significantly depending on the GEMS scan profiles. After gridding the GEMS AOPs into a 0.1° × 0.1° grid box, monthly averages were calculated. Then, seasonal averages were calculated for each pixel only when data for all 3 months within a season were available. Regional averages were calculated when more than 50 % of the available values were within the domain. For AOD, U-shaped or flat diurnal variations were observed in all four regions. For SSA, higher values were observed during June, July, and August (JJA) in Korea, North China, and South China, which are considered to be influenced by aerosol hygroscopic growth due to relatively high atmospheric humidity. However, the Indo-China Peninsula showed the highest SSA values in SON (September, October, and November) and the lowest values in DJF (December, January, and February), which is consistent with the relatively low SSA values observed at the Chiang Mai AERONET site from 2011 to 2016 during DJF (Liang et al., 2019). However, there are limitations to investigating diurnal variations in ALH. The diurnal variations in ALH were not consistent with the diurnal variations in the mixing-layer height. One reason for the uncertainty in the ALH values is that they were retrieved from the OE routine based on the uncertainty in the a priori AOD, SSA, and ALH values. Before post-processing, GEMS AOD and SSA exhibited diurnal bias patterns compared to the AERONET data (details in Sect. 5.1 and 5.2). These uncertainties affect the uncertainty in the diurnal variation in ALH. Because GEMS ALH cannot undergo post-processing correction with CALIOP data (details in Sect. 3), we will consider post-processing corrections of ALH using ground-based lidar observation networks (i.e., the Korea Aerosol Lidar Observation Network and the Asian Dust and Aerosol Lidar Observation Network) in future studies. Therefore, one of the limitations of this study is that GEMS ALH has limitations with regard to the detailed investigation of diurnal variations in ALH.
Several methods can be employed to improve the results of the GEMS aerosol algorithm. First, additional satellite data could be integrated for cloud detection. Incorporating data from other satellite sensors with IR channels, such as the Advanced Meteorological Imager (AMI), can provide complementary information for cloud masking. Secondly, it is necessary to consider the AOPs used in the LUT to improve the GEMS aerosol algorithm. It is essential to incorporate additional ground-based observations from the UV region, such as those from the Pandora instrument and the sky radiometer network (SKYNET). Collecting ground-based observations from the UV region and incorporating them into the LUT could enhance the algorithm's performance. Finally, regional LUTs with data from diverse regions that consider variability in AOPs based on regional characteristics are crucial.
In this study, we present the first atmospheric aerosol-monitoring results from the GEMS over Asia. Given that the GEMS AERAOD algorithm was developed using the OMI as the input data before the GEMS launch, modifications were made to consider the GEO observation characteristics during the IOT period. A new hourly surface reflectance database was created using the minimum-reflectance method with a fine spatial resolution aligned with the GEMS pixel resolution. In addition, monthly BAOD maps were incorporated to estimate hourly GEMS surface reflectance. New cloud-removal techniques have significantly improved the effectiveness of cloud detection and have enhanced the quality of aerosol retrieval. To avoid discrepancies between the observed and simulated radiances that may arise due to the monochromatic assumption of the LUT calculation, we applied a spectral-binning approach to the LUT calculation. Finally, post-processing correction methods based on machine learning were used to remove non-physical diurnal biases from the AOD and SSA retrievals. This reduced the biases over time and provided more reliable hourly GEMS aerosol products in near-real time.
The GEMS aerosol products were investigated with respect to three specific events: dust events over Northeast Asia, biomass burning in Southeast Asia, and absorbing-aerosol events in India. These events highlight the capability of the GEMS in monitoring and providing insights into aerosol properties during various atmospheric events while also emphasizing the importance of post-processing for data accuracy and agreement with ground measurements.
The GEMS aerosol products were validated against AERONET and CALIOP data across the entire GEMS domain for 1 year (from November 2021 to October 2022). The performance of the GEMS aerosol algorithm was assessed to verify its applicability in studying the distribution of AOPs across Asia. The validation results for each product are summarized below.
GEMS AOD showed a good correlation with AERONET AOD (R = 0.792). However, specific biased patterns were observed. Notably, the underestimation of high AERONET AOD values and the overestimation of low AERONET AOD values occurred because of cloud contamination. Different aerosol types exhibited varying validation results: the HAF type had the highest R and Q values, the dust type was underestimated in India but overestimated in Northeast Asia, and the NA type had cloud contamination issues, particularly for low AOD values. This indicates the need to improve the cloud-masking process, particularly over the ocean. Certain deviations beyond the error range of the GEMS AOD values were observed in India and Beijing. The underestimation of the high AOD values can be attributed to the aerosol model. Diurnal variations in the retrieval performance were evident, with slopes and other comparison statistics varying throughout the day. Because the testbed for the GEMS algorithm was on the LEO platform, a time-dependent retrieval bias was not previously observed. Therefore, we adopted a model-enforced post-processing correction method and found that this enhanced GEMS AOD performance reduced the overall biases. These corrected data ensure the reliability of various applications.
GEMS SSA at 443 nm was validated against AERONET SSA at 440 nm over the entire GEMS region. The agreement of the GEMS SSA values with the AERONET data was evaluated within a reasonable error range of ±0.03 (±0.05). For GEMS AOD exceeding 0.4, 42.76 % (67.25 %) of GEMS SSA values were within an error range of ±0.03 (0.05). This increased to 56.61 (85.70 %) for the strong aerosol signals (GEMS AOD > 1.0). However, the accuracy varied among the aerosol types. The HAF type exhibited higher variability and lower accuracy. The dust type had a marginal positive bias, mainly when AOD was high. Similar to AOD, the post-processing correction for the GEMS SSA data yielded significant enhancements in the statistical metrics.
The GEMS data and CALIOP data were compared. GEMS ALH was compared with CALIOP ALH when GEMS AOD exceeded 0.2. The results showed a mean difference of −0.225 km, with 55.29 % of data falling within ±1 km and 71.70 % within ±1.5 km. GEMS ALH exhibited variability similar to that of CALIOP ALH.
Overall, improvements in the GEMS aerosol algorithm have advanced our understanding of aerosol properties and their effects on the environment. Therefore, the algorithm provides valuable information for diverse applications, including air quality monitoring, air quality data assimilation, and health impact assessments in Asia.
The GEMS L2 AERAOD algorithm is not available publicly.
GEMS L2 AERAOD data were downloaded from the Environmental Satellite Center website (https://nesc.nier.go.kr/en/html/datasvc/index.do, NIER, 2024). The CALIOP V3.41 data were obtained from the Atmospheric Science Data Center at the NASA Langley Research Center (https://doi.org/10.5067/CALIOP/CALIPSO/CAL_LID_L2_VFM-ValStage1-V3-41, NASA/LARC/SD/ASDC, 2020; Vaughan et al., 2004).
The supplement related to this article is available online at: https://doi.org/10.5194/amt-17-4369-2024-supplement.
YC, JK, SG, and MK designed the experiments. WJL and DWL provided support for data collection. SL, MK, HC, OT, and SSP contributed to algorithm development. YC wrote the paper with contributions from all co-authors. JK reviewed and edited the paper. JK provided support and supervision. All authors analyzed the measurement data and prepared the paper.
At least one of the (co-)authors is a member of the editorial board of Atmospheric Measurement Techniques. The peer-review process was guided by an independent editor, and the authors also have no other competing interests to declare.
Publisher's note: Copernicus Publications remains neutral with regard to jurisdictional claims made in the text, published maps, institutional affiliations, or any other geographical representation in this paper. While Copernicus Publications makes every effort to include appropriate place names, the final responsibility lies with the authors.
This article is part of the special issue “GEMS: first year in operation (AMT/ACP inter-journal SI)”. It is not associated with a conference.
We thank all principal investigators and their staff for establishing and maintaining the AERONET sites used in this investigation. The authors acknowledge the National Institute of Environmental Research and the Korea Aerospace Research Institute for providing satellite data and Myoung-Hwan Ahn and his research group at Ewha Womans University for providing information regarding GEMS specifications and Level-1 data.
This research has been supported by a grant from the National Institute of Environment Research (NIER), funded by the Ministry of Environment (MOE) of the Republic of Korea (grant no. NIER-2024-04-02-028). The GEMS program is supported by the National Institute of Environmental Research (NIER) under the Ministry of Environment, Republic of Korea. This project is supported by the Ministry of Environment (MOE) of the Republic of Korea through the Public Technology Program based on the Environmental Policy Program (grant no. 2017000160001).
This paper was edited by Myoung-Hwan Ahn and reviewed by two anonymous referees.
Ahn, C., Torres, O., and Jethva, H.: Assessment of OMI near-UV aerosol optical depth over land, J. Geophys. Res.-Atmos., 119, 2457–2473, https://doi.org/10.1002/2013jd020188, 2014.
Ceamanos, X., Six, B., Moparthy, S., Carrer, D., Georgeot, A., Gasteiger, J., Riedi, J., Attié, J.-L., Lyapustin, A., and Katsev, I.: Instantaneous aerosol and surface retrieval using satellites in geostationary orbit (iAERUS-GEO) – estimation of 15 min aerosol optical depth from MSG/SEVIRI and evaluation with reference data, Atmos. Meas. Tech., 16, 2575–2599, https://doi.org/10.5194/amt-16-2575-2023, 2023.
Choi, M., Kim, J., Lee, J., Kim, M., Park, Y.-J., Holben, B., Eck, T. F., Li, Z., and Song, C. H.: GOCI Yonsei aerosol retrieval version 2 products: an improved algorithm and error analysis with uncertainty estimation from 5-year validation over East Asia, Atmos. Meas. Tech., 11, 385–408, https://doi.org/10.5194/amt-11-385-2018, 2018.
Curier, R. L., Veefkind, J. P., Braak, R., Veihelmann, B., Torres, O., and de Leeuw, G.: Retrieval of aerosol optical properties from OMI radiances using a multiwavelength algorithm: Application to western Europe, J. Geophys. Res.-Atmos., 113, D17S90, https://doi.org/10.1029/2007JD008738, 2008.
Dobber, M., Kleipool, Q., Dirksen, R., Levelt, P., Jaross, G., Taylor, S., Kelly, T., Flynn, L., Leppelmeier, G., and Rozemeijer, N.: Validation of Ozone Monitoring Instrument level 1b data products, J. Geophys. Res., 113, D15S06, https://doi.org/10.1029/2007jd008665, 2008.
Dubovik, O., Smirnov, A., Holben, B. N., King, M. D., Kaufman, Y. J., Eck, T. F., and Slutsker, I.: Accuracy assessment of aerosol optical properties retrieved from Aerosol Robotic Network (AERONET) Sun and sky radiance measurements, J. Geophys. Res., 105, 9791–9806, 2000.
Giles, D. M., Sinyuk, A., Sorokin, M. G., Schafer, J. S., Smirnov, A., Slutsker, I., Eck, T. F., Holben, B. N., Lewis, J. R., Campbell, J. R., Welton, E. J., Korkin, S. V., and Lyapustin, A. I.: Advancements in the Aerosol Robotic Network (AERONET) Version 3 database – automated near-real-time quality control algorithm with improved cloud screening for Sun photometer aerosol optical depth (AOD) measurements, Atmos. Meas. Tech., 12, 169–209, https://doi.org/10.5194/amt-12-169-2019, 2019.
Go, S., Kim, J., Mok, J., Irie, H., Yoon, J., Torres, O., Krotkov, N. A., Labow, G., Kim, M., Koo, J.-H., Choi, M., and Lim, H.: Ground-based retrievals of aerosol column absorption in the UV spectral region and their implications for GEMS measurements, Remote Sens. Environ., 245, 111759, https://doi.org/10.1016/j.rse.2020.111759, 2020a.
Go, S., Kim, J., Park, S. S., Kim, M., Lim, H., Kim, J.-Y., Lee, D.-W., and Im, J.: Synergistic Use of Hyperspectral UV-Visible OMI and Broadband Meteorological Imager MODIS Data for a Merged Aerosol Product, Remote Sens., 12, 3987, https://doi.org/10.3390/rs12233987, 2020b.
Herman, J. R. and Celarier, E. A.: Earth surface reflectivity climatology at 340–380 nm from TOMS data, J. Geophys. Res.-Atmos., 102, 28003–28011, 1997.
Holben, B. N., Eck, T. F., Slutsker, I., Tanre, D., Buis, J. P., Setzer, A., Vermote, E., Reagan, J. A., Kaufman, Y., Nakajima, T., Lavenue, F., Jankowiak, I., and Smirnov, A.: AERONET – A federated instrument network and data archive for aerosol characterization, Remote Sens. Environ., 66, 1–16, https://doi.org/10.1016/S0034-4257(98)00031-5, 1998.
Hsu, N. C., Si-Chee, T., King, M. D., and Herman, J. R.: Aerosol properties over bright-reflecting source regions, IEEE T. Geosci. Remote, 42, 557–569, https://doi.org/10.1109/tgrs.2004.824067, 2004.
Hsu, N. C., Tsay, S. C., King, M. D., and Herman, J. R.: Deep Blue Retrievals of Asian Aerosol Properties During ACE-Asia, IEEE T. Geosci. Remote, 44, 3180–3195, https://doi.org/10.1109/tgrs.2006.879540, 2006.
Hsu, N. C., Lee, J., Sayer, A. M., Carletta, N., Chen, S.-H., Tucker, C. J., Holben, B. N., and Tsay, S.-C.: Retrieving near-global aerosol loading over land and ocean from AVHRR, J. Geophys. Res.-Atmos., 122, 9968–9989, https://doi.org/10.1002/2017JD026932, 2017.
Hsu, N. C., Lee, J., Sayer, A. M., Kim, W., Bettenhausen, C., and Tsay, S. C.: VIIRS Deep Blue Aerosol Products Over Land: Extending the EOS Long-Term Aerosol Data Records, J. Geophys. Res.-Atmos., 124, 4026–4053, https://doi.org/10.1029/2018jd029688, 2019.
Jackson, J. M., Liu, H., Laszlo, I., Kondragunta, S., Remer, L. A., Huang, J., and Huang, H.-C.: Suomi-NPP VIIRS aerosol algorithms and data products, J. Geophys. Res.-Atmos., 118, 12673–12689, https://doi.org/10.1002/2013jd020449, 2013.
Jeong, U., Kim, J., Ahn, C., Torres, O., Liu, X., Bhartia, P. K., Spurr, R. J. D., Haffner, D., Chance, K., and Holben, B. N.: An optimal-estimation-based aerosol retrieval algorithm using OMI near-UV observations, Atmos. Chem. Phys., 16, 177–193, https://doi.org/10.5194/acp-16-177-2016, 2016.
Jethva, H., Satheesh, S. K., and Srinivasan, J.: Assessment of second-generation MODIS aerosol retrieval (Collection 005) at Kanpur, India, Geophys. Res. Lett., 34, L19802, https://doi.org/10.1029/2007gl029647, 2007.
Kang, M., Ahn, M.-H., Liu, X., Jeong, U., and Kim, J.: Spectral Calibration Algorithm for the Geostationary Environment Monitoring Spectrometer (GEMS), Remote Sens., 12, 2846, https://doi.org/10.3390/rs12172846, 2020.
Kassianov, E., Barnard, J., Pekour, M., Berg, L. K., Michalsky, J., Lantz, K., and Hodges, G.: Do diurnal aerosol changes affect daily average radiative forcing?, Geophys. Res. Lett., 40, 3265–3269, 2013.
Kayetha, V., Torres, O., and Jethva, H.: Retrieval of UV–visible aerosol absorption using AERONET and OMI–MODIS synergy: spatial and temporal variability across major aerosol environments, Atmos. Meas. Tech., 15, 845–877, https://doi.org/10.5194/amt-15-845-2022, 2022.
Kim, B.-R., Kim, G., Cho, M., Choi, Y.-S., and Kim, J.: First results of cloud retrieval from the Geostationary Environmental Monitoring Spectrometer, Atmos. Meas. Tech., 17, 453–470, https://doi.org/10.5194/amt-17-453-2024, 2024.
Kim, J., Jeong, U., Ahn, M.-H., Kim, J. H., Park, R. J., Lee, H., Song, C. H., Choi, Y.-S., Lee, K.-H., Yoo, J.-M., Jeong, M.-J., Park, S. K., Lee, K.-M., Song, C.-K., Kim, S.-W., Kim, Y. J., Kim, S.-W., Kim, M., Go, S., Liu, X., Chance, K., Chan Miller, C., Al-Saadi, J., Veihelmann, B., Bhartia, P. K., Torres, O., Abad, G. G., Haffner, D. P., Ko, D. H., Lee, S. H., Woo, J.-H., Chong, H., Park, S. S., Nicks, D., Choi, W. J., Moon, K.-J., Cho, A., Yoon, J., Kim, S.-k., Hong, H., Lee, K., Lee, H., Lee, S., Choi, M., Veefkind, P., Levelt, P. F., Edwards, D. P., Kang, M., Eo, M., Bak, J., Baek, K., Kwon, H.-A., Yang, J., Park, J., Han, K. M., Kim, B.-R., Shin, H.-W., Choi, H., Lee, E., Chong, J., Cha, Y., Koo, J.-H., Irie, H., Hayashida, S., Kasai, Y., Kanaya, Y., Liu, C., Lin, J., Crawford, J. H., Carmichael, G. R., Newchurch, M. J., Lefer, B. L., Herman, J. R., Swap, R. J., Lau, A. K. H., Kurosu, T. P., Jaross, G., Ahlers, B., Dobber, M., McElroy, C. T., and Choi, Y.: New Era of Air Quality Monitoring from Space: Geostationary Environment Monitoring Spectrometer (GEMS), B. Am. Meteorol. Soc., 101, E1–E22, https://doi.org/10.1175/bams-d-18-0013.1, 2020.
Kim, M., Kim, J., Wong, M. S., Yoon, J., Lee, J., Wu, D., Chan, P. W., Nichol, J. E., Chung, C. Y., and Ou, M. L.: Improvement of aerosol optical depth retrieval over Hong Kong from a geostationary meteorological satellite using critical reflectance with background optical depth correction, Remote Sens. Environ., 142, 176–187, 2014.
Kim, M., Kim, J., Jeong, U., Kim, W., Hong, H., Holben, B., Eck, T. F., Lim, J. H., Song, C. K., Lee, S., and Chung, C.-Y.: Aerosol optical properties derived from the DRAGON-NE Asia campaign, and implications for a single-channel algorithm to retrieve aerosol optical depth in spring from Meteorological Imager (MI) on-board the Communication, Ocean, and Meteorological Satellite (COMS), Atmos. Chem. Phys., 16, 1789–1808, https://doi.org/10.5194/acp-16-1789-2016, 2016.
Kim, M., Kim, J., Torres, O., Ahn, C., Kim, W., Jeong, U., Go, S., Liu, X., Moon, K., and Kim, D.-R.: Optimal Estimation-Based Algorithm to Retrieve Aerosol Optical Properties for GEMS Measurements over Asia, Remote Sens., 10, 162, https://doi.org/10.3390/rs10020162, 2018.
Kim, M., Kim, S. H., Kim, W. V., Lee, Y. G., Kim, J., and Kafatos, M. C.: Assessment of Aerosol optical depth under background and polluted conditions using AERONET and VIIRS datasets, Atmos. Environ., 245, 117994, https://doi.org/10.1016/j.atmosenv.2020.117994, 2021.
Kleipool, Q. L., Dobber, M. R., de Haan, J. F., and Levelt, P. F.: Earth surface reflectance climatology from 3 years of OMI data, J. Geophys. Res., 113, D18308, https://doi.org/10.1029/2008jd010290, 2008.
Kondragunta, S., Laszlo, I., Zhang, H., Ciren, P., and Huff, A.: Air Quality Applications of ABI Aerosol Products from the GOES-R Series, in: The GOES-R Series: A New Generation of Geostationary Environmental Satellites, Elsevier, Amsterdam, the Netherlands, Oxford, UK, Cambridge MA, USA, 203–217, ISBN 9780128143285, 2020.
Kuang, Y., Zhao, C. S., Tao, J. C., and Ma, N.: Diurnal variations of aerosol optical properties in the North China Plain and their influences on the estimates of direct aerosol radiative effect, Atmos. Chem. Phys., 15, 5761–5772, https://doi.org/10.5194/acp-15-5761-2015, 2015.
Lee, J., Kim, J., Song, C., Kim, S., Chun, Y., Sohn, B., and Holben, B.: Characteristics of aerosol types from AERONET sunphotometer measurements, Atmos. Environ., 44, 3110–3117, https://doi.org/10.1016/j.atmosenv.2010.05.035, 2010.
Lee, J., Kim, J., Yang, P., and Hsu, N. C.: Improvement of aerosol optical depth retrieval from MODIS spectral reflectance over the global ocean using new aerosol models archived from AERONET inversion data and tri-axial ellipsoidal dust database, Atmos. Chem. Phys., 12, 7087–7102, https://doi.org/10.5194/acp-12-7087-2012, 2012.
Lee, S., Choi, M., Kim, J., Park, Y. J., Choi, J. K., Lim, H., Lee, J., Kim, M., and Cho, Y.: Retrieval of aerosol optical properties from GOCI-II observations: Continuation of long-term geostationary aerosol monitoring over East Asia, Sci. Total Environ., 903, 166504, https://doi.org/10.1016/j.scitotenv.2023.166504, 2023.
Lennartson, E. M., Wang, J., Gu, J., Castro Garcia, L., Ge, C., Gao, M., Choi, M., Saide, P. E., Carmichael, G. R., Kim, J., and Janz, S. J.: Diurnal variation of aerosol optical depth and PM2.5 in South Korea: a synthesis from AERONET, satellite (GOCI), KORUS-AQ observation, and the WRF-Chem model, Atmos. Chem. Phys., 18, 15125–15144, https://doi.org/10.5194/acp-18-15125-2018, 2018.
Levelt, P. F., van den Oord, G. H. J., Dobber, M. R., Malkki, A., Huib, V., Johan de, V., Stammes, P., Lundell, J. O. V., and Saari, H.: The ozone monitoring instrument, IEEE T. Geosci. Remote, 44, 1093–1101, https://doi.org/10.1109/tgrs.2006.872333, 2006.
Levelt, P. F., Joiner, J., Tamminen, J., Veefkind, J. P., Bhartia, P. K., Stein Zweers, D. C., Duncan, B. N., Streets, D. G., Eskes, H., van der A, R., McLinden, C., Fioletov, V., Carn, S., de Laat, J., DeLand, M., Marchenko, S., McPeters, R., Ziemke, J., Fu, D., Liu, X., Pickering, K., Apituley, A., González Abad, G., Arola, A., Boersma, F., Chan Miller, C., Chance, K., de Graaf, M., Hakkarainen, J., Hassinen, S., Ialongo, I., Kleipool, Q., Krotkov, N., Li, C., Lamsal, L., Newman, P., Nowlan, C., Suleiman, R., Tilstra, L. G., Torres, O., Wang, H., and Wargan, K.: The Ozone Monitoring Instrument: overview of 14 years in space, Atmos. Chem. Phys., 18, 5699–5745, https://doi.org/10.5194/acp-18-5699-2018, 2018.
Levy, R. C., Mattoo, S., Munchak, L. A., Remer, L. A., Sayer, A. M., Patadia, F., and Hsu, N. C.: The Collection 6 MODIS aerosol products over land and ocean, Atmos. Meas. Tech., 6, 2989–3034, https://doi.org/10.5194/amt-6-2989-2013, 2013.
Liang, Y., Che, H., Gui, K., Zheng, Y., Yang, X., Li, X., Liu, C., Sheng, Z., Sun, T., and Zhang, X.: Impact of Biomass Burning in South and Southeast Asia on Background Aerosol in Southwest China, Aerosol Air Qual. Res., 19, 1188–1204, https://doi.org/10.4209/AAQR.2018.08.0324, 2019.
Lipponen, A., Kolehmainen, V., Kolmonen, P., Kukkurainen, A., Mielonen, T., Sabater, N., Sogacheva, L., Virtanen, T. H., and Arola, A.: Model-enforced post-process correction of satellite aerosol retrievals, Atmos. Meas. Tech., 14, 2981–2992, https://doi.org/10.5194/amt-14-2981-2021, 2021.
Lipponen, A., Reinvall, J., Väisänen, A., Taskinen, H., Lähivaara, T., Sogacheva, L., Kolmonen, P., Lehtinen, K., Arola, A., and Kolehmainen, V.: Deep-learning-based post-process correction of the aerosol parameters in the high-resolution Sentinel-3 Level-2 Synergy product, Atmos. Meas. Tech., 15, 895–914, https://doi.org/10.5194/amt-15-895-2022, 2022.
Lyapustin, A., Wang, Y., Korkin, S., and Huang, D.: MODIS Collection 6 MAIAC algorithm, Atmos. Meas. Tech., 11, 5741–5765, https://doi.org/10.5194/amt-11-5741-2018, 2018.
Lyapustin, A., Wang, Y., Go, S., Choi, M., Korkin, S., Huang, D., Knyazikhin, Y., Blank, K., and Marshak, A.: Atmospheric Correction of DSCOVR EPIC: Version 2 MAIAC Algorithm, Front. Remote Sens., 2, 748362, https://doi.org/10.3389/frsen.2021.748362, 2021.
Martonchik, J. V., Kahn, R. A., and Diner, D. J.: Retrieval of Aerosol Properties over Land Using MISR Observations, in: Satellite Aerosol Remote Sensing Over Land, edited by: Kokhanovsky, A. A. and de Leeuw, G., Springer, Berlin, 267–293, ISBN 978-3-540-69396-3, 2009.
Nanda, S., de Graaf, M., Veefkind, J. P., Sneep, M., ter Linden, M., Sun, J., and Levelt, P. F.: A first comparison of TROPOMI aerosol layer height (ALH) to CALIOP data, Atmos. Meas. Tech., 13, 3043–3059, https://doi.org/10.5194/amt-13-3043-2020, 2020.
NASA/LARC/SD/ASDC: CALIPSO Lidar Level 1B Profile, Validated Stage 1 V3-41, NASA Langley Atmospheric Science Data Center DAAC [data set], https://doi.org/10.5067/CALIOP/CALIPSO/CAL_LID_L2_VFM-ValStage1-V3-41, 2020.
National Institute of Environmental Research (NIER): GEMS data, Environmetal Satellite Center [data set], https://nesc.nier.go.kr/en/html/datasvc/index.do, last access: 16 July 2024.
Park, S. S., Kim, J., Cho, Y., Lee, H., Park, J., Lee, D.-W., Lee, W.-J., and Kim, D.-R.: Retrieval Algorithm for Aerosol Effective Height from the Geostationary Environment Monitoring Spectrometer (GEMS), Atmos. Meas. Tech. Discuss. [preprint], https://doi.org/10.5194/amt-2023-136, in review, 2023.
Ram, K., Sarin, M. M., Sudheer, A. K., and Rengarajan, R.: Carbonaceous and Secondary Inorganic Aerosols during Wintertime Fog and Haze over Urban Sites in the Indo-Gangetic Plain, Aerosol Air Qual. Res., 41, 359–370, https://doi.org/10.4209/aaqr.2011.07.0105, 2012.
Remer, L. A., Kaufman, Y. J., Tanré, D., Mattoo, S., Chu, D. A., Martins, J. V., Li, R., Ichoku, C., Levy, R. C., Kleidman, R. G., Eck, T. F., Vermote, E., and Holben, B. N.: The MODIS Aerosol Algorithm, Products, and Validation, J. Atmos. Sci., 62, 947–973, https://doi.org/10.1175/JAS3385.1, 2005.
Rodgers, C. D.: Inverse method for atmospheric sounding: theory and practice. World Scientific Publishing Co. Pte. Ltd., Singapore, ISBN 9789810227401, 2000.
Singh, G. K., Choudhary, V., Rajeev, P., Paul, D., and Gupta, T.: Understanding the origin of carbonaceous aerosols during periods of extensive biomass burning in northern India, Environ. Pollut., 270, 116082, https://doi.org/10.1016/j.envpol.2020.116082, 2021.
Sinyuk, A., Holben, B. N., Eck, T. F., Giles, D. M., Slutsker, I., Korkin, S., Schafer, J. S., Smirnov, A., Sorokin, M., and Lyapustin, A.: The AERONET Version 3 aerosol retrieval algorithm, associated uncertainties and comparisons to Version 2, Atmos. Meas. Tech., 13, 3375–3411, https://doi.org/10.5194/amt-13-3375-2020, 2020.
Spurr, R. J. D.: VLIDORT: A linearized pseudo-spherical vector discrete ordinate radiative transfer code for forward model and retrieval studies in multilayer multiple scattering media, J. Quant. Spectrosc. Ra., 102, 316–342, https://doi.org/10.1016/j.jqsrt.2006.05.005, 2006.
Torres, O., Bhartia, P. K., Herman, J. R., Syniuk, A., Ginoux, P., and Holben, B.: A long term record of aerosol optical depth from TOMS observations D and comparison to AERONET measurements, J. Atmos. Sci., 59, 398–413, 2002.
Torres, O., Bhartia, P. K., Sinyuk, A., Welton, E. J., and Holben, B.: Total Ozone Mapping Spectrometer measurements of aerosol absorption from space: Comparison to SAFARI 2000 ground-based observations, J. Geophys. Res., 110, D10S18, https://doi.org/10.1029/2004JD004611, 2005.
Torres, O., Tanskanen, A., Veihelmann, B., Ahn, C., Braak, R., Bhartia, P. K., Veefkind, P., and Levelt, P.: Aerosols and surface UV products from Ozone Monitoring Instrument observations: An overview, J. Geophys. Res., 112, D24S47, https://doi.org/10.1029/2007jd008809, 2007.
Torres, O., Ahn, C., and Chen, Z.: Improvements to the OMI near-UV aerosol algorithm using A-train CALIOP and AIRS observations, Atmos. Meas. Tech., 6, 3257–3270, https://doi.org/10.5194/amt-6-3257-2013, 2013.
Torres, O., Jethva, H., Ahn, C., Jaross, G., and Loyola, D. G.: TROPOMI aerosol products: evaluation and observations of synoptic-scale carbonaceous aerosol plumes during 2018–2020, Atmos. Meas. Tech., 13, 6789–6806, https://doi.org/10.5194/amt-13-6789-2020, 2020.
Vaughan, M., Young, S., Winker, D., Powell, K., Omar, A., Liu, Z., Hu, Y., and Hostetler, C.: Fully automated analysis of space-based lidar data: an overview of the CALIPSO retrieval algorithms and data products, Laser Radar Techniques for Atmospheric Sensing, Remote Sensing, 4 November 2004, Maspalomas, Canary Islands, Spain, edited by: Singh, U. N., International Society for Optical Engineering, SPIE Proceedings, 5575, 16, https://doi.org/10.1117/12.572024, 2004.
Wei, J., Li, Z., Sun, L., Peng, Y., Zhang, Z., Li, Z., Su, T., Feng, L., Cai, Z., and Wu, H.: Evaluation and uncertainty estimate of next-generation geostationary meteorological Himawari-8/AHI aerosol products, Sci. Total Environ., 692, 879–891, https://doi.org/10.1016/j.scitotenv.2019.07.326, 2019.
Winker, D. M., Vaughan, M. A., Omar, A., Hu, Y., Powell, K. A., Liu, Z., Hunt, W. H., and Young, S. A.: Overview of the CALIPSO mission and CALIOP data processing algorithms, J. Atmos. Ocean. Tech., 26, 2310–2323, https://doi.org/10.1175/2009JTECHA1281.1, 2009.
Xu, X., Wang, J., Wang, Y., Zeng, J., Torres, O., Yang, Y., Marshak, A., Reid, J., and Miller, S.: Passive remote sensing of altitude and optical depth of dust plumes using the oxygen A and B bands: first results from EPIC/DSCOVR at Lagrange-1 point, Geophys. Res. Lett., 44, 7544–7554, https://doi.org/10.1002/2017gl073939, 2017.
Xu, X., Wang, J., Wang, Y., Zeng, J., Torres, O., Reid, J. S., Miller, S. D., Martins, J. V., and Remer, L. A.: Detecting layer height of smoke aerosols over vegetated land and water surfaces via oxygen absorption bands: hourly results from EPIC/DSCOVR in deep space, Atmos. Meas. Tech., 12, 3269–3288, https://doi.org/10.5194/amt-12-3269-2019, 2019.
Yin, S., Wang, X., Zhang, X., Guo, M., Miura, M., and Xiao, Y.: Influence of biomass burning on local air pollution in mainland Southeast Asia from 2001 to 2016, Environ. Pollut., 254, 112949, https://doi.org/10.1016/j.envpol.2019.07.117, 2019.
Yoshida, M., Kikuchi, M., Nagao, T. M., Murakami, H., Nomaki, T., and Higurashi, A.: Common Retrieval of Aerosol Properties for Imaging Satellite Sensors, J. Meteorol. Soc. Jpn. Ser. II, 96B, 193–209, https://doi.org/10.2151/jmsj.2018-039, 2018.
Zhang, H., Kondragunta, S., Laszlo, I., Liu, H., Remer, L. A., Huang, J., Superczynski, S., and Ciren, P.: An enhanced VIIRS aerosol optical thickness (AOT) retrieval algorithm over land using a global surface reflectance ratio database, J. Geophys. Res.-Atmos., 121, 10717–10738, https://doi.org/10.1002/2016jd024859, 2016.
Zhang, H., Kondragunta, S., Laszlo, I., and Zhou, M.: Improving GOES Advanced Baseline Imager (ABI) aerosol optical depth (AOD) retrievals using an empirical bias correction algorithm, Atmos. Meas. Tech., 13, 5955–5975, https://doi.org/10.5194/amt-13-5955-2020, 2020.
Zhang, W., Gu, X., Xu, H., Yu, T., and Zheng, F.: Assessment of OMI near-UV aerosol optical depth over Central and East Asia, J. Geophys. Res.-Atmos., 121, 382–398, https://doi.org/10.1002/2015jd024103, 2016.
Zhang, Y., Zhang, X., Wang, L., Zhang, Q., Duan, F., and He, K.: Application of WRF/Chem over East Asia: Part I. Model evaluation and intercomparison with MM5/CMAQ, Atmos. Environ., 124, 285–300, https://doi.org/10.1016/j.atmosenv.2015.07.022, 2016.
- Abstract
- Introduction
- Data and GEMS aerosol algorithm
- GEMS post-processing correction for near-real-time retrieval
- Aerosol events
- Validation in the GEMS AERAOD product
- Summary
- Code availability
- Data availability
- Author contributions
- Competing interests
- Disclaimer
- Special issue statement
- Acknowledgements
- Financial support
- Review statement
- References
- Supplement