the Creative Commons Attribution 4.0 License.
the Creative Commons Attribution 4.0 License.
 | 13 Aug 2024
Evaluation of the effects of different lightning protection rods on the data quality of C-band weather radars
Cornelius Hald
Maximilian Schaper
Annette Böhm
Michael Frech
Jan Petersen
Bertram Lange
Benjamin Rohrdantz
Lightning protection is important for weather radars to prevent critical damage or outages, but this can have negative effects on data quality. The existing lightning protection of the German Meteorological Service (Deutscher Wetterdienst, DWD) polarimetric C-band weather radar network consists of four vertical poles with a maximum diameter of 10 cm. During radar operation, these rods cause local scattering in the near field of the antenna, resulting in negative impacts on radar products. One effect is the removal of significant transmission power from the main beam axis and its addition to other areas or the side lobes. This results in wrongly localised precipitation fields in a radial direction. The second effect is the loss of transmitted and received power, appearing as a decrease in system gain, and subsequently an underestimation of all power-based radar moments in the vicinity of the rods. The underestimation in radar reflectivity Z then leads to a negative bias of approximately 20 % in the actual rain rate if a Z–R relationship is applied. These detrimental effects on data quality led to the requirement of developing a new lightning protection concept. The new concept must minimise the effect on data quality but also provide sufficient protection from lightning strikes according to the existing regulations and requirements. Three possible lighting protection concepts are described in this paper: two using vertical rods of different diameters (16 and 40 mm) and one with horizontally placed rods outside the antenna aperture. Their possible influence on data quality is quantified through a dedicated measurement campaign by analysing resulting antenna patterns and precipitation sum products. Antenna patterns are analysed with respect to the side-lobe levels compared to antenna patterns without lightning protection and the original lightning protection. With the newly tested lightning rods, the apparent side-lobe levels are slightly increased compared to an antenna pattern taken without lightning protection but are within the accepted antenna specifications. Compared to the original lightning protection, a decrease of up to −15 dB in apparent side-lobe levels is found for all tested lightning protection options. Beam blockage is substantially reduced compared to the existing lightning protection, as shown by the evaluation of quantitative precipitation estimation (QPE) sums. These results and some structural considerations are a solid basis to recommend the installation of four rods with a maximum 40 mm diameter for all 17 radar systems of the DWD weather radar network.
- Article
(6212 KB) - Full-text XML
- BibTeX
- EndNote


Weather radars are often located on towers in very exposed locations in order to have an unobstructed view around the entire azimuth (AZ). This can increase the risk of lightning striking the devices (Kingfield et al., 2017). To prevent this, the radar installations are usually secured by an external lightning protection installation to avoid damage to the radar or radome and to guarantee the safety of radar technicians. Lightning protection is commonly realised by having a number of lightning protection rods (LPRs) around or on top of the radome that are able to conduct the electric energy of a lightning strike from the top of the tower to the ground.
A common concept consists of four or more vertical LPRs around the radome, sometimes complemented by an LPR on top of the radome. Such a setup means that the rods reach into the aperture of the antenna and can therefore interact with the electromagnetic fields during transmission and reception. Scattering of electromagnetic waves on the LPRs causes two negative effects on data quality: the first is the emission of a part of the transmitted pulse outside of the main lobe of the antenna. In comparison to an antenna without LPRs, this phenomenon manifests in the antenna pattern by way of increased side-lobe levels. In an actual radar image of a thunderstorm, this appears as an echo that has some resemblance to a so-called hail spike (see Fig. 3 and Zrnic et al., 2010) but extends in the azimuthal instead of the radial direction. For the remainder of this paper, we will be referring to this phenomenon as reflection. The second effect of the parasitic scattering is a reduction in the main-lobe energy, which leads to an underestimation of precipitation in the affected direction. It appears as shadowing effects in accumulated weather radar measurements and is therefore often termed as beam blockage in the literature (e.g. Krajewski et al., 2006; McRoberts and Nielsen-Gammon, 2017).
The German Meteorological Service (Deutscher Wetterdienst, DWD) is operating 17 operational and 1 research C-band weather radars (Frech et al., 2017). They have been in service since 2012. The lighting protection concept consists of four LPRs with a maximum diameter of 10 cm and a length of 8 m. These LPRs are known to show both of the negative effects on data quality described above. It was therefore decided to introduce a new concept with less influence on data quality while keeping the required level of lightning protection to meet all safety concerns. Three new types of LPRs were evaluated: two vertical rods with a length of 4 m and diameters of 16 and 40 mm and a horizontal rod with a length of 4 m and a diameter of 76 mm. All three options require an additional LPR of about 1 m length in the top panel of the radome, which is not part of this evaluation. Previous investigations looking at Doppler spectra recorded at 90° elevation found no influence on the radar's operation.
The effect of the three LPR options on data quality is evaluated through antenna pattern measurements and dedicated data analysis. To this end, a measurement campaign was conducted using the research radar of the DWD at the Hohenpeissenberg Meteorological Observatory (MOHP). The recorded data are compared to measurements with the old LPR and without any LPR, taken during the acceptance test of the research radar in 2010 and 2011 (see, e.g. Frech et al., 2013, for some of the results). The following section (Sect. 2) contains an in-depth description of the three new LPR configurations and the old configuration, as well as a description of the conducted measurements. Section 3 describes the results of the antenna measurements and the precipitation sums. The paper concludes with a discussion of the results and a recommendation for a future lightning protection concept in Sect. 4.
2.1 Description of the lightning protection rods
The current lightning protection for the operational German weather radars is realised by four rods that are positioned on top of the radar tower surrounding the radome. These rods have a total length of 8 m. The last metre is made out of stainless steel and has a diameter of 10 mm. It is connected to an aluminium cable with a diameter of 8 mm that reaches down to the mount of the rod and is encased by fibreglass. The coating narrows down from the mounting to the stainless steel rod from 100 to 50 mm. The four rods are separated by 90° in azimuth, and their exact distance from the antenna or the centre of the tower depends on the respective tower itself as they are all unique buildings. During the recent measurements conducted at MOHP and presented here, three of the original LPRs were removed, keeping only one at an azimuth of 357°. When a new radome was installed in 2011, detailed antenna pattern measurements with the old LPR at 276.5° AZ were carried out (Frech et al., 2013); these are used as a reference for comparison in the study at hand.
Of the three evaluated new LPRs, two are vertically mounted with a total length of 4 m. The thinner rod starts with a diameter of 16 mm up to a height of 3 m and narrows down to a diameter of 10 mm in the uppermost metre. The thicker rod starts with 40 mm and continues with 16 and 10 mm in the third and fourth metres, respectively. Both are made from stainless steel tubes and have no coating. For complete lightning protection in accordance with the regulations, four of these are required, with a spacing of 90°, together with a single shorter rod on top of the radome. During the measurements, both were placed at 267.5° AZ (same location as one of the old LPRs) and at 250° AZ. For the precipitation sums, the 16 mm rod was also placed at 177.5° AZ for a few weeks.
The third tested LPR also has a total length of 4 m, but the first 3 m are installed horizontally, reaching outwards radially from the radar tower. The last metre is angled upwards by 45°. The diameters are 76 and 10 mm for the first and second parts, respectively. Depending on the desired level of lightning protection, up to eight of these rods are required, together with the shorter top rod. The number of rods can also be lowered by increasing the length of the horizontal part while retaining the same level of lightning protection. Due to it requiring a different mounting than the other rods, the horizontal LPR was only installed at 245° AZ. Schematics for all four evaluated LPRs are shown in Fig. 1. Here, diameters of the LPRs are exaggerated by a factor of 10 with respect to their heights or lengths. Additionally, their properties are summarised in Table 1.
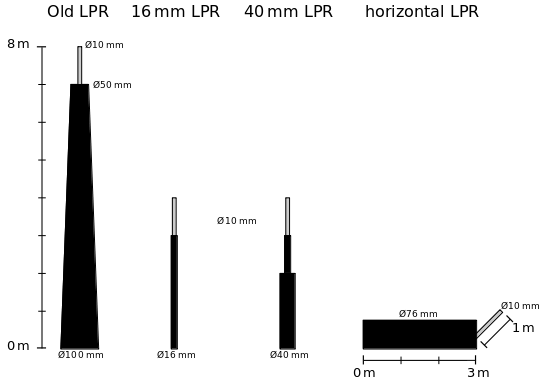
Figure 1Schematics of all four LPRs presented in this study. Diameters are scaled up by a factor of 10 with respect to lengths or heights.

All tested LPR options are chosen in accordance with the legal requirements of lightning protection class 3 for the MOHP radar tower. The classes can be assessed using the rolling-sphere method with a maximal sphere diameter of 45 m. Thus, a shorter top-panel lightning rod is a necessity.
2.2 Antenna measurements
Antenna measurements can be used to precisely describe the properties of the propagation path of an antenna (Chandrasekar and Keeler, 1993). For weather radars, the overall antenna pattern is of particular interest; this can be characterised by the main lobe (half-power beam width) and the level of resulting side lobes. Furthermore, the influence of the struts and feed horn on the transmitted electrical field can be identified in the antenna pattern. For dual-pol weather radars, a good match in terms of the characteristics between the horizontal and the vertical channels is another factor of interest.
To conduct an antenna measurement, a high-quality, stable external signal source is set up at a suitable location (in direct line of sight) in the far field of the radar. It transmits a continuous wave signal tuned to the radar frequency towards the radar. The weather radar is set into receiving mode, with the transmitter turned off. A series of high-resolution scans around the position of the external source is then carried out. During recent years, the use of UAVs as external signal sources has become more prominent (Umeyama et al., 2020).
In the case presented here, the external signal source consists of a signal generator, a power amplifier, and a reflector antenna with a diameter of 1.3 m and with a centre-fed single-pol C-band feed horn. During the measurements, the source unit was located on a hill called Auerberg, another solitary hill that is north of the Alps and that is very similar to Hohenpeissenberg. The orography (valley between Auerberg and MOHP) ensures an unobstructed propagation path. The distance to the radar MOHP is 21.6 km, and the angles relative to the radar are 250° AZ and 0° elevation (EL). During the measurements for the old LPR in 2012, the external signal source was installed at the same location. This setup represents a very good antenna test range as the antenna manufacturer's pattern measurements can easily be reproduced (Frech et al., 2013).
To ensure that the external signal source is aligned directly towards the weather radar, the following procedure is performed:
-
The radar antenna is pointed towards the approximate direction of the external source. First-guess coordinates can be derived from a map and elevation data.
-
The radar transmitter is turned off, and a pulse repetition frequency (PRF) of 3000 Hz is chosen in order to achieve a high sampling rate.
-
The received signal-to-noise ratio (SNR) over range is displayed live via the radar software.
-
The antenna of the external source is tilted carefully horizontally and vertically until the maximum signal strength is measured with the weather radar.
-
The feed horn at the external site is rotated until either the signal is identical in both polarisation channels (dual-polarisation mode) or until one is at maximum while the other is at minimum (single-pol measurement). It is usually easier to identify the minimum.
-
The external signal source antenna is fixed in place when the desired signal strength is reached.
-
The radar antenna is moved in small steps around the previously used coordinates, again until a maximum SNR is reached in either one or both channels.
-
The now precisely determined azimuth and elevation angles of the signal source are recorded for use in the evaluation of the data. Here, the precise identified angles are 250.43° AZ and 0.13° EL.
It is recommended to keep contact with the operators of the external source via phone during this process or, alternatively, to have remote control over either the external signal source or the weather radar. During the setup and the subsequent scanning, the automatic frequency control (AFC) has to be disabled, and the radar receiving frequency should be set manually to the transmission frequency of the external signal source.
The MOHP weather radar is a DWSR-5001C/SDP/CE by EEC, with radar-operating software and signal processing by Gamic. Its software and hardware enable it to perform a multitude of different scan types automatically and in sequence. A schedule of scans was set up prior to the measurements, and the precise location was inserted into the scan templates according the orientation described above. This way, several measurements were conducted in sequence, ensuring comparable results.
All scans record data up to a range of 20 km, while 40 data bins are averaged in the signal processor to 1 km. This is done only for having a range of data to perform statistical evaluations; the total recorded range is not important since the external source is providing a constant continuous wave and not a pulsed signal. It is therefore constant in all recorded ranges. The PRF of the radar is set to 3000 Hz, which is only possible with a simultaneous selection of a pulse width of 0.4 µs due to duty cycle protection limits. This means that the band width and range resolution of the 0.4 µs pulse width also apply to these measurements. Recorded radar moments are SNR in the horizontal and vertical channel, the differential reflectivity ZDR, differential phase PhiDP, and the cross-correlation coefficient RhoHV, all from the time series without any clutter correction or thresholding. All scans were performed with an antenna speed of 6° s−1, resulting in about 25 pulses per ray and an angular resolution of 0.05°. Some scans utilised the time sampling mode, where the number of pulses per ray is defined by the PRF and the recording time. One complete scan cycle takes a little over 2 h. Several cycles with different setups in terms of LPRs were performed; the data from the following LPR configurations will be shown in this paper:
-
no lightning protection rod, dual-pol mode;
-
16 mm LPR at 267.5° AZ, dual-pol mode;
-
40 mm LPR at 267.5° AZ, dual-pol mode;
-
horizontal LPR at 245° AZ, dual-pol mode.
One cycle consists of several different types of scans, as explained in the following subsections. They are schematically displayed in Fig. 2.
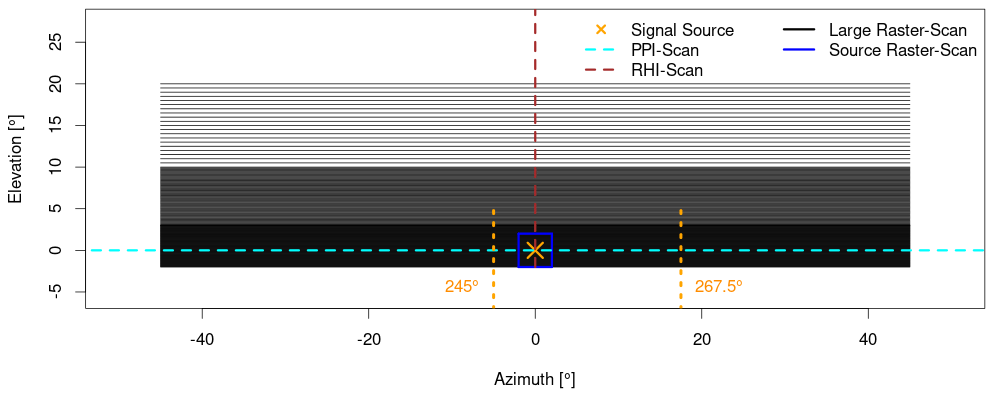
Figure 2Schematics of the scans conducted during one instance of the antenna measurements. RHIs extend to 90° EL, and PPIs span the whole azimuth from 0 to 360°.
2.2.1 Source raster scan
The first scan is a raster scan that scans a rectangular area around the external signal source. It is used to repeatedly determine the precise signal strength and location of the external signal source during the scanning schedule. Both can change minimally due to changing beam propagation conditions caused by the temporal variability of pressure, temperature and humidity in the atmosphere (Grabner and Kvicera, 2011) or because of drift in the frequency or the transmitted power of the external signal source. The source raster scan covers an area of ±2° in AZ and EL around the previously precisely determined position of the signal source. The horizontal resolution is set to 0.05°, and the vertical resolution is limited by the software to 0.1°. To reach identical resolutions in AZ and EL, the scan is performed twice with an offset in the starting EL angle of 0.05°. This is well within the achievable angle resolution of the radar, which is ±0.007° according to the angle tags in the data. Therefore, the first part goes from −2 to 2° EL, and the second goes from −1.95 to 2.05° EL. The two scans are combined into one data set in post-processing. The source raster scans are represented as the blue rectangle in Fig. 2.
2.2.2 Large raster scan
The large raster scan covers an area of ±45° in AZ around the external signal source and reaches from −2 to 20° in EL. The recorded data provide a two-dimensional image of the characteristics of the main lobe and multiple side lobes. It can be used to describe the influence of the lower struts in detail. To find a compromise between precision and duration of the measurements, the resolution from −2 to 3.05° EL is set to 0.05° (by using the offset in the starting elevation described above), to 0.1° from 3 to 9.9° EL and to 0.5° from 10 to 20° EL. The full area is split into 15 unique sweeps over the whole AZ range, with different EL ranges being chosen such that they all take approximately the same time. After every slice, one source raster scan is performed that is later used to correct for signal strength and location. The slices are again put together to one large data set in post-processing. The large raster scans are represented as the black lines in Fig. 2. Their spacing shows the vertical resolution of the three parts.
2.2.3 Plan position indicator (PPI)
Plan position indicators (PPIs) are radar scans where the antenna performs a complete rotation from 0 to 360° in AZ at a constant EL. Here, the EL was set to the exact EL that was determined during the alignment of the external signal source. Data from the PPIs can be used to describe all side lobes, including the back lobes of the antenna in the horizontal plane. The data acquired by this scan constitute the main source for the evaluation in the following section. In total, five PPIs were recorded during the measurement, equally spaced between the slices of the large raster scan. The PPI scan is shown as the dashed cyan line in Fig. 2. Other than what is displayed, it covers not only the area of the raster scans but also the whole azimuth from 0 to 360°.
2.2.4 Range height indicator (RHI)
Range height indicators (RHIs) are complementary to PPIs: the AZ is fixed to the position of the external signal source, and the EL is scanned from −2 to 90°, constituting the limits of the mechanical system of the radar. The data are used to describe the main and side lobes in the vertical plane. Again, five RHIs were performed between the slices of the large raster scan. RHI scans are represented by the dashed brown line in Fig. 2. It extends to 90° in elevation.
2.3 Beam blockage estimation
When the antenna is turning in azimuth, the LPR is locally obstructing parts of the antenna aperture, resulting in a reduced system gain in that direction. The reduced gain can be described as beam blockage, where some of the radiated power is being deflected out of the main lobe on transmission, and incoming radiation is partially deflected from reaching the antenna. Two approaches for quantifying this phenomenon are described here.
2.3.1 Precipitation sum products
To quantify the effects of beam blockage on weather radar data, one simple approach is to calculate precipitation sums. Over sufficiently long time spans (≥ 1 month), it can be expected that the accumulated precipitation field becomes more and more homogeneous around the radar, averaging out local differences caused by variability in precipitation. However, orographic effects will appear to be more pronounced. Strong negative deviations in precipitation sums that appear as radial spokes in such fields can be attributed to beam blockage.
The MOHP research radar runs the default operational DWD scanning routine most of the time. One of the performed scans is the so-called “precipitation scan” (PCP), which is a PPI scan where the elevation is adapted as a function of azimuth. Hence, the radar beam is guided in such a way that it is always as close to the ground as possible while also being above the horizon. For MOHP, this means that the EL is at 0.8° while scanning towards the lowlands in the north and reaches up to 3.5° EL over the Alps in the south. One of these precipitation scans is performed every 5 min. The data were recorded over two periods of about 1 month, each with a different setup in terms of LPRs. Details are summarised in Table 2. The positioning of the LPRs in relation to the radar and in relation to each other can be seen as the radial purple lines in Fig. 8.
The recorded reflectivity data were transferred into rain rates using the standard Z–R-relationship used at DWD (Aniol et al., 1980):
with Z being a reflectivity in linear units (mm6 m−3) and R being the rain rate (in mm h−1). The calculated sums are evaluated up to a maximum radius of 30 km around the radar (corresponds to a maximum beam height of 470 m at 0.8° EL and 1880 m at 3.5° EL). This ensures that only liquid precipitation below the melting layer is measured, for which the Z–R-relationship is valid.
2.3.2 Time scans
During a time scan, the radar antenna is permanently pointed towards the same position, and the recorded rays are defined by time spans. The gathered data can be used to produce robust statistical evaluations under the assumption that the environmental conditions change only minimally during the considered time. In the case presented here, the antenna was pointed directly towards the external signal source. The radar transmitter was turned off, and settings regarding range and pulse width are identical to those of the other scans; the PRF was set to 1000 Hz. The duration of one time scan was set to 120 s, producing about 14 000 data points per scan. Three LPR setups were evaluated this way:
-
no LPR between weather radar and signal source
-
vertical LPR with 16 mm diameter between radar and signal source
-
vertical LPR with 40 mm diameter between radar and signal source.
The purpose of these scans is to precisely quantify the effect of beam blockage on the propagation path by the LPRs on SNR.
This section presents the results of the measurements introduced in Sect. 2. Data from the PPI scans conducted during the antenna measurements are used to quantify the effect of the LPRs on the side-lobe level and the sum products. Time scans provide the data for the evaluation of beam blockage and the subsequent underestimation of precipitation amounts, which, as discussed in the introduction, stands as the primary issue with the current LPR setup and prompts this evaluation. The RHI scans are ignored in the evaluation because the LPRs cause no apparent effects on the signal above the external signal source.
3.1 Reflection and side lobes
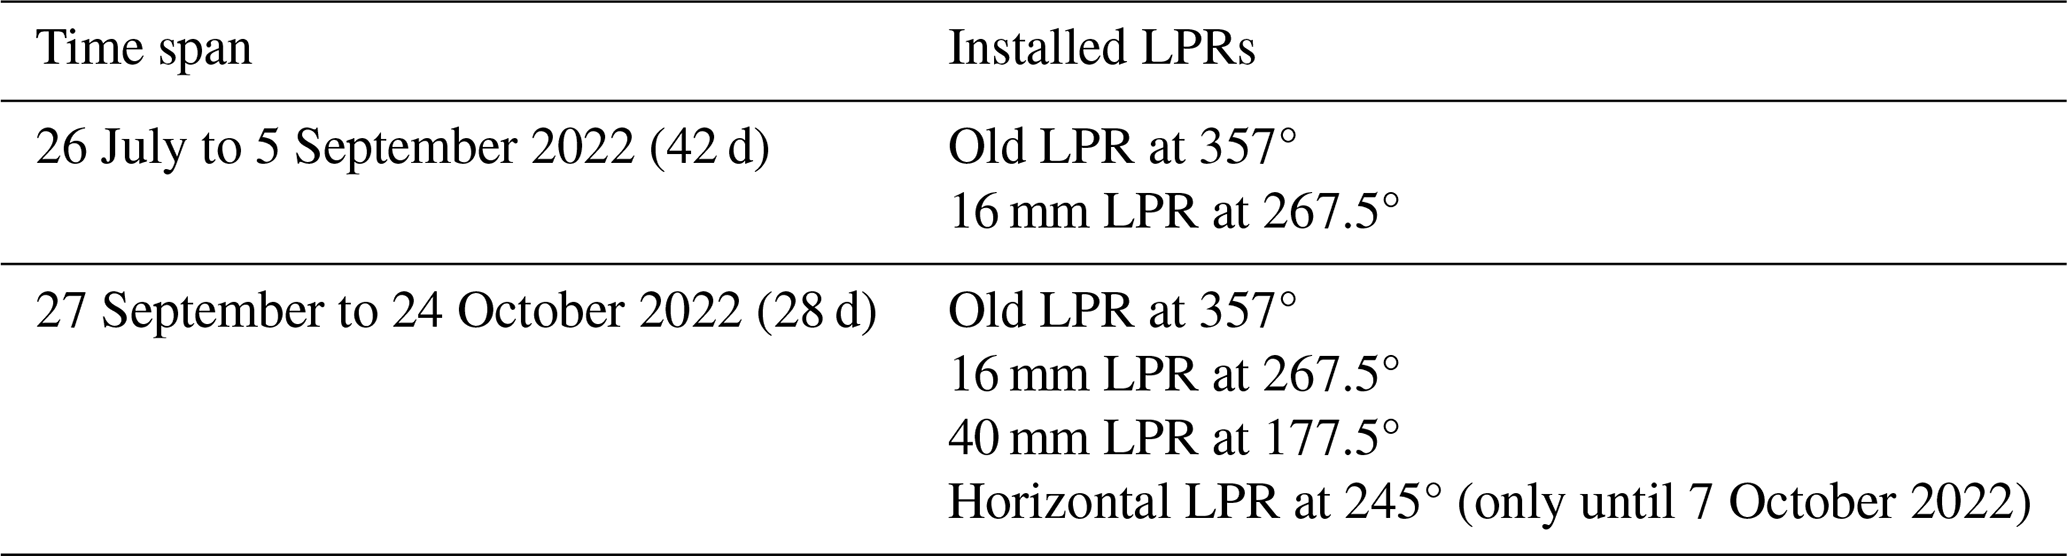
An LPR scatters the electromagnetic field close to the antenna and partially redirects it off the main beam axis for a given azimuth and elevation, resulting in increased side lobes at the position of the LPR. If there is a target with high reflectivity, such as a thunderstorm appearing in the direction of a strong side lobe, the radiation off the main beam axis can be sufficient to produce a backscatter signal that the radar can detect. However, this signal is recorded as originating from the current pointing angle of the main lobe, resulting in incorrect positioning. Such a case is presented in Fig. 3. It shows the reflectivity recorded during a thunderstorm at the radar Memmingen (MEM) in summer 2022. The centre of the thunderstorm (shown in purple) is located in the southwest of the radar and reaches over 50 dBZ. The radar uses the old LPRs (see Sect. 2.1), and one of them is located at an AZ of 203°. Exactly at that position, the weather echo is smeared radially over an AZ span of about 22°, which is highlighted with the red circle.
Figure 3Spurious echo (red circle) produced by a degraded antenna pattern due to the old LPR at 203° AZ on 20 July 2022 at the radar MEM.
For the quantification of this effect, SNR measurements from the PPI scans are used. Data are averaged over the recorded range. The maximum recorded SNR is used to normalise the data of each PPI, and the position of this maximum is used to centre each PPI on the external signal source. Then, the logarithmic SNR values are spatially interpolated, using a bilinear interpolation, to an AZ grid of equal spacing with a resolution of 0.05°. This is to account for small deviations in the angle tags between the consecutive scans that are within a range of 0.007°. The absolute pointing accuracy of the radar, which was determined to be better than 0.1° (Frech et al., 2019), does not play a role because every sweep is normalised in space by its own maximum SNR value. Subsequently, the data from the five PPIs are averaged into one data set, resulting in one data point for every 0.05° of AZ, with the maximum SNR being set to 0 dB, centred at 0° in AZ.
Results from the measurements for the horizontal channel are shown in Fig. 4. As the antenna is moving through the beam of the external signal source, the received SNR will rise and peak when it hits the exact position (0° AZ in Fig. 4) and then will decline again. Displayed are SNR values for the measurements without an LPR around the signal source, with one of the three vertical LPRs installed at 267.5° AZ and with the horizontal LPR installed at 245° AZ (relative LPR positions are indicated by grey lines at the top). The black line refers to the antenna pattern without any LPR. It serves as the reference for the antenna pattern results with the investigated LPR options. The most prominent line in blue is for the old LPR. It features increased side lobes over almost the entirety of the shown AZ span. Near the location of the LPR at 17.5°, side lobes are increased by, on average, up to 20 dB compared to all other measurements. These increased side-lobe levels resemble the earlier-showcased spurious echo (Fig. 3) in the antenna pattern. The first side lobes, as an important criterion for the assessment of an antenna, are not influenced by the new LPRs and stay close to the reference value of −34.7 and −28.7 dB to the left and right of the main lobe, respectively. This asymmetry has been known since the installation of the antenna and has, in earlier studies, been attributed to a possible lateral feed misalignment (Frech et al., 2013). The old LPR led to values of −28.8 dB (left) and −23.7 dB (right). Maximum differences in side-lobe level between the old LPR and no LPR reach 40 dB due to small variations in the positioning of the side lobes.
The two vertical LPRs (green and red lines) cause a slight increase of no more than 5 dB in the side lobes in close proximity to the rod's position, with the 40 mm diameter rod having a larger impact than the thinner 16 mm rod. The horizontal LPR has no discernible effect on the side lobes at its current position other than causing a different shape in the peaks. It is not clear if these differences are caused by the LPR or by having a slightly different setup in the measurement, which was conducted a few days after the other ones.
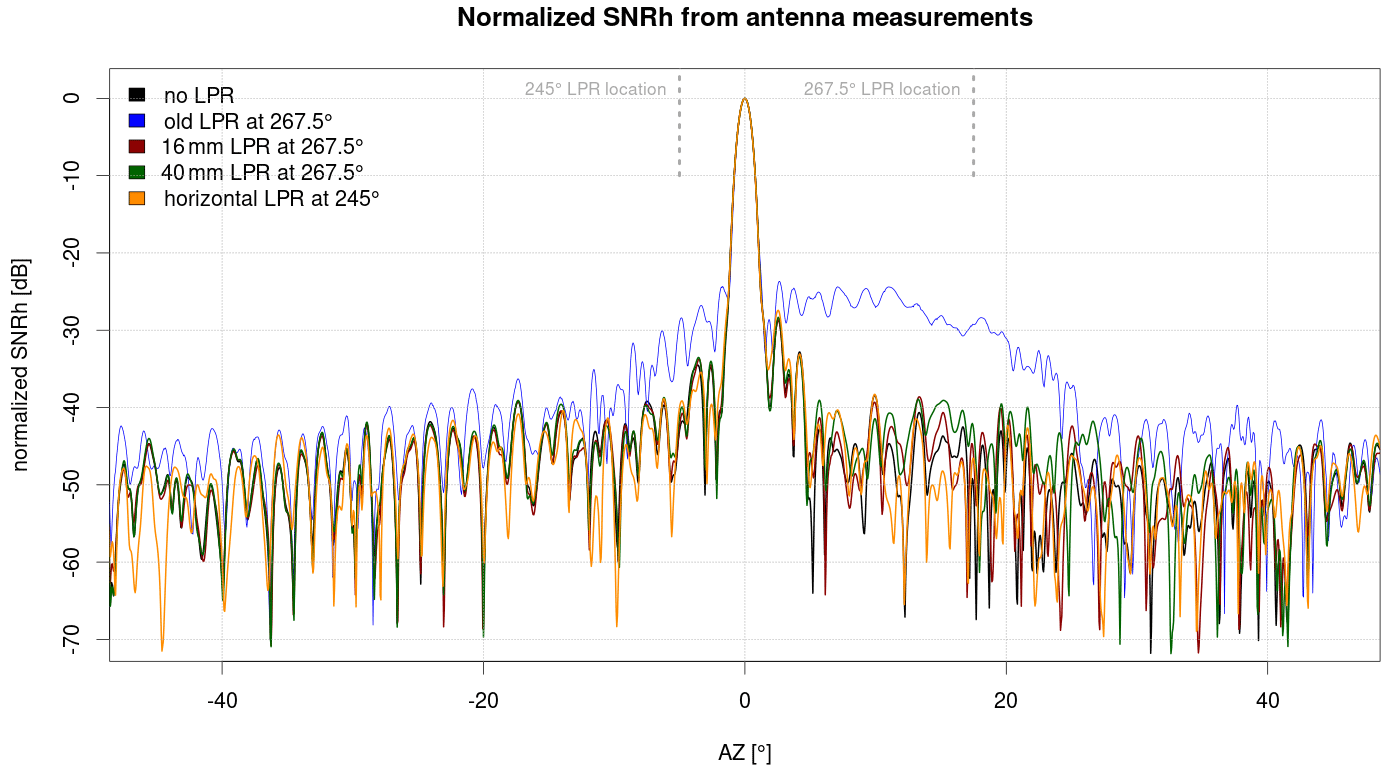
Figure 4Antenna pattern measurement without LPR and with four different LPR designs. A radome is present for all measurements. Shown are normalised SNR measurements from PPI scans for the horizontal channel. Grey lines at the top mark the installation locations of the LPRs relative to the peak of the external signal source.
Figure 5 shows the data from the vertical channel of the radar. Again, the old LPR has the largest effect on side-lobe level. Generally, the signal strength in the side lobes is higher in all measurements compared to the horizontal channel, even with no LPR present. Yet, the relative differences between measurements are more pronounced: in the area of the mounting point of the vertical LPRs, side lobes are clearly increased (for example, 6.5 dB difference between no LPR and 16 mm LPR), and their shape is changed, disturbing the typical pattern of minima and maxima that is seen, for example, at −40° AZ. Apparently, the interaction between the microwave and the LPR is different depending on the polarisation of the radiation. In this case, it leads to an increase in the disturbance of the antenna pattern in the vertical polarisation plane compared to in the horizontal plane. The horizontal LPR again has no discernible effect on the antenna pattern. Firstly, side lobes experience a slight increase with the two new vertical LPRs by 0.2 dB (left side) and 0.5 dB (right side).
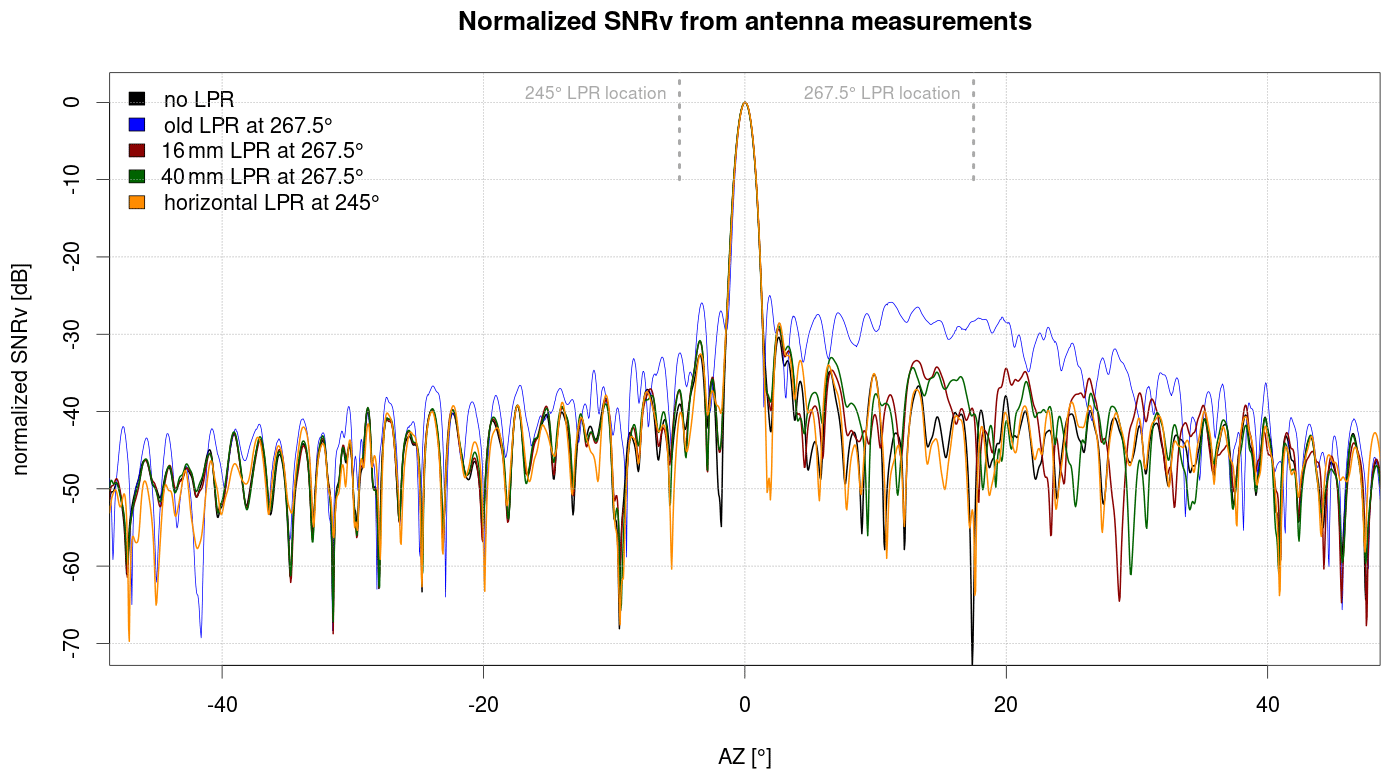
In summary, the antenna patterns show that all three tested LPRs provide considerable improvement in the overall antenna pattern compared to the old lightning protection solution, with the horizontal rod having the best properties.
So far, only the main azimuthal plane of the antenna pattern has been considered. The positive effect of the new LPRs on the resulting antenna pattern can also be shown in the 2D plane. Results are shown as an example for the old LPR and the 40 mm LPR for the horizontal channel in Fig. 6 and for the vertical channel in Fig. 7. For this analysis, data from all slices of the large raster scans (see Sect. 2.2) were centred and normalised. Each slice was individually normalised and centred using the nearest small raster scan in time. Subsequently, the normalised slices were combined into one comprehensive data set and interpolated to a common grid.
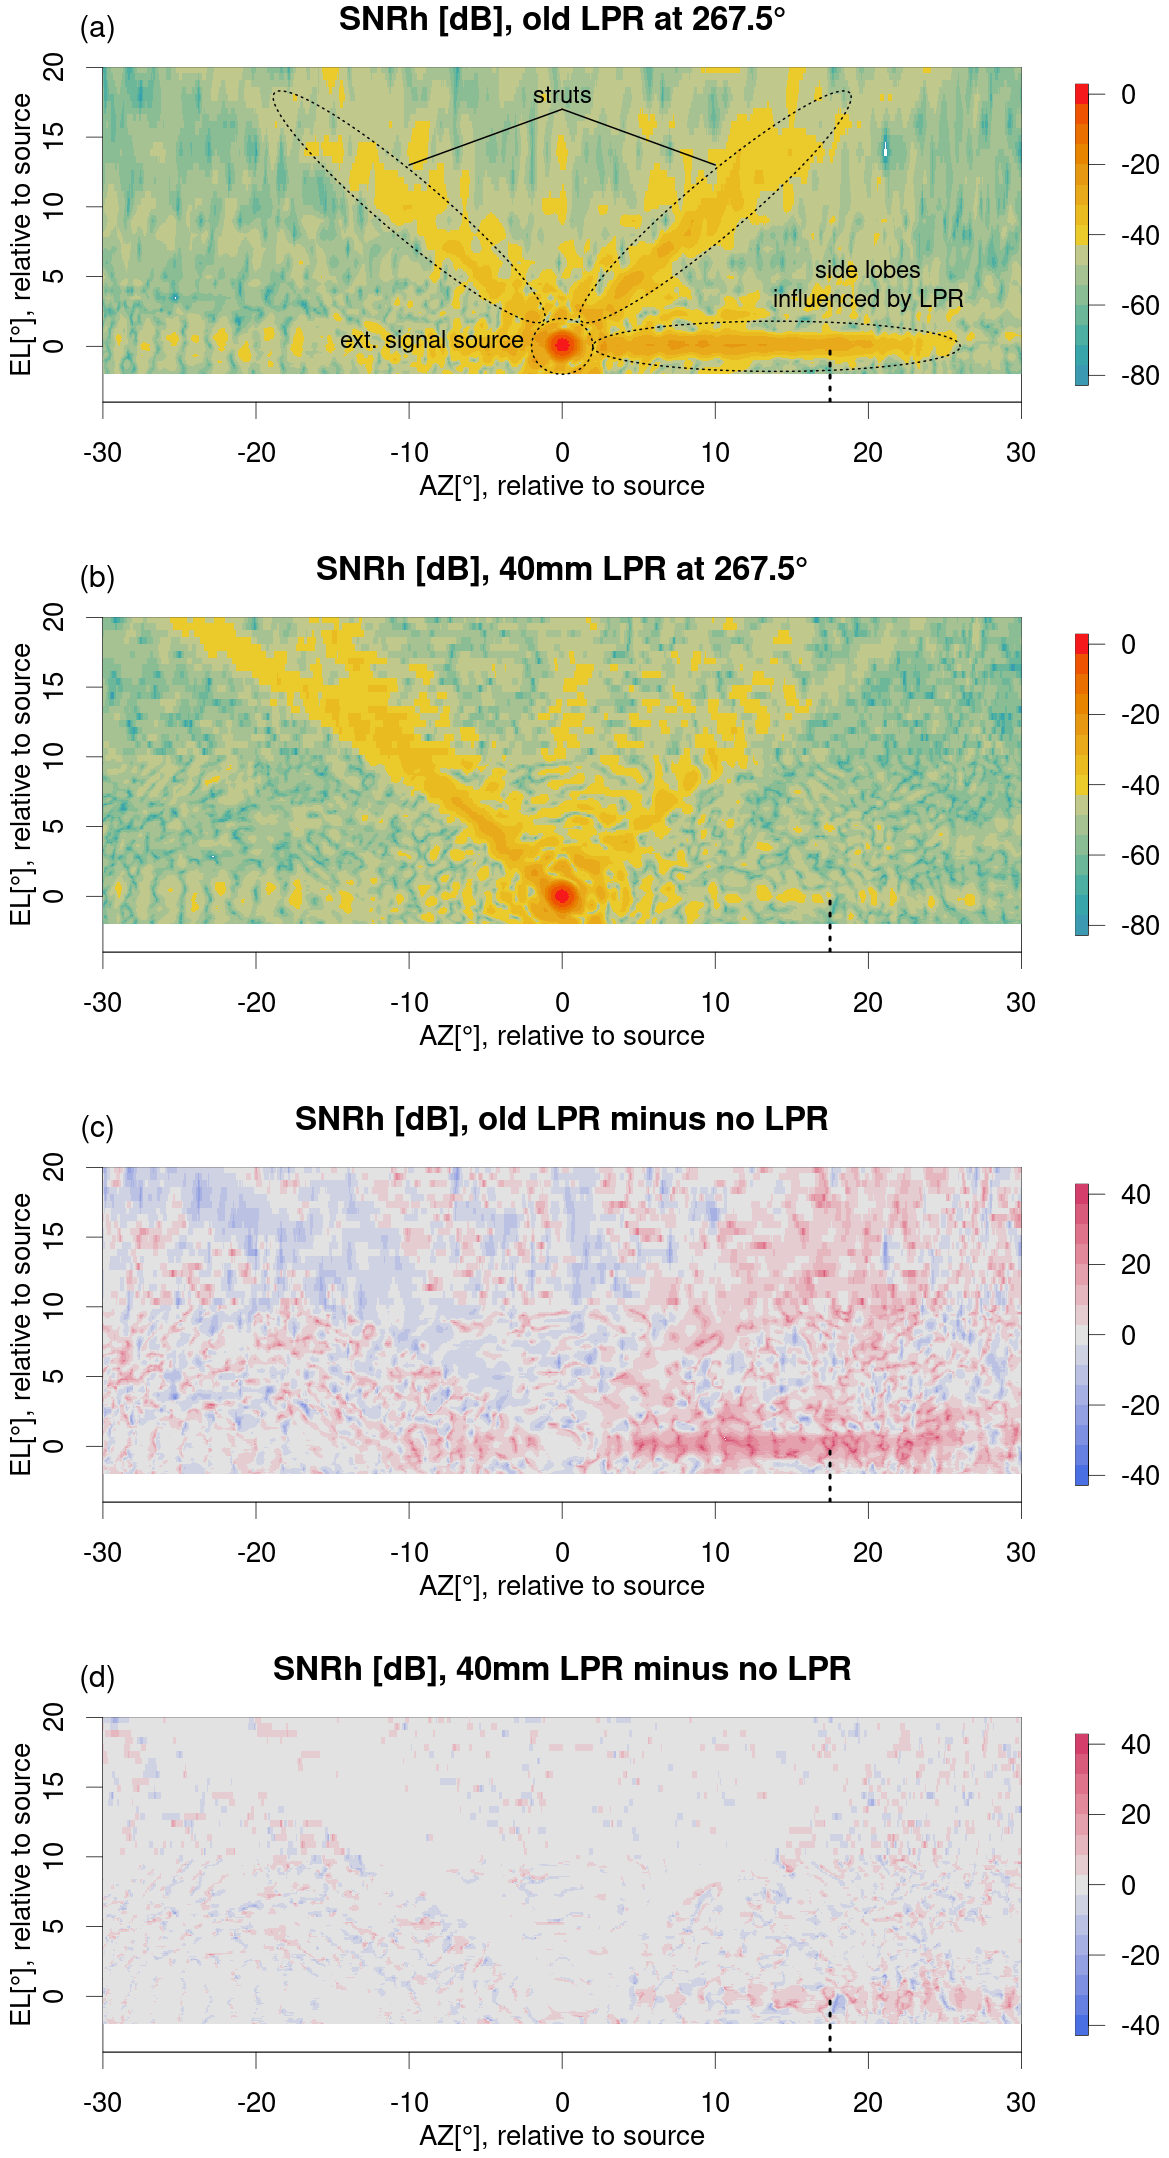
Figure 6SNR (horizontal channel) from the raster scans. (a) Data from the measurement with the old LPR from 2012, (b) data taken with the 40 mm LPR. Panels (c) and (d) show the difference between the two measurements with LPRs and the one without. The vertical black line in the figures marks the position of the LPRs.
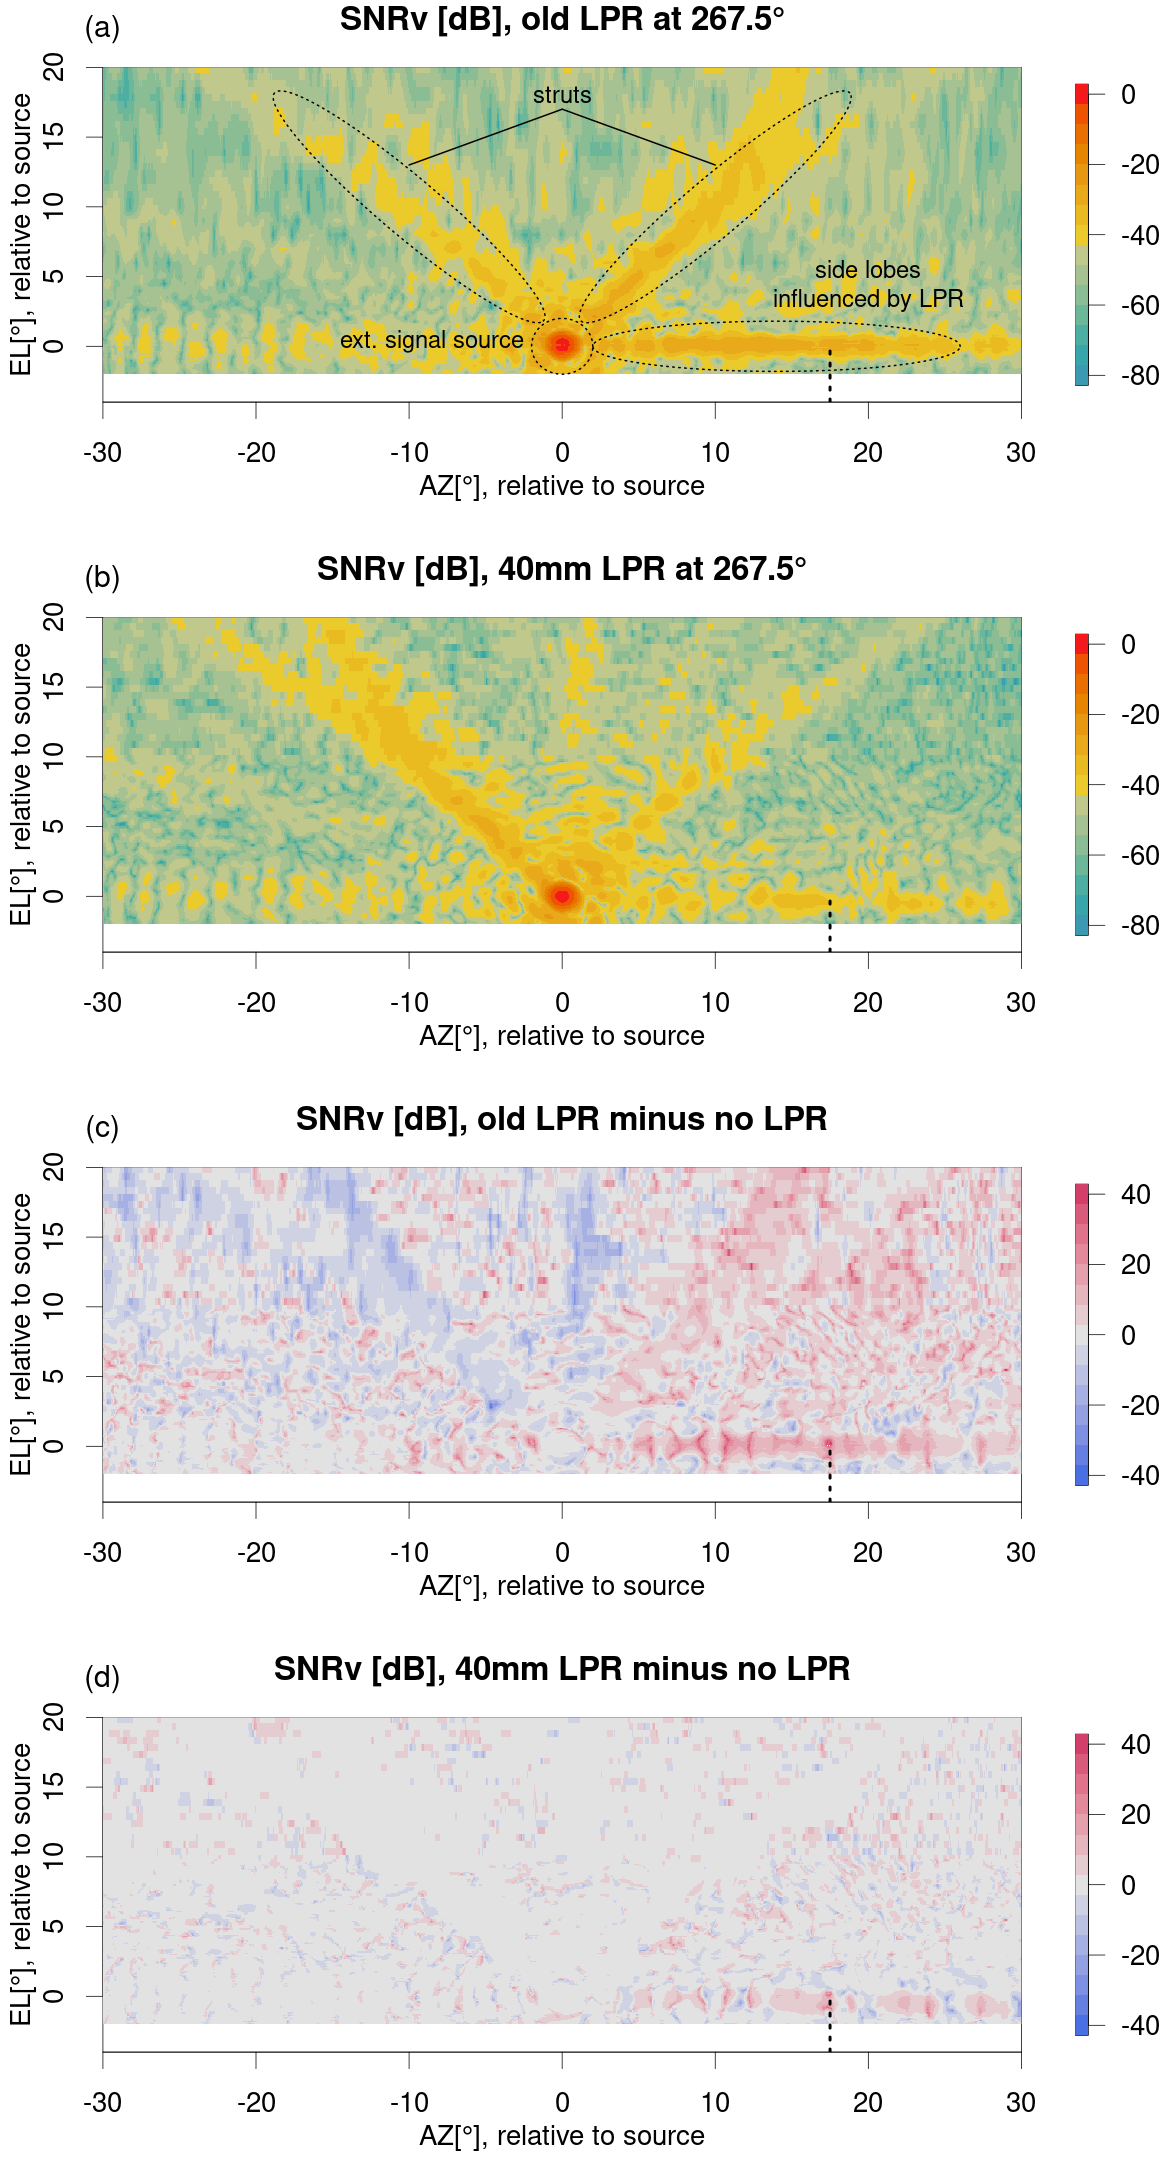
The red spot at 0° AZ and 0° EL in panels (a) and (b) of both figures marks the main beam of the antenna, with a beam width of about 1°. The two areas of about −40 dB going upwards diagonally from there are caused by the antenna struts. When the antenna points above the signal source, some of the incoming field is reflected into the antenna aperture by the struts.
The areas of strong signal reaching out from the signal source to the left and right at 0° EL are the side lobes discussed above. They are clearly stronger and more persistent and fill a larger area in the old-LPR case. Compared to the measurement without an LPR (panels c and d), SNR is increased by up to 15 dB around the LPR location in the 40 mm case. In contrast, in the case of the old LPR, the signal difference exceeds 30 dB.
The evaluation of the polarimetric moments supports the reported findings. The patterns are disturbed by the LPRs in the same way as those of SNR are. For RhoHV, the area with a perfectly correlated signal (value of 1) is extended to the parts where side lobes are increased to higher SNR values, but even in the case with no LPR, RhoHV reaches a value of 0.999. The main lobe is not affected. ZDR shows a different pattern in the area affected by the LPRs, but the total variability is within the limits apparent in the measurements with no LPR. The same is the case for PhiDP.
3.2 Beam blockage
Beam blockage describes the effect where a portion of the transmitted power that is returned from a scatterer is lost on either the transmitting or the receiving path. The loss is the same in both directions. It is caused by scattering of the electromagnetic wave on an obstacle in such a way that it reaches neither the intended target on the transmission path nor the antenna on the receiving path. For a weather radar, this means that weather with a certain reflectivity will be recorded at a lower dBZ value behind an LPR than without the obstacle in place. The old LPRs used at the DWD radars are known to cause a loss in reflectivity and, subsequently, a loss in precipitation rates of up to 30 %.
Figure 8 shows the precipitation sum products as they are described in Sect. 2.3.1 for the time spans and LPR setups listed in Table 2. The black sector between 99 and 111° AZ is caused by safety sector blanking. Despite the summation over 42 d, the August period does not show a homogeneous precipitation field. During this month, rain mostly originates from localised convection, and the region in the southeast of the radar is a known hotspot for thunderstorms. Still, a cone-shaped area of low precipitation sums is visible in the north, where the old LPR is located. Another distinct beam blockage is apparent at 125° AZ, caused by an old measurement tower with a maximum diameter of about 1 m at 50 m distance from the radar. The comparison between both obstructed areas shows that the beam blockage has approximately the same strength, but the width of the two resulting cones is distinctly different.
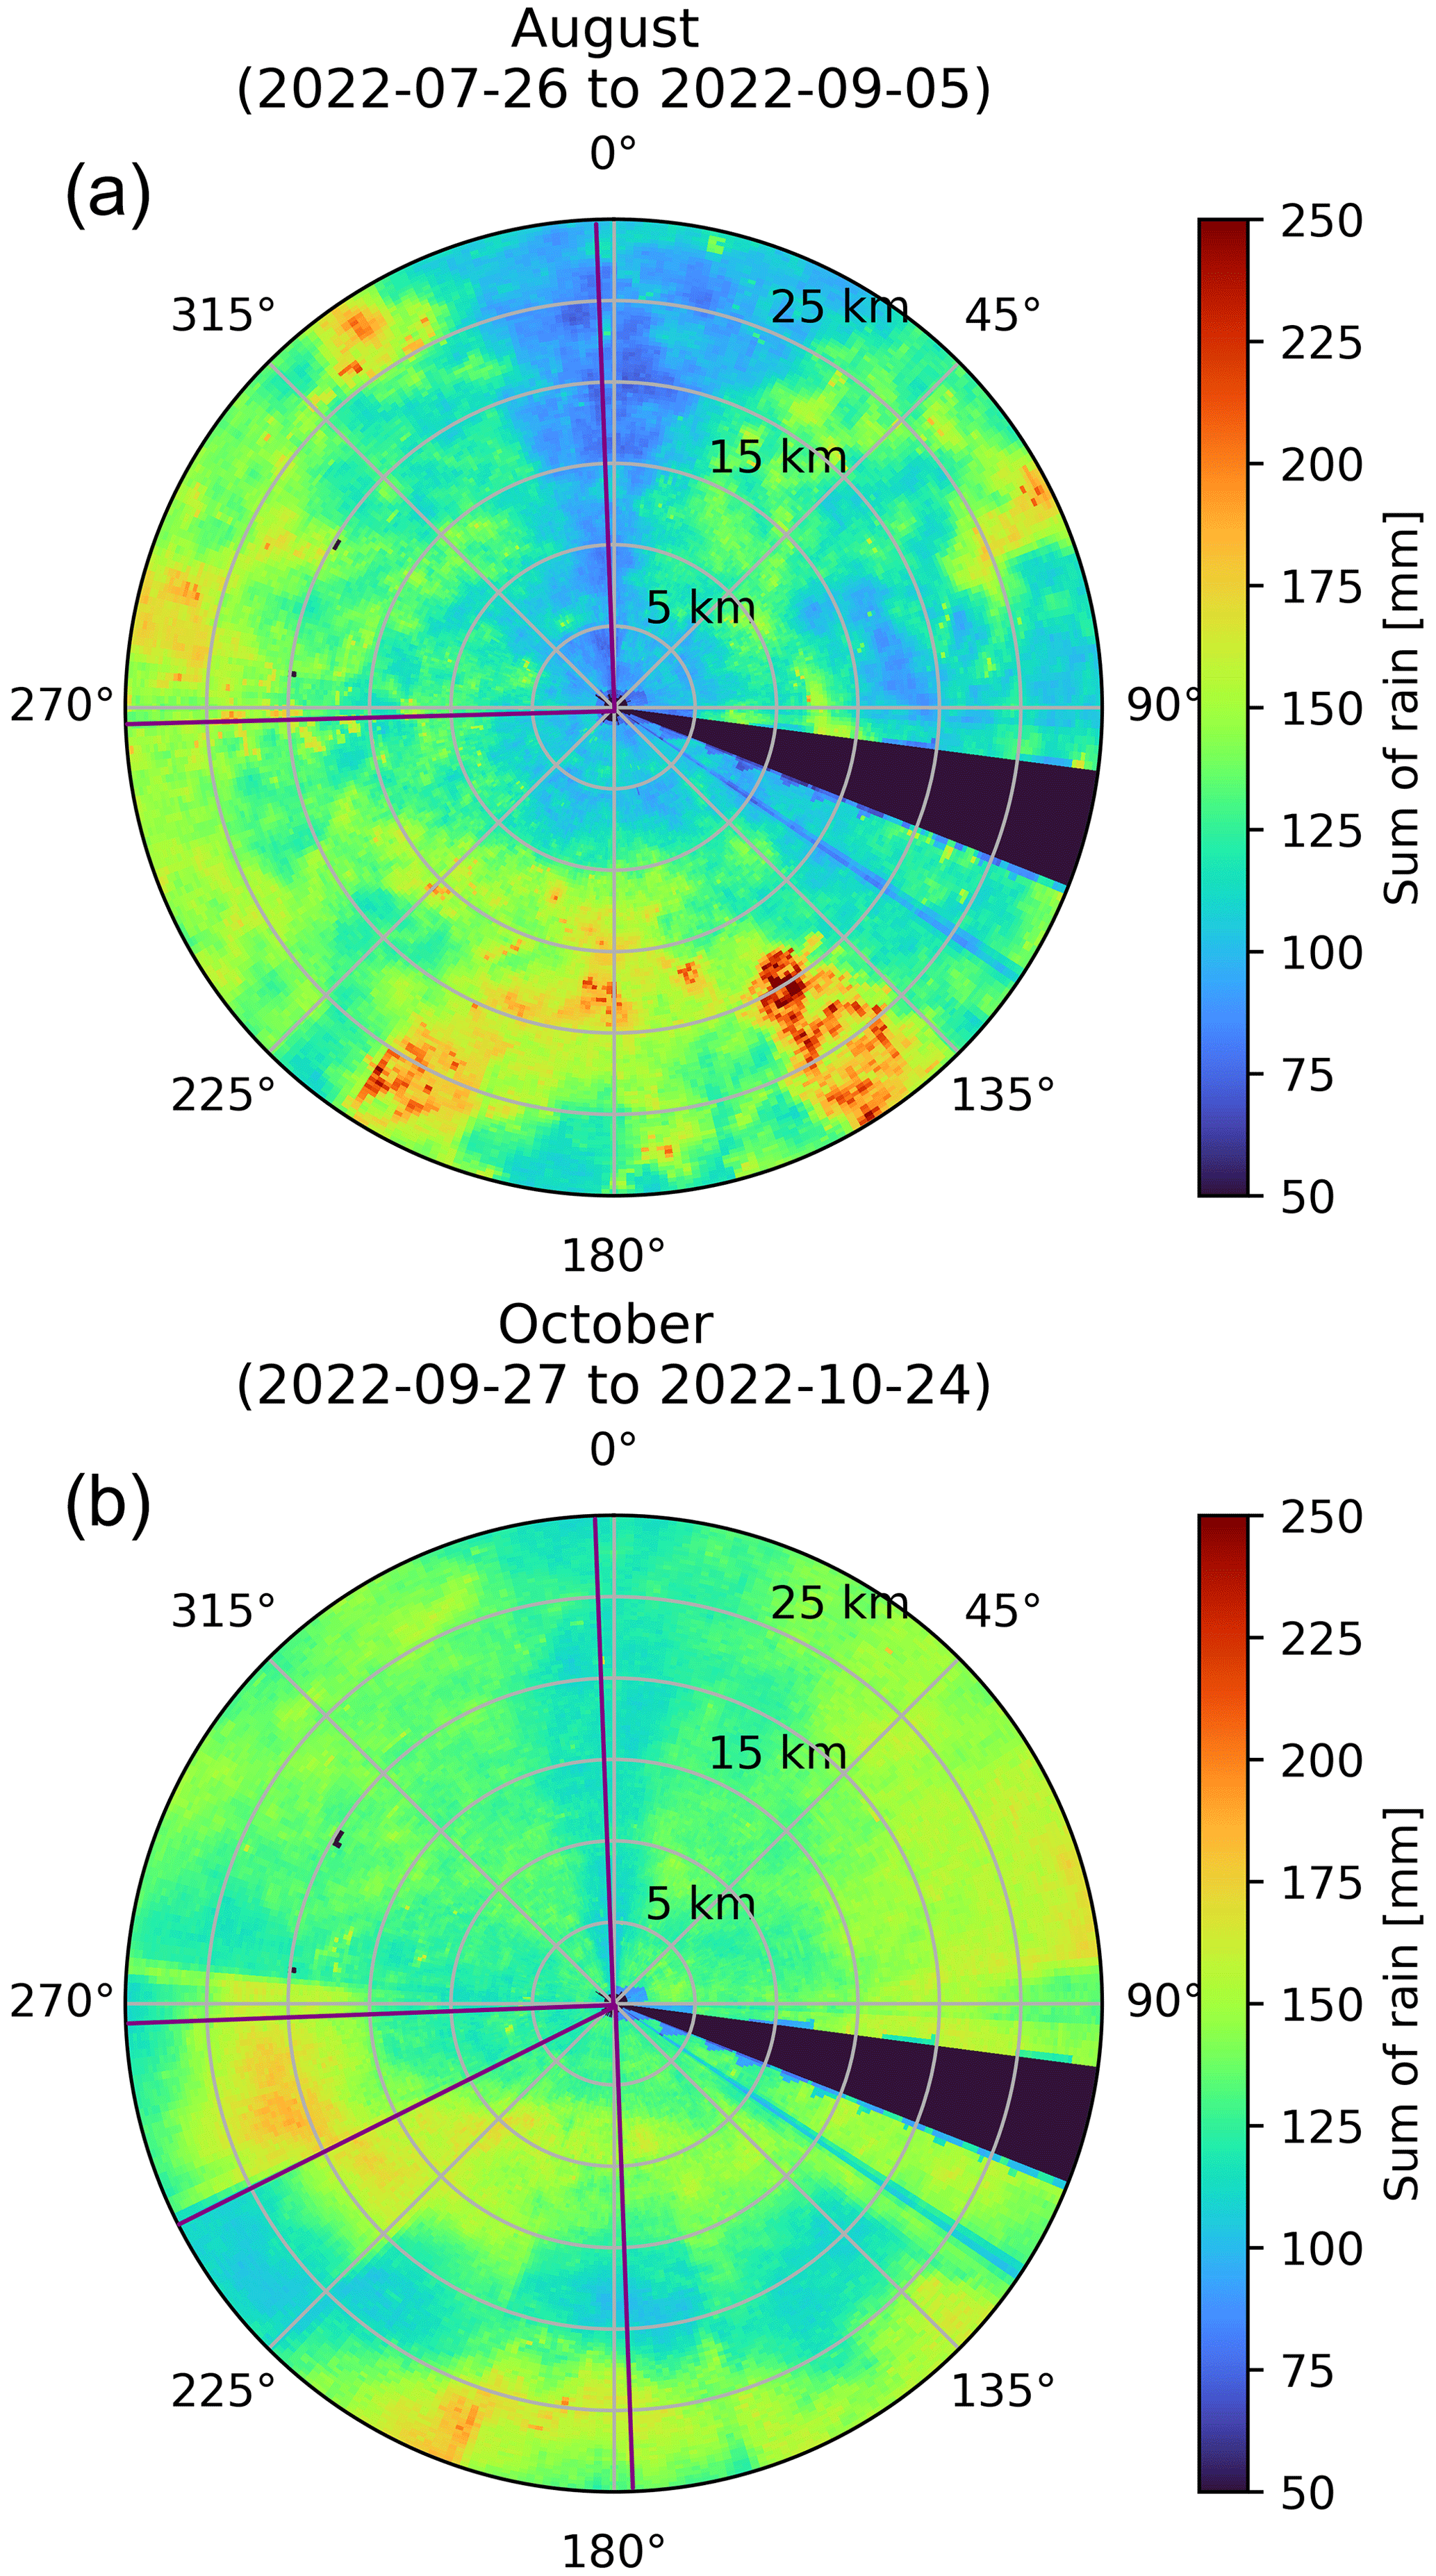
Figure 8Precipitation sums (mm) for the inner 30 km during August (a) and October (b). Positions of the installed LPRs are indicated by purple lines. Data originate from terrain following scans with azimuth-dependent elevation changes.
During the October period (Fig. 8b), the three features described above (sector blanking, beam blockage by old LPR and measurement tower) are visible again. Additionally, there are several step-like features in 220 to 275° AZ. These are caused by the changes in elevation during the terrain-following precipitation scan. With different EL angles, the most reflective part of the weather (oftentimes the bright band; Klaassen, 1988) appears at different distances. These steps were performed during the August period as well but are not that clearly visible due to the intrinsic variability in the precipitation field, caused by a greater variability in the melting-layer height and the generally more convective nature of precipitation in summer.
In contrast to the August period, in October, the three new LPRs were installed at 177.5, 245 and 167.5° AZ (details in Table 1). At these AZ angles, no sign of any decrease in the precipitation sum is visible. This is confirmed by Fig. 9, where precipitation sums for selected AZ angles are shown for both evaluated periods. The sums shown in Fig. 8 were averaged over a range of 30 km, providing one value per AZ and further smoothing the local variability. At 360° AZ, the strong beam blockage caused by the old LPR is clearly visible: compared to the unobstructed AZ areas at ±40° AZ, the measured precipitation sum behind the LPR drops by up to 25 % in the August period and by ≈ 15 % in October, which again highlights the exact reason for this study. At the angles of the other three LPRs, no such drop in precipitation sum for October is visible, neither as an unique feature for this measurement nor in comparison to the August measurement without the LPRs installed. Inhomogeneities can be explained by either local precipitation variability (150°, August) or the change in the elevation angle of the precipitation scan (275°, both periods).
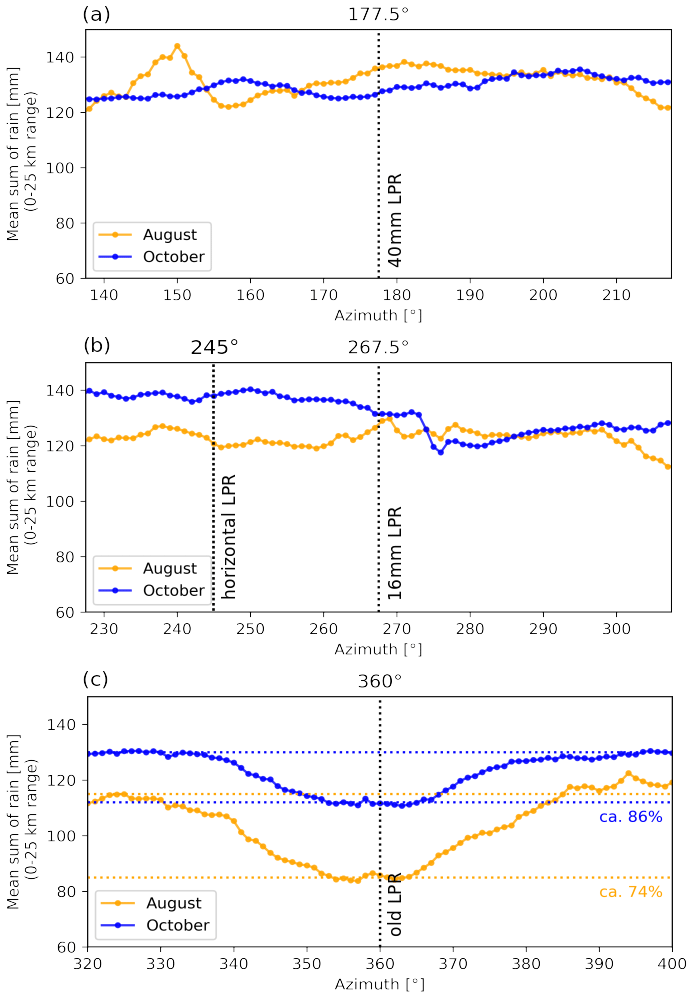
Figure 9Azimuthal averages of precipitation sums shown in Fig. 8 for August (orange) and October (blue). Dotted lines show the positions of the LPRs.
To quantify the beam blockage on the receiving path, the time scan measurements (Sect. 2.3.2) are used. They provide an estimate of how much of the signal from the external source is blocked by the 16 and 40 mm LPRs. Figure 10a shows the absolute SNR for the horizontal (red) and vertical (blue) channels for the measurements with, from left to right, no LPR, 16 mm LPR and 40 mm LPR. The small widths of the boxes, including the outliers (≈ 0.5 dB), prove the robustness of the measurements. Since all three setups were tested within 1 h and without any changes in the setup of the external signal source, no change in signal strength due to external factors is expected, and all observed differences can be attributed to the LPRs. The difference in signal strength between the horizontal and vertical channels is due to the fact that a higher precision is hardly achievable in the manual setup of the external signal source. For both channels, a drop in the median SNR from no LPR to that with LPR is visible. To further illustrate, Fig. 10b shows the relative differences, where the respective median of the data with no LPR has been subtracted from both channels. Now the effect of beam blockage becomes more clear: in the horizontal channel, the SNR drops by 0.057 and 0.076 dB for the 16 and 40 mm LPRs, respectively. The slightly higher drop at the 40 mm rod can be attributed to its larger diameter, providing a larger obstacle for the electromagnetic field. In the vertical channel, the beam blockage is slightly higher. The 16 mm rod lowers the signal by a median of 0.11 dB, and the 40 mm rod lowers the signal by a median of 0.124 dB. This is in accordance with the findings from the antenna patterns, where a stronger influence of the LPRs on the vertical channel is visible as well.
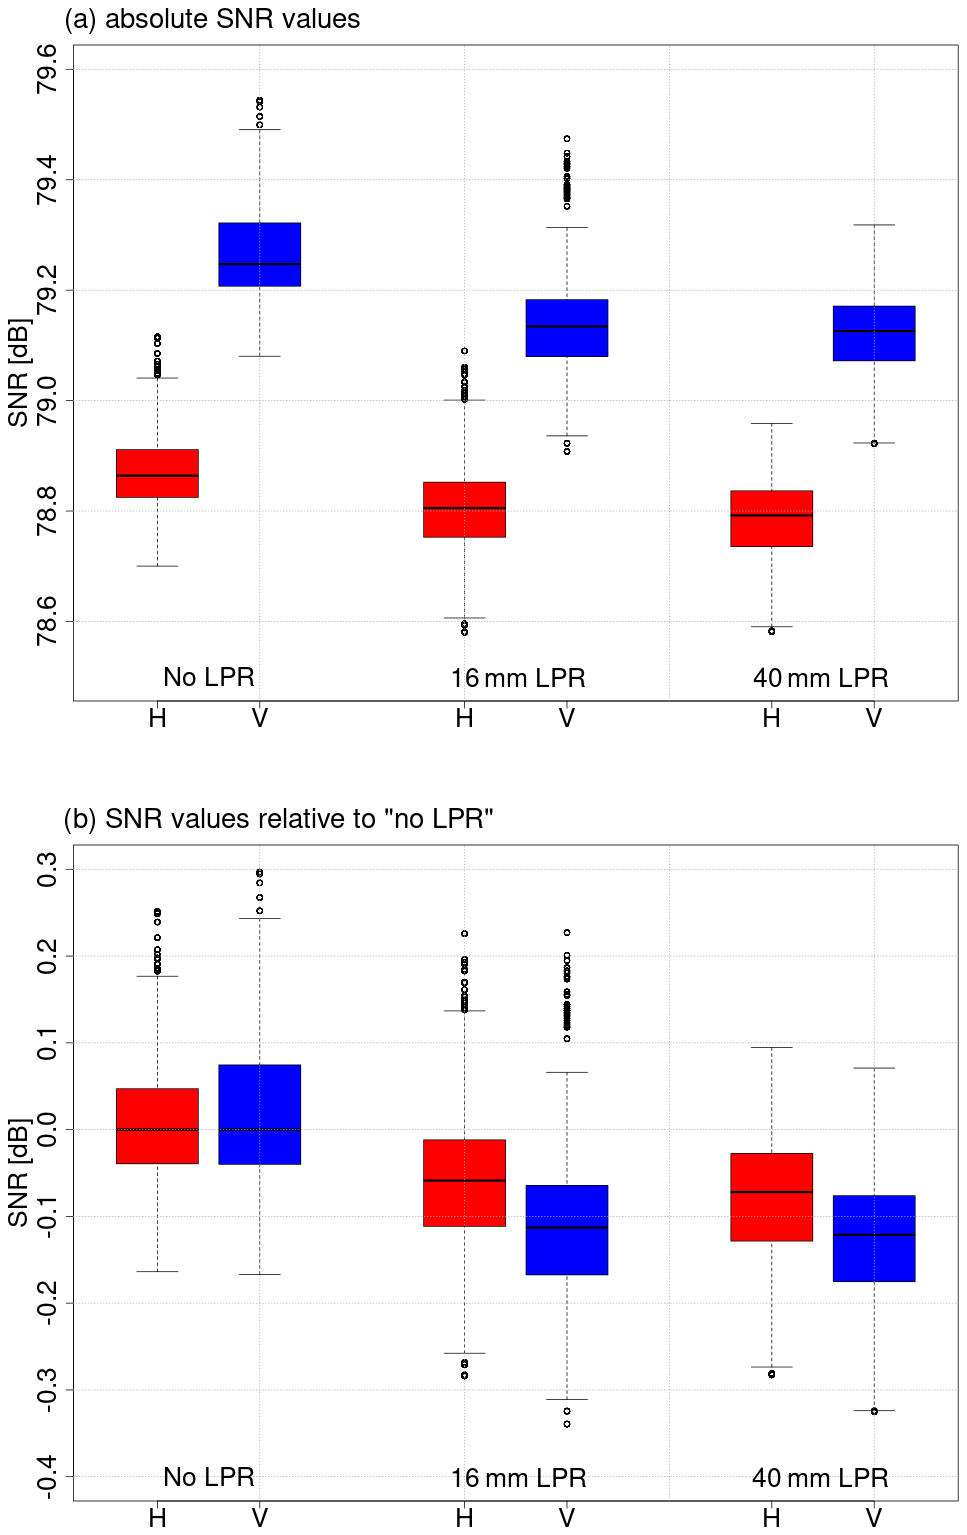
Figure 10SNR from the time scans described in Sect. 2.3.2. (a) Absolute measured values, (b) values relative to those of the “no LPR” measurement.
The recorded SNR values can be transformed into reflectivities (in dBZ) using a range correction, a correction for gas attenuation and a calibration constant. Then, relative changes (in dBZ) can be calculated: the 16 mm LPR lowers the recorded reflectivity by 0.11 % and 0.21 % for the horizontal and vertical channels, respectively, and the values for the 40 mm LPR are 0.14 % and 0.24 %. The results are doubled to represent the loss on both the transmitting and receiving paths and are applied to a range of possible reflectivities. Using the Z–R-relationship in Eq. (1), percentage reductions in the expected rain rates become available: at very high reflectivities over 50 dBZ, losses in rain rate exceed 1.8 % and 2.2 % in the horizontal channels of the 16 and 40 mm LPRs, respectively, and reach 3.3 % and 3.8 % in the vertical channels. Usually, such high reflectivities occur only very rarely, and most precipitation originates from events with much lower reflectivity. At a much more frequent value of 25 dBZ, losses in rain rate are only 0.9 % (16 mm LPR) and 1.1 % (40 mm LPR) for the horizontal channels and 1.7 % and 1.9 % for the vertical channels. In fact, the mean of all the reflectivity data points that were used for the rain sums shown for the month of August in Fig. 8 is 4.8 dBZ. The loss in rain amount there is 0.39 % in the worst case (40 mm LPR, vertical channel). This indicates why no reductions are visible at the locations of the new LPRs in Figs. 8 and 9.
The results from Sect. 3 show that the evaluated LPRs do have an effect on data quality when compared to the conditions without any rods, but this is minimal compared to the old LPR. Therefore, all three setups can be recommended for future lightning protection at DWD radar sites.
Antenna diagrams show that the horizontal LPR has the smallest effect on the measurements due to the fact that very little of it covers the aperture of the antenna during scans. In fact, this setup seems to have the lowest minima in between the side lobes and in some areas of the diagram.
There are many factors that might introduce slight changes into the measurements that are not caused by the LPRs. These include the repeated manual setup of the external signal source, slight differences in the positioning of both antennas, differences in the absolute signal power between measurements, and the atmospheric effects on beam propagation and attenuation. Despite the short time required for one measurement (2 h), the campaign had to take place over the span of 2 weeks, including changes in weather and the repeated setup of the external signal source.
The summation of rain rates is a simple method consisting of quantifying the effects of beam blockage. The possible severity of this effect was shown with the old LPR, behind which the amount of rain was substantially underestimated. Still, the method has its shortcomings. Even over a month-long period, precipitation fields can be so variable that no homogeneous sums are produced. Ideally, the evaluation is made over at least 1 year in order to eliminate seasonal differences. As shown, the percentage underestimation of precipitation behind the rod is not always the same. During August, most of the rain comes from convective events with large drops, while in October, stratiform rain increases in frequency. According to the radar equation, the measured reflectivity is a function of the sixth power of drop size (e.g. Doviak and Zrnic, 1993). Therefore, if the same percentage amount of power is blocked from a strong signal, this results in a larger loss of reflectivity than if the blocking happens to a weak signal. The nonlinear behaviour of the Z–R relationship that results in exponentially higher rain rates for high reflectivities intensifies this effect.
The three tested new LPRs did not show any decrease in precipitation sum at their location during the recorded month. As noted above, it cannot be ruled out that an effect might become visible over substantially longer evaluation periods of 1 or several years. As discussed, the loss in recorded rain amounts caused by the two evaluated vertical LPRs can reach up to 3.8 % during very high intensity precipitation events but do not exceed 1 % loss most of the time.
From a data-centred point of view, the horizontal LPRs have the smallest effect on data quality and should therefore be recommended as a lightning protection concept if one has the freedom to design it and the tower it is placed on from scratch. By varying the number of rods and their length, different lightning protection levels can be realised in accordance with the regulations in Germany. In the case of the DWD radar network, the new concept has to be adapted to the existing infrastructure of towers and their surroundings and radars. All evaluated LPRs are expected to be subject to ice formation under the right meteorological conditions. In the case of the horizontal rods, the ice might break and fall down around the tower, causing a potential hazard to people and infrastructure on the surrounding ground. Additionally, accumulation of ice might lead to a structural failure of the rods and make them break. This concept is therefore not readily applicable to existing sites with their individual requirements and available infrastructure.
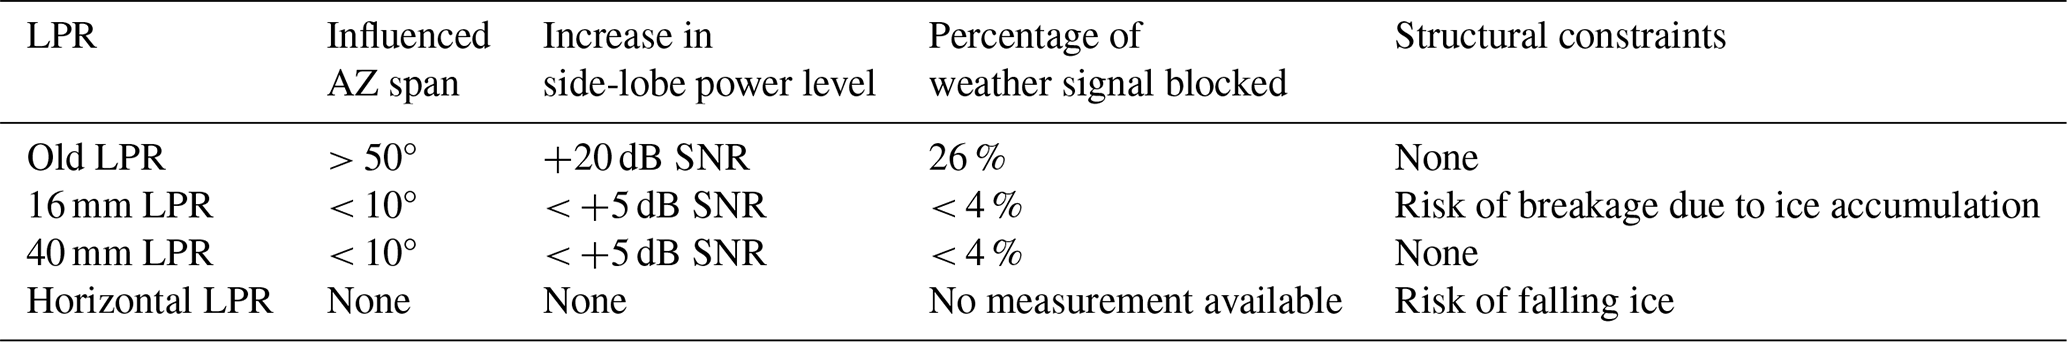
For the 16 mm LPR, calculations of potential ice formation showed that the diameter is too small for structural integrity at MOHP (a mountain site), meaning that the rods might break if a lot of ice accumulates around them and if they are hit by strong winds. This leaves the LPRs with a 40 mm diameter as the only structurally serviceable lightning protection concept and is therefore recommended for retrofitting the weather radar network of the German Meteorological Service. The key findings of this study, together with the structural constraints, are summarised in Table 3.
The recorded data from the antenna measurements and the R code for the evaluation are available upon request from the authors. All analyses were performed using R statistical software (https://www.R-project.org/; R Core Team, 2021).
CH helped design the study, wrote large parts of the paper, developed the scanning routines, and evaluated and plotted the antenna measurement data. MS developed the scanning routines, supported the data evaluation and wrote parts of the paper. AB developed the rain sum evaluation and collected, evaluated and plotted the data. MF helped design the study, wrote parts of the paper and supported the operation of the radar during the study. JP supported the operation of the radar and the external signal source during the study. BL supported the operation of the radar and the external signal source during the study. BR helped design the study, wrote parts of the paper and supported the operation of the radar during the study.
The contact author has declared that none of the authors has any competing interests.
Publisher's note: Copernicus Publications remains neutral with regard to jurisdictional claims made in the text, published maps, institutional affiliations, or any other geographical representation in this paper. While Copernicus Publications makes every effort to include appropriate place names, the final responsibility lies with the authors.
The authors want to acknowledge Kai Reymers for the installation of the LPR options, Karl Zirngibl for supporting the operation of the external signal source and Tabea Wilke for providing the precipitation sum algorithms. All named colleagues are at DWD. We also thank two anonymous reviewers for their comments that substantially improved the paper.
This paper was edited by Gianfranco Vulpiani and reviewed by two anonymous referees.
Aniol, R., Riedl, J., and Dieringer, M.: Über kleinräumige und zeitliche Variationen der Niederschlagsintensität, Meteorologische Rundschau, 33, 50–56, 1980. a
Chandrasekar, V. and Keeler, R. J.: Antenna pattern analysis and measurements for multiparameter radars, J. Atmos. Ocean. Tech., 10, 674–683, 1993. a
Doviak, R. J. and Zrnic, D. S.: Doppler radar and weather observations, Elsevier Academic Press, ISBN-13 978-0486450605, 1993. a
Frech, M., Lange, B., Mammen, T., Seltmann, J., Morehead, C., and Rowan, J.: Influence of a radome on antenna performance, J. Atmos. Ocean. Tech., 30, 313–324, 2013. a, b, c, d
Frech, M., Hagen, M., and Mammen, T.: Monitoring the absolute calibration of a polarimetric weather radar, J. Atmos. Ocean. Tech., 34, 599–615, 2017. a
Frech, M., Mammen, T., and Lange, B.: Pointing accuracy of an operational polarimetric weather radar, Remote Sens., 11, 1115, https://doi.org/10.3390/rs11091115, 2019. a
Grabner, M. and Kvicera, V.: Atmospheric refraction and propagation in lower troposphere, in: Electromagnetic Waves, edited by: Zhurbenko, V., IntechOpen, 139–156, https://doi.org/10.5772/16379, 2011. a
Kingfield, D. M., Calhoun, K. M., and de Beurs, K. M.: Antenna structures and cloud-to-ground lightning location: 1995–2015, Geophys. Res. Lett., 44, 5203–5212, 2017. a
Klaassen, W.: Radar observations and simulation of the melting layer of precipitation, J. Atmos. Sci., 45, 3741–3753, 1988. a
Krajewski, W. F., Ntelekos, A. A., and Goska, R.: A GIS-based methodology for the assessment of weather radar beam blockage in mountainous regions: Two examples from the US NEXRAD network, Comput. Geosci., 32, 283–302, 2006. a
McRoberts, D. B. and Nielsen-Gammon, J. W.: Detecting beam blockage in radar-based precipitation estimates, J. Atmos. Ocean. Tech., 34, 1407–1422, 2017. a
R Core Team: R: A Language and Environment for Statistical Computing, Version v4.1.2, R Foundation for Statistical Computing, Vienna, Austria, https://www.R-project.org/ (last access: 30 July 2024), 2021. a
Umeyama, A. Y., Salazar-Cerreno, J. L., and Fulton, C. J.: UAV-based far-field antenna pattern measurement method for polarimetric weather radars: Simulation and error analysis, IEEE Access, 8, 191124–191137, 2020. a
Zrnic, D. S., Zhang, G., Melnikov, V., and Andric, J.: Three-Body Scattering and Hail Size, J. Appl. Meteorol. Clim., 49, 687–700, https://doi.org/10.1175/2009JAMC2300.1, 2010. a