the Creative Commons Attribution 4.0 License.
the Creative Commons Attribution 4.0 License.
 | 03 Sep 2024
Classification accuracy and compatibility across devices of a new Rapid-E+ flow cytometer
Branko Sikoparija
Predrag Matavulj
Isidora Simovic
Predrag Radisic
Sanja Brdar
Vladan Minic
Danijela Tesendic
Evgeny Kadantsev
Julia Palamarchuk
The study evaluated a new model of a Plair SA airflow cytometer, Rapid-E+, and assessed its suitability for airborne pollen monitoring within operational networks. Key features of the new model are compared with the previous one, Rapid-E. A machine learning algorithm is constructed and evaluated for (i) classification of reference pollen types in laboratory conditions and (ii) monitoring in real-life field campaigns. The second goal of the study was to evaluate the device usability in forthcoming monitoring networks, which would require similarity and reproducibility of the measurement signal across devices. We employed three devices and analysed (dis-)similarities of their measurements in laboratory conditions. The lab evaluation showed similar recognition performance to that of Rapid-E, but field measurements in conditions when several pollen types were present in the air simultaneously showed notably lower agreement of Rapid-E+ with manual Hirst-type observations than those of the older model. An exception was the total-pollen measurements. Comparison across the Rapid-E+ devices revealed noticeable differences in fluorescence measurements between the three devices tested. As a result, application of the recognition algorithm trained on the data from one device to another led to large errors. The study confirmed the potential of the fluorescence measurements for discrimination between different pollen classes, but each instrument needed to be trained individually to achieve acceptable skills. The large uncertainty of fluorescence measurements and their variability between different devices need to be addressed to improve the device usability.
- Article
(9961 KB) - Full-text XML
- BibTeX
- EndNote


A recently published special issue “Bioaerosol Research: Methods, Challenges, and Perspectives” provided an extensive overview of developments in monitoring of primary biological aerosol particles, emphasizing the interest in real-time automatic measurements (Huffman et al., 2019). In the past 10 years, several devices were released to the market claiming to be able to detect and quantify atmospheric concentrations of various bioaerosols (i.e. pollen and fungal spores) (Buters et al., 2022). An extensive international intercomparison of automatic bioaerosol monitors with reference measurements (EN 16868, 2019) was organized within the framework of the EUMETNET AutoPollen Programme and the ADOPT COST Action in 2021. It indicated that three automatic instruments, with an appropriate identification algorithm, are capable of identification of the main types of airborne pollen present in the atmosphere of Munich during the campaign: Helmut Hund BAA-500, Swisens Poleno (Mars and Jupiter models), and Plair Rapid-E (Maya-Manzano et al., 2023). They also showed high reliability, which made them potentially suitable for continuous pollen monitoring within operational networks of automatic aerobiological stations. The campaign has also raised some concerns regarding the device calibration and inter-calibration, which will be addressed in follow-up studies and campaigns.
The aim of this study is to evaluate a new model of Plair airflow cytometers, Rapid-E+, and assess its suitability for operational automatic measurements of airborne pollen and fungal spores within forthcoming monitoring networks. We performed a series of laboratory experiments and evaluated the device performance in real-life field conditions by comparing their measurements with the standard manual method. In addition to testing the recognition performance of certain bioaerosols, we have analysed to what extent different devices are compatible with each other and thus allow for a common classification algorithm trained with data collected with one device (or a few devices) and applied across the network.
2.1 Rapid-E+ flow cytometer at a glance: pros and cons of the new model
In this study, we are focussing on the airflow cytometer Rapid-E+ from Plair SA (https://www.plair.ch/, last access: 10 August 2024), which is a new model stemming from the PA-300 (Crouzy et al., 2016) and Rapid-E (Šaulienė et al., 2019). Although the same approach for measuring particle morphology (laser scattering) and chemical characteristics (laser-induced fluorescence spectrum and lifetime) is used, Rapid E+ substantially differs from its predecessor (Table A1). In particular, Rapid-E+ samples at a higher flow rate of 5 L min−1 (compared to 2.8 L min−1 for Rapid-E). Also regardless the operation mode, Rapid-E+ records the concentration of all particles passing through a 447 nm scattering laser (classified into four size bins: > 0.3, > 0.5, > 1, and > 5 µm), while Rapid-E only records the concentration of particles above the operation-mode-determined size limit. High efficiency of detections was verified for the device prototype at the Swiss Federal Institute of Metrology (certificate of calibration no. 235-11067): > 80 % of particles ranging within 0.5–5 µm and 65 %–75 % of particles of a 5–10 µm range. Unfortunately, a test for larger particles (in the range of most pollen grains) was not performed. Like its predecessor, the fluorescence measurements of Rapid-E+ can be limited to particles within a specific size range (i.e. 0.3–100, 1–100, and 5–100 µm), thus ignoring smaller and larger particles, to extend the excitation-inducing laser lifetime. Changing the particle size sensitivity also allows for adjusting the gain of the fluorescence spectrum and lifetime detectors, which is useful for measuring particles with low-fluorescence emission, such as most fungal spores. The lifetime of the 337 nm laser has been extended, according to the manufacturer, from about 100 million to about 200 million shots. However, recording all particles larger than 1 µm could easily result in 2000 particles min−1 measured, which would still quickly use up the laser. The device offers a solution by enabling intermittent high-sensitivity measurements (e.g. one every 10 min).
Each measurement component in Rapid-E+ went through changes compared to its predecessor. The 447 nm laser scattering is now measured in two polarization planes at a narrower angle window and fixed duration limited to 120 acquisitions. The fluorescence spectrum and the fast speed fluorescence decay (lifetime) are measured at a narrower wavelength range. The device also records slow-speed fluorescence decay by measuring spectrum at the moment of the 337 nm laser shot, followed by 31 measurements every microsecond. In addition, the intensity of light scattering from a 637 nm laser is recorded as an image using a 4 × 4 px detector.
The interface of the device has changed as well and has generally become less convenient. Rapid-E+ output files contain data of 10 000 particles each, and there is no longer a time stamp in the file name. In addition, the data transfer protocol from the device storage has changed from SSH for Rapid-E to SFTP, which has limitations in handling security keys, so the remote file synchronization (rsync) is not supported anymore. It complicated the automatization of the data download to external storage and forced a reprogramming of the external operational environment after the upgrade from Rapid-E.
2.2 Experiments with Rapid-E+
Three Rapid-E+ airflow cytometers were involved in this study. One device operated in Novi Sad, Serbia (serial number 00E7277C), was trained indoors in the laboratory of the BioSense Institute and then set to continuous outdoor measurements during the period 7 April to 27 September 2023. Two other devices, owned by the City of Osijek, Croatia (serial number 00E74EDE), and the Finnish Meteorological Institute (FMI) in Helsinki, Finland (serial number 00C59ACA), were used in the corresponding laboratories to test compatibility of the devices and transferability of the pollen recognition algorithm.
2.2.1 Field monitoring campaign
The monitoring was performed at the roof level (20 m a.g.l.) in Novi Sad (45.245575° N, 19.853453° E). The test period allowed us to explore the measurement performance of instruments for automatic detection and quantification of bioaerosol in a variety of conditions characteristic of the Pannonian Plain. This region is characterized by the large diversity of airborne pollen (Tešendić et al., 2020) and fungal spores (Simović et al., 2023) often mixed with abundant mineral dust (Šikoparija, 2020) but also occasional records of unusual bioaerosols, such as starch (Šikoparija et al., 2022). In the study region, the period of seasonal pollen allergies (i.e. tree pollen season from January to April and grass pollen season from April to September) is extended by the weed pollen season from July to the end of October, when large quantities of ragweed pollen are recorded in the air (Šikoparija et al., 2018).
During the campaign, the sensitive middle mode (all particles coarser than 1 µm) was active for 1 min in 10 min cycles, which resulted in six equidistant 1 min measurements per hour, which is still representative of capturing the main features of diurnal variations, albeit at a somewhat coarser temporal resolution (Sikoparija et al., 2020).
2.2.2 Laboratory measurements of bioaerosols
The laboratory work had two main parts.
- i.
We created an extensive training dataset using the device operated in Novi Sad. Reference pollen for training was collected locally. We selected 27 pollen classes (Table A2; note that the class labels do not fully represent the taxonomic rank and are thus not written in italics) that represent the most abundant pollen in Novi Sad. To explore the specificity of chemical analysis from fluorescence measurements, the selected classes include pollen classes that are morphologically similar (e.g. Cannabis and Humulus, Juniperus and Taxus, and Urtica and Parietaria), which are commonly grouped together in manual identification. The laboratory tests were performed in two different sensitivity modes: pollen mode, which measures fluorescence for particles larger than 5 µm, and middle mode, which measures fluorescence for particles larger than 1 µm with 10 % increased sensitivity of the lifetime detector and 28 % increased sensitivity of the spectrometer.
- ii.
Two other devices were tested independently in Osijek and Helsinki, with subsets of the Novi Sad pollen collection shared between laboratories in order to produce theoretically identical training datasets for the corresponding pollen types.
2.2.3 Reference data collection
The FMI Rapid-E+ device was exposed to pollen using a Swisens Atomizer (Swisens AG, 2023). A custom-made system (Bruffaerts et al., 2024) with similar features was developed to expose pollen to the Novi Sad and Osijek devices. Both systems prevent particles from the ambient air from entering the detection chamber while keeping the sampling flow unaffected and facilitating the emission of pollen from an Eppendorf cuvette through a combination of vibrations and air blows. The devices were exposed to pollen until a sufficient number of particles were collected for training, validating, and testing a classification algorithm (Table A2). Since the atmosphere also contains numerous aerosols other than pollen (e.g. fungal spores, mineral dust, starch), an additional training class was created from operational measurements containing particles measured on the roof during periods when no pollen was recorded in samples collected in a collocated Hirst-type sampler.
The data were preprocessed prior to further analysis (Fig. B1). Firstly, we removed measurements at the seventh and the eighth bands of the fluorescence spectrum, which, according to the manufacturer, record light at about 450 nm and at about 462 nm, respectively, thus being affected by the scattering laser interference. Only five spectral measurements (i.e. the 14th–18th acquisitions corresponding to 13–17 µs from laser triggering) were used for classification of bioaerosols. Each spectrum measurement, as well as both scattering images, was smoothed with the Savitzky–Golay filter (Savitzky and Golay, 1964) for the noise removal. The lifetime of fluorescence measurements was aligned to start at the fourth pixel before the first maximum to avoid shifts caused by temperature changes in the device. The fluorescence spectrum and the fluorescence lifetime modalities were converted into image-like formats for further neural network processing and then normalized into a 0–1 range to focus on the shape of the signal rather than its intensity. This resulted in the following input data dimensions as illustrated in Fig. B1: 14 × 5 for the fluorescence spectrum, 22 × 3 for the fluorescence lifetime, 120 × 14 for polarization scattering, and 4 × 4 for infrared scattering.
The data were also filtered to remove particles for which noise exceeded the signal. To do this, we focused on the intensity of the scattering and fluorescence signals, as was done in previous studies with Rapid-E (Tešendić et al., 2020; Matavulj et al., 2022, 2023; Šikoparija et al., 2022; Brdar et al., 2023). The particles for which the maximum intensity of the spectrum did not exceed 4000 units or for which the sum of scattering measurements was below 50 000 units after smoothing were removed from the analysis (Table A2). The class “other” included 1 942 375 particles, out of which only 10 282 remained after filtering. In the more sensitive middle mode, 54 776 out of 1 156 902 particles remained in the class “other” after filtering. The single-particle measurements showed very large variability even within the filtered dataset (Fig. B2), seemingly larger than in the case of Rapid-E (Šaulienė et al., 2019).
2.2.4 Creating the classification algorithm
In the current study, we have applied a two-step classification. The first step separates pollen from the class “other”, whereas the second step classifies particles recognized as pollen at the first step into 27 pollen classes. The machine-learning-based classification model combined all measurement modalities (i.e. parallel-polarization scattering, perpendicular-polarization scattering, infrared scattering, fluorescence spectrum, and fluorescence lifetime), assuming that this would result in the best performance as was the case for Rapid-E (Tešendić et al., 2020).
The ResNet architecture with shortcut connections was chosen for its proven superior performance in classifying pollen using Rapid-E measurements (Matavulj et al., 2023; Daunys et al., 2022). Given the variability in input data, we adapted the ResNet model inspired by the 18-layer version. Specifically, we implemented a four-block layer for the fluorescence spectrum and lifetime, a three-block layer for the 447 nm laser scattering images, and a one-block layer for the 637 nm laser scattering image. Details of these configurations are provided in Table B1. These architectures were selected because they demonstrated the best performance for the respective data types in the previous device version (Matavulj et al., 2023). The block layers contained three convolutional layers, where we captured a residual following the initial convolution. Subsequently, at the closure of each block layer, we established a residual connection to the layer's output. Following the completion of all block layers, an additional convolutional layer was integrated. This was followed by global-average pooling, which was averaged over the spatial dimensions of the images. The network initially learned from each type of input separately. After this initial training, we transferred the learned features from these individual inputs (specifically, the parts of the network responsible for feature extraction, known as convolutional blocks) to a new network. This new network processed all different inputs together by equalizing the features from each input using a fully connected (FC) layer, and the inputs were then merged. Finally, the network was trained only to classify these combined data using another FC layer with a softmax function. During this phase, the weights of the feature extractors (the convolutional blocks) were kept unchanged. This means that while the network was learning to classify the merged data, the initial parts that extract features from each input type did not undergo any further changes.
The first convolutional layer was customized to accept a monochrome image. For handling the lifetime and spectrum data, this layer was configured with a kernel size of 5 × 5, with a padding of 2 × 2, and without any stride to maintain the original spatial dimensions. The classification model was trained with 80 % of the reference dataset, 10 % of particles were used for model validation during training to avoid overfitting, and 10 % of particles were used to test the classification performance after training.
2.3 Manual measurements of bioaerosols in the field campaign
The performance of Rapid-E+ in the field bioaerosol monitoring was assessed by comparing its 2 h averaged pollen concentrations with values obtained from the Hirst-type manual standard method EN 16868 (CEN, 2019), following the approach described by Matavulj et al. (2022).
The Lanzoni VPPS2000 volumetric pollen and spore trap of the Hirst (1952) design situated next to the Rapid-E+ instrument continuously sampled the ambient air at 10 L min−1 through a 2 mm × 14 mm orifice constantly oriented towards the direction of the wind. Particles sampled with the airflow were impacted onto an adhesive transparent plastic tape that was mounted on a rotating drum moving past the orifice at 2 mm h−1. The 48 mm long tape segments corresponding to 24 h periods were subsequently mounted onto a microscope slide and analysed by a light microscope at 400× magnification. Pollen grains were counted along three horizontal transects corresponding to 11.57 % of the slide following EN 16868 requirements (CEN, 2019), while fungal spores were counted along one horizontal transect (i.e. 3.86 % of the sample) following the recommendation of Galán et al. (2021). The results were expressed as pollen m−3 (Galán et al., 2017).
2.4 Meteorological data
Meteorological measurements were obtained from an automatic meteorological station (INOVIS15; Dinarska 2, 21000 Novi Sad; 45.236° N, 19.809° E) located about 3.5 km from the aerosol measurements. The data for relative humidity, wind speed, and precipitation were retrieved from a Weather Underground database (https://www.wunderground.com/dashboard/pws/INOVIS15, last access: 10 August 2024).
2.5 Data analysis
Agreement between the automatic and the standard manual measurements was quantified via the temporal correlation coefficient. The correlation was evaluated for daily pollen concentrations to limit the shot-noise uncertainty resulting from substantial detection limits due to the limited flow rate of the devices (Tummon et al., 2022). The correlations were calculated both for the entire measurement period (to account for the effect of false positives outside the main flowering season) and for days when average pollen concentrations measured with the manual method exceeded 10 pollen m−3, a suggested threshold for calculating the uncertainty by the standard EN 16868:2019. By following this approach, we also focused on the main pollen season, thus limiting the inflation of correlation coefficients and p values due to seasonality. An initial data assessment using the Shapiro–Wilk test was performed to check for normality of distribution. Where data were found to be normally distributed, a Pearson correlation analysis was applied; Spearman's correlation coefficient was calculated otherwise.
3.1 Aerosol quantification
The Rapid-E+ measurements in Novi Sad only had four interruptions (from 12 to 36 h long) during 6 months of the continuous operations. One resulted from a physical blockage of the nozzle, which was resolved by cleaning. The other three resulted from a software bug related to flow measurements, which switched off the 337 nm laser. Those cases were resolved by restarting the device, which had to be done manually on the roof.
A strong feature of the device was its ability to provide output with very high temporal resolution (Fig. 1).
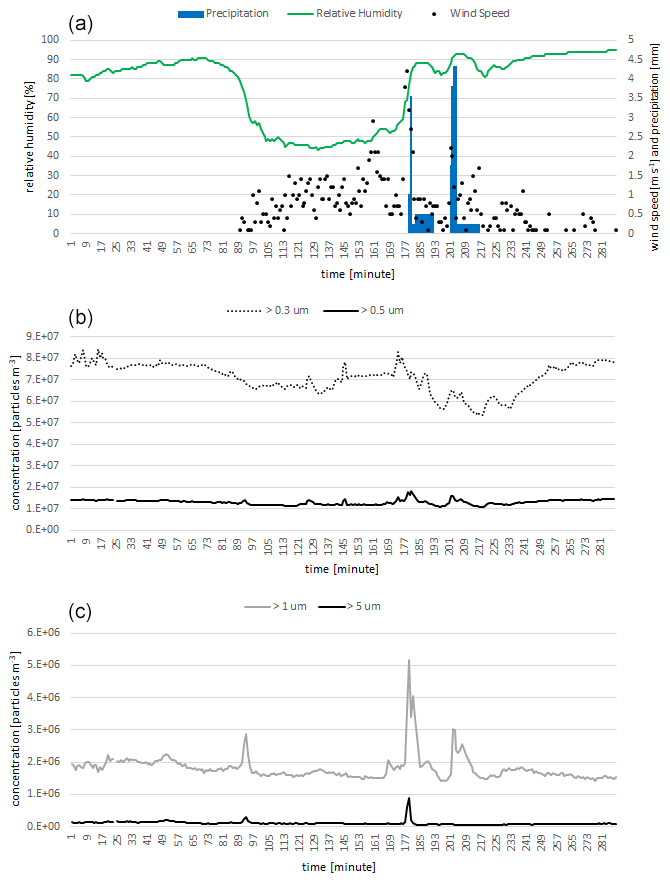
Figure 1Time series of 5 min average of relative humidity, wind speed, precipitation (a), and fine-particle (b) and coarse-particle (c) concentrations measured by Rapid-E+. The time axis shows minutes from 00:00 UTC on 30 July 2023.
The concentrations of submicron particles were notably higher that those larger than 1 and 5 µm. We also registered several sharp increases in the detected particles, seemingly related to approaching atmospheric fronts and rain episodes (Fig. 1). The increase was the most pronounced for particles larger than 1 µm (Fig. 1). It is interesting to note that after the start of the rainfall the coarse particles (> 5 µm) did not follow the increase in concentrations of small aerosols. This observation emphasizes the advantage of measuring with a high-temporal-resolution simultaneously resolving particle size distribution for exploring the behaviour of aerosols in changing meteorological conditions. However, following the equations given in Tummon et al. (2022), the flow rate of Rapid-E+ (5 L min−1) is not sufficient to measure all relevant concentrations at a sub-hour temporal resolution with reasonably low uncertainty.
3.2 Pollen recognition performance in laboratory
Performance of the binary model designed to discriminate pollen from “other” bioaerosols measured in pollen mode (Fig. C1a) in laboratory conditions was characterized by high precision (94 %), recall (98 %), and F1 score (0.96). Classifications of 27 pollen classes in pollen mode (Fig. 2a) yielded an average precision, recall, and F1 score of 83 %, 85 %, and 0.84, respectively, which was comparable to results of classification models built for the Rapid-E measurements for the similar number of pollen types (Tešendić et al., 2020; Smith et al., 2022; Matavulj et al., 2022). As expected, there was confusion within the following four groups of pollen classes that have a similar morphology: (i) Alnus, Betula, and Corylus; (ii) Morus and Broussonetia; (iii) Carpinus, Quercus, and Alnus; and (iv) Cannabis, Humulus, and Morus. Once we merged the classes that could not be distinguished in the manual analysis (i.e. Cannabis and Humulus, Juniperus and Taxus, and Urtica and Parietaria), the performance improved (the average precision was 86 %, recall was 86 %, and F1 score was 0.86). It is interesting to note that the classification algorithm distinguishes Urtica and Parietaria from Broussonetia with high accuracy, despite these pollen grains being morphologically similar. However, there was unexpected confusion between Cannabis and Platanus.
Measurements with the more sensitive middle mode resulted in more particles exceeding the fluorescence threshold (Table A2). However, as can be seen from the confusion matrix (Fig. 2b), the performance in discriminating pollen from other aerosols slightly decreased. The average precision was 93 %, recall was 96 %, and F1 score was 0.95 (Fig. C1b). Performance of the multiclass pollen classification also decreased, so that the average precision, recall, and F1 score became 75 %, 77 %, and 0.76, respectively. The accuracy improved only for Corylus.
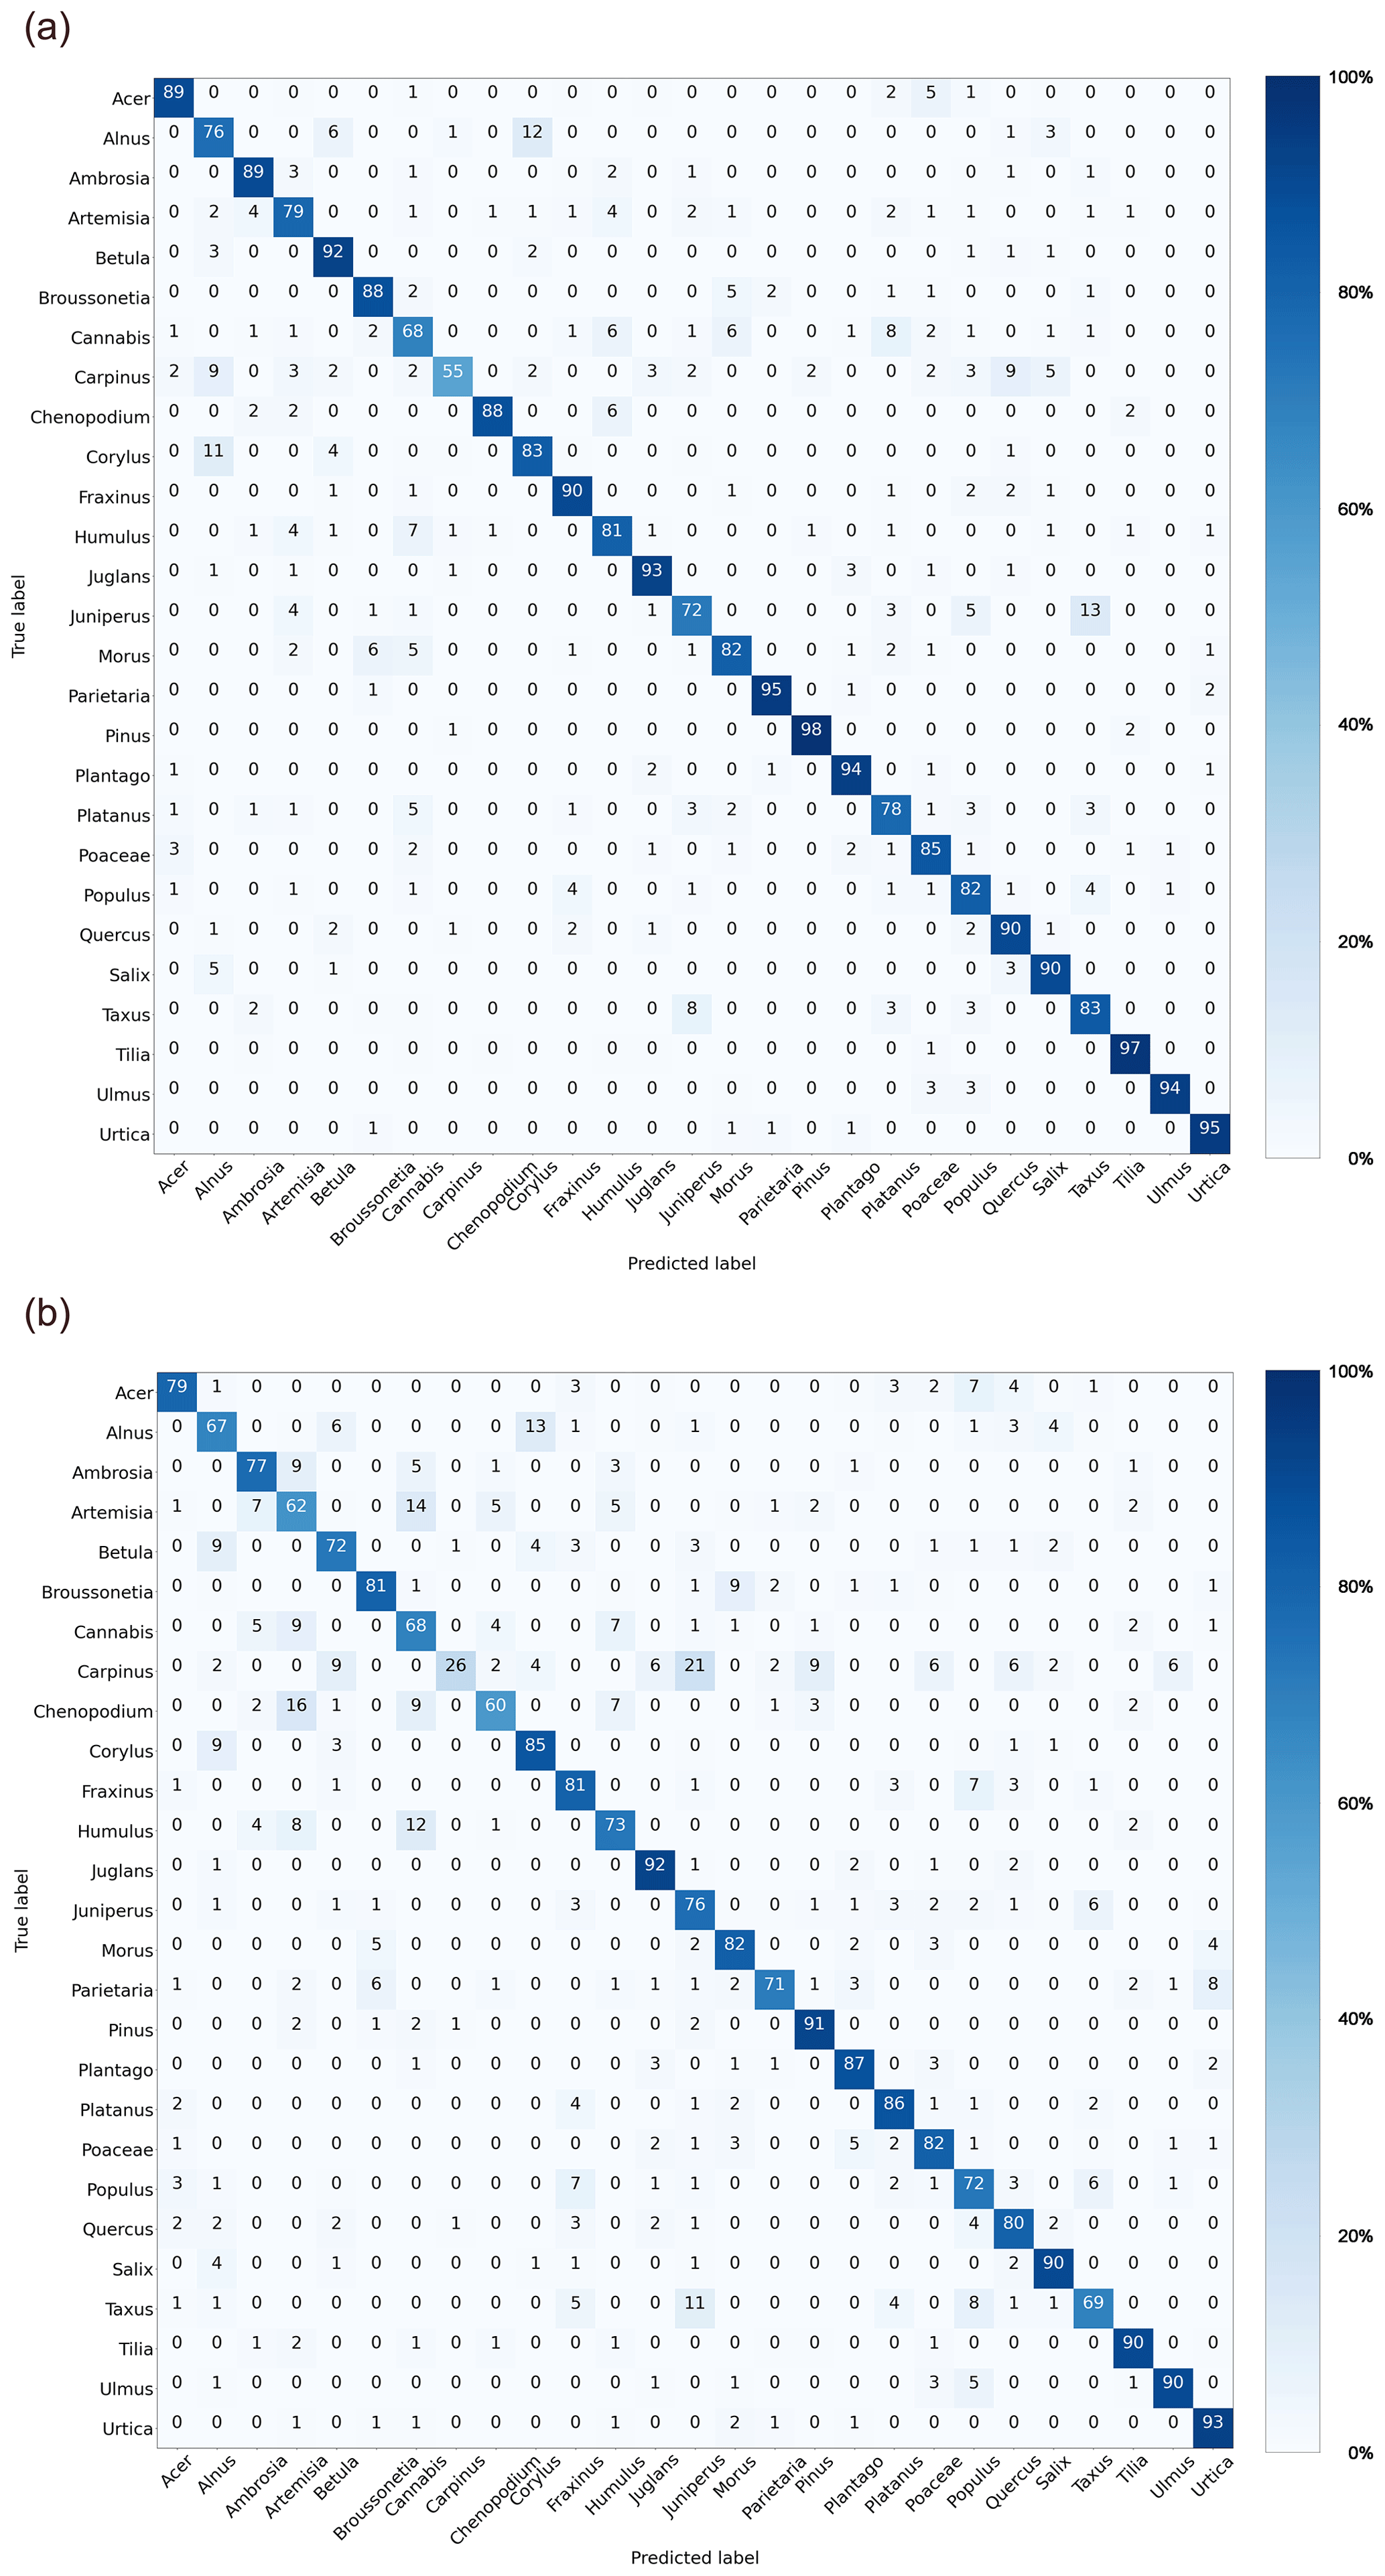
Figure 2Confusion matrices depicting pollen classification performance on the test dataset measured in (a) pollen mode and (b) middle mode.
3.3 Comparison of field measurement with manual reference time series
The Rapid-E+ measurements in pollen mode record an order of magnitude less pollen and fungal spores than the Hirst-type measurements (Fig. 3). This can be attributed to the very rigorous cleaning of the measurements (Sect. 2.2.3), from either failed measurements (in particular, fluorescence) or good measurements of particles that emit a weak fluorescence signal.
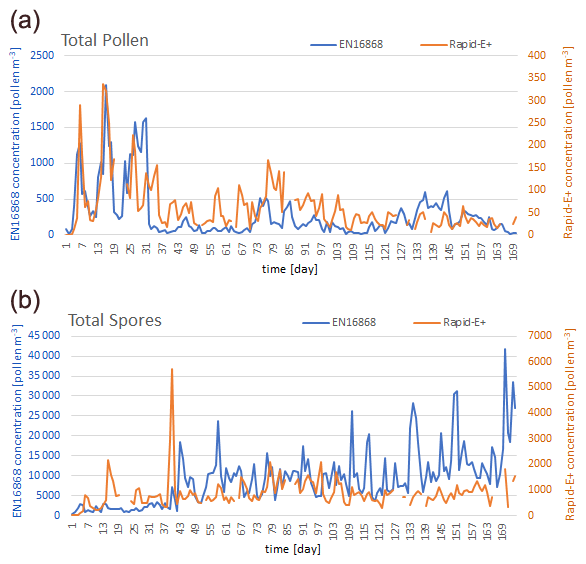
Figure 3Time series of daily concentrations measured in Novi Sad by the side-by-side-operated Hirst-type device (EN 16868) and Rapid-E+ in pollen mode for (a) total pollen and (b) total spores (note the difference in y-axis scales).
From the 27th to the 31st daily measurement points (3–7 May 2023), Rapid-E+ underestimated total-pollen concentrations even more. When looking into the pollen types detected by the standard measurements for these days, a notable amount of small Broussonetia pollen (about 10 µm; Halbritter, 1998) is evident (Fig. C2), which probably caused the higher omission rate. The apparent under-representativity of the Rapid-E+ measurements for small pollen grains could be handled by a less strict cleaning of the scattering signal. This would improve detections of Broussonetia, Urtica, Morus, Parietaria, and Platanus but could increase the number of false positives from other small aerosols present in the atmosphere. A similar underestimation can be seen for the days 136–144 (corresponding to 21–29 August) when Ambrosia pollen was dominant in the atmosphere, implying that a notable amount of this pollen was also filtered out. Ambrosia has a larger diameter but contains air in its pollen wall (like saccate pollen, i.e. Pinus, Picea, and Abies), which could affect the refraction index and result in a size underestimation when inferred from more homogenous PSLs (polystyrene particles). Also, it could affect the fluorescence measurements by limiting the number of excited fluorophores, which in turn would require more sensitive detections of fluorescence for reliable counting.
Automatic detections of total pollen, Juglans, Morus, and Ambrosia, have a statistically significant positive correlation with the standard EN 16868 measurements during days when daily concentration exceeded 10 pollen m−3 (Table 1). Overall seasonality was captured for most of the pollen classes, with a limited number of false-positive detections outside the season. The exceptions were Juglans, Pinus, Tilia, Chenopodium, Humulus, and Cannabis, for which a significant number of wrong classifications existed outside the pollen season (Fig. C3). There was a clear tendency towards confusion of pollen occurring simultaneously in the air, which was expected following the results of the tests shown in Fig. 2a. Merging Rapid-E+ measurements for classes that are difficult to identify with manual method (i.e. Taxus and Juniperus, Urtica and Parietaria, and Cannabis and Humulus) did not improve the correlations (Table 1). Some improvement in the correlations could be expected if the measurement uncertainty of the standard Hirst volumetric method (EN 16868), inherited from the subsampling during the analysis of the tapes, is eliminated by counting 100 % of the slide area (Mimić and Šikoparija, 2021). However, such analysis for the entire season is extremely difficult, and even if done, the effect is presumed to be small.
Table 1Correlations between daily concentrations measured by Rapid-E+ in pollen mode and EN 16868 measurements.
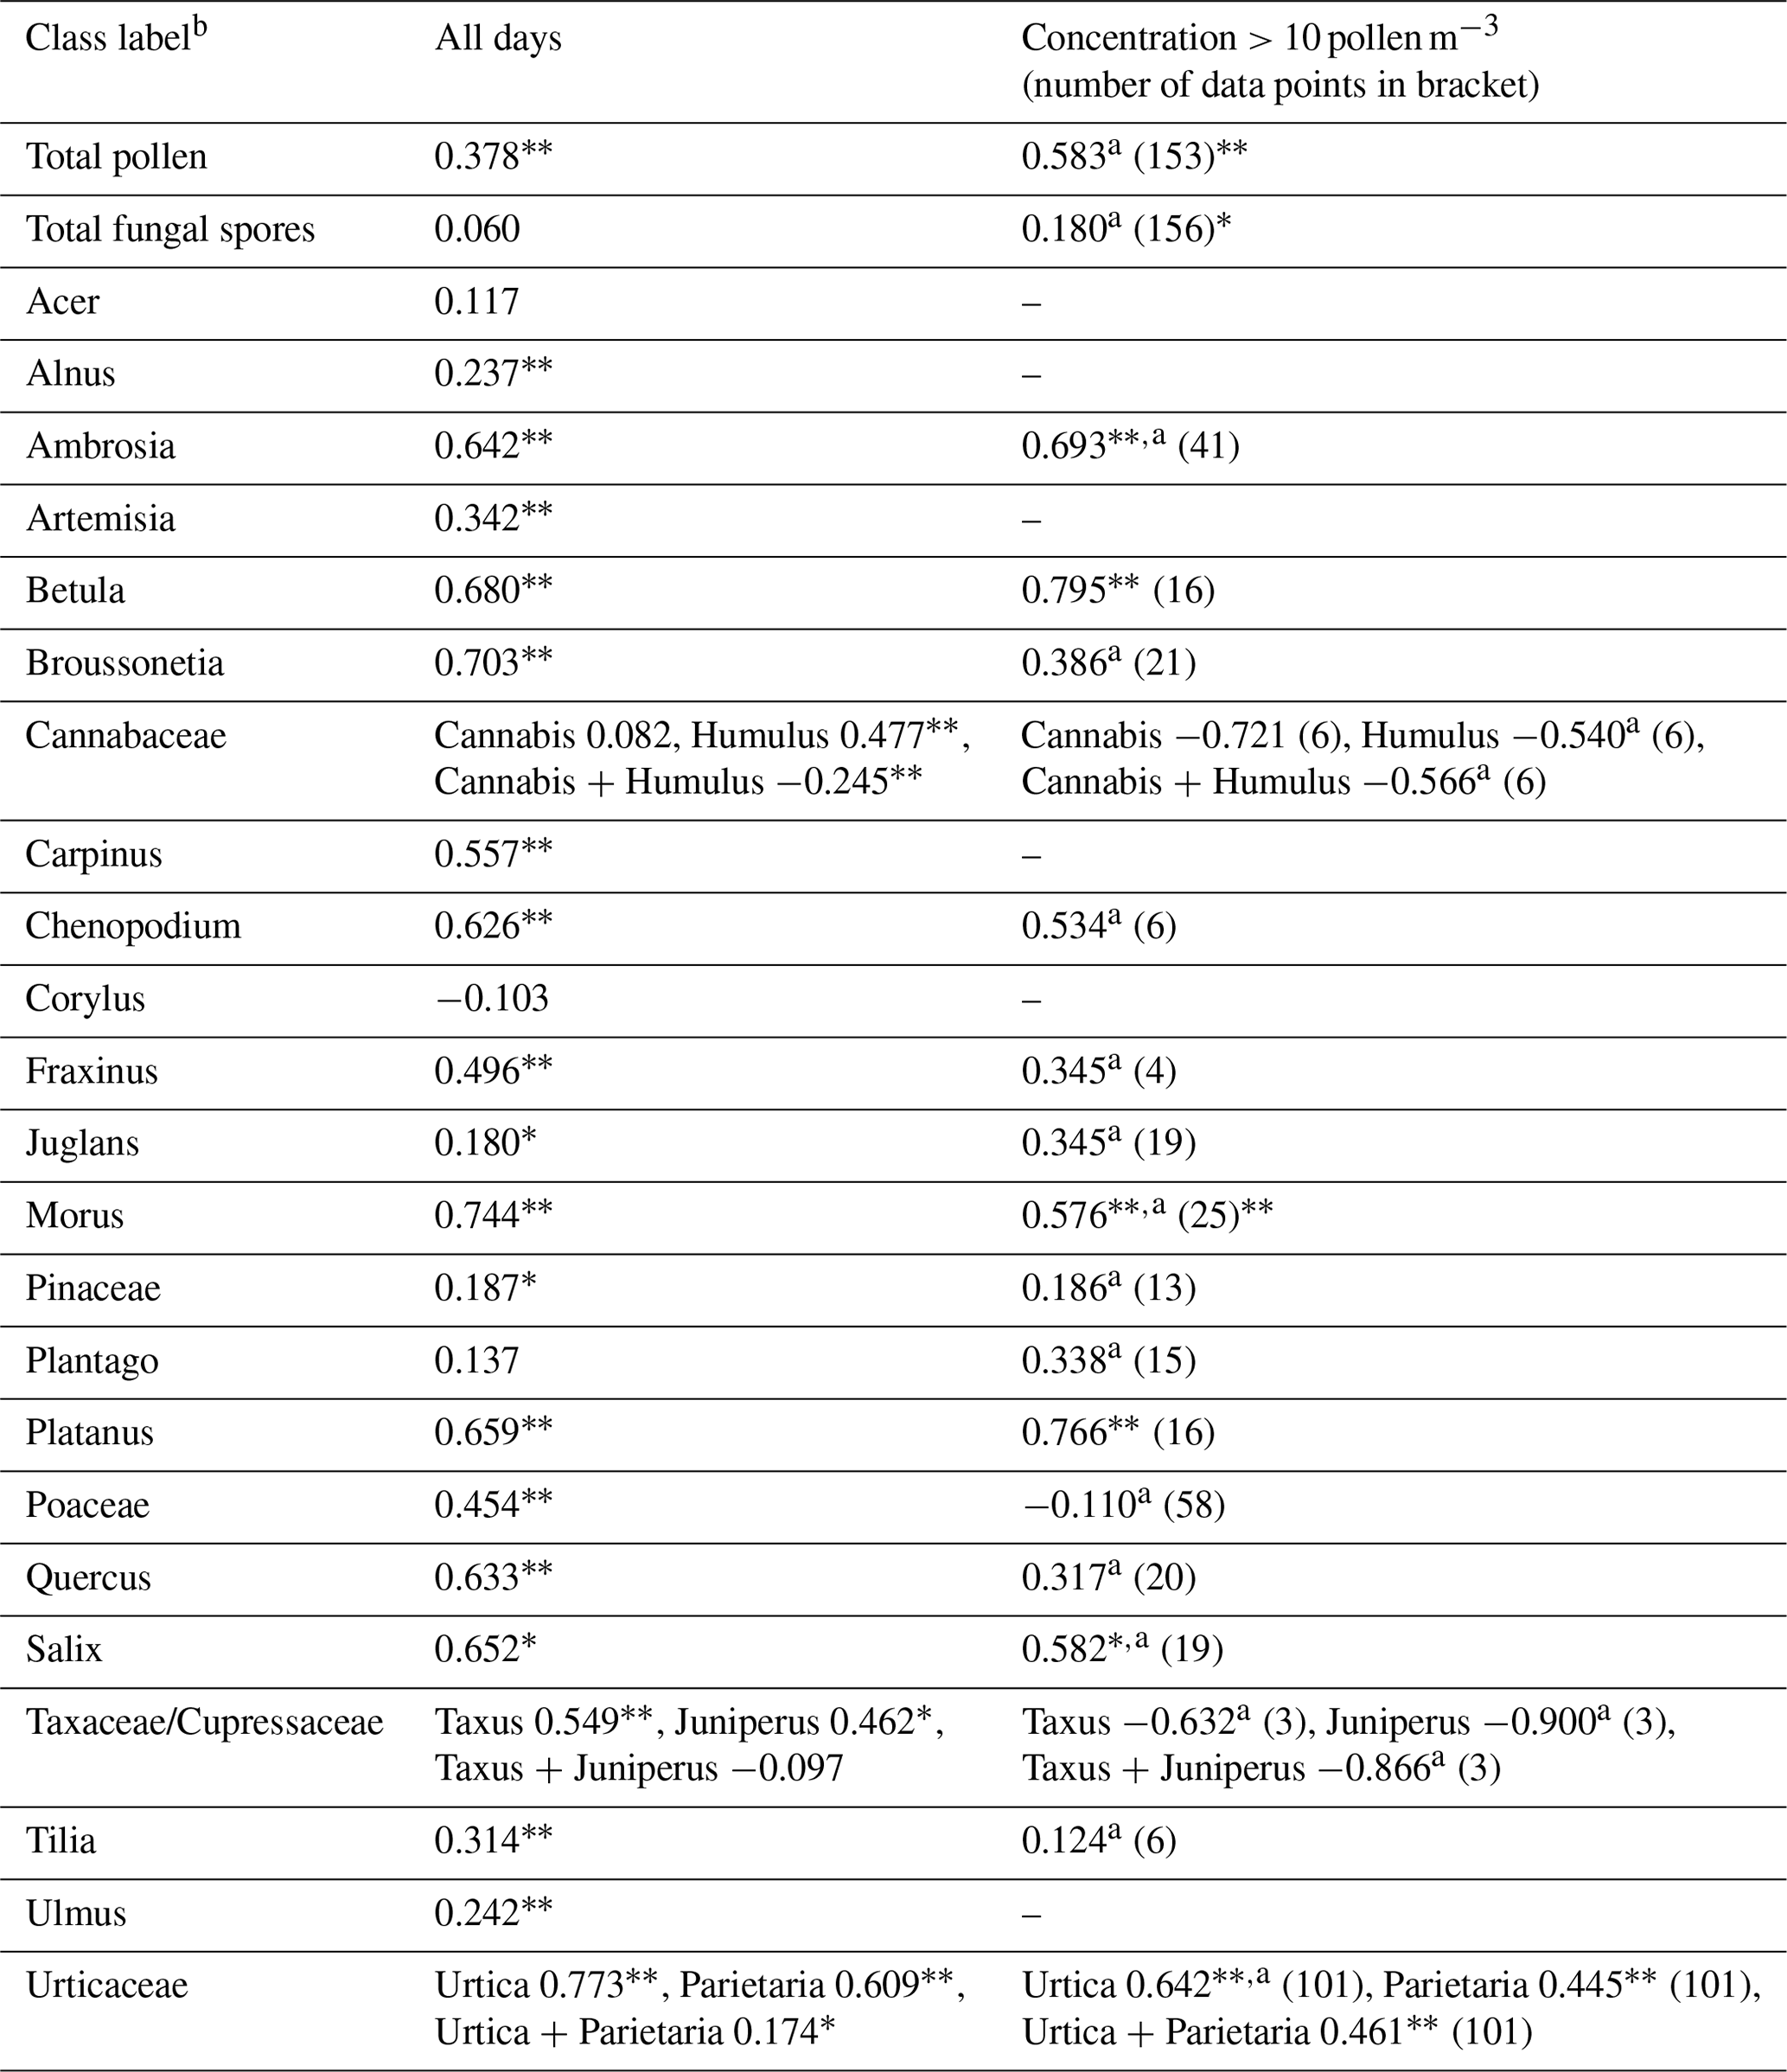
* p < 0.05. p < 0.01.
a Pearson correlation coefficient.
b The class labels do not fully represent the taxonomic rank (i.e. with pollen in reference data coming only from one or several species of the respective taxonomic category) and are thus not written in italics.
Despite the fact that the sensitivity of the fluorescence detectors increased in the middle mode, which as expected improved representativity of the Rapid-E+ measurements, some of the clear peaks (e.g. Platanus, Broussonetia) were still not detected (Fig. C2). The increase in the fluorescence sensitivity also increased fluorescence at shorter wavelengths that dominated in the class “other” (Fig. E1). This could lead to difficulties in discriminating pollen from other bioaerosols and an additional uncertainty affecting the discrimination between different pollen classes, in agreement with the confusion matrix of the test dataset (Fig. 2b).
3.4 Compatibility of different devices and transferability of the classification algorithm
Rapid-E+ is delivered without a particle classification algorithm and reference pollen datasets; therefore, a major effort is needed to create these monitoring prerequisites. Repeating the algorithm for each device in a network is unfeasible, which adds strict requirements for compatibility of the measurement signal across devices: an algorithm developed and trained for one device must be equally (or with minor losses in fidelity) applicable to all devices in the network. At the same time, individual features of lasers and detectors, as well as variations in the hardware setup resulting in slightly different light paths for different devices, cause various device-specific features of the signal. As a result, classification performance falls when a model trained on a reference dataset from one device is tested on a reference dataset from another one, which was demonstrated for Rapid-E (Matavulj et al., 2021). The same problem exists in Rapid-E+ (Fig. 4). The algorithm created on the training dataset collected with the Novi Sad device failed to identify the same reference pollen collected with both Osijek and FMI devices (average F1 score = 0.01 in both cases).
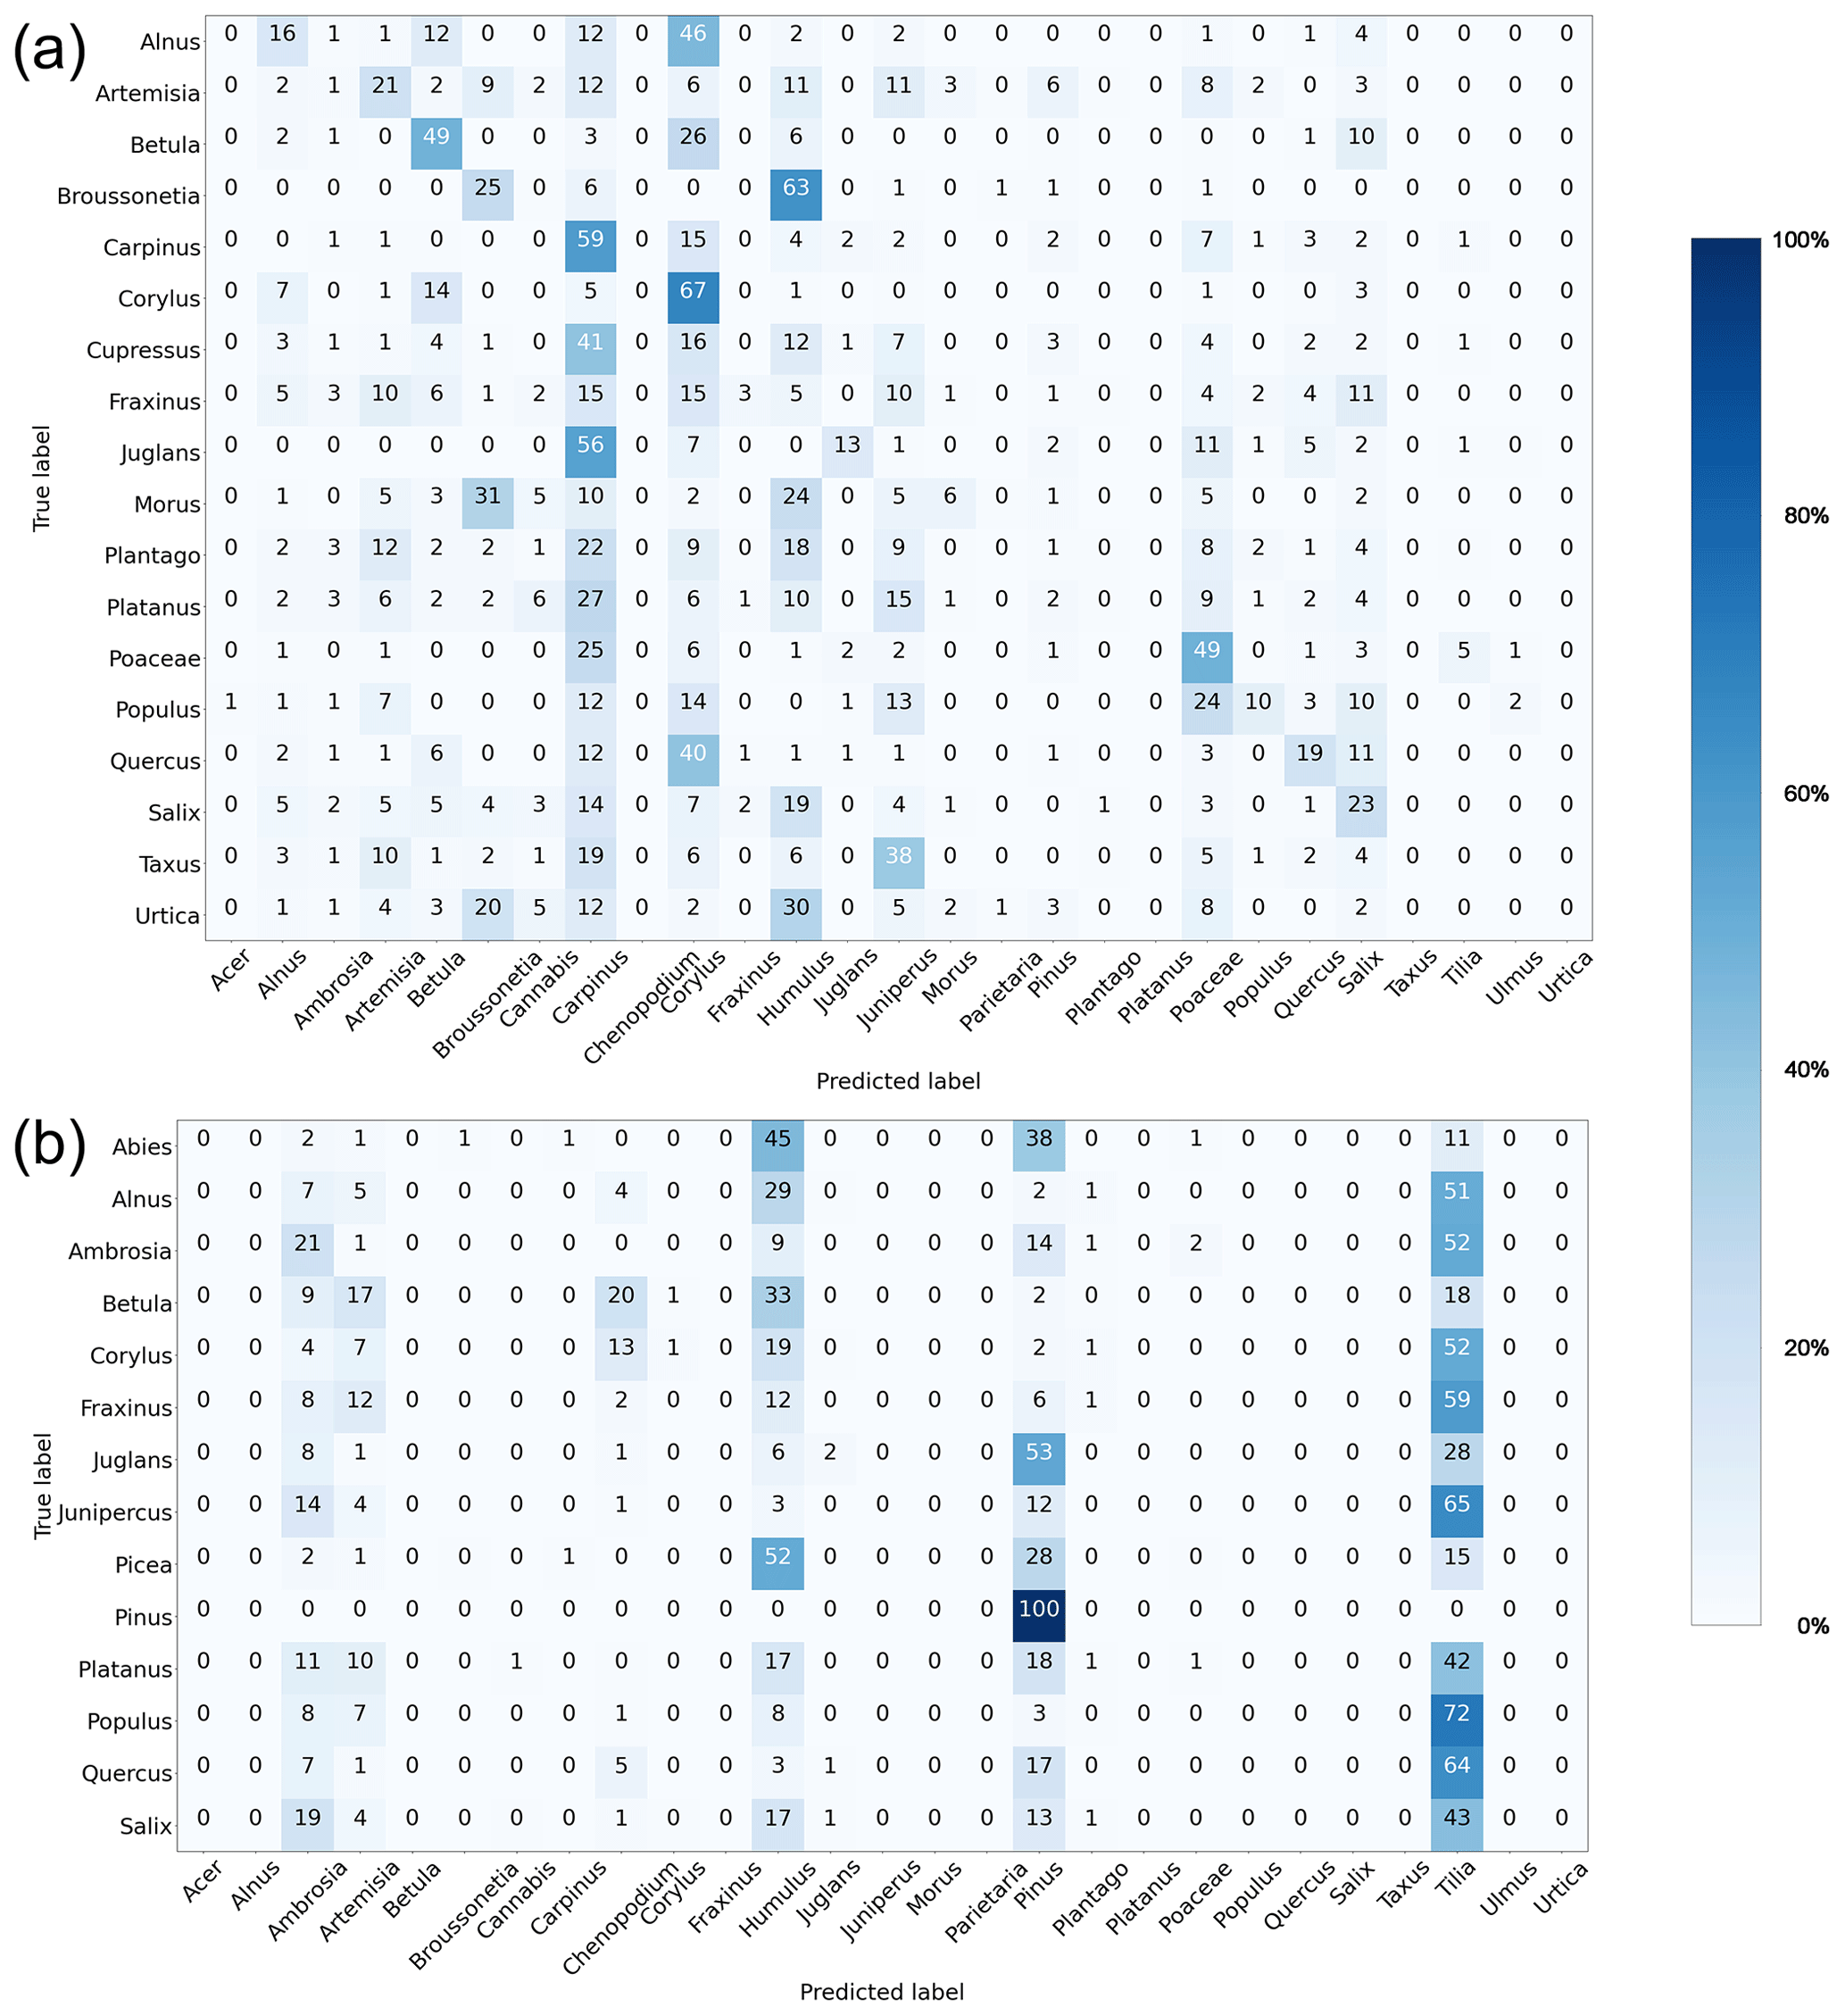
Figure 4Confusion matrices with the results depicting the performance of the classification model trained on the reference dataset collected with the Novi Sad Rapid-E+ device when classifying the same pollen measured by the Osijek (a) and Helsinki (b) devices.
3.5 Strength of the fluorescence signal and difference between devices
Cleaning the reference data based on fluorescence intensity reveals differences in the signal strength between different pollen types, in line with observations from Rapid-E (Smith et al., 2022). This limits detection of pollen with low-fluorescence signatures by Rapid-E+. As shown by earlier excitation–emission measurements (Pöhlker et al., 2013), the excitation with the 337 nm laser may lead to a low-intensity response for some pollen types. The most-affected pollen is from the Pinaceae and Betulaceae families (Table 1).
When analysing the results of cleaning the reference data for the same pollen measured with different devices, we noticed a significant difference between the devices for most pollen classes except for Platanus, Salix, and Betula. Different timing of the lab work and different methods of exposing the device to pollen cannot explain observed differences, but it is rather attributed to differences in device sensitivity to the scattering and/or fluorescence signals.
When comparing the Betula size measured by Rapid-E+, derived from a 447 nm laser scattering image (Fig. 5a and b), the distributions are similar for all tested devices (Fig. 5c), but there is a shift between them. Also, the absolute value is smaller than the expected size (10–25 µm) for this pollen grain (Halbritter et al., 2020). This discrepancy could originate from the fact that the linear regression function for calculating the size supplied by the Rapid-E+ manufacturer (Appendix D) is derived from measurements of PSLs, which have different refraction characteristics and are more homogenous than pollen. This could also be the reason for the negative size reported for some particles, which is an evident artefact, especially since size was positively correlated with intensity of the scattering measurements of Rapid-E (Lieberherr et al., 2021). There is also a big difference between the devices in the average 647 nm laser scattering signals (Fig. 5d).
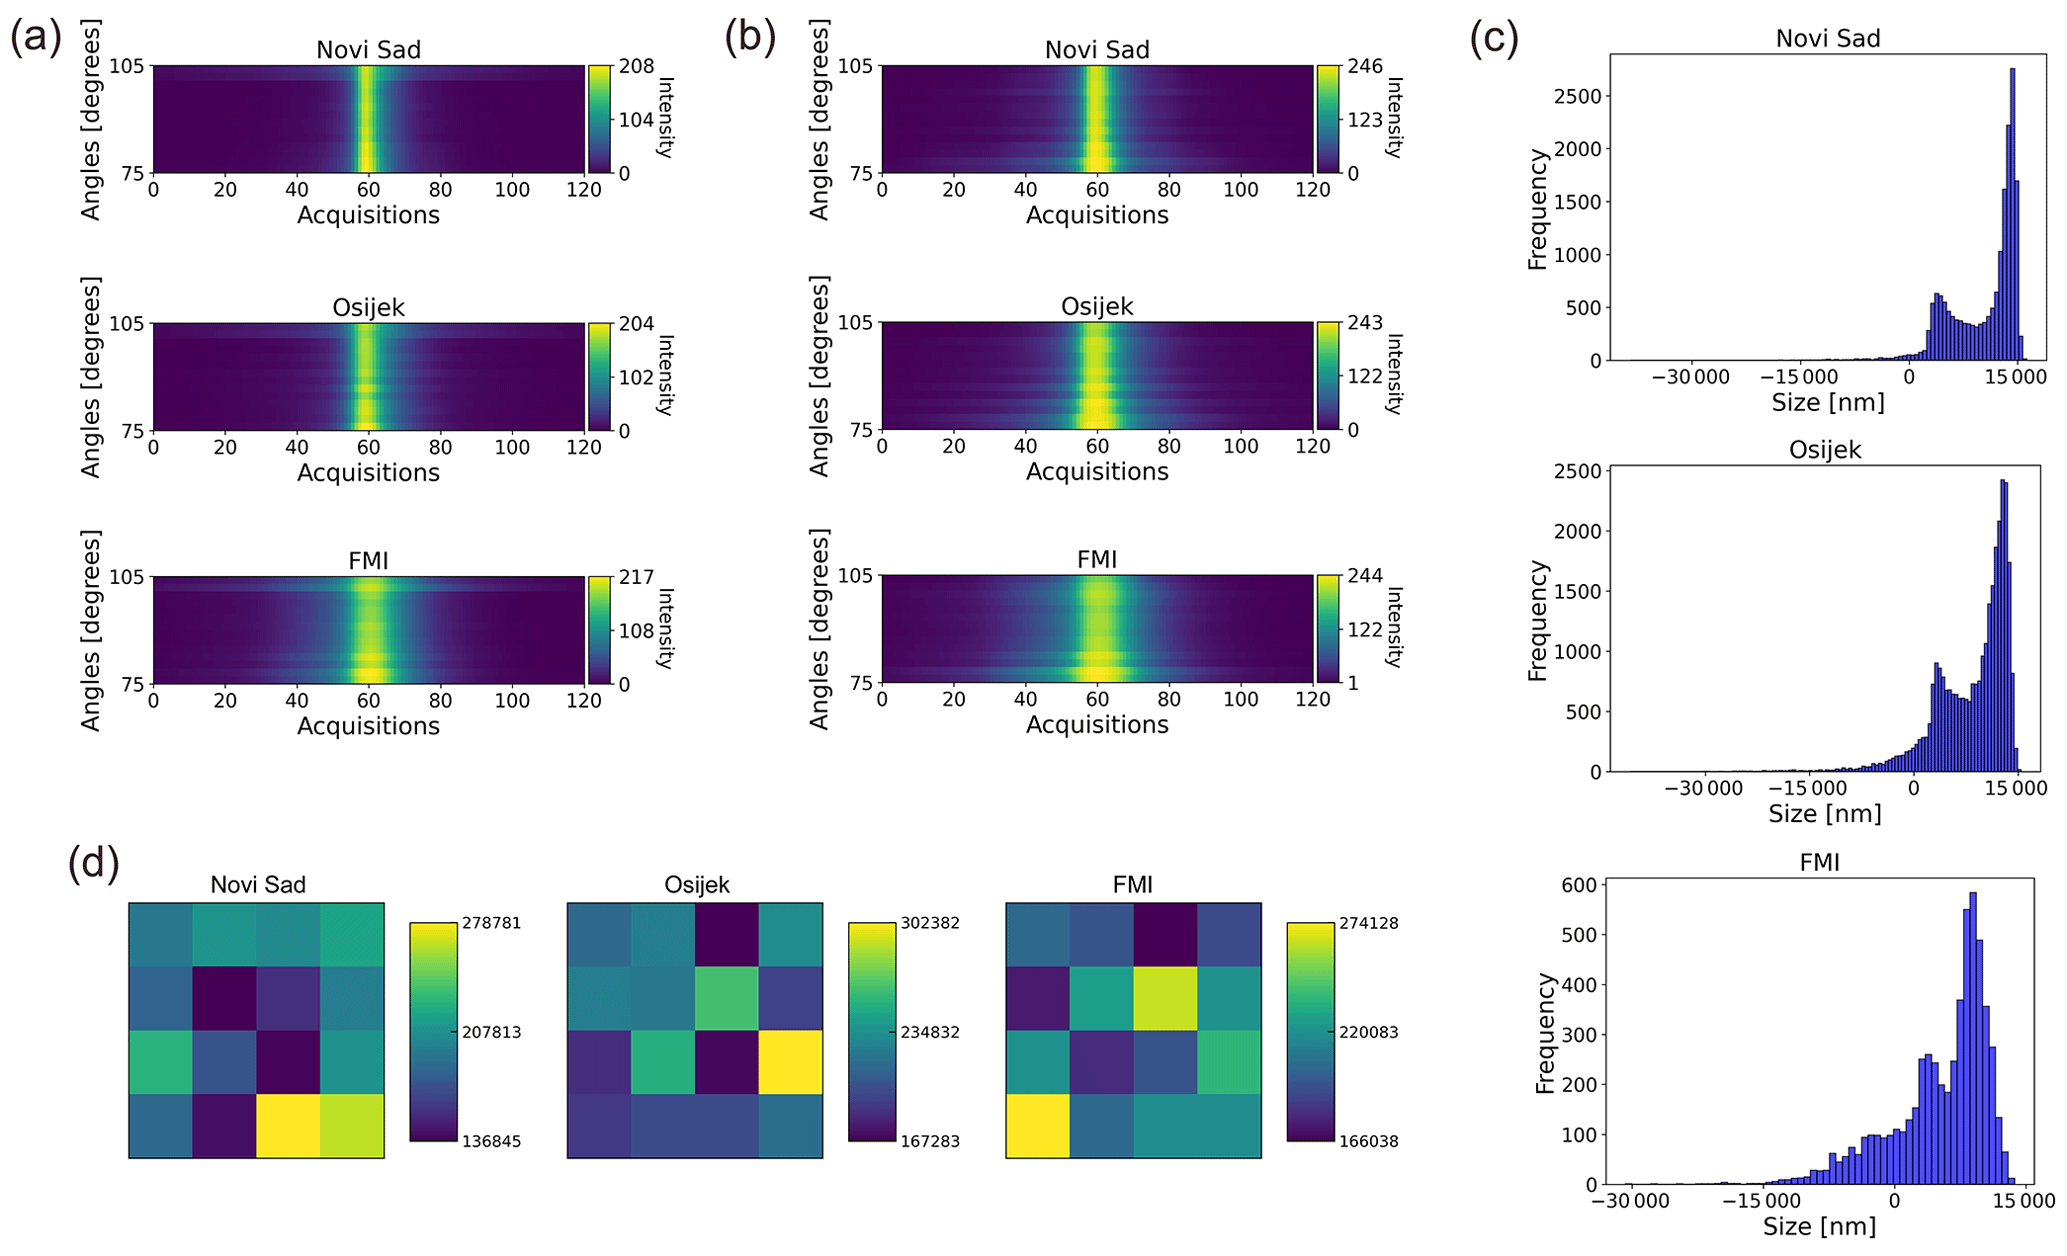
Figure 5Comparison of reference Betula pollen measurements in pollen mode on Novi Sad, Osijek, and Helsinki Rapid-E+ devices after preprocessing: (a) average 447 nm laser perpendicular-polarization scatter, (b) average 447 nm laser parallel-polarization scatter, (c) histogram of size distribution, and (d) average unitless intensity of 637 nm laser scattered light, recorded as an image using a 4 × 4 px detector.
With respect to fluorescence, the difference between devices in the spectrum measurements is hardly noticeable (Fig. 6a). However, signals of the fluorescence lifetime notably differ (Fig. 6b). The noise seems to dominate in the Betula pollen average fluorescence lifetime signals from Osijek and Helsinki devices (Fig. 6b). Similar differences in the fluorescence lifetime measurements by different devices are also seen for other directly comparable pollen classes (Fig. F1).
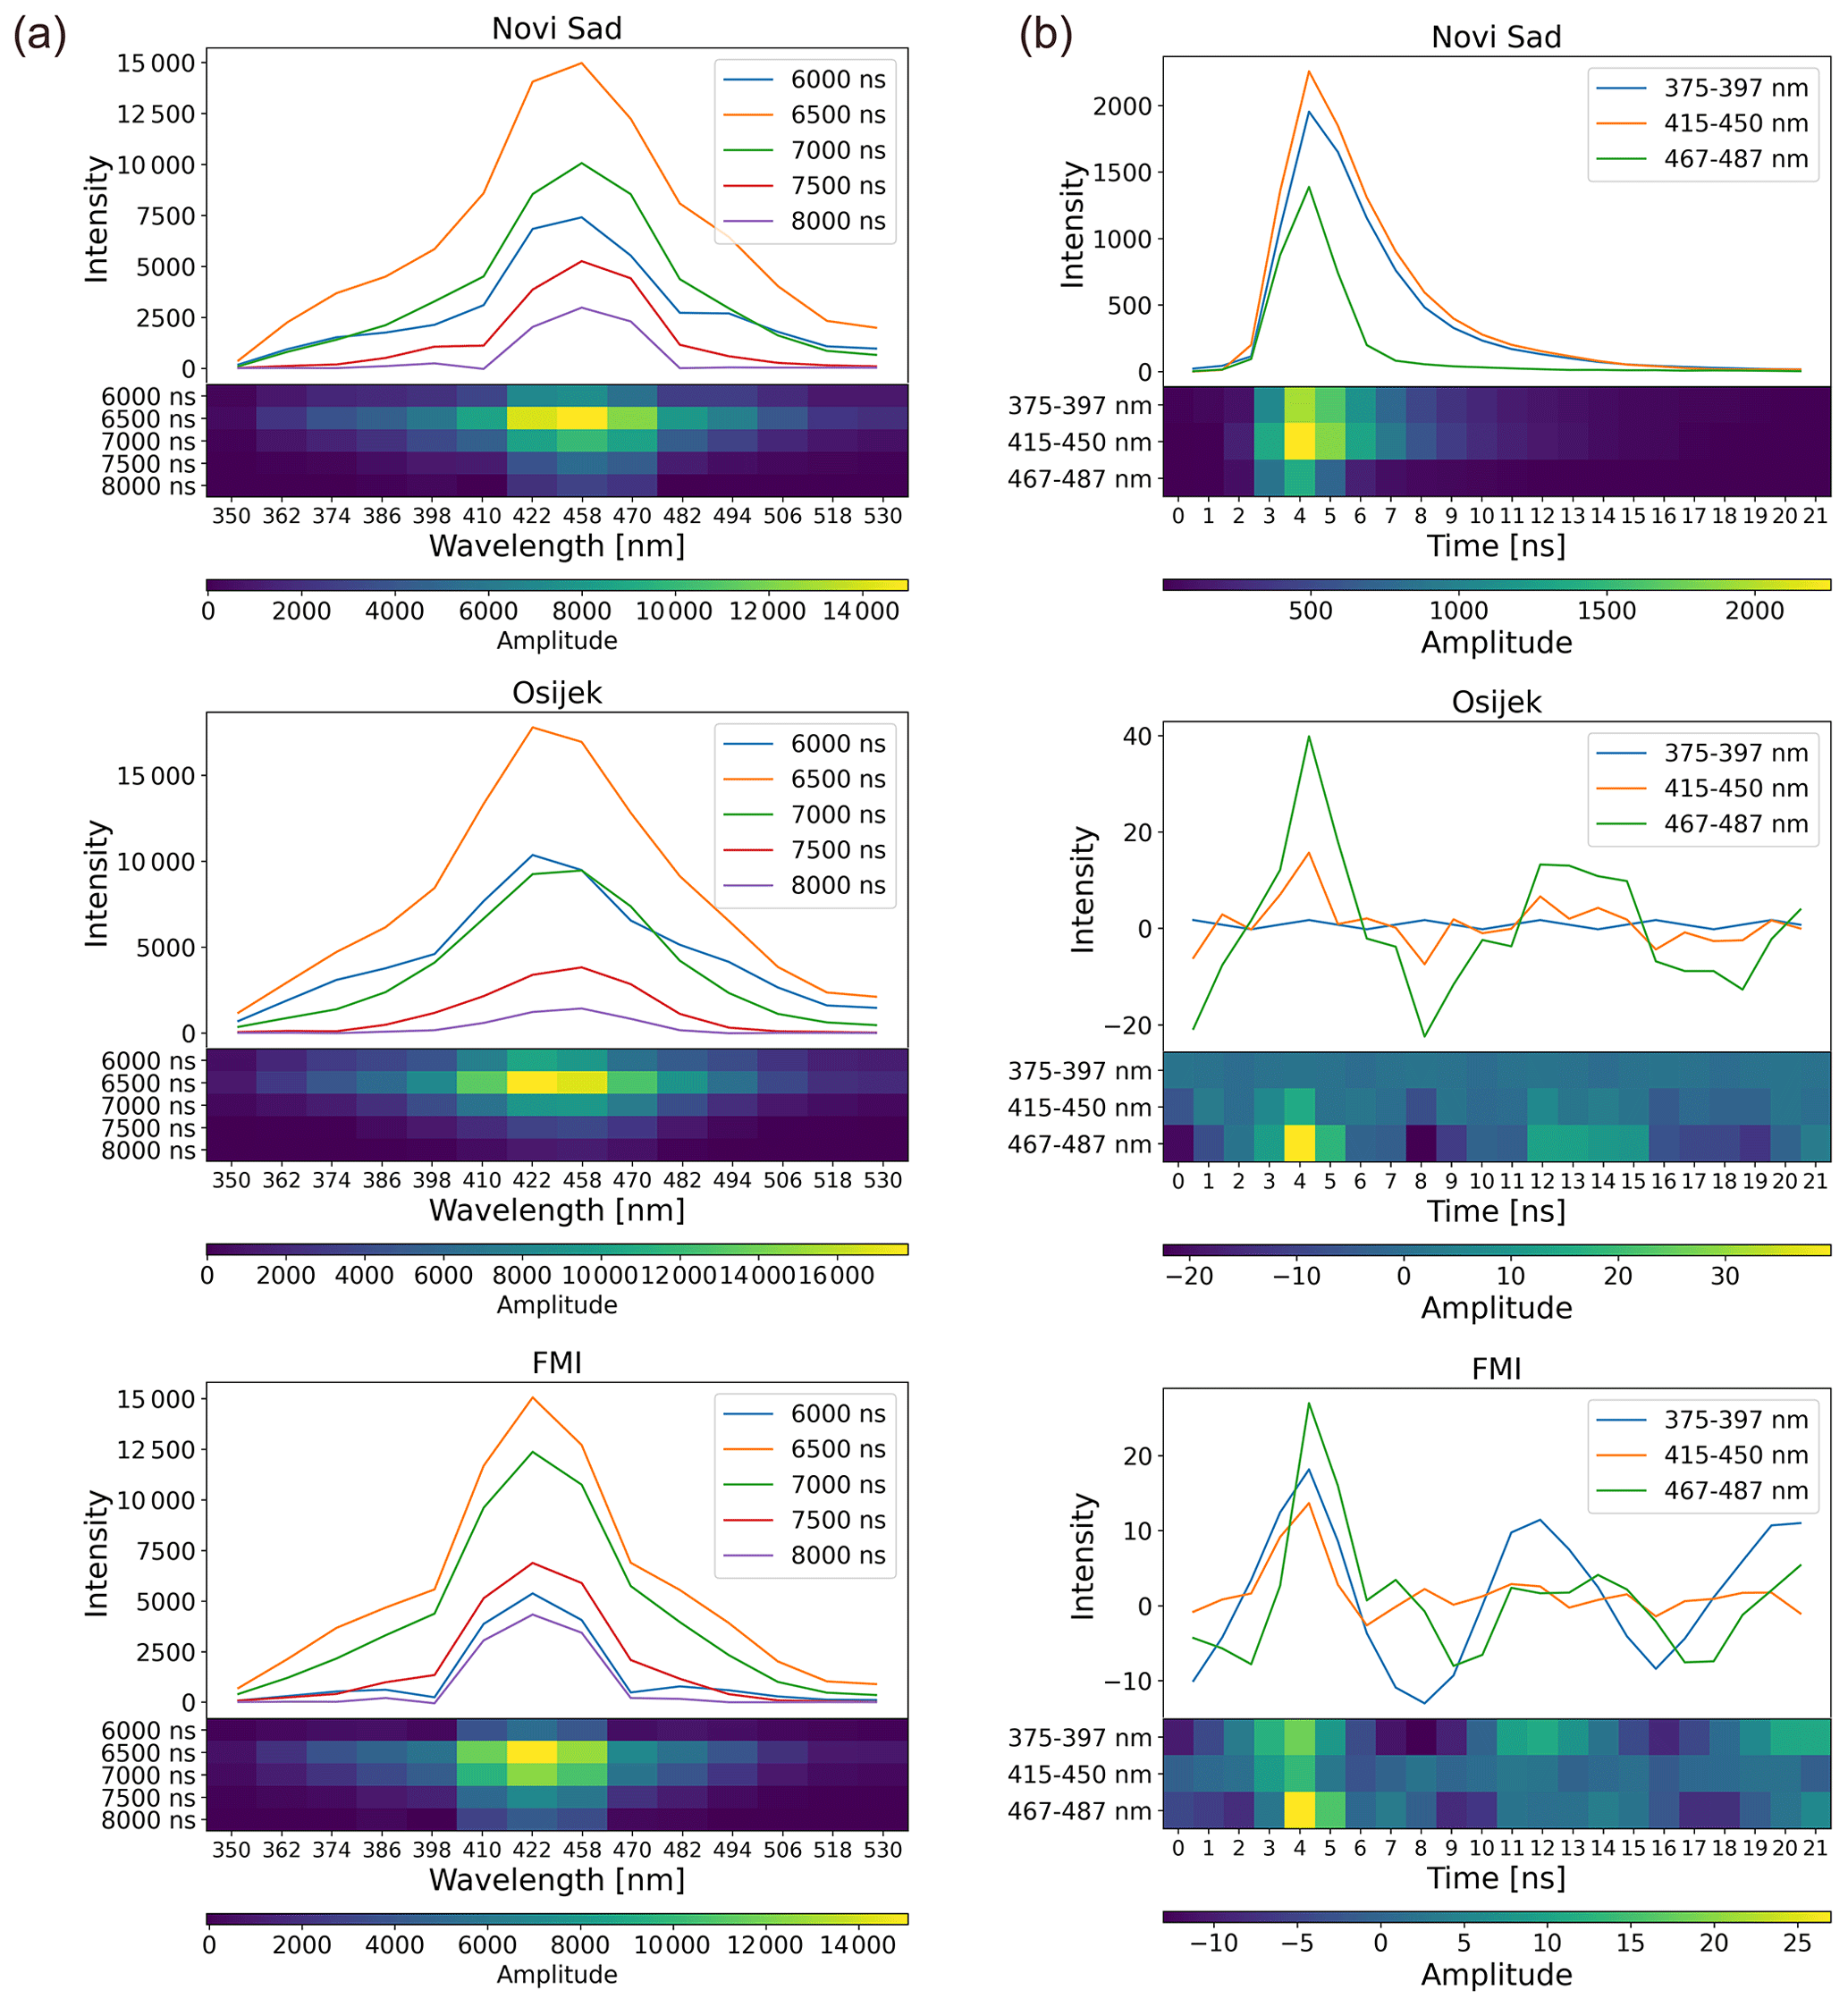
Figure 6Comparison of reference Betula pollen fluorescence measurements in pollen mode with Novi Sad, Osijek, and Helsinki Rapid-E+ devices after preprocessing: (a) average spectrum and (b) average lifetime. The regular line plot and image-like smoothed and normalized presentation (the latter used as input for the neural network) are shown.
These observations explain the poor transferability of the recognition algorithm.
The upgrade of the Plair Rapid-E to Rapid-E+ brought some improvements in performance regarding identification of pollen and provided some new capabilities. The most-useful new feature is recording the particles in different size bins even when the fluorescence-inducing laser was not activated. The accuracy of the size determination, however, may depend on pollen type, especially for particles that significantly differ from PSLs used for establishing the relationships between the scattering measurements and the particle size. The new device worked reliably in continuous measurements, and, according to the manufacturer, the lifetime of the 337 nm fluorescence-inducing laser has doubled. The ability to detect particles with a different sensitivity of fluorescence measurements potentially enables measurements of fungal spores.
The most significant problems were faced with the fluorescence measurements. The uncertainty of the single-particle fluorescence measurements was large, which limited the accuracy of the particle recognition, both in the lab and in the field campaign. At the same time, there is a large discrepancy between the signals measured by different devices. Both aspects make the device unsuitable for large operational monitoring networks: Rapid-E+ comes without a classification algorithm and training datasets, the creation of which is a highly demanding process. Each of the devices analysed in the current study required a full-scale independent training of the algorithm prior to application.
Additional efforts from the manufacturer are needed to increase the signal-to-noise ratio of the fluorescence measurement for a wide spectrum of bioaerosols of interest. This is particularly emphasized for regions where numerous pollen and fungal spore classes are simultaneously present in the atmosphere. A much closer collaboration of the manufacturer with its clients is needed to bring Rapid-E+ to the level required for monitoring in operational aerobiological networks.
Table A1Side-by-side key specifications of the Plair SA Rapid-E and Rapid-E+ as extracted from user manuals.
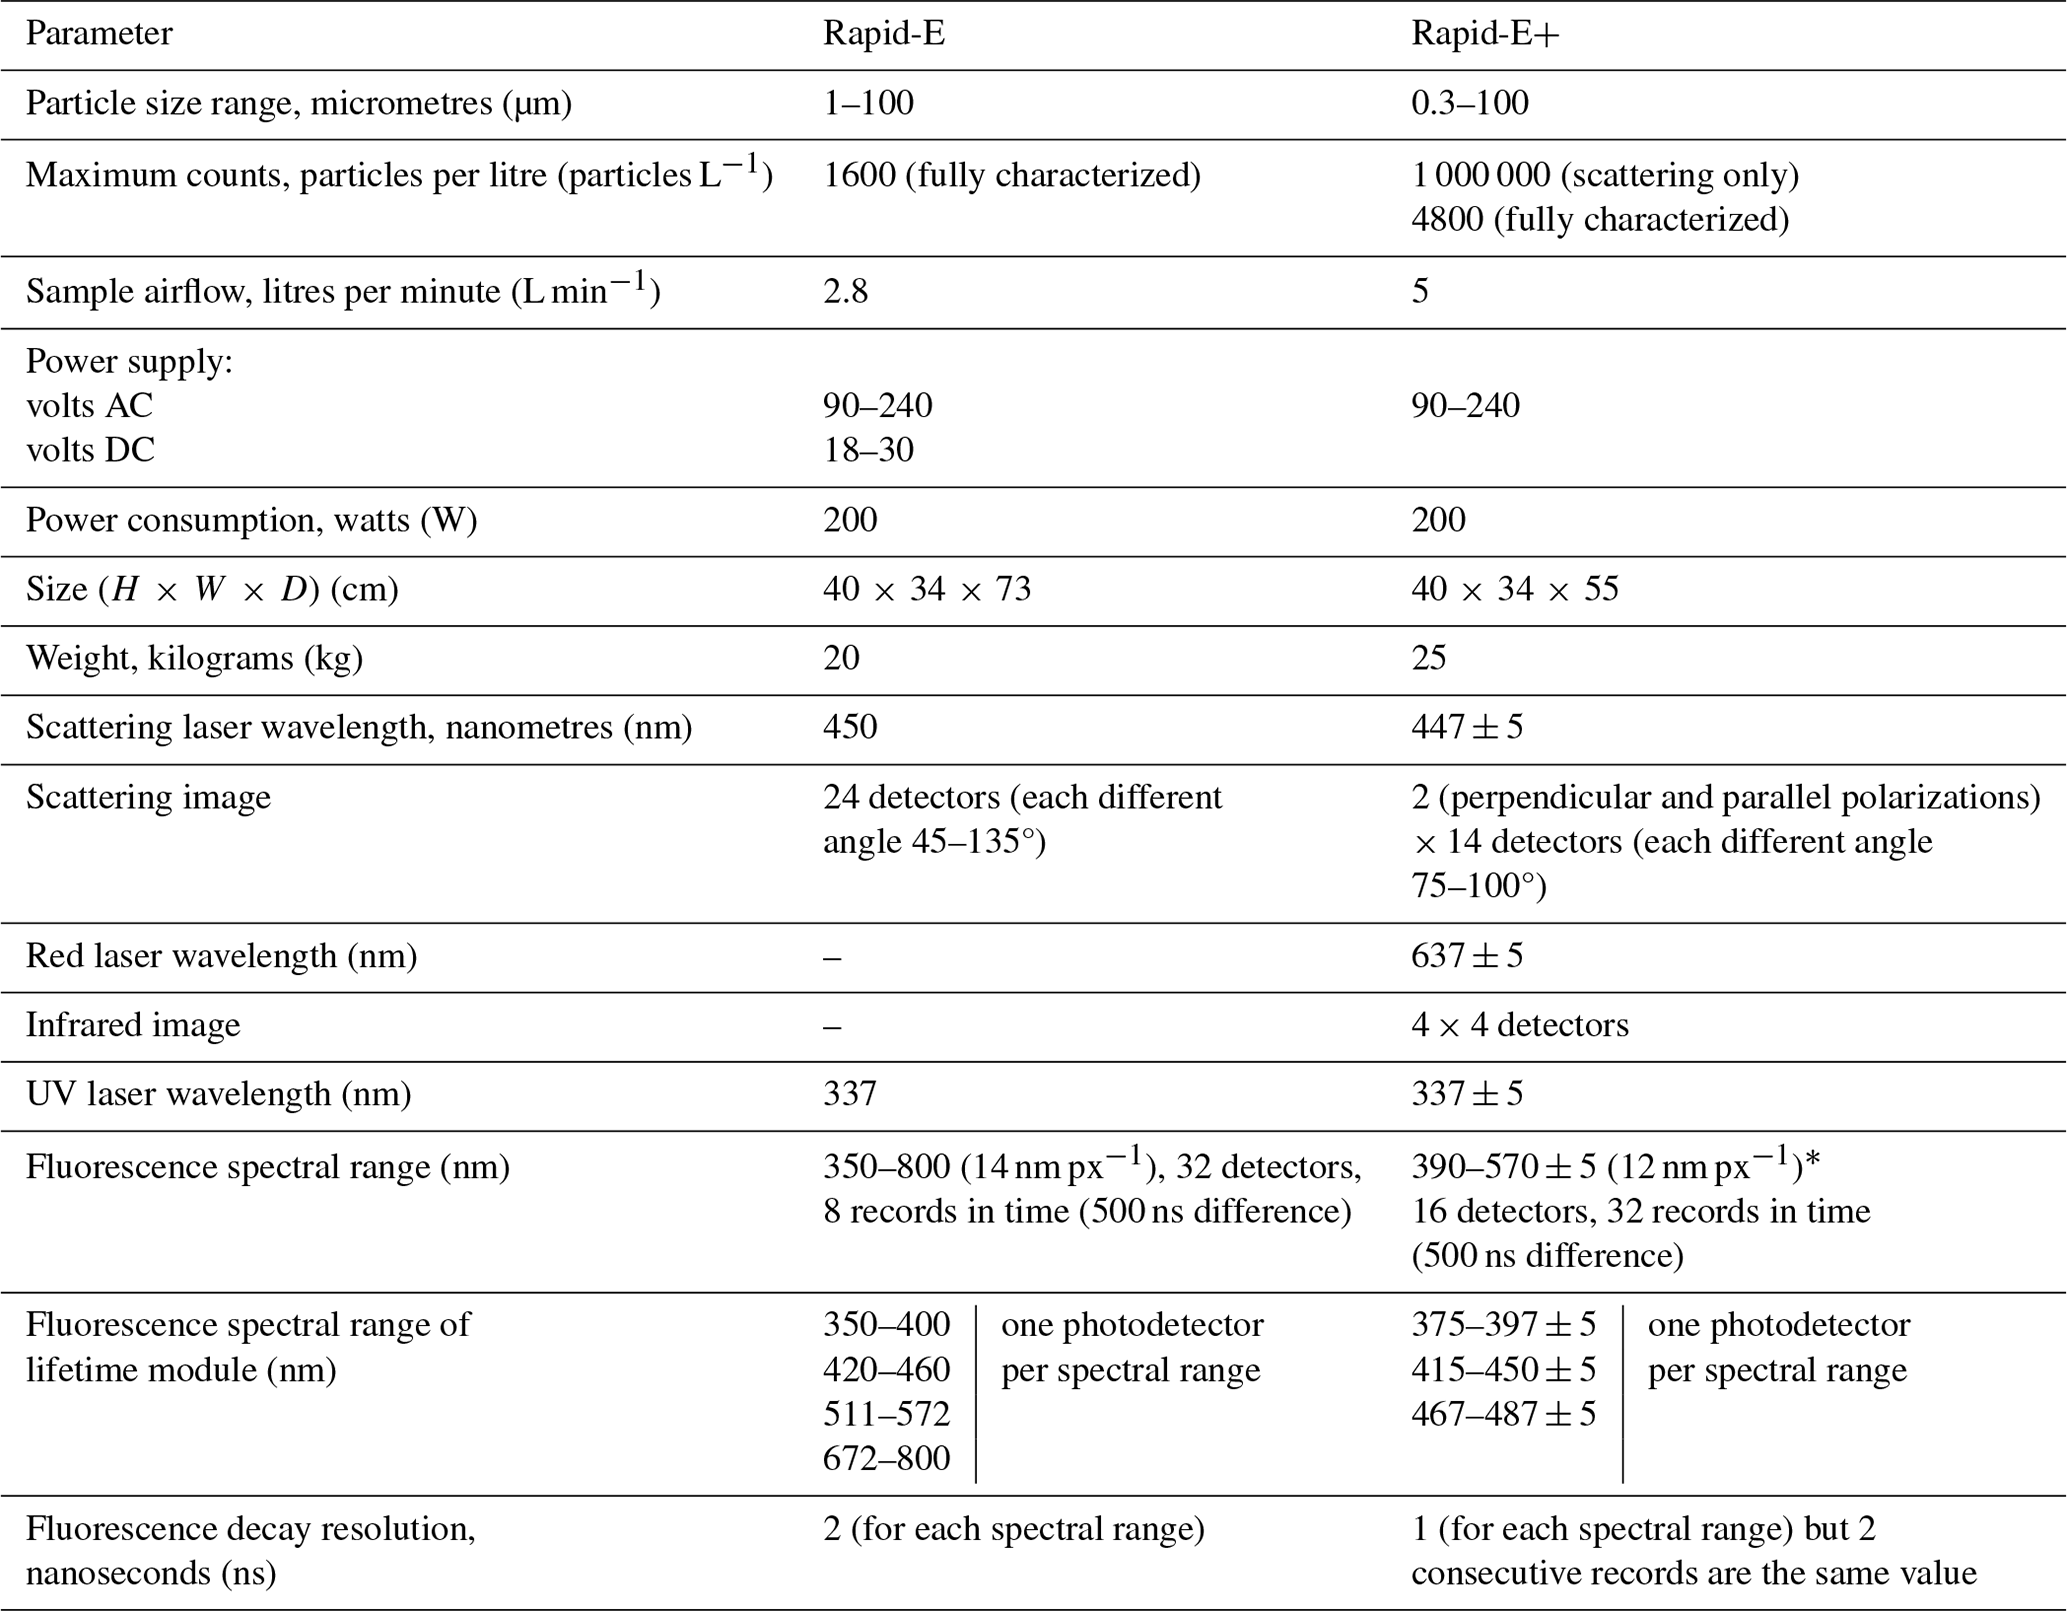
* There is a discrepancy in the ranges given in different parts of the Rapid-E+ Operation and Service Manual version 6.2. In the specifications on page 9 and in the table on page 14, the range is 390–570 nm; in the figure on page 14, the range is from 350 to about 560 nm (so the resolution is about 14 nm); in the figures on pages 21, 22, 24, 28, 29, and 30, the range starts from 350 nm, and the resolution is higher than 12 nm; and in the figure on page 31, the range is 350–700 nm (so the resolution is 23.34 nm).
Table A2Pollen classes in tests and the results of cleaning the dataset for each device involved in this study. If more than one species is used as a pollen source, taxa from which reference data are collected on different devices are marked using bold font.
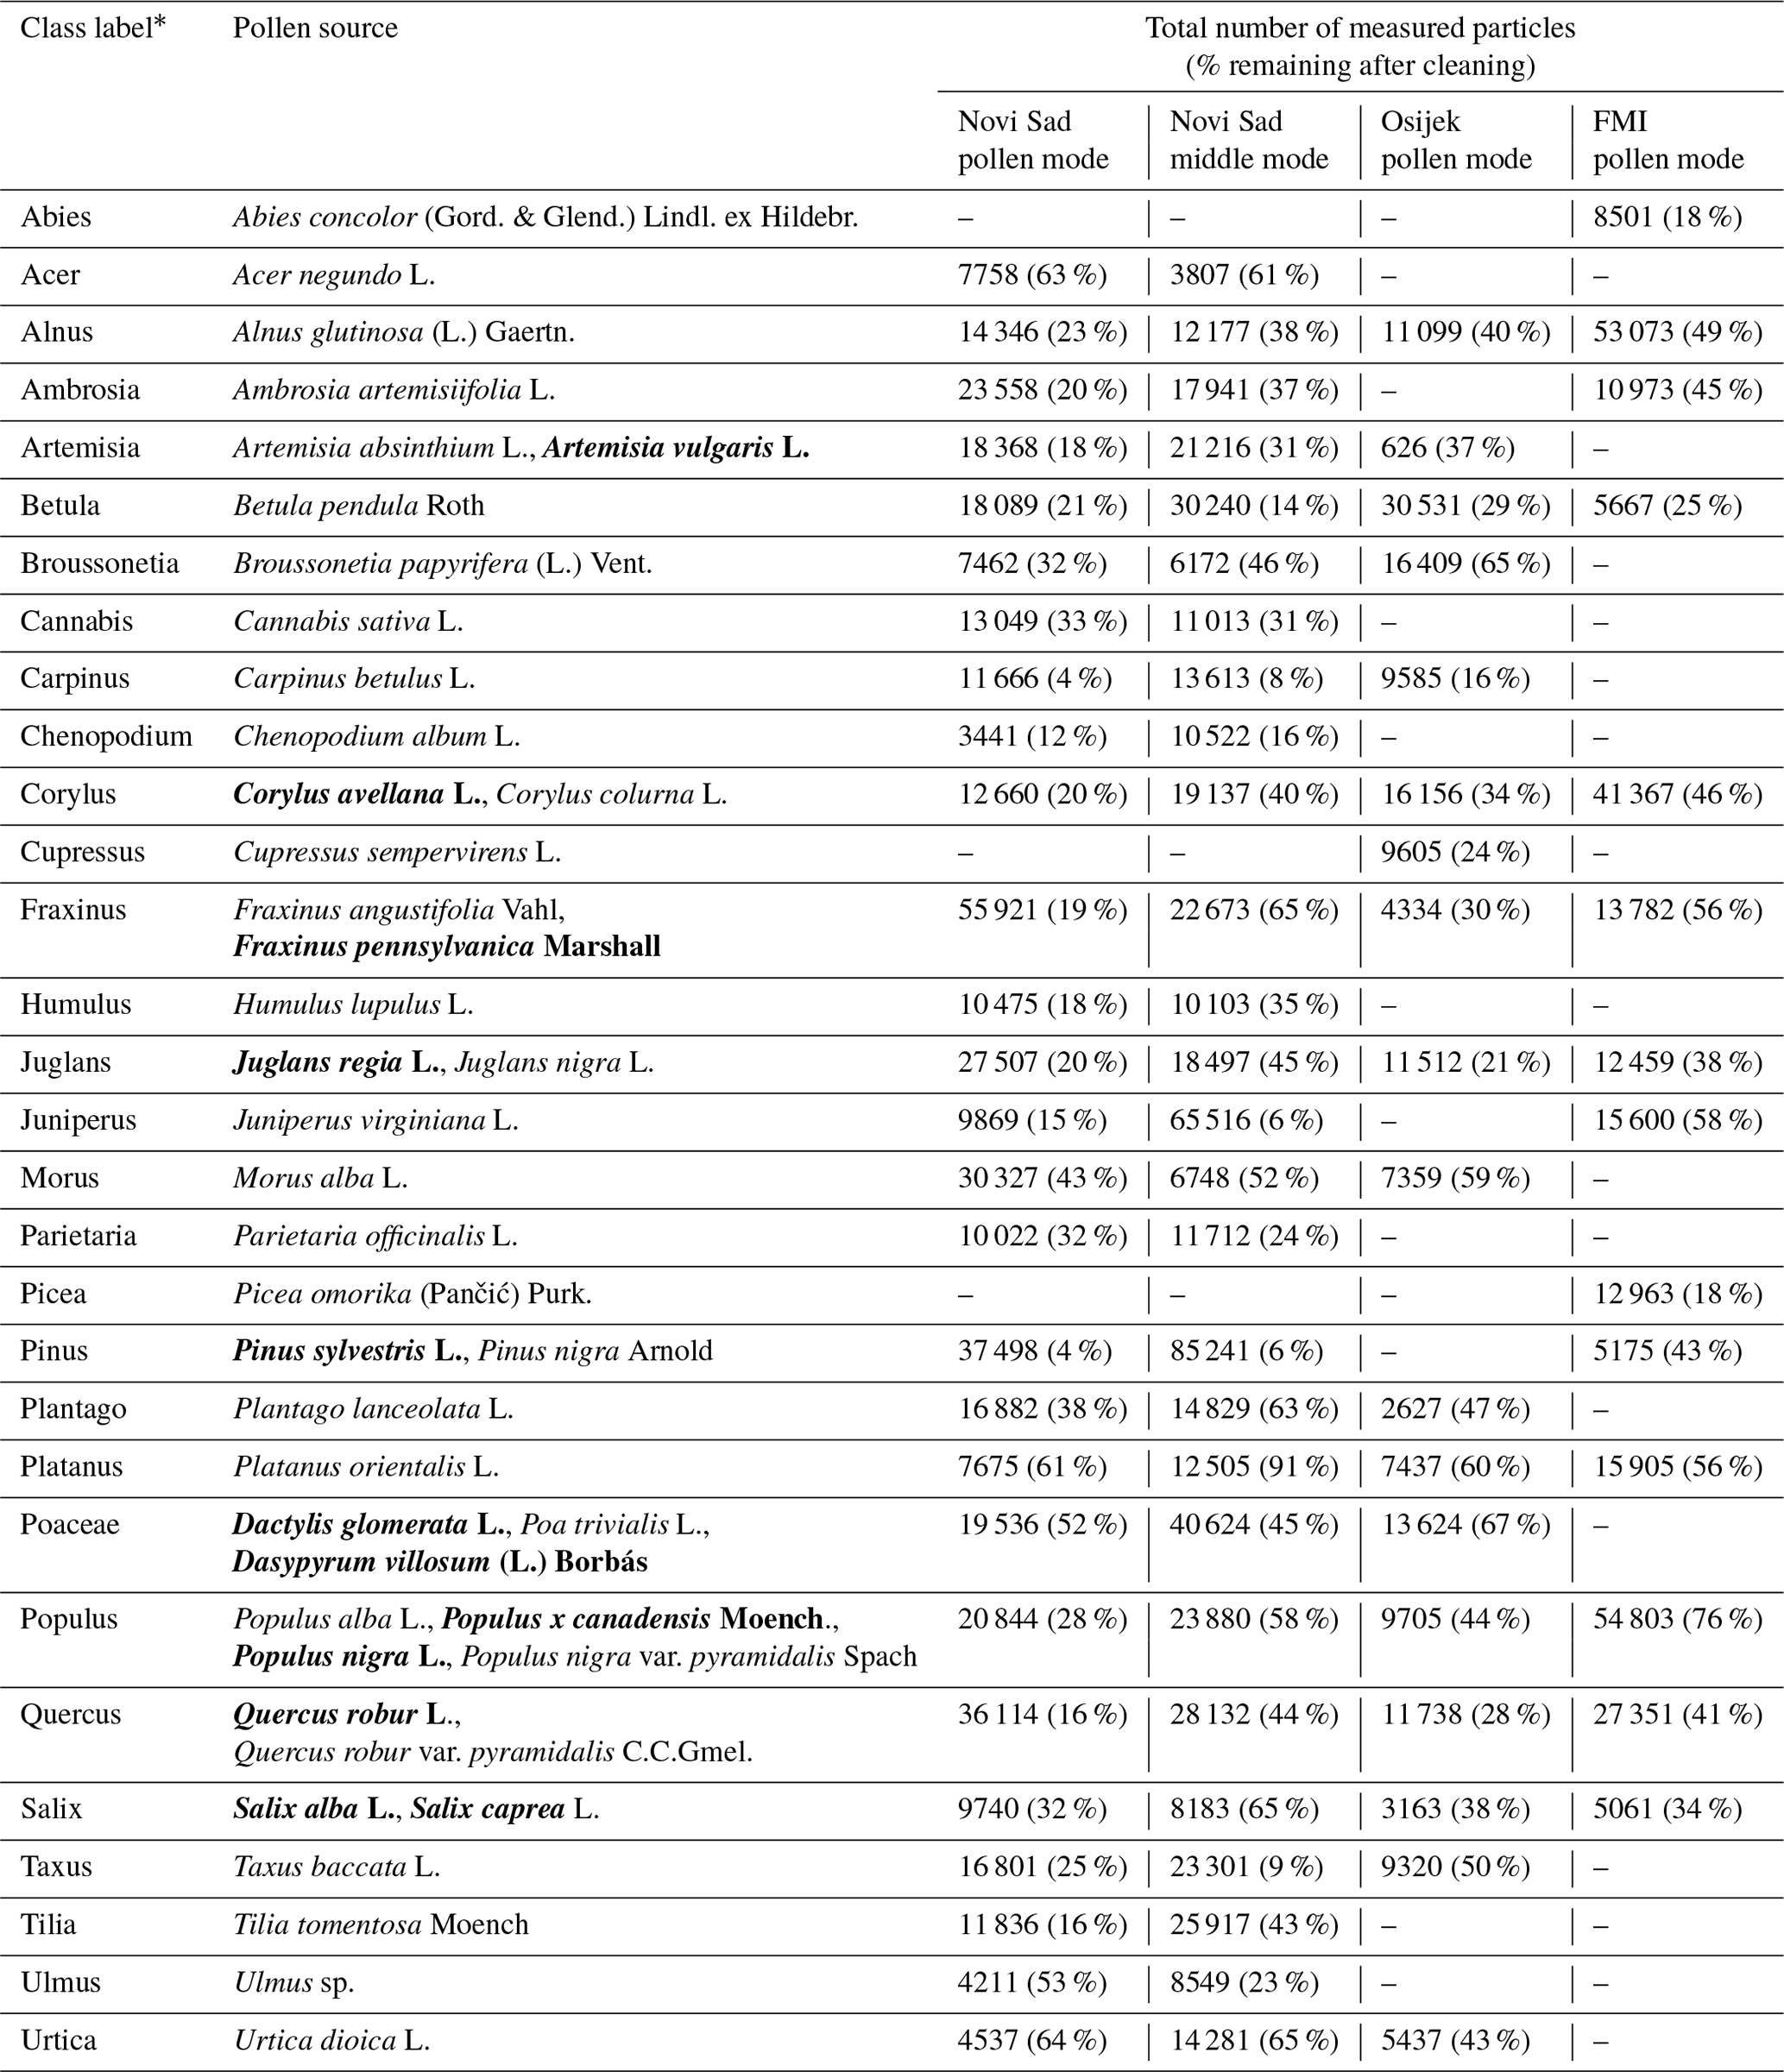
* The class labels do not fully represent the taxonomic rank (i.e. with pollen in reference data coming only from one or several species of the respective taxonomic category) and are thus not written in italics.
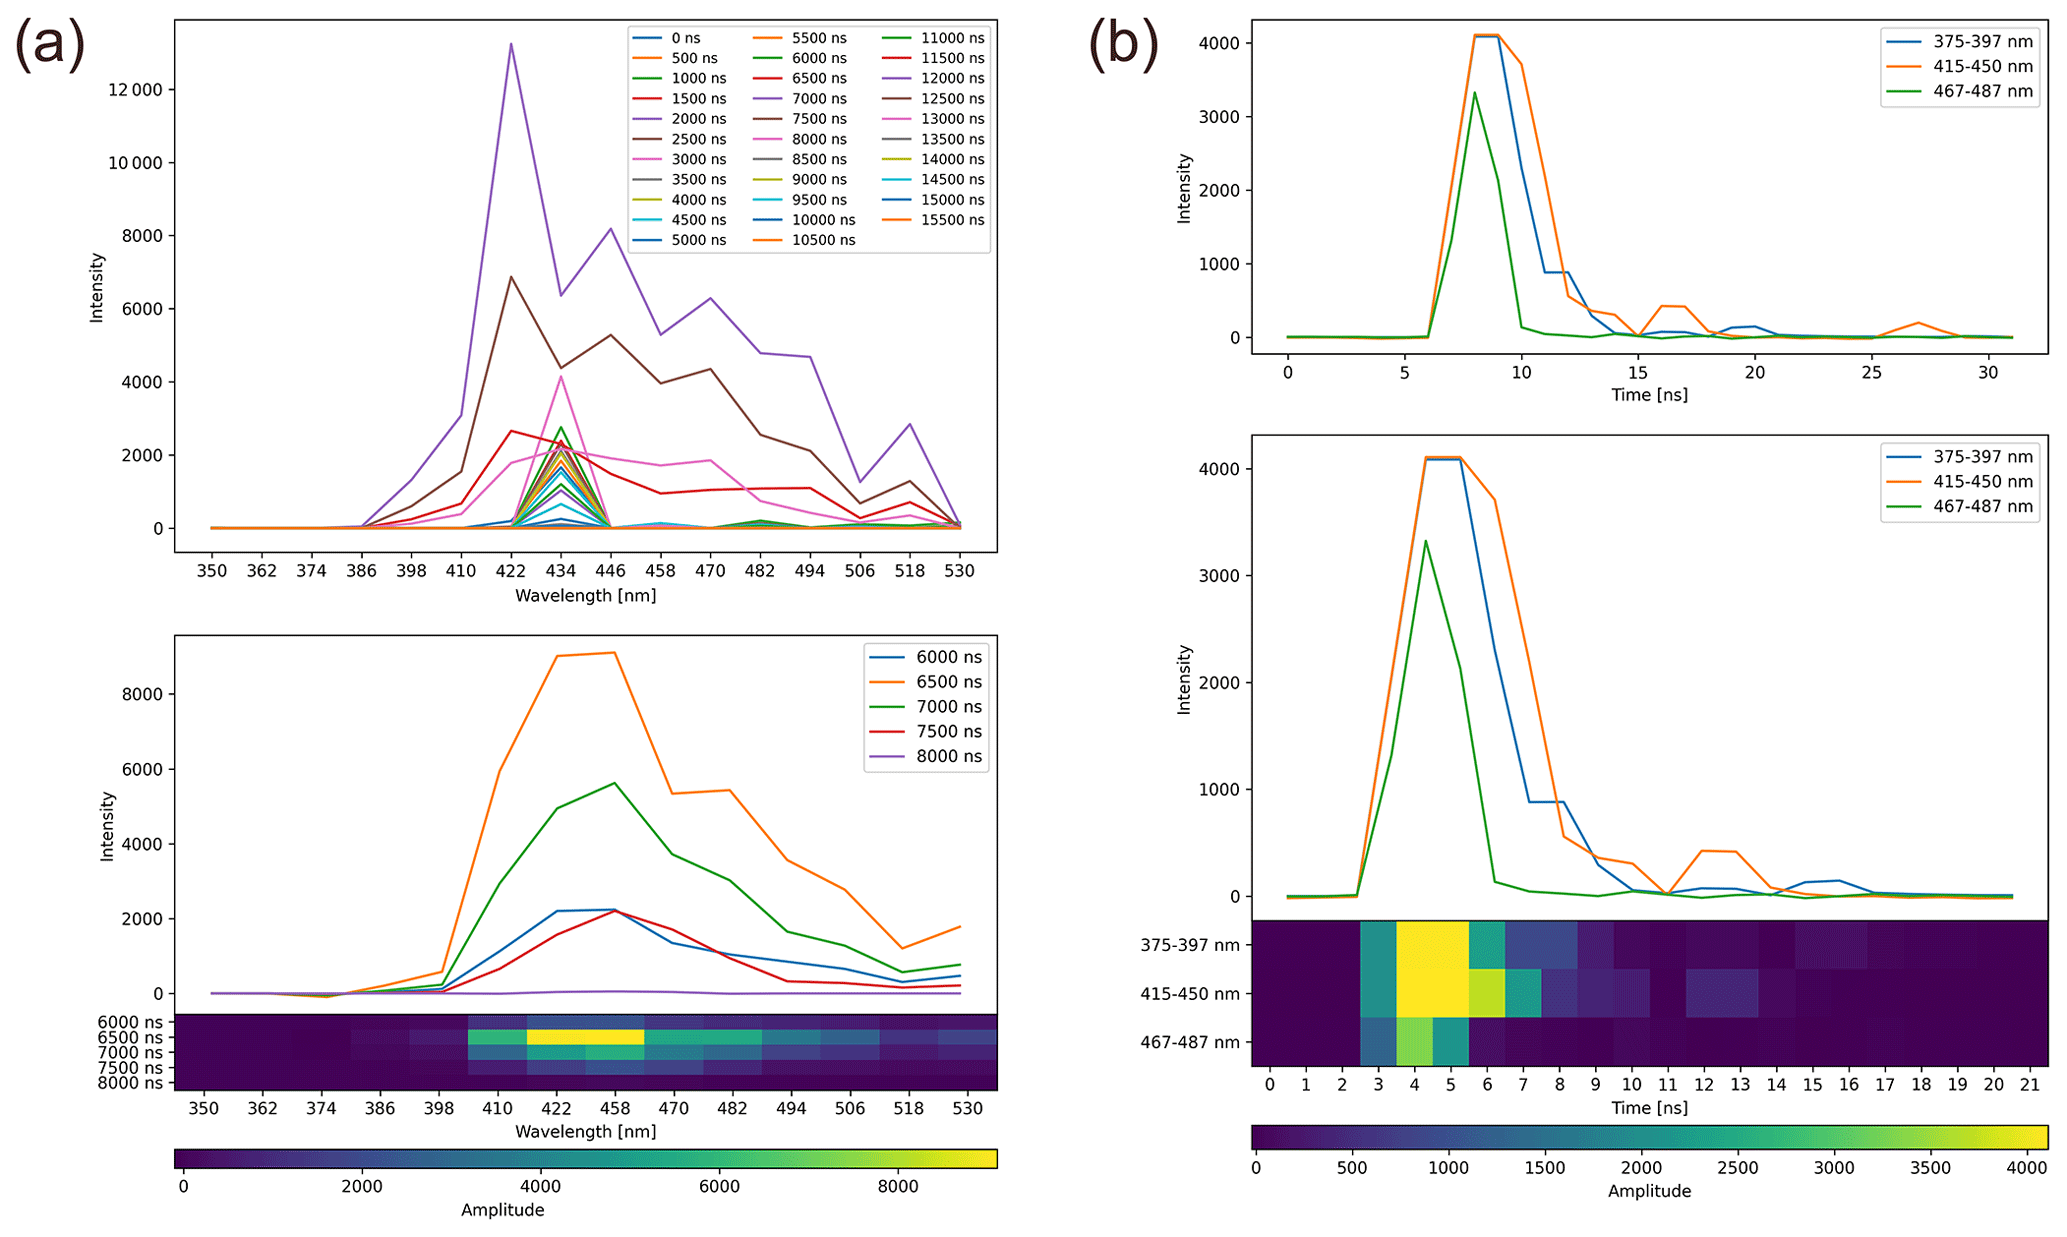
Figure B1Preprocessing of Rapid-E+ single-Betula-pollen-particle fluorescence measurements: (a) spectrum and (b) lifetime. Upper panel, raw signal; middle panel, selection of suitable measurements from raw signal; lower panel, image-like smoothed and normalized format used as input for the neural network. The y axis is unitless.
Table B1Feature extractors for each data type. The convolutional layers are represented as N × M, F, where N × M represents the filter size for the 2D convolution, while F represents the number of feature maps.
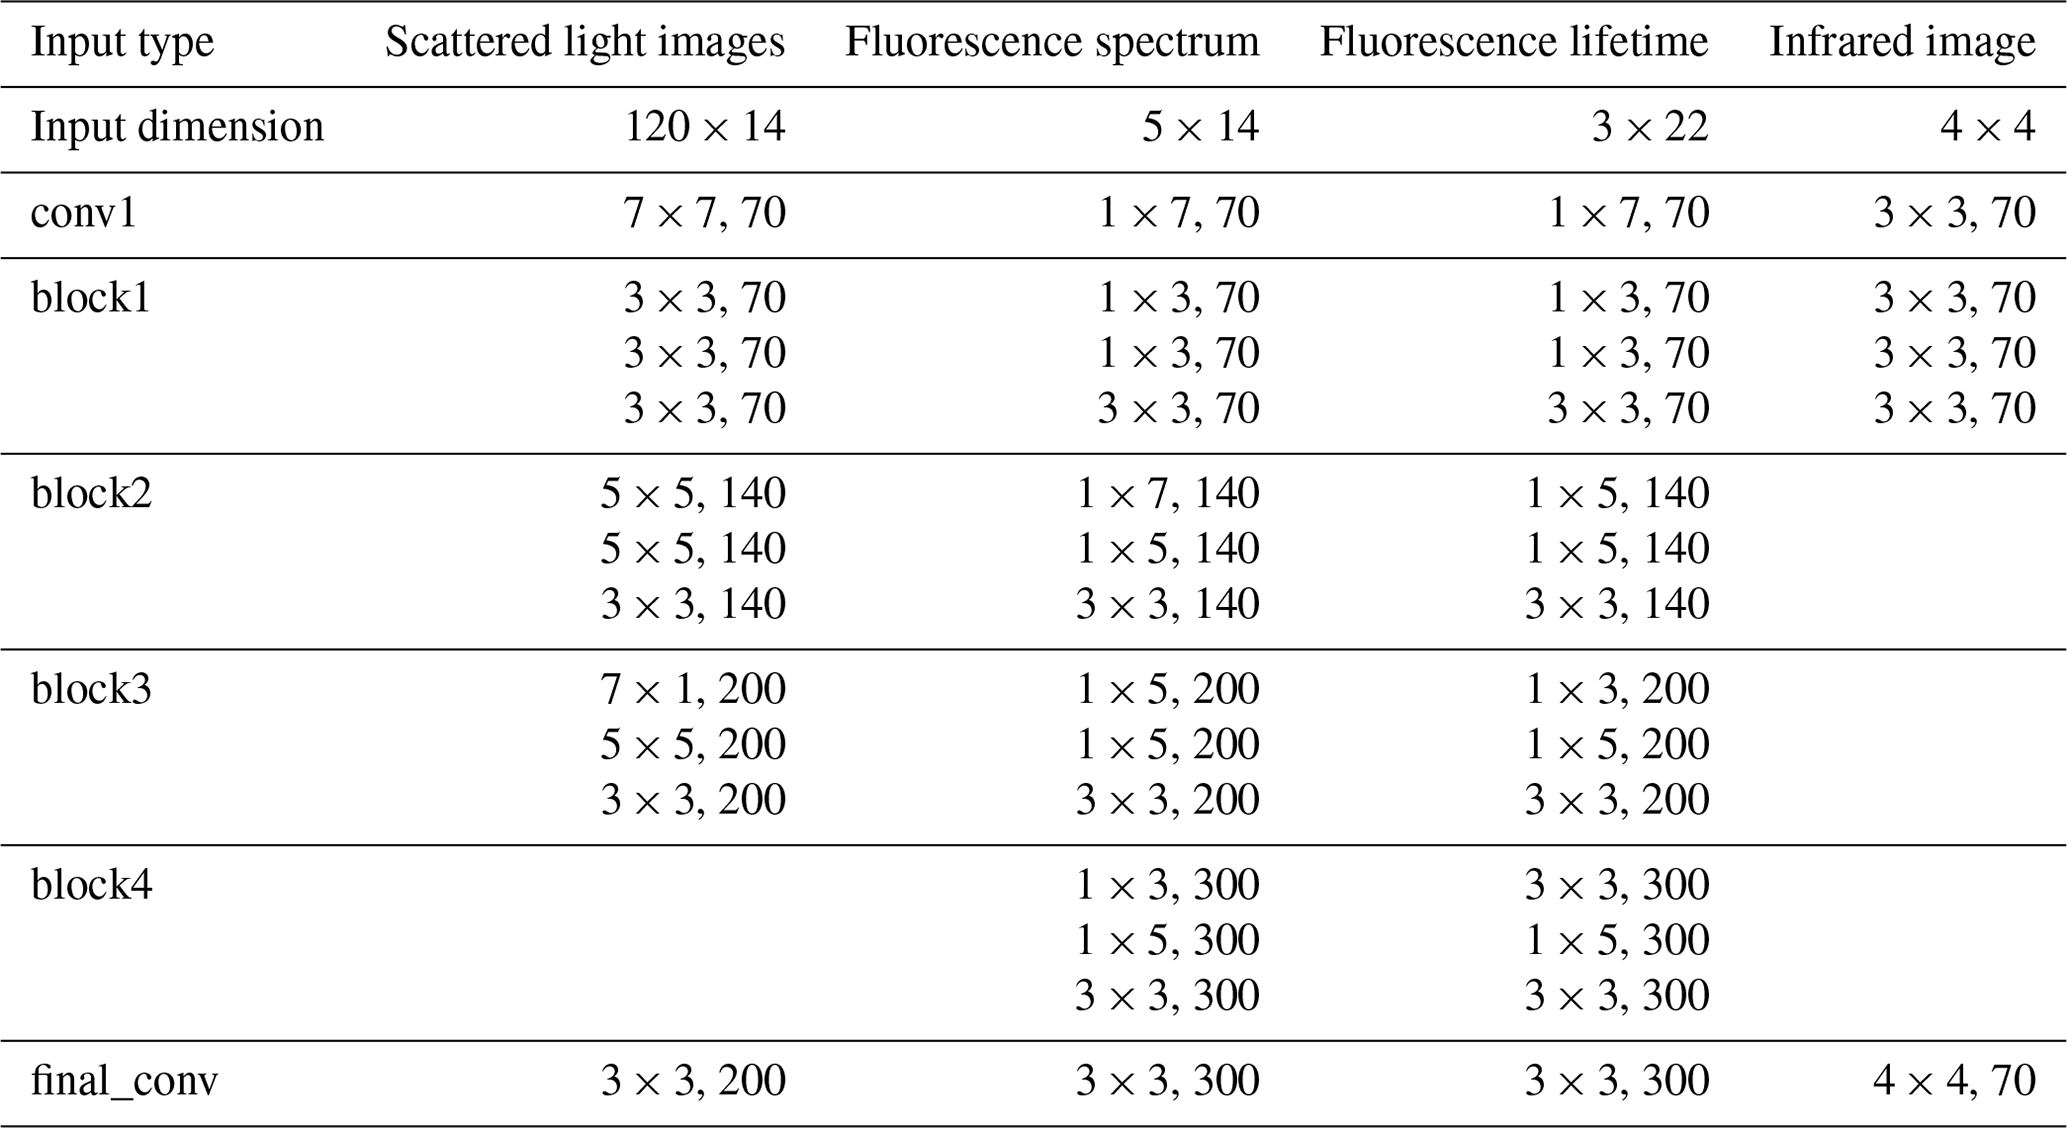
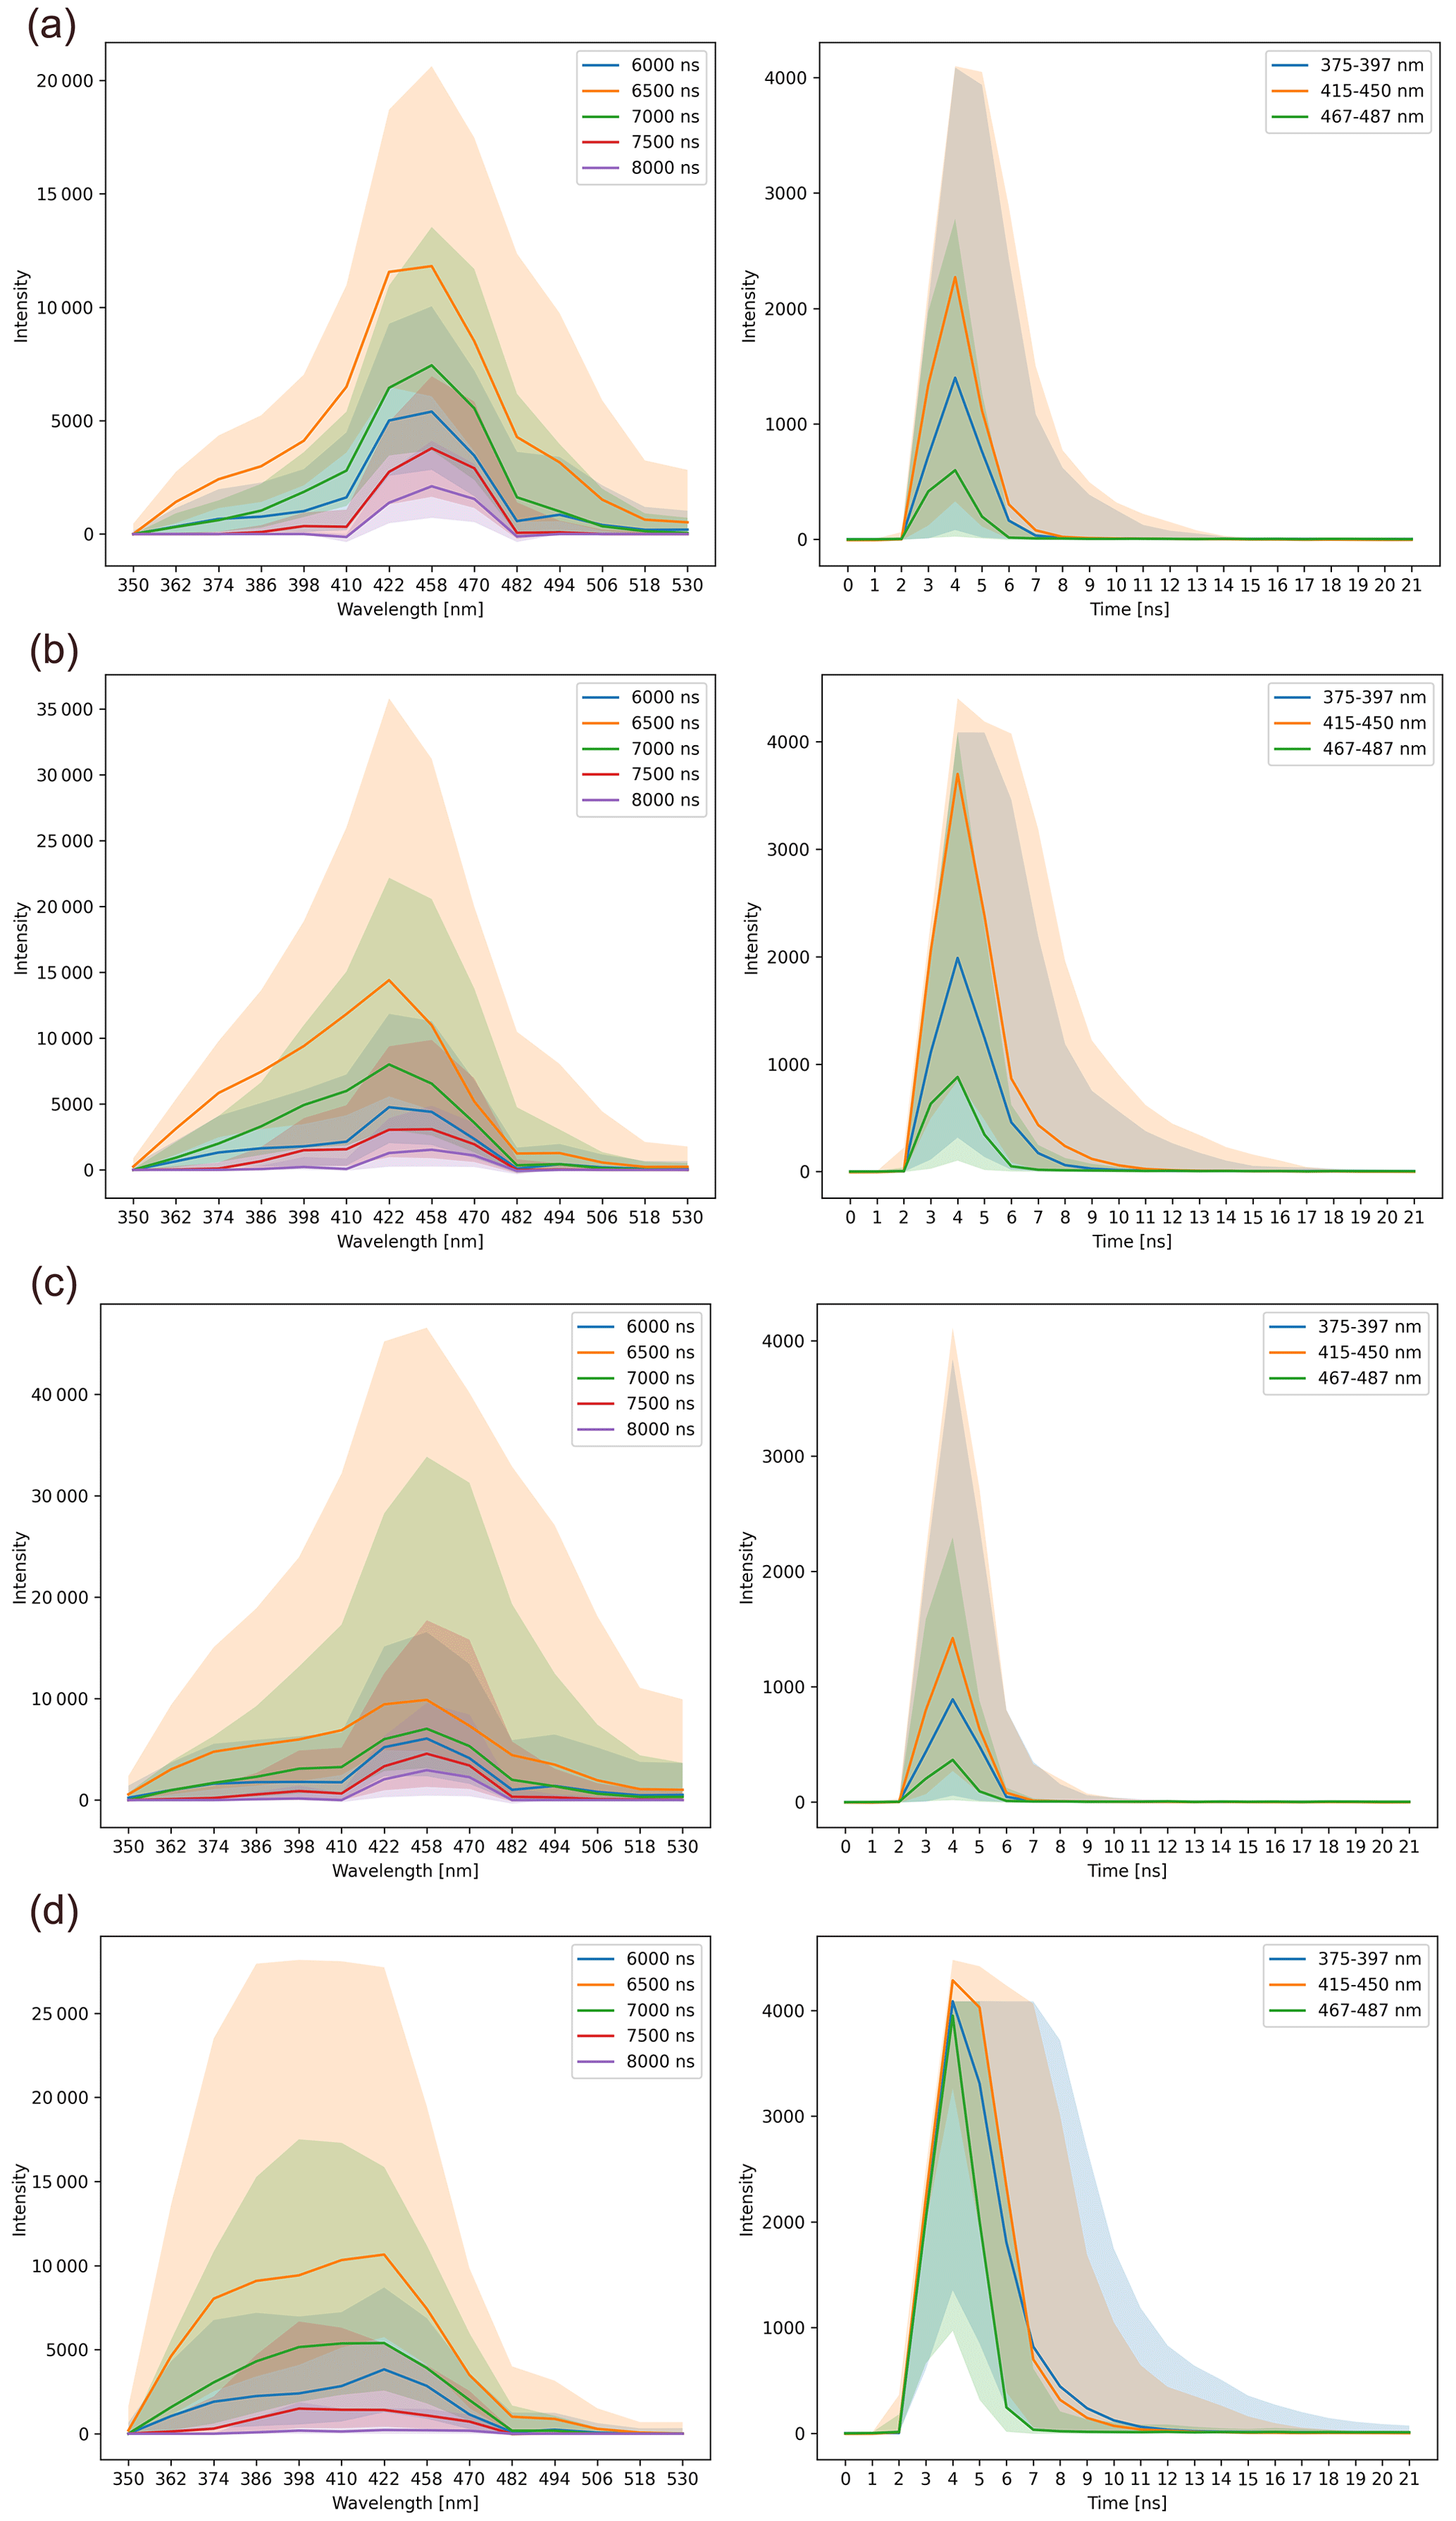
Figure B2Median (with the interquartile range 25th–75th percentiles depicted by the area around lines) fluorescence spectrum (left side) and lifetime (right side) measurements after preprocessing for (a) Betula pendula, (b) Fraxinus pennsylvanica, (c) Juglans regia, and (d) Platanus orientalis reference pollen measured in pollen mode on the Novi Sad Rapid-E+ device. The y axis is unitless.
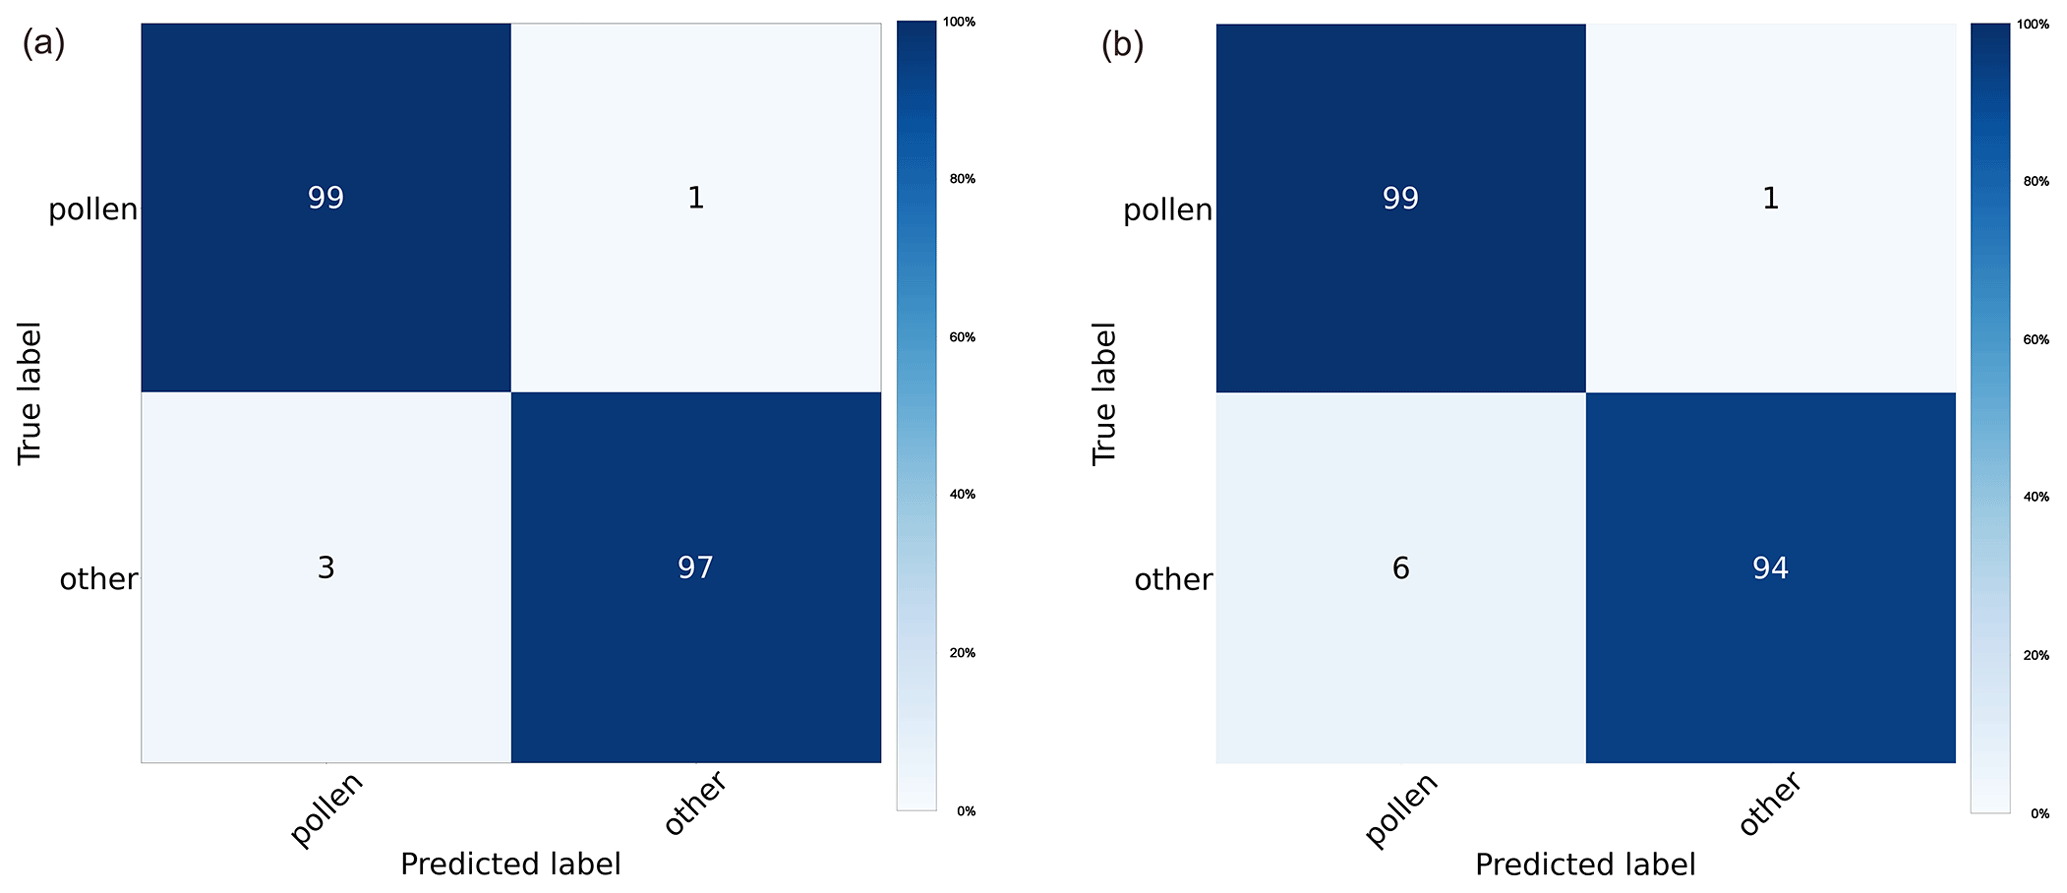
Figure C1Confusion matrices depicting the performance of the classification model in discriminating pollen from other bioaerosols on the test dataset measured in (a) pollen mode and (b) middle mode.
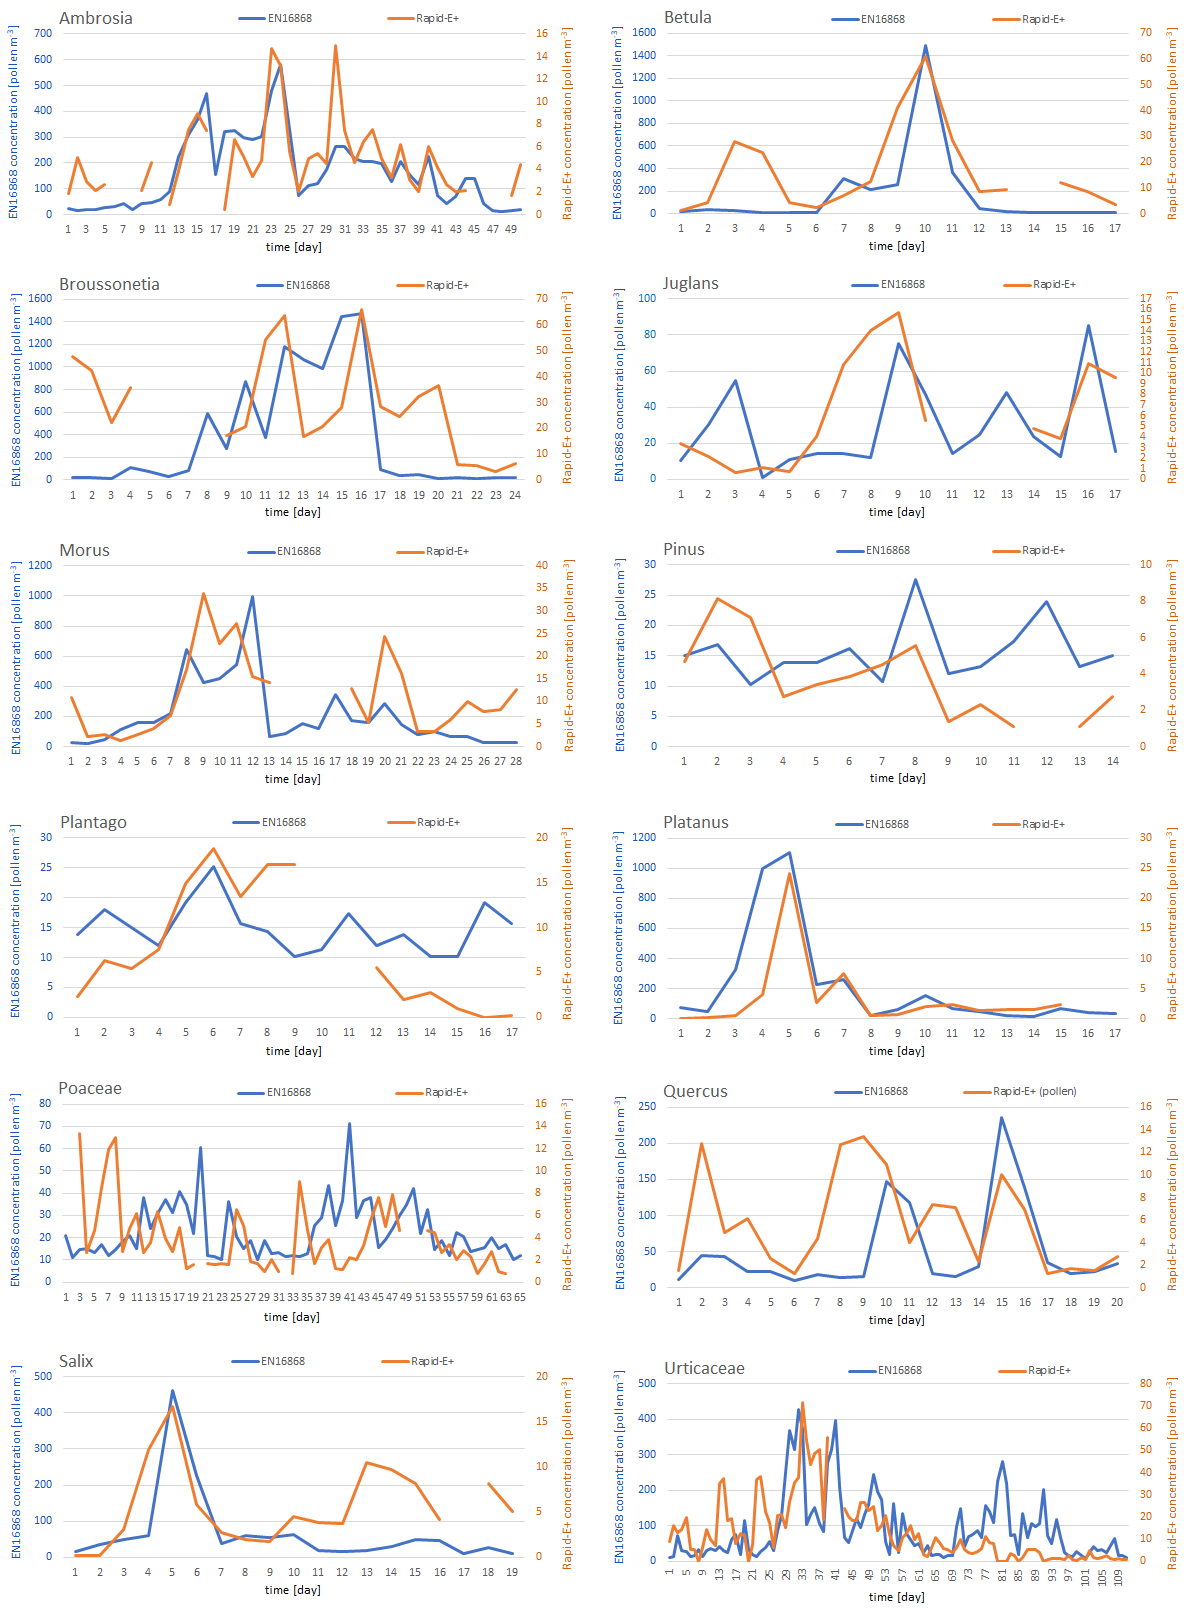
Figure C2Daily pollen concentrations measured side by side using the Rapid-E+ device (orange) and the standard EN 16868 method (blue) for pollen classes with concentrations exceeding 10 pollen m−3 at least 10 d (note the difference in y-axis scales). Rapid-E+ records affected by collecting reference datasets and interruptions in measurements were removed.
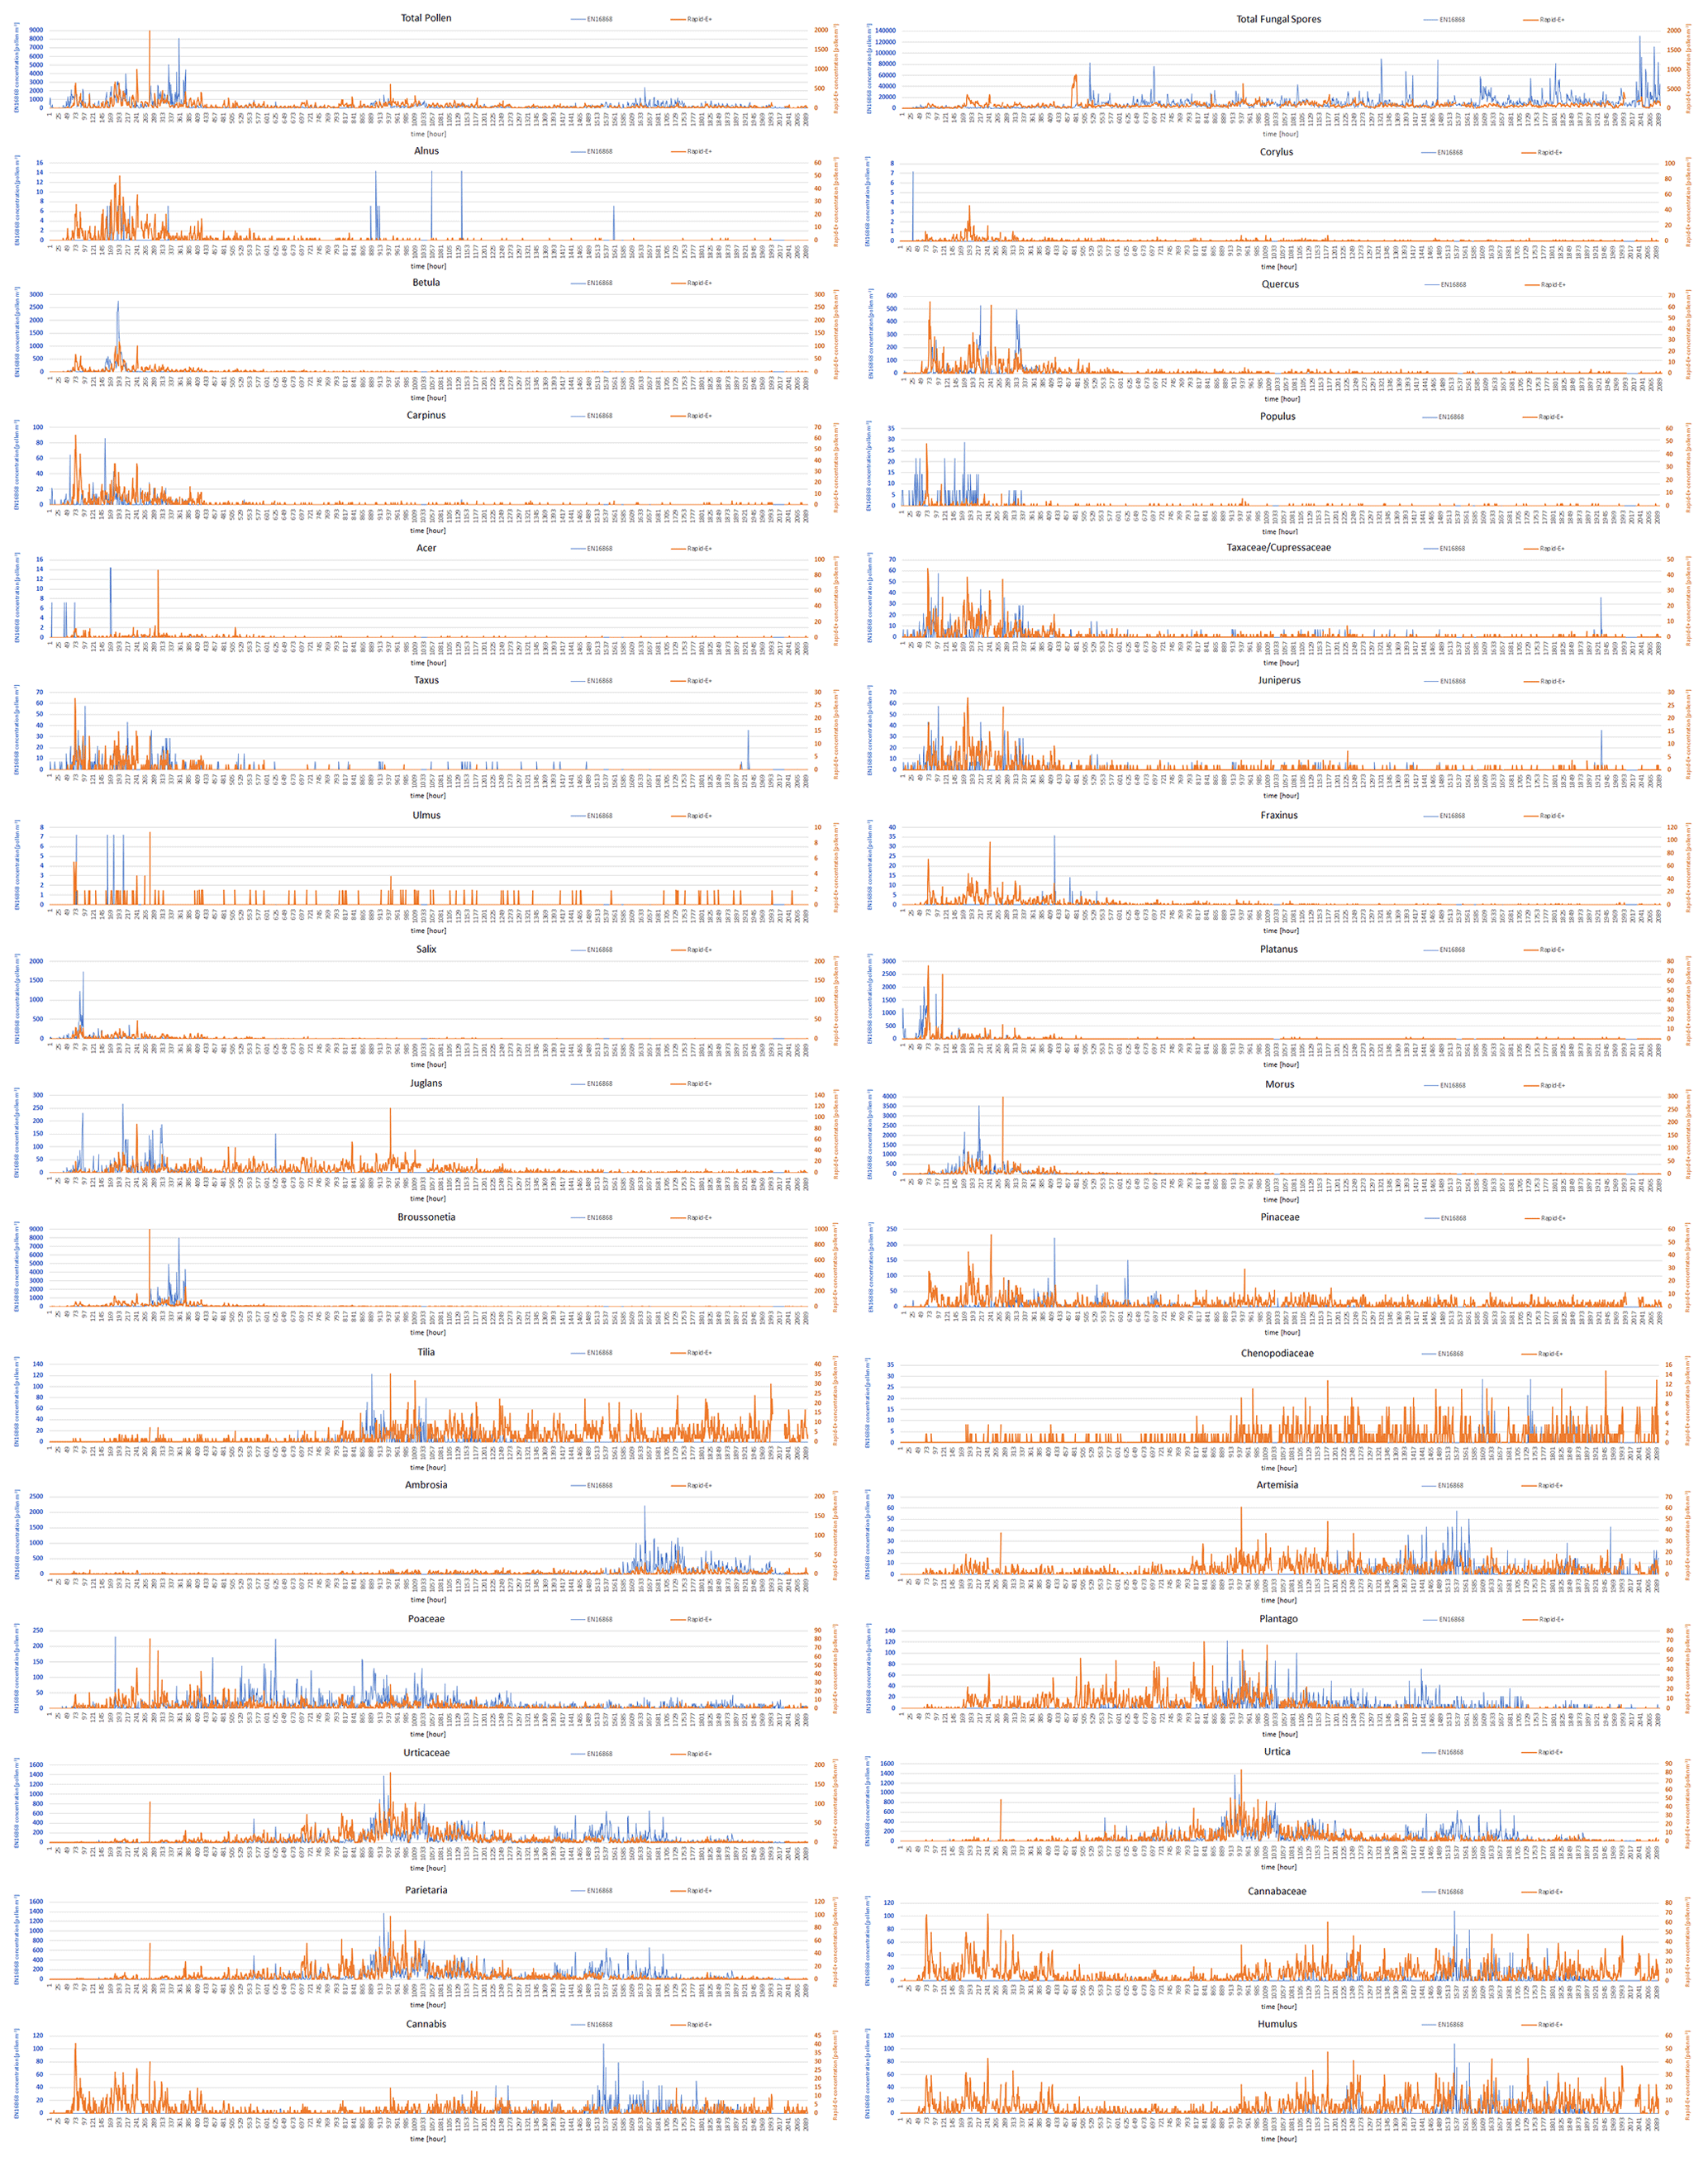
Figure C3Two-hourly pollen and total fungal spore concentrations measured side by side using the Rapid-E+ device (orange) in pollen mode and the standard EN 16868 method (blue) (note the difference in y-axis scales). Rapid-E+ records affected by collecting reference datasets and interruptions in measurements were removed.
The equation below is for calculating particle size (nm) from features of the scattering signal. The formula is supplied by the manufacturer with a reference to data collected during the device calibration at the Swiss Federal Institute of Metrology.
where USum is the sum of all pixels of the perpendicular polarization, DSum is the sum of all pixels of the parallel polarization, UMax is the maximum of the sum of all pixels of the perpendicular polarization, DMax is the maximum of the sum of all pixels of the parallel polarization, UDur is the duration of the perpendicular polarization, and DDur is the duration of the parallel polarization.
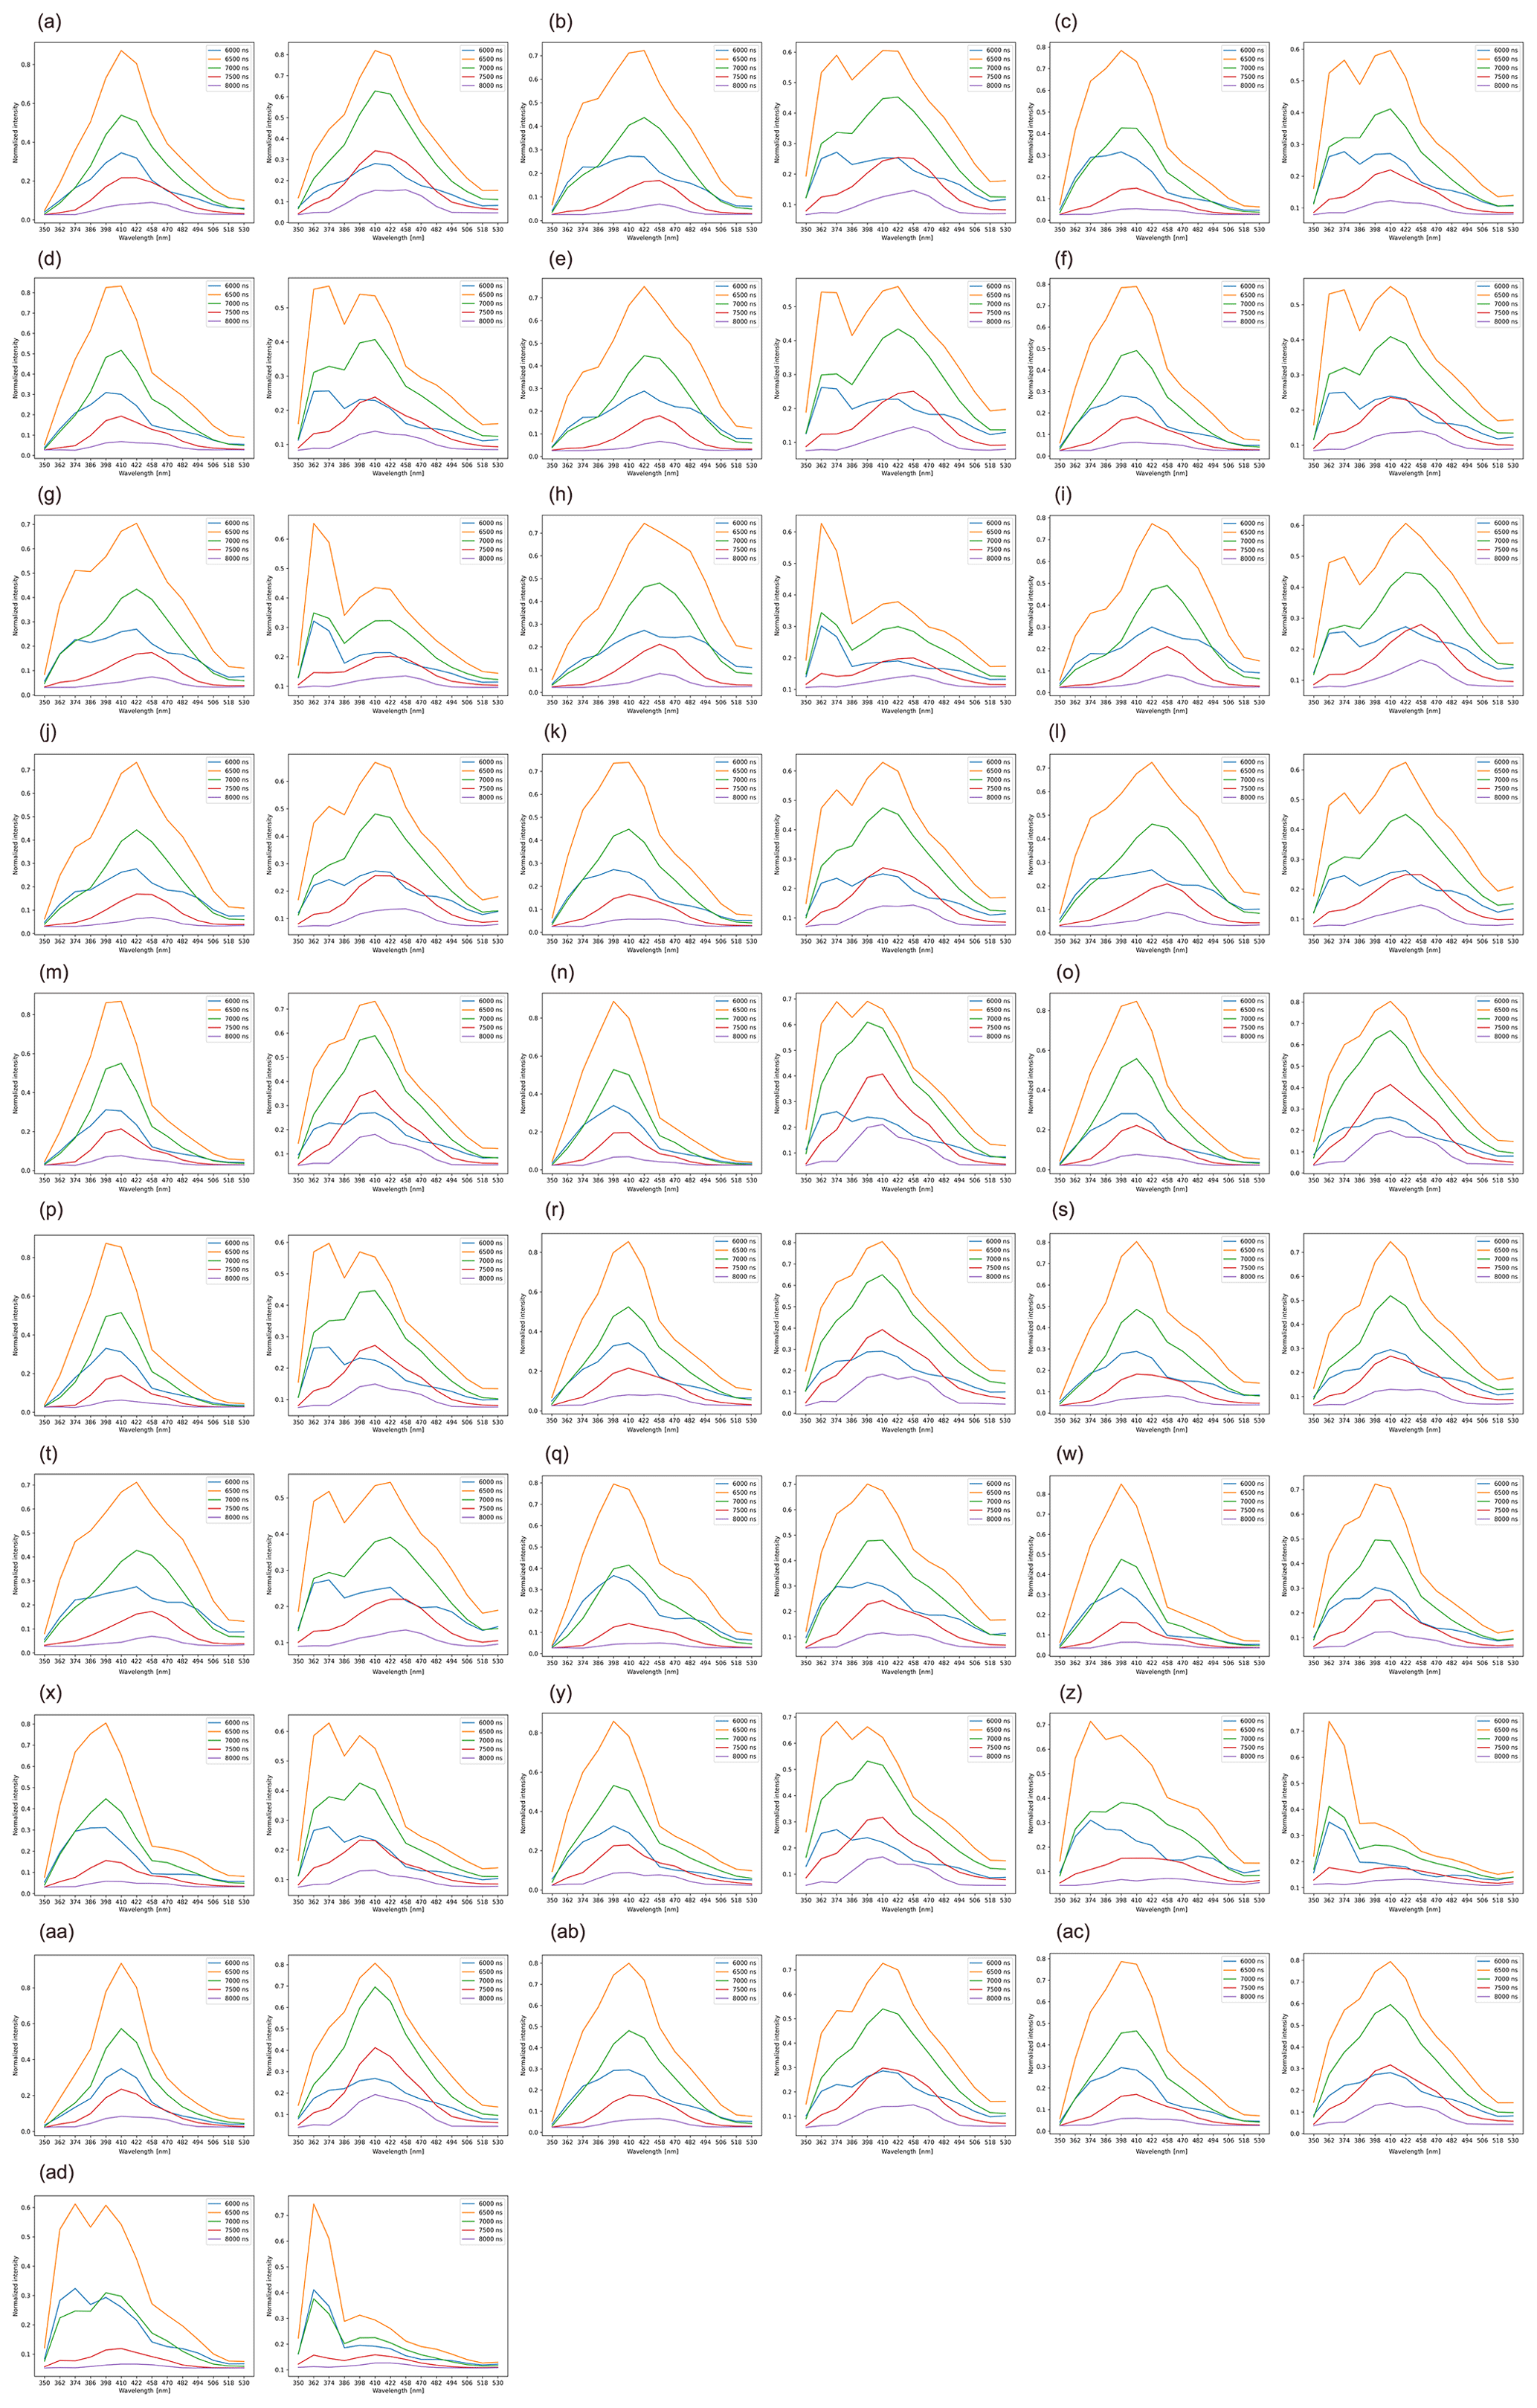
Figure E1Average normalized fluorescence spectrum in pollen mode (left side) and middle mode (right side) measured using the Novi Sad Rapid-E+ device for reference pollen: (a) Acer, (b) Alnus, (c) Ambrosia, (d) Artemisia, (e) Betula, (f) Cannabis, (g) Carpinus, (h) Chenopodium, (i) Corylus, (j) Fraxinus, (k) Humulus, (l) Juglans, (m) Morus, (n) Broussonetia, (o) Urtica, (p) Parietaria, (r) Poaceae, (s) Populus, (t) Quercus, (q) Salix, (w) Taxus, (x) Juniperus, (y) Tilia, (z) Pinus, (aa) Ulmus, (ab) Plantago, (ac) Platanus, and (ad) “other”. The y axis is unitless.
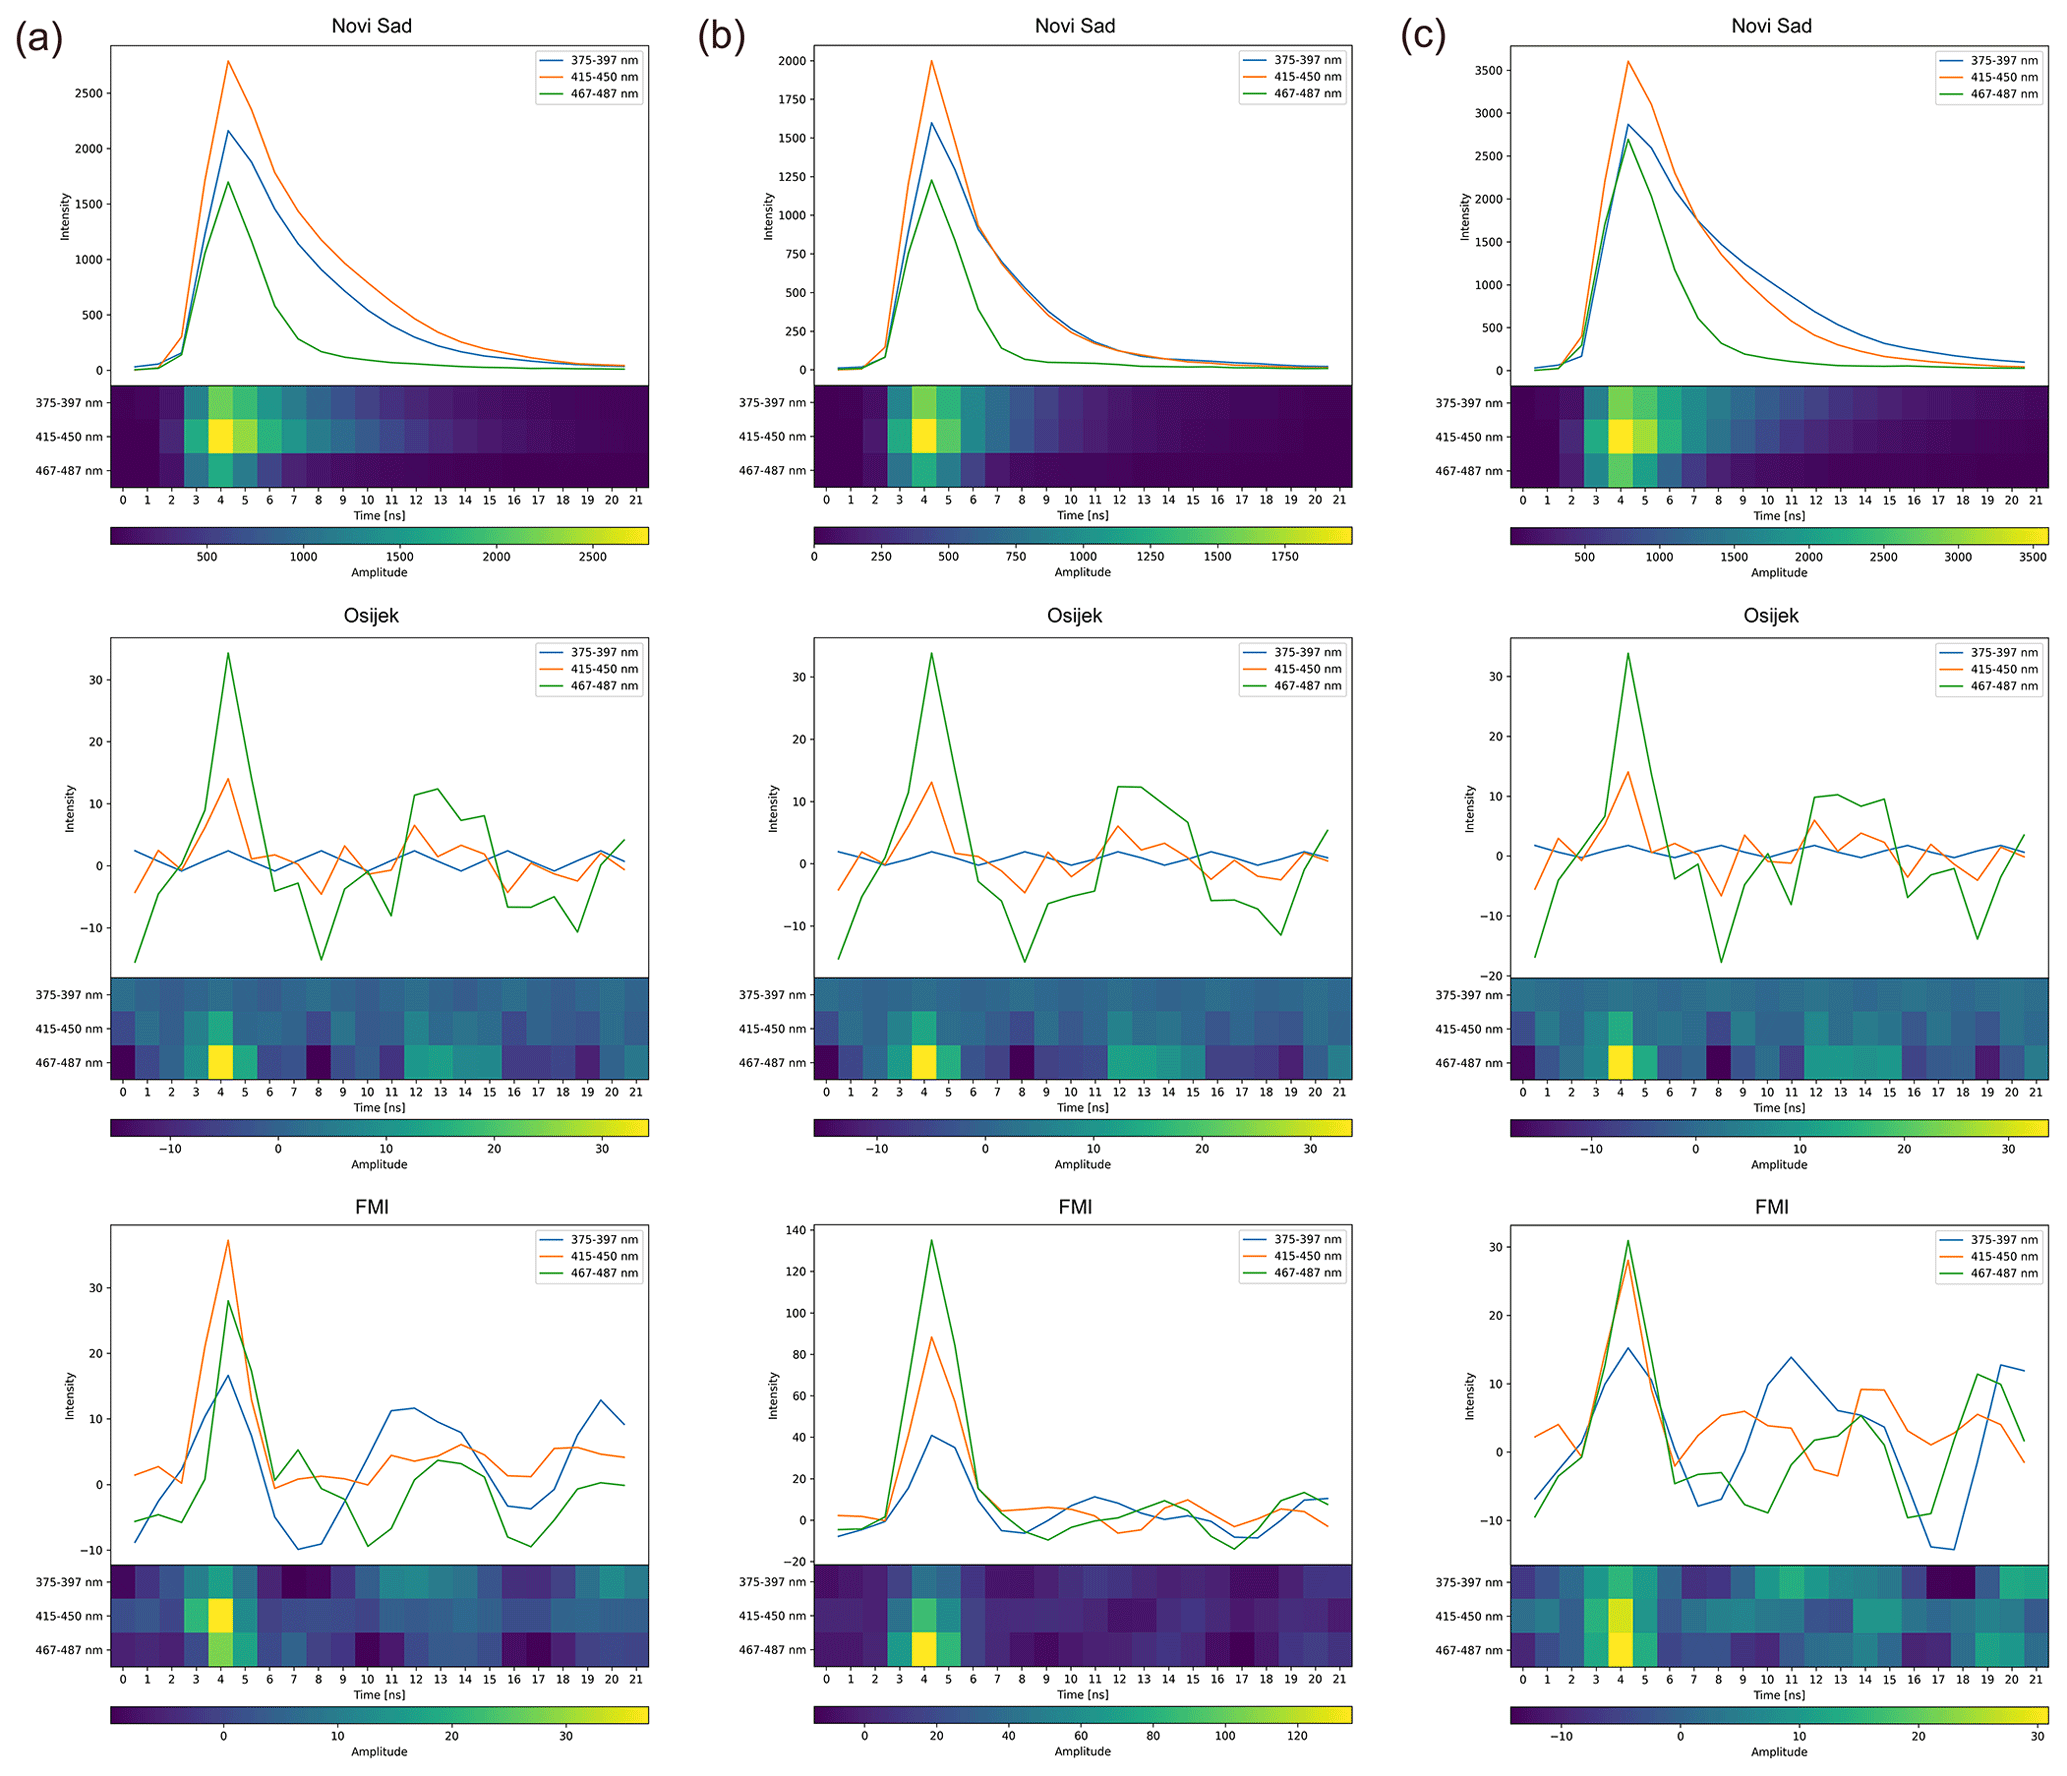
Figure F1Comparison of (a) Fraxinus, (b) Juglans, and (c) Platanus pollen average fluorescence lifetime measurements in pollen mode after preprocessing on Novi Sad, Osijek, and FMI Rapid-E+ devices. The regular and normalized image-like formats used by the neural network are presented. The y axis is unitless.
The model code and the training dataset are available at https://doi.org/10.23728/B2SHARE.31ADB0E9A5BF408DB47DAC1721B57BFA (Matavulj, 2024) (note the low transferability of this information).
BS: conceptualization; observational data preparation, processing, and evaluation; formal analysis; writing (original draft); financial, managerial, and administrative support. PM: formal analysis. IS: observational data preparation, processing, and evaluation. PR: observational data preparation, processing, and evaluation. SB: formal analysis. VM: formal analysis. DT: formalanalysis. EK: observational data preparation, processing, and evaluation. JP: observational data preparation, processing, and evaluation. MS: writing, reviewing, and editing; financial, managerial, and administrative support.
The contact author has declared that none of the authors has any competing interests.
Publisher’s note: Copernicus Publications remains neutral with regard to jurisdictional claims made in the text, published maps, institutional affiliations, or any other geographical representation in this paper. While Copernicus Publications makes every effort to include appropriate place names, the final responsibility lies with the authors.
The authors acknowledge the support of the EU Horizon Europe project SYLVA (grant no. 101086109) and the Ministry of Science, Technological Development and Innovation of the Republic of Serbia (grant no. 200358).
This research has been supported by the EU Horizon Europe project SYLVA (grant no. 101086109) and the Ministarstvo Prosvete, Nauke i Tehnološkog Razvoja, Republike Srbije (grant no. 200358).
This paper was edited by Francis Pope and reviewed by two anonymous referees.
Brdar, S., Panić, M., Matavulj, P., Stanković, M., Bartolić, D., and Šikoparija, B.: Explainable AI for unveiling deep learning pollen classification model based on fusion of scattered light patterns and fluorescence spectroscopy, Sci. Rep.-UK, 13, 3205, https://doi.org/10.1038/s41598-023-30064-6, 2023.
Bruffaerts, N., Graf, E., Matavulj, P., Tiwari, A., Pyrri, I., Zeder, Y., Erb, S., Plaza, M., Dietler, S., Bendinelli, T., D'hooge, E., and Sikoparija, B.: Advancing automated identification of airborne fungal spores: guidelines for cultivation and reference dataset creation, Aerobiologia, in review, 2024.
Buters, J., Clot, B., Galán, C., Gehrig, R. Gilge, S. Hentges, F., O'Connor, D., Sikoparija, B., Skjøth, C., Tummon, F., Adams-Groom, B., Antunes, C., Bruffaerts, N., Celenk, S., Crouzy, B., Guillaud, G., Hajkova, L., Seliger, A., Oliver, G., Ribeiro, H., Rodinkova, V., Saarto, A., Sauliene, I., Sozinova, O., and Stjepanovic, B.: Automatic detection of airborne pollen: an overview, Aerobiologia, 40, 13–37, https://doi.org/10.1007/s10453-022-09750-x, 2022.
CEN: EN 16868: Ambient air - Sampling and analysis of airborne pollen grains and fungal spores for networks related to allergy - Volumetric Hirst method, CEN, 2019.
Crouzy, B., Stella, M., Konzelmann, T., Calpini, B., and Clot, B.: All-optical automatic pollen identification: Towards an operational system, Atmos. Environ., 140, 202–212, https://doi.org/10.1016/j.atmosenv.2016.05.062, 2016.
Daunys, G., Šukienė, L., Vaitkevičius, L., Valiulis, G., Sofiev, M., and Šaulienė, I.: Comparison of computer vision models in application to pollen classification using light scattering, Aerobiologia, 40, 109–121, https://doi.org/10.1007/s10453-022-09769-0, 2022.
Galán, C., Ariatti, A., Bonini, M., Clot, B., Crouzy, B., Dahl, A., Fernandez-González, D., Frenguelli, G., Gehrig, R., Isard, S., Levetin, E., Li, D. W., Mandrioli, P., Rogers, C. A., Thibaudon, M., Sauliene, I., Skjoth, S., Smith, M., and Sofiev, M.: Recommended terminology for aerobiological studies, Aerobiologia, 33, 293–295, https://doi.org/10.1007/s10453-017-9496-0, 2017.
Galán, C., Smith, M., Damialis, A., Frenguelli, G., Gehrig, R., Grinn-Gofron, A., Kasprzyk, I., Magyar, D., Oteros, J., Sauliene, I., Thibaudon, T., Sikoparija, B., and EAS QC Working Group: Airborne fungal spore monitoring: between analyst proficiency testing, Aerobiologia, 37, 351–361, https://doi.org/10.1007/s10453-021-09698-4, 2021.
Halbritter, H.: Preparing living pollen material for scanning electron microscopy using 2,2-dimethoxypropane (DMP) and critical-point drying, Biotech. Histochem., 73, 137–143, https://doi.org/10.3109/10520299809140519, 1998.
Halbritter, H., Diethart, B., and Heigl, H.: Betula pendula, PalDat - A palynological database, https://www.paldat.org/pub/Betula_pendula/303759 (last access: 1 December 2023), 2020.
Hirst, J. M.: An automatic volumetric spore trap, Ann. Appl. Biol., 39, 257–265, https://doi.org/10.1111/j.1744-7348.1952.tb00904.x, 1952.
Huffman, J. A., Perring, A. E., Savage, N. J., Clot, B., Crouzy, B., Tummon, F., Shoshanim, O., Damit, B., Schneider, J., Sivaprakasam, V., Zawadowicz, M. A., Crawford, I., Gallagher, M., Topping, D., Doughty, D. C., Hill, S. C., and Pan, Y.: Real-time sensing of bioaerosols: Review and current perspectives, Aerosol Sci. Tech., 54, 465–495, https://doi.org/10.1080/02786826.2019.1664724, 2019.
Lieberherr, G., Auderset, K., Calpini, B., Clot, B., Crouzy, B., Gysel-Beer, M., Konzelmann, T., Manzano, J., Mihajlovic, A., Moallemi, A., O'Connor, D., Sikoparija, B., Sauvageat, E., Tummon, F., and Vasilatou, K.: Assessment of real-time bioaerosol particle counters using reference chamber experiments, Atmos. Meas. Tech., 14, 7693–7706, https://doi.org/10.5194/amt-14-7693-2021, 2021
Matavulj, P.: Machine-learning-based classification model for pollen recognition using Rapid-E+ measurements, B2SHARE EUDAT [code/data set], https://doi.org/10.23728/B2SHARE.31ADB0E9A5BF408DB47DAC1721B57BFA, 2024.
Matavulj, P., Brdar, S., Racković, M., Šikoparija, B., and Athanasiadis, I. N.: Domain adaptation with unlabeled data for model transferability between airborne particle identifiers, Version v1, Zenodo, https://doi.org/10.5281/zenodo.5574164, 2021.
Matavulj, P., Cristofori, A., Cristofolini, F., Gottardini, E., Brdar, S., and Šikoparija, B.: Integration of reference data from different Rapid-E devices supports automatic pollen detection in more locations, Sci. Total Environ., 851, 158234, https://doi.org/10.1016/j.scitotenv.2022.158234, 2022.
Matavulj, P., Panić, M., Šikoparija, B., Tešendić, D., Radovanović, M., and Brdar, S.: Advanced CNN Architectures for Pollen Classification: Design and Comprehensive Evaluation, Appl. Artif. Intell., 37, 2157593, https://doi.org/10.1080/08839514.2022.2157593, 2023.
Maya-Manzano, J. M., Tummon, F., Abt, R., Allan, N., Bunderson, L., Clot, B., Crouzy, B., Erb, S., Gonzalez-Alonso, M., Graf, E., Grewling, L., Haus, J., Kadantsev, E., Kawashima, S., Martinez-Bracero, M., Matavulj, M., Mills, S., Niederberger, E., Lieberherr, G., Lucas, R. W., O'Connor, D. J., Oteros, J. Palamarchuk, J., Pope, F. D., Rojo, J., Schäfer, S., Schmidt-Weber, C., Šikoparija, B., Skjøth, C. A., Sofiev, M., Stemmler, T., Triviño, M., and Buters, J.: Towards European automatic bioaerosol monitoring: Comparison of 9 automatic pollen observational instruments with classic Hirst-type traps, Sci. Total Environ., 866, 161220, https://doi.org/10.1016/j.scitotenv.2022.161220, 2023.
Mimić, G. and Šikoparija, B.: Analysis of airborne pollen time series originating from Hirst-type volumetric samplers–comparison between mobile sampling head oriented toward wind direction and fixed sampling head with two-layered inlet, Aerobiologia, 37, 321–331, https://doi.org/10.1007/s10453-021-09695-7, 2021.
Pöhlker, C., Huffman, J. A., Förster, J.-D., and Pöschl, U.: Autofluorescence of atmospheric bioaerosols: spectral fingerprints and taxonomic trends of pollen, Atmos. Meas. Tech., 6, 3369–3392, https://doi.org/10.5194/amt-6-3369-2013, 2013.
Savitzky, A. and Golay, M. J. E.: Smoothing and Differentiation of Data by Simplified Least Squares Procedures, Anal. Chem., 36, 1627–1639, https://doi.org/10.1021/ac60214a047, 1964.
Šaulienė, I., Šukienė, L., Daunys, G., Valiulis, G., Vaitkevičius, L., Matavulj, P., Brdar, S., Panic, M., Sikoparija, B., Clot, B., Crouzy, B., and Sofiev, M.: Automatic pollen recognition with the Rapid-E particle counter: the first-level procedure, experience and next steps, Atmos. Meas. Tech., 12, 3435–3452, https://doi.org/10.5194/amt-12-3435-2019, 2019.
Šikoparija, B.: Desert dust has a notable impact on aerobiological measurements in Europe, Aeolian Res., 47, 100636, https://doi.org/10.1016/j.aeolia.2020.100636, 2020.
Šikoparija, B., Marko, O., Panić, M., Jakovetić, D., and Radišić, P.: How to prepare a pollen calendar for forecasting daily pollen concentrations of Ambrosia, Betula and Poaceae?, Aerobiologia, 34, 203–217, https://doi.org/10.1007/s10453-018-9507-9, 2018.
Sikoparija, B., Mimić, G., Matavulj, P., Panić, M., Simović, I., and Brdar, S.: Do we need continuous sampling to capture variability of hourly pollen concentrations?, Aerobiologia, 36, 3–7, https://doi.org/10.1007/s10453-019-09575-1, 2020.
Šikoparija, B., Matavulj, P., Mimić, G., Smith, M., Grewling, Ł., and Podraščanin, Z.: Real-time automatic detection of starch particles in ambient air, Agr. Forest Meteorol., 323, 109034, https://doi.org/10.1016/j.agrformet.2022.109034, 2022.
Simović, I., Matavulj, P., and Šikoparija, B.: Manual and automatic quantification of airborne fungal spores during wheat harvest period, Aerobiologia, 39, 227–239, https://doi.org/10.1007/s10453-023-09788-5, 2023.
Smith, M., Matavulj, P., Mimić, G., Panić, M., Grewling, L., and Šikoparija, B.: Why should we care about high temporal resolution monitoring of bioaerosols in ambient air?, Sci. Total Environ., 826, 154231, https://doi.org/10.1016/j.scitotenv.2022.154231, 2022.
Swisens AG: SwisensAtomizer web page at manufacturer internet site, https://www.swisens.ch/en/swisensatomizer (last access: 1 December 2023), 2023.
Tešendić, D., Boberić Krstićev, D., Matavulj, P., Brdar, S., Panić, M., Minić, V., and Šikoparija, B.: RealForAll: Real-time System for Automatic Detection of Airborne Pollen, Enterp. Inf. Syst.-UK, 16, 1793391, https://doi.org/10.1080/17517575.2020.1793391, 2020.
Tummon, F., Bruffaerts, N., Celenk, S., Choël, M., Clot, B., Crouzy, B., Galán, C., Gilge, S., Hajkova, L., Mokin, V., O'Connor, D., Rodinkova, V., Sauliene, I., Sikoparija, B., Sofiev, M., Sozinova, O., Tesendic, D., and Vasilatou, K.: Towards standardisation of automatic pollen and fungal spore monitoring: best practises and guidelines, Aerobiologia, 40, 39–55, https://doi.org/10.1007/s10453-022-09755-6, 2022.