the Creative Commons Attribution 4.0 License.
the Creative Commons Attribution 4.0 License.
 | 05 Sep 2024
A bias-corrected GEMS geostationary satellite product for nitrogen dioxide using machine learning to enforce consistency with the TROPOMI satellite instrument
Daniel J. Jacob
Nicholas Balasus
Laura H. Yang
Heesung Chong
Junsung Park
Hanlim Lee
Gitaek T. Lee
Eunjo S. Ha
Rokjin J. Park
Hyeong-Ahn Kwon
Jhoon Kim
The Geostationary Environment Monitoring Spectrometer (GEMS) launched in February 2020 is now providing continuous daytime hourly observations of nitrogen dioxide (NO2) columns over eastern Asia (5° S–45° N, 75–145° E) with 3.5 × 7.7 km2 pixel resolution. These data provide unique information to improve understanding of the sources, chemistry, and transport of nitrogen oxides (NOx) with implications for atmospheric chemistry and air quality, but opportunities for direct validation are very limited. Here we correct the operational level-2 (L2) NO2 vertical column densities (VCDs) from GEMS with a machine learning (ML) model to match the much sparser but more mature observations from the low Earth orbit TROPOspheric Monitoring Instrument (TROPOMI), preserving the data density of GEMS but making them consistent with TROPOMI. We first reprocess the GEMS and TROPOMI operational L2 products to use common prior vertical NO2 profiles (shape factors) from the GEOS-Chem chemical transport model. This removes a major inconsistency between the two satellite products and greatly improves their agreement with ground-based Pandora NO2 VCD data in source regions. We then apply the ML model to correct the remaining differences, Δ(GEMS–TROPOMI), using the GEMS NO2 VCDs and retrieval parameters as predictor variables. We train the ML model with colocated GEMS and TROPOMI NO2 VCDs, taking advantage of TROPOMI off-track viewing to cover the wide range of effective zenith angles (EZAs) observed by GEMS. The two most important predictor variables for Δ(GEMS–TROPOMI) are GEMS NO2 VCD and EZA. The corrected GEMS product is unbiased relative to TROPOMI and shows a diurnal variation over source regions more consistent with Pandora than the operational product.
- Article
(6928 KB) - Full-text XML
- BibTeX
- EndNote


Nitrogen oxides (NOx ≡ NO + NO2) are reactive trace gases emitted from combustion, lightning, and microbial activity in soils. Emission is mainly as nitrogen oxide (NO), which cycles rapidly with nitrogen dioxide (NO2). This cycling produces tropospheric ozone (O3) and oxidation of NOx produces nitrate particulate matter (PM), with implications for air quality, climate forcing, and nitrogen deposition. Satellite measurements of NO2 vertical column densities (VCDs) by solar backscatter from polar sun-synchronous low Earth orbit (LEO) have been used extensively to monitor NOx emissions and their trends worldwide (Martin et al., 2003; Lamsal et al., 2015; Curier et al., 2014; Duncan et al., 2016; Liu et al., 2017) and to improve understanding of NOx oxidation chemistry (Boersma et al., 2008; Valin et al., 2013; Miyazaki et al., 2017; Beirle and Wagner, 2024).
NO2 has been measured continuously from LEO since 1995, starting with the Global Ozone Monitoring Experiment (GOME) (Burrows et al., 1999), followed by the operational GOME-2 series (Munro et al., 2016). The Ozone Monitoring Instrument (OMI) was launched in 2004 and is providing global daily continuous data at 13×24 km2 nadir resolution (Levelt et al., 2006). The TROPOspheric Monitoring Instrument (TROPOMI) launched on board the Sentinel-5 Precursor (S5P) satellite in 2017 improved the resolution to 3.5×5.5 km2 (Veefkind et al., 2012).
OMI and TROPOMI retrievals of NO2 have been extensively validated using ground-based measurements of NO2 VCDs from sun-staring Pandora spectrometers and Multi-Axis Differential Optical Absorption Spectroscopy (MAX-DOAS) instruments and also by intercomparisons with each other (Herman et al., 2019; Pinardi et al., 2020; Wang et al., 2020; Cai et al., 2022; Gu et al., 2023). TROPOMI NO2 is routinely validated against Pandora, MAX-DOAS, and OMI by the Royal Netherlands Meteorological Institute (KNMI), showing overall good agreement with a −7 % mean bias (Lambert et al., 2023). It has been used to quantify NOx emissions (Goldberg et al., 2019), infer surface NO2 concentrations (Cooper et al., 2020), and evaluate air quality models (Douros et al., 2023).
A limitation with polar sun-synchronous LEO satellites is that they observe a given location at most once per day and at the same time of day. Geostationary satellites can observe at much higher frequency and in principle continuously, providing much denser data and a unique capability for tracking the diurnal cycle of emissions, oxidation chemistry, and pollutant transport. The Geostationary Environment Monitoring Spectrometer (GEMS) was launched onboard the Korea Aerospace Research Institute GEO-KOMPSAT2B (GK2B) satellite in February 2020 in an equatorial plane at 128.2° longitude with a continuous view of eastern Asia at 3.5×7.7 km2 pixel resolution over Korea (Kim et al., 2020). It is now providing the first NO2 observations from geostationary orbit. GEMS is part of a geostationary air quality constellation that includes TEMPO over North America launched in April 2023 (Zoogman et al., 2017) and Sentinel-4 over Europe to be launched in 2025 (Ingmann et al., 2012).
As with all satellite observations, GEMS retrievals take some time to mature. NO2 VCDs (L2 products) are currently retrieved operationally with the version 2.0 algorithm (National Institute of Environmental Research, 2020a). Evaluation of the GEMS NO2 product with four urban Pandora observations in South Korea found an underestimate and disagreements in diurnal patterns (Kim et al., 2023). However, the local Pandora data may not be representative of the 3.5×7.7 km2 GEMS pixels, particularly in urban environments. GEMS evaluation for China found both high and low biases in comparison with ground-based observations and other satellite products (Li et al., 2023; Zhang et al., 2023). Yang et al. (2024) reprocessed the GEMS NO2 version 2.0 data with prior NO2 vertical profiles from the GEOS-Chem chemical transport model (CTM) on a 0.25° × 0.3125° grid and found good agreement with Pandora in Seoul and Beijing including diurnal variations.
Here we introduce a bias-corrected GEMS NO2 product using machine learning (ML) to minimize the biases between GEMS and TROPOMI and provide in this manner a more reliable and consistent satellite product for scientific applications and for improving the GEMS retrieval. Although TROPOMI observes over a limited range of solar zenith angles (SZAs) on account of the overpass time at approximately 13:30 local time (LT), it has off-track viewing to ±50°, providing a range of viewing zenith angles (VZAs) to mimic the wider range of SZAs seen by GEMS. The bias-corrected GEMS product combines the high data density of GEMS with the accuracy of TROPOMI demonstrated by extensive validation and algorithm development (Gu et al., 2023; Eskes et al., 2022). Our approach is as follows. First, we adjust for biases caused by different prior information used in the operational L2 retrievals by applying common prior vertical profiles simulated by GEOS-Chem. Second, we train an ML model using GEMS and TROPOMI NO2 VCDs to minimize differences in colocated data during 2022–2023 using GEMS retrieval parameters as explanatory variables. Third, we apply the trained ML model to the ensemble of GEMS data for July 2022–June 2023, producing a bias-corrected GEMS product that has the temporal coverage of GEMS and is consistent with TROPOMI. We use the ML model to identify the GEMS retrieval parameters associated with the largest discrepancies with TROPOMI and validate this bias-corrected GEMS product with ground-based observations from the Pandora spectrometers.
GEMS is an ultraviolet–visible (UV-VIS) hyperspectral imaging spectrometer that measures solar backscatter with 0.6 nm spectral resolution over eastern Asia (5–45° latitude, 75–145° longitude) with 3.5×7.7 km2 pixels at 37.5° latitude and hourly repeat times (08:45–17:45 LT) (Kim et al., 2020). Total NO2 slant column densities (SCDs) along the sun–satellite light path are retrieved using differential optical absorption spectroscopy (DOAS) (Platt, 1994) with a fitting window of 435–450 nm (National Institute of Environmental Research 2020b; Kim et al., 2020). We use the operational L2 product from version 2.0 (available online: https://nesc.nier.go.kr/en/html/index.do, last access: 19 January 2024).
TROPOMI is similarly a UV-VIS hyperspectral imaging spectrometer with a full width at half maximum (FWHM) of 0.55 nm. It is a push-broom instrument with a wide swath of ∼ 2600 km and an off-track viewing angle of ±50° off-nadir, providing global daily viewing once a day at approximately 13:30 LT with 5.5×3.5 km2 nadir spatial resolution. Total NO2 SCDs are retrieved using DOAS in the 405–465 nm window (van Geffen et al., 2022). Here we use the offline (OFFL) L2 product produced by the KNMI NO2 processor version 2.4.0 (available online: https://dataspace.copernicus.eu/explore-data/data-collections/sentinel-data/sentinel-5p, last access: 19 January 2024).
Ground-based NO2 column measurements from Pandora instruments have been widely used to validate satellite retrievals (Park et al., 2022; Kim et al., 2023; Pinardi et al., 2020; Yang et al., 2024). Pandora spectrometers provide direct-sun observations to retrieve ground-based NO2 VCDs by DOAS using a spectral fitting window of 400–470 nm (Herman et al., 2009). Here we use the L2 total NO2 VCDs processed by the BlickP software (available online: https://www.pandonia-global-network.org, last access: 19 January 2024) at 16 Pandora stations located in northeastern Asia (China, South Korea, Japan) from the Pandonia Global Network (PGN). We select data with quality flags of 0, 1, 10, or 11 and with SZA ≤ 70°.
Spectral fitting of satellite solar backscatter observations yields NO2 SCDs, which must be converted to VCDs, the geophysical quantity more relevant for column interpretation, using air mass factors (AMF = SCD/VCD) (Palmer et al., 2001). Standard retrieval algorithms separate the stratospheric and tropospheric portions of the total VCDs to account for the NO2 background in the stratosphere from oxidation of nitrous oxide (N2O) (Bucsela et al., 2013), but this introduces uncertainty related to the stratosphere–troposphere separation (STS) algorithm, which may differ between retrievals (Geddes et al., 2018) and leads to ambiguity in the allocation of near-tropopause NO2 such as from lightning and aircraft (Travis et al., 2016; Dang et al., 2023). Since the stratospheric background component is readily predictable from CTMs such as GEOS-Chem (Knowland et al., 2022) and the spatial structure in the NO2 column is mainly from the troposphere, the purpose for separating stratosphere and troposphere is in fact not clear. We focus here on total NO2 VCDs as most useful for scientific applications and to avoid STS errors.
The AMF from the surface to the top of the atmosphere (TOA) can be decomposed into two parts, scattering weights and vertical shape factors, as follows:
where w(z) is the scattering weight at altitude z measuring the sensitivity of the instrument to NO2 at altitude z as computed by a radiative transfer model (RTM) and S(z) is the vertical shape factor of normalized number densities obtained from a CTM. Scattering weights for a given wavelength depend on SZA, VZA, relative azimuth angle, surface albedo, and cloud and aerosol optical depths and vertical distributions (Kwon et al., 2019; Hong et al., 2017). The operational GEMS retrieval algorithm uses a lookup table (LUT) of pre-calculated scattering weights from the VLIDORT RTM at 441 nm (Spurr and Christi, 2014). TROPOMI retrievals use a LUT from the Doubling Adding KNMI (DAK) RTM at 437.5 nm (Stammes, 2001).
The vertical shape factor S(z) in Eq. (1) describes how NO2 is distributed with altitude as determined by emissions, chemistry, and transport. It must be prescribed in the retrieval as independent information. The L2 GEMS and TROPOMI retrievals use normalized partial column densities simulated for the local scene by GEOS-Chem (Bey et al., 2001; Yang et al., 2023) at 0.25° × 0.3125° resolution and TM5-MP (Williams et al., 2017; Bucsela et al., 2013) at 1° × 1° resolution, respectively. However, the L2 version 2.0 GEMS product used incorrect GEOS-Chem vertical coordinates. To eliminate differences caused by using different vertical shape factors, we replace the profiles in the GEMS and TROPOMI L2 products with identical GEOS-Chem model profiles extending from the surface to the stratopause. Yang et al. (2023) showed that GEOS-Chem successfully reproduces the vertical profiles of NO2 and their diurnal variations observed over South Korea in the KORUS-AQ aircraft campaign, supporting the use of GEOS-Chem profiles in a common AMF calculation for GEMS and TROPOMI satellite retrievals in eastern Asia. We use monthly mean hourly profiles from a 0.25° × 0.3125° resolution simulation with GEOS-Chem version 13.0.0 (https://doi.org/10.5281/zenodo.4618180, The International GEOS-Chem User Community, 2021). Details on model configuration and emissions can be found in Lee et al. (2024).
Scattering weights are not provided in the GEMS L2 NO2 product; therefore, we use scattering weights calculated by VLIDORT using GEMS geometry and atmospheric conditions at 448 nm, which are provided in the GEMS L2 glyoxal product (National Institute of Environmental Research 2020a). The GEMS glyoxal algorithm uses a spectral fitting window of 433.0–461.5 nm (Ha et al., 2024), which sufficiently overlaps with the NO2 fitting window (435–450 nm). The AMF for the GEMS total column can then be calculated using vertical shape factors from GEOS-Chem, following Eq. (1). The TROPOMI L2 product reports averaging kernels A(z), which normalize the scattering weights to the reported AMF (Eskes and Boersma, 2003).
The AMF for the TROPOMI total column can then be calculated from the GEOS-Chem vertical shape factors as follows:
where AMF is from the L2 product and AMF′ is the reprocessed value using GEOS-Chem vertical shape factors. The TROPOMI product reports A(z) for 34 layers, corresponding to the TM5-MP vertical grid, and we interpolate the values to the 47-layer vertical grid of GEOS-Chem. GEMS pixels with AlgorithmQualityFlags > 112, AMFQualityFlags > 64, and FinalAlgorithmFlags > 1 and TROPOMI pixels with qa_value < 0.75 are filtered out as per quality control recommendations. No other filtering is used. We apply area-weighted regridding to the filtered satellite products and use hourly gridded data at 0.25° × 0.3125° resolution with cloud fraction ≤ 0.3 and SZA ≤ 70° for the remainder of this study.
Figure 1 shows how the reprocessing of AMFs modifies the TROPOMI and GEMS NO2 VCDs compared to the operational L2 products. In what follows, we denote the operational L2 products as “TROPOMI L2” and “GEMS L2” and the products reprocessed with GEOS-Chem vertical profiles as “reprocessed TROPOMI” and “reprocessed GEMS”. The reprocessing increases TROPOMI in the northeastern Asia source regions, including eastern China, South Korea, and Japan. GEMS decreases over eastern China and increases elsewhere.
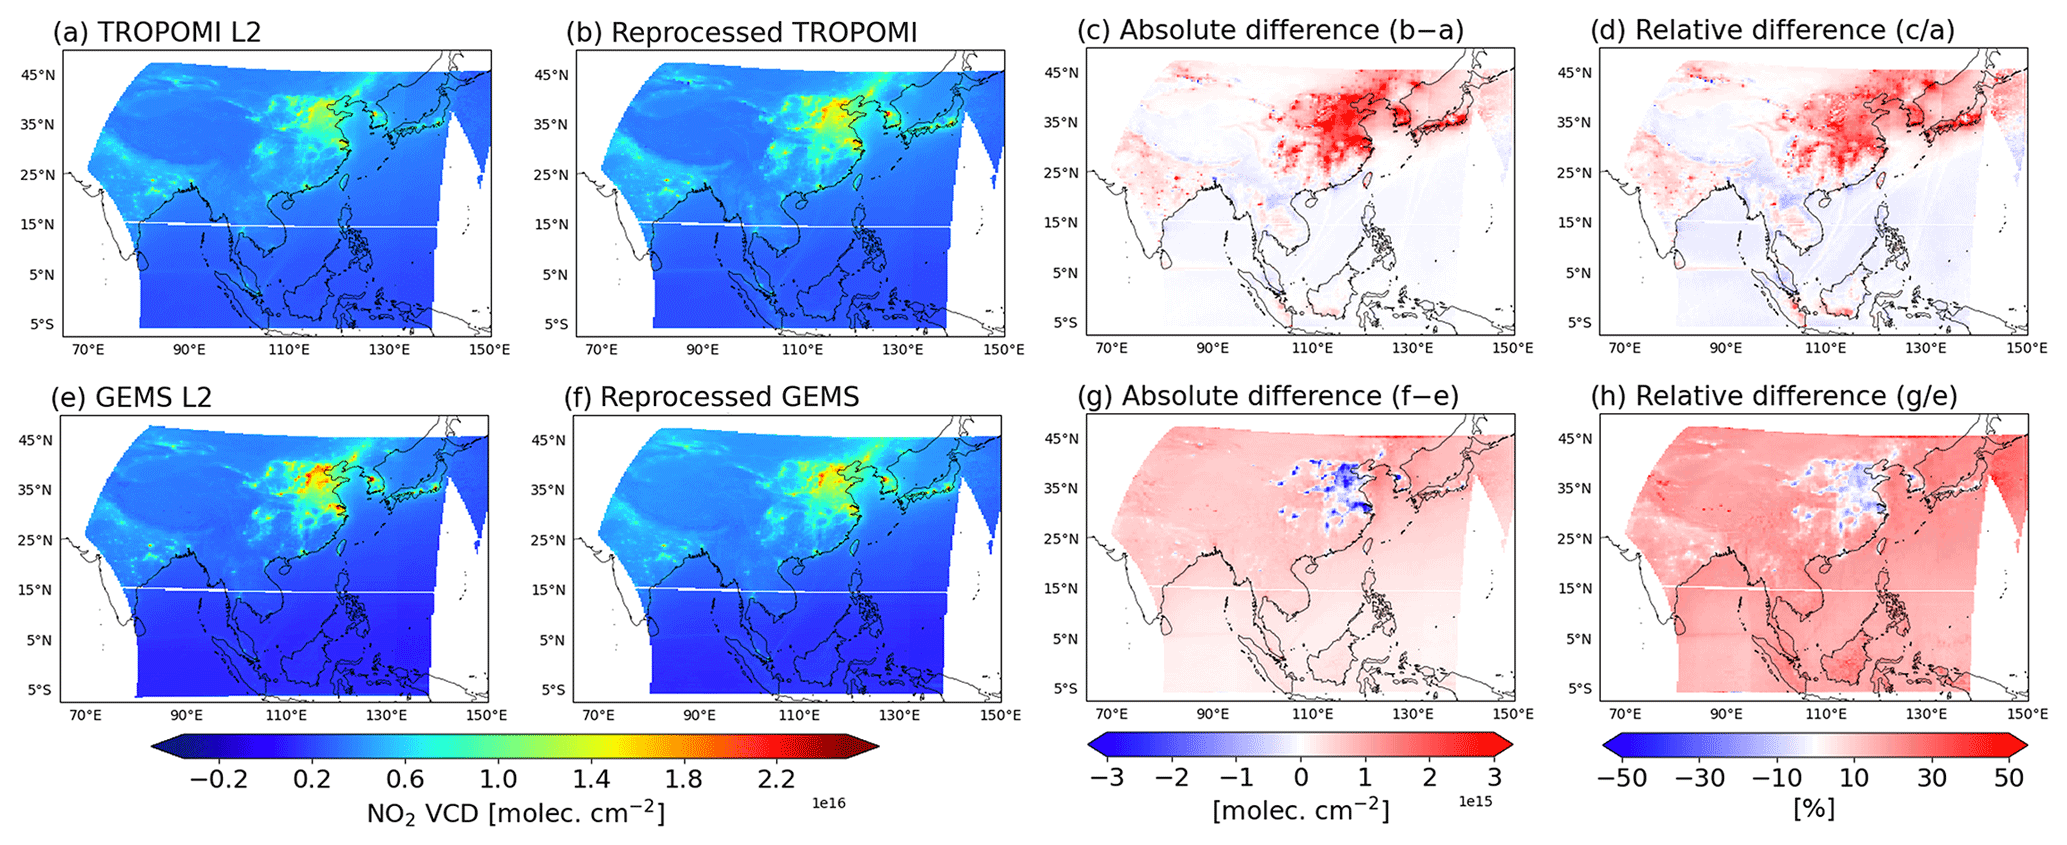
Figure 1NO2 total vertical column densities (VCDs) from TROPOMI and GEMS. Values are averages for July 2022–June 2023 sampled at the overpass time of TROPOMI (13:30 LT). Panels (a)–(d) show the TROPOMI operational product (L2), our product reprocessed with GEOS-Chem NO2 vertical profiles, and the absolute and relative differences between the two. Panels (e)–(h) show the same information for GEMS.
Figure 2 compares NO2 VCDs from the L2 and reprocessed products for the ensemble of GEMS and TROPOMI daily data sampled at the overpass time of TROPOMI. For the L2 products we find a negative normalized mean bias (NMB) of −14 % in GEMS compared to TROPOMI due to lower background values, but source regions are higher in GEMS. Reprocessing to common prior profiles greatly reduces GEMS–TROPOMI differences, with the exception of the background, where some differences increase.
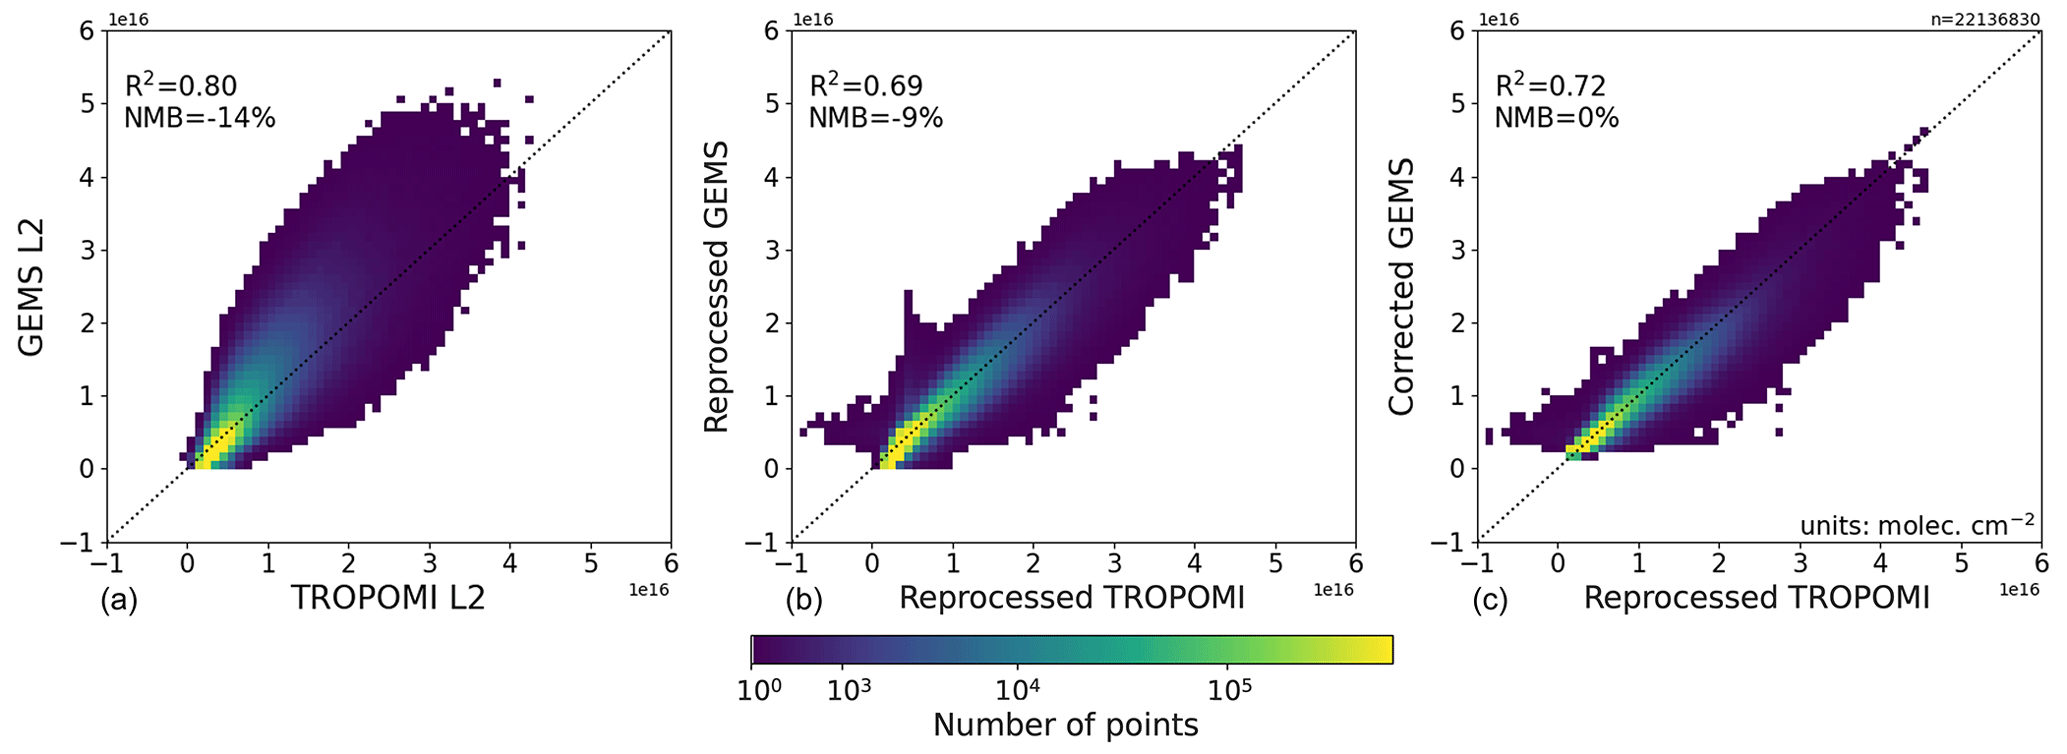
Figure 2Scatterplot comparison of NO2 total VCDs from TROPOMI and GEMS. Individual points are daily data for July 2022–June 2023 on the 0.25° × 0.3125° grid sampled at the overpass time of TROPOMI. Panel (a) compares the operational TROPOMI and GEMS products, and panel (b) compares our reprocessed products with GEOS-Chem NO2 vertical profiles. Panel (c) compares the reprocessed TROPOMI product with the GEMS data corrected for residual differences with TROPOMI using machine learning (ML) (Sect. 4). The color scale shows the density of points. The dashed line indicates the 1 : 1 line. The coefficient of determination (R2) and normalized mean bias (NMB = %) are given as an inset. Negative TROPOMI values reflect noise in the SCD spectral fitting. The GEMS L2 product has no negative values.
Figure 3a compares the mean seasonal variations in Pandora and satellite NO2 VCDs averaged over the 16 Pandora stations in northeastern Asia. The VCDs are maximum in winter and minimum in summer, reflecting the lifetime of NOx against photochemical oxidation. The operational TROPOMI L2 product has a −16 % NMB relative to the Pandora data that is reduced to 7 % when reprocessed with GEOS-Chem vertical profiles. The operational GEMS L2 product has a 23 % NMB relative to Pandora that is reduced to 7 % when reprocessed with GEOS-Chem vertical profiles. The reprocessed TROPOMI and GEMS products are in close agreement, in contrast to the large differences between the TROPOMI L2 and GEMS L2 products, showing that much of the discrepancy in the L2 products stems from different vertical shape factors. Incorrect use of GEOS-Chem vertical coordinates in the L2 version 2.0 GEMS product will be corrected in the next operational product with the GEOS-Chem profiles used here for reprocessing. In the following section, we correct the remaining discrepancies between the reprocessed TROPOMI and GEMS products using machine learning.
Figure 3b and c show the mean diurnal variations in the warm and cold seasons, comparing GEMS and Pandora. The Pandora data in the cold season increase over the course of the day due to daytime emissions, while the data in the warm season are at a minimum in the early afternoon due to chemical loss (Yang et al., 2024). The operational GEMS L2 data feature a midday maximum in the cold season that is not seen in the Pandora data. Our reprocessed product is more consistent with the diurnal variation observed by Pandora. More detailed comparisons of diurnal variations in Pandora and GEMS are presented by Yang et al. (2024) for Beijing and Seoul.
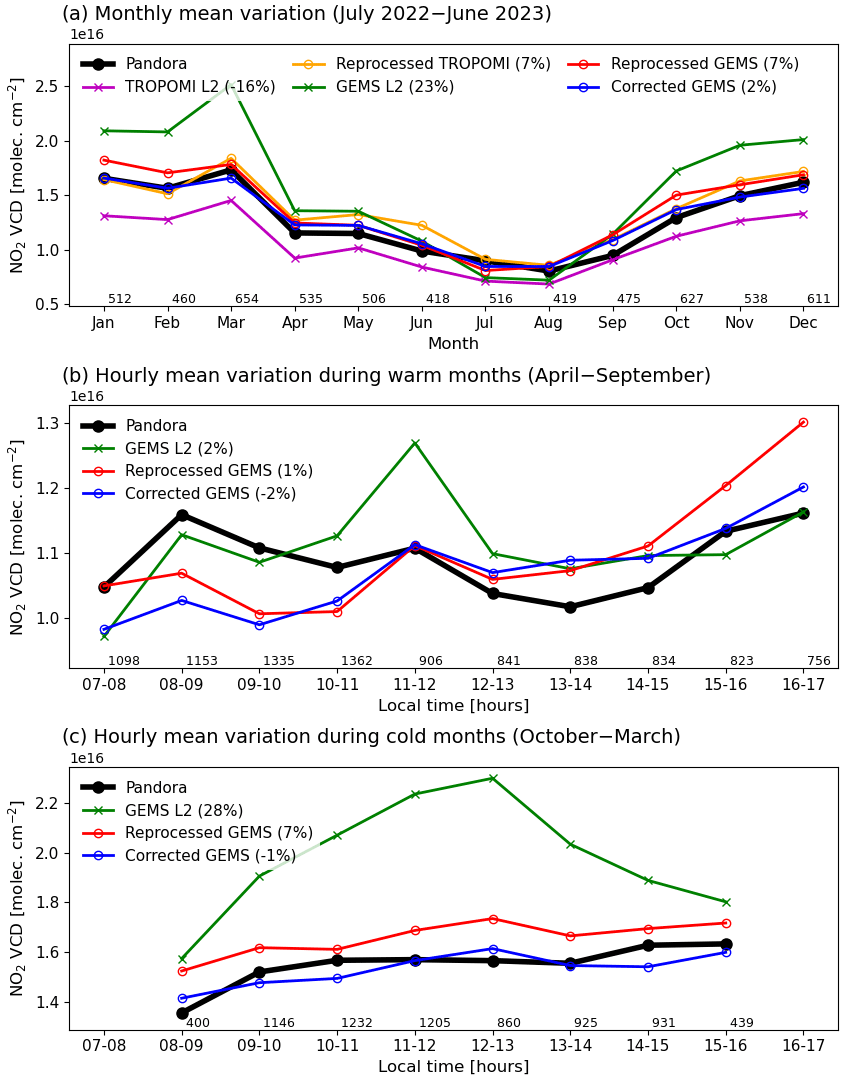
Figure 3Seasonal and diurnal variations in NO2 total VCDs from Pandora, TROPOMI, and GEMS averaged at 16 Pandora stations in northeastern Asia over July 2022–June 2023. TROPOMI and GEMS data are shown for the operational L2 products and the products reprocessed with GEOS-Chem NO2 vertical profiles. Also shown is the GEMS product corrected for residual differences with TROPOMI using ML (Sect. 4). Seasonal variations in (a) are for the TROPOMI overpass time (13:30 LT). Diurnal variations in (b) and (c) are only for Pandora and GEMS and are shown for April–September and October–March, respectively. NMB relative to Pandora (NMB = %) are given as an inset. The numbers of observations for each month and hour are also indicated.
Here we construct a TROPOMI-corrected GEMS product by developing an ML model that can predict the differences, Δ(GEMS–TROPOMI), remaining between GEMS and TROPOMI after reprocessing to common vertical profiles. TROPOMI is used as reference because of the greater maturity of its retrieval. The ML model uses as predictors the GEMS NO2 VCD and the GEMS retrieval parameters provided in the L2 product including effective zenith angle (EZA), relative azimuth angle, aerosol optical depth, aerosol layer height, O3 column amount, surface reflectance at 440 nm, single-scattering albedo, cloud fraction, and cloud top pressure. EZA combines the geometric effects of SZA and VZA on the AMF, as defined by the geometric AMF = sec(EZA) + 1 in the absence of scattering (Palmer et al., 2001):
TROPOMI observations are for a single time of day but extend off the track to viewing angles ±50°, meaning that the colocated dataset covers EZA values ranging up to 75°. This allows us to build an ML model valid for a sufficient range of EZAs, as is necessary for application to GEMS observations over their full diurnal range.
We tested five ensemble method algorithms including both bagging (random forest, extra tree) and boosting (LightGBM, XGBoost, CatBoost) using the Fast and Lightweight AutoML Library (FLAML) (Wang et al., 2021). We separated colocated Δ(GEMS–TROPOMI) pairs into training (July and October 2022, January and April 2023) and test (the rest of the colocated data for July 2022–June 2023) datasets. The average NO2 VCD from the test dataset is higher than the training data by 5 %, but the two datasets display similar spatial distributions. We trained the models to fit 7 489 498 Δ(GEMS–TROPOMI) pairs (training data) for 4 months as representative of the four seasons and found that the LightGBM algorithm has the best performance. We excluded Δ(GEMS–TROPOMI) data lying outside 6 times the interquartile range (6 × IQR; 0.1 % of the training data) to avoid contamination by outliers.
Figure 4 compares observed and predicted differences for the test data. We conducted a z-score transform to correct possible systematic biases associated with the LightGBM algorithm (Belitz and Stackelberg, 2021; Balasus et al., 2023). The R2 for the ML prediction is 0.51 and the root-mean-square error (RMSE) is 0.65×10¹⁵ molec. cm−2, which lies within the estimated single-retrieval errors in GEMS and TROPOMI NO2 of 0.15–2.47 × 10¹⁵ molec. cm−2 (Kim et al., 2020) and approximately 0.5 × 10¹⁵ molec. cm−2 (van Geffen et al., 2022), respectively.
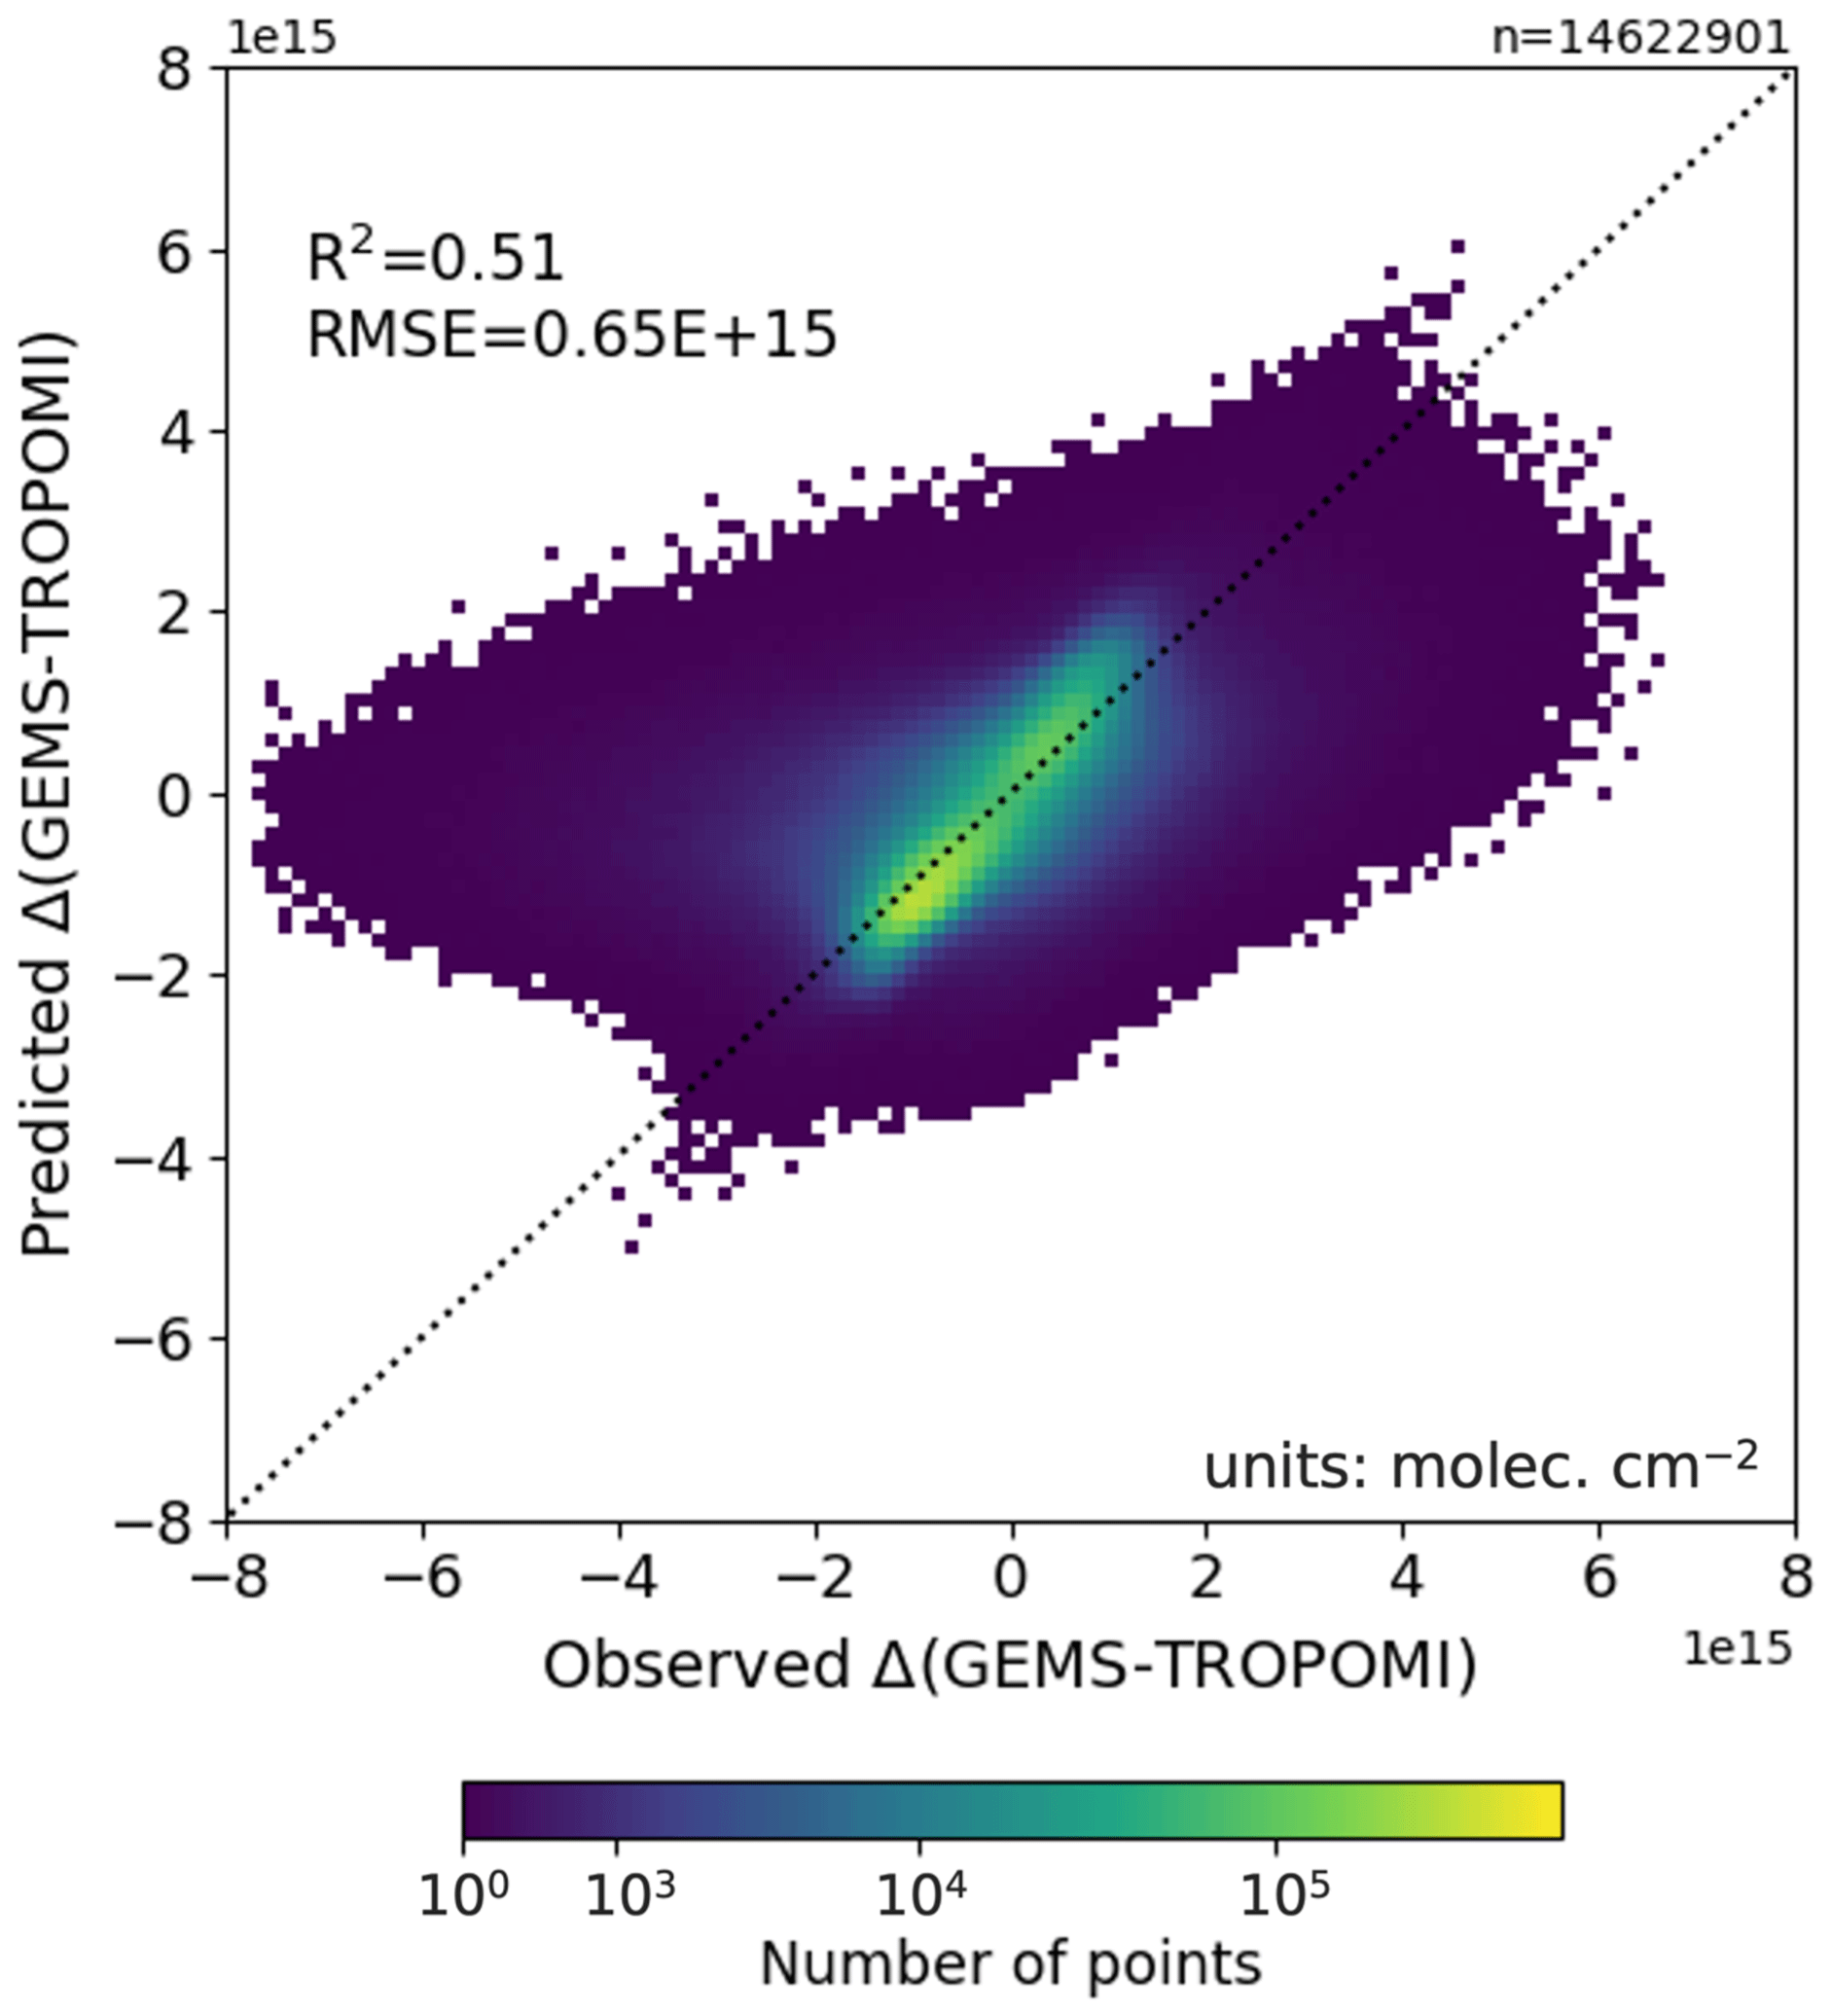
Figure 4Predicted versus observed Δ(GEMS–TROPOMI) in the test dataset. The color scale shows the density of points. The dashed line indicates the 1 : 1 line. R2 and root-mean-square error (RMSE) are given as an inset.
We produced a corrected GEMS product for the duration of the GEMS L2 version 2.0 record (November 2020 to present) by subtracting Δ(GEMS–TROPOMI) from the GEMS data previously reprocessed to the GEOS-Chem vertical profiles:
The ML calculation of Δ(GEMS–TROPOMI) only requires GEMS retrieval information and is therefore applied to all GEMS retrievals, not requiring collocation with TROPOMI.
Figure 5 compares TROPOMI, GEMS, and the corrected GEMS NO2 VCDs for the warm and cold seasons. The corrected GEMS product increases VCDs in the remote ocean background in the southeastern part of the GEMS scan domain by up to 200 % and decreases VCDs in central Asia by up to 40 % regardless of season. However, corrections to the GEMS product in the polluted regions in northeastern Asia display different patterns during the warm and cold months. Figure 6 shows an enlarged view of the northeastern Asian domain along with observations from the Pandora stations. In the warm season, GEMS displays consistent 10 % negative biases relative to TROPOMI in eastern parts of China and South Korea (Fig. 6d), resulting in an upward correction. The GEMS bias in the cold season is much noisier and tends to be positive, resulting in downward correction (Fig. 6j).
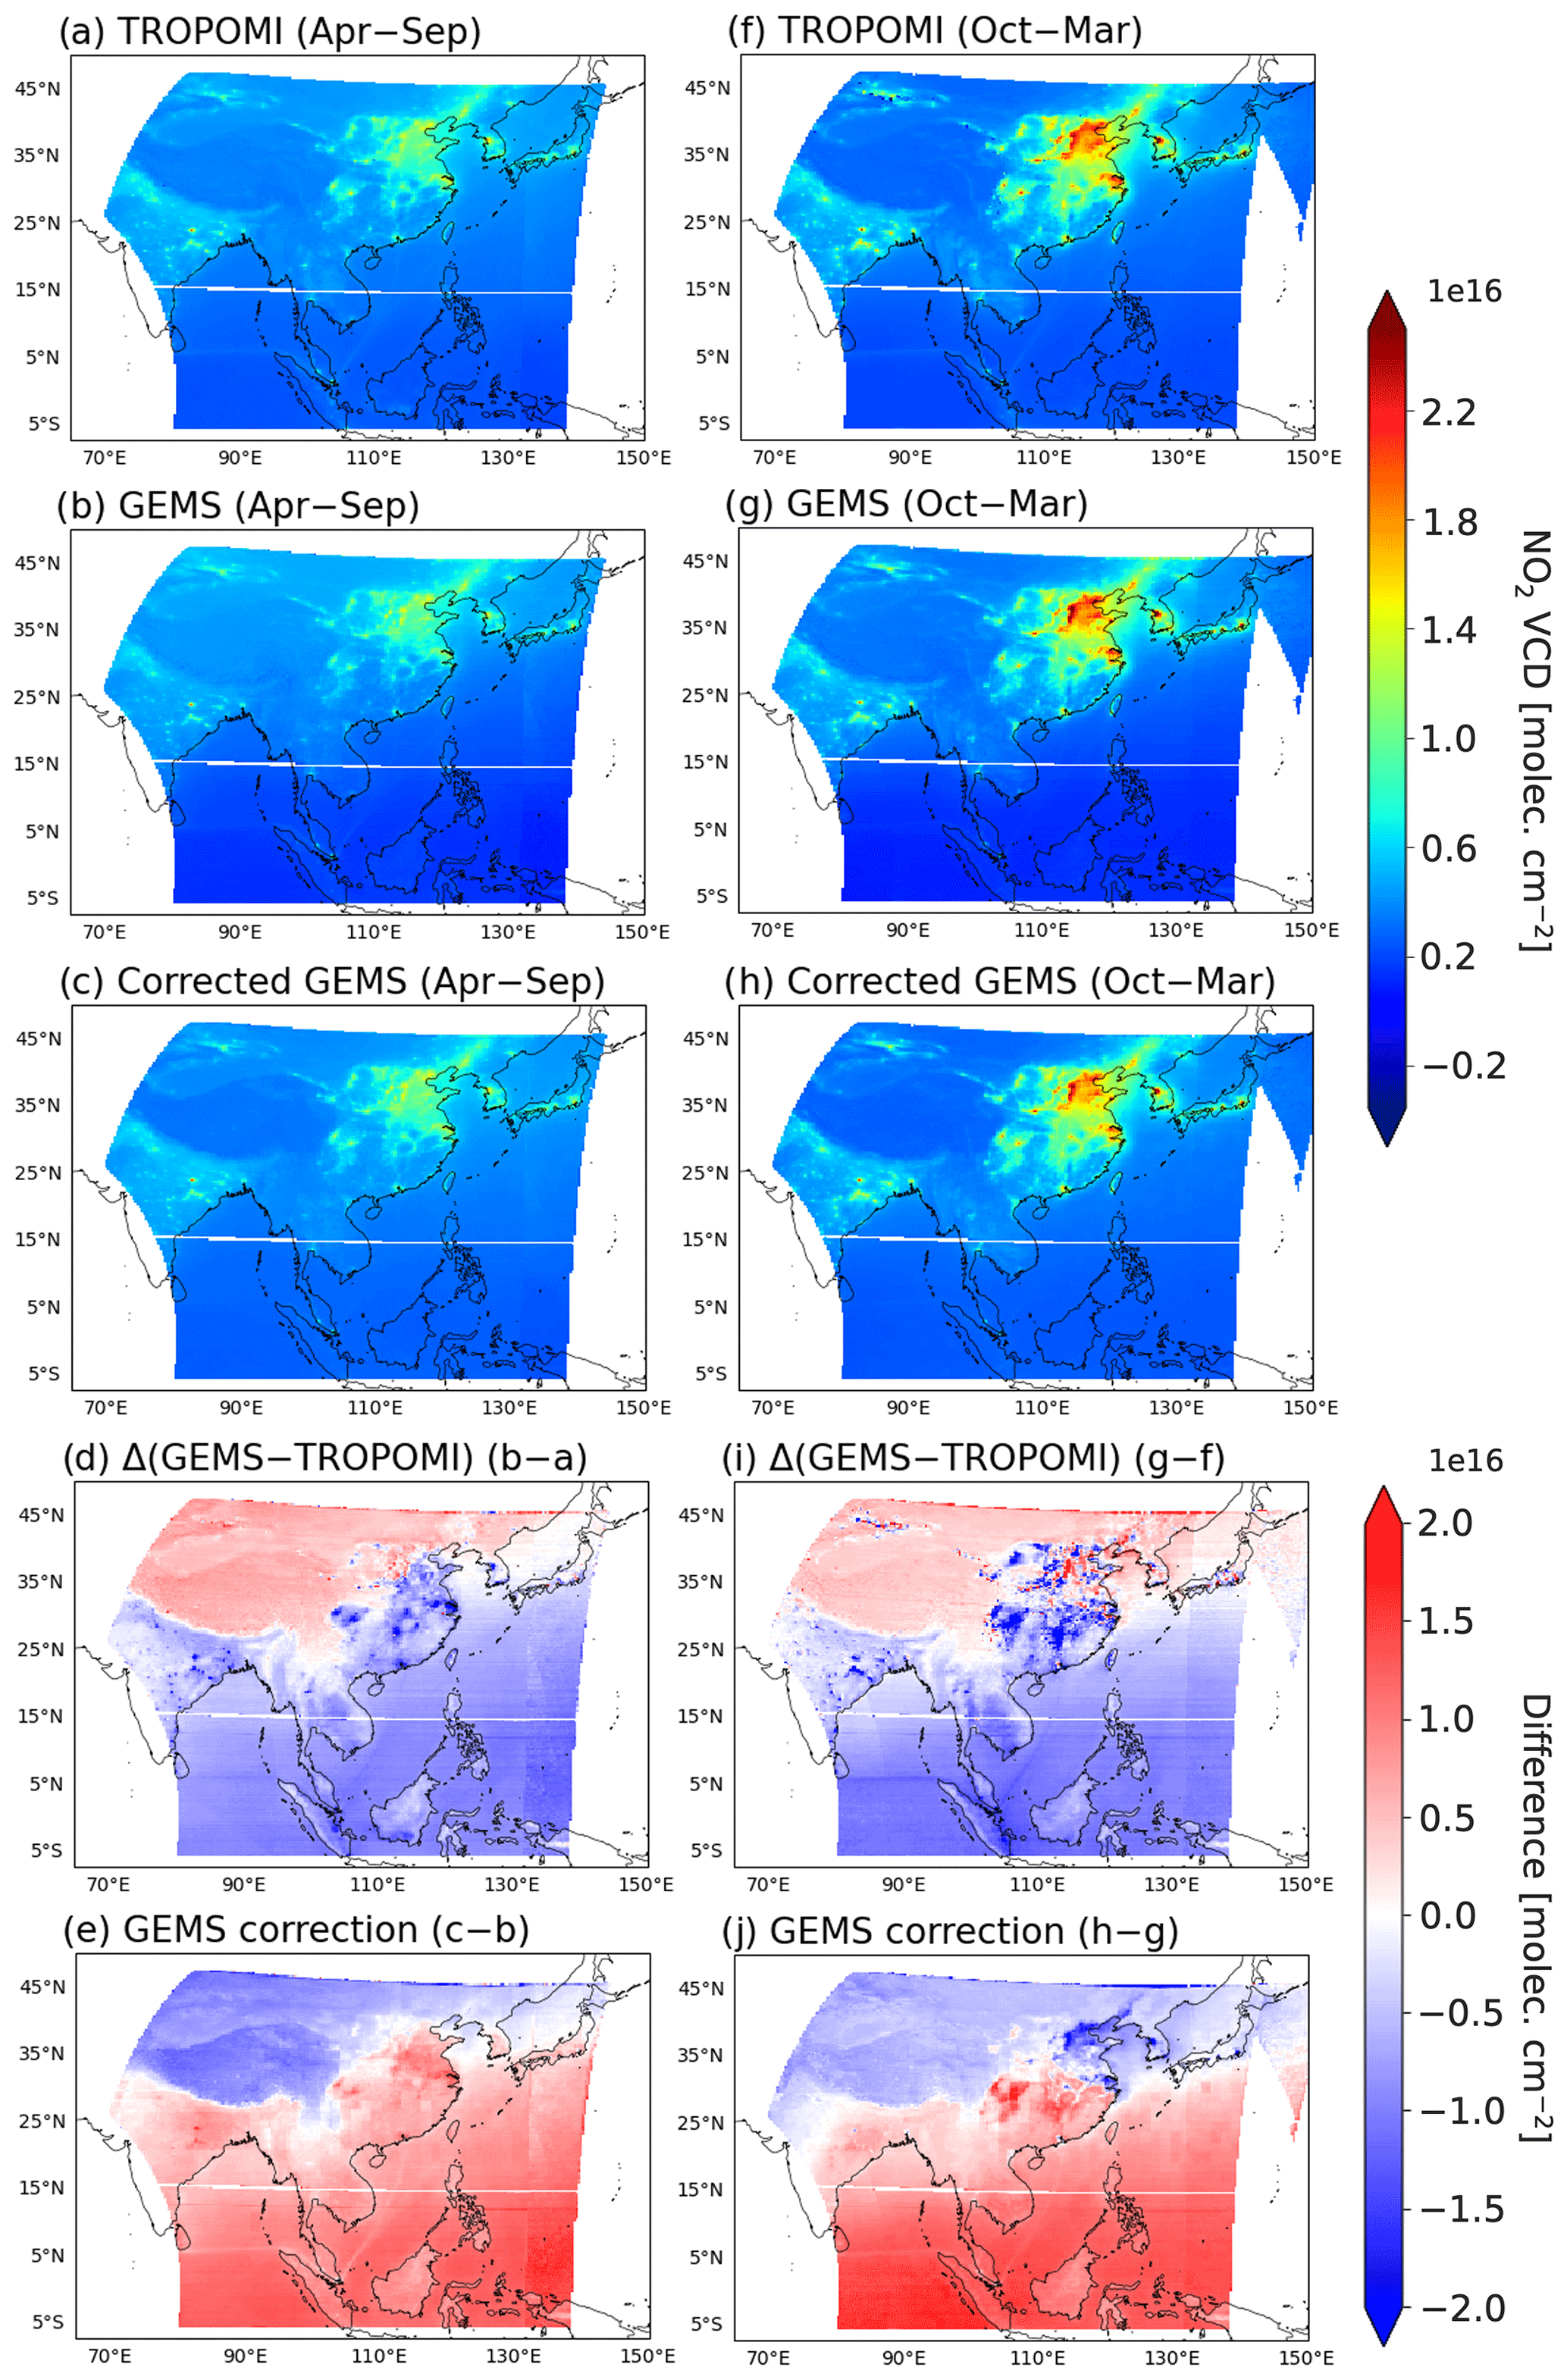
Figure 5Comparison of TROPOMI, GEMS, and corrected GEMS NO2 products in the GEMS scan domain. (a–c) NO2 total VCDs averaged for April–September at the TROPOMI overpass time. The TROPOMI and GEMS data have been reprocessed to common GEOS-Chem vertical profiles for the observation scenes. (d) Δ(GEMS–TROPOMI) for April–September. (e) Correction to the GEMS product for April–September. (f–j) The same as panels (a)–(e) but for October–March.
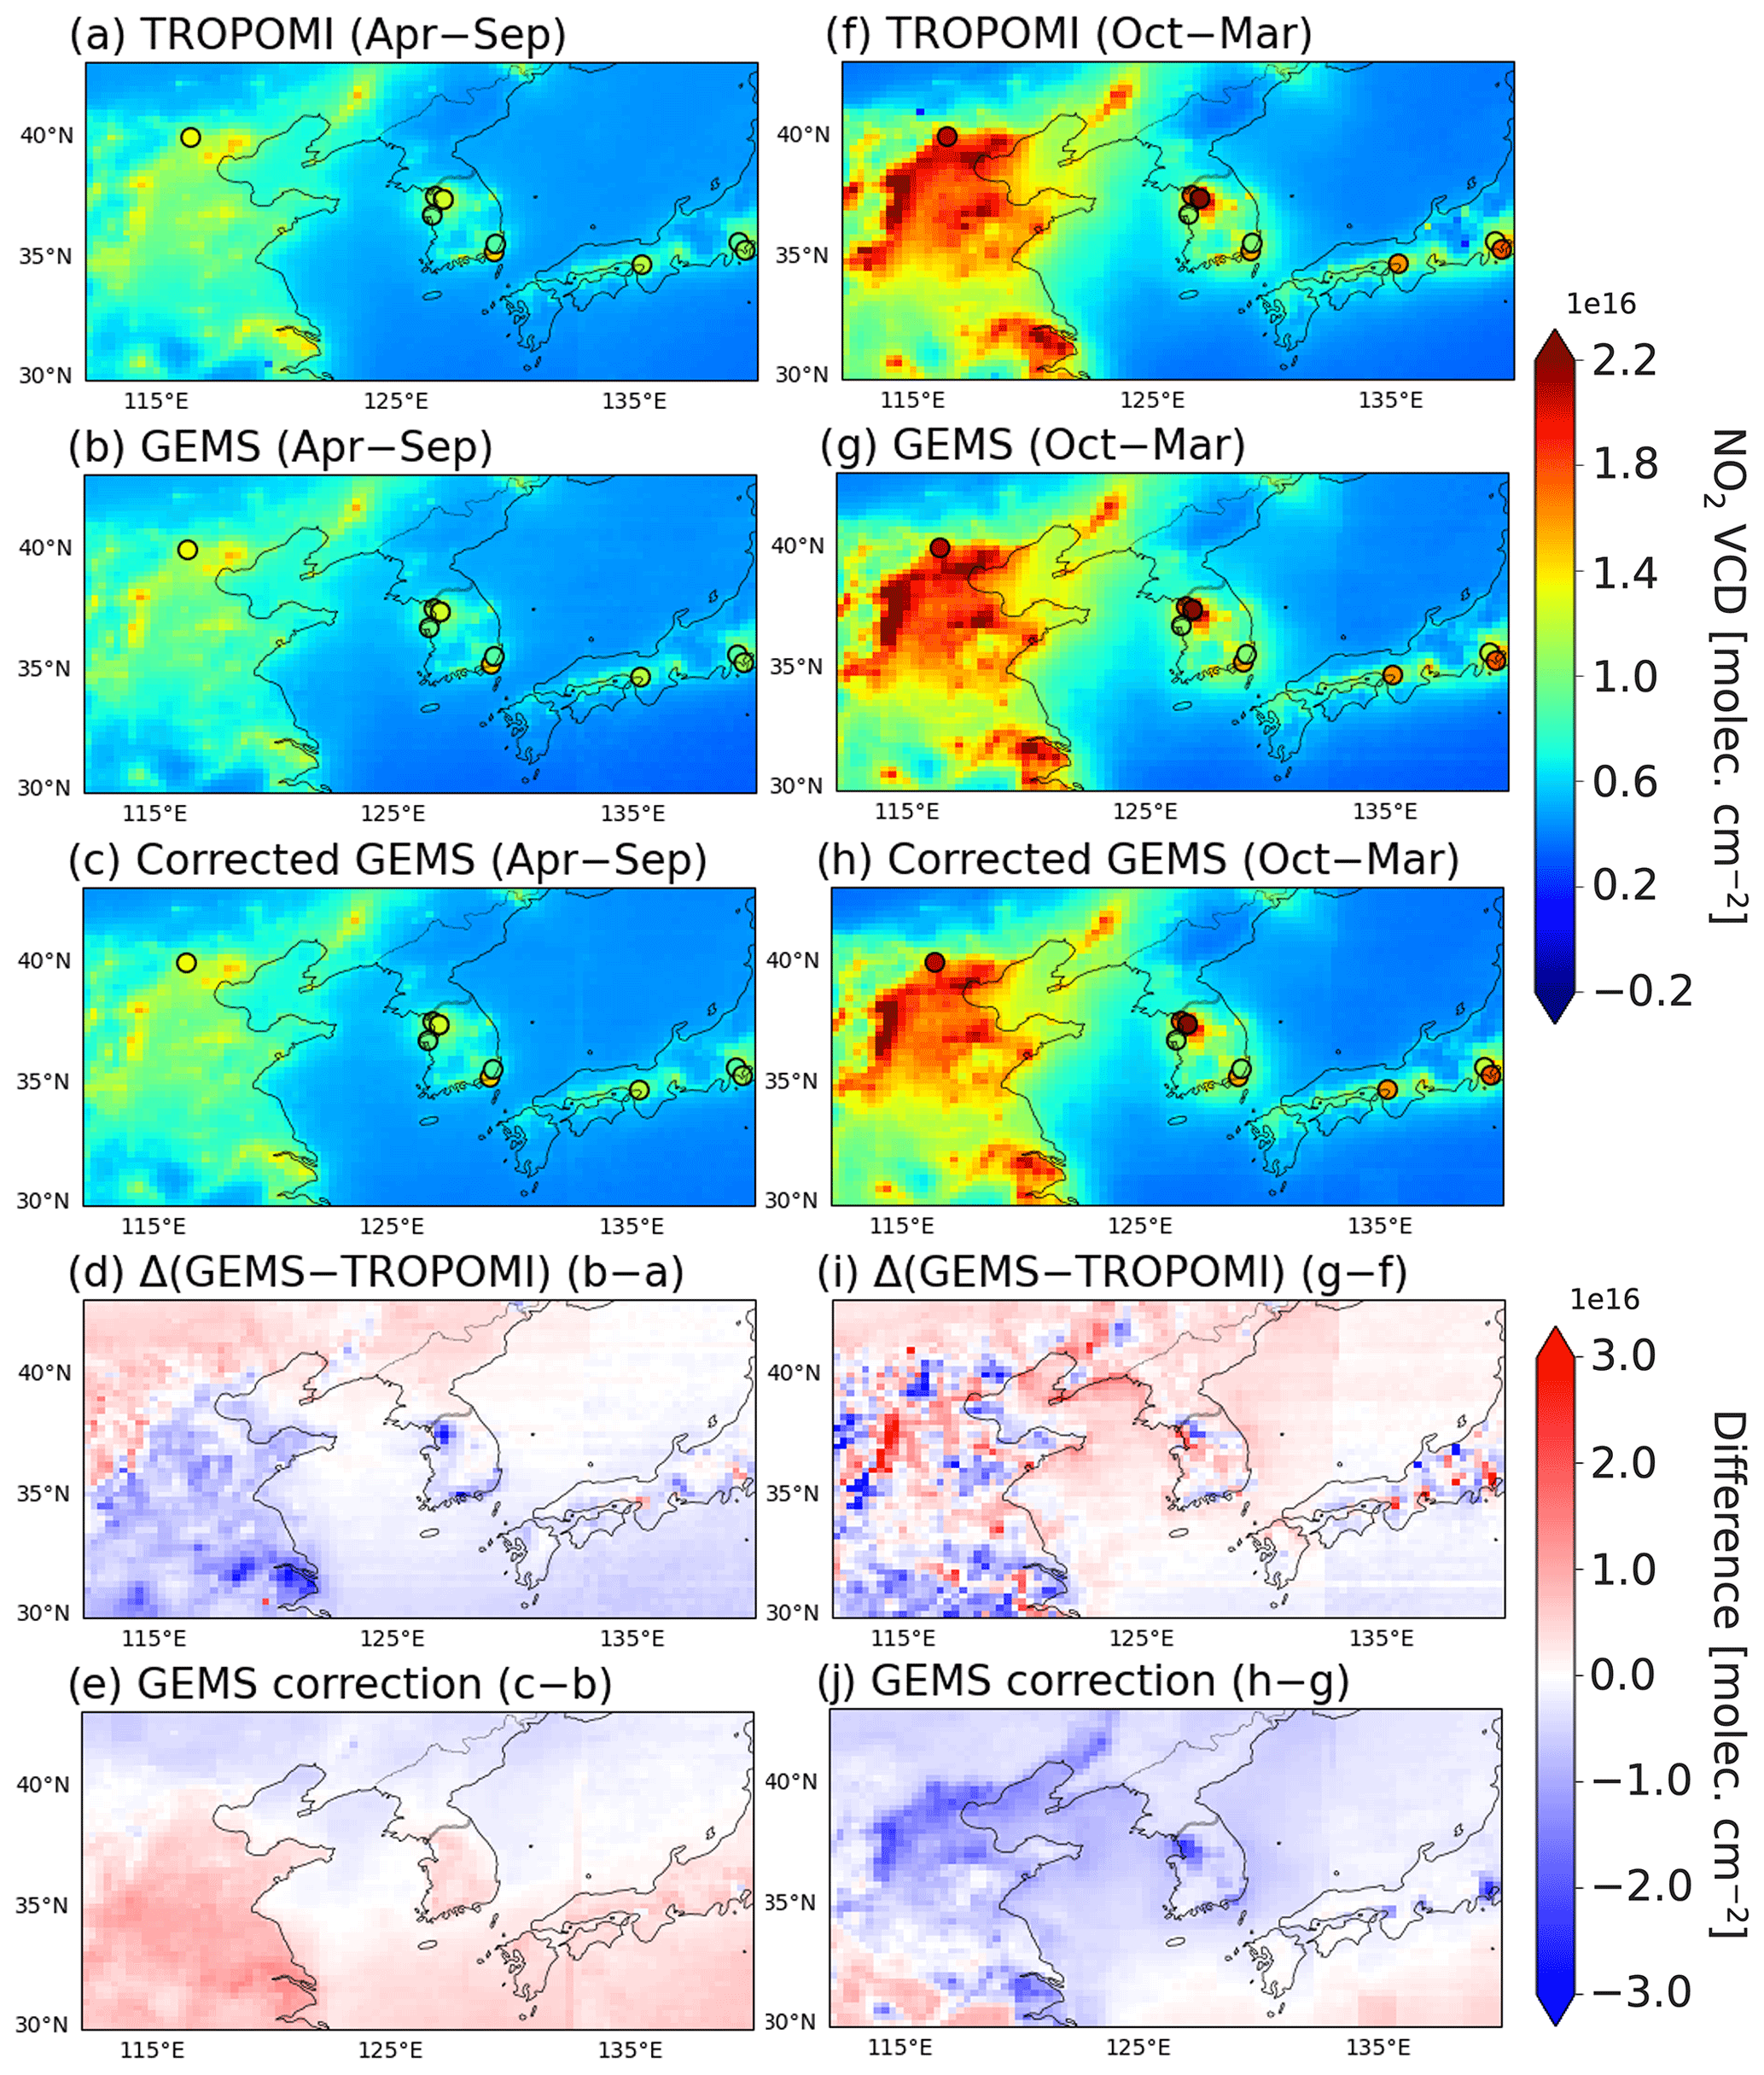
Figure 6The same as Fig. 5 but in the northeastern Asian domain with Pandora observations shown as circles. The color scales are different from Fig. 5.
Comparison of the monthly mean variations in GEMS VCDs at the Pandora sites in northeastern Asia also shows that the ML model performs an upwards correction during May to August and a larger downwards correction during other months, resulting in an overall low bias of ∼ 5 % compared to TROPOMI (Fig. 3a). However, we see from Fig. 2 that the correction successfully reduces remaining residual differences between GEMS and TROPOMI (NMB = 0 %) for the entire GEMS domain and increases consistency with the observed variability from TROPOMI (R2=0.72).
We can determine the contribution of each predictor variable to the model prediction using the SHapley Additive exPlanations (SHAP) analysis with the TreeExplainer method (Lundberg et al., 2020), as shown in Fig. 7. The SHAP value can be interpreted as the relative importance of the predictor variable to the bias correction, where negative SHAP values indicate low biases in GEMS and vice versa. Figure 7a shows that the GEMS NO2 VCD contributes the largest corrections, followed by the EZA, while variables related to atmospheric scattering and surface reflectance are less important. Figure 7b shows that the corrections from NO2 VCD and EZA are strongly nonlinear. The NO2 VCD drives the correction of the low bias in the ocean background and the high bias in polluted regions. EZA drives a correction for high biases at angles exceeding 60°. The dominant corrections from VCD and EZA might be viewed as reflecting a correction from the SCD, as we would have SCD/VCD = sec(EZA) + 1 in the absence of scattering. However, we found that using GEMS SCD as a predictor variable was less successful than using VCD.
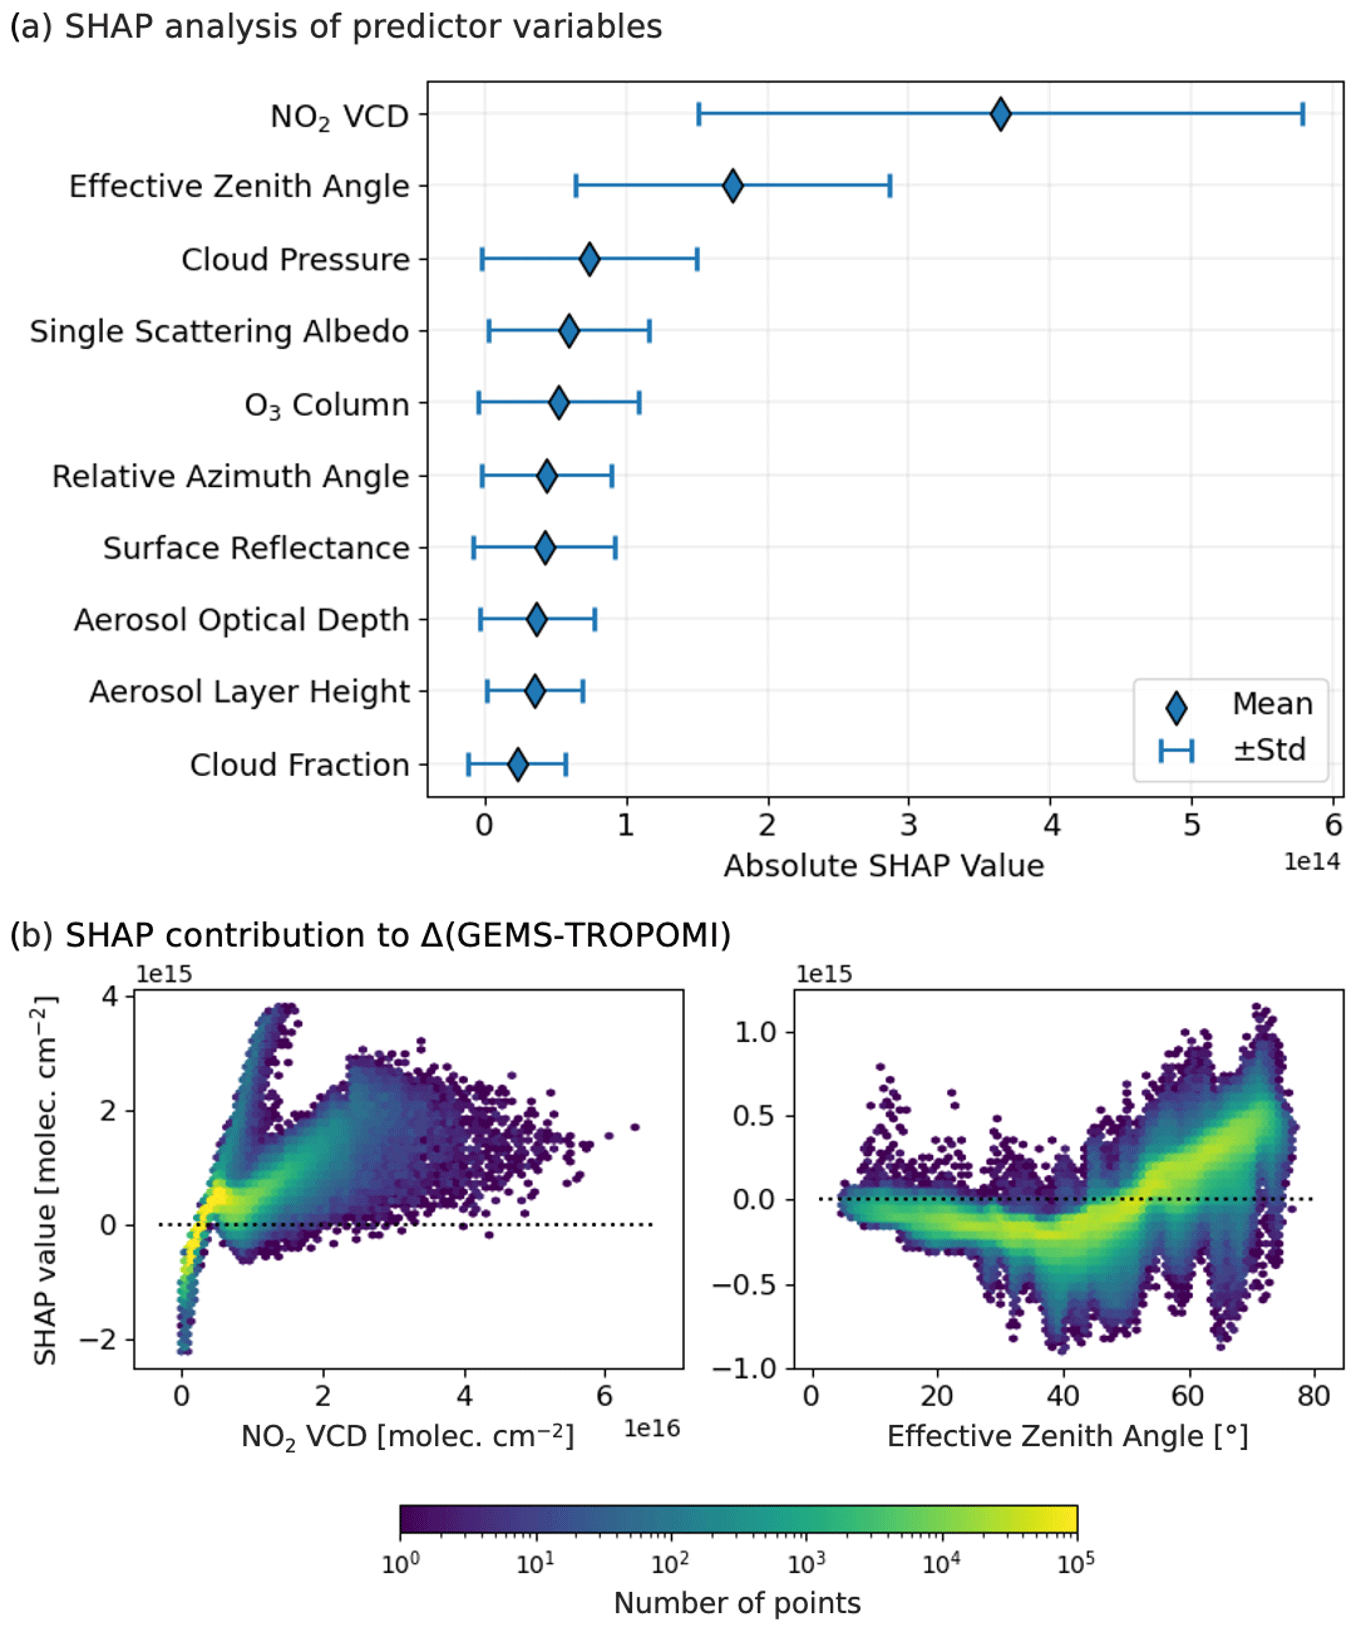
Figure 7SHAP analysis for predictors of GEMS–TROPOMI differences, Δ(GEMS–TROPOMI), in the ML training dataset. (a) SHAP analysis results ranking the predictor variables in order of their contributions to the fit. (b) SHAP contribution to Δ(GEMS–TROPOMI) from GEMS NO2 VCD and effective zenith angle (EZA). The color scale shows the density of points.
The effect of the correction on the diurnal profiles observed by GEMS at the Pandora sites is shown in Fig. 3b–c. The correction in the warm season dampens the diurnal variability because EZA varies from 50° at local noon to 65° at 07:00 or 17:00 LT, a range limited by the constant VZA set by latitude. The corrected diurnal variability improves agreement with Pandora in the late afternoon while degrading it in the early morning. By contrast, the correction in the cold season decreases GEMS by similar increments for all hours of the day, resulting in no change in the diurnal profile but better agreement with Pandora. The lack of diurnal variability in the correction is because EZA varies over only a limited range. The VZA averages 44° for the Pandora sites in northeastern Asia, and the SZA ranges from 52° at local noon to 65° at 08:00 or 16:00 LT, meaning that the EZA varies only from 60 to 68°.
We have presented an improved NO2 vertical column density (VCD) product from the Geostationary Environment Monitoring Spectrometer (GEMS) by calibrating it to TROPOspheric Monitoring Instrument (TROPOMI) with a machine learning (ML) algorithm. A first step was to reprocess both GEMS and TROPOMI datasets to adopt common NO2 vertical profiles and resulting air mass factors (AMFs) from the GEOS-Chem model. The second step was to correct the residual difference, Δ(GEMS–TROPOMI), with the ML model. The corrected GEMS product preserves the data density of GEMS, provides hourly daytime data over eastern and southern Asia and neighboring oceans, and is consistent with TROPOMI. It is available for the duration of the GEMS record (November 2020 to present).
Reprocessing with a common AMF removed most of the differences between GEMS and TROPOMI operational L2 products. It also resulted in better agreement with the ground-based Pandora observations. Even after this reprocessing, GEMS displayed low biases compared to TROPOMI in polluted regions of eastern China and South Korea, as well as in the ocean background, and high biases in central Asia.
We used the LightGBM ML algorithm to correct these remaining biases in GEMS relative to TROPOMI. We trained the ML model to fit colocated Δ(GEMS–TROPOMI) pairs for 4 months (July and October 2022, January and April 2023) to GEMS NO2 VCDs and GEMS retrieval parameters. This took advantage of the wide range of TROPOMI viewing angles to train the ML in a manner relevant to GEMS observations at different times of day. The ML was successful in correcting the remaining GEMS differences with TROPOMI. SHAP analysis showed that NO2 VCD and effective zenith angle (EZA) were the predictor variables associated with largest corrections. ML correction increases VCDs in the remote ocean regions by up to 200 % and decreases VCDs in central Asia by up to 40 %. GEMS values in NOx source regions of eastern China and South Korea increase by ∼ 10 % during the warm season but decrease during the cold season, resulting in better agreement with Pandora observations. The GEMS correction in these source regions is largest for the early morning and late afternoon in the warm season but is similar for all times of day in the cold season.
Our corrected GEMS NO2 product is designed to be consistent with the TROPOMI product, supporting the combined use of both datasets for analyses of eastern Asia air quality including NOx emissions and chemistry and their diurnal variations. Our approach of calibrating GEMS NO2 observations to TROPOMI can be extended to other observed species (such as formaldehyde or glyoxal) and to other geostationary satellite instruments including TEMPO over North America and Sentinel-4 over Europe. This would produce consistent datasets across the geostationary air quality constellation with reference to a common TROPOMI calibration for global observing capability.
The The GEMS L2, TROPOMI L2, and Pandora NO2 products are available online through https://nesc.nier.go.kr/en/html/index.do (data inquiry and approval from the PI is required; NESC, 2024), https://dataspace.copernicus.eu/explore-data/data-collections/sentinel-data/sentinel-5p (Copernicus, 2024), and https://www.pandonia-global-network.org (Pandonia, 2024), respectively. The corrected GEMS product from November 2020 to present is available from Harvard Dataverse (https://doi.org/10.7910/DVN/ZQQJRO, Oak, 2024).
Original draft preparation, data processing, analysis, investigation, and visualization were done by YJO. DJJ and NB contributed to project conceptualization. Review and editing were done by DJJ, NB, HC, RJP, HAK, and JK. LHY, JP, HL, GTL, and ESH provided additional resources and support in analysis.
The contact author has declared that none of the authors has any competing interests.
Publisher's note: Copernicus Publications remains neutral with regard to jurisdictional claims made in the text, published maps, institutional affiliations, or any other geographical representation in this paper. While Copernicus Publications makes every effort to include appropriate place names, the final responsibility lies with the authors.
This article is part of the special issue “GEMS: first year in operation (AMT/ACP inter-journal SI)”. It is not associated with a conference.
We thank NIER for providing the GEMS data, the ESA for providing the TROPOMI data, and the PIs and support staff of the PGN.
This research has been supported by the Samsung Advanced Institute of Technology (grant no. A41602).
This paper was edited by Myoung-Hwan Ahn and reviewed by three anonymous referees.
Balasus, N., Jacob, D. J., Lorente, A., Maasakkers, J. D., Parker, R. J., Boesch, H., Chen, Z., Kelp, M. M., Nesser, H., and Varon, D. J.: A blended TROPOMI+GOSAT satellite data product for atmospheric methane using machine learning to correct retrieval biases, Atmos. Meas. Tech., 16, 3787–3807, https://doi.org/10.5194/amt-16-3787-2023, 2023.
Beirle, S. and Wagner, T.: A new method for estimating megacity NOx emissions and lifetimes from satellite observations, Atmos. Meas. Tech., 17, 3439–3453, https://doi.org/10.5194/amt-17-3439-2024, 2024.
Belitz, K. and Stackelberg, P. E.: Evaluation of six methods for correcting bias in estimates from ensemble tree machine learning regression models, Environ. Modell. Softw., 139, 105006, https://doi.org/10.1016/j.envsoft.2021.105006, 2021.
Bey, I., Jacob, D. J., Yantosca, R. M., Logan, J. A., Field, B. D., Fiore, A. M., Li, Q., Liu, H. Y., Mickley, L. J., and Schultz, M. G.: Global modeling of tropospheric chemistry with assimilated meteorology: Model description and evaluation, J. Geophys. Res.-Atmos., 106, 23073–23095, https://doi.org/10.1029/2001JD000807, 2001.
Boersma, K. F., Jacob, D. J., Eskes, H. J., Pinder, R. W., Wang, J., and van der A, R. J.: Intercomparison of SCIAMACHY and OMI tropospheric NO2 columns: Observing the diurnal evolution of chemistry and emissions from space, J. Geophys. Res.-Atmos., 113, D16S26, https://doi.org/10.1029/2007JD008816, 2008.
Bucsela, E. J., Krotkov, N. A., Celarier, E. A., Lamsal, L. N., Swartz, W. H., Bhartia, P. K., Boersma, K. F., Veefkind, J. P., Gleason, J. F., and Pickering, K. E.: A new stratospheric and tropospheric NO2 retrieval algorithm for nadir-viewing satellite instruments: applications to OMI, Atmos. Meas. Tech., 6, 2607–2626, https://doi.org/10.5194/amt-6-2607-2013, 2013.
Burrows, J. P., Weber, M., Buchwitz, M., Rozanov, V., Ladstätter-Weißenmayer, A., Richter, A., DeBeek, R., Hoogen, R., Bramstedt, K., Eichmann, K.-U., Eisinger, M., and Perner, D.: The Global Ozone Monitoring Experiment (GOME): Mission Concept and First Scientific Results, J. Atmos. Sci., 56, 151–175, https://doi.org/10.1175/1520-0469(1999)056<0151:TGOMEG>2.0.CO;2, 1999.
Cai, K., Li, S., Lai, J., Xia, Y., Wang, Y., Hu, X., and Li, A.: Evaluation of TROPOMI and OMI Tropospheric NO2 Products Using Measurements from MAX-DOAS and State-Controlled Stations in the Jiangsu Province of China, Atmosphere, 13, 886, https://doi.org/10.3390/atmos13060886, 2022.
Cooper, M. J., Martin, R. V., McLinden, C. A., and Brook, J. R.: Inferring ground-level nitrogen dioxide concentrations at fine spatial resolution applied to the TROPOMI satellite instrument, Environ. Res. Lett., 15, 104013, https://doi.org/10.1088/1748-9326/aba3a5, 2020.
Copernicus: Sentinel-5P, Monitoring our atmosphere, Copernicus [data set], https://dataspace.copernicus.eu/explore-data/data-collections/sentinel-data/sentinel-5p, last access: 3 September 2024.
Curier, R. L., Kranenburg, R., Segers, A. J. S., Timmermans, R. M. A., and Schaap, M.: Synergistic use of OMI NO2 tropospheric columns and LOTOS–EUROS to evaluate the NOx emission trends across Europe, Remote Sens. Environ., 149, 58–69, https://doi.org/10.1016/j.rse.2014.03.032, 2014.
Dang, R., Jacob, D. J., Shah, V., Eastham, S. D., Fritz, T. M., Mickley, L. J., Liu, T., Wang, Y., and Wang, J.: Background nitrogen dioxide (NO2) over the United States and its implications for satellite observations and trends: effects of nitrate photolysis, aircraft, and open fires, Atmos. Chem. Phys., 23, 6271–6284, https://doi.org/10.5194/acp-23-6271-2023, 2023.
Douros, J., Eskes, H., van Geffen, J., Boersma, K. F., Compernolle, S., Pinardi, G., Blechschmidt, A.-M., Peuch, V.-H., Colette, A., and Veefkind, P.: Comparing Sentinel-5P TROPOMI NO2 column observations with the CAMS regional air quality ensemble, Geosci. Model Dev., 16, 509–534, https://doi.org/10.5194/gmd-16-509-2023, 2023.
Duncan, B. N., Lamsal, L. N., Thompson, A. M., Yoshida, Y., Lu, Z., Streets, D. G., Hurwitz, M. M., and Pickering, K. E.: A space-based, high-resolution view of notable changes in urban NOx pollution around the world (2005–2014), J. Geophys. Res.-Atmos., 121, 976–996, https://doi.org/10.1002/2015JD024121, 2016.
Eskes, H., van Geffen, J., Boersma, F., Eichmann, K.-U., Apituley, A., Pedergnana, M., Sneep, M., Veefkind, J. P., and Loyola, D.: Sentinel-5 precursor/TROPOMI Level 2 Product User Manual Nitrogendioxide, S5P-KNMI-L2-0021-MA, CI-7570-PUM, 2022.
Eskes, H. J. and Boersma, K. F.: Averaging kernels for DOAS total-column satellite retrievals, Atmos. Chem. Phys., 3, 1285–1291, https://doi.org/10.5194/acp-3-1285-2003, 2003.
Geddes, J. A., Martin, R. V., Bucsela, E. J., McLinden, C. A., and Cunningham, D. J. M.: Stratosphere–troposphere separation of nitrogen dioxide columns from the TEMPO geostationary satellite instrument, Atmos. Meas. Tech., 11, 6271–6287, https://doi.org/10.5194/amt-11-6271-2018, 2018.
Goldberg, D. L., Lu, Z., Streets, D. G., de Foy, B., Griffin, D., McLinden, C. A., Lamsal, L. N., Krotkov, N. A., and Eskes, H.: Enhanced Capabilities of TROPOMI NO2: Estimating NOx from North American Cities and Power Plants, Environ. Sci. Technol., 53, 12594–12601, https://doi.org/10.1021/acs.est.9b04488, 2019.
Gu, J., Liang, X., Song, S., Tian, Y., Chen, L., and Tao, J.: Evaluation of TROPOMI operational standard NO2 column retrievals (from version 1.3 to 2.4) with OMNO2 and QA4ECV OMI observations over China, EGUsphere [preprint], https://doi.org/10.5194/egusphere-2023-175, 2023.
Ha, E. S., Park, R. J., Kwon, H.-A., Lee, G. T., Lee, S. D., Shin, S., Lee, D.-W., Hong, H., Lerot, C., De Smedt, I., Hendrick, F., and Irie, H.: First evaluation of the GEMS glyoxal products against TROPOMI and ground-based measurements, EGUsphere [preprint], https://doi.org/10.5194/egusphere-2024-589, 2024.
Herman, J., Cede, A., Spinei, E., Mount, G., Tzortziou, M., and Abuhassan, N.: NO2 column amounts from ground-based Pandora and MFDOAS spectrometers using the direct-sun DOAS technique: Intercomparisons and application to OMI validation, J. Geophys. Res.-Atmos., 114, D13307, https://doi.org/10.1029/2009JD011848, 2009.
Herman, J., Abuhassan, N., Kim, J., Kim, J., Dubey, M., Raponi, M., and Tzortziou, M.: Underestimation of column NO2 amounts from the OMI satellite compared to diurnally varying ground-based retrievals from multiple PANDORA spectrometer instruments, Atmos. Meas. Tech., 12, 5593–5612, https://doi.org/10.5194/amt-12-5593-2019, 2019.
Hong, H., Lee, H., Kim, J., Jeong, U., Ryu, J., and Lee, D. S.: Investigation of Simultaneous Effects of Aerosol Properties and Aerosol Peak Height on the Air Mass Factors for Space-Borne NO2 Retrievals, Remote Sens., 9, 208, https://doi.org/10.3390/rs9030208, 2017.
Ingmann, P., Veihelmann, B., Langen, J., Lamarre, D., Stark, H., and Courrèges-Lacoste, G. B.: Requirements for the GMES Atmosphere Service and ESA's implementation concept: Sentinels-4/-5 and -5p, Remote Sens. Environ., 120, 58–69, https://doi.org/10.1016/j.rse.2012.01.023, 2012.
Kim, J., Jeong, U., Ahn, M.-H., Kim, J. H., Park, R. J., Lee, H., Song, C. H., Choi, Y.-S., Lee, K.-H., Yoo, J.-M., Jeong, M.-J., Park, S. K., Lee, K.-M., Song, C.-K., Kim, S.-W., Kim, Y. J., Kim, S.-W., Kim, M., Go, S., Liu, X., Chance, K., Chan Miller, C., Al-Saadi, J., Veihelmann, B., Bhartia, P. K., Torres, O., Abad, G. G., Haffner, D. P., Ko, D. H., Lee, S. H., Woo, J.-H., Chong, H., Park, S. S., Nicks, D., Choi, W. J., Moon, K.-J., Cho, A., Yoon, J., Kim, S.-k., Hong, H., Lee, K., Lee, H., Lee, S., Choi, M., Veefkind, P., Levelt, P. F., Edwards, D. P., Kang, M., Eo, M., Bak, J., Baek, K., Kwon, H.-A., Yang, J., Park, J., Han, K. M., Kim, B.-R., Shin, H.-W., Choi, H., Lee, E., Chong, J., Cha, Y., Koo, J.-H., Irie, H., Hayashida, S., Kasai, Y., Kanaya, Y., Liu, C., Lin, J., Crawford, J. H., Carmichael, G. R., Newchurch, M. J., Lefer, B. L., Herman, J. R., Swap, R. J., Lau, A. K. H., Kurosu, T. P., Jaross, G., Ahlers, B., Dobber, M., McElroy, C. T., and Choi, Y.: New Era of Air Quality Monitoring from Space: Geostationary Environment Monitoring Spectrometer (GEMS), B. Am. Meteorol. Soc., 101, E1–E22, https://doi.org/10.1175/BAMS-D-18-0013.1, 2020.
Kim, S., Kim, D., Hong, H., Chang, L.-S., Lee, H., Kim, D.-R., Kim, D., Yu, J.-A., Lee, D., Jeong, U., Song, C.-K., Kim, S.-W., Park, S. S., Kim, J., Hanisco, T. F., Park, J., Choi, W., and Lee, K.: First-time comparison between NO2 vertical columns from Geostationary Environmental Monitoring Spectrometer (GEMS) and Pandora measurements, Atmos. Meas. Tech., 16, 3959–3972, https://doi.org/10.5194/amt-16-3959-2023, 2023.
Knowland, K. E., Keller, C. A., Wales, P. A., Wargan, K., Coy, L., Johnson, M. S., Liu, J., Lucchesi, R. A., Eastham, S. D., Fleming, E., Liang, Q., Leblanc, T., Livesey, N. J., Walker, K. A., Ott, L. E., and Pawson, S.: NASA GEOS Composition Forecast Modeling System GEOS-CF v1.0: Stratospheric Composition, J. Adv. Model. Earth Sy., 14, e2021MS002852, https://doi.org/10.1029/2021MS002852, 2022.
Kwon, H.-A., Park, R. J., González Abad, G., Chance, K., Kurosu, T. P., Kim, J., De Smedt, I., Van Roozendael, M., Peters, E., and Burrows, J.: Description of a formaldehyde retrieval algorithm for the Geostationary Environment Monitoring Spectrometer (GEMS), Atmos. Meas. Tech., 12, 3551–3571, https://doi.org/10.5194/amt-12-3551-2019, 2019.
Lambert, J.-C., Keppens, A., Compernolle, S., Eichmann, K.-U., Graaf, M. d., Hubert, D., Langerock, B., Ludewig, A., Sha, M. K., Verhoelst, T., Wagner, T., Ahn, C., Argyrouli, A., Balis, D., Chan, K. L., Coldewey-Egbers, M., Smedt, I. D., Eskes, H., Fjæraa, A. M., Garane, K., Gleason, J. F., Goutail, F., Granville, J., Hedelt, P., Ahn, C., Heue, K.-P., Jaross, G., Kleipool, Q., Koukouli, M., Lutz, R., Velarte, M. C. M., Michailidis, K., Nanda, S., Niemeijer, S., Pazmiño, A., Pinardi, G., Richter, A., Rozemeijer, N., Sneep, M., Zweers, D. S., Theys, N., Tilstra, G., Torres, O., Valks, P., Geffen, J. v., Vigouroux, C., Wang, P., and Weber, M.: Quarterly Validation Report of the Copernicus Sentinel-5 Precursor Operational Data Products #21: April 2018–November 2023, 194, Copernicus Atmospheric Mission Performance Cluster Service, S5P-MPC-IASB-ROCVR-21.01.00-20231218, DI-MPC-ROCVR/TD-VALREP, 2023.
Lamsal, L. N., Duncan, B. N., Yoshida, Y., Krotkov, N. A., Pickering, K. E., Streets, D. G., and Lu, Z.: U.S. NO2 trends (2005–2013): EPA Air Quality System (AQS) data versus improved observations from the Ozone Monitoring Instrument (OMI), Atmos. Environ., 110, 130–143, https://doi.org/10.1016/j.atmosenv.2015.03.055, 2015.
Lee, G. T., Park, R. J., Kwon, H.-A., Ha, E. S., Lee, S. D., Shin, S., Ahn, M.-H., Kang, M., Choi, Y.-S., Kim, G., Lee, D.-W., Kim, D.-R., Hong, H., Langerock, B., Vigouroux, C., Lerot, C., Hendrick, F., Pinardi, G., De Smedt, I., Van Roozendael, M., Wang, P., Chong, H., Cho, Y., and Kim, J.: First evaluation of the GEMS formaldehyde product against TROPOMI and ground-based column measurements during the in-orbit test period, Atmos. Chem. Phys., 24, 4733–4749, https://doi.org/10.5194/acp-24-4733-2024, 2024.
Levelt, P. F., Oord, G. H. J. v. d., Dobber, M. R., Malkki, A., Huib, V., Johan de, V., Stammes, P., Lundell, J. O. V., and Saari, H.: The ozone monitoring instrument, IEEE T. Geosci. Remote Sens., 44, 1093–1101, https://doi.org/10.1109/TGRS.2006.872333, 2006.
Li, Y., Xing, C., Peng, H., Song, Y., Zhang, C., Xue, J., Niu, X., and Liu, C.: Long-term observations of NO2 using GEMS in China: Validations and regional transport, Sci. Total Environ., 904, 166762, https://doi.org/10.1016/j.scitotenv.2023.166762, 2023.
Liu, F., Beirle, S., Zhang, Q., van der A, R. J., Zheng, B., Tong, D., and He, K.: NOx emission trends over Chinese cities estimated from OMI observations during 2005 to 2015, Atmos. Chem. Phys., 17, 9261–9275, https://doi.org/10.5194/acp-17-9261-2017, 2017.
Lundberg, S. M., Erion, G., Chen, H., DeGrave, A., Prutkin, J. M., Nair, B., Katz, R., Himmelfarb, J., Bansal, N., and Lee, S.-I.: From local explanations to global understanding with explainable AI for trees, Nature Machine Intelligence, 2, 56–67, https://doi.org/10.1038/s42256-019-0138-9, 2020.
Martin, R. V., Jacob, D. J., Chance, K., Kurosu, T. P., Palmer, P. I., and Evans, M. J.: Global inventory of nitrogen oxide emissions constrained by space-based observations of NO2 columns, J. Geophys. Res.-Atmos., 108, https://doi.org/10.1029/2003JD003453, 2003.
Miyazaki, K., Eskes, H., Sudo, K., Boersma, K. F., Bowman, K., and Kanaya, Y.: Decadal changes in global surface NOx emissions from multi-constituent satellite data assimilation, Atmos. Chem. Phys., 17, 807–837, https://doi.org/10.5194/acp-17-807-2017, 2017.
Munro, R., Lang, R., Klaes, D., Poli, G., Retscher, C., Lindstrot, R., Huckle, R., Lacan, A., Grzegorski, M., Holdak, A., Kokhanovsky, A., Livschitz, J., and Eisinger, M.: The GOME-2 instrument on the Metop series of satellites: instrument design, calibration, and level 1 data processing – an overview, Atmos. Meas. Tech., 9, 1279–1301, https://doi.org/10.5194/amt-9-1279-2016, 2016.
National Institute of Environmental Research (NIER): Geostationary Environment Monitoring Spectrometer (GEMS) Algorithm Theoretical Basis Document VOC (HCHO/CHOCHO) Retrieval Algorithm, https://nesc.nier.go.kr/en/html/satellite/doc/doc.do (last access: 3 September 2024), 2020a.
National Institute of Environmental Research (NIER): Geostationary Environment Monitoring Spectrometer (GEMS) Algorithm Theoretical Basis Document NO2 Retrieval Algorithm, https://nesc.nier.go.kr/en/html/satellite/doc/doc.do (last access: 3 September 2024), 2020b.
NESC: GEMS L2 data, available upon request and approval from PI, NESC [data set], https://nesc.nier.go.kr/en/html/index.do, last access: 4 September 2024.
Oak, Y.: A bias-corrected GEMS geostationary satellite product for nitrogen dioxide using machine learning to enforce consistency with the TROPOMI satellite instrument, V1, Harvard Dataverse [data set], https://doi.org/10.7910/DVN/ZQQJRO, 2024.
Palmer, P. I., Jacob, D. J., Chance, K., Martin, R. V., Spurr, R. J. D., Kurosu, T. P., Bey, I., Yantosca, R., Fiore, A., and Li, Q.: Air mass factor formulation for spectroscopic measurements from satellites: Application to formaldehyde retrievals from the Global Ozone Monitoring Experiment, J. Geophys. Res.-Atmos., 106, 14539–14550, https://doi.org/10.1029/2000JD900772, 2001.
Pandonia: Pandonia Global Network, Pandonia [data set], https://www.pandonia-global-network.org, last access: 3 September 2024.
Park, J., Park, J.-S., Santana Díaz, D., Gebetsberger, M., Mueller, M., Shalaby, L., Tiefengraber, M., Kim, H.-J., Park, S. S., Song, C.-K., and Kim, S.-W.: Spatiotemporal inhomogeneity of total column NO2 in a polluted urban area inferred from TROPOMI and Pandora intercomparisons, GISci. Remote Sens., 59, 354–373, https://doi.org/10.1080/15481603.2022.2026640, 2022.
Pinardi, G., Van Roozendael, M., Hendrick, F., Theys, N., Abuhassan, N., Bais, A., Boersma, F., Cede, A., Chong, J., Donner, S., Drosoglou, T., Dzhola, A., Eskes, H., Frieß, U., Granville, J., Herman, J. R., Holla, R., Hovila, J., Irie, H., Kanaya, Y., Karagkiozidis, D., Kouremeti, N., Lambert, J.-C., Ma, J., Peters, E., Piters, A., Postylyakov, O., Richter, A., Remmers, J., Takashima, H., Tiefengraber, M., Valks, P., Vlemmix, T., Wagner, T., and Wittrock, F.: Validation of tropospheric NO2 column measurements of GOME-2A and OMI using MAX-DOAS and direct sun network observations, Atmos. Meas. Tech., 13, 6141–6174, https://doi.org/10.5194/amt-13-6141-2020, 2020.
Platt, U.: Differential Optical Absorption Spectroscopy (DOAS), in: Air monitoring by spectroscopic techniques, edited by: Sigrist, M. W., Chemical Analysis Series, 127, John Wiley, 27–76, https://doi.org/10.1002/9780470027318.a0706, 1994.
Spurr, R. and Christi, M.: On the generation of atmospheric property Jacobians from the (V)LIDORT linearized radiative transfer models, J. Quant. Spectrosc. Ra., 142, 109–115, https://doi.org/10.1016/j.jqsrt.2014.03.011, 2014.
Stammes, P.: Spectral radiance modeling in the UV-visible range, in: IRS 2000: Current problems in atmospheric radiation, edited by: Smith, W. L. and Timofeyev, Y. M., A. Deepak Publishing, Hampton, VA, 385–388, ISBN 0937194433, 2001.
The International GEOS-Chem User Community: geoschem/GCClassic: GEOS-Chem 13.0.0 (13.0.0), Zenodo [data set], https://doi.org/10.5281/zenodo.4618180, 2021.
Travis, K. R., Jacob, D. J., Fisher, J. A., Kim, P. S., Marais, E. A., Zhu, L., Yu, K., Miller, C. C., Yantosca, R. M., Sulprizio, M. P., Thompson, A. M., Wennberg, P. O., Crounse, J. D., St. Clair, J. M., Cohen, R. C., Laughner, J. L., Dibb, J. E., Hall, S. R., Ullmann, K., Wolfe, G. M., Pollack, I. B., Peischl, J., Neuman, J. A., and Zhou, X.: Why do models overestimate surface ozone in the Southeast United States?, Atmos. Chem. Phys., 16, 13561–13577, https://doi.org/10.5194/acp-16-13561-2016, 2016.
Valin, L. C., Russell, A. R., and Cohen, R. C.: Variations of OH radical in an urban plume inferred from NO2 column measurements, Geophys. Res. Lett., 40, 1856–1860, https://doi.org/10.1002/grl.50267, 2013.
van Geffen, J. H. G. M., Eskes, H. J., Boersma, K. F., and Veefkind, J. P.: TROPOMI ATBD of the total and tropospheric NO2 data products, S5P-KNMI-L2-0005-RP, CI-7430-ATBD, 2022.
Veefkind, J. P., Aben, I., McMullan, K., Förster, H., de Vries, J., Otter, G., Claas, J., Eskes, H. J., de Haan, J. F., Kleipool, Q., van Weele, M., Hasekamp, O., Hoogeveen, R., Landgraf, J., Snel, R., Tol, P., Ingmann, P., Voors, R., Kruizinga, B., Vink, R., Visser, H., and Levelt, P. F.: TROPOMI on the ESA Sentinel-5 Precursor: A GMES mission for global observations of the atmospheric composition for climate, air quality and ozone layer applications, Remote Sens. Environ., 120, 70–83, https://doi.org/10.1016/j.rse.2011.09.027, 2012.
Wang, C., Wang, T., Wang, P., and Rakitin, V.: Comparison and Validation of TROPOMI and OMI NO2 Observations over China, Atmosphere, 11, 636, https://doi.org/10.3390/atmos11060636, 2020.
Wang, C., Wu, Q., Weimer, M., and Zhu, E.: Flaml: A fast and lightweight automl library, Proceedings of Machine Learning and Systems, 3, 434–447, 2021.
Williams, J. E., Boersma, K. F., Le Sager, P., and Verstraeten, W. W.: The high-resolution version of TM5-MP for optimized satellite retrievals: description and validation, Geosci. Model Dev., 10, 721–750, https://doi.org/10.5194/gmd-10-721-2017, 2017.
Yang, L. H., Jacob, D. J., Colombi, N. K., Zhai, S., Bates, K. H., Shah, V., Beaudry, E., Yantosca, R. M., Lin, H., Brewer, J. F., Chong, H., Travis, K. R., Crawford, J. H., Lamsal, L. N., Koo, J.-H., and Kim, J.: Tropospheric NO2 vertical profiles over South Korea and their relation to oxidant chemistry: implications for geostationary satellite retrievals and the observation of NO2 diurnal variation from space, Atmos. Chem. Phys., 23, 2465–2481, https://doi.org/10.5194/acp-23-2465-2023, 2023.
Yang, L. H., Jacob, D. J., Dang, R., Oak, Y. J., Lin, H., Kim, J., Zhai, S., Colombi, N. K., Pendergrass, D. C., Beaudry, E., Shah, V., Feng, X., Yantosca, R. M., Chong, H., Park, J., Lee, H., Lee, W.-J., Kim, S., Kim, E., Travis, K. R., Crawford, J. H., and Liao, H.: Interpreting Geostationary Environment Monitoring Spectrometer (GEMS) geostationary satellite observations of the diurnal variation in nitrogen dioxide (NO2) over East Asia, Atmos. Chem. Phys., 24, 7027–7039, https://doi.org/10.5194/acp-24-7027-2024, 2024.
Zhang, Y., Lin, J., Kim, J., Lee, H., Park, J., Hong, H., Van Roozendael, M., Hendrick, F., Wang, T., Wang, P., He, Q., Qin, K., Choi, Y., Kanaya, Y., Xu, J., Xie, P., Tian, X., Zhang, S., Wang, S., Cheng, S., Cheng, X., Ma, J., Wagner, T., Spurr, R., Chen, L., Kong, H., and Liu, M.: A research product for tropospheric NO2 columns from Geostationary Environment Monitoring Spectrometer based on Peking University OMI NO2 algorithm, Atmos. Meas. Tech., 16, 4643–4665, https://doi.org/10.5194/amt-16-4643-2023, 2023.
Zoogman, P., Liu, X., Suleiman, R. M., Pennington, W. F., Flittner, D. E., Al-Saadi, J. A., Hilton, B. B., Nicks, D. K., Newchurch, M. J., Carr, J. L., Janz, S. J., Andraschko, M. R., Arola, A., Baker, B. D., Canova, B. P., Chan Miller, C., Cohen, R. C., Davis, J. E., Dussault, M. E., Edwards, D. P., Fishman, J., Ghulam, A., González Abad, G., Grutter, M., Herman, J. R., Houck, J., Jacob, D. J., Joiner, J., Kerridge, B. J., Kim, J., Krotkov, N. A., Lamsal, L., Li, C., Lindfors, A., Martin, R. V., McElroy, C. T., McLinden, C., Natraj, V., Neil, D. O., Nowlan, C. R., O'Sullivan, E. J., Palmer, P. I., Pierce, R. B., Pippin, M. R., Saiz-Lopez, A., Spurr, R. J. D., Szykman, J. J., Torres, O., Veefkind, J. P., Veihelmann, B., Wang, H., Wang, J., and Chance, K.: Tropospheric emissions: Monitoring of pollution (TEMPO), J. Quant. Spectrosc. Ra., 186, 17–39, https://doi.org/10.1016/j.jqsrt.2016.05.008, 2017.
- Abstract
- Introduction
- GEMS, TROPOMI, and Pandora operational products
- Reprocessing of GEMS and TROPOMI retrievals to use common vertical profiles
- Bias correction in GEMS using machine learning
- Conclusions
- Data availability
- Author contributions
- Competing interests
- Disclaimer
- Special issue statement
- Acknowledgements
- Financial support
- Review statement
- References