the Creative Commons Attribution 4.0 License.
the Creative Commons Attribution 4.0 License.
 | 09 Oct 2024
Troposphere–stratosphere-integrated bromine monoxide (BrO) profile retrieval over the central Pacific Ocean
François Hendrick
Douglas Kinnison
Christopher F. Lee
Michel Van Roozendael
Rainer Volkamer
Bromine monoxide (BrO) is relevant to atmospheric oxidative capacity, affecting the lifetime of greenhouse gases (i.e., methane, dimethylsulfide) and mercury oxidation. However, measurements of BrO radical vertical profiles are rare, and BrO is highly variable. As a result, the few available aircraft observations in different regions of the atmosphere are not easily reconciled. Autonomous multi-axis differential optical absorption spectroscopy (MAX-DOAS) instruments placed at remote mountaintop observatories (MT-DOAS) present a cost-effective alternative to aircraft, with the potential to probe the climate-relevant yet understudied free troposphere more routinely.
Here, we describe an innovative full-atmosphere BrO and formaldehyde (HCHO) profile retrieval algorithm using MT-DOAS measurements at Mauna Loa Observatory (MLO – 19.536° N, 155.577° W; 3401 m a.s.l.). The retrieval is based on time-dependent optimal estimation and simultaneously inverts 190+ individual BrO (and formaldehyde, HCHO) SCDs (slant column densities; SCD = dSCD + SCDRef) from solar stray light spectra measured in the zenith and off-axis geometries at high and low solar zenith angles (92° > SZA > 30°) to derive BrO concentration profiles from 1.9 to 35 km with 7.5 degrees of freedom (DoFs). Two case study days are characterized by the absence (26 April 2017, base case) and presence of a Rossby-wave-breaking double tropopause (29 April 2017, RW-DT case). Stratospheric-BrO vertical columns are nearly identical on both days (VCD = (1.5 ± 0.2) × 1013 molec. cm−2), and the stratospheric-BrO profile peaks at a lower altitude during the RW-DT (1.6–2.0 DoFs). Tropospheric-BrO VCDs increase from (0.70 ± 0.14) × 1013 molec. cm−2 (base case) to (1.00 ± 0.14) × 1013 molec. cm−2 (RW-DT) owing to a 3-fold increase in BrO in the upper troposphere (1.7–1.9 DoFs). BrO at MLO increases from (0.23 ± 0.03) pptv (base case) to (0.46 ± 0.03) pptv (RW-DT) and is characterized by an added time resolution (∼ 3.8 DoFs). Up to (0.9 ± 0.1) pptv BrO is observed above MLO in the lower free troposphere in the absence of the double tropopause.
We validate the retrieval using aircraft BrO profiles and in situ HCHO measurements aboard the NSF/NCAR GV aircraft above MLO (11 January 2014) that establish BrO peaks around 2.4 pptv above 13 km in the upper troposphere–lower stratosphere (UTLS) during a similar RW-DT event (0.83 × 10¹³ molec. cm2 tropospheric-BrO VCD above 2 km). The tropospheric-BrO profile measured using MT-DOAS (RW-DT case) and using the aircraft agree well (after averaging-kernel smoothing). Furthermore, these tropospheric-BrO profiles over the central Pacific Ocean are found to closely resemble those over the eastern Pacific Ocean (2–14 km) and are in contrast to those over the western Pacific Ocean, where a C-shaped tropospheric-BrO profile shape has been observed.
- Article
(5073 KB) - Full-text XML
-
Supplement
(5650 KB) - BibTeX
- EndNote


Bromine has been of particular interest to atmospheric chemists since its role in the stratospheric ozone (O3) hole prompted the Copenhagen Amendment to the Montreal Protocol. Gas-phase atmospheric bromine can be divided into organic species and inorganic species (Bry). Bry can be further divided into active bromine (BrOx≡ Br + BrO), reservoir species (HBr, HOBr, BrNO2, and BrONO2), and photolabile compounds (Br2 and BrCl). Atomic bromine (Br) and bromine monoxide (BrO) radicals rapidly interconvert, primarily by reaction with O3 and photolysis. The atmospheric budget of BrOx – and, to a large extent, Bry – is principally constrained by measurements of bromine monoxide (BrO) utilizing differential optical absorption spectroscopy (DOAS).
BrOx impacts chemistry in the troposphere and stratosphere by modifying (O3) but also in other ways. First, the most direct impact on O3 is direct catalytic photochemical destruction (von Glasow et al., 2004; Read et al., 2008; Saiz-Lopez and von Glasow, 2012; Simpson et al., 2015; Schmidt et al., 2016; Wang et al., 2015; Wofsy et al., 1975). Second, BrOx modifies NOx (≡ NO + NO2) (Evans et al., 2003; Custard et al., 2015; Lary, 2005), increasing the ratio of (Bloss et al., 2010), and, as an overall sink of NOx, suppresses O3 production (Schmidt et al., 2016). Third, BrOx increases oxidative capacity and exerts a number of competing effects on HOx (≡ OH + HO2) (Stone et al., 2018). Fourth, bromine atoms are understood to be the primary oxidant of mercury in the atmosphere (Holmes et al., 2006; Coburn et al., 2016; Goodsite et al., 2004; Shah et al., 2021) and an important loss mechanism for dimethyl sulfide (Boucher et al., 2003). Fifth, the net effect of BrOx impacts on O3, NOx, and HOx leads to an increase in the lifetime of CO, hydrocarbons, and climate-active gases such as methane (Lelieveld et al., 1998; Parrella et al., 2012; Saiz-Lopez and von Glasow, 2012; Sherwen et al., 2016; Wang et al., 2021).
Remote sensing of BrO by DOAS from the ground has previously been conducted near the poles (Kreher et al., 1997; Sinnhuber et al., 2002; Schofield et al., 2006; Hendrick et al., 2007), at mid-latitudes (Aliwell et al., 1997, 2002; Sinnhuber et al., 2002; Schofield et al., 2004), in the subtropics (Leser et al., 2003; Coburn et al., 2011, 2016), and in the tropics (Theys et al., 2007). There is also an extensive record of DOAS measurements of BrO from space (Chance, 1998; Wagner et al., 2001; Richter et al., 2002; Hendrick et al., 2009; Theys et al., 2011; Seo et al., 2019). DOAS measurements of BrO in the free troposphere and lower stratosphere from balloons (Fitzenberger et al., 2000; Pundt et al., 2002; Dorf et al., 2006, 2008) and from aircraft (Volkamer et al., 2015; Wang et al., 2015; Werner et al., 2017; Koenig et al., 2017) find that BrO is widespread in the free troposphere but highly variable. Over the Pacific, previous tropospheric measurements have found that BrO mixing ratios increase roughly linearly with altitude over the eastern Pacific, being near or below detection in the boundary layer and greatest below the tropopause (Volkamer et al., 2015; Wang et al., 2015; Dix et al., 2016), while measurements by DOAS (Koenig et al., 2017) and other methods (Le Breton et al., 2017; Chen et al., 2016) find a more C-shaped profile over the western Pacific. The sensitivity of ground-based and space-based measurements to BrO in the free troposphere was apparent even prior to the first profile studies (Harder et al., 1998; Frieß et al., 1999; Van Roozendael et al., 2002). However, the quantification and location of BrO in the free troposphere from the ground and space requires accurate knowledge of the air mass factors (AMFs), which the variability in tropospheric profiles continues to confound.
This work systematically explores the significant information content of a mountaintop (MT)-DOAS for purposes of profiling tropospheric and stratospheric trace gases, which has the potential to help overcome the above-mentioned limitation. Figure 1 illustrates the measurement concept: (1) zenith-sky (ZS)-DOAS measurements under twilight conditions exploit the motion of the sun, varying atmospheric path length and scattering attitude to profile the stratosphere, while (2) off-axis (OA)-DOAS measurements during the day profile the troposphere. Section 2 introduces the hardware and software methods used, including the DOAS instrumentation (Sect. 2.1), DOAS fit settings (Sect. 2.2), radiative transfer models used to account for repartitioning of bromine during twilight (Sect. 2.3), and data taken from global models (Sect. 2.4), and introduces the time-dependent optimal-estimation approach (accounts for non-photochemical diurnal variability, Sect. 2.5). Section 3 introduces the case studies (Sect. 3.1) and discusses the results, including those of sensitivity studies in DOAS fitting that exploit recent advances in the knowledge of absorption cross-section spectra (Sect. 3.2), the full atmosphere profile retrievals (Sect. 3.3), and evaluation of the profiles using aircraft measurements (Sect. 3.4); finally, the results are placed in context with previous aircraft campaigns (Sect. 3.5). Section 4 presents the conclusions and gives an outlook on opportunities for future work.

Figure 1Principles and components of integrated BrO retrieval: from left to right. At twilight, high-solar-zenith-angle (SZA) measurements are taken in a zenith-sky (ZS) geometry and must account for the rapid photochemical changes to bromine in both time and along the light path. BrO mixing ratios are shown for the stratosphere (solid line), western Pacific (long dashes), and eastern Pacific (fine dashes) next to the box air mass factors (boxAMF), showing which altitude measurements at different SZAs (matching color to left) they are sensitive to (red SZA = 92°, pink SZA = 88°, orange SZA = 84°). These peak strongly in the stratosphere and more mildly in the tropical transition layer (TTL) and upper free troposphere (uFT). When SZA< 75°, the instrument varies the elevation angle (EA) viewing geometries relative to the horizon (OA). The differential boxAMF relative to a ZS measurement at the same times is shown for different EAs (orange −3°, red 0°, green 30°). These peak below the instrument in the transition layer (TL), at the instrument altitude (lower FT to TL), and in the lower FT. Combining these sensitivities allows for five and a half to six independent measurements conceptually shown as averaging kernels (AVKs) on the right. Far above the instrument, almost three independent partial columns are retrieved; almost two are retrieved in the stratosphere (primarily from ZS-DOAS data); and one is retrieved in the upper FT and TTL through ZS-DOAS and OA-DOAS synergy. Near instrument altitude, there is relatively fine vertical resolution (from OA-DOAS), and three mixing ratios are retrieved.
Data reported herein were principally collected by two multi-axis (MAX)-DOAS instruments: principally, a University of Colorado (CU) mountaintop (MT)-DOAS instrument at Mauna Loa Observatory (MLO), as described in Sect. 2.1.1 (references to the MT-DOAS hereafter refer to this instrument unless otherwise specified), and the CU airborne MAX-DOAS (AMAX-DOAS), as described in Sect. 2.1.2, used for data collection during the CONvective TRansport of Active Species in the Tropics (CONTRAST) field campaign.
2.1 DOAS instrumentation
The MT-DOAS and AMAX-DOAS are broadly similar; solar scattered light enters a telescope and is transported by fiber optic cables to two diffraction spectrographs, which image and save spectra for analysis. The instruments are described below.
2.1.1 MLO MT-DOAS
The CU MT-DOAS at MLO (19.536° N, 155.577° W; 3401 m a.s.l.) is a modified version of that previously deployed at Pensacola, Florida (Coburn et al., 2011). It is also a near-copy of an instrument which participated in the Cabauw Intercomparison of Nitrogen Dioxide Measuring Instruments-2 (CINDI-2) campaign (Kreher et al., 2020), almost matching apart from some precise points in terms of the form factor and spectroscope alignment. The system was deployed to MLO in February 2017 and has operated near-continuously since then. The system will be described briefly, considering modifications since the Pensacola deployment and the particulars of the setup at MLO; it is highlighted with further details in the Supplement.
The telescope gathers light from a symmetric cone with an opening angle of 0.3°. The anodized aluminum telescope has been ruggedized for the environment of MLO. The 1/4” baseplate has been replaced with 1” of cast aluminum to mitigate possible warping due to extended mechanical stress from mounting during long-term deployments and to provide additional mass as a defense against winds. In addition, a heating element was placed inside the telescope head to provide heating when the temperature dropped below 0 °C, as indicated by a sensor also kept in the housing.
The primary azimuthal viewing direction of the telescope is estimated to be along −50 ± 2°. The telescope head rotates in a plane of elevation angles (EAs) defined relative to the horizontal (positive up, negative down). The telescope has a free line of sight for EA > −4.5° in the primary direction, below which major radiative effects from the reflective roof of the Chin Building are always apparent, and for EA > 7° in the reverse direction (heading 130 ± 2°), below which the line of sight intercepts the ridge of Mauna Loa.
The instrument includes two spectrometers: an Acton SP2356i spectrometer with a PIXIS 400B CCD detector, equipped with UV fluorescence coating (AP) covering 307.6–474.8 nm, and an Ocean Optics QE65000 spectrometer (QE) covering 414.3–1119.7 nm. Atomic emission spectra from Hg and Kr are used to determine the spectral resolutions of 0.593 nm per full width at half-maximum (FWHM) and 1.45 nm for the AP and QE. Spectra collected on the AP can be analyzed for BrO, HCHO, NO2 (360 and 450 nm), O2–O2 (360 nm; hereafter O4), glyoxal (CHOCHO), and iodine oxide (IO) radicals. Spectra on the QE can be analyzed for NO2 (450 and 560 nm), O4 (477 nm), CHOCHO, and H2O. In this work, only BrO, HCHO, NO2, and O4 are presented.
All spectra from the MT-DOAS used in the analysis are collected with 1 min total integration time. The spectrometers are operated synchronously. For 75° < SZA < 110°, spectra were collected in a ZS geometry. For SZA > 92.5°, insufficient photons are collected for meaningful analysis on the AP, and the data are excluded. For SZA < 75°, spectra were collected in the following standard sequence of angles, where angles preceded by † are collected in the reverse azimuthal direction (+130° ± 2): −4.5, −3, −2, −1, 0° (four repeats), 1, 2, 3, 5, 8, 12, 20, 30° (four repeats), 45, 90° (four repeats); †45, †30° (four repeats), †20, †12, †8°. Spectra in both directions were analyzed; however, it was subsequently found that the two viewing directions could not be reproduced simultaneously with 1D radiative transfer modeling, and the data from the reverse direction are not reported here.
For fixed-reference analyses, spectra for both days were analyzed against a 4 min zenith acquisition collected shortly before local noon on 26 April (26 April, 21:18 UTC, 11:18 local time; EA = 90°; SZA = 15.92°), which is later in the morning than the data presented in this work. For moving-reference analyses, the fixed-reference analyses are adjusted by the fitted zenith spectra linearly interpolated in time, which was found to obtain results not statistically distinguishable from irradiance interpolation but is much more time efficient.
2.1.2 AMAX-DOAS
The CU AMAX-DOAS instrument has been deployed during field campaigns in urban air (Oetjen et al., 2013; Baidar et al., 2013) and over remote oceans (Dix et al., 2013; Volkamer et al., 2015) and is described in detail in these papers. The configuration employed during the CONTRAST field campaign is described in Koenig et al. (2017).
Briefly, the CU AMAX-DOAS consists of a wing-mounted pylon containing a motion-stabilized telescope and two spectrographs housed in the interior of the aircraft. One Acton SP2150/PIXIS400B CCD unit (AP1) covers the spectral range from 330 to 470 nm, with 0.7 nm full-width half-maximum (FWHM) optical resolution based on the 404.66 nm Hg line. The other (AP2) measures 440–700 nm at 1.2 nm FWHM resolution based on the 450.24 Kr line. Spectra collected on AP1 are used for the measurement of BrO, glyoxal, HCHO, H2O, IO, NO2 (360 and 450 nm), and O4 (360 nm); spectra collected on AP2 are used for the measurement of NO2 (560 nm) and O4 (477 nm). In this work, only BrO and O4 (360 nm) results will be presented using EA 0° spectra collected with 30 s integration times.
The data presented here were collected towards the end of research flight no. 1 (RF01; 11 January 2014) of the CONTRAST field campaign, when the aircraft conducted a deep vertical profile in the vicinity of MLO. Four RF01 spectra were analyzed against a 2 min zenith acquisition collected during the period presented (12 January, 00:47 UTC; 11 January, 14:47 local; 20.12° N, 155.81° W; 3.02 km a.s.l., EA = 90°, SZA = 53.28°). Flight segments are designated following a system described more fully in Koenig et al. (2017); in brief, monotonic ascents and descents for a given flight are assigned sequentially as (RF no.-aa), such that all ascents have odd numbers for aa, and all descents have even numbers for aa.
2.2 DOAS fitting
Trace gases were fit using the DOAS method (Platt and Stutz, 2008) using the QDOAS software package (Danckaert et al., 2012). Fit settings for the MT-DOAS are summarized in Table S1, and fit settings for the AMAX-DOAS are summarized in Table S2. The wavelength calibration for each spectrum is precisely determined by measuring the atomic emission lines as described in Sect. 2.1. This slit function was further refined by fitting two wavelength-dependent width parameters, using the Kurucz spectrum as a reference (Chance and Kurucz, 2010; Kurucz et al., 1984). The slit function was fixed for final calibration of the instrument wavelength mapping. High-resolution laboratory cross-sections (species and references given in Table S1 in the Supplement) are convolved with the instrument function for analysis. Broadband extinction including Mie and Rayleigh scattering is accounted for by a polynomial. Trace gases with broadband absorption components such as O3 and NO2 are orthogonalized to this polynomial. A linear intensity offset is included to account for instrumental stray light and imperfect knowledge of the Grainger–Ring effect (Grainger and Ring, 1962). Absorption by relevant species is fitted simultaneously using the non-linear Marquardt–Levenberg algorithm with full non-linear treatment reserved for shift, stretch, and intensity offsets (Danckaert et al., 2012). This is done in finite wavelength windows targeting specific trace gases. The determination of optimized fit settings is a major product of this work; therefore, relevant sensitivity studies and final fit settings are discussed in greater length in Sect. 3.2 and 3.3 and are presented in Fig. 3.
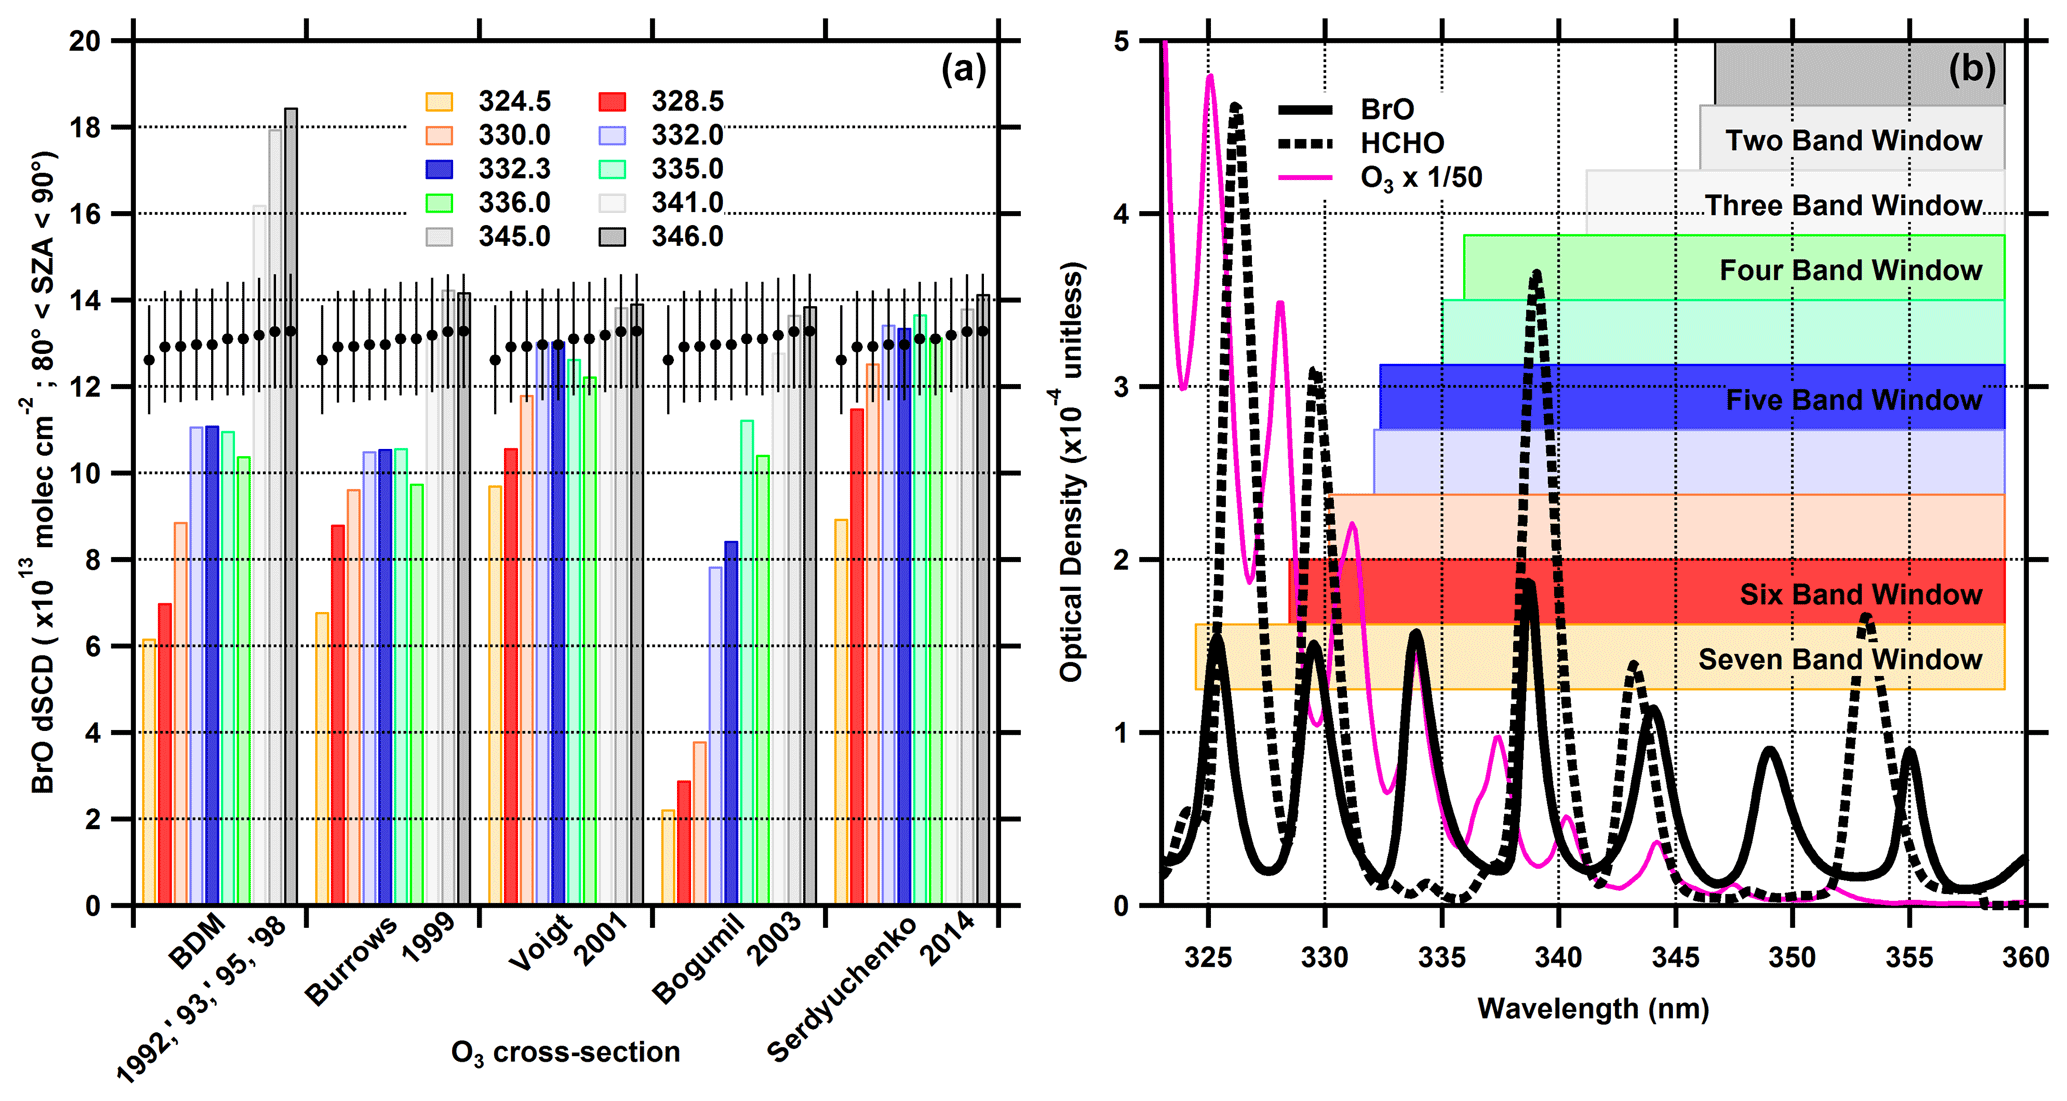
Figure 2Advances in O3 molecular spectroscopy and the effect on a robust BrO fit: (a) average BrO dSCD fits for twilight data in different spectral fitting windows when using different O3 cross-sections, (b) representative optical densities as observed at MLO for SZA = 70° and EA = 0°. Colored bars indicate DOAS fitting windows for which the short-wavelength edges are given in the legend (the long-wavelength edge is always 359 nm) and are graphically shown on the right to indicate the number of BrO bands included. Bars on the left compare the average measured BrO dSCD (80° < SZA < 90°) with that expected due to changes in light paths for the different windows (due primarily to O3; black circles are scaled to match the average from windows with five BrO bands or fewer), and error bars indicate the average DOAS fit uncertainty in the same SZA range.

Figure 3Summary of MT-DOAS BrO retrieval methods: rectangles identify data products, while ellipses indicate processing tools. In orange are spectral fitting processes and products, in green are radiative transfer modeling tools and products, in yellow are chemical data products and tools, and in blue are optimal-estimation and other retrieval methods for data products reported in this work.
2.3 Radiative transfer
Two radiative transfer codes were used for this study. For ZS-DOAS measurements, the discrete ordinate method radiative transfer (DISORT) was used, and for OA measurements, the Monte Carlo atmospheric radiative transfer inversion model (McArtim) was used. Weighting functions used for the retrieval were calculated from both models using the same vertical grid consisting of the following layers (given as altitude a.s.l.): 0–0.9 km, 0.5 km layers between 0.9 to 3.4 km (instrument altitude), 0.5 km layers from 3.4 to 7.4 km, and 2 km layers from 7.4 to 53.4 km. Layers below the instrument (necessary for downward-looking angles) were not represented in DISORT, while longitudinal modeling of atmospheric change along the solar light path (necessary for high SZA) was not modeled in McArtim. For SZA < 80° and altitudes above ∼ 7.4 km, the results from both models agreed within 1.06 % root-mean-square (rms) difference.
2.3.1 DISORT with PSCBOX
The principal forward model for stratospheric and ZS-DOAS measurements was the UVspec/DISORT package (Mayer and Kylling, 2005), which utilizes the discrete ordinate method in a pseudo-spherical geometry approximation. The application of the model to twilight measurements by ZS-DOAS is described in detail in Hendrick et al. (2004), and it has been utilized since for BrO (Hendrick et al., 2007; Theys et al., 2007, 2011).
The model was run in multiple-scattering mode, including Rayleigh and Mie scattering and molecular absorption. Pressure and temperature profiles were based on those from the CAM-Chem model (see Sect. 2.4). Stratospheric aerosol was modeled to represent background conditions, and tropospheric aerosol was derived from inversions reproducing the observed O4, in the course of which albedo was also optimized (see the Supplement for details). UVspec/DISORT was run with the instrument at the surface, placed at 3.4 km altitude, with only the layers above this altitude being treated in the model. Rapid photochemical changes at twilight cause concentrations, particularly of BrO and NO2, to change along the light path, impacting radiative transfer (Sinnhuber et al., 2002). This is represented in UVspec/DISORT by introducing a second dimension with the different profiles along the light path populated using the stacked-box photochemical model PSCBOX (Errera and Fonteyn, 2001; Hendrick et al., 2004). PSCBOX was run with 20 altitude levels between ∼ 10 and ∼ 55 km (altitudes below 10 km were assumed to have the same chemical partitioning as the lowest level), with chemical species from the SLIMCAT 3-D chemical transport model (Chipperfield, 2006; Hendrick et al., 2007). The model has been updated to reflect the latest bromine chemistry taken from the JPL 2015 compilation (Burkholder et al., 2015).
While McArtim is, in principle, capable of modeling stratospheric radiative transfer at twilight, a suitable 2-D implementation of McArtim to be used in conjunction with a photochemical model (i.e., UVspec) was not straightforward. We use DISORT instead since the 2-D geometry is defined along the solar azimuth, which is ideal for accounting for photochemical effects along the principal line of sight. For ZS data, this agrees with McArtim results, including lower altitudes with better than ∼ 1 % differences.
2.3.2 McArtim
The principal forward model for MAX-DOAS measurements and aircraft measurements was McArtim (Deutschmann et al., 2011) in a 1D spherical atmosphere. The model includes Rayleigh and Mie scattering and molecular absorption. Pressure and temperature profiles were based on those from the CAM-Chem model (see Sect. 2.4). Tropospheric aerosol was assumed to be marine for both MT-DOAS and AMAX-DOAS simulations: non-absorbing Henyey–Greenstein aerosol phase function with asymmetry parameter g=0.72 above the boundary layer and g=0.77 in the boundary layer. The retrieval of aerosol extinction was based on reproducing O4 signals measured by DOAS at 360 nm (Spinei et al., 2015; Volkamer et al., 2015) and utilized a layering approach. The surface was set at sea level with an albedo of 0.05 at 360 nm and 0.08 at 477 nm. For MT-DOAS, sensitivity studies were conducted for the surface altitude and albedo (see the Supplement for details).
For MT-DOAS retrievals, the atmosphere was initialized with a 200 m grid from the surface to 7.4 km altitude. Pressure, temperature, humidity, and major absorber (O3 and NO2) profiles were based on those from the CAM-Chem model (see Sect. 2.4). Aerosol conditions for the data in this work had significant extinction below the instrument but sub-Rayleigh extinction near and above the instrument (see Fig. S5, Sect. 3.3.1). For these conditions, each EA was given an altitude sensitivity mapping, and the extinction profile was adjusted starting from lower EA and lower altitudes for better agreement with O4 SCDs. The a priori aerosol profile used consisted of constant aerosol extinction below 2 km, exponentially decreasing with altitude with a scale height of 2 km, with the magnitude first being manually determined for approximate agreement. EAs were proceeded through from lowest (−4.5°) to highest (45°). This bottom-up approach, as opposed to a top-down approach, was chosen because representing aerosols and/or clouds below instrument altitude was needed to reproduce O4 observations at higher EAs. The bottom-up sequence of O4 comparisons and adjustments was run six times independently for each scan. For morning twilight measurements, the aerosol profile from the first scan was used.
The aerosol extinction used for AMAX-DOAS retrievals is based on that used in Baidar et al. (2013). In brief, aircraft limb measurements are collected on a 200 m grid with aerosol added to or removed from layers until the average difference between simulated and measured O4 signals is within a specified tolerance. This procedure is repeated for each grid layer from the top of the profile downwards and is then iterated with decreasing tolerance. Clouds which are present are introduced based on camera imagery from the GV, assumed to have a constant optical density distribution, the magnitude of which is adjusted manually to reproduce signals measured above and below the cloud. Pressure, temperature, humidity, and major absorber (O3 and NO2) profiles were based on aircraft measurements below the aircraft ceiling altitude and were based on CAM-Chem above this altitude.
2.4 CAM-Chem
The 3-D chemistry climate model Community Atmospheric Model with Chemistry (CAM-Chem) is described in Lamarque et al. (2012). In the present configuration, the meteorological analyses (from GEOS-5) specific to the observational periods are used to constrain the meteorological fields (horizontal wind components and temperature) in CAM-Chem. The horizontal resolution is 0.9° × 1.25°, and the vertical resolution of 52 levels includes full coverage of the troposphere and stratosphere, with a full representation of tropospheric and stratospheric chemistry.
For bromine chemistry, the version used here includes geographically distributed and time-dependent oceanic emissions of six bromocarbons (CHBr3, CH2Br2, CH2BrCl, CHBrCl2, CHBr2Cl, CH2IBr), as well as an additional source of inorganic bromine and chlorine in the lower troposphere due to sea salt aerosol (SSA) dehalogenation (Ordóñez et al., 2012; Saiz-Lopez et al., 2012; Fernandez et al., 2014). It considers heterogeneous processes for halogen species on a variety of surfaces, including uptake and recycling of HBr, HOBr, and BrONO2 on ice crystals and sulfate aerosols.
CAM-Chem fields for pressure, temperature, water vapor, O3, and NO2 were used to constrain the atmosphere for MT-DOAS radiative transfer simulations and above flight altitude for AMAX-DOAS radiative transfer simulations. For MT-DOAS measurements, data were interpolated from the surrounding points horizontally and then were averaged from the 30 min output over the period of the included scans (the NO2 field was still adjusted spatiotemporally based on PSCBOX; see Sect. 2.3.1). For AMAX-DOAS, data were averaged from extracted curtains for the individual profiles. CAM-Chem profiles extracted for the purposes of comparison with measurements were extracted the same way.
2.5 Retrieval methods
The BrO profiles reported herein were retrieved using optimal estimation (Rodgers, 2000). In brief, the MT-DOAS measurement vector, y, consists of SCDs (= dSCD + SCDRef, Sect. 2.2 and 2.5.1.), where each measurement is a function of the absorber profile x and the weighing function K (determined by the radiative transfer model, RTM, Sect. 2.3) such that y=Kx. The solution to the inverse problem consists of finding the maximum likelihood estimator of the profile given an a priori profile xa, the measurements y, and their respective covariance matrices Sa and Sε. BrO is an optically thin absorber (i.e., K is independent of x), and, for this linear case, the solution is given by
The MT-DOAS retrieval was developed for this work and includes a number of steps described in more detail below. The AMAX-DOAS optimal-estimation inversion was more straightforward. HCHO and BrO dSCDs were used with the DOAS fit errors employed for the uncertainties. The three individual aircraft profiles (two descents and one ascent; Sect. 3.4) were inverted separately.
2.5.1 Photochemical Langley plot
For the MT-DOAS inversion, SCDs were used as the elements of y, which required the determination of SCDRef. The primary method for doing so was through use of a Langley plot of dSCDs against air mass factors (AMFs). However, given that the BrO profile changes rapidly during twilight, both as a function of SZA and along the light path, a traditional Langley plot analysis is not possible. We employ a method adapted from Hendrick et al. (2007) which normalizes the AMF to a single reference SZA (70°), correcting for photochemical effects. Specifically, we define AMF(SZA) = SCDmodeled(SZA)/VCD(70°), where SCDmodeled (SZA) is computed using DISORT and PSCBOX, as described above in Sect. 2.3.1. Particular instances of DISORT and PSCBOX are selected based on the month of the year, the latitude, and the bromine loading and are interpolated to more precisely match a preliminarily chosen value of VCD(70°). This allows for an adapted Langley equation to be defined, namely
where the intercept of a fitted line determines SCDRef, and the slope determines VCD(70°). Significant deviations from linearity would indicate that the time evolution of the BrO profile is not that assumed in the determination of SCDmodeled(SZA) and thereby in AMF(SZA). The value for SCDRef determined by the Langley plot is compared and assessed using the final retrieval results (see Sect. 3.3 for details). SCDRef is added to the dSCDs to obtain SCDs for optimal estimation.
2.5.2 Integrated optimal estimation
The integrated MT-DOAS retrieval required using weighting functions from DISORT and McArtim in tandem. As noted above, to accomplish this, DISORT was used for weighting functions for SZA > 70° (with McArtim used to extend these below 3.4 km), and McArtim was used for the weighting functions for SZA < 70°. Both sets of weighting functions were adjusted to account for the photochemical change by applying the same methodology as used for AMFs described in Sect. 2.5.1. K is multiplied element-wise by (xmodSZA/), where xmodSZA is the BrO profile at some SZA, and xmod70°SZA is the profile at SZA = 70°. Note that, because profile shape changes as a function of SZA, this adjustment varies with altitude unlike that described for AMF.
For each day, all measurements were considered simultaneously under the assumption of constant Bry, i.e., that the changes in the BrO profile are captured by the photochemical model and reflect only chemical repartitioning.
The MT-DOAS results reported herein used an a priori BrO profile composed of 0.5 pptv below 17.4 km and set to 50 % of the stratospheric climatology (Theys et al., 2011) above 17.4 km. For the measurement covariance Sε, the uncertainties were assumed to be uncorrelated and equivalent to the DOAS fit errors. Sensitivity studies were conducted, accounting additionally for the uncertainty in the BrO cross-section (∼ 10.5 %) and the constrained DOAS fits. The a priori covariance Sa was computed as 100 % of the a priori below 15.4 km and 50 % above this altitude, with Gaussian correlation heights (Clémer et al., 2010) of 1 and 4 km below and above 15.4 km altitude, respectively. This results in the diagonal elements of Sa being relatively similar to altitude compared to using the climatology.
The conventional approach to retrieving trace gas profiles changing in time from data acquired by a MAX-DOAS instrument is to retrieve separate profiles from individual OA angle scans – often in a moving-reference analysis to minimize the effect of signals mostly captured by ZS data. Where information content is limited, scans might also be averaged or otherwise combined. One limitation of such an approach relates to the question of how to combine it with a stratospheric profile retrieved using ZS-DOAS data. Using the nearest zenith reference removes most dependence on the stratospheric profile, but, to our knowledge, existing approaches effectively impose a time dependence on the stratosphere (most typically constancy), as does our time-independent retrieval. Furthermore, the constraint, although conceptually placed on the stratosphere, also includes altitudes where the information content from an individual OA scan is limited and where ZS variation contributes significantly, such as in the upper troposphere, and where the various constraints are tied together. The different scans are contingent on the imposed trend and are not statistically fully independent, which can obscure the statistical significance of comparing scans. Here, we define an alternate approach where a consistent time function f(t) for changes in the profile is used but where different layers in the atmosphere can vary separately.
2.5.3 Time-dependent retrieval
The conventional time-independent retrieval assumes constant Bry (a static atmosphere), with the only changes in BrO being those predicted by the photochemical model (Bry repartitions as a function of SZA). This assumption was ultimately found to be invalid for one day where dynamical changes in Bry were observed in addition to chemical repartitioning (see Sect. 3.3 and 3.4 for details). We addressed this by augmenting the optimal estimation with time-dependent variables. To our knowledge, such an approach has not been employed for DOAS optimal estimation before; thus, we describe it here in detail.
We define the time evolution of the BrO profile at time t(x) in terms of L altitude regions (here L=4) consisting of a weighted set of related atmospheric grid layers (WL), where Bry is expected to evolve consistently such that
where x0 is a vector, i.e., the BrO profile at some reference time (t0) with dimensions of 1 × 36 for this work, I is an identity matrix matching the dimension of x0 for this work (36×36), and f(t): t→ (−1, 1] is a scalar time evolution function such that f(t0)=0. For convenience, we choose t0 to match SZA = 70° so that photochemical and dynamical effects vary on a common time axis. In principle, f(t) could be indexed to the layers L. However, for this work, there was insufficient external information to constrain more than one choice; a single f(t) function describes the relative time variation in all four altitude regions. In practice, only a linear and a ramp function form – which mirrors the stratospheric O3 column on 29 April – were tested for f(t). The choice of the co-domain (−1, 1] is more generally important for reasons outlined below.
WL→ (0, 1] is a matrix of altitude weights defining the mapping of altitude regions L onto the altitude grid that x0 is defined on, constructed such that ΣL WL≤1 for all altitudes, with dimensions of 36 × 4 for this work. For this work, the stricter condition that ΣL WL=1 for all altitudes is fulfilled. Finally, CL are scaling factors describing the proportional change in the BrO profile within the altitude region L, with dimensions of 1 × 4 for this work; e.g., if an element of CL has a value of 1.1, BrO increased by 10 % in that layer when f(t) = 1.
We choose to fully constrain f(t) and WL; as such, the combination of x0 and CL fully specifies the state vector x. We seek to retrieve CL in addition to x0 given a choice of f(t) and WL.
We seek to derive a time-augmented Jacobian starting from the transformation H in terms of a left-side transform matrix K0:
Taking the relevant partial derivatives,
A close observer may notice a potential challenge posed by these equations; the weighting functions for x0 require knowledge of CL, while the weighing functions for CL require knowledge of x0. To resolve this challenge, we take advantage of the fact that the extended definition for x0 still contains a term which is fully independent of CL and approaches the time-independent formulation as t→t0. We therefore leverage the time-independent retrieval (Sect. 2.5.2; already photochemically indexed to t0) to gain imperfect knowledge of x0. This retrieval already averages over the time dependence and should get us close to the true state; as such, we supply it as the a priori for x0 to compute the weighting functions. If the solution is too far from this a priori, however, the computed partial derivatives might no longer be locally valid. To limit this effect, we reduce the a priori covariance for the spatial variables (x0) by a factor of 10. In reporting results, we use the spatial variables (x0) retrieved using the procedure in Sect. 2.5.2, including their corresponding averaging kernels (AVKs). The values and AVKs for the time dependence vector (CL) are reported for the results of this second stage.
It remains for us to choose f(t) and WL. Examination of Eq. (5a) reveals the rationale for setting the co-domain of f(t) to (−1, 1] for solutions in which the entire retrieved column entirely disappears or doubles (considered to be reasonable bounding cases); this bounds the time-dependent term to (], which, for the small values of (L=4) considered here, is comparable to the time-independent weight fixed at 1, hence ensuring that the relative importance of measurements is at least partly preserved. In addition, by defining all f(t) as having a maximum value of 1, the profile which is maximally different from that at t0 is readily computed and compared. For this work, we considered only linear and ramp functions, ultimately using a ramp function defined to be zero prior to 70° SZA and increasing this to 1, which matches an observed trend in O3 VCDs (see the Supplement for details). For WL, logistic curves were chosen as the functional form, with a logistic steepness in all cases of 2 km−1. The atmosphere was first divided at the tropopause at 17.5 km and then at 6 and 10 km based on the results of retrievals using single scans and modeled behavior in CAM-Chem (see Sect. 3.3 for details).
The solutions to the inversion of the time-dependent retrieval were found to be highly sensitive to the a priori supplied for CL, including non-physical results. We suspect that this might be because the assumptions for the staged retrieval only work where the partial derivatives are sufficiently flat or, perhaps, at least smooth. This necessitated systematic sensitivity studies to find solutions which were physical, as well as categorizing solutions based on minimizing any time-dependent trend in the a posteriori residuals. This methodology identified a family of solutions with similar values that met stringent criteria, from which the solution with the lowest overall residual was selected (see Sect. 3.3 for details).
3.1 Rossby wave breaking as a natural experiment
As outlined in the introduction, there is a well-established record of measurements of BrO in the stratosphere by ZS-DOAS and near instrument altitude by OA-DOAS. The sensitivity of an integrated retrieval to the region of limited information content in the upper troposphere can be tested when a change in BrO is expected in this region of the atmosphere. The much larger mixing ratios in the stratosphere (> 5 pptv BrO) compared to those in the troposphere (0.5–1.0 pptv BrO) can result in high concentrations during the Rossby-wave-breaking double tropopause (RW-DT). Mauna Loa is seasonally located near the subtropical jet where the tropopause and the associated BrO gradient dramatically change altitude from ∼ 17 km on the equatorward side to ∼ 12 km on the poleward side. RW-DT events can transport BrO from the mid-latitude stratosphere into the tropical upper troposphere along isentropes. Such events are particularly frequent in the vicinity of the Hawaiian islands (Wernli and Sprenger, 2007; Funatsu and Waugh, 2008).
Routine and rapid processing of ZS-DOAS data for O3 VCDs can readily identify RW-DTs as O3 VCD enhancements. However, RW-DTs are found to be shortly preceded by large-scale convection and, indeed, might have a causal link to it (Funatsu and Waugh, 2008; de Vries, 2021). This convection, in turn, leads to cloud conditions which challenge or preclude DOAS retrievals. Over the course of 5 years of observations, only a limited number of unambiguous RW-DTs have been observed (Fig. S1), and 29 April 2017 was an unusual instance when a RW-DT moved over MLO in such a manner as to allow significant periods of both ZS-DOAS and OA-DOAS and so was chosen for this study.
Figure S2 highlights the natural experiment that the RW-DT provides as modeled by CAM-chem. Regional conditions on the morning of 26 April 2017 before the RW-DT show ordinary boreal-spring conditions; stratospheric O3 at 16 km is confined to the north of ∼ 40° N poleward of the subtropical jet, as indicated by strong zonal winds. On the morning of 29 April 2017, the RW-DT streamed mid-latitude stratospheric air (as indicated by O3) toward the Equator at 12–17 km, which is in the process of being separated from the mid-latitude stratosphere. Quantification and location of the BrO increase in this 12–17 km range will help characterize the capability of the integrated retrieval.
A further basis of assessment for the retrieval is the observation of another RW-DT in the vicinity of MLO during the CONTRAST campaign by the AMAX-DOAS on board the NSF/NCAR GV aircraft. The lower panels of Fig. S2 show the broad similarity of the RW-DT observed on the afternoon of 11 January 2014 to that observed on 29 April 2017, with the former being smaller and more completely cut off when observed. The aircraft successfully profiled into the RW-DT, allowing for greatly enhanced BrO information content and vertical resolution relative to the MT-DOAS retrievals. Unlike the 29 April 2017 RW-DT, the one observed during CONTRAST was impacted by clouds and required leveraging three separate profiles (see Sect. 3.4 for details).
3.2 Advances in spectroscopy and DOAS fit settings
Fitting of BrO for the integrated tropospheric–stratospheric retrieval required leveraging recent advances in molecular spectroscopy – particularly of O3 and O4 – and managing the spectral cross-correlation of BrO and HCHO. For the levels of BrO we aim to retrieve, the optical density of BrO is typically 1 order of magnitude less than O3 or O4 across different observation geometries, making even small changes to the cross-sections important for fitting BrO (Fig. S2). Early fitting windows for DOAS retrievals of BrO utilized narrower windows covering two or three BrO absorption bands at longer wavelengths (Aliwell et al., 2002), which minimizes spectral interferences by avoiding stronger absorptions by O3 and HCHO. The development of methods accounting for non-linear terms in absorption fitting (Pukite and Wagner, 2016) has helped facilitate the use of wider windows with four bands (Coburn et al., 2016; Koenig et al., 2017; Seo et al., 2019), which are similar to HCHO retrieval windows (Pinardi et al., 2013). The use of wider windows with five BrO bands has been previously examined for BrO and HCHO (Pukite and Wagner, 2016; Pinardi et al., 2013), and even wider windows have been contemplated (Seo et al., 2019) but ultimately not adopted due to the strong impacts of O3, HCHO, and SO2. We have found that, for the low optical densities of BrO (and HCHO) we encounter, rather than avoid these interferences, we must characterize them accurately.
The choice of O3 cross-section is critical as the difference between cross-sections multiplied by ZS dSCDs has an optical density over 1 order of magnitude greater than that of BrO at twilight (Fig. S3). We employed the same treatment for temperature dependence and orthogonalization (Table S1) for all cross-sections to focus on the cross-sections themselves. Comparison of empirical results reveals the benefits of advances in O3 spectroscopy (Fig. 2). The narrow fit windows used by Aliwell et al. (2002), which specifically avoid strong spectral effects from O3, are found to be generally insensitive to the choice of O3 cross-section, as expected. For wider windows, however, significantly smaller BrO columns are measured on average, with large differences when using different O3 cross-sections. Some variability in the retrieved BrO as a function of fitting window is expected due to the different light paths sampled as a function of wavelength (Pukite and Wagner, 2016). Simulating this effect on different BrO bands for ZS observations at twilight finds that the effect is minor for SZA < 90° when accounting for photochemical changes, except for the BrO band at ∼ 325 nm (Fig. S4A). The cross-section reported by Serdyuchenko et al. (2014) yields the most consistent BrO across different windows, with deviations from the modeled trend being less than the fit uncertainty for most windows apart from the widest. This cross-section is shifted by 3 picometers, as per the latest recommendations (Gorshelev et al., 2014; Richard Siddans, personal communication, 2023). Stability for even wider windows will likely require further measurements of O3 cross-sections at the relevant wavelengths or the application of higher-order corrections for non-linearity. Ultimately, the window starting at 328.5 nm was chosen (Table S1) despite deviating slightly from the consistent O3 for ZS data; this is on the basis of constraining O4 and HCHO accurately.
For low-elevation angles, the choice of cross-section for O2–O2 collision-induced absorption (O4) also changes the optical density by more than 10 times the total optical density of BrO. We utilize the recently published cross-section by Finkenzeller and Volkamer (2022), which significantly changes the O4 band at 344 nm and adds the absorption band at 328 nm. During sensitivity tests for fitting, it was found that O4 plays a role in mediating the spectral cross-correlation between BrO and HCHO, which we examine further below. This is consistent with previous findings (Pinardi et al., 2013). In order to capture O4 accurately, we first fit O4 in an optimized fitting window (350–388 nm) and then constrain the O4 fit in the BrO fitting window to a scaled dSCD value. This method has been employed previously, assuming a Rayleigh atmosphere for scaling (Koenig et al., 2017). For this work, the scaling factor was determined empirically to be 0.80 ± 0.01 by least-orthogonal-distance fitting of the correlation of the unconstrained fits (Fig. S4B). This value is similar to what one might expect for a Rayleigh comparison of the optical depth and pathlength of the 360 and 344 nm bands – (344/360)4=0.83 (Wagner et al., 2004). To better represent the wavelength dependence of the scaling factor, the absorption bands at 344 and 328 nm were scaled by the empirical factor, but that at 360 nm was not (to account for the wavelength-dependent pathlength). Given that the effect is small and that the constraint employed emerges empirically from unconstrained fits, one might question the need for it; the key impact of the O4 constraint is to give more consistent fits, which are critical to further constraints discussed below. Further details on the O4 constraint and other constraints are provided in Sect. D of the Supplement.
The NO2 fits retrieved from the BrO fitting window were not consistent with those found in the visible range and, indeed, seemed to be non-physical. We suspect that this arises from intensity effects from the changes in illumination at different elevation angles as the fitted intensity offset and ring cross-sections (which often compensate for such effects in DOAS) show similar patterns. Those effects could be accurately fitted as offsets from changing stray light; notably, the exposure of spectra measured at different EAs is dynamically adjusted for consistent saturation in our setup (Coburn et al., 2011). The effect is too small to be relevant to stratospheric-NO2 retrievals but is relevant to the small NO2 signals measured in the free troposphere, for which OA NO2 dSCDs differ from nearby zeniths by less than 3 times the fit uncertainty. Unlike O4, which is sensitive to only light path changes, NO2 columns are also impacted by concentration changes which are more difficult to constrain. We first employed O4 and NO2 fits from a more sensitive window in the visible range (411–490 nm) to invert tropospheric-NO2 profiles in the vicinity of the instrument altitude. The results from NO2 fitting and the resultant profiles will be described in more detail elsewhere. We then used the aerosol optical depth retrieved using the constrained O4 fits described above to model NO2 dSCDs in the BrO fitting window under the assumption of horizontal homogeneity. These NO2 dSCDs were then specified and constrained for further fits of HCHO and BrO.
A major challenging factor in the retrieval of BrO in the troposphere is a remarkable (but coincidental) similarity in the absorption cross-sections of BrO and HCHO when observed at the optical resolutions typical of UV–Vis spectrometers. This similarity in measurement leads to an empirical anticorrelation, the characterization of which is further confounded by chemical coupling of BrO and HCHO via reactions of Br atoms with HCHO and other aldehydes, which often correlate with the latter, suppressing BrO formation and creating a chemical anticorrelation. After optimization of the fitting window, we believe that this spectral cross-talk is handled by the DOAS fit, with the exception of a fast-changing anticorrelation identifiable as opposing changes in BrO and HCHO for sequential measurements of the same viewing geometry and slow-changing opposing “drifts” in both HCHO and BrO dSCDs. For periods on the order of 1 h, this drift in BrO and HCHO appears to correlate with the overall measured spectral fluxes and/or with small temperature variations of the spectrometer (< 0.01 K); however, we could not find a consistent correlating parameter or a definite causal mechanism. As the SZA-dependent variation in HCHO dSCDs is relatively small and because there is little prospect, without more stable data, of retrieving high-altitude HCHO columns, a moving-reference analysis was employed for HCHO. The HCHO from the moving-reference analysis was used as input for optimal-estimation retrievals of HCHO profiles using differential AMFs (dAMFs) as described in Sect. 3.3.2. A posteriori HCHO profiles were then used to compute SCDs using AMFs (not dAMFs). Because the information content in the HCHO retrievals is minimal above 7.4 km, HCHO profiles from CAM-Chem were substituted for these altitudes prior to computing SCDs. The SCD of the fixed reference was then subtracted to yield HCHO dSCDs which were used to constrain the BrO fit. The impact of the HCHO constraint on fits is further detailed in Sect. 3.3.2 as well.
Examining Fig. 2A, one might question why the 328.5–359 nm window was chosen given that, even with the latest cross-sections, it deviates from the expected consistency at twilight by more than the measurement uncertainty. The benefit of the wider fitting window is to gain access to an additional HCHO absorption feature (peaking between 329 and 330 nm; Fig. 2B). The wider window necessitates an order-7 polynomial due to its width, and the Huggins band absorption gradient (but at ∼ 45 times the FWHM of the slit function) has more than sufficient information for fitting the 17 linear absorption parameters. The combined effect of the constraints on O4, NO2, and HCHO (resulting primarily from HCHO) is to slightly increase BrO dSCDs in general. Without the constraints, BrO dSCDs frequently have negative fits for 12° ≤ EA ≤ 45° relative to a zenith reference near noon. For smaller negative, values this would indicate surprising profile shapes that are difficult to reconcile with ZS data, while larger negative values cannot be physically explained. For the 328.5–359 nm window, application of the fitting constraints for O4, NO2, and HCHO yields positive or (within fit error) zero BrO dSCDs for almost all data, with marked benefits for robust physical dSCDs at the elevated EA off-axis angles (Fig. S4). Leveraging the latest spectroscopy for O3 and O4 and applying constraints on O4, NO2, and HCHO determined from the same MT-DOAS yields robust BrO dSCDs as input for further retrievals.
3.3 Mountaintop profile retrievals
The mountaintop BrO profile retrieval, including the DOAS fitting, is summarized in a flowchart in Fig. 3. Broadly, the retrieval proceeds from DOAS fitting to a time-independent profile retrieval and finally to a time-dependent BrO retrieval. As Fig. 3 makes clear, and as already outlined in Sect. 3.2, intermediate steps are taken. We first examine the aerosol and HCHO profiles retrieved for constraining the DOAS BrO fit on the mornings of 26 and 29 April 2017, and then we consider the determination of BrO SCDRef for the reference spectrum (on 26 April, used on both days; see Sect. 2.2); subsequently, we discuss the time-averaged retrievals for both days and assess their self-consistency, and, finally, we describe the time-dependent profile retrievals for both mornings.
3.3.1 Aerosol profile retrieval
Aerosol extinction profiles were retrieved for each EA scan to reproduce the scaled O4 dSCDs as described in Sect. 2.3.2. The retrieved aerosol profiles were then used for the HCHO inversion (Sect. 3.3.2) and BrO inversion (Sect. 3.3.3–3.3.5). Prior to the aerosol retrieval, an approximate O4 SCDRef was determined to match the Rayleigh-modeled O4 SCDs for ZS observations. For the base case of 26 April, the agreement with the Rayleigh assumption was within 2 × 1042 molec.2 cm−5, while, for the RW-DT case of 29 April, ZS SCDs vary by up to 4 × 1042 molec.2 cm−5 compared to this assumption. The EA = 0° O4 SCDs agree with the assumption of a Rayleigh atmosphere by better than 3 % in all instances and by better than 1 % more typically. This level of agreement for EA = 0° is better than the fit uncertainty and highlights a major advantage of MT-DOAS locating the instrument in an environment where aerosol extinction is sub-Rayleigh extinction. Such low aerosol extinction is detectable to DOAS only at 477 nm, where fit errors are lower than at 360 nm and where the aerosol contrast is enhanced by reduced Rayleigh scattering (Volkamer et al., 2015). The aerosol optical depth (AOD) above the instrument retrieved by MAX-DOAS at 360 nm ranges from 0.000 to 0.015 for both days, which is consistently lower than that found by AERONET direct sun measurements at 340 nm (0.012–0.020 on 26 April; 0.021–0.032 on 29 April). This level of consistency is expected given that such a low AOD is close to the limit of detection for AERONET and MAX-DOAS aerosol retrievals. AERONET observations further corroborate an Ångström exponent of ∼ 0 between 477 and 360 nm. More impactful – but still minor – are the effects from aerosol below the instrument, which are observed as a small increase in observed O4 dSCDs for 0° < EA < 90°.
The presence of aerosol and/or clouds below the instrument increases multiple scattering at lower altitudes, which can add O4 signals given that most of the O4 profile resides below instrument altitude (O4 scales with the square of atmospheric density). The observed magnitude of this effect at 360 nm is 5.5 × 1042 molec.2 cm−5 or 9 % in O4 dSCDs at worst and, on average, is less than half of that around the limit of detection. Longer path lengths and better signal-to-noise ratios at 477 nm better highlight the effect. We examine this and other factors, such as inaccurate EA pointing, as well as alternative representations such as with surface albedo at 477 nm, in the Supplement (Fig. S5). In brief, inaccurate pointing could explain increases in O4 dSCDs for positive EAs but increases discrepancies for negative EAs and is not consistent with pointing tests; an elevated increased albedo surface can also improve agreement for upward-looking angles but is at odds with observations in downward and forward geometry; finally, an increased albedo for a surface at lower altitudes can be equivalent in terms of matching O4 dSCDs to the effect modeled by aerosol at low altitudes. We chose to use aerosol to represent the aerosol and cloud effects rather than surface albedo because the latter often necessitates adding similar or more aerosol in any case, and we prefer to represent surface albedo closer to its accurate value if possible. The retrieved combined aerosol and cloud optical depth below the site ranges from 0.310 to 0.662; this is likely to be greater than in reality, especially as much of it is located below 2 km altitude, where there is minimal sensitivity. Nonetheless, based on the excellent agreement of O4 SCDs, being better than the fit uncertainty for all EAs, the (small) aerosol effects are radiatively correct. Retrieval of aerosol profiles, especially when so close to Rayleigh conditions and when including these secondary effects from multiple scattering below the instrument altitude, presently exceeds the data collection times by over 1 order of magnitude and is the greatest limitation in further application of this analysis.
3.3.2 HCHO profile inversions
As described above, it was found to be necessary to constrain HCHO for the DOAS BrO fitting; HCHO profiles were therefore retrieved for each EA scan. Since a moving-reference analysis is employed for HCHO, corresponding differential weighting functions (dWFs) were used for optimal estimation. The HCHO a priori profile is 600 pptv at the surface, with the mixing ratio decreasing exponentially with a folding height of 2 km but not to less than 50 pptv. This profile was chosen based on AMAX-DOAS and CAM-Chem (see Sect. 3.4 for details). The optimal estimation uses a 100 % a priori covariance for diagonal terms and a 0.5 km correlation height for off-diagonal terms below 17.4 km and 50 % covariance and a 4 km correlation height above 17.4 km. The retrieved profiles are then combined with a weighting function (WF) (non-differential) to obtain HCHO dSCDs as the BrO fit constraint.
The retrieved HCHO profiles are summarized in Fig. S6, along with the comparison of measured and a posteriori HCHO dSCDs and SCDs. The effect of constraining HCHO is much greater than those of constraining NO2 and O4, which roughly counteract each other (on average) in terms of their effect on BrO dSCDs; HCHO sensitivities dominate the pattern observed in Fig. S7. The overall effect of constraining HCHO is almost always an increase in BrO dSCDs (Fig. S7 data are above the 1:1 line), which, given the low-SZA zenith reference spectrum, is easier to understand physically. The effect of the HCHO constraint – including fast and drift components – is 1.5 ± 0.9 × 10¹³ molec. cm−2, dominating the overall effect of the constraints which have the same mean and standard deviation. Unlike the other constraints, this is, on average, almost 2.5 times the fit uncertainty of BrO and is dominated by the drift. Secondary effects are most apparent for larger EA (≥ 12°), for which dSCDs are “pulled” as a result of the constraints of non-negative, physically meaningful values relative to the BrO dSCDs of the nearest zenith spectrum. In all instances, these smaller changes are well within the range of uncertainty. They are, however, important to the BrO profile retrieval as they act on relatively small separations between these EAs.
Reproducing the dSCDs retrieves independent HCHO profiles below ∼ 6 km but largely converges with the a priori above this altitude. The DoFs for the individual HCHO retrievals range from 2.24 to 2.61. This is roughly distributed as 1 DoF being located between 1.9 and 3.4 km below the instrument, 1 DoF being located between 3.4 and 4.4 km near the instrument altitude, and the remainder being above instrument, with ∼ 70 % of the remaining information content below 6 km. Apart from scan 1 on 26 April, which has more HCHO, and the latter three scans on 29 April, which have decreasing HCHO concentrations, the retrieved HCHO concentration at instrument altitude varies by less than 10 % from 2.73 × 10⁹ molec. cm−3 (161 ppt). In contrast to this relative stability at the instrument altitude, HCHO varies more below the instrument, generally without clear trends. Given there is a single DoF below the instrument, the profile shape below the instrument should not be interpreted as significant. However, the changes in partial columns remain significant. These perhaps reflect the dynamic evolution of HCHO in the boundary layer below MLO from biogenic and/or anthropogenic primary and secondary sources. The retrieved HCHO concentrations above the instrument altitude tend to be greater than the 50 pptv a priori. Retrieved HCHO profiles and columns are further compared with aircraft data and other measurements and models in Sect. 3.5 and 3.6.
3.3.3 Determination of BrO SCDRef
To obtain SCDs for optimal estimation requires a determination of SCDRef. Previous studies have highlighted the impact that SCDRef can have on BrO retrievals, particularly in regions of low sensitivity. These prior studies found a need to optimize the distribution of BrO based on a modified Langley plot (Hendrick et al., 2007; Theys et al., 2007) or by iteration until a self-consistent result is obtained (Coburn et al., 2016). A consistent feature of these previous studies is the connection between upper-tropospheric BrO and the BrO SCDRef. In Hendrick et al. (2007), inclusion of the tropospheric-BrO column is necessary to retrieve consistent BrO VCDs and thereby a photochemical Langley plot. In Coburn et al. (2016), optimal-estimation retrievals with and without SCDRef were both assessed, with SCDRef providing additional information content in a broad peak in the upper troposphere. While Theys et al. (2007) examined the connection between SCDRef and BrO in the upper troposphere less directly, tropospheric AMFs are folded into the parameterization used to derive SCDRef; furthermore, the authors note that the lack of BrO signals near the instrument altitude and differences between their retrieved tropospheric-BrO VCDs and unpublished results over Nairobi both indicate that the tropospheric BrO is likely to be located at higher altitudes in the troposphere. We adopt a similar approach, assessing different values of SCDRef.
To assess values of SCDRef, we employ photochemical Langley plots as described in Sect. 2.5.1; results from this are summarized in Fig. S8. Because the retrieved profile itself impacts the photochemical AMFs, we conduct the time-independent retrieval for various values of SCDRef. This is a fast process because, as a trace absorber, BrO does not change the WF used for its own retrieval. It is found that SCDRef = 2.00 × 10¹³ molec. cm−2 recovers itself within uncertainty (2.01 ± 0.09 × 10¹³ molec. cm−2) and has a high R2 value (0.984). Substituting the final retrieved profile shape for the climatological BrO profile retrieves identical results that are within the precision range of the significant figures. While the R2 value (0.982) and apparent linearity for SCD 1013 molec. cm−2 are similar, the choice of SCDRef is not self-consistent in that it retrieves a value for SCDRef which is different by > 3.5σ (1.85 ± 0.09 × 10¹³ molec. cm−2). Using SCDRef = 2.50 × 10¹³ molec. cm−2, the photochemical Langley plot is visibly non-linear, which is also reflected in a lower R2 value (0.901), and it can be more readily rejected on this basis. However, the retrieved value (2.58 ± 0.09 × 10¹³ molec. cm−2) is not significantly different from the previous value, and it might be considered to be self-consistent. Furthermore, Coburn et al. (2016) employed an iterative approach for SCDRef using an a posteriori SCDRef as the a priori, which assumes that SCDRef will tend to converge; however, the retrieved SCDRef in this instance diverges further from the optimized value of 2.00 × 10¹³ molec. cm−2 which is used. We find that iterative approaches and goodness-of-fit metrics alone are not sufficient to identify accurate values of SCDRef; rather, different values should be surveyed and assessed based on self-consistency and apparent linearity in tandem.
3.3.4 Integrated time-independent BrO retrieval
A difference between the twilight BrO SCDs between 26 April and 29 April is apparent through simple examination (Fig. 4). On 26 April, BrO SCDs are observed to decrease monotonically as the sun rises from values starting from almost 2.5 × 10¹⁴ molec. cm−2, whereas, on 29 April, they, at first, increase from lower values of ∼ 1.7 × 10¹⁴ molec. cm−2 before an Umkehr effect around SZA = 90° and then decrease by a lower amount to a relatively high BrO SCD at SZA = 75° (Fig. 4). Together, these differences indicate additional BrO above the site on 29 April relative to 26 April below the mean scattering altitude for SZA ≥ 90° (∼ 30 km). Zenith SCDs at lower SZAs, however, are similar on both days, necessitating additional differences; these are ultimately determined to be dynamics-driven profile changes over the course of the measurement period on 29 April. On both days, intermediate angles (3–30° EA) are often elevated relative to lower elevation angles, suggesting that BrO is not enhanced at the instrument altitude but rather aloft in the free troposphere. The residuals of the time-independent retrieval on 26 April are within 2 % of the mean slant column fit uncertainties and are typically smaller. Comparing the residuals (Fig. 4) to these mean uncertainties for 26 April, the overall difference is very slightly larger for all observations at 6.2 vs. 6.1 × 10¹² molec. cm−2 but smaller for ZS data (8.1 vs. 8.3 × 10¹² molec. cm−2) and for OA data (3.6 vs. 4.1 × 10¹² molec. cm−2). For 29 April, by contrast, the comparison for ZS data is even better at 7.9 vs. 9.1 × 10¹² molec. cm−2; on the other hand, OA data compare less favorably but still within 60 % (7.1 vs. 4.4 × 10¹² molec. cm−2), in turn driving poorer performance overall (7.1 vs. 6.6 × 10¹² molec. cm−2). Examination of the time series of the retrieval residuals from the time-independent retrieval (black symbols in Fig. 4d background) reveals a clear pattern: for ZS data, residuals scatter around zero, increasingly converging as more photons improve the signal-to-noise ratio; rather suddenly, at SZA = 75°, residuals are systematically positive across EAs and then decrease approximately linearly to be systematically negative at SZA = 40°. This is indicative of the fact that changes in BrO at altitudes above those that are the most OA-sensitive and below those that are the most ZS-sensitive, which is potentially consistent with an evolving RW-DT event. While it is clear that the retrieval, especially on 29 April, can be further improved (as is done below in Sect. 3.3.5), the magnitude of residuals indicates that the results of the time-independent retrieval are sufficiently accurate to be examined.
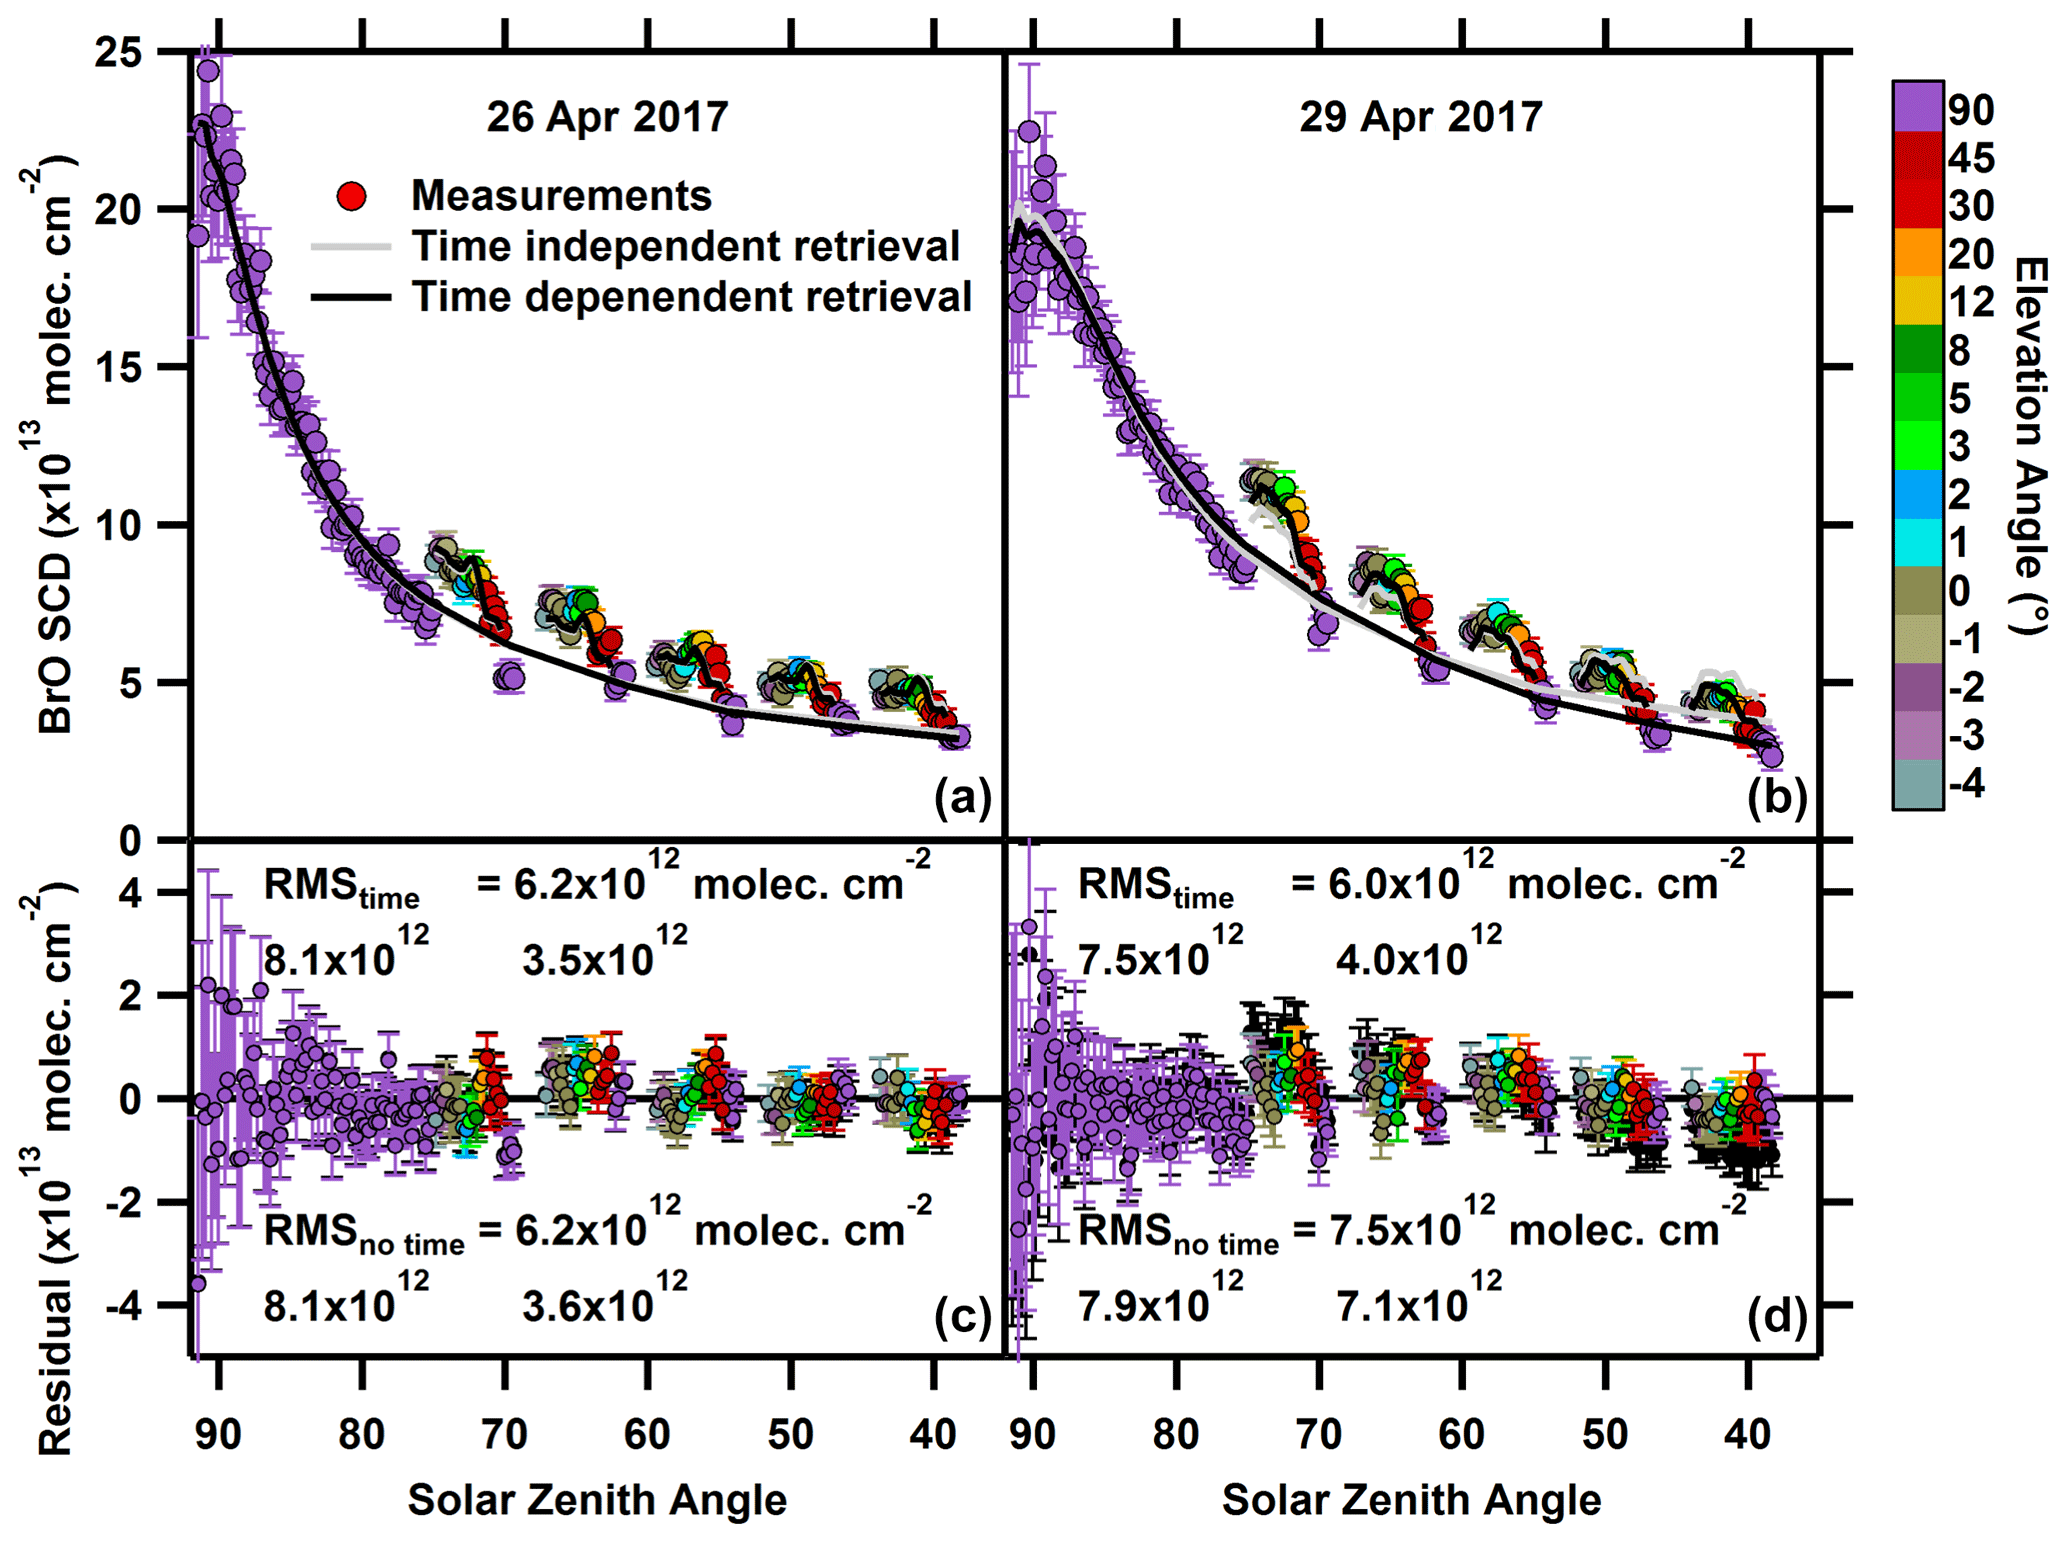
Figure 4Comparison of measured and retrieved BrO SCDs. Top: retrieved reproduction of measured BrO SCDs for the mornings of 26 April (a, c) and 29 April (b, d) in 2017. Measurements are color coded by EA, with error bars showing the DOAS fitting error (SCDRef = 2.0×10¹³ molec. cm−2 is included) against SZA (sunrise is on the left of each window). The gray lines show the retrieval for the zenith data and for each EA scan normalized to SZA 70° without time dependence being accounted for. The black line shows the retrieval allowing for a time dependence of the BrO profile (the difference is almost imperceptible for 26 April). The residuals (retrieved−measured) are shown on the bottom for the time-independent retrieval (solid black) and the time-dependent retrieval (color coded). Also listed are the root-mean-square (rms) values of the residuals for each retrieval, as well as for subranges of SZA > 75° and SZA < 75°. The primary benefit of including the time dependence is the elimination of the slope apparent in the residuals for SZA < 75° on 29 April.
Examination of the retrieved time-independent profiles and the associated AVKs (Fig. 5) and, in particular, the DoFs (Table 1) can better quantify the major differences in the BrO profile brought about by RW-DT. Examination of the AVKs and column sensitivities reveals the two regions of high information content at the bottom and top of the profile. Below ∼ 7.4 km, the retrieval has 3 DoFs with a reasonable precision of altitude: 1.9–3.4 km (1.1 DoFs), 3.4–4.4 km (1.1 DoFs), and 4.4–7.4 km (1.0 DoF). A local minimum in BrO is observed near the instrument altitude on both days; however, the altitude regions each possess a single DoF in aggregate; considering this, the BrO at the instrument altitude is not significantly less than that below the instrument on 29 April. The more striking difference between the two days is above the instrument, in the 4.4–7.4 km range, which, on 26 April, peaks at over twice the concentration at the instrument altitude, while, on 29 April, the BrO concentration decreases, on average, broadly in line with air density (see also Fig. 5). There is no obvious connection between an RW-DT event and this altitude range, suggesting that the observed differences are coincidental or that something more subtle in the atmospheric dynamics or retrieval is responsible. The column sensitivity (Fig. 4) reveals the other region of significant information content (1.5 DoFs) in terms of ZS data concentration in the stratosphere above 17.4 km. The retrieved stratospheric-BrO profile on 26 April is broadly consistent with those previously measured by balloons in the tropics (Pundt et al., 2002; Dorf et al., 2008), peaking between 20 and 25 km at 1.2 ± 0.1 molec. cm−3. The effect of the RW-DT on the 29th of April is immediately apparent as the stratospheric-BrO profile is shifted to a lower altitude and demonstrates a larger total column, both better resembling what is seen in the mid-latitudes. It is notable that the decrease in BrO concentration is greater than the decrease in air density above 25 km; this would indicate a BrO concentration decrease, which we do not believe has been previously observed. However, as with the AVK reveal, information content in the stratosphere is imprecise for the attribution of altitude to BrO signal, and information content is especially limited at these highest altitudes; therefore, we suspect that this decrease in mixing ratio is likely to be false, that the BrO peak at lower altitudes is slightly overestimated in a manner that is consistent with the AVK, and that the sensitivity above ∼ 30 km is limited, though a better signal-to-noise ratio for SZA > 90° could address this.
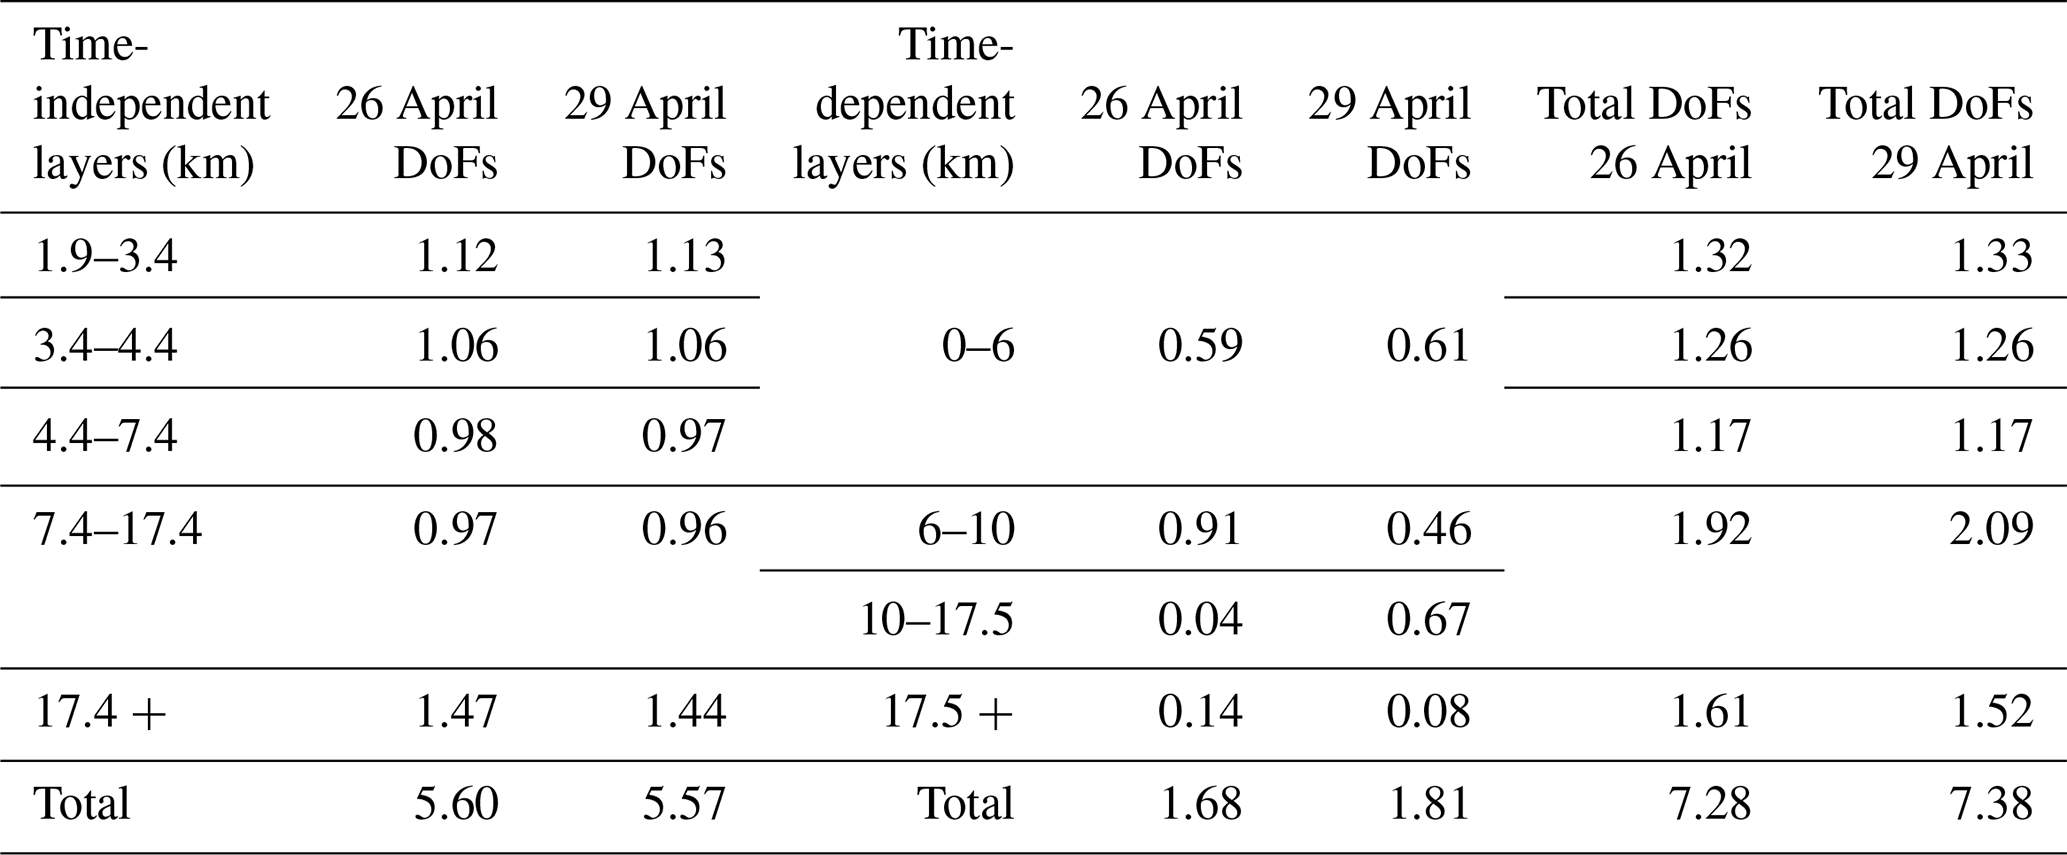
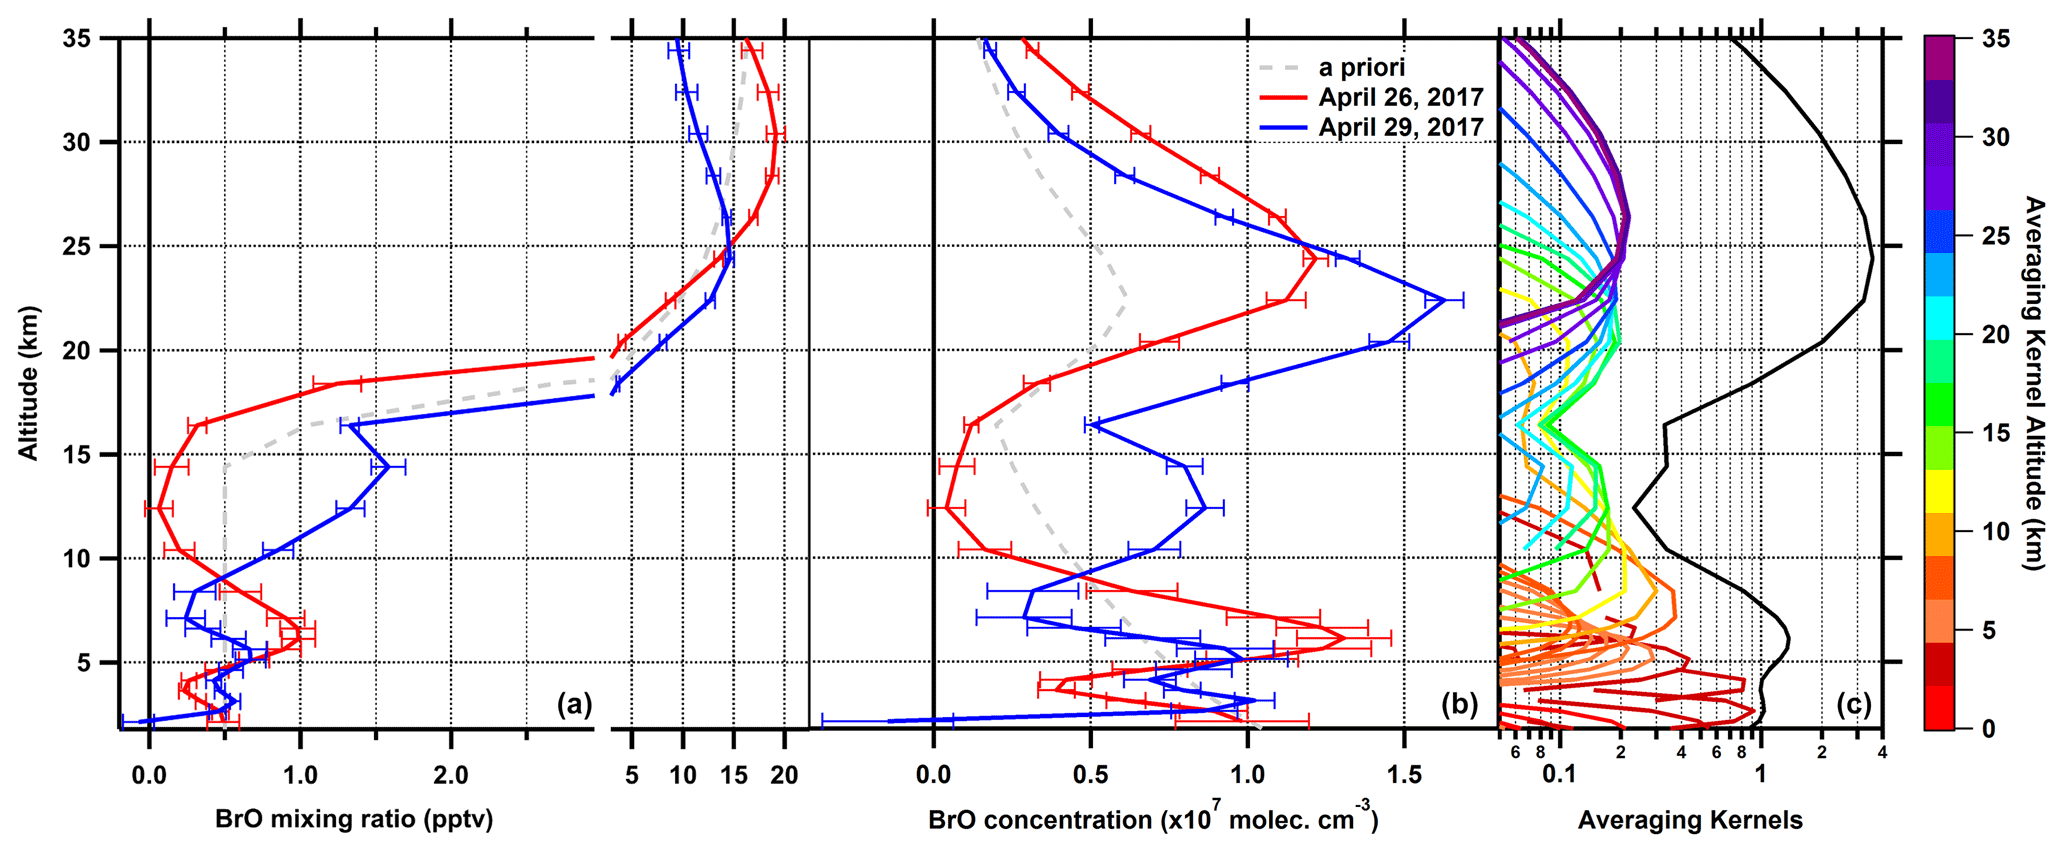
Figure 5The integrated BrO profile retrieval. (a) Bro mixing ratio profiles at SZA = 70° for the mornings of 26 April and 29 April in 2017, utilizing the default a priori (dashed gray line). (b) The corresponding BrO concentration profiles at SZA = 70°. (c) Averaging kernels (for 26 April) at the kernel altitude (color coded) and the column sensitivity (black line, the sum of all kernels at a given altitude). The vertical resolution is best near the instrument altitude and decreases in the upper free troposphere (uFT) and stratosphere; the column sensitivity drops as low as ∼ 0.3 in the altitude range of 10–17 km but does not drop lower.
Accounting for additional sources of uncertainty in the measurement covariance (Sε) highlights the robustness of the retrieval. Accounting for the uncertainty in the BrO absorption cross-section ∼ 10.5 % (Fleischmann et al., 2004), as well as the change in BrO dSCD from the O4 and NO2 constraints and from the non-drift component of the HCHO fit constraint (order of 1012 molec. cm−2), fundamentally lowers the signal-to-noise ratio, leading the retrieval to generally trend slightly toward the a priori and to be smoothed over (Fig. S9). The drift observed in the HCHO–BrO cross-talk is clearly an instrumental effect; however, we account for it in a further sensitivity study to further probe the robustness of the retrieval. The effect on 26 April is, as expected, minimal, and while more than 1 DoF is lost on 29 April, the change in VCD is small, and the increased BrO in the upper free troposphere is still retrieved (more detail in Sect. D of the Supplement). Even accounting extremely conservatively for uncertainty, the retrieval already improves upon previous BrO retrievals.
Below ∼ 1.9 km, the sensitivity of the MT-DOAS is not only limited but negligible (< 0.1 DoFs) and constitutes a null space for retrieval. This leaves one region of the atmosphere between the lower troposphere (1.9–7.4 km; 3.2 DoFs) and the stratosphere (> 17.4 km; 1.5 DoFs): the upper troposphere (7.4–17.4 km), which is not readily retrieved using OA or ZS data alone. Here, a local but non-zero minimum in column sensitivity is observed. The joint leverage of ZS and OA data allows 0.96–0.97 DoFs to be retrieved between 7.4–10.4 km, clearly revealing the impact of the RW-DT, even on the BrO concentration in the upper troposphere. On 26 April, the BrO profile decreases with altitude to a minimum, not significantly different from zero, at 11.4–13.4 km. The increase above this altitude, while still in the troposphere, is consistent with previous profiles on mobile platforms (Pundt et al., 2002; Dorf et al., 2008; Koenig et al., 2017). During the RW-DT event on 29 April, however, there is instead a BrO maximum in the upper troposphere, presumably resulting from the injection of air from the stratosphere with a much higher BrO mixing ratio. This stratospheric intrusion on 29 April is captured with an independent DoF from the synergy of ZS and OA observations, indicating that it is independently significant and not the result of other differences in the profile.
3.3.5 Time-dependent BrO retrieval
The SCD retrieval residuals on 29 April show a clear temporal pattern, particularly for OA data (Fig. 4); as noted in Sect. 3.3.4, these constitute the only subset of data for which the retrieved residuals exceed the average fitting uncertainties. Given that the photochemical variation in Bry partitioning is already reflected in the air mass factor calculations, we attribute this to additional time-dependent changes in BrO (and possibly Bry). The setup of the time-dependent retrieval is given in Sect. 2.5.3. Sensitivity studies used to determine the values ultimately used are described in Sect. C of the Supplement. In brief, in Eq. (3), f(t) was set to be a ramp function with value of zero for SZA < 70°, increasing linearly with time to a value of 1 for the remaining data based on time-dependent O3 VCD retrieval for ZS data (Fig. S10). There were four atmospheric layers (WL) for the lower, middle, and upper troposphere and for the stratosphere based on CAM-Chem modeling for 29 April (Fig. S11). The retrieved profile is sensitive to the choice of a priori profile (x0; Fig. S11), with a western Pacific profile even having slightly smaller average retrieval residuals but extreme gradients in BrO at low altitudes, which were deemed to be likely to be non-physical. The retrieval was found to be highly sensitive in an unpredictable manner to the choice of a priori values for CL, which were chosen based on the selection of consistent results when varying the BrO a priori profile (x0 a priori) and for small changes in the CL a priori (Fig. S13), from a systematic survey of choices. Settings optimized for 29 April were also applied to 26 April, which was found to be less sensitive to the choice of a priori. Specifically, 1.7 and 1.8 time-dependent DoFs were retrieved for 26 and 29 April, respectively.
RW-DT events involve the movements of mid-latitude air toward the tropics, which might be expected to increase the BrO VCD; however, the difference in BrO VCD is not significant, whether examined at SZA = 70° or at the minimum SZA: base case (SZA = 70° to SZA = min.) (2.2 to 2.3 ± 0.2) × 1013 molec. cm−2 vs. RW-DT (2.6 to 2.4 ± 0.3) × 1013 molec. cm−2. The stratospheric-BrO VCD differs by 5 %–10 % between the two days: (1.46 to 1.47 ± 0.08) × 1013 molec. cm−2 in the base case and (1.61 to 1.55 ± 0.08) × 1013 molec. cm−2 for the RW-DT (Fig. 6), which is broadly consistent with the 7% difference in the O3 VCDs for SZA < 70° (Fig. S10). Given the observed increase in O3 VCDs on 29 April, it could be expected that the observed decrease in stratospheric-BrO VCDs in the morning of 29 April must be compensated for by a tropospheric increase resulting from the RW-DT; however, BrO SCDs are actually lower than expected with the time-independent retrieval (Fig. 4). Consistently with this, the time-dependent tropospheric-BrO VCD decreases from (1.01 ± 0.14) × 1013 molec. cm−2 to (0.85 ± 0.17) × 1013 molec. cm−2. Counterintuitively, given the expectation that RW-DT is typically conceived to inject BrO into the troposphere, BrO decreases by (0.15 ± 0.17) × 1013 molec. cm−2 from (1.01 ± 0.14) × 1013 molec. cm−2 in the RW-DT case, mostly in the middle to lower FT (> 80 % of the change), the altitudes furthest from the stratosphere. That tropospheric BrO increases slightly – (0.13 ± 0.16) × 1013 molec. cm−2 over (0.70 ± 0.14) × 1013 in the base case – demonstrates the capacity of the retrieval to produce such an increase when reflective of the underlying data. The small to negligible change in the stratosphere and upper FT for the RW-DT has 0.75 total DoFs. This suggests that, while the O3 VCD provides a reasonable estimate of the change in stratospheric-BrO VCDs between the two days, it does not readily predict changes during the RW-DT event. Nonetheless, the time evolution of the O3 VCDs has been found to roughly correspond to changes in BrO, suggesting that there is some connection between the changes. On both days, the largest changes are observed in the lower atmosphere (< 7.4 km). On 26 April, the change is primarily in the 4.4–7.4 km range, where BrO increases from 0.7 ± 0.1 pptv to 0.9 ± 0.1 pptv, which is very slightly compensated for by minor increases at lower altitudes. Changes on 29 April are roughly the opposite (0.5 ± 0.1 pptv to 0.3 ± 0.1 pptv) and are more consistent with the changes at lower altitudes (0.46 ± 0.03 pptv to 0.29 ± 0.04 pptv at 3.4–4.4 km and 0.32 ± 0.06 pptv to 0.20 ± 0.07 pptv at 1.9–3.4 km). Even if the observed increase in O3 is in or near the stratosphere, it would be expected to lower JBrO slightly via increased UV absorption, increasing the BrO:Br ratio and holding other chemical conditions constant. The observed decrease in BrO in the lower FT therefore points to either a decrease in Bry or chemical changes lowering the BrO:Bry ratio, which have some link to the changes in O3 VCDs.
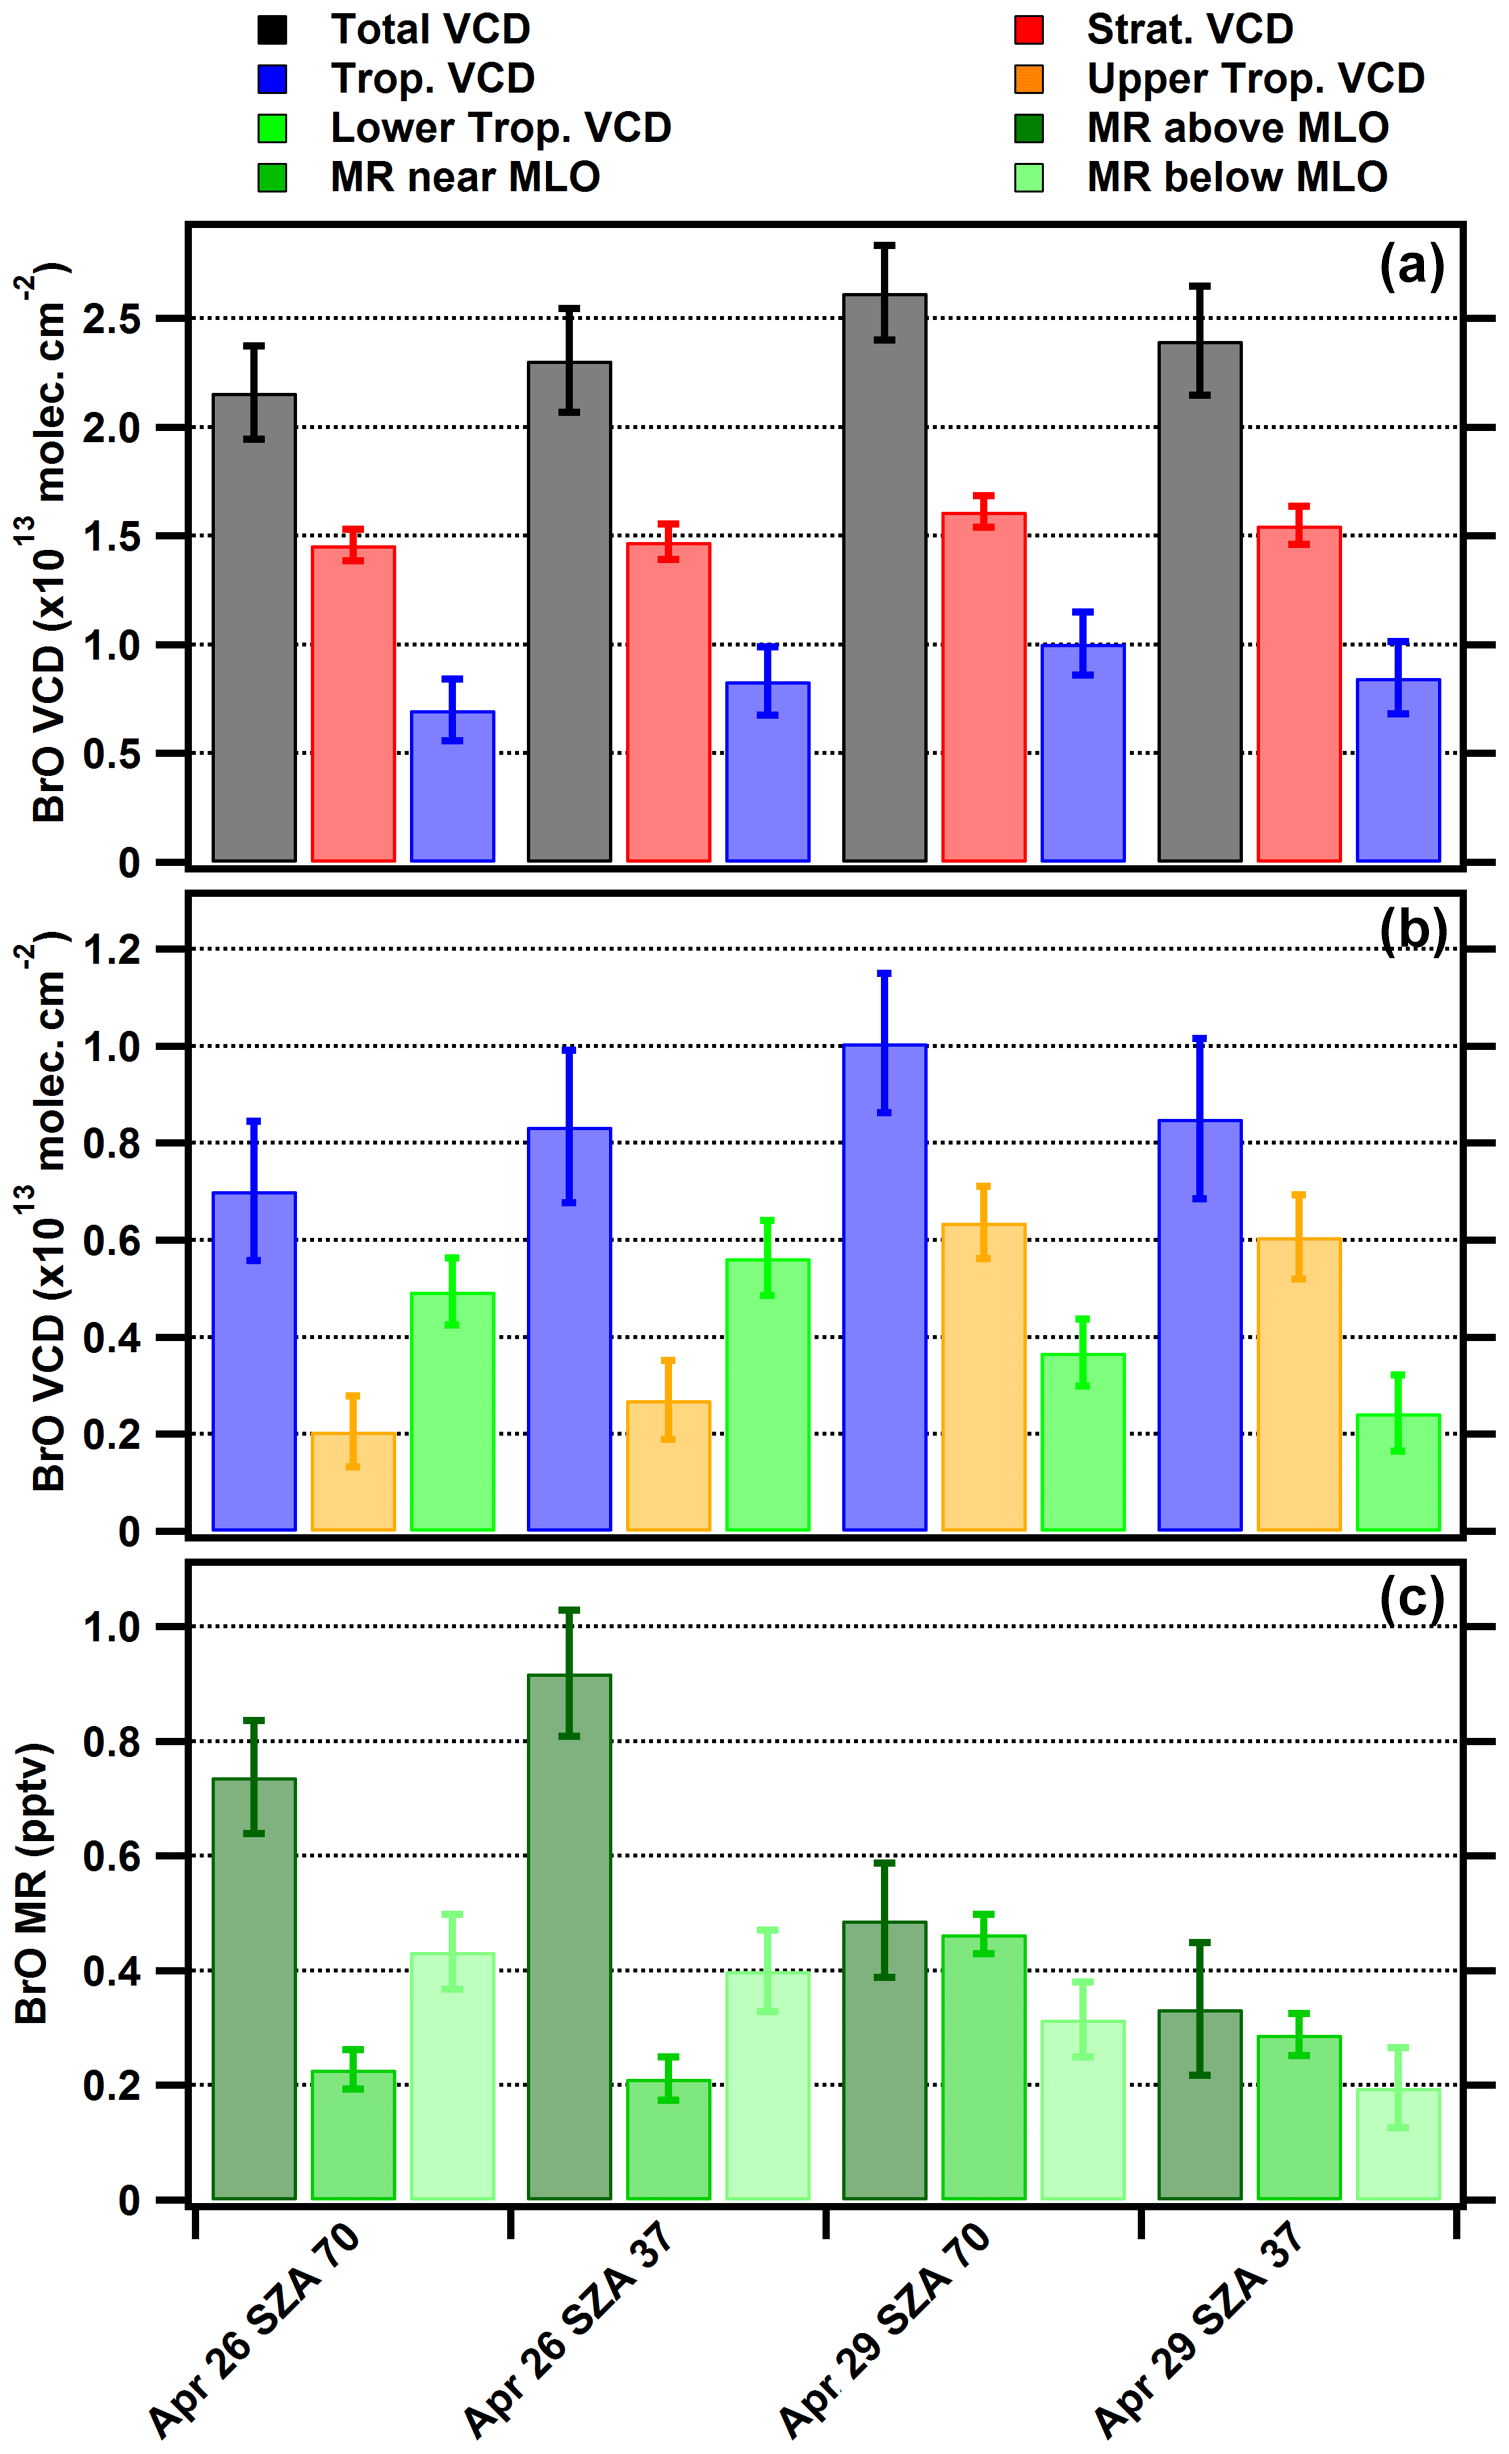
Figure 6Retrieved BrO columns and mixing ratios and time evolution. (a) The total, stratospheric (17.4–53.4 km) and tropospheric (1.9–17.4 km) BrO VCDs; the error bars indicate the total uncertainty. (b) The tropospheric-BrO VCD (repeated) is broken into the upper FT (7.4–17.4 km) and the lower FT (1.9–7.4 km). (c) Three mixing ratios retrieved in the lower FT are averaged above the instrument (3.9–7.4 km), near the instrument (3.4–3.9 km), and below the instrument (1.9–3.4 km).

Figure 7Overview of CONTRAST RF01 aircraft case study in the vicinity of Mauna Loa Observatory (MLO) on 11 January 2014: approaching from the east, the GV aircraft descended to a missed approach at Kona (descent is denoted RF01-06) then ascended by spiraling (RF01-07) into the stratospheric intrusion (not observed on the RF01-06 to the east) and, finally, spiraling, descended (RF01-08) out of the intrusion to land in Honolulu. Color-coded arrows indicate the viewing direction and approximate maximum horizontal distance sampled by the MT-DOAS near the instrument altitude under typical low-aerosol conditions at the wavelengths indicated. BrO observed at MLO may be transported from but is not located over the ocean.
3.4 Aircraft profile retrievals of HCHO and BrO
Aircraft observations of a second RW-DT event in the vicinity of MLO by the CU AMAX-DOAS provide an opportunity for us to assess the retrieval, leveraging the greater sensitivity and precision of altitude available aboard a mobile platform. As has been previously noted, RW-DTs are often accompanied by widespread and complex cloud fields, presenting challenges for DOAS retrievals due to the radiation fields; this was the case on 11 January 2014; however, two descents and an ascent over Hawaii together provide a near-complete profile, sampled twice with a clear line of sight. The relevant flight path is summarized in Fig. 7. BrO profiles from the CONTRAST campaign have been previously reported in Koenig et al. (2017). After conducting sensitivity studies, in this work, we have made some minor adjustments to the BrO fit settings to better match those used for MLO, as summarized in Table S2, with further details in the text of the Supplement.
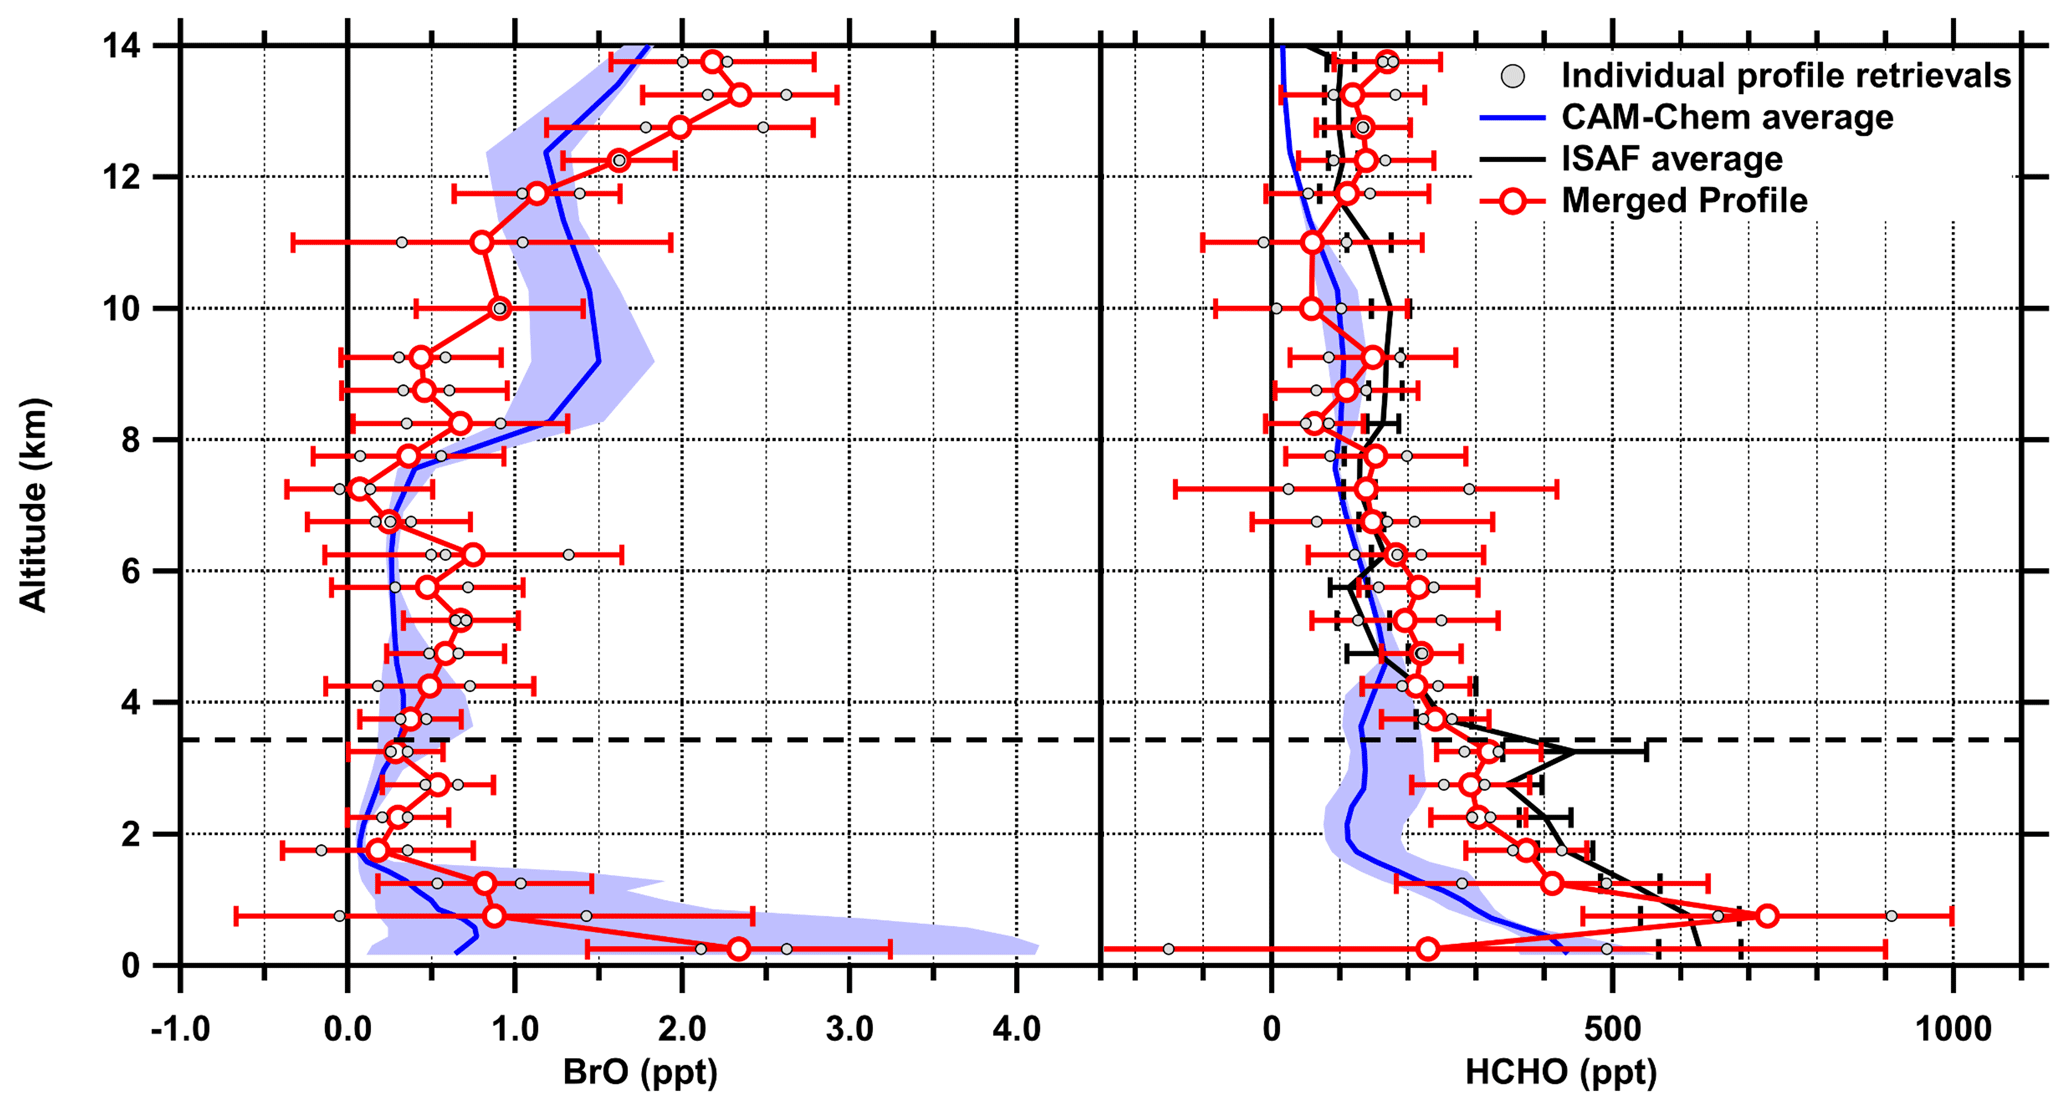
Figure 8Retrieved BrO and HCHO columns compared with modeled profiles from CAM-Chem and measured by ISAF: profile is a weighted average. See text for details on averaging and CAM-Chem and ISAF profiles.
The retrieved BrO and HCHO profiles are summarized in Fig. 8. In the boundary layer below ∼ 2 km altitude, significant heterogeneity is observed. The rapid changes in observed signals around the missed approach at Kona International Airport (KOA) present challenges for the optimal estimation, leading to strikingly different concentrations at neighboring altitudes and between RF01-06 and RF01-07 (Figs. S15 and S16). Comparison with the interpolated BrO profile from CAM-Chem shows that the model underestimates the local concentrations; however, the shading showing the range of concentrations over the Hawaiian islands shows that the model does include instances of high BrO concentrations in the marine boundary layer (MBL) and is only missing the precise locations of these in the vicinity of KOA. A number of points retrieved in the HCHO profile for RF01-07 in the boundary layer – but not for RF01-06 – are outside the measured range of in situ observations obtained by ISAF (Hanisco, 2014), indicating that there might have been very-low-HCHO air somewhere in the vicinity but not along the flight track, although the large propagated uncertainty in the optimal estimation indicates that the limitations of the retrieval are also likely to play a role. Retrieved BrO mixing ratios in the FT from 2 to 9.5 km oscillate around ∼ 0.5 ppt, with a minor local maximum around 5–6 km being captured in all profiles (see also Fig. S15). CAM-Chem generally captures the broad picture of BrO in the FT but appears to misplace the vertical extent of RW-DT stratospheric intrusion to as low as 8 km, which is not observed. Instead, the stratospheric intrusion is observed to start at 10–12 km, where BrO is observed to increase to over 2 ppt, with the intensity again being mildly underestimated by the model. In the lower FT, both the ISAF and AMAX-DOAS find that HCHO mixing ratios are not only higher than predicted by CAM-Chem but also outside the regional range in the model up to roughly the altitude of MLO. Through the altitude range of 4–8 km, the measurements remain in general agreement, with the ISAF possessing greater precision; the model is within uncertainty over this range but is still systematically slightly low. The measurements again depart from CAM-Chem predictions in the stratospheric intrusion, where the model predicts < 50 ppt HCHO, but both instruments observe ≥ 100 ppt. This discrepancy was not generally observed by ISAF during flights over the central Pacific but is more typical of the western Pacific (Anderson et al., 2017).
3.5 Retrieved profiles in context
The CONTRAST RF01 profiles offer only a limited snapshot over the central Pacific but nonetheless offer an opportunity to compare to prior aircraft measurements over the western and eastern Pacific. Examining the profiles over the altitude range the MT is sensitive to (Fig. 9), the RF01 retrieved profile is broadly consistent with the eastern Pacific in the lower FT. This is particularly notable because, as noted above, BrO was observed in the MBL, similarly to the western Pacific, but this is not found to propagate up to the lower FT as it does there. This might reflect lower convective intensity relative to the western Pacific but might also be a reflection of limited sampling and statistics. Through the range of 4–9 km, all three regional profiles are approximately 0.5 ppt BrO, indicating that this might reflect a broadly applicable Pacific background with some uncertainty. Above this altitude, the RF01 profile is again in general agreement with the average profile observed over the eastern Pacific. Keeping in mind that the observed profile is during an RW-DT, this suggests that such events and isentropic transport from the stratosphere more generally, which are common in the region (Wernli and Sprenger, 2007; Funatsu and Waugh, 2008), are likely to be contributors to the observed increase in BrO in the upper FT observed over the eastern Pacific. Intriguingly, the decrease in BrO observed in the lower FT at the same time may reflect the effects of dynamics which are broadly coupled to Rossby wave breaking (Funatsu and Waugh, 2008; de Vries, 2021), and it is possible that these dynamics can also contribute to the relatively low BrO concentrations at lower altitudes observed over the eastern Pacific.

Figure 9Comparison of MT-DOAS retrieved tropospheric-BrO profiles with AMAX-DOAS profiles: (a) BrO over the central Pacific Ocean is compared with BrO profiles previously measured over the eastern Pacific Ocean (Dix et al., 2016) and western Pacific Ocean (Koenig et al., 2017). All profiles are measured in January and February. (b) Comparison of the AMAX-DOAS and MT-DOAS retrieved profiles reported here. Mountaintop profiles are shown for SZA = 70°. Despite the fact that measurements occurred 3 years apart and utilized different geometries, the BrO profiles for the RW-DT conditions are remarkably similar through most of the troposphere. Applying the MT-AVK to the aircraft profile resolves apparent discrepancies in the uFT.
Comparing the MT and aircraft profiles from this work (Fig. 9), BrO is consistently ∼ 0.5 ppt, again generally suggesting that this might be a regional average within some bounds of altitude. We apply the AVK from the MT-DOAS retrieval to the AMAX-DOAS profile to better compare how the two profiles would appear on the same instrument. Interestingly, the maximum of ∼ 1.0 ppt BrO observed around 6 km altitude on 26 April is broadly similar to the upper range of a local maximum observed over the western Pacific, suggesting that it might arise from similar processes over the western Pacific. The low BrO observed above 9 km on 26 April is also broadly consistent with the western Pacific, although again being more marked than average. In contrast to the RW-DT-impacted profiles, 26 April more closely resembles the western Pacific. This suggests that variability in BrO profiles over the central Pacific and perhaps more broadly might be partly driven by meteorological conditions which occur and are sampled with different frequencies regionally. Intriguingly, the aircraft profile observes a similar BrO minimum between 6 and 9 km as on 29 April. As previously noted, this altitude range does not obviously connect to the RW-DT events observed. With only two samples, it is possible that this is merely coincidental, and it should be noted that applying the AVK for 29 April to the aircraft profile eliminates this feature. However, we note the local maximum in BrO observed on 26 April and over the western Pacific; this minimum might have its origins in convective transport (and perhaps the lack thereof) which is known to be systematically perturbed prior to and during RW-DT events. Examining the stratospheric intrusion above ∼ 12 km associated with the RW-DT, the two profiles are remarkably similar when accounting for the AVK. Consistently with the CAM-Chem model prediction that the RW-DT on 29 April 2017 is greater in intensity than on 11 January 2014 (Fig. S2), more BrO is observed in the upper FT from the MT when accounting for AVK. This demonstrates that the MT-DOAS is sensitive to BrO in the upper FT and can detect the impact of an RW-DT with AVK, likely accurately capturing the limitations of the retrieval (Rodgers and Connor, 2003). These limitations as represented by the AVK should be considered when interpreting the data as the comparison with the aircraft profile demonstrates the limited altitude precision of the MT retrieval. It is likely that BrO enhancements are more limited in vertical extent than captured by MT-DOAS are but correspondingly more intense.
MT-DOAS is well suited to measuring trace gas profiles up to 35 km altitude, being able to retrieve more than 1 degree of freedom below the instrument, near the instrument altitude, in the free troposphere, and in the stratosphere. We further highlight a number of lessons learned and prospects for extensions to other work.
4.1 Lessons learned
Development of the retrieval method highlighted a number of features of the MT-DOAS retrieval of BrO:
-
The placement of the MT-DOAS above most atmospheric aerosol meant that aerosol at and above the instrument altitude were minimal to almost negligible; however, it also revealed the need to represent aerosol and cloud radiative effects below the instrument.
-
Recent advances in the molecular spectroscopy of O3 and O2–O2 collision-induced absorption (Serdyuchenko et al., 2014; Finkenzeller and Volkamer, 2022) greatly improve consistent spectral fitting of BrO and HCHO dSCDs from solar stray light spectra measured in the ZS and OA geometries .
-
Nonetheless, spectral cross-correlation between BrO and HCHO still requires active management and the imposition of constrains consistent with prior findings (Pinardi et al., 2013; Pukite and Wagner, 2016; Seo et al., 2019).
-
Combining the ZS- and OA-based retrievals of stratospheric and tropospheric BrO, respectively, has a synergistic benefit of gaining roughly 1 degree of freedom.
-
Time-dependent variables were needed to represent changes in Bry by faster than 1 d. When added to the purely spatial variables typically used for optimal estimation, they allowed for a consistent inverse Bayesian treatment of the data and agreement with observations; however, the sensitivity of the new variables is still incompletely understood.
Additionally, knowledge of atmospheric BrO was extended through the first measurements over the central Pacific by MT-DOAS and AMAX-DOAS.
-
The central Pacific BrO profile is generally consistent with that of the western Pacific in the base case; however, the RW-DT case highlights the likely contribution of such events to elevated BrO at high altitudes over the eastern Pacific.
-
Unexpectedly, given that RW-DTs are typically understood primarily as injections of stratospheric air, short-term changes in BrO (faster than 1 d) were found to occur mostly lower in the troposphere.
4.2 Prospects for further development and application
The methods developed here can be built upon and extended to other remote sensing retrievals. Key needs for further development include the following:
-
We must overcome the key limitation imposed by the computational time of the RTM for aerosol retrieval despite low-aerosol conditions. Consolidating the RTM computations within a single model and perhaps using look-up tables if necessary could help in this direction.
-
The only remaining null space for the retrieval is below 1.9 km. Coordination of MT-DOAS with a MAX-DOAS is one potential long-term solution to this, but there may be others.
The methods developed here can also be extended to different trace gases using MT-DOAS. The synergistic benefit of combining the ZS and OA retrievals is greatest where the stratospheric and tropospheric partial columns are comparable (for BrO less than 1:2 either way), and the benefit of time-dependent extensions to optimal estimation is greatest for species where there is extensive nonphotochemical heterogeneity. Species to be targeted, in an approximate order of suitability, are as follows:
-
The first is NO2, which, in an urban environment, has tropospheric and stratospheric partial columns within the same 1:2 ratio, and even in the remote atmosphere, it still frequently has a tropospheric-to-stratospheric partial column ratio of 1:6 or better. Furthermore, the retrieval of NO2 can be conducted at multiple wavelengths, which, especially at low AOD, can be used for ranging (Ortega et al., 2015; Dimitropoulou et al., 2022); employing this ranging approach in conjunction with the time-dependent methods introduced here holds potential to further develop and assess multidimensional optimal-estimation approaches.
-
The second is HCHO, which might be considered as a target because it is expected to be fitted and retrieved in the course of BrO retrievals in any case. In regions of low HCHO, the stratospheric column on the order of 1 × 10¹⁴ molec. cm−2 can be as much as 10 % of the total column; however, it is typically less than this. Tropospheric HCHO does, however, have complex drivers from both photochemistry and transport which might benefit from a time-dependent approach.
-
IO and CHOCHO are expected to have even less favorable conditions in terms of the relative proportion of their stratospheric partial columns, but the comparability of tropospheric and stratospheric columns specifically might not be the key criterion as both have significant columns in the free troposphere. Both also have significant tropospheric heterogeneity to unravel.
-
Finally, there is O3, which, in contrast, to most other species measured by DOAS, has its VCD dominated by the stratosphere, with the troposphere accounting for a single-digit percentage of the total column typically. Nonetheless, a full atmosphere retrieval might be possible for the Chappuis bands, which have longer path lengths and better signal-to-noise ratio for OA geometries, or perhaps by leveraging both the Chappuis and Harley bands together.
A set of functions used for the optimal estimation written for Igor 7, as well as the code used for the final retrieval, are archived at https://doi.org/10.5281/zenodo.11570073 (Koenig et al., 2024).
MT-DOAS data and associated RTM data products are archived at https://doi.org/10.5281/zenodo.8337857 (Koenig et al., 2023). The AMAX-DOAS BrO data are available from the CONTRAST data archive: https://doi.org/10.5065/D6F769MF (Volkamer et al., 2020). The CONTRAST data set is open for use by the public, subject to the data policy: https://www.eol.ucar.edu/ content/contrast-data-policy (last access: 24 January 2020).
The supplement related to this article is available online at: https://doi.org/10.5194/amt-17-5911-2024-supplement.
TKK, FH, MVR, and RV conceptualized this work and developed the methodology. TKK, CFL, and RV conducted measurements. TKK, FH, CFL, and MVR conducted data analysis. DK provided model data and analysis tools. TKK visualized data with contributions from all the authors. TKK and RV wrote the paper with contributions from all the authors.
At least one of the (co-)authors is a member of the editorial board of Atmospheric Measurement Techniques. The peer-review process was guided by an independent editor, and the authors also have no other competing interests to declare.
Publisher's note: Copernicus Publications remains neutral with regard to jurisdictional claims made in the text, published maps, institutional affiliations, or any other geographical representation in this paper. While Copernicus Publications makes every effort to include appropriate place names, the final responsibility lies with the authors.
This work was funded by the National Science Foundation (NSF; grant nos. AGS-2027252, AGS-1649147, and AGS-1951514). CONTRAST was funded by the NSF (grant nos. AGS-1261740, and AGS-1620530). Mauna Loa Observatory is a National Oceanic and Atmospheric Administration (NOAA), Earth System Research Laboratory (ESRL) Global Monitoring Laboratory (GML) facility. CAM-Chem is a component of the Community Earth System Model, supported by the National Science Foundation (NSF). We would like to acknowledge high-performance computing support from Cheyenne (DOI: https://doi.org/10.5065/D6RX99HX), provided by NCAR's Computational and Information Systems Laboratory, sponsored by the NSF. We thank the NOAA staff at Mauna Loa Observatory for the assistance with the on-site maintenance and calibrations on the MT-DOAS instrument, especially Paul Fukumura. We further thank Barbara Dix for the initial setup of the MT-DOAS at Mauna Loa and the preliminary discussions that contributed toward this work, as well as the CONTRAST team, including pilots, technicians, forecasters, and scientists on the aircraft and on the ground. Theodore K. Koenig and Rainer Volkamer thank Thomas Hanisco, Glenn Wolfe, and Daniel C. Anderson for the use of the CONTRAST ISAF data. The GV aircraft was operated by the National Center for Atmospheric Research's (NCAR) Earth Observing Laboratory's (EOL) Research Aviation Facility (RAF).
This research has been supported by the National Science Foundation (grant nos. AGS-2027252, AGS-1649147, and AGS-1951514).
This paper was edited by Karin Kreher and reviewed by two anonymous referees.
Aliwell, S. R., Jones, R. L., and Fish, D. J.: Mid-latitude observations of the seasonal variation of BrO 1. Zenith-sky measurements, Geophys. Res. Lett., 24, 1195–1198, https://doi.org/10.1029/97GL01165, 1997.
Aliwell, S. R., Van Roozendael, M., Johnston, P. V., Richter, A., Wagner, T., Arlander, D. W., Burrows, J. P., Fish, D. J., Jones, R. L., Tørnkvist, K. K., Lambert, J. C., Pfeilsticker, K., and Pundt, I.: Analysis for BrO in zenith-sky spectra: An intercomparison exercise for analysis improvement, J. Geophys. Res.-Atmos., 107, ACH 10-1, https://doi.org/10.1029/2001JD000329, 2002.
Anderson, D. C., Nicely, J. M., Wolfe, G. M., Hanisco, T. F., Salawitch, R. J., Canty, T. P., Dickerson, R. R., Apel, E. C., Baidar, S., Bannan, T. J., Blake, N. J., Chen, D., Dix, B., Fernandez, R. P., Hall, S. R., Hornbrook, R. S., Gregory Huey, L., Josse, B., Jöckel, P., Kinnison, D. E., Koenig, T. K., Le Breton, M., Marécal, V., Morgenstern, O., Oman, L. D., Pan, L. L., Percival, C., Plummer, D., Revell, L. E., Rozanov, E., Saiz-Lopez, A., Stenke, A., Sudo, K., Tilmes, S., Ullmann, K., Volkamer, R., Weinheimer, A. J., and Zeng, G.: Formaldehyde in the Tropical Western Pacific: Chemical Sources and Sinks, Convective Transport, and Representation in CAM-Chem and the CCMI Models, J. Geophys. Res.-Atmos., 122, 11201–11226, https://doi.org/10.1002/2016JD026121, 2017.
Baidar, S., Oetjen, H., Coburn, S., Dix, B., Ortega, I., Sinreich, R., and Volkamer, R.: The CU Airborne MAX-DOAS instrument: vertical profiling of aerosol extinction and trace gases, Atmos. Meas. Tech., 6, 719–739, https://doi.org/10.5194/amt-6-719-2013, 2013.
Bloss, W. J., Camredon, M., Lee, J. D., Heard, D. E., Plane, J. M. C., Saiz-Lopez, A., Bauguitte, S. J.-B., Salmon, R. A., and Jones, A. E.: Coupling of HOx, NOx and halogen chemistry in the antarctic boundary layer, Atmos. Chem. Phys., 10, 10187–10209, https://doi.org/10.5194/acp-10-10187-2010, 2010.
Boucher, O., Moulin, C., Belviso, S., Aumont, O., Bopp, L., Cosme, E., von Kuhlmann, R., Lawrence, M. G., Pham, M., Reddy, M. S., Sciare, J., and Venkataraman, C.: DMS atmospheric concentrations and sulphate aerosol indirect radiative forcing: a sensitivity study to the DMS source representation and oxidation, Atmos. Chem. Phys., 3, 49–65, https://doi.org/10.5194/acp-3-49-2003, 2003.
Burkholder, J. B., Sander, S. P., Abbatt, J. P. D., Barker, J. R., Huie, R. E., Kolb, C. E., Kurylo, M. J., Orkin, V. L., Wilmouth, D. M., and Wine, P. H.: Chemical Kinetics and Photochemical Data for Use in Atmospheric Studies, Evaluation No. 18, Pasadena, CA, USA, 1392 pp., http://jpldataeval.jpl.nasa.gov (last access: 3 June 2019), 2015.
Chance, K.: Analysis of BrO measurements from the Global Ozone Monitoring Experiment, Geophys. Res. Lett., 25, 3335–3338, https://doi.org/10.1029/98GL52359, 1998.
Chance, K. and Kurucz, R. L.: An improved high-resolution solar reference spectrum for earth's atmosphere measurements in the ultraviolet, visible, and near infrared, J. Quant. Spectrosc. Radiat. Transf., 111, 1289–1295, https://doi.org/10.1016/j.jqsrt.2010.01.036, 2010.
Chen, D., Huey, L. G., Tanner, D. J., Salawitch, R. J., Anderson, D. C., Wales, P. A., Pan, L. L., Atlas, E. L., Hornbrook, R. S., Apel, E. C., Blake, N. J., Campos, T. L., Donets, V., Flocke, F. M., Hall, S. R., Hanisco, T. F., Hills, A. J., Honomichl, S. B., Jensen, J. B., Kaser, L., Montzka, D. D., Nicely, J. M., Reeves, J. M., Riemer, D. D., Schauffler, S. M., Ullmann, K., Weinheimer, A. J., and Wolfe, G. M.: Airborne measurements of BrO and the sum of HOBr and Br2 over the Tropical West Pacific from 1 to 15 km during the CONvective TRansport of Active Species in the Tropics (CONTRAST) experiment, J. Geophys. Res.-Atmos., 121, 12560–12578, https://doi.org/10.1002/2016JD025561, 2016.
Chipperfield, M. P.: New version of the TOMCAT/SLIMCAT off-line chemical transport model: Intercomparison of stratospheric tracer experiments, Q. J. R. Meteorol. Soc., 132, 1179–1203, https://doi.org/10.1256/qj.05.51, 2006.
Clémer, K., Van Roozendael, M., Fayt, C., Hendrick, F., Hermans, C., Pinardi, G., Spurr, R., Wang, P., and De Mazière, M.: Multiple wavelength retrieval of tropospheric aerosol optical properties from MAXDOAS measurements in Beijing, Atmos. Meas. Tech., 3, 863–878, https://doi.org/10.5194/amt-3-863-2010, 2010.
Coburn, S., Dix, B., Sinreich, R., and Volkamer, R.: The CU ground MAX-DOAS instrument: characterization of RMS noise limitations and first measurements near Pensacola, FL of BrO, IO, and CHOCHO, Atmos. Meas. Tech., 4, 2421–2439, https://doi.org/10.5194/amt-4-2421-2011, 2011.
Coburn, S., Dix, B., Edgerton, E., Holmes, C. D., Kinnison, D., Liang, Q., ter Schure, A., Wang, S., and Volkamer, R.: Mercury oxidation from bromine chemistry in the free troposphere over the southeastern US, Atmos. Chem. Phys., 16, 3743–3760, https://doi.org/10.5194/acp-16-3743-2016, 2016.
Custard, K. D., Thompson, C. R., Pratt, K. A., Shepson, P. B., Liao, J., Huey, L. G., Orlando, J. J., Weinheimer, A. J., Apel, E., Hall, S. R., Flocke, F., Mauldin, L., Hornbrook, R. S., Pöhler, D., General, S., Zielcke, J., Simpson, W. R., Platt, U., Fried, A., Weibring, P., Sive, B. C., Ullmann, K., Cantrell, C., Knapp, D. J., and Montzka, D. D.: The NOx dependence of bromine chemistry in the Arctic atmospheric boundary layer, Atmos. Chem. Phys., 15, 10799–10809, https://doi.org/10.5194/acp-15-10799-2015, 2015.
Danckaert, T., Fayt, C., van Roozendael, M., de Smedt, I., Letocart, V., Merlaud, A., and Pinardi, G.: QDOAS Software user manual v2.1, 125 pp., http://uv-vis.aeronomie.be/software/QDOAS/QDOAS_manual.pdf (last access: 10 June 2019), 2012.
Deutschmann, T., Beirle, S., Frieß, U., Grzegorski, M., Kern, C., Kritten, L., Platt, U., Prados-Román, C., Pukite, J., Wagner, T., Werner, B., and Pfeilsticker, K.: The Monte Carlo atmospheric radiative transfer model McArtim: Introduction and validation of Jacobians and 3D features, J. Quant. Spectrosc. Radiat. Transf., 112, 1119–1137, https://doi.org/10.1016/j.jqsrt.2010.12.009, 2011.
de Vries, A. J.: A global climatological perspective on the importance of Rossby wave breaking and intense moisture transport for extreme precipitation events, Weather Clim. Dyn., 2, 129–161, https://doi.org/10.5194/WCD-2-129-2021, 2021.
Dimitropoulou, E., Hendrick, F., Friedrich, M. M., Tack, F., Pinardi, G., Merlaud, A., Fayt, C., Hermans, C., Fierens, F., and Van Roozendael, M.: Horizontal distribution of tropospheric NO2 and aerosols derived by dual-scan multi-wavelength multi-axis differential optical absorption spectroscopy (MAX-DOAS) measurements in Uccle, Belgium, Atmos. Meas. Tech., 15, 4503–4529, https://doi.org/10.5194/amt-15-4503-2022, 2022.
Dix, B., Baidar, S., Bresch, J. F., Hall, S. R., Schmidt, K. S., Wang, S., and Volkamer, R.: Detection of iodine monoxide in the tropical free troposphere, P. Natl. Acad. Sci. USA, 110, 2035–2040, https://doi.org/10.1073/pnas.1212386110, 2013.
Dix, B., Koenig, T. K., and Volkamer, R.: Parameterization retrieval of trace gas volume mixing ratios from Airborne MAX-DOAS, Atmos. Meas. Tech., 9, 5655–5675, https://doi.org/10.5194/amt-9-5655-2016, 2016.
Dorf, M., Butler, J. H., Butz, A., Camy-Peyret, C., Chipperfield, M. P., Kritten, L., Montzka, S. A., Simmes, B., Weidner, F., and Pfeilsticker, K.: Long-term observations of stratospheric bromine reveal slow down in growth, Geophys. Res. Lett., 33, 1–4, https://doi.org/10.1029/2006GL027714, 2006.
Dorf, M., Butz, A., Camy-Peyret, C., Chipperfield, M. P., Kritten, L., and Pfeilsticker, K.: Bromine in the tropical troposphere and stratosphere as derived from balloon-borne BrO observations, Atmos. Chem. Phys., 8, 7265–7271, https://doi.org/10.5194/acp-8-7265-2008, 2008.
Errera, Q. and Fonteyn, D.: Four-dimensional variational chemical assimilation of CRISTA stratospheric measurements, J. Geophys. Res.-Atmos., 106, 12253–12265, https://doi.org/10.1029/2001JD900010, 2001.
Evans, M. J., Jacob, D. J., Atlas, E., Cantrell, C. A., Eisele, F., Flocke, F., Fried, A., Mauldin, R. L., Ridley, B. A., Wert, B., Talbot, R., Blake, D., Heikes, B., Snow, J., Walega, J., Weinheimer, A. J., and Dibb, J.: Coupled evolution of BrOx-ClOx-HOx-NOx chemistry during bromine-catalyzed ozone depletion events in the arctic boundary layer, J. Geophys. Res., 108, 8368, https://doi.org/10.1029/2002JD002732, 2003.
Fernandez, R. P., Salawitch, R. J., Kinnison, D. E., Lamarque, J.-F., and Saiz-Lopez, A.: Bromine partitioning in the tropical tropopause layer: implications for stratospheric injection, Atmos. Chem. Phys., 14, 13391–13410, https://doi.org/10.5194/acp-14-13391-2014, 2014.
Finkenzeller, H. and Volkamer, R.: O2–O2 CIA in the gas phase: Cross-section of weak bands, and continuum absorption between 297–500 nm, J. Quant. Spectrosc. Radiat. Transf., 279, 108063, https://doi.org/10.1016/J.JQSRT.2021.108063, 2022.
Fitzenberger, R., Bösch, H., Camy-Peyret, C., Chipperfield, M. P., Harder, H., Platt, U., Sinnhuber, B.-M., Wagner, T., and Pfeilsticker, K.: First profile measurements of tropospheric BrO, Geophys. Res. Lett., 27, 2921–2924, https://doi.org/10.1029/2000GL011531, 2000.
Fleischmann, O. C., Hartmann, M., Burrows, J. P., and Orphal, J.: New ultraviolet absorption cross-sections of BrO at atmospheric temperatures measured by time-windowing Fourier transform spectroscopy, J. Photochem. Photobiol. A Chem., 168, 117–132, https://doi.org/10.1016/J.JPHOTOCHEM.2004.03.026, 2004.
Frieß, U., Chipperfield, M. P., Harder, H., Otten, C., Platt, U., Pyle, J., Wagner, T., and Pfeilsticker, K.: Intercomparison of measured and modelled BrO slant column amounts for the arctic winter and spring 1994/95, Geophys. Res. Lett., 26, 1861–1864, https://doi.org/10.1029/1999GL900345, 1999.
Funatsu, B. M. and Waugh, D. W.: Connections between Potential Vorticity Intrusions and Convection in the Eastern Tropical Pacific, J. Atmos. Sci., 65, 987–1002, https://doi.org/10.1175/2007JAS2248.1, 2008.
Goodsite, M. E., Plane, J. M. C., and Skov, H.: A Theoretical Study of the Oxidation of Hg0 to HgBr2 in the Troposphere, Environ. Sci. Technol., 38, 1772–1776, https://doi.org/10.1021/ES034680S, 2004.
Gorshelev, V., Serdyuchenko, A., Weber, M., Chehade, W., and Burrows, J. P.: High spectral resolution ozone absorption cross-sections – Part 1: Measurements, data analysis and comparison with previous measurements around 293 K, Atmos. Meas. Tech., 7, 609–624, https://doi.org/10.5194/amt-7-609-2014, 2014.
Grainger, J. F. and Ring, J.: Anomalous Fraunhofer Line Profiles, Nature, 193, 762–762, https://doi.org/10.1038/193762a0, 1962.
Harder, H., Camy-Peyret, C., Ferlemann, F., Fitzenberger, R., Hawat, T., Osterkamp, H., Schneider, M., Perner, D., Platt, U., Vradelis, P., and Pfeilsticker, K.: Stratospheric BrO profiles measured at different latitudes and seasons: Atmospheric observations, Geophys. Res. Lett., 25, 3843–3846, https://doi.org/10.1029/1998GL900026, 1998.
Hendrick, F., Barret, B., Van Roozendael, M., Boesch, H., Butz, A., De Mazière, M., Goutail, F., Hermans, C., Lambert, J.-C., Pfeilsticker, K., and Pommereau, J.-P.: Retrieval of nitrogen dioxide stratospheric profiles from ground-based zenith-sky UV-visible observations: validation of the technique through correlative comparisons, Atmos. Chem. Phys., 4, 2091–2106, https://doi.org/10.5194/acp-4-2091-2004, 2004.
Hendrick, F., Van Roozendael, M., Chipperfield, M. P., Dorf, M., Goutail, F., Yang, X., Fayt, C., Hermans, C., Pfeilsticker, K., Pommereau, J.-P., Pyle, J. A., Theys, N., and De Mazière, M.: Retrieval of stratospheric and tropospheric BrO profiles and columns using ground-based zenith-sky DOAS observations at Harestua, 60° N, Atmos. Chem. Phys., 7, 4869–4885, https://doi.org/10.5194/acp-7-4869-2007, 2007.
Hendrick, F., Rozanov, A., Johnston, P. V., Bovensmann, H., De Mazière, M., Fayt, C., Hermans, C., Kreher, K., Lotz, W., Sinnhuber, B.-M., Theys, N., Thomas, A., Burrows, J. P., and Van Roozendael, M.: Multi-year comparison of stratospheric BrO vertical profiles retrieved from SCIAMACHY limb and ground-based UV-visible measurements, Atmos. Meas. Tech., 2, 273–285, https://doi.org/10.5194/amt-2-273-2009, 2009.
Holmes, C. D., Jacob, D. J., and Yang, X.: Global lifetime of elemental mercury against oxidation by atomic bromine in the free troposphere, Geophys. Res. Lett., 33, L20808, https://doi.org/10.1029/2006GL027176, 2006.
Koenig, T. K., Volkamer, R., Baidar, S., Dix, B., Wang, S., Anderson, D. C., Salawitch, R. J., Wales, P. A., Cuevas, C. A., Fernandez, R. P., Saiz-Lopez, A., Evans, M. J., Sherwen, T., Jacob, D. J., Schmidt, J., Kinnison, D., Lamarque, J.-F., Apel, E. C., Bresch, J. C., Campos, T., Flocke, F. M., Hall, S. R., Honomichl, S. B., Hornbrook, R., Jensen, J. B., Lueb, R., Montzka, D. D., Pan, L. L., Reeves, J. M., Schauffler, S. M., Ullmann, K., Weinheimer, A. J., Atlas, E. L., Donets, V., Navarro, M. A., Riemer, D., Blake, N. J., Chen, D., Huey, L. G., Tanner, D. J., Hanisco, T. F., and Wolfe, G. M.: BrO and inferred Bry profiles over the western Pacific: relevance of inorganic bromine sources and a Bry minimum in the aged tropical tropopause layer, Atmos. Chem. Phys., 17, 15245–15270, https://doi.org/10.5194/acp-17-15245-2017, 2017.
Koenig, T. K., Hendrick, F., Kinnison, D., Lee, C. F., Van Roozendael, M., and Volkamer, R.: Troposphere – stratosphere integrated BrO profile retrieval over the central Pacific Ocean, Zenodo [data set], https://doi.org/10.5281/zenodo.8337857, 2023.
Koenig, T. K., Hendrick, F., Kinnison, D., Lee, C. F., Van Roozendael, M., and Volkamer, R.: Troposphere – stratosphere integrated BrO profile retrieval over the central Pacific Ocean, Zenodo [code], https://doi.org/10.5281/zenodo.11570073, 2024.
Kreher, K., Johnston, P. V., Wood, S. W., Nardi, B., and Platt, U.: Ground-based measurements of tropospheric and stratospheric BrO at Arrival Heights, Antarctica, Geophys. Res. Lett., 24, 3021–3024, https://doi.org/10.1029/97GL02997, 1997.
Kreher, K., Van Roozendael, M., Hendrick, F., Apituley, A., Dimitropoulou, E., Frieß, U., Richter, A., Wagner, T., Lampel, J., Abuhassan, N., Ang, L., Anguas, M., Bais, A., Benavent, N., Bösch, T., Bognar, K., Borovski, A., Bruchkouski, I., Cede, A., Chan, K. L., Donner, S., Drosoglou, T., Fayt, C., Finkenzeller, H., Garcia-Nieto, D., Gielen, C., Gómez-Martín, L., Hao, N., Henzing, B., Herman, J. R., Hermans, C., Hoque, S., Irie, H., Jin, J., Johnston, P., Khayyam Butt, J., Khokhar, F., Koenig, T. K., Kuhn, J., Kumar, V., Liu, C., Ma, J., Merlaud, A., Mishra, A. K., Müller, M., Navarro-Comas, M., Ostendorf, M., Pazmino, A., Peters, E., Pinardi, G., Pinharanda, M., Piters, A., Platt, U., Postylyakov, O., Prados-Roman, C., Puentedura, O., Querel, R., Saiz-Lopez, A., Schönhardt, A., Schreier, S. F., Seyler, A., Sinha, V., Spinei, E., Strong, K., Tack, F., Tian, X., Tiefengraber, M., Tirpitz, J.-L., van Gent, J., Volkamer, R., Vrekoussis, M., Wang, S., Wang, Z., Wenig, M., Wittrock, F., Xie, P. H., Xu, J., Yela, M., Zhang, C., and Zhao, X.: Intercomparison of NO2, O4, O3 and HCHO slant column measurements by MAX-DOAS and zenith-sky UV–visible spectrometers during CINDI-2, Atmos. Meas. Tech., 13, 2169–2208, https://doi.org/10.5194/amt-13-2169-2020, 2020.
Kurucz, R. L., Furenlid, I., Brault, J., and Testerman, L.: Solar flux atlas from 296 to 1300 nm, National Solar Observatory, 1984, Sunspot, New Mexico, 239 pp., 1984.
Lamarque, J.-F., Emmons, L. K., Hess, P. G., Kinnison, D. E., Tilmes, S., Vitt, F., Heald, C. L., Holland, E. A., Lauritzen, P. H., Neu, J., Orlando, J. J., Rasch, P. J., and Tyndall, G. K.: CAM-chem: description and evaluation of interactive atmospheric chemistry in the Community Earth System Model, Geosci. Model Dev., 5, 369–411, https://doi.org/10.5194/gmd-5-369-2012, 2012.
Lary, D. J.: Halogens and the chemistry of the free troposphere, Atmos. Chem. Phys., 5, 227–237, https://doi.org/10.5194/acp-5-227-2005, 2005.
Le Breton, M., Bannan, T. J., Shallcross, D. E., Khan, M. A., Evans, M. J., Lee, J., Lidster, R., Andrews, S., Carpenter, L. J., Schmidt, J., Jacob, D., Harris, N. R. P., Bauguitte, S., Gallagher, M., Bacak, A., Leather, K. E., and Percival, C. J.: Enhanced ozone loss by active inorganic bromine chemistry in the tropical troposphere, Atmos. Environ., 155, 21–28, https://doi.org/10.1016/j.atmosenv.2017.02.003, 2017.
Lelieveld, J., Crutzen, P. J., and Dentener, F. J.: Changing concentration, lifetime and climate forcing of atmospheric methane, Tellus B, 50, 128–150, https://doi.org/10.1034/j.1600-0889.1998.t01-1-00002.x, 1998.
Leser, H., Hönninger, G., and Platt, U.: MAX-DOAS measurements of BrO and NO2 in the marine boundary layer, Geophys. Res. Lett., 30, 1537 pp., https://doi.org/10.1029/2002gl015811, 2003.
Mayer, B. and Kylling, A.: Technical note: The libRadtran software package for radiative transfer calculations – description and examples of use, Atmos. Chem. Phys., 5, 1855–1877, https://doi.org/10.5194/acp-5-1855-2005, 2005.
Oetjen, H., Baidar, S., Krotkov, N. A., Lamsal, L. N., Lechner, M., and Volkamer, R.: Airborne MAX-DOAS measurements over California: Testing the NASA OMI tropospheric NO2 product, J. Geophys. Res.-Atmos., 118, 7400–7413, https://doi.org/10.1002/jgrd.50550, 2013.
Ordóñez, C., Lamarque, J.-F., Tilmes, S., Kinnison, D. E., Atlas, E. L., Blake, D. R., Sousa Santos, G., Brasseur, G., and Saiz-Lopez, A.: Bromine and iodine chemistry in a global chemistry-climate model: description and evaluation of very short-lived oceanic sources, Atmos. Chem. Phys., 12, 1423–1447, https://doi.org/10.5194/acp-12-1423-2012, 2012.
Ortega, I., Koenig, T., Sinreich, R., Thomson, D., and Volkamer, R.: The CU 2-D-MAX-DOAS instrument – Part 1: Retrieval of 3-D distributions of NO2 and azimuth-dependent OVOC ratios, Atmos. Meas. Tech., 8, 2371–2395, https://doi.org/10.5194/amt-8-2371-2015, 2015.
Parrella, J. P., Jacob, D. J., Liang, Q., Zhang, Y., Mickley, L. J., Miller, B., Evans, M. J., Yang, X., Pyle, J. A., Theys, N., and Van Roozendael, M.: Tropospheric bromine chemistry: implications for present and pre-industrial ozone and mercury, Atmos. Chem. Phys., 12, 6723–6740, https://doi.org/10.5194/acp-12-6723-2012, 2012.
Pinardi, G., Van Roozendael, M., Abuhassan, N., Adams, C., Cede, A., Clémer, K., Fayt, C., Frieß, U., Gil, M., Herman, J., Hermans, C., Hendrick, F., Irie, H., Merlaud, A., Navarro Comas, M., Peters, E., Piters, A. J. M., Puentedura, O., Richter, A., Schönhardt, A., Shaiganfar, R., Spinei, E., Strong, K., Takashima, H., Vrekoussis, M., Wagner, T., Wittrock, F., and Yilmaz, S.: MAX-DOAS formaldehyde slant column measurements during CINDI: intercomparison and analysis improvement, Atmos. Meas. Tech., 6, 167–185, https://doi.org/10.5194/amt-6-167-2013, 2013.
Platt, U. and Stutz, J.: Differential Optical Absorption Spectroscopy – Principles and Applications, Springer, Heidelberg, https://doi.org/10.1007/978-3-540-75776-4, 2008.
Pukite, J. and Wagner, T.: Quantification and parametrization of non-linearity effects by higher-order sensitivity terms in scattered light differential optical absorption spectroscopy, Atmos. Meas. Tech., 9, 2147–2177, https://doi.org/10.5194/amt-9-2147-2016, 2016.
Pundt, I., Pommereau, J. -P., Chipperfield, M. P., van Roozendael, M., and Goutail, F.: Climatology of the stratospheric BrO vertical distribution by balloon-borne UV–visible spectrometry, J. Geophys. Res., 107, 4806, https://doi.org/10.1029/2002JD002230, 2002.
Read, K. A., Mahajan, A. S., Carpenter, L. J., Evans, M. J., Faria, B. V. E., Heard, D. E., Hopkins, J. R., Lee, J. D., Moller, S. J., Lewis, A. C., Mendes, L., McQuaid, J. B., Oetjen, H., Saiz-Lopez, A., Pilling, M. J., and Plane, J. M. C.: Extensive halogen-mediated ozone destruction over the tropical Atlantic Ocean, Nature, 453, 1232–1235, https://doi.org/10.1038/nature07035, 2008.
Richter, A., Wittrock, F., Ladstätter-Weißenmayer, A., and Burrows, J. P.: GOME measurements of stratospheric and tropospheric BrO, Adv. Sp. Res., 29, 1667–1672, https://doi.org/10.1016/S0273-1177(02)00123-0, 2002.
Rodgers, C. D.: Inverse Methods for Atmospheric Sounding Theory and Practice, Singapore, Oxford, 256 pp., https://doi.org/10.1142/3171, 2000.
Rodgers, C. D. and Connor, B. J.: Intercomparison of remote sounding instruments, J. Geophys. Res.-Atmos., 108, 4116, https://doi.org/10.1029/2002JD002299, 2003.
Van Roozendael, M., Wagner, T., Richter, A., Pundt, I., Arlander, D. W., Burrows, J. P., Chipperfield, M., Fayt, C., Johnston, P. V., Lambert, J. C., Kreher, K., Pfeilsticker, K., Platt, U., Pommereau, J. P., Sinnhuber, B. M., Tornkvist, K. K., and Wittrock, F.: Intercomparison of BrO measurements from ERS-2 GOME, ground-based and balloon platforms, Adv. Sp. Res., 29, 1661–1666, https://doi.org/10.1016/S0273-1177(02)00098-4, 2002.
Saiz-Lopez, A. and von Glasow, R.: Reactive halogen chemistry in the troposphere, Chem. Soc. Rev., 41, 6448–6472, https://doi.org/10.1039/c2cs35208g, 2012.
Saiz-Lopez, A., Lamarque, J.-F., Kinnison, D. E., Tilmes, S., Ordóẽz, C., Orlando, J. J., Conley, A. J., Plane, J. M. C., Mahajan, A. S., Sousa Santos, G., Atlas, E. L., Blake, D. R., Sander, S. P., Schauffler, S., Thompson, A. M., and Brasseur, G.: Estimating the climate significance of halogen-driven ozone loss in the tropical marine troposphere, Atmos. Chem. Phys., 12, 3939–3949, https://doi.org/10.5194/acp-12-3939-2012, 2012.
Schmidt, J. A., Jacob, D. J., Horowitz, H. M., Hu, L., Sherwen, T., Evans, M. J., Liang, Q., Suleiman, R. M., Oram, D. E., Le Breton, M., Percival, C. J., Wang, S., Dix, B., and Volkamer, R.: Modeling the observed tropospheric BrO background: Importance of multiphase chemistry and implications for ozone, OH, and mercury, J. Geophys. Res.-Atmos., 121, 11819–11835, https://doi.org/10.1002/2015JD024229, 2016.
Schofield, R., Kreher, K., Connor, B. J., Johnston, P. V., Thomas, A., Shooter, D., Chipperfield, M. P., Rodgers, C. D., and Mount, G. H.: Retrieved' tropospheric and stratospheric BrO columns over Lauder, New Zealand, J. Geophys. Res.-Atmos., 109, 14304, https://doi.org/10.1029/2003JD004463, 2004.
Schofield, R., Johnston, P. V., Thomas, A., Kreher, K., Connor, B. J., Wood, S., Shooter, D., Chipperfield, M. P., Richter, A., von Glasow, R., and Rodgers, C. D.: Tropospheric and stratospheric BrO columns over Arrival Heights, Antarctica, 2002, J. Geophys. Res.-Atmos., 111, 22310, https://doi.org/10.1029/2005JD007022, 2006.
Seo, S., Richter, A., Blechschmidt, A.-M., Bougoudis, I., and Burrows, J. P.: First high-resolution BrO column retrievals from TROPOMI, Atmos. Meas. Tech., 12, 2913–2932, https://doi.org/10.5194/amt-12-2913-2019, 2019.
Serdyuchenko, A., Gorshelev, V., Weber, M., Chehade, W., and Burrows, J. P.: High spectral resolution ozone absorption cross-sections – Part 2: Temperature dependence, Atmos. Meas. Tech., 7, 625–636, https://doi.org/10.5194/amt-7-625-2014, 2014.
Shah, V., Jacob, D. J., Thackray, C. P., Wang, X., Sunderland, E. M., Dibble, T. S., Saiz-Lopez, A., Cernusák, I., Kellö, V., Castro, P. J., Wu, R., and Wang, C.: Improved mechanistic model of the atmospheric redox chemistry of mercury, Environ. Sci. Technol., 55, 14445–14456, https://doi.org/10.1021/ACS.EST.1C03160/ASSET/IMAGES, 2021.
Sherwen, T., Schmidt, J. A., Evans, M. J., Carpenter, L. J., Großmann, K., Eastham, S. D., Jacob, D. J., Dix, B., Koenig, T. K., Sinreich, R., Ortega, I., Volkamer, R., Saiz-Lopez, A., Prados-Roman, C., Mahajan, A. S., and Ordóñez, C.: Global impacts of tropospheric halogens (Cl, Br, I) on oxidants and composition in GEOS-Chem, Atmos. Chem. Phys., 16, 12239–12271, https://doi.org/10.5194/acp-16-12239-2016, 2016.
Simpson, W. R., Brown, S. S., Saiz-Lopez, A., Thornton, J. A., and von Glasow, R.: Tropospheric Halogen Chemistry: Sources, Cycling, and Impacts, Chem. Rev., 115, 4035–4062, https://doi.org/10.1021/cr5006638, 2015.
Sinnhuber, B. M., Arlander, D. W., Bovensmann, H., Burrows, J. P., Chipperfield, M. P., Enell, C. F., Frieß, U., Hendrick, F., Johnston, P. V., Jones, R. L., Kreher, K., Mohamed-Tahrin, N., Müller, R., Pfeilsticker, K., Platt, U., Pommereau, J. P., Pundt, I., Richter, A., South, A. M., Tømkvist, K. K., Van Roozendael, M., Wagner, T., and Wittrock, F.: Comparison of measurements and model calculations of stratospheric bromine monoxide, J. Geophys. Res.-Atmos., 107, 4398, https://doi.org/10.1029/2001JD000940, 2002.
Spinei, E., Cede, A., Herman, J., Mount, G. H., Eloranta, E., Morley, B., Baidar, S., Dix, B., Ortega, I., Koenig, T., and Volkamer, R.: Ground-based direct-sun DOAS and airborne MAX-DOAS measurements of the collision-induced oxygen complex, O2O2, absorption with significant pressure and temperature differences, Atmos. Meas. Tech., 8, 793–809, https://doi.org/10.5194/amt-8-793-2015, 2015.
Stone, D., Sherwen, T., Evans, M. J., Vaughan, S., Ingham, T., Whalley, L. K., Edwards, P. M., Read, K. A., Lee, J. D., Moller, S. J., Carpenter, L. J., Lewis, A. C., and Heard, D. E.: Impacts of bromine and iodine chemistry on tropospheric OH and HO2: comparing observations with box and global model perspectives, Atmos. Chem. Phys., 18, 3541–3561, https://doi.org/10.5194/acp-18-3541-2018, 2018.
Theys, N., Van Roozendael, M., Hendrick, F., Fayt, C., Hermans, C., Baray, J.-L., Goutail, F., Pommereau, J.-P., and De Mazière, M.: Retrieval of stratospheric and tropospheric BrO columns from multi-axis DOAS measurements at Reunion Island (21° S, 56° E), Atmos. Chem. Phys., 7, 4733–4749, https://doi.org/10.5194/acp-7-4733-2007, 2007.
Theys, N., Van Roozendael, M., Hendrick, F., Yang, X., De Smedt, I., Richter, A., Begoin, M., Errera, Q., Johnston, P. V., Kreher, K., and De Mazière, M.: Global observations of tropospheric BrO columns using GOME-2 satellite data, Atmos. Chem. Phys., 11, 1791–1811, https://doi.org/10.5194/acp-11-1791-2011, 2011.
Volkamer, R., Baidar, S., Campos, T. L., Coburn, S., DiGangi, J. P., Dix, B., Eloranta, E. W., Koenig, T. K., Morley, B., Ortega, I., Pierce, B. R., Reeves, M., Sinreich, R., Wang, S., Zondlo, M. A., and Romashkin, P. A.: Aircraft measurements of BrO, IO, glyoxal, NO2, H2O, O2–O2 and aerosol extinction profiles in the tropics: comparison with aircraft-/ship-based in situ and lidar measurements, Atmos. Meas. Tech., 8, 2121–2148, https://doi.org/10.5194/amt-8-2121-2015, 2015.
Volkamer, R., Koenig, T. K., Baidar, S., and Dix, B.: Airborne Multi-AXis Differential Optical Absorption Spectroscopy (AMAX-DOAS) Data, Version 2.0, UCAR/NCAR – Earth Observing Laboratory [data set], https://doi.org/10.5065/D6F769MF, 2020.
von Glasow, R., von Kuhlmann, R., Lawrence, M. G., Platt, U., and Crutzen, P. J.: Impact of reactive bromine chemistry in the troposphere, Atmos. Chem. Phys., 4, 2481–2497, https://doi.org/10.5194/acp-4-2481-2004, 2004.
Wagner, T., Leue, C., Wenig, M., Pfeilsticker, K., and Platt, U.: Spatial and temporal distribution of enhanced boundary layer BrO concentrations measured by the GOME instrument aboard ERS-2, J. Geophys. Res.-Atmos., 106, 24225–24235, https://doi.org/10.1029/2000JD000201, 2001.
Wagner, T., Dix, B., Friedeburg, C. v., Frieß, U., Sanghavi, S., Sinreich, R., and Platt, U.: MAX-DOAS O 4 measurements: A new technique to derive information on atmospheric aerosols-Principles and information content, J. Geophys. Res.-Atmos., 109, D22205, https://doi.org/10.1029/2004JD004904, 2004.
Wang, S., Schmidt, J. A., Baidar, S., Coburn, S., Dix, B., Koenig, T. K., Apel, E., Bowdalo, D., Campos, T. L., Eloranta, E., Evans, M. J., DiGangi, J. P., Zondlo, M. A., Gao, R.-S., Haggerty, J. A., Hall, S. R., Hornbrook, R. S., Jacob, D., Morley, B., Pierce, B., Reeves, M., Romashkin, P., ter Schure, A., and Volkamer, R.: Active and widespread halogen chemistry in the tropical and subtropical free troposphere, P. Natl. Acad. Sci. USA, 112, 9281–9286, https://doi.org/10.1073/pnas.1505142112, 2015.
Wang, X., Jacob, D. J., Downs, W., Zhai, S., Zhu, L., Shah, V., Holmes, C. D., Sherwen, T., Alexander, B., Evans, M. J., Eastham, S. D., Neuman, J. A., Veres, P. R., Koenig, T. K., Volkamer, R., Huey, L. G., Bannan, T. J., Percival, C. J., Lee, B. H., and Thornton, J. A.: Global tropospheric halogen (Cl, Br, I) chemistry and its impact on oxidants, Atmos. Chem. Phys., 21, 13973–13996, https://doi.org/10.5194/acp-21-13973-2021, 2021.
Werner, B., Stutz, J., Spolaor, M., Scalone, L., Raecke, R., Festa, J., Colosimo, S. F., Cheung, R., Tsai, C., Hossaini, R., Chipperfield, M. P., Taverna, G. S., Feng, W., Elkins, J. W., Fahey, D. W., Gao, R.-S., Hintsa, E. J., Thornberry, T. D., Moore, F. L., Navarro, M. A., Atlas, E., Daube, B. C., Pittman, J., Wofsy, S., and Pfeilsticker, K.: Probing the subtropical lowermost stratosphere and the tropical upper troposphere and tropopause layer for inorganic bromine, Atmos. Chem. Phys., 17, 1161–1186, https://doi.org/10.5194/acp-17-1161-2017, 2017.
Wernli, H. and Sprenger, M.: Identification and ERA-15 Climatology of Potential Vorticity Streamers and Cutoffs near the Extratropical Tropopause, J. Atmos. Sci., 64, 1569–1586, https://doi.org/10.1175/JAS3912.1, 2007.
Wofsy, S. C., McElroy, M. B., and Yung, Y. L.: The chemistry of atmospheric bromine, Geophys. Res. Lett., 2, 215–218, https://doi.org/10.1029/GL002i006p00215, 1975.