the Creative Commons Attribution 4.0 License.
the Creative Commons Attribution 4.0 License.
Severe-hail detection with C-band dual-polarisation radars using convolutional neural networks
Vincent Forcadell
Clotilde Augros
Olivier Caumont
Kévin Dedieu
Maxandre Ouradou
Cloé David
Jordi Figueras i Ventura
Olivier Laurantin
Hassan Al-Sakka
Radar has consistently been proven to be the most reliable source of information for the remote detection of hail within storms in real time. Currently, existing hail detection techniques have limited ability to clearly distinguish storms that produce severe hail from those that do not. This often results in a prohibitive number of false alarms that hamper real-time decision-making. This study utilises convolutional neural network (CNN) models trained on dual-polarisation radar data to detect severe-hail occurrence on the ground. The morphology of the storms is studied by leveraging the capabilities of a CNN. Two datasets of images of 60 km × 60 km containing 19 different radar-derived features are built. The first is created from severe-hail cases (≥2 cm), and the second is obtained from rain or small-hail cases (rain or hail <2 cm) selected with the help of a cell identification algorithm above densely populated areas with no hail reports. After a tuning phase on the CNN architecture and its input size, the CNN is trained to output one probability of severe hail on the ground per image of 30 km × 30 km. A test set of 1396 images between 2018 and 2023 demonstrates that the CNN method outperforms state-of-the-art methods according to various metrics. A feature importance study indicates that existing radar-based hail proxies as input features are beneficial to the CNN, particularly the maximum estimated size of hail (MESH). The study demonstrates that many of the existing hail proxies can be adjusted using a threshold value and a threshold area to achieve better performance. Finally, the output of 10 fitted CNN models in inference mode on a hail event is shown.
- Article
(9355 KB) - Full-text XML
- BibTeX
- EndNote
Hailstorms are severe weather phenomena that pose significant risks to agriculture, infrastructure, and human safety. Accurate detection and monitoring of hail is crucial for issuing timely warnings and minimising potential damage, as well as assisting damage surveys after an event. Weather surveillance radar systems have been proven to be valuable tools for detecting hail (Ryzhkov and Zrnic, 2019). Dual-polarisation radars use horizontally and vertically polarised electromagnetic waves transmitted to the atmosphere in pulses using a rotating antenna. The echoes returned from targets such as raindrops or hailstones are analysed to compute various variables within the scanned volume. These data are used to enhance the capabilities of radar systems in detecting and warning about the formation of hail-bearing storms in real time.
Radar-based hail detection techniques can be divided into two distinct groups. The first group is based on reflectivity at horizontal polarisation (ZH). Dry hailstones typically exhibit high ZH values, although they are weaker than those of raindrops of the same size due to a higher dielectric constant for rain (Ryzhkov and Zrnic, 2019). For a given amount of hail contained in a unit volume of cloud, i.e. a given hail content, the hail size distribution is shifted towards larger diameters in comparison to rain. This results in higher reflectivities for hail compared to rain. Melting hail (or hail growing in the wet regime) is associated with even larger reflectivities due to an increase of the dielectric constant compared to dry hail, because of the presence of liquid water (Ryzhkov et al., 2013b; Ryzhkov and Zrnic, 2019). By analysing ZH data, either alone or with temperature profiles, meteorologists have attempted to identify the presence of hail and severe hail (≥2 cm). For example, Waldvogel et al. (1979) developed a criterion that combines echo tops (ETs), i.e. the maximum height at which the reflectivity reaches a certain value, and the height of the melting layer, to compute a probability of hail (POH). This criterion is still used in several European countries as a proxy for hail occurrence (Delobbe and Holleman, 2006; Foote et al., 2005; Trefalt et al., 2023). In an effort to utilise this vertical information in storms, studies have sought to produce proxies that integrate reflectivity over the vertical, such as the vertically integrated liquid (VIL; Greene and Clark, 1972; Pilorz et al., 2022) and the VIL density (VILd; Amburn and Wolf, 1997). Since hail mainly forms within storm updraughts and above the melting layer, relationships between vertically integrated ZH values and temperature profiles have been developed for hail and severe-hail detection (Witt et al., 1998; Trefalt et al., 2023; Murillo and Homeyer, 2019). Among these methods, some are based on the severe hail index (SHI) developed by Witt et al. (1998). The SHI is derived from the weighted integral of reflectivity over the vertical, where values are weighted based on their relative position to the hail growth zone. Several proxies, such as the probability of severe hail (POSH) and the maximum estimated size of hail (MESH), were developed from it (Witt et al., 1998). These aforementioned methods using ZH as a main variable are still widely used operationally in weather services, either for real-time applications (Smith et al., 2016) or for the production of hail climatologies (Australia: Soderholm et al., 2017; Brook et al., 2024; USA: Wang et al., 2018; Switzerland: Nisi et al., 2020). While providing a high probability of detection depending on the validation methodology, these techniques are known to suffer from a relatively high number of false alarms and moderate critical success indices (CSIs between 0.4 and 0.6; Holleman, 2001; Ortega, 2021; Pilorz et al., 2022).
The second group of techniques uses dual-polarisation radar data, also called polarimetric data, which provide valuable information about the shape of targets and the precipitation type (Zrnić et al., 1993; Vivekanandan et al., 1999; Kumjian, 2013a, b; Ryzhkov et al., 2013a; Ryzhkov and Zrnic, 2019). Polarimetric radars allow the computation of new variables: the differential reflectivity (ZDR), the copolar correlation coefficient (also called cross-correlation coefficient (ρHV)), and the specific differential phase (KDP). As polarimetric variable distributions can overlap significantly among different precipitation types (Kumjian, 2013a), a fuzzy-logic scheme appeared well suited to answer the problem of classification of radar echoes (Vivekanandan et al., 1999), where hail could be detected as an independent class. A fuzzy-logic algorithm is based on assigning each precipitation type its own range of values for single-polarisation and dual-polarisation variables. These ranges are determined through simulations or physical interpretations of the radar variables (Park et al., 2009; Ryzhkov et al., 2013b; Kumjian, 2013a). The grade of membership to a particular type being within the radar gate, given the value of a variable, is computed using a membership function, typically trapezoidal. The aggregation of the membership grades of each precipitation type for each radar variable enables the determination of the most dominant precipitation type within the radar gate (Kumjian, 2013a). Based on this principle, a significant number of fuzzy-logic algorithms using dual-polarisation variables were developed (Vivekanandan et al., 1999; Straka et al., 2000; Gourley et al., 2007; Al-Sakka et al., 2013; Ryzhkov et al., 2013b; Ortega et al., 2016; Steinert et al., 2021). For hail, due to the wide distribution of possible axis ratios and hailstone shapes in real conditions (Giammanco et al., 2017; Soderholm and Kumjian, 2023), there is a significant increase in the variability of the scattering properties, particularly at C-band due to resonance scattering at large sizes. This may prevent good discrimination between hail and other precipitation types using a fuzzy-logic approach based solely on membership hypotheses of polarimetric variables (Jiang et al., 2019; Shedd et al., 2021). Furthermore, classes of hail within fuzzy-logic algorithms are difficult to validate given the scarcity of hail reports available both on the ground and aloft (Al-Sakka et al., 2013; Ortega et al., 2016). Despite these limitations, radar-based fuzzy-logic classification remains the best method for discriminating hail from other types of precipitation (Kumjian, 2013b; Ortega, 2013).
The common limitation of the aforementioned single- and dual-polarisation hail detection techniques is the fact that they are computed on a pixel-by-pixel or column-by-column basis. They can be represented as functions mapped to all radar pixels either coming from the volumetric radar data or deduced from the vertical integration of radar variables. These pixel-based methods do not allow the broader view of the radar variables, their spatial structure, and the morphology of the storm to be studied. Additionally, the models are unable to accurately represent potential intricate and non-linear relationships between model variables or radar variables and hail on the ground. To tackle these limitations, techniques capable of (1) harnessing the morphology of spatially coherent features within radar images or (2) studying the intricate relationships between radar or environmental variables and ground truth were developed. In recent years, machine-learning and deep-learning radar hail detection techniques have gained traction. In the work of Wang et al. (2018), they developed a convolutional neural network (CNN; Lecun et al., 1998) applied to three-dimensional reflectivity grids in order to detect hail. Using 70 km × 70 km reflectivity images at different altitudes centred on the cell cores, they showed better discrimination of hail compared to the POSH method, particularly reducing the number of false alarms. In the work of Shi et al. (2020), they tracked convective cells and trained a bagging class-weighted support-vector machine (CWSVM) using single-polarisation cell-based features and environmental information from proximity soundings. By comparing with common reflectivity-based hail proxies, they showed better performances for their fitted model. Finally, in the work of Ackermann et al. (2024), they trained a neural network using the severe hail index (SHI; Witt et al., 1998) and variables from ERA5 (Hersbach et al., 2020) to estimate the magnitude of the damage generated by hail on the ground. Using insurance data as ground truth, they developed a hail damage estimate variable that showed high accuracy on the estimation of damage and its intensity. Other studies have employed deep-learning and machine-learning techniques, applied exclusively to environmental variables derived from numerical weather prediction (NWP) models, for the purpose of analysing or forecasting hailstorm environments (Gagne et al., 2017, 2019; Battaglioli et al., 2023). These prior machine-learning and deep-learning studies have demonstrated the potential of these techniques to partially address the lack of information on hail growth processes. Consequently, the consideration of hail detection as an image-based problem where the morphology of storms can be taken into account seems to be a promising approach to enhance the hail detection capabilities of radar networks.
This study aims to train different CNN models for the detection of severe hail (≥2 cm) on the ground using polarimetric radar data. Although studies have already explored the use of CNNs for hail occurrence detection, to the authors' knowledge, none have attempted to use radar polarimetric variables for severe-hail detection with CNNs. How do CNNs perform on the task of severe-hail detection when applied to polarimetric radar data? Can CNNs outperform existing hail proxies? Can CNNs be used to extract information relevant to the detection of severe hail? To answer these questions, the framework developed herein for the detection of severe hail on the ground comprises the training of CNNs to discriminate between severe-hail cases (≥ 2 cm) and rain or small-hail cases (rain or hail below 2 cm). To this end, a dataset comprising both types of cases is constructed, and a comparison between state-of-the-art hail proxies and the CNN approach is performed on a test dataset. The study is divided into several sections. First, the data gathered for this study and the construction of severe-hail cases and rain or small-hail cases are presented in Sect. 2. Then, the methods explaining the features, the tuning phase to choose the CNN's architecture and its input size, and the metrics are described in Sect. 3. Finally, the results presented in Sect. 4 are divided into three parts: (1) the results of the tuning phase (Sect. 4.1), (2) the feature selection and feature importance studies (Sect. 4.2), and (3) a comparison with state-of-the-art hail detection methods (Sect. 4.3). Finally, the conclusions of this study present a summary of the contributions made to the field of severe-hail detection and suggest potential applications for future research.
2.1 Radar
This study uses data from C-band radars within metropolitan France (Fig. 1). It did not include S-band and X-band radars. Only the cases where the two nearest radars were C-band radars were considered in this study. The volume coverage pattern (VCP) of each radar consists of super-cycles of 15 min in which five to seven elevation angles are scanned, depending on the radar (Table 1). Each 15 min super-cycle contains three 5 min subcycles with the three lowest elevation angles remaining the same and the three upper elevation angles changing every 5 min. The maximum range of the radars is 250 km. The raw volumetric radar data, with a range resolution of 240 m and an azimuthal sampling of 0.5°, are processed through a polarimetric processing chain (Figueras i Ventura et al., 2012). Non-meteorological echoes are removed, partial beam blockage is corrected, and ZH and ZDR are corrected for attenuation (Gourley et al., 2007; Figueras i Ventura et al., 2012; Figureas i Ventura and Tabary, 2013). Volumetric radar data are not corrected for advection between successive elevation angles. Radar data were collected for severe-hail cases (see Sect. 2.3) and for rain or small-hail cases (see Sect. 2.4) to provide the radar images fed to the deep-learning framework. Polarimetric radar variables considered in this study are ZH, ZDR, KDP, and ρHV.
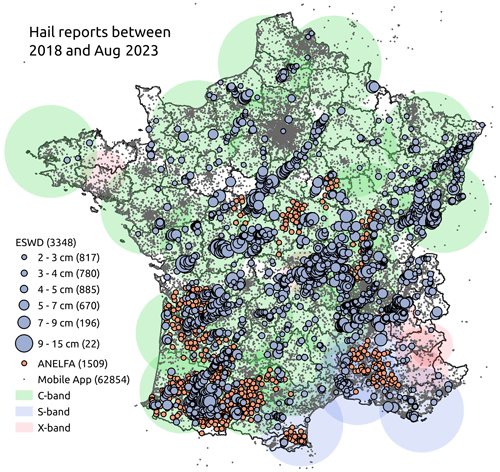
Figure 1Hail reports between 2018 and August 2023 from ESWD (grey-blue), from the hailpad network of ANELFA (orange), and from the mobile application of Météo-France (small grey dots).
In addition to the corrected polarimetric radar variables available in the polar radar geometry, three-dimensional Cartesian grids are generated for the study. The interpolation algorithm implemented within the Python ARM Radar Toolkit (Helmus and Collis, 2016) is used to generate the grids. Derived two-dimensional fields from the three-dimensional grids are then used as input features to the CNN. The algorithm produces the grids with a specified resolution of 250 m × 250 m × 500 m on a domain of 60 km × 60 km × 15 km by interpolating values from the two nearest radars around each case. The value of each grid point is determined by interpolating from the collected radar points within a given radius of influence (ROI). The ROI increases proportionally with distance to the radar, and the ROI value for each grid point in the target Cartesian grid is determined by the nearest radar. In order to identify the nearest radar points within the specified ROI of a given grid point, a K-dimensional tree algorithm is employed. The value of the grid point is calculated by summing the collected values, with each value weighted by an inverse distance weighting function defined by Barnes (1964). The three-dimensional grid is generated for ZH, ZDR, KDP, and ρHV.
To account for the low vertical sampling resolution of the French radars and to avoid discontinuities in the resulting 3D fields, both above the radar and at long range, a minimum radius of influence of 2000 m was defined above each radar. This minimum ROI resulted in a smoothing of the fields. A nearest-neighbour interpolation scheme was also tested (not shown) but produced strong artefacts within the 3D fields such as holes and stripes, preventing its use. As a result, the Barnes interpolation with a minimum ROI of 2000 m was kept.
2.2 Hail reports
This study utilises various sources of hail reports, either as ground truth for severe-hail cases or to assist in constructing the rain or small-hail cases.
The European Severe Weather Database (ESWD; Dotzek et al., 2009), an initiative of the European Severe Storms Laboratory (ESSL), is the primary source of severe-hail reports used in this study. Severe weather phenomena are reported by volunteer observers, weather services, or individuals and are quality-controlled by the ESSL into four levels of quality: QC0, QC0+, QC1, and QC2 (Groenemeijer and Kühne, 2014). To localise and estimate the maximum hail size, images from social media or local newspapers are frequently used. From January 2018 to August 2023, the ESWD collected 3348 reports in France with a maximum hail size information above 2 cm (Fig. 1).
The study also collected 1509 hailpad reports between 2018 and 2022, purchased from the Association Nationale d'Étude et de Lutte contre les Fléaux Atmosphériques (ANELFA; Dessens et al., 2007). Its network of hailpads covers most of the south-west of France (Fig. 1). A hailpad consists of a 30 cm × 50 cm × 7 cm layer of polyester placed on the ground or mounted on a pole. Hail reports are generated from photographs of hailpads after hailstorms and are processed by ANELFA using computer vision techniques to infer hail characteristics. There is only one report per day per hailpad, and each report is accompanied by an estimated time of hailfall by the observer. Numerous quantities are available in the reports, such as maximum diameter or hail size distribution. The main challenge with hailpad data is the small sampling area of the pad, which prevents accurate measurement of maximum hailstone size, as the largest hailstone can easily be missed (Smith and Waldvogel, 1989).
Hail reports were also collected through the crowdsourcing feature of Météo-France's mobile application between 2018 and August 2023. The application allows users to report weather events such as snow, strong winds, and hail, which are then located using GPS technology embedded in mobile phones. Since 2014, users have been able to add information about the size of the hailstones and include a picture. The hail size categories available are (a) lower than 0.5 cm, (b) 0.5 cm to 1.0 cm, (c) 1.0 cm to 2.0 cm, and (d) greater than 2.0 cm. A large quantity of hail is reported between 2018 and August 2023 (137 108 reports). However, the database may contain a significant misrepresentation of hail occurrence due to the lack of systematic quality controls. Observers may report hail despite the absence of reflectivity data indicating precipitation, or there may be potential errors in space and time caused by people reporting hail after it has fallen.
2.3 Severe-hail cases
Severe-hail cases (≥ 2 cm) were created above the ESWD severe-hail reports only. Due to the potential of systematic underestimation of the maximum diameter in hailpad data and considerable uncertainty associated with the crowdsourcing database, these reports were not employed in the creation of severe-hail cases. Nevertheless, they remain a valuable resource for the development of a database of rain or small-hail cases (see Sect. 2.4).
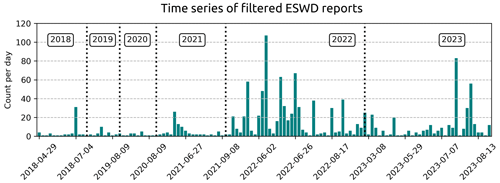
Although the ESWD management team applies quality checks to its reports, errors in the hailfall time or report localisation may still occur. To reduce their impact, the hailfall time was adjusted by examining the reflectivities from the nearest radar within a time range of ± 30 min. If needed, the report time was shifted to the time when a storm cell passed over the report. If multiple cells were observed over the report within the time range, the time of the closest cell to the reported time was retained. If no cell was clearly visible at different elevation angles within that time frame, the report was discarded. A significant proportion of reports produced by the same storm at the same time remain in the database. It artificially increases the number of independent storm cells that produced severe hail. To avoid duplicating severe-hail cases centred on ESWD reports that are really close to each other, a density-based clustering algorithm (DBSCAN; Ester et al., 1996) is applied to find reports within 10 km of each other every 5 min. The report that is the closest to the barycentre of collected reports is kept. The total number of severe-hail reports used for training decreased from 3348 to 1169. Figure 2 shows their distribution over time. The 1169 severe-hail reports from the ESWD are considered the only trustable source of severe-hail reports for the remainder of the study. Radar data will be gathered above them to constitute the severe-hail cases of the study.
2.4 Rain or small-hail cases
Rain or small-hail cases are created as situations that produced either rain or small hail below 2 cm. In order for the CNN to accurately distinguish between radar images that result in severe hail and those that do not, it is crucial that the training set includes instances where severe hail did not occur on the ground. Rain or small-hail cases are built to include storms that may be conducive to hail formation but did not produce severe hail at the ground. The identification of such storms is necessary for the validation of severe-hail detection algorithms. They are considered edge cases and often produce many false alarms with current hail detection methods, making it difficult for forecasters to distinguish between severe-hail storms and rain or small-hail storms.
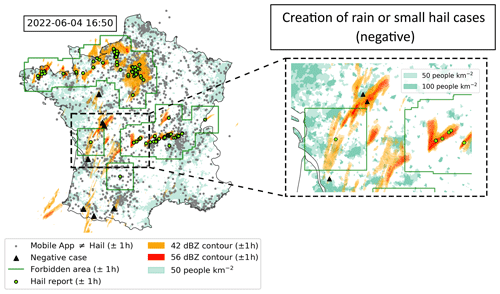
Figure 3Construction of the rain or small-hail cases on the 4 June 2022 at 16:50 (UTC) during a convective outbreak where hail was reported. Green dots represent hail reports (ESWD + mobile application + ANELFA) within a time interval of ±1 h. Green squares are “forbidden” areas around hail reports (120 km × 120 km) where rain or small-hail cases cannot be created at 16:50 (UTC). The orange and red colours represent the 42 and 56 dBZ cell cumulative contours within a time interval of ± 1 h. Grey dots represent the reports from the application that are not hail reports within a time interval of ± 1 h. Light and dark turquoise show populated areas with more than 50 and 100 people per square kilometre, respectively. Black triangles represent negative (rain or small-hail) cases created at the mentioned timestamp. They represent the intersection of reflectivity contours and areas of more than 100 people per square kilometre outside forbidden areas. Some of them are discarded based on further filtering explained in Sect. 2.4.
The creation of rain or small-hail cases is divided into four distinct phases. The first phase involves the presentation of the cell identification algorithm. The second phase entails the implementation of a consistency check to filter the collaborative reports using the cell identification algorithm. The third phase encompasses the successive steps to identify the time and locations of the rain or small-hail cases. The final phase comprises a filter to exclude mild-precipitation cases from the dataset.
First, the cell identification algorithm is derived from the methodology proposed by Morel and Sénési (2002) and subsequently applied to the national reflectivity composite product, whereby the lowest available and valid reflectivity measurement from all the radars is selected (Caumont et al., 2021). The product is available every 5 min at a 1 km horizontal resolution. The cell identification algorithm defines cells as a contiguous set of pixels above a certain reflectivity threshold. Cell objects with four different thresholds are defined: 36, 42, 48, and 56 dBZ. Cell splits and merges are managed by comparing cell overlaps between consecutive images, taking into account cell motion (Morel and Sénési, 2002).
Secondly, the cell identification algorithm facilitates the filtration of crowdsourced hail reports from the Météo-France application. To correct for possible biases of reporting, a consistency check was carried out on the crowdsourced hail reports. Cell objects of 42 dBZ from the cell identification algorithm were collected within a time period of −120 to +30 min around each report. If the distance between the report and the nearest 42 dBZ cell within that period was more than 15 km, the report was discarded. The 42 dBZ reflectivity threshold was chosen because small and melting hail above 5 mm is hardly reported at reflectivity values lower than 45 dBZ (Ryzhkov and Zrnic, 2019). The selected time interval is needed to consider potential delays between the reported time and the actual hailfall time. A delay of 2 h prior to the reported time was deemed adequate to account for this. Finally, a distance of 15 km between a report and the nearest 42 dBZ contour was chosen to represent the median commuting distance travelled by the rural French population each day (INSEE, 2023). Using that consistency check, the quantity of reports decreased from 137 108 to 62 854, still covering 45 % of the days within the study. Furthermore, only 28 % of the remaining 62 854 reports contain hail size information, and about 1.1 % is severe hail (≥ 2 cm). Because of the database's size, manual filtering was not possible within the scope of this work. Therefore, the final quality of the collaborative reports remains uncertain. As a result, it is only used to assist the construction of the rain or small-hail database.
Thirdly, once crowdsourced reports were filtered, rain and small-hail cases were searched every 20 min during hail seasons (March–September) between 2018 and August 2023. A number of measures were implemented to prevent the inclusion of irrelevant cases where hail was deemed unlikely and to ensure the integrity of the rain or small-hail database, which shall not include severe-hail cases. An initial filtering was applied every 20 min using cell objects, where the following locations were kept:
-
locations below cell objects that had a maximum ZH above 45 dBZ;
-
locations at the intersection between cell objects and a highly populated area of at least 100 people per square kilometre, as in Kopp et al. (2024);
-
locations within working hours (07:00–22:00 UTC);
-
locations outside “forbidden” areas, defined as squares of 120 km × 120 km around all available hail reports within a time interval of ± 1 h. (The hail reports considered here are a combination of raw severe-hail reports from the ESWD (3348), hailpad measurements from ANELFA (1509), and filtered collaborative reports from the Météo-France mobile application (62 854)).
An example of the rain or small-hail reports produced by such filters applied to a convective outbreak on 4 June 2022 at 16:50 (UTC) is shown in Fig. 3. Using a filter that combines all available hail reports to exclude “forbidden” areas where rain or small-hail cases cannot be created was considered the best option, given the significant uncertainty in the size and hailfall time in the hailpad measurements and in the overall robustness of the collaborative reports. However, a risk remains that avoiding such forbidden areas around hail reports may result in the withdrawal of several small-hail cases (< 2 cm). The filtering assumed that all missed severe hail by ESWD was correctly observed in highly populated areas within working hours by other databases, even with a wrongly observed hail size, as it attracts more attention from both the media and the public (Punge and Kunz, 2016). This hypothesis is contingent upon the presence of a sufficient number of individuals capable of recording hail. It can be demonstrated that a non-negligible number of non-hail observations are produced by the mobile application within the French territory every 2 h (Fig. 3), reducing the risk of missing severe hail. These steps serve to ensure that rain or small-hail cases are not contaminated by severe hail, which is of the utmost importance for the relevance of the method and the interpretation of its results.
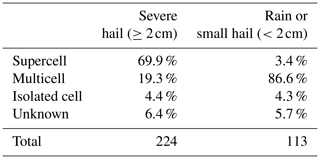
Finally, in order to reduce the number of cases that produced moderate ZH values, an additional filter was applied. Since mild precipitation events are climatologically predominant compared to severe and extreme precipitation events, they can populate most of the rain or small-hail cases, even if a minimum threshold of 45 dBZ was set. In order to prevent the CNN from learning with a disproportionate number of mild cases, a filter was applied to cases that had cell objects with a maximum ZH below 56 dBZ. These cases were divided into two categories: those produced by cells with a maximum ZH (1) between 45 and 48 dBZ and (2) between 48 and 56 dBZ. The cases with the largest cell area per bin of 0.2 dBZ for each category were then retained. This was done to ensure that rain or small-hail cases were produced by large enough storms where hail is plausible, as severe hail is mainly produced in supercell and multicell convective systems (see Appendix B). In the event that cases were situated at a distance of less than 15 km from one another, only the case produced by the cell exhibiting the highest reflectivity was included. In the event that they originated from the same cell, one was selected at random. This methodology ensured that rain or small-hail cases were extracted from independent stages of a storm's life cycle.
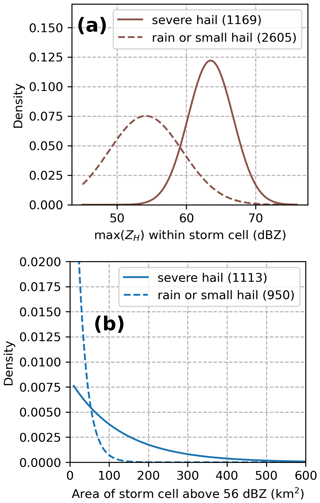
After these different steps of filtering, the rain or small-hail database contained 2605 cases during hail seasons between 2018 and August 2023. Cell objects formed by the cell identification algorithm were also gathered for the severe-hail cases. The fitted probability density functions (PDFs) of max(ZH) within the cell and the cell area above 56 dBZ are compared in Fig. 4. Despite the efforts to gather intense storms in the rain or small-hail dataset, Fig. 4 shows only a partial overlap between the distributions on both datasets, indicating that the biggest cases in terms of maximum reflectivity and cell area were mostly produced by severe hail storms. This behaviour may be a consequence of the storm modes embedded in each dataset, where severe hail is nearly systematically produced by large, intense, and highly organised systems such as supercells (see Appendix B).
It is crucial to acknowledge that it was not feasible to ensure that small hail was included in the rain or small-hail dataset. Indeed, small hail is less likely to be reported by observers, and a significant degree of uncertainty contaminates the existing databases that have the capacity to report it (Météo-France crowdsourcing application, ANELFA hailpads). Consequently, it is assumed that by selecting the strongest storm cases outside areas where hail was reported, using the aforementioned filters, it was possible to include potential instances of small hail. In the most unfavourable scenario, the rain or small-hail database is populated with instances of rain or heavy rain only, which still contributes to the generation of false alarms in existing severe-hail detection algorithms.
2.5 Reference hail proxies
This section presents the existing radar-based hail proxies that are compared with the CNN approach. They are separated into three different kinds.
The first hail proxy being compared is the output of an updated version of the fuzzy-logic hydrometeor classification algorithm from Al-Sakka et al. (2013), which is available at S-, C-, and X-bands. The original version of the algorithm discriminates between six different hydrometeor classes using dual-polarisation radar variables and temperature: biological scatters or ground clutter (BS-GC), rain (RA), wet snow (WS), dry snow (DS), icy particles (IC), and hail (HA). A revised version enables the classification of hail into three distinct categories: small hail (SH; < 0.5 cm), medium hail (MH; 0.5 to 2 cm), and large hail (LH; > 2 cm). Details on the updated version can be found in Appendix C. It is called A13 hereafter.
The second family of hail proxies uses the severe hail index (SHI) developed by Witt et al. (1998) to produce two proxies capable of detecting hail: the probability of severe hail (POSH; Witt et al., 1998) and the maximum estimated size of hail (MESH; Witt et al., 1998; Murillo and Homeyer, 2019). The SHI is calculated by the weighted sum of 3D reflectivities over the vertical, based on the position of radar gates to the hail growth zone (0 and −20°C; Witt et al., 1998) as follows:
with
where SHI is in J m−1 s−1, H is the altitude, Ht is the altitude of the top of the storm, H0 and H−20 are the altitudes of the 0°C isotherm and −20°C isotherm, respectively, ZL=40 dBZ and ZU=50 dBZ, and is the hail kinetic energy. The POSH and MESH relationships, derived from the SHI, are defined as follows:
with WT being a warning threshold calibrated for POSH to produce the best critical success index (CSI) for the US S-band radars (Witt et al., 1998), MESH coming from Witt et al. (1998), and MESH75 and MESH95 coming from Murillo and Homeyer (2019). The variables are calculated based on the three-dimensional reflectivity grid, and the 0 and −20°C altitudes are extracted from the nearest forecast hour within the AROME model (Brousseau et al., 2016). The AROME model provides hourly forecasts with a horizontal resolution of 0.01°. The isotherms are regridded to the 250 km × 250 km horizontal resolution of the three-dimensional grid and interpolated in time to the time of the severe-hail and rain or small-hail cases.
The third family of hail proxies compared in this study are based on echo tops, i.e. the maximum altitude at which a reflectivity threshold is reached. The probabilities of hail (POHs) from Delobbe and Holleman (2006) and Foote et al. (2005) are compared in this study and are constructed as follows:
where ΔH is the difference between the echo top at 45 dBZ (ET45) and H0 in kilometres. Echo tops are computed using the three-dimensional reflectivity grid (see Sect. 2.1).
Finally, the maximum reflectivity over the vertical (see Sect. 3.1) is added as a comparison baseline to all the methods compared in this study.
Delobbe and Holleman (2006)Foote et al. (2005)Witt et al. (1998)Witt et al. (1998)Murillo and Homeyer (2019)Murillo and Homeyer (2019)Al-Sakka et al. (2013)This section outlines the experimental design used to evaluate the performance of the CNNs. To align with machine-learning terminology, the term “radar variable” has been replaced with “feature”. A feature represents a 2D radar-derived variable that is fed to the CNN.
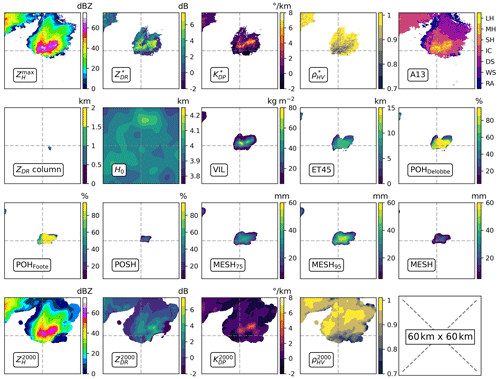
Figure 5Input features defined in Table 2 for a case producing severe hail on the ground. Image size is 60 km × 60 km, and the severe-hail report is located at the centre of the image.
3.1 Input features
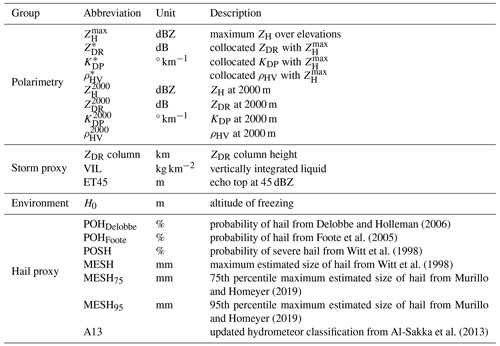
For each severe-hail case and rain or small-hail case, two different sets of inputs are generated: (1) 2D features obtained from the 3D grid and (2) 2D features extracted directly from the volumetric radar data. Both groups are fed into the CNN. The input features are summarised in Table 2. They are produced using the nearest radar time step from the time mentioned in each case.
The 3D grids are used to generate a number of storm and hail proxies, which are known for their ability to help in the detection of hail. First, the ZDR column is calculated from the 3D grid to account for potential hail formation processes above the freezing level, as it indicates regions with high concentrations of supercooled water and graupel, which are essential for hail growth (Kumjian, 2013b; Kuster et al., 2019). The ZDR column height was calculated using the 3D Cartesian polarimetric grid, with candidate pixels that met the following criteria: ZH≥25 dBZ and ZDR≥2 dB. The height of a column of adjacent candidate pixels is computed as the ZDR column height. A criterion was applied to ensure the continuity of the column above and below H0 in the event that 500 m portions of the column were missing in the middle of two candidate pixels over the vertical. Other 2D input features derived from 3D grids include vertically integrated liquid (VIL; Greene and Clark, 1972), ET45, and H0. Furthermore, polarimetric features at an altitude of 2 km are incorporated to account for hail-related signatures at low altitudes below the altitude of freezing. The 2 km height was selected as a compromise to achieve optimal 3D radar coverage while remaining below the freezing level in the majority of cases. It is notable that low ZDR values may be indicative of dry spherical hail. High ZDR and KDP may suggest the presence of either rain or a mixture of rain and melting hail (Ryzhkov and Zrnic, 2019). The features at 2 km include , , , and . Finally, a series of hail proxies were subjected to testing as input features, with the objective of determining the extent to which they might provide additional information within the framework of a CNN: MESH, MESH75, MESH95, POSH, POHFoote, and POHDelobbe.
The utilisation of 3D interpolation may result in the loss of information present in the original volumetric fields, as it reduces the small-scale variations and the original resolution of the fields (Fig. 5). In order to more accurately represent the native resolution of volumetric radar data, 2D features derived from volumetric radar data are incorporated in addition to those derived from the 3D grid. Nearest-neighbour interpolation is employed on the volumetric data at every elevation angle in order to match the horizontal resolution of the 3D grid (250 km × 250 km). This interpolation is different from the 3D interpolation scheme in Sect. 2.1. It is performed separately for each case and for the two nearest radars independently. In order to account for the low vertical sampling of French radars and the frequent partial beam blockage at low elevations, 2D features are created from the interpolated elevations. The initial feature to be considered is the maximum ZH value over the vertical (). The other ones are called “collocated” polarimetric features, named , , and . They are selected where is reached over the elevations. As hail is always detected in areas of high ZH (Kumjian, 2013a; Ryzhkov and Zrnic, 2019), it appears appropriate to examine the polarimetric signatures where reflectivity is the highest. One disadvantage of this approach is that the resulting collocated features (2D images) may contain pixels located at different altitudes, which makes it challenging to interpret their values. To eliminate collocated polarimetric features produced at very high altitudes and low values, only collocated values where was above 30 dBZ were retained. A sample of all input features for a case that resulted in severe hail on the ground is shown in Fig. 5.
For each case, either severe hail or rain or small hail, two samples were created, each containing 2D features. One sample was created for the nearest radar, and the other was created for the second-nearest radar. Both samples share identical 2D features that originate from the 3D grid. However, they differ in their and collocated features, as they were produced independently for each radar. This process helped to augment the dataset, which is considered crucial, particularly given the scarcity of severe-hail reports.
A total of 7523 radar samples were produced. Among them, 2335 were created from the 1169 severe-hail cases, and 5188 were created from the rain or small-hail cases. A total of 3 severe-hail samples and 22 rain or small-hail samples were removed from the dataset due to issues with interpolation, primarily arising from the second-nearest radar. Figure 6 illustrates the distributions of maximum values within samples for a selection of features. It should be noted that the distribution of the maximum reflectivity values within the images may differ from the distributions obtained with the cell identification algorithm (Fig. 4), as the reflectivity values do not originate from the same methodology. In the context of this study, distributions of the maximum of input features, including VIL, ET45, MESH proxies, and POSH, exhibit a certain separation between cases of severe hail and those of rain or small hail (Fig. 6). This may provide insight into the discriminative power of these features for severe-hail detection.
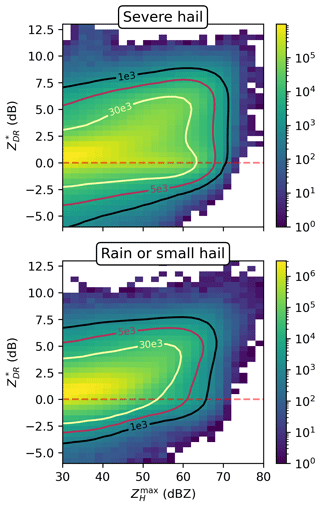
To analyse the polarimetric variables, the bivariate distributions of and are presented in Fig. 7. The distribution of values for severe-hail cases exhibits a high density of values with above 50 dBZ and 0 dBZ, in accordance with the expected behaviour of spherical hailstones (Kumjian, 2013a). For rain and small-hail cases, increases with , as the database may be populated by storms producing either rain or small melting hail that has higher ZDR values compared to larger hail due to a higher dielectric constant for water (Kumjian, 2013a; Ryzhkov and Zrnic, 2019).
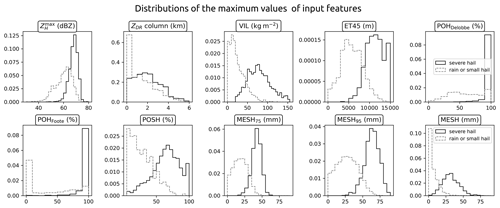
Figure 6Distributions of the maximum value over 60 km × 60 km images for most of the input features in the severe-hail dataset and the rain or small-hail dataset.
3.2 Tuning architecture and input size
Two distinct types of CNN architecture are evaluated to identify the optimal architecture and input size. The first type of architecture is a feed-forward CNN, which draws inspiration from the AlexNet architecture (Krizhevsky et al., 2017). Two models were created from it: SmallConvNet and ConvNet. The former comprises only one convolutional layer, while the latter is a deeper architecture with three convolutional layers (Fig. 8). The second kind of architecture tested in this study is residual network architecture (ResNet; He et al., 2015). The 18-layer variant of ResNet is used and includes 18 layers of convolutions with skipped connections that increase the accuracy of the network (He et al., 2015). Four input sizes are tested with the different models using a centred crop around the case location: 5 km × 5 km, 15 km × 15 km, 30 km × 30 km, and 50 km × 50 km. Every combination of model and input size is trained, and the combination that yields the best performance is selected for the remainder of the study. The training for the tuning phase is performed using all the variables listed in Table 2 as input features to the CNNs.
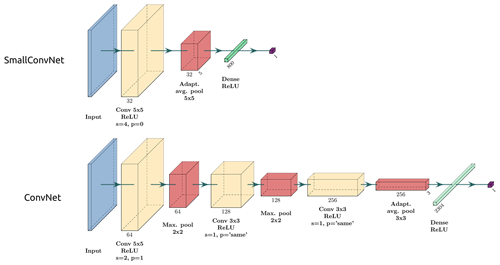
Figure 8Two types of feed-forward CNN architecture tested in this study: SmallConvNet and ConvNet. Convolutional layers are denoted as “Conv” (yellow boxes); pooling layers are denoted as “Max. pool” and “Adapt. avg. pool” for max pooling and adaptive average pooling, respectively (red boxes); fully connected layers of perceptrons are denoted as “Dense” (green boxes), with “p” for padding and “s” for stride. The number of filters per layer is shown below boxes. The kernel size is shown by multiplicative terms. All activation functions are ReLU. A batch normalisation layer is added after each convolutional layer for regularisation (hidden). The output of the network is a real number, which is subsequently passed to a sigmoid function to produce a probability of severe hail on the ground within the image, denoted as .
The choice of hyperparameters can influence the learning phase and the final performance of a fitted model. However, in order to focus solely on the choice of the model and the impact of input size on the performance, the models are trained with fixed hyperparameters. Stochastic gradient descent (SGD) is used with a learning rate of , a weight decay of , and a momentum of m=0.9. The loss function is the binary cross entropy (BCE), the training mini-batch size is bs=64, and the maximum number of epochs is nepochs=300. Additional regularisation is achieved through the incorporation of batch normalisation layers within the models. The selection of hyperparameters is highly empirical and dependent on the specific problem being solved, as well as the quality and quantity of data used for training. The aforementioned hyperparameters are selected in order to ensure that the model's loss decreases monotonically during training towards convergence.
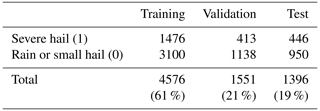
During the tuning phase, all possible combinations of models and input sizes are trained under identical conditions. The whole dataset containing severe-hail and rain or small-hail samples (7523) is separated between a training dataset, a validation dataset, and a test dataset. The different splits are presented in Table 3. The training and validation datasets are employed during the tuning phase, while the test dataset is reserved for subsequent performance analysis. To ensure independence between the datasets, samples are grouped by date. This guarantees that each date is only present in one dataset. Furthermore, an additional precaution is taken to ensure that the proportion of severe-hail and rain or small-hail cases remains the same in all three datasets. In order to address the imbalance of the dataset during training, the minority class (i.e. severe hail) is oversampled using weighted random sampling. This process artificially increases the number of severe-hail cases seen by the CNN at each training iteration. Finally, early stopping enables the model to halt training when the validation loss fails to decrease after 20 consecutive epochs.
Table 3Number of samples in the training, validation, and test datasets for the tuning phase in Sect. 3.2.
3.3 Scores
The performance of the models is evaluated using a scoring methodology. For the CNNs, the output provides one probability of severe hail at the ground, denoted as P, for each image. The image is predicted as producing severe hail () or rain or small hail () on the ground given a discrimination threshold α:
with .
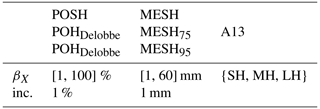
The reference hail proxies (see Sect. 2.5) produce either a gridded probability or a gridded hail size as output (Fig. 5). In order to facilitate comparison with the output of CNNs, it is necessary to reduce the proxies to a single value per image. Two thresholds can be used simultaneously to determine whether the image is associated with severe hail on the ground: a threshold for feature values X, designated βX, and a discrimination threshold for the area AX covered by the resulting field, designated . If the area of pixels above βX exceeds , the hail proxy predicts severe hail on the ground within the image as follows:
For example, if βX=50 % and for POSH, the prediction for the image will be severe hail if the area of POSH above 50 % in the image exceeds 10 km2. This evaluation method allows for the study of the trade-off between a threshold on the hail proxies and the area they cover, with the objective of detecting severe hail. The various feature threshold values βX tested in this study for the hail proxies are presented in Table 5. For A13, three different feature threshold values are employed. These are (i) pixels with a class above or equal to the small-hail class (), (ii) pixels with a class above or equal to the medium-hail class (), and (iii) pixels with a class above or equal to the large-hail class (). This approach enables the determination of the performance for different hail class as thresholds.
The performance metrics for the predictions are defined through the use of a contingency table (Table 4). The following metrics are employed in order to compute the performance of a model: the probability of detection (POD), also known as the recall; the probability of false detection (POFD), also known as the false alarm rate; the Peirce skill score (PSS); the critical success index (CSI); the Heidke skill score (HSS); and the precision, also known as the success ratio. They are defined as follows:
The precision captures how often it turns out to be correct when a model makes a positive prediction (Kelleher et al., 2020). The PSS shows the trade-off between POD and POFD. The global performance of models is evaluated by calculating the receiver operating characteristic (ROC) curves and the precision–recall curves, which illustrate the trade-off between metrics at different discrimination thresholds. Each variant of the hail proxies with a given βX value is considered a classifier. The performance of a classifier is evaluated by calculating the metrics for each possible discrimination area (). For the CNN, each point on the curves shows the local performance for a given discrimination threshold α. For hail proxies, each point on the curves shows the local performance for a given βX and a given . The areas under the curve for the ROC curve (AUC-ROC) and the precision–recall curve (AUC-Pr.Re.) are computed and used as representative metrics of the global performance of a model. If all the predictions are wrong, the AUC is 0.0; if they are right, the AUC is 1.0. In the context of a balanced dataset, an AUC of 0.5 indicates that the model's performance is equivalent to that of a random function.
Table 5Interval of feature threshold values (βX) tested to assess the performance of hail proxies. For example, if βX=25 mm for MESH, the performance of a model where MESH ≥25 mm is assessed for different areas covered by the resulting field. Increments tested along the βX intervals are denoted as inc.
4.1 Tuning phase
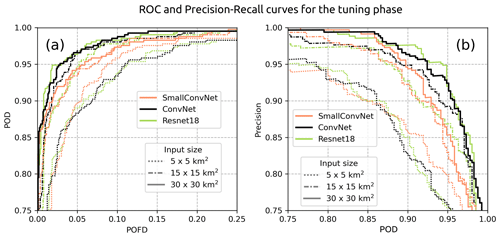
The results of the tuning phase are summarised by the learning curves of the different models (Fig. 9) and the ROC and precision–recall curves, which assess the performance on the validation split (Fig. 10). Models trained with an input size of 50 km × 50 km were tested but not included in the results, as they did not demonstrate any improvement in performance.
The evolution of the training loss in Fig. 9 shows a global monotonic decrease for each model and input size, implying that some information within the features is learned by the models. However, this information may be irrelevant for severe-hail detection if the fitted models do not generalise well to unseen examples. Different behaviours are seen for certain input sizes and model architecture. Simple models such as the SmallConvNet lag behind in terms of minimum loss achieved on both the training and validation sets. SmallConvNet struggles to learn as much as the other models and reacts on average more incorrectly when presented with the validation set, especially for small input sizes (Fig. 10). This may be a classic case of underfitting, where a model is too simple to learn highly abstract features in the data. In addition to underfitting, small input sizes appear to be detrimental to the performance of CNNs, regardless of the model used. Although this was expected, it shows that the models trained with 5 km × 5 km input features are likely to miss important information in the vicinity of the storm cores that can be attributed to larger-scale phenomena within the storms (hook echo, updraught region, downdraught region). The decline in performance with decreasing input size is evident in Fig. 10.
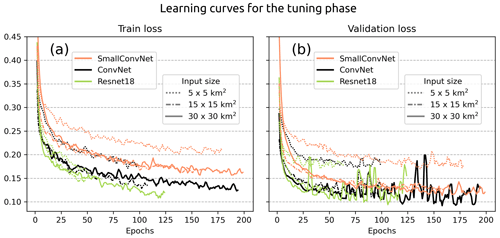
Figure 9Learning curves with the evolution of the train loss (a) and the validation loss (b) for the models trained during the tuning phase. The retained model is highlighted by the solid black line. The curves are smoothed with a sliding window of three epochs.
Two models, ConvNet and ResNet18, appear to achieve equivalent performance on the validation set, despite ResNet18 containing a significantly greater number of parameters (Fig. 9). The models in question are deeper than SmallConvNet, which increases their likelihood of identifying information at varying levels of abstraction within the data, thereby enhancing their performance. The fact that ResNet18 achieves performance levels comparable to those of ConvNet on the validation set, despite being more complex, suggests that the size of the validation dataset may be insufficient for it to enhance its prediction.
Although a monotonic decrease is observed for the training loss across epochs, oscillations in the validation loss are evident for ConvNet and ResNet18 after the 50th epoch (Fig. 9). This behaviour is observed when a minor adjustment to the weights and biases during training results in a significant change to the value of the validation loss. This phenomenon is likely attributable to the relatively limited size of the validation dataset, which may prompt abrupt changes in model behaviour when parameters are updated. A direct consequence is that the models are learning additional information that may be derived from noise within the input features rather than severe hail. Although the complexity of the ConvNet and ResNet18 networks may appear to be their strength, in certain situations this may outweigh the benefits, as they are more likely to learn useless information due to their multiple layers and connections, thus overfitting. The observation that simpler models, such as SmallConvNet, do not exhibit the same degree of oscillation in the validation loss suggests that the issue may lie in the complexity of the model (Fig. 9). Nevertheless, there are methods to mitigate the adverse effects of overfitting on small datasets. One such method is cross-validation, which entails training an ensemble of models on distinct training and validation sets and subsequently averaging the predictions of all models to obtain the final output on the test set (Kelleher et al., 2020).
Consequently, SmallConvNet exhibited suboptimal performance relative to deeper models, and complexity can impede generalisation when utilising limited datasets. Therefore, ConvNet with an input size of 30 km × 30 km is deemed an optimal compromise for the remainder of the study. Cross-validation will be employed to mitigate the risk of overfitting.
4.2 Feature selection and feature importance
Prior to comparing the selected CNNs with hail proxies, it is necessary to explore the features. This involves the removal of highly correlated features in order to limit them to a subset of the most useful ones and the determination of the importance of each feature in the final prediction of the CNNs.
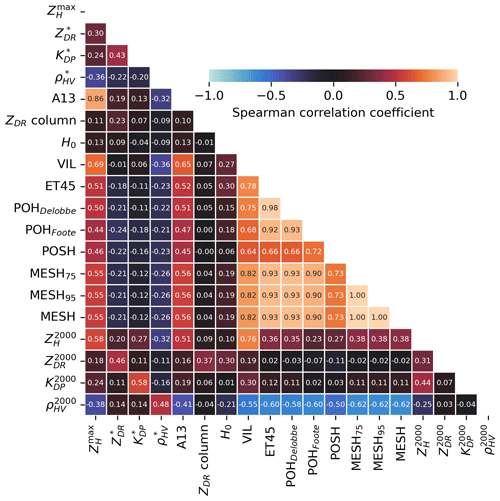
Figure 11Spearman correlation matrix for the 19 input features computed on a subset of 1 million pixels from the entire dataset. Warm colours correspond to positive Spearman correlation coefficients and cold colours to negative ones.
Feature selection is performed by exploring the correlations between the 19 input features listed in Table 2. A random sample of 1 million pixels from the entire dataset was employed to compute the Spearman correlation coefficient between each variable. The resulting coefficient matrix is presented in Fig. 11.
It is anticipated that high positive correlations will be observed between features that are based on the same underlying variable. MESH, MESH75, and MESH95 demonstrate perfect Spearman correlations (1.00) due to their underlying monotonic relationship with the SHI (see Eq. 5). The same rationale can be applied to the high positive correlations observed between ET45, POHDelobbe, and POHFoote, although the correlation seems higher between ET45 and POHDelobbe (0.98) due to the latter's direct linear relationship with ET45 (Eq. 9). A strong positive correlation is observed between MESH variants and ET45 (≈0.93), despite the fact that they were not produced using the same methodology. The relationship between the echo tops and the integral of weighted reflectivities used in MESH may provide an explanation for this behaviour. Higher echo tops indicate a greater volume of ZH≥45 dBZ above the −20°C altitude, which carries the most weight in the construction of the SHI (Witt et al., 1998). Moderate positive correlations are observed between , VIL, and all the hail proxies presented in Table 5, which is consistent with expectations, given their dependence on ZH. The correlation between hail proxies and ρHV at an altitude of 2 km is moderately negative (). This correlation is likely influenced by the effect of hail or a mixture of rain and hail on the reduction of ρHV values at low levels (Kumjian, 2013a; Ryzhkov and Zrnic, 2019).
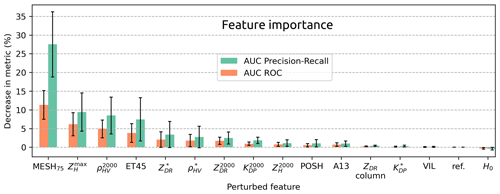
Once the correlations between variables have been established, a feature importance study can be conducted. The withdrawn variables are the following: MESH, MESH95, POHDelobbe, and POHFoote. In order to prevent overfitting and to account for any potential variability in the results, the feature importance is computed by cross-validation of the performance of 10 ConvNet models trained on a 30 km × 30 km input size. A total of 10 distinct combinations of training and validation sets are generated through the application of bootstrapping to the train and validation sets employed during the tuning phase (Table 3). In order to ensure the independence of the sets, the same precautions as in the tuning phase are taken. Following training, the performance of the 10 fitted models is assessed on the test dataset. One variant with unperturbed input is trained for each of the 10 combinations and serves as a baseline. Feature importance is then computed for each model by sequentially perturbing features using random permutations within mini-batches. If a particular feature is important to the model, its random permutation should result in decreased performance compared to the baseline model. The greater the decrease in performance, the more important the feature is for the model to detect severe hail. The performance decrease is calculated by measuring the reduction in AUC for both the ROC curve and the precision–recall curve. Figure 12 illustrates the average and the uncertainty of feature importance for each input feature.
A low feature importance does not necessarily indicate that the feature is useless for severe-hail detection. On the one hand, it may indicate that the feature plays a less important role in the output of the CNN. On the other hand, it could suggest that the majority of the information that the CNN requires to make its decision is already embedded in other features. The feature importance study only demonstrates the importance of a feature within the context of a CNN developed for severe-hail detection.
The performance decline resulting from the perturbation of MESH75 is the most pronounced among all variables. MESH was specifically developed for the detection of severe hail at S-band. Consequently, despite the potential of higher reflectivity values at S-band than at C-band (Ryzhkov and Zrnic, 2019), it is anticipated that MESH facilitates the identification of areas with severe hail. Due to its capacity to account for the vertical reflectivity profile within the hail growth zone, MESH may be less sensitive to the effects of low vertical sampling than echo tops and may be better at summarising information at mid-levels and upper levels that are useful to quantify the severity of hail on the ground.
Three additional features appear to be important for the CNN: , , and ET45. This is not unexpected given that ZH is sensitive to the particle size distribution and that high ZH values above 70 dBZ are typically associated with large and giant hail (≥ 5 cm; Ryzhkov and Zrnic, 2019). The importance of may be attributed to the better representation of small-scale variations of the field in comparison to 2D features extracted from the 3D grid. This may also explain the enhanced importance of relative to VIL, despite the latter having stronger correlation coefficients with hail proxies (Fig. 11). As a feature that may be negatively correlated to the presence of hail in the low levels, is of significant importance for the CNN to make its prediction. This negative correlation of with various hail proxies indicates a decrease in ρHV in the presence of hail that is expected, particularly in the presence of melting hail or hail growing in the wet regime (Ryzhkov and Zrnic, 2019). Finally, it can be seen that ET45 is of some importance. Although affected by vertical sampling (Delobbe and Holleman, 2006), echo tops can contain useful information about storm height and remain relevant as a storm proxy, as more intense storms are expected to produce stronger echoes at high altitudes (Trefalt et al., 2023).
The average importance of the remaining features is situated within their respective uncertainty intervals. For instance, ZDR columns appear to be relatively inconsequential in the context of this study. However, this feature is not adequately represented by examining data at the time of the hailfall, as ZDR columns are expected to be visible prior to hailstones falling on the ground (Kuster et al., 2019). It may prove advantageous to use ZDR columns in the context of storm cell tracking and the study of the life cycle of storms, as it has been observed to be effective in the short-term forecast of severe weather (Kuster et al., 2019). The relatively low importance of polarimetric collocated variables (, , ) may be explained by two factors. Firstly, as collocated polarimetric variables may originate from different heights, they may insufficiently characterise the presence of hail, and important information may be lost. Secondly, this may simply reflect the fact that the value of these variables contributes little to the prediction compared to other, more significant variables such as MESH75 and .
Following the completion of a feature importance study, it is standard practice to train a model again using the most important features in order to validate its performance on unseen data. However, due to the unavailability of more severe-hail reports within the French territory, it was not possible to retrain the models. Consequently, the feature importance study was limited solely to interpretation purposes.
4.3 Comparison with state of the art
The performance of the 10 ConvNet fitted models is compared to the hail proxies on the test set. The results are summarised in Fig. 13 as ROC and precision–recall curves. Table 6 summarises the global metrics with the feature threshold values and threshold areas leading to the best performance.
Overall, high AUC values are observed for all the hail proxies except A13 and POSH (Table 6). This demonstrates their capacity to optimise their performance if the threshold value above which they produce severe hail (βX) is meticulously selected. It is in accordance with several studies that have emphasised the significance of calibration in order to optimise the performance of existing hail proxies (Murillo and Homeyer, 2019; Ortega, 2021; Brook et al., 2024; Kopp et al., 2024). The validation framework developed in this study permits the further investigation of the performance of hail proxies by incorporating an additional discrimination threshold on the area covered by the feature ().
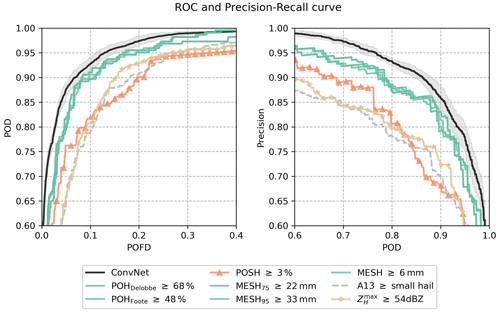
Figure 13ROC curves and precision recall curves for models applied to the test set. The average curve obtained from the 10 fitted ConvNet models is shown as a solid black line along with the uncertainty interval (±σ, shaded area). Coloured curves show the hail proxies with the βX value that produced the highest AUC-ROC. The dashed grey line corresponds to the best variant of A13 with severe hail detected when the hail size is equal to or above the small-hail class (SH). Each point in the solid black line corresponds to a discrimination threshold . Each point within the coloured curves and the dashed grey line corresponds to a discrimination area in km2.
Table 6Performance on the test set. Methods are compared using their five best variants producing the highest area under the ROC curve (AUC-ROC). The precision–recall AUC (AUC-Pr.Re.), the CSI, the HSS, the best average threshold value (βX), and the best discrimination area () are shown. Values are shown as “mean (±SD)”. AUC values are multiplied by 100 for readability. Results for all the variants of A13 are shown directly instead of their average. They correspond to the performance of the A13 hail size output above or equal to (1) small hail (A13small), (2) medium hail (A13medium), and (3) large hail (A13large). The * symbol denotes the average performance of the five best variants (i.e. best βX) of each algorithm.

Table 7Confusion matrix for three different methods on the test set: POHDelobbe, MESH95, and ConvNet. Each confusion matrix cell in (b) contains performance of different models that are specified in (a). The different variants proposed are explained in Sect. 4.3.

The best performance for severe-hail detection overall is reached by the ConvNet model, with an average AUC-ROC of 0.979 and an average AUC-Pr.Re of 0.961 (Table 6). It also reaches the best performance in CSI and HSS, with 0.803 and 0.837, respectively. The low variance around mean values demonstrates a consistent behaviour among the models trained using cross-validation. Furthermore, the results indicate that the network generalises well when applied to unseen data within the test dataset. ConvNet exhibits the optimal trade-off between POD and POFD among all models. Table 7 shows a confusion matrix for different variants of ConvNet and hail proxies. The number of false alarms for the best ConvNet, i.e. the ConvNet with the highest AUC-ROC at a discrimination probability of α=0.12, is the lowest among all methods (61 in total – Table 7). The results demonstrate that a shallow CNN architecture is capable of identifying relevant features indicative of severe hail on the ground.
According to Table 6, the second-best methods for detecting severe hail on the test set are the hail proxies MESH95 and MESH75. The performance in terms of PSS for the MESH95 is the best for βX=33 mm and . For MESH75, the best PSS is at βX=22 mm and . This is consistent with the findings of the feature importance study (Sect. 4.2), which identified MESH variables as the most crucial variables for ConvNet to detect severe hail on the ground. The feature thresholds in Table 6 are also in accordance with what can be found in other studies (Murillo and Homeyer, 2019; Ortega, 2021; Brook et al., 2024). When employed either independently or as an input feature to a CNN framework, the results on the test set demonstrate that MESH remains effective for the discrimination of severe hail on the ground, even at C-band.
The POSH and the fuzzy-logic algorithm (A13) appear to be less effective when compared to other methods, as evidenced in Table 6. In the case of POSH, the application of the warning threshold (WT) in Eq. (5) may be considered a potential explanation for the decrease in performance. The denser vertical sampling, higher ZH, and lower attenuation of US S-band radars compared to French C-band radars result in SHI values that may be smaller than the ones expected at S-band. Consequently, the WT fitted to the S-band radars may remove a significant proportion of pixels with low SHI values in this study. This can be verified in Fig. 5, where the POSH values cover a smaller area than other hail proxies. One potential solution would be to modify the fit of POSH in order to adapt it to the French radar network. The performance of the fuzzy-logic algorithm (A13) varies significantly depending on the hail class used as a feature threshold (i.e. ≥ SH, ≥ MH, ≥ LH), as evidenced in Table 6. In essence, the performance of the algorithm declines significantly as the threshold for hail class is increased, as the model with small hail as a threshold is the best among all other hail classes (A13small, Table 6). This may indicate a propensity of the fuzzy-logic scheme to model severe hail as small hail (SH – < 0.5 cm) rather than large hail (LH – ≥ 2 cm). This may demonstrate that an improvement is possible in the design of the bi-dimensional membership functions of hail classes within A13 (see Appendix C), as the small-hail and medium-hail class may in reality represent larger hail sizes than those indicated.
The variation in the local performance of hail proxies for different pairs (βX, ) is also investigated in order to demonstrate the potential for compromise in operational use. The variations in performance are presented in the form of PSS matrices in Fig. 14. The PSS matrix indicates that the local performance for a given feature threshold (βX) can be modified by adjusting the discrimination area (). The PSS values demonstrate that the local performance of hail proxies can be markedly improved by implementing an optimised pair (). In fact, Fig. 14 indicates that the thresholds yielding the highest PSS for the hail proxies are not exclusive and lie within a broad range of potential feature thresholds and discrimination areas.
To investigate further the consequences of the threshold selection in terms of false alarms, two pair variants are evaluated for two of the most effective hail proxies: POHDelobbe and MESH95. The pairs are the following:
-
the (βX, ) pair that produced the highest PSS among all thresholds
-
and the pairs
-
(βX=50 %, for POHDelobbe
-
(βX=30 mm, ) for MESH75.
-
The latter pair variant was considered a baseline model for both proxies, where 30 km × 30 km images are classified as producing severe hail if an area of at least 1 km is found within POHDelobbe≥50 % and MESH95≥30 mm, respectively. The results of this local performance analysis are given as a confusion matrix in Table 7. The confusion matrix indicates a significant increase in the number of false alarms when a small area of 1 km is used to trigger the severe-hail detection for the hail proxies, in comparison to their optimal variant. The number of false alarms increases from 68 to 364 (+435 %) for MESH95 and from 80 to 552 (+590 %) for POHDelobbe. Although anticipated, the results demonstrate that incorporating fairness into the prediction of existing hail proxies by considering both a threshold value and the area they cover is more effective than a simple verification that would rely on the nearest hail proxy pixel within a certain radius around a location.
Additionally, the ROC curves (Fig. 13) indicate that the majority of the hail proxies compared in this study can be considered to have equivalent skill for severe-hail detection on the test set if the threshold value is optimised. This demonstrates that the proper tuning of an operationally deployed hail detection technique can result in a satisfactory level of severe-hail detection, in accordance with other studies (Ortega, 2021; Brook et al., 2024; Ackermann et al., 2024; Kopp et al., 2024). This interpretation as well as the threshold values may change according to the specificities of each national radar network, particularly for different radar bands and scanning strategies where more vertical sampling is available.
Finally, the inference of the ensemble of the 10 ConvNet models is assessed on a hail event that occurred on 11 July 2023 between 17:00 and 19:00 (UTC). The situation is extracted from the test dataset. The results are presented in Fig. 15. The average probability of severe hail at the ground predicted by the 10 models is denoted as . The computation is performed on images with dimensions of 30 km × 30 km around cell centroids every 5 min. Cell centroids are obtained using the cell identification algorithm tobac (see Appendix A). Throughout the hail event and the life cycle of different cells, the ConvNet models demonstrate a consistent behaviour. The cells responsible for the severe-hail reports are accurately identified, exhibiting a high probability of severe hail (large circle). One particular cell appears to have reached a mature stage, capable of producing severe hail on the ground for about 1.5 h, which is consistent with the characteristics of long-lasting, highly organised convective systems such as multicell or supercell systems. A notable proportion of cells exhibiting high reflectivity (≥ 60 dBZ) are not identified as producing severe hail on the ground by the ConvNet models (; grey lines without circles in Fig. 15). Although severe-hail reports may be subject to reporting bias, this could highlight the potential of CNNs to capture relevant information within the morphology of storms and use it to discriminate severe hail storms from other storms. The main advantage of performing the inference with an ensemble of ConvNet models is the computation of uncertainty intervals. The uncertainty appears to increase when the predicted probability of severe hail decreases (reduced circle radius, brighter colour), indicating a decline in prediction consistency when the ConvNet models encounter an edge case, i.e. where rain or small hail below 2 cm might be produced. A small oscillation in the average probability and uncertainty is visible every 5 min within the north-eastern cell in Fig. 15, probably due to the different vertical sampling at each time step implemented in the VCPs (Table 1) that have an impact on important features of the CNN. However, a more comprehensive analysis of the inference on unseen events is necessary to gain a deeper understanding of the underlying causes of error in the prediction.
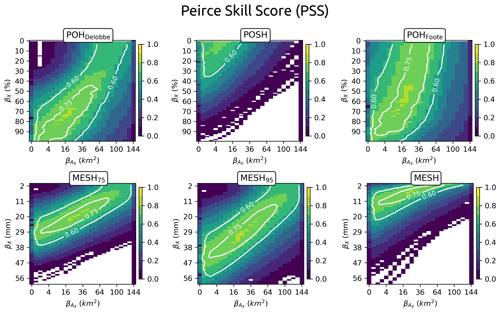
Figure 14Peirce skill score (PSS) matrix for hail proxies with varying feature thresholds (βX) and discrimination areas ().
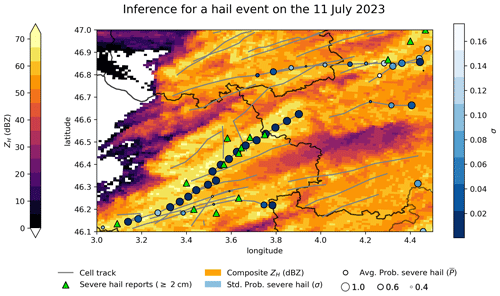
Figure 15Predictions of 10 ConvNet models on 11 July 2023 between 17:00 and 19:00 (UTC). The maximum over 2 h of the national reflectivity composite is shown in the background (orange). Grey lines represent the cell tracks detected with the tobac cell-tracking algorithm (Appendix A). Green triangles represent severe-hail reports (≥ 2 cm) from ESWD within the 2 h. Circles represent the cell centroids every 5 min. Their average probability of severe hail (circle size) and its affiliated uncertainty σ (blue scale) are computed with the predictions of 10 ConvNet models applied to 30 km × 30 km images around centroids. Cell tracks without circles (pure grey lines) contain cell centroids with .
This study demonstrated the development and validation of a convolutional neural network (CNN) for the detection of severe hail (≥ 2 cm) on the ground. The framework for CNN validation, comprising a heavily filtered severe-hail dataset and a rain or small-hail dataset, enabled an extensive comparison of existing radar-based hail proxies on the severe-hail detection problem. The conclusions of this work are as follows:
-
A shallow CNN architecture, named ConvNet, was constructed and selected from among three different types of CNN architecture. It demonstrated superior performance for severe-hail detection within radar images compared to existing hail proxies on a test dataset comprising 1396 radar images with dimensions of 30 km × 30 km, which included severe hail and rain or small hail between 2018 and 2023. This was achieved while utilising the radar information of a unique time step.
-
A feature importance study demonstrated that incorporating hail proxies, such as MESH, as input features to ConvNet enhanced its prediction. Other important features were , ET45, and .
-
A comparison with existing hail proxies led to the conclusion that three hail proxies (MESH, POSH, and POH) can be considered equivalent for severe-hail detection on the test dataset if their performance is assessed using a tuned threshold value and a tuned discrimination area. Furthermore, the number of false alarms can also be drastically reduced if a threshold value and a discrimination area are chosen accordingly.
-
The study showed an example of application in real time, where the ConvNet's inference was contingent upon the detection of cell centroids via a cell identification and tracking algorithm. Its performance seemed to align with observed hail during an event within a large geographical domain. However, a more comprehensive performance validation across future events remains necessary.
The hail proxies examined in this study demonstrate satisfactory performance on the severe-hail detection task when their parameters are optimised. The optimised parameters, particularly the feature threshold values βX, align with those of previous studies (Murillo and Homeyer, 2019; Ortega, 2021). All existing hail proxies, with the exception of two, performed similarly on the test dataset. While their optimal local performance may be achieved through the use of varying threshold values and discrimination areas, it appeared that storm proxies such as echo tops for POH proxies or underlying weighted integrated reflectivity values for MESH proxies demonstrated relevance in capturing crucial information about the presence of hail aloft. This relevance appears to be well suited to the challenging issue of severe-hail detection on the ground, based on the results of this study. The POSH exhibits suboptimal performance, likely due to the presence of a warning threshold that eliminates low SHI values at C-band, owing to the low vertical sampling of French radars. The fuzzy-logic algorithm developed at Météo-France (A13), with capabilities for severe-hail detection, encounters challenges due to the small- and medium-hail classes below 2 cm, which may represent larger hail sizes in reality.
The feature importance study yielded insights into the decision-making process of ConvNet. The MESH proxies were identified as valuable input features, in addition to , , and ET45. This aligns with the strong performance of MESH proxies for severe-hail detection (Table 6). The majority of the most significant variables are based on reflectivity, indicating that storm proxies based on this variable remain a valuable tool for the detection of severe hail on the ground.
One limitation of the current study is that only one time step is used to perform a prediction associated with a report and to compare the CNNs with hail proxies. The life cycle of the storm is not taken into account when performing a severe-hail prediction. This ultimately decreases the importance of input features that have a forecasting potential of storm severity, such as ZDR columns, in this study. Nevertheless, the performance of the aforementioned methods on the test set was generally satisfactory, suggesting that the reported time of the hailfall may be sufficient for the detection of severe hail in this study. However, even after heavy filtering, uncertainty may remain regarding the location and time of severe hail. This uncertainty may compromise the generalisation of the CNN on cases that were not included in the training data if a significant proportion of the severe-hail cases on which it was trained were misplaced in space and time or if there was a systematic error in time and location. However, this uncertainty was, as much as possible, taken into account by manually repositioning in time severe-hail cases in the vicinity of a visible storm. Additionally, the construction of images of 30 km × 30 km around the reports allows for a more comprehensive view of the storms, thereby reducing the impact of potential errors in the reports' location on the performance of the CNN.
The translation of the developed CNN into operations is contingent upon the implementation of a cell-tracking algorithm. As the CNN was trained with radar images of storms, the storms must be identified prior to applying the CNN. The potential volatility in cell tracking due to the high sensitivity of such techniques to their input parameters can increase the inference time of the approach, depending on the number of cells identified every 5 min. In order to detect severe hail, it is recommended to examine cells that have produced reflectivities of at least 45 dBZ. The cell identification algorithm and the production of input features for the CNN may require a greater investment of computational time and resources than existing hail proxies. The necessary 3D interpolation can be particularly costly. However, this additional computational time can be offset in real time by the cell identification algorithm. The input features can be generated for a 30 km × 30 km area centred on cell centroids, which significantly reduces the computational time required for the processing of volumetric radar data into 3D grids in comparison to producing them for the entire national territory, even in areas where there are no reflectivity data that suggest the presence of hail. Furthermore, limiting the inference to useful domains around cell centroids allows for the parallelisation of data processing and inference, which may be crucial for reducing the lag time for real-time applications.
Efforts were made to construct the input features in a way that would minimise the impact of attenuation and resolution decline with range. The use of 3D interpolated grid and volumetric radar data from the two nearest radars enabled the model to be less sensitive to these factors. However, it should be noted that extreme attenuation may not always be taken into account in situations at the border of the French national domain. This may have an impact on the predictability of ConvNet. The use of radar data from neighbouring countries (Germany, Switzerland, Italy, Belgium, Spain) may help to decrease the impact of attenuation in these critical regions.
Despite the implementation of precautionary measures in this study, the challenge of developing effective solutions for severe-hail detection in France persists due to the scarcity of data, particularly severe-hail reports. The results were analysed on a test dataset of 1396 radar images. While a consistent behaviour was visible in the metrics and in a broader hail event, further validation will be crucial for the CNN to validate its global performance and assess its generalisation to unseen cases. Furthermore, the specificities of the French radar network have an impact on the importance of variables and the output of the CNN in this study, particularly the radar band and the low vertical sampling. It is strongly advised that such deep-learning methods be developed and tested on the specific characteristics of different national data and severe-hail report databases in order to validate the effectiveness of CNNs in detecting severe hail on the ground. The incorporation of radar data and hail reports from neighbouring countries could significantly enhance the relevance of deep-learning methods for a common hail warning system in real time.
This study establishes the foundation for the use of convolutional neural networks (CNNs) to study the morphology of storms and extract relevant information for the detection of severe hail. The interpretability of such methods is a crucial aspect. Ongoing work includes the implementation of attribution methods that will facilitate the interpretation of the prediction of the CNN. Attribution methods for neural networks, such as saliency maps, Sobol attribution, and GradCAM (Fel et al., 2022), are currently being explored in order to gain insight into the decision-making process of the CNN. Future work will probably involve the gathering of more data and the increase in the number of features, particularly polarimetric features above the melting layer. Based on the results of this study, deep-learning techniques may have the potential to answer a bigger problem: hail size estimation. Ongoing work also entails the development of a framework for the testing of such methods on the hail size estimation problem.
An advanced cell-tracking algorithm was employed on a single event to illustrate the inference process for the methods developed herein (Fig. 15). The use of a different cell-tracking algorithm for inference is necessary because the former algorithm (i.e. the algorithm presented in Sect. 2.4) is not always able to accurately locate cell centroids. In the first cell-tracking algorithm, centroids are defined as the geometric mean within the contours and are not weighted by the reflectivity values within the cell. As a result, centroids may not be within the cell core but far away from it, preventing continuous tracking of cells every 5 min. The more sophisticated cell-tracking algorithm for inference is based on the open-source Python package tobac (Heikenfeld et al., 2019). It comprises a toolbox where cell-tracking and segmentation algorithms can be applied using different parameters. In this study, the cell-tracking feature is employed exclusively within the inference process. Cells are identified within the national composite reflectivity as one or more contiguous regions of reflectivity values that meet or exceed a threshold. The thresholds used in this study are 36, 42, and 48 dBZ. Additional parameters are used to set a minimum cell size per threshold: 30, 10, and 2 km2, respectively. As multiple reflectivity thresholds are specified, the centroid of each 42 dBZ cell that exists within a 36 dBZ region supersedes and replaces the centroid detected for the encompassing 36 dBZ cell, as explained in Heikenfeld et al. (2019). The centroids are identified by calculating a weighted mean of reflectivity values within the cells. The combination of different thresholds allows for the detection of cell centroids for cells at their initial or decay stage, as well as the identification of cell cores during the mature stage.
In order to gain further insight into the database, a storm mode assessment was conducted. The storms responsible for the production of severe-hail cases and rain or small-hail cases were categorised into four distinct modes: supercell, multicell, isolated cell, and unknown. However, it was deemed impractical to label the storms that produced all the reports presented above. Indeed, a certain proportion of the cases were isolated, and manually labelling them would have required too much time. As a result, only the clusters comprising at least two cases were labelled. For the severe-hail cases, all were kept. For the rain or small-hail cases, only the most severe with a cell producing a were kept. This likely introduces a bias towards more severe storm modes and provides an inaccurate representation of the occurrence of certain storm modes, particularly isolated cells. Nevertheless, it was deemed necessary to examine the data, despite the potential for inaccuracy, in order to ascertain whether a discernible signal existed with regard to specific storm modes in relation to storms accompanied by severe hail.
The clusters of cases were created using a spatio-temporal DBSCAN algorithm (ST-DBSCAN; Birant and Kut, 2007). The severe-hail cases are clustered with δx=15 km and δt=10 min. The rain or small-hail cases are clustered with δx=30 km and δt=60 min. A higher spatio-temporal tolerance was selected for the rain or small-hail cases, as they are geographically scarcer than the severe-hail cases. The national composite reflectivity product (Caumont et al., 2021) and the cells detected by the first cell identification algorithm (Morel and Sénési, 2002) are gathered around ±90 km before and after the first and the last case of the cluster, respectively. All the data are superimposed in a visualisation tool that enables navigation through time during the life cycle of the storm, facilitating the identification of relevant signatures for labelling. The labelling was performed independently by two meteorologists, and the results were cross-validated.
For supercells, typical signatures in the reflectivity composite were searched for: a hook echo, a cell splitting, and/or a deviation of the cells to the right (or to the left) of the main flux (Markowski and Richardson, 2011; Houze, 2014). In the event that a clear line of cells was discernible, the cluster was designated as being part of a multicell system. Conversely, if a cell exhibited a brief lifespan and was isolated from any broader convective system, it was classified as an isolated cell. In the absence of any of the aforementioned criteria or in the event that a determination was precluded due to the passage of multiple cells above the cluster in a brief period of time, the cluster was designated as unknown.
A total of 224 severe-hail clusters and 113 rain or small-hail clusters were labelled. The results are presented in Table B1. Supercells produce 69.9 % of the severe hail on the ground within this study. This shows the predominance of supercells in the production of severe weather compared to other storm modes, which is in accordance with previous studies (Markowski and Richardson, 2011). The rain or small-hail dataset is mainly populated by multicell convective systems (86 %), while only 3.4 % were produced by supercells.
The conclusions in this section remain highly dependent on the data used and the portion of cases selected to perform the storm mode assessment.
The fuzzy-logic algorithm for hydrometeor classification (A13) currently operational at Météo-France corresponds to an updated version of the algorithm developed from Al-Sakka et al. (2013), with three new hail classes. The update was performed to tackle the lack of robustness in the membership functions for hail in the original study (see conclusions of Al-Sakka et al., 2013). The following classes are now computed: (1) rain (RA), (2) wet snow (WS), (3) dry snow (DS), (4) ice (IC), (5) small hail (SH; < 0.5 cm), (6) medium hail (MH; 0.5 to 2 cm), and (7) large hail (LH; > 2 cm). The three hail classes replace the former single hail class (HA) of Al-Sakka et al. (2013).
The fuzzy-logic scheme is based on radar variables ZH, ZDR, ρHV, and KDP. The bright-band (BB) location is also used and produced using the method presented by Tabary et al. (2006), which is based on the cross-correlation coefficient ρHV at high elevations. Finally, the temperature T is used to discriminate regions where certain hydrometeor types are not allowed. Temperature is deduced from the nearest NWP-derived sounding from the ARPEGE global model (Bouyssel et al., 2022) at the radar location.
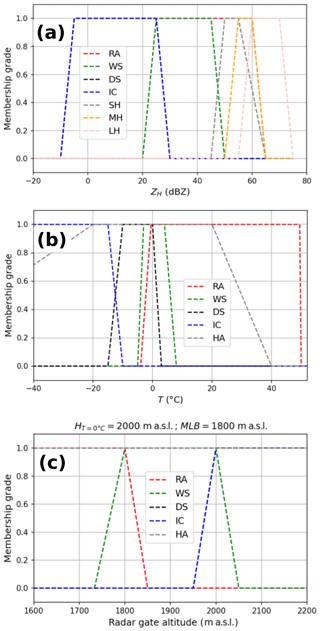
Figure C1One-dimensional membership functions of the updated fuzzy-logic classification algorithm at Météo-France (A13). (a) Fi(ZH), (b) Fi(T), and (c) Fi(BB). Fi(BB) is shown with an altitude of freezing of m a.s.l. (metres above sea level) computed by the AROME model and a melting layer bottom of MLB=1800 m a.s.l. computed using the BB location algorithm of Tabary et al. (2006).
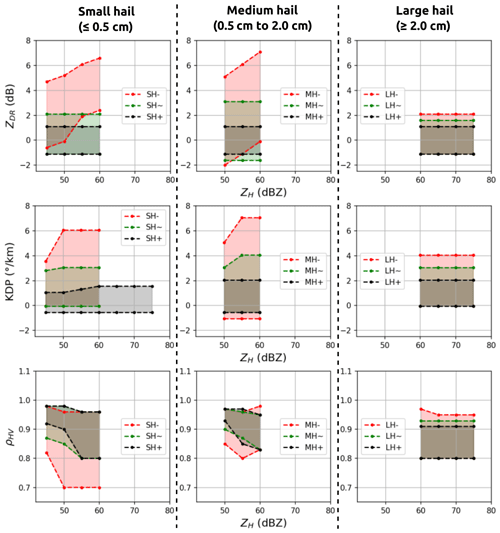
Figure C2Two-dimensional membership functions of the updated fuzzy-logic classification algorithm at Météo-France (A13) with small hail (SH), medium hail (MH), and large hail (LH). The position relative to the BB is specified as under (−), within (∼), and above (+).
The principle of the fuzzy-logic algorithm relies on the computation of a weight for each hydrometeor class. The hydrometeor class having the highest weight becomes the hydrometeor class of the radar gate. The weight is computed thanks to membership functions (one-dimensional and two-dimensional) built on a priori knowledge of the single-polarisation and dual-polarisation signatures for the hydrometeor classes. The weight is defined as follows:
where i stands for the hydrometeor type, and F represents the membership grade (between 0 and 1) coming from both one-dimensional and two-dimensional membership functions.
The one-dimensional membership functions Fi(ZH), Fi(T), and Fi(BB) for all hydrometeor types are presented in Fig. C1. As they are multiplicative terms in the weight, the presence of certain hydrometeor types is heavily driven by the reflectivity, the temperature profile at the radar site, and the position of the radar gate to the BB.
The two-dimensional membership functions Fi(ZH,ZDR), Fi(ZH,KDP), and Fi(ZH,ρHV) for hail depending on the relative position to the BB are presented in Fig. C2. For other hydrometeor classes, refer to Al-Sakka et al. (2013). To simplify the visualisation, only regions with a membership grade superior to 0.7 were kept, but membership grade values exist outside the intervals shown in Fig. C2.
The software is under a private intellectual property contract between Descartes Underwriting and Météo-France and can not be shared publicly.
The raw volumetric dual-polarisation radar data are publicly accessible through the AERIS platform (https://radarsmf.aeris-data.fr/description/?uuid=dea49d60-1489-458e-a8de-589d21b14ca4, Météo-France, 2024) under a research and development licence.
The hail reports from the European Severe Weather Database (https://www.eswd.eu/, European Severe Storms Laboratory, 2024) are not publicly accessible. The ESWD reports used in this study are part of a user agreement between the ESSL and Météo-France.
The hail reports from the Météo-France application are not publicly accessible.
The hailpad reports from the ANELFA (https://www.anelfa.asso.fr/, ANELFA, 2024) are not publicly accessible.
VF designed the methodology, developed the code, validated the results, and prepared the manuscript. CA and OC helped in the conceptualisation, methodology, supervision, and writing. KD contributed to the conceptualisation, supervision, and funding acquisition. MO contributed to the investigation of the storm mode assessment in Appendix B. CD contributed to the conceptualisation of the tobac cell-tracking algorithm in Appendix A and implemented the ZDR column detection algorithm. JF contributed to the supervision and the software of the fuzzy-logic algorithm in Appendix C. OL contributed to the accessibility of the crowdsourcing reports from the Météo-France mobile application. HA contributed to the software of the fuzzy-logic algorithm in Appendix C.
The contact author has declared that none of the authors has any competing interests.
Publisher’s note: Copernicus Publications remains neutral with regard to jurisdictional claims made in the text, published maps, institutional affiliations, or any other geographical representation in this paper. While Copernicus Publications makes every effort to include appropriate place names, the final responsibility lies with the authors.
The authors would like to express their gratitude to the three anonymous reviewers for their invaluable feedback and corrections, which have undoubtedly enhanced the quality of the article.
This research has been supported by Descartes Underwriting, Météo-France, and the French national program Les Enveloppes Fluides et l'Environnement (LEFE, project ASMA and EXDOMO grants).
This paper was edited by Gianfranco Vulpiani and reviewed by three anonymous referees.
Ackermann, L., Soderholm, J., Protat, A., Whitley, R., Ye, L., and Ridder, N.: Radar and environment-based hail damage estimates using machine learning, Atmos. Meas. Tech., 17, 407–422, https://doi.org/10.5194/amt-17-407-2024, 2024. a, b
Al-Sakka, H., Boumahmoud, A.-A., Fradon, B., Frasier, S. J., and Tabary, P.: A New Fuzzy Logic Hydrometeor Classification Scheme Applied to the French X-, C-, and S-Band Polarimetric Radars, J. Appl. Meteorol. Climatol., 52, 2328–2344, https://doi.org/10.1175/JAMC-D-12-0236.1, 2013. a, b, c, d, e, f, g, h, i
Amburn, S. A. and Wolf, P. L.: VIL Density as a Hail Indicator, Weather Forecast., 12, 473–478, https://doi.org/10.1175/1520-0434(1997)012<0473:VDAAHI>2.0.CO;2, 1997. a
ANELFA: ANELFA hailpad database, ANELFA, https://www.anelfa.asso.fr/-Reseaux-.html (last access: 18 November 2024), 2024. a
Barnes, S. L.: A Technique for Maximizing Details in Numerical Weather Map Analysis, J. Appl. Meteorol. Climatol., 3, 396–409, https://doi.org/10.1175/1520-0450(1964)003<0396:ATFMDI>2.0.CO;2, 1964. a
Battaglioli, F., Groenemeijer, P., Tsonevsky, I., and Púčik, T.: Forecasting large hail and lightning using additive logistic regression models and the ECMWF reforecasts, Nat. Hazards Earth Syst. Sci., 23, 3651–3669, https://doi.org/10.5194/nhess-23-3651-2023, 2023. a
Birant, D. and Kut, A.: ST-DBSCAN: An Algorithm for Clustering Spatial–Temporal Data, Data Knowl. Eng., 60, 208–221, https://doi.org/10.1016/j.datak.2006.01.013, 2007. a
Bouyssel, F., Berre, L., Bénichou, H., Chambon, P., Girardot, N., Guidard, V., Loo, C., Mahfouf, J.-F., Moll, P., Payan, C., and Raspaud, D.: The 2020 Global Operational NWP Data Assimilation System at Météo-France, in: Data Assimilation for Atmospheric, Oceanic and Hydrologic Applications (Vol. IV), edited by: Park, S. K. and Xu, L., 645–664 pp., Springer International Publishing, Cham, ISBN 978-3-030-77722-7, https://doi.org/10.1007/978-3-030-77722-7_25, 2022. a
Brook, J. P., Soderholm, J. S., Protat, A., McGowan, H., and Warren, R. A.: A Radar-Based Hail Climatology of Australia, Mon. Weather Rev., 152, 607–628, https://doi.org/10.1175/MWR-D-23-0130.1, 2024. a, b, c, d
Brousseau, P., Seity, Y., Ricard, D., and Léger, J.: Improvement of the Forecast of Convective Activity from the AROME-France System, Quarterly J. Roy. Meteorol. Soc., 142, 2231–2243, https://doi.org/10.1002/qj.2822, 2016. a
Caumont, O., Mandement, M., Bouttier, F., Eeckman, J., Lebeaupin Brossier, C., Lovat, A., Nuissier, O., and Laurantin, O.: The heavy precipitation event of 14–15 October 2018 in the Aude catchment: a meteorological study based on operational numerical weather prediction systems and standard and personal observations, Nat. Hazards Earth Syst. Sci., 21, 1135–1157, https://doi.org/10.5194/nhess-21-1135-2021, 2021. a, b
Delobbe, L. and Holleman, I.: Uncertainties in Radar Echo Top Heights Used for Hail Detection, Meteorol. Appl., 13, 361–374, https://doi.org/10.1017/S1350482706002374, 2006. a, b, c, d
Dessens, J., Berthet, C., and Sanchez, J. L.: A Point Hailfall Classification Based on Hailpad Measurements: The ANELFA Scale, Atmos. Res., 83, 132–139, https://doi.org/10.1016/j.atmosres.2006.02.029, 2007. a
Dotzek, N., Groenemeijer, P., Feuerstein, B., and Holzer, A. M.: Overview of ESSL's Severe Convective Storms Research Using the European Severe Weather Database ESWD, Atmos. Res., 93, 575–586, https://doi.org/10.1016/j.atmosres.2008.10.020, 2009. a
Ester, M., Kriegel, H.-P., and Xu, X.: A Density-Based Algorithm for Discovering Clusters in Large Spatial Databases with Noise, Proceedings of the Second International Conference on Knowledge Discovery and Data Mining, Portland, Oregon, https://doi.org/10.5555/3001460.3001507, 1996. a
European Severe Storms Laboratory: ESWD European Severe Weather Database, European Severe Storms Laboratory, https://www.eswd.eu/ (last access: 18 November 2024), 2024. a
Fel, T., Hervier, L., Vigouroux, D., Poche, A., Plakoo, J., Cadene, R., Chalvidal, M., Colin, J., Boissin, T., Bethune, L., Picard, A., Nicodeme, C., Gardes, L., Flandin, G., and Serre, T.: Xplique: A Deep Learning Explainability Toolbox, https://doi.org/10.48550/arXiv.2206.04394, 2022. a
Figueras i Ventura, J., Boumahmoud, A.-A., Fradon, B., Dupuy, P., and Tabary, P.: Long-Term Monitoring of French Polarimetric Radar Data Quality and Evaluation of Several Polarimetric Quantitative Precipitation Estimators in Ideal Conditions for Operational Implementation at C-band, Q. J. Roy. Meteorol. Soc., 138, 2212–2228, https://doi.org/10.1002/qj.1934, 2012. a, b
Figureas i Ventura, J. and Tabary, P.: The New French Operational Polarimetric Radar Rainfall Rate Product, J. Appl. Meteorol. Climatol., 52, 1817–1835, https://doi.org/10.1175/JAMC-D-12-0179.1, 2013. a
Foote, G. B., Krauss, T. W., and Makitov, V.: Hail Metrics Using Conventional Radar, in: Proc., 16th Conference on Planned and Inadvertent Weather Modification, https://ams.confex.com/ams/pdfpapers/86773.pdf (last access: 7 November 2024), 2005. a, b, c
Gagne, D. J., McGovern, A., Haupt, S. E., Sobash, R. A., Williams, J. K., and Xue, M.: Storm-Based Probabilistic Hail Forecasting with Machine Learning Applied to Convection-Allowing Ensembles, Weather Forecast., 32, 1819–1840, https://doi.org/10.1175/WAF-D-17-0010.1, 2017. a
Gagne, D. J., Haupt, S. E., Nychka, D. W., and Thompson, G.: Interpretable Deep Learning for Spatial Analysis of Severe Hailstorms, Mon. Weather Rev., 147, 2827–2845, https://doi.org/10.1175/MWR-D-18-0316.1, 2019. a
Giammanco, I. M., Maiden, B. R., Estes, H. E., and Brown-Giammanco, T. M.: Using 3D Laser Scanning Technology to Create Digital Models of Hailstones, B. Am. Meteorol. Soc., 98, 1341–1347, https://doi.org/10.1175/BAMS-D-15-00314.1, 2017. a
Gourley, J. J., Tabary, P., and du Chatelet, J. P.: A Fuzzy Logic Algorithm for the Separation of Precipitating from Nonprecipitating Echoes Using Polarimetric Radar Observations, J. Atmos. Ocean. Technol., 24, 1439–1451, https://doi.org/10.1175/JTECH2035.1, 2007. a, b
Greene, D. R. and Clark, R. A.: Vertically Integrated Liquid Water – A New Analysis Tool, Mon. Weather Rev., 100, 548–552, https://doi.org/10.1175/1520-0493(1972)100<0548:VILWNA>2.3.CO;2, 1972. a, b
Groenemeijer, P. and Kühne, T.: A Climatology of Tornadoes in Europe: Results from the European Severe Weather Database, Mon. Weather Rev., 142, 4775–4790, https://doi.org/10.1175/MWR-D-14-00107.1, 2014. a
He, K., Zhang, X., Ren, S., and Sun, J.: Deep Residual Learning for Image Recognition, 2016 IEEE Conference on Computer Vision and Pattern Recognition (CVPR), 770–778, https://doi.org/10.48550/arXiv.1512.03385, 2015. a, b
Heikenfeld, M., Marinescu, P. J., Christensen, M., Watson-Parris, D., Senf, F., van den Heever, S. C., and Stier, P.: tobac 1.2: towards a flexible framework for tracking and analysis of clouds in diverse datasets, Geosci. Model Dev., 12, 4551–4570, https://doi.org/10.5194/gmd-12-4551-2019, 2019. a, b
Helmus, J. J. and Collis, S. M.: The Python ARM Radar Toolkit (Py-ART), a Library for Working with Weather Radar Data in the Python Programming Language, J. Open Res. Softw., 4, e25, https://doi.org/10.5334/jors.119, 2016. a
Hersbach, H., Bell, B., Berrisford, P., Hirahara, S., Horányi, A., Muñoz-Sabater, J., Nicolas, J., Peubey, C., Radu, R., Schepers, D., Simmons, A., Soci, C., Abdalla, S., Abellan, X., Balsamo, G., Bechtold, P., Biavati, G., Bidlot, J., Bonavita, M., De Chiara, G., Dahlgren, P., Dee, D., Diamantakis, M., Dragani, R., Flemming, J., Forbes, R., Fuentes, M., Geer, A., Haimberger, L., Healy, S., Hogan, R. J., Hólm, E., Janisková, M., Keeley, S., Laloyaux, P., Lopez, P., Lupu, C., Radnoti, G., de Rosnay, P., Rozum, I., Vamborg, F., Villaume, S., and Thépaut, J.-N.: The ERA5 Global Reanalysis, Q. J. Roy. Meteorol. Soc., 146, 1999–2049, https://doi.org/10.1002/qj.3803, 2020. a
Holleman, I.: Hail Detection Using Single-Polarization Radar, 2001. a
Houze, R. A.: Mesoscale Convective Systems, in: International Geophysics, Vol. 104, 237–286 pp., Elsevier, ISBN 978-0-12-374266-7, https://doi.org/10.1016/B978-0-12-374266-7.00009-3, 2014. a
INSEE: Le Trajet Median Domicile-Travail Augmente de Moitié En Vingt Ans Pour Les Habitants Du Rural, https://www.insee.fr/fr/statistiques/7622203#:text=Insee%20%20Premi~Are%20^A%C2%B7%20%20%20Mai%202023%20^A%C2%B7%20n,pour%20les%20habitants%20du%20rural&text=En%202019,%20un%20%20%20tiers%20des,travaillent%20dans%20une%20zone%20urbaine (last access: 25 May 2023), 2023. a
Jiang, Z., Kumjian, M. R., Schrom, R. S., Giammanco, I., Brown-Giammanco, T., Estes, H., Maiden, R., and Heymsfield, A. J.: Comparisons of Electromagnetic Scattering Properties of Real Hailstones and Spheroids, J. Appl. Meteorol. Climatol., 58, 93–112, https://doi.org/10.1175/JAMC-D-17-0344.1, 2019. a
Kelleher, J. D., Mac Namee, B., and D'arcy, A.: Fundamentals of Machine Learning for Predictive Data Analytics: Algorithms, Worked Examples, and Case Studies, MIT Press, ISBN: 9780262331746, 2020. a, b
Kopp, J., Hering, A., Germann, U., and Martius, O.: A comprehensive verification of the weather radar-based hail metrics POH and MESHS and a recalibration of POH using dense crowdsourced observations from Switzerland, EGUsphere [preprint], https://doi.org/10.5194/egusphere-2024-729, 2024. a, b, c
Krizhevsky, A., Sutskever, I., and Hinton, G. E.: ImageNet Classification with Deep Convolutional Neural Networks, Commun. ACM, 60, 84–90, https://doi.org/10.1145/3065386, 2017. a
Kumjian, M. R.: Principles and Applications of Dual-Polarization Weather Radar. Part II: Warm-and Cold-Season Applications, J. Oper. Meteorol., 1, 243–264, https://doi.org/10.15191/nwajom.2013.0120, 2013a. a, b, c, d, e, f, g, h
Kumjian, M. R.: Principles and Applications of Dual-Polarization Weather Radar. Part I: Description of the Polarimetric Radar Variables, J. Oper. Meteorol., 1, 226–242, https://doi.org/10.15191/nwajom.2013.0119, 2013b. a, b, c
Kuster, C. M., Snyder, J. C., Schuur, T. J., Lindley, T. T., Heinselman, P. L., Furtado, J. C., Brogden, J. W., and Toomey, R.: Rapid-Update Radar Observations of ZDR Column Depth and Its Use in the Warning Decision Process, Weather Forecast., 34, 1173–1188, https://doi.org/10.1175/WAF-D-19-0024.1, 2019. a, b, c
Lecun, Y., Bottou, L., Bengio, Y., and Haffner, P.: Gradient-Based Learning Applied to Document Recognition, P. IEEE, 86, 2278–2324, https://doi.org/10.1109/5.726791, 1998. a
Markowski, P. and Richardson, Y.: Mesoscale Meteorology in Midlatitudes, John Wiley & Sons, ISBN 978-1-119-96667-8, 2011. a, b
Météo-France: RADAR Double-Polar Radial raw Data from PAM* products, Météo-France, https://radarsmf.aeris-data.fr/description/?uuid=dea49d60-1489-458e-a8de-589d21b14ca4 (last access: 18 November 2024), 2024. a
Morel, C. and Sénési, S.: A Climatology of Mesoscale Convective Systems over Europe Using Satellite Infrared Imagery. I: Methodology, Q. J. Roy. Meteorol. Soc., 128, 1953–1971, https://doi.org/10.1256/003590002320603485, 2002. a, b, c
Murillo, E. M. and Homeyer, C. R.: Severe Hail Fall and Hailstorm Detection Using Remote Sensing Observations, J. Appl. Meteorol. Climatol., 58, 947–970, https://doi.org/10.1175/JAMC-D-18-0247.1, 2019. a, b, c, d, e, f, g, h
Nisi, L., Hering, A., Germann, U., Schroeer, K., Barras, H., Kunz, M., and Martius, O.: Hailstorms in the Alpine Region: Diurnal Cycle, 4D-characteristics, and the Nowcasting Potential of Lightning Properties, Q. J. Roy. Meteorol. Soc., 146, 4170–4194, https://doi.org/10.1002/qj.3897, 2020. a
Ortega, K. L.: Evaluating a Hail Size Discrimination Algorithm for Dual-Polarized WSR-88Ds Using High-Resolution Reports and Forecaster Feedback, in: 36th Conference on Radar Meteorology (16–20 September, 2013), AMS, https://ams.confex.com/ams/36Radar/webprogram/Paper228601.html (last access: 7 November 2024), 2013. a
Ortega, K. L.: Evaluating Multi-Radar, Multi-Sensor Products for Surface Hailfall Diagnosis, E-J. Severe Storm. Meteorol., 13, 1–36, https://doi.org/10.55599/ejssm.v13i1.69, 2021. a, b, c, d, e
Ortega, K. L., Krause, J. M., and Ryzhkov, A. V.: Polarimetric Radar Characteristics of Melting Hail. Part III: Validation of the Algorithm for Hail Size Discrimination, J. Appl. Meteorol. Climatol., 55, 829–848, https://doi.org/10.1175/JAMC-D-15-0203.1, 2016. a, b
Park, H. S., Ryzhkov, A. V., Zrnić, D. S., and Kim, K.-E.: The Hydrometeor Classification Algorithm for the Polarimetric WSR-88D: Description and Application to an MCS, Weather Forecast., 24, 730–748, https://doi.org/10.1175/2008WAF2222205.1, 2009. a
Pilorz, W., Zięba, M., Szturc, J., and Łupikasza, E.: Large Hail Detection Using Radar-Based VIL Calibrated with Isotherms from the ERA5 Reanalysis, Atmos. Res., 274, 106185, https://doi.org/10.1016/j.atmosres.2022.106185, 2022. a, b
Punge, H. J. and Kunz, M.: Hail Observations and Hailstorm Characteristics in Europe: A Review, Atmos. Res., 176–177, 159–184, https://doi.org/10.1016/j.atmosres.2016.02.012, 2016. a
Ryzhkov, A. V. and Zrnic, D. S.: Radar Polarimetry for Weather Observations, Springer Atmospheric Sciences, Springer International Publishing, Cham, ISBN 978-3-030-05092-4 978-3-030-05093-1, https://doi.org/10.1007/978-3-030-05093-1, 2019. a, b, c, d, e, f, g, h, i, j, k, l
Ryzhkov, A. V., Kumjian, M. R., Ganson, S. M., and Khain, A. P.: Polarimetric Radar Characteristics of Melting Hail. Part I: Theoretical Simulations Using Spectral Microphysical Modeling, J. Appl. Meteorol. Climatol., 52, 2849–2870, https://doi.org/10.1175/JAMC-D-13-073.1, 2013a. a
Ryzhkov, A. V., Kumjian, M. R., Ganson, S. M., and Zhang, P.: Polarimetric Radar Characteristics of Melting Hail. Part II: Practical Implications, J. Appl. Meteorol. Climatol., 52, 2871–2886, https://doi.org/10.1175/JAMC-D-13-074.1, 2013b. a, b, c
Shedd, L., Kumjian, M. R., Giammanco, I., Brown-Giammanco, T., and Maiden, B. R.: Hailstone Shapes, J. Atmos. Sci., 78, 639–652, https://doi.org/10.1175/JAS-D-20-0250.1, 2021. a
Shi, J., Wang, P., Wang, D., and Jia, H.: Radar-Based Hail-producing Storm Detection Using Positive Unlabeled Classification, Tehnički vjesnik, 27, 941–950, https://doi.org/10.17559/TV-20190903094335, 2020. a
Smith, P. L. and Waldvogel, A.: On Determinations of Maximum Hailstone Sizes from Hailpad Observations, J. Appl. Meteorol. Climatol., 28, 71–76, https://doi.org/10.1175/1520-0450(1989)028<0071:ODOMHS>2.0.CO;2, 1989. a
Smith, T. M., Lakshmanan, V., Stumpf, G. J., Ortega, K. L., Hondl, K., Cooper, K., Calhoun, K. M., Kingfield, D. M., Manross, K. L., Toomey, R., and Brogden, J.: Multi-Radar Multi-Sensor (MRMS) Severe Weather and Aviation Products: Initial Operating Capabilities, B. Am. Meteorol. Soc., 97, 1617–1630, https://doi.org/10.1175/BAMS-D-14-00173.1, 2016. a
Soderholm, J. S. and Kumjian, M. R.: Automating the analysis of hailstone layers, Atmos. Meas. Tech., 16, 695–706, https://doi.org/10.5194/amt-16-695-2023, 2023. a
Soderholm, J. S., McGowan, H., Richter, H., Walsh, K., Weckwerth, T. M., and Coleman, M.: An 18-Year Climatology of Hailstorm Trends and Related Drivers across Southeast Queensland, Australia, Q. J. Roy. Meteorol. Soc., 143, 1123–1135, https://doi.org/10.1002/qj.2995, 2017. a
Steinert, J., Tracksdorf, P., and Heizenreder, D.: Hymec: Surface Precipitation Type Estimation at the German Weather Service, Weather Forecast., 36, 1611–1627, https://doi.org/10.1175/WAF-D-20-0232.1, 2021. a
Straka, J. M., Zrnić, D. S., and Ryzhkov, A. V.: Bulk Hydrometeor Classification and Quantification Using Polarimetric Radar Data: Synthesis of Relations, J. Appl. Meteorol. Climatol., 39, 1341–1372, https://doi.org/10.1175/1520-0450(2000)039<1341:BHCAQU>2.0.CO;2, 2000. a
Tabary, P., Henaff, A. L., Vulpiani, G., Parent-du-Châtelet, J., and Gourley, J. J.: Melting Layer Characterization and Identification with a C-band Dual-Polarization Radar: A Long-Term Analysis, https://www.researchgate.net/profile/Gianfranco-Vulpiani/publication/258833606_Melting_layer _characterization_and_identification_with_a_C-band_dual-polarization_radar_A_long-term_analysis/links/59eda2150f7e9bfdeb71c2b7/Melting-layer-characterization-and-identification-with (last access: 7 November 2024), 2006. a, b
Trefalt, S., Germann, U., Hering, A., Clementi, L., Boscacci, M., Schroër, K., and Schwierz, C.: Operational radar hail detection algorithms at MeteoSwiss: quality assesssment and improvement, Tech. rep., MeteoSwiss, No. 284, https://doi.org/10.18751/PMCH/TR/284.HailClimateSwitzerland/1.0, 2023. a, b, c
Vivekanandan, J., Zrnic, D. S., Ellis, S. M., Oye, R., Ryzhkov, A. V., and Straka, J.: Cloud Microphysics Retrieval Using S-Band Dual-Polarization Radar Measurements, B. Am. Meteorol. Soc., 80, 381–388, https://doi.org/10.1175/1520-0477(1999)080<0381:CMRUSB>2.0.CO;2, 1999. a, b, c
Waldvogel, A., Federer, B., and Grimm, P.: Criteria for the Detection of Hail Cells, J. Appl. Meteorol. Climatol., 18, 1521–1525, https://doi.org/10.1175/1520-0450(1979)018<1521:CFTDOH>2.0.CO;2, 1979. a
Wang, P., Lv, W., Wang, C., and Hou, J.: Hail Storms Recognition Based on Convolutional Neural Network*, in: 2018 13th World Congress on Intelligent Control and Automation (WCICA), 1703–1708 pp., https://doi.org/10.1109/WCICA.2018.8630701, 2018. a, b
Witt, A., Eilts, M. D., Stumpf, G. J., Johnson, J. T., Mitchell, E. D. W., and Thomas, K. W.: An Enhanced Hail Detection Algorithm for the WSR-88D, Weather Forecast., 13, 286–303, https://doi.org/10.1175/1520-0434(1998)013<0286:AEHDAF>2.0.CO;2, 1998. a, b, c, d, e, f, g, h, i, j, k, l, m
Zrnić, D. S., Bringi, V. N., Balakrishnan, N., Aydin, K., Chandrasekar, V., and Hubbert, J.: Polarimetric Measurements in a Severe Hailstorm, Mon. Weather Rev., 121, 2223–2238, https://doi.org/10.1175/1520-0493(1993)121<2223:PMIASH>2.0.CO;2, 1993. a
- Abstract
- Introduction
- Data
- Methods
- Results
- Conclusions
- Appendix A: Cell identification algorithm for inference
- Appendix B: Storm mode assessment
- Appendix C: Updated fuzzy-logic algorithm in C-band from Al-Sakka et al. (2013)
- Code availability
- Data availability
- Author contributions
- Competing interests
- Disclaimer
- Acknowledgements
- Financial support
- Review statement
- References


