the Creative Commons Attribution 4.0 License.
the Creative Commons Attribution 4.0 License.
Advantages of G-band radar in multi-frequency liquid-phase microphysical retrievals
Benjamin M. Courtier
Alessandro Battaglia
Kamil Mroz
Radar-based microphysical retrievals of cloud and droplet properties are vital for informing model parameterisations of clouds and precipitation, but these retrievals often do not capture the details of small droplets in light rain or drizzle. A state-of-the-art G-band radar is used here to demonstrate improvements to microphysical retrievals in a case study featuring light rain. Compared to W-band radar, improvements are seen in the retrieval of vertical wind speed due to the location of Mie minima at smaller droplet sizes with the G-band radar. This, in turn, has an impact on the retrieval of the drop size distribution, allowing for better accuracy in the retrieval of the characteristic drop diameter and for improvements in the retrieval of the particle number concentrations of small droplet sizes. The dual-Doppler velocity (DDV) between the Ka- and G-bands shows increased dynamic range compared to the Ka–W pairing, particularly for instances presenting small characteristic drop diameters. The increased attenuation experienced at G-band enables improved retrievals of liquid water content and precipitation rate when paired with W-band or Ka-band compared to the W-band and Ka-band pairing. This is particularly noticeable in periods of light rain when the W-band and Ka-band radars receive negligible attenuation, while the attenuation at G-band is much greater.
- Article
(5177 KB) - Full-text XML
- BibTeX
- EndNote
Radar-based microphysical retrievals of cloud and droplet properties are vital for informing model parameterisations of clouds and precipitation. In situ measurements of microphysical parameters are very informative but do not have the breadth of coverage geographically or in terms of the range of cloud types that can be sampled using radars and in particular satellite-based radars (e.g. Kidd, 2001; Mason et al., 2023). As improvements in solid-state radar technology have fostered the development of the next generation of meteorological radars in the G-band region (Cooper et al., 2018; Lamer et al., 2021; Courtier et al., 2022), the potential for a satellite-borne G-band radar is of great interest for improving the retrievals of the smallest particles found in both ice and liquid clouds (Battaglia et al., 2020).
Current rain microphysical retrievals typically use W-band, Ka-band, X-band, or a combination of any or all of those frequencies (e.g. Tridon and Battaglia, 2015; Tridon et al., 2020; Mróz et al., 2021; von Terzi et al., 2022). This is appropriate for many atmospheric conditions and works well for rain and raindrops exceeding ∼ 0.5 mm. But most cloud droplets are too small to be effectively observed using these radar frequencies, assuming standard radar sensitivities. Small cloud droplets are observed by X-, Ka-, and W-band radars in the Rayleigh regime, meaning that no size information can be diagnosed from multi-frequency techniques. G-band radar is predicted to improve the retrievals of microphysical properties such as liquid water content (LWC) or rainfall rate for these small-sized droplets or particles (Mead et al., 1989; Lhermitte, 1990)
The microphysical retrievals that are of interest to this study are the vertical wind, the drop size distribution (DSD), the characteristic droplet diameter, and the LWC (which is related to the path-integrated attenuation, PIA). These are introduced in more detail below. Battaglia et al. (2014) detailed the improvements that can be made in these retrievals by using a G-band radar in combination with other cloud radars. They state that the vertical wind can be observed with median volume droplet diameters (D0) as small as 0.23 mm (with a spectral broadening of less than 0.2 m s−1). This is a substantial improvement over the smallest D0 possible to retrieve the vertical wind in W-band (this is around 0.7 mm). The improvement in the LWC is largely due to the increased differential attenuation observed by the inclusion of a G-band radar. Battaglia et al. (2014) suggest a 4-fold improvement in accuracy for a Ka–G pairing compared to a Ka–W pairing.
DSD retrievals vary greatly in terms of complexity; the most simple way is to assume no turbulence in the atmosphere and just retrieve the DSD by the spectral power in a velocity bin. An efficient method by Williams et al. (2016) assumed that the DSD could be represented by a gamma distribution and used the Doppler velocity difference (the difference between mean Doppler velocity at two difference wavelengths) to retrieve the parameters of the gamma distribution and therefore the DSD.
Many methods use variational techniques to retrieve the DSD; for example, Mason et al. (2017) use the moments of airborne Doppler radar observations together with the PIA to retrieve parameters to produce a gamma-based DSD with a fixed shape parameter. More complex methods (Firda et al., 1999; Tridon et al., 2017; Mróz et al., 2021) use observations of Doppler spectra to adjust binned retrievals of DSD using turbulence and the vertical wind to adjust the shape and using path-integrated attenuation to adjust the magnitude of the spectra. This was done using a simple iterative method by Firda et al. (1999) and using an optimal estimation technique by Tridon et al. (2017) and Mróz et al. (2021).
Dual-Doppler velocity (DDV) retrievals aim to retrieve a characteristic diameter of the DSD without retrieving the entire DSD; this can then be used to estimate the full DSD if some assumptions are made (e.g. Tian et al., 2007). This is advantageous if the full Doppler spectrum is not recorded and instead only the moments are known. The method relates the dual-Doppler velocity (which is independent of the vertical wind) to, in a typical case, the mass-mean-weighted diameter (Dm). This relationship is derived via a statistical, observational approach (e.g. Matrosov, 2017) or a theoretical one (e.g. Tian et al., 2007).
Using only two radar wavelengths brings the issue of possible double solutions for each DDV observation; this is because the Doppler velocity of the shorter wavelength is reduced for larger droplets compared to the longer wavelength when entering into the Mie regime from the Rayleigh regime. However, this gap is reduced again as the two wavelengths enter into the geometric scattering regime where the Doppler velocity is independent of the wavelength. Often this can be resolved using the Doppler velocity or reflectivity to discern the right solution based on the fact that larger particles are associated with larger signals in such variables. However, there can still be ambiguous results, particularly for values of Dm where the two solutions are similar. Mróz et al. (2020) presented a triple-frequency retrieval in which the uncertainty in the retrieval of Dm is reduced for large Dm. They also suggested that in order to improve the ability to retrieve small Dm, the inclusion of a G-band radar is necessary.
The path-integrated attenuation is difficult to retrieve because of the entanglement of attenuation and non-Rayleigh effects, which both affect the radar reflectivity (Tridon et al., 2020). If multiple-frequency-band radars are being used, it becomes slightly easier to separate attenuation and non-Rayleigh scattering. One method to disentangle these effects, implemented by Tridon et al. (2013), aligns the Rayleigh regions of the spectra and uses the reflectivity adjustment to estimate the differential attenuation. If one of the radar frequencies used can be approximated as receiving no attenuation, then the absolute attenuation can also be retrieved. Attenuation is caused by both gaseous and hydrometeor attenuation. If the gaseous attenuation is known (this can be simply calculated using a radiosonde profile or reanalysis model data), then any remaining attenuation below the freezing level (with respect to height) is caused by liquid water. Hogan et al. (2005) demonstrated a method for retrieving LWC using the fact that differential attenuation is proportional to liquid water content in a cloud. If equal sensitivity of the radars is assumed and the radars are operated with the same pulse repetition frequency (PRF), then the reduction in error for the Ka–G combination versus the Ka–W combination is around a 4-fold improvement (Battaglia et al., 2014).
These three retrieval techniques are used throughout this study to exemplify the benefits of the G-band radar when retrieving microphysical properties. The retrieval of the full DSD is of particular importance, as the other microphysical properties of interest can all also be calculated if the full DSD is known.
In this study, we detail the theoretical advantages of G-band radar with respect to microphysical retrievals and then examine the actual performance of the G-band Radar for Cloud Evaluation (GRaCE) based in Chilbolton in retrieving microphysical properties. In Sect. 2 we present an overview of the theoretical performance of a G-band radar for several different retrievals. In Sect. 3 we describe the retrieval methods used and the case study data that are used to verify the retrievals. In Sect. 4 we demonstrate the real-life capabilities of a G-band radar with regard to the microphysical retrievals and relate the performance back to what is expected from theory. In Sect. 5 we summarise the study and present the capabilities of the G-band radar.
The main advantages of G-band over lower frequencies are in the interactions between the 1.5 mm radar-transmitted electromagnetic wave and droplets of a similar size. At 200 GHz the microwave radiation scatters in the Rayleigh regime (i.e. when the backscattering cross section differs from the Rayleigh counterpart by less than 3 dB) for droplets with a diameter of less than approximately 0.37 mm; beyond this size, the scattering enters the non-Rayleigh regime and the backscattering cross section is reduced compared to the Rayleigh counterpart. Local scattering minima known as Mie notches occur in the non-Rayleigh regime; these minima occur repeatedly until the geometric scattering regime is reached. Pertinent Mie notches for G-band are located at droplets with diameters of 0.8 and 1.5 mm. For a vertically pointing radar observing spherical droplets falling at terminal velocity in the absence of any vertical wind at 1000 hPa, these droplet diameters correspond directly to velocities of 3.24 and 5.02 m s−1 respectively. Any change from this theoretical Doppler velocity is largely due to atmospheric forcing from the vertical wind (Lhermitte, 1988; Kollias et al., 1999). This technique has been used successfully by Giangrande et al. (2010) with a W-band radar to measure the vertical velocity in stratiform precipitation in Oklahoma. Because the Mie notches occur at smaller droplet diameters for G-band radar than they do for lower frequencies, the vertical wind can be retrieved at lower rainfall rates and smaller mean drop diameters than when using longer-wavelength radars.
The retrieval of the Mie notch location is done computationally using a local minimum detection algorithm with 3 dB required prominence to filter out noise; this threshold could be set to be smaller, but here the choice has been made to avoid the possibility of false detection. This is shown in Fig. 1: the first G-band Mie notch, occurring at around 3.2 m s−1, clearly meets this threshold and so would be detected. The second G-band Mie notch does not have a clear minimum and so is not detected as a Mie notch. The W-band Mie minimum is slightly more complex; it can clearly be recognised by eye as a Mie notch but is not detected by the algorithm because the prominence of the minimum is not sufficiently strong. This method is used in the optimal estimation described later in this study.
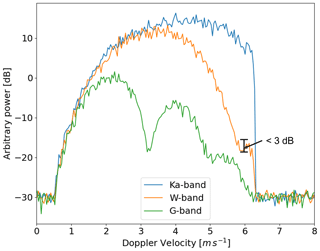
Figure 1Triple-frequency spectra generated from a gamma distribution with added noise. The y-axis scale is in log units but is arbitrary and uncalibrated. The first Mie notch in the G-band curve is clear, while the second has no local minimum. The Mie notch in W-band can be seen but does not meet the required 3 dB prominence and so would not be detected as a Mie notch.
The dual-frequency ratio (DFR) can be a good proxy for the characteristic diameter estimation when at least one of the radars has some non-Rayleigh scattering contributing to the radar reflectivity. Figure 2 shows that for pairings including G-band and for exponential DSDs with a Dm between 0.3 and 2 mm in particular, the DFR gives a clear diagnostic of the Dm. At a Dm much greater than 2 mm, the DFR levels out for the W–G pairs but continues to increase for the Ka–G and Ka–W pairs. For Fig. 1, where the Dm is 0.75 mm, the DFR between the Ka- and W-bands is around 4 dB, whereas the DFR between the Ka- and G-bands is 17 dB. The large difference between the radar reflectivity in Ka-band and in G-band is manifested by the area between the Ka-band spectra and the G-band spectra. For the exponential distributions used to generate Fig. 2, the onset of the non-Rayleigh regime defined above is at a Dm of 0.25 mm.
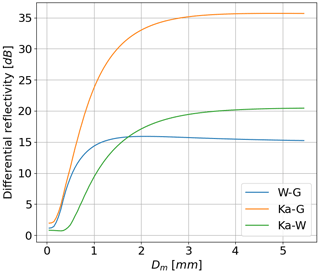
Figure 2Dual-frequency ratios for three wavelength pairings for different sizes of Dm. All spectra were generated using exponential DSDs.
Figure 3 demonstrates the enhanced capabilities of the Mie notch wind retrieval when using a G-band compared to a W-band radar. The figure shows where the first Mie notch can be detected in rain rate–Dm space for various radar sensitivities. For a sufficiently large Dm (1.3 mm), both W-band and G-band can detect a Mie notch (dark-grey-shaded region in Fig. 3a), although there is a difference in the sensitivity required for each system. For G-band, better sensitivity is required to retrieve the vertical wind speed compared to W-band because of the non-Rayleigh reduction in reflectivity. However, it can be seen in Fig. 3b that for any realistic observations, the sensitivity required at Dm greater than 1.3 mm is easily obtainable. For a sufficiently small Dm (0.35 mm), neither W-band nor G-band can detect a Mie notch, and therefore neither can retrieve the vertical wind. Within the region where a G-band radar can detect a Mie notch but a W-band radar cannot (i.e. the light-grey-shaded region in Fig. 3a), there are small variations in the success of the G-band at detecting a Mie notch; this is due to differences in the exact formation of the gamma distribution used to generate the spectral data.
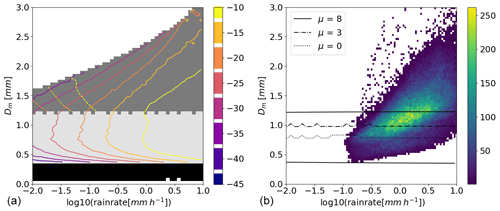
Figure 3Panel (a) shows the sensitivity required to observe a Mie notch for the W-band and G-band radars. The required sensitivity is shown in contours [dBz]: in solid lines for G-band and in dashed lines for W-band. The light-grey-filled region is the region where a G-band Mie notch can be observed but a W-band notch cannot be, the dark-grey-filled region is where both W- and G-bands can observe a Mie notch, and the black region is where no Mie notches can be detected. The white-filled regions are outside of where DSDs could be constructed with the parameters used. Panel (b) shows the frequency of disdrometer observations within this Dm–rain rate space. The black lines represent the contours of the region where a G-band Mie notch can be detected but a W-band Mie notch cannot be.
For the W-band simulations, there is also dependence of the detection of the Mie notch on the shape parameter. For narrower DSDs (i.e. larger values of μ), the Dm at which the Mie notch can be detected at W-band is larger than for broader DSDs (i.e. smaller values of μ). This dependence is shown in Fig. 3b; for a μ of 8 (the maximum considered here), the Dm required to detect the Mie notch at W-band is 1.3 mm, while for a μ of 0, the Dm required to detect the Mie notch is 0.8 mm.
While there is a sensitivity dependence on the detection of the G-band Mie notch, for reasonable radar sensitivity, this only becomes relevant for very small values of Dm (i.e. below 0.6 mm). At this point – for an appropriate rainfall rate such as 0.5 mm h−1 – the sensitivity required to detect the Mie notch is at least −20 dBz.
The DSD observations in Fig. 3b show that a large number of observed precipitation events lie within the window where only the G-band radar can retrieve the vertical wind. If a μ of 8 is assumed (i.e. the full extent of Fig. 3a), then almost half (49.5 %) the observations fall into this region. If a μ of 0 is assumed, then in about 8 % of the observations, the vertical wind can be retrieved by the G-band radar but not by the W-band radar. Even at the most conservative end, there are a large number of cases where only the G-band radar can provide information on the vertical wind.
Another specific feature of G-band radars over longer wavelengths is the larger amount of attenuation received at G-band at small droplet sizes. This is not desired behaviour, but it is useful for retrieving liquid water content for rain and cloud profiles where the mean droplet diameter is small, and therefore the liquid water content is often also small. Figure 4a shows that while for very small Dm (0.15 mm) the differential extinction coefficient between the Ka- and G-bands is already around 10 dB km−1 (g m−3)−1, larger than that of the Ka–W pairing, this gap quickly grows to around 20 dB km−1 (g m−3)−1 for a Dm of 0.5 mm. This increase is similar, although smaller, in the W–G pairing, where the differential extinction coefficient peaks at around 21 dB km−1 (g m−3)−1 at a Dm of 0.4 mm.
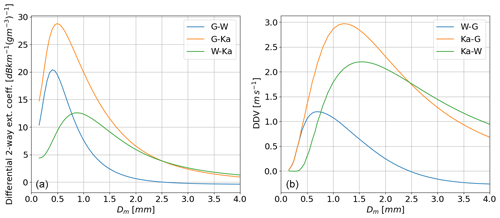
Figure 4Panel (a) shows the differential two-way extinction coefficient for three wavelength pairings for different sizes of Dm. Panel (b) shows the dual-Doppler velocity for three frequency pairings for different sizes of Dm. For both panels, spectra were generated using an exponential DSD.
This strong increase at such a small Dm is due to the fact that attenuation increases strongly in the non-Rayleigh regime to a maximum at (where r is the droplet radius and λ is the radar wavelength), as suggested in Battaglia et al. (2014). For droplets large enough to scatter geometrically rather than in either the Rayleigh or the resonance regimes, the attenuation reduces and there is a very weak wavelength dependence on the attenuation. For instance for the W–G pair, for large Dm the differential attenuation becomes slightly negative (i.e. W-band is attenuated more strongly than G-band).
The dual-Doppler velocity can provide an alternative to other methods for retrieving the characteristic diameter due to the simplicity and computational inexpensiveness of the method and due to the fact that it is not impacted by any reflectivity calibration errors or by the presence of any vertical velocity. This method does, however, require accurate volume matching and excellent vertical pointing calibration so that there is no impact from the horizontal wind on the Doppler velocity. Again, including G-band here improves the estimation of smaller characteristic diameters. Figure 4b shows that the signal for DDV from Ka- and W-bands is strongest at a characteristic diameter of around 1.8 mm, and for diameters less than around 0.4 mm the signal is negligible. Compared to this, the DDVs between the Ka- and G-bands and the W- and G-bands give a signal at much lower diameters, reaching down to the lowest Dm considered here. Further, the signal from the Ka–G combination is stronger than that of DDV Ka–W, meaning that the retrieval will be more reliable for all diameters smaller than around 1.8 mm. There is, of course, a double solution for both W–G and Ka–G combinations; these double solutions can easily be mitigated using the DDV in combination with another frequency pairing or with the Doppler velocity itself. In most cases, the Doppler velocity should be sufficient to distinguish between the two possible solutions.
3.1 Data
The data used in this study were collected on 25 May 2021; this is the same as the case study presented in Courtier et al. (2022). The data were collected during a precipitation event that included periods of both light and moderate precipitation (i.e. rain rates varying between 0.5 and 5 mm h−1 according to disdrometer measurements). Doppler spectra and radar moments were collected at the Ka-, W-, and G-bands. The radars used here were all located at Chilbolton Atmospheric Observatory and are located in close proximity to one another. The Ka- and W-band radars are at the same location, while the G-band radar is around 30 m away. The details of the Ka-band, W-band, and G-band radars can be found in Courtier et al. (2022).
A slight mispointing error was found between the G-band radar and the other two radars; this was estimated to be no more than 0.2 °. While there is likely some impact from this mispointing, the case studies presented in this study were chosen at times when the standard deviation of the Doppler velocity was low and the horizontal wind was light (horizontal winds are taken from ECMWF model data) in order to attempt to minimise the impacts of both the mispointing and the distance between the radars. Despite this, the mispointing did still have an impact on some retrievals.
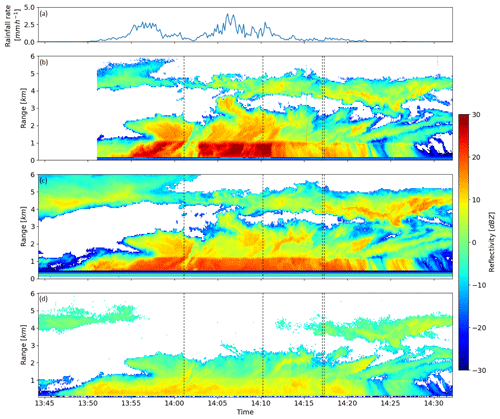
Figure 5 shows the reflectivity for the Ka-band and G-band radars with the rainfall rate for the case study. It can be seen that the precipitation rate is generally light, regularly below 4 mm h−1. These lighter precipitation rates are more favourable for scanning with the G-band radar, as this minimises the problem of attenuation. Unfortunately, the G-band is attenuated strongly by water vapour. With a surface temperature of 11 °C and high relative humidity, in the lowest kilometre, the total two-way attenuation from all atmospheric gases was 4.9 dB.
3.2 Retrievals
The retrievals that are examined in this study are based on existing methods, with the addition of the G-band radar. These methods are outlined in Table 1 and are described in greater detail below.
Lhermitte (1988)Kollias et al. (1999)Mróz et al. (2021)Tridon and Battaglia (2015)Matrosov (2017)Mróz et al. (2021)Tridon and Battaglia (2015)3.2.1 Vertical wind retrieval
The vertical wind retrieval uses the Mie notch method; this method finds the Mie minima in the measured spectra and then compares their locations with the theoretical predictions. The difference between the observations and the theoretical values provides the vertical wind speed. The application of this method requires some extra modifications to account for the noisiness of the spectra. As such, a series of thresholds are used to remove unsuitable data. The first is a prominence (i.e. the difference between the value of the minimum and the nearest local maximum) threshold for the minima of 3 dB or greater; this removes many of the local minima generated by noise. A maximum vertical wind speed of 1.5 m s−1 is enforced to further reduce the retrieval of anomalous data; in the frontally driven cloud and precipitation being studied here, this is a reasonable assumption. These thresholds were sufficient to remove much of the noise from the vertical wind retrievals. However, given that there are two Mie notches in the G-band, an extra constraint can be used in cases where the two Mie notches are visible. That is, the vertical wind speed retrieved from the position of the two individual Mie notches must not differ by more than 0.3 m s−1.
3.2.2 Characteristic diameter retrieval using dual-Doppler velocity
Tian et al. (2007) show that the DDV is only dependent on the shape of the DSD (i.e. the Dm and μ parameters) and not on the intensity, and therefore it is simple to retrieve Dm for a known (or assumed) value of μ. As can be seen in Fig. 9, there is a clear relationship between the DDVs for a combination of frequencies and the Dm within that radar volume. There are typically two solutions for Dm for a given DDV, and so the DDV alone is not enough to retrieve the Dm. The Doppler velocity can, however, almost always be used to aid in finding a sensible solution for Dm. For example, in Fig. 9, a DDV between the Ka- and G-bands of 1.5 m s−1 gives a Dm of either 0.5 or 2.7 mm. The Doppler velocity for these two DSDs would be 3.6 or 7.3 m s−1, and so the two values of Dm are easily distinguished. In this study the retrieval of Dm has been conducted using lookup tables generated from data gathered in the NASA Global Precipitation Measurement (GPM) disdrometer observation network.
3.2.3 Drop size distribution and attenuation retrieval using optimal estimation
The path-integrated attenuation (PIA) can be retrieved using the method of disentangling non-Rayleigh effects and attenuation implemented by Tridon et al. (2013). This method aligns the Rayleigh regions of each frequency spectrum and records the vertical shift in decibels that the spectra must be shifted toward to achieve a perfect alignment. This decibel value corresponds to the differential attenuation between the two frequencies. However, there were several reasons why this could not be implemented here. The assumption that the radars are observing the same targets, used in this method, presents a certain challenge in this case due to some small mispointing errors and the fact that the G-band radar was situated around 30 m away from the other two radars. Another reason the Tridon et al. (2013) method could not be used was because the sensitivity of the GRaCE radar is somewhat poor. This meant that the Rayleigh region (which only extends to 1.49 m s−1 for 200 GHz) was often obscured, either partially or fully, by noise. This meant that matching the Rayleigh regions of the G-band with any other frequency was difficult.
Instead, an optimal estimation (OE) method was used to retrieve the DSD and therefore the PIA. The methods used for optimal estimation and microphysical retrievals are well established. Firda et al. (1999) first used optimal estimation to retrieve binned DSD using multi-frequency radar observations. Since then, optimal estimation techniques have been widely used in microphysical retrievals (e.g. Hogan, 2007; Tridon and Battaglia, 2015; Mason et al., 2017). The OE method used to retrieve the DSD within this study is implemented as a single-level retrieval, which retrieves the DSD at a certain level in isolation, and a full-column retrieval, which uses the DSD retrieved at each level to produce a consistent profile of attenuation. In the full-column version, the shape of the DSD is retrieved separately at each level, but the intensity of the DSDs is adjusted together across the entire column to produce a consistent profile of attenuation.
The OE method is based on that of Mróz et al. (2021) and Tridon and Battaglia (2015). In order to study the effect of the G-band on DSD retrievals, an OE technique using a combination of the Ka-, W-, and G-bands is used to compare against a control technique using just the Ka- and W-bands.
Other than the inclusion of the extra frequency (and the benefits derived from that, e.g. more frequent measurements of vertical wind), the optimal estimation techniques are equivalent. In each, the measurement vector consists of the triple-frequency spectral data, and the state vector consists of the discretised DSD, together with vertical wind speed and turbulence (both of which modify the forward modelled spectra). The covariance matrix was constructed assuming that the errors were uncorrelated and weighted by the inverse of the variance. The a priori of the DSD is the average DSD across the precipitation event as recorded by the surface disdrometer; the error in this was taken as a constant value of 6 dB. The a priori of the vertical wind speed is calculated using the vertical wind speed retrieval described above, and the a priori of the turbulence parameter is assumed to be 0 m s−1. Because there were some small issues with mispointing as mentioned previously, some corrections for differences in vertical wind speed between the radars were conducted before the optimal estimation. This effect was worsened within the boundary layer, as the turbulent nature of the boundary layer makes any influence of the horizontal wind on the retrieval of the vertical wind inconsistent between radars.
For the full-column retrieval, the measurement vector consists of the triple-frequency spectral data at each level (in this study, this is nine levels between 450 and 950 m, which is the portion of the liquid cloud that has a reliable signal from all three frequencies). The state vector consists of the discretised DSD at each level, as well as vertical wind speed and turbulent broadening parameters at each level. The vertical wind speed and turbulent broadening were included at each level (as opposed to a single value for each) due to the highly variable nature of turbulence in the boundary layer.
4.1 Vertical wind retrieval
One of the vital improvements seen with the G-band radar in Courtier et al. (2022) is in the retrieval of vertical wind speed. Because there are no in situ observations of vertical wind taken simultaneously with the radar observations, there is no “truth” to compare against. However, there is a clear improvement shown in Fig. 6 in the coverage of wind retrieval. The number of range gates that successfully retrieve the vertical wind at the W-band is 41.7 % of gates below the melting layer, as shown in Fig. 6c, while at the G-band it is 76.1 %. The number of points where it is possible to retrieve vertical wind at the W-band is highest near the ground and in the areas of greatest reflectivity (i.e. mainly greater than 20 dBz). The coverage from the G-band is much more even and can sometimes extend into the regions of reflectivity smaller than 10 dBz. At the W-band, the number of vertical wind retrievals reduces rapidly after 14:12 UTC, when the Dm suddenly drops from around 2 to around 1 mm. Similarly the drop in Dm from around 13:58 to 14:00 UTC is matched by a reduction in the number of vertical wind retrieval points at the W-band. This follows what was predicted by the theory in Fig. 3, where the vertical wind retrieval at the W-band is unlikely to succeed at a Dm lower than 1.2 mm, although this has some dependency on the noisiness of the data and the shape of the drop size distribution. As discussed in Sect. 2, this increased coverage (and therefore reliability) in the vertical wind retrieval will help improve the retrieval of other more complex microphysical parameters such as the drop size distribution.
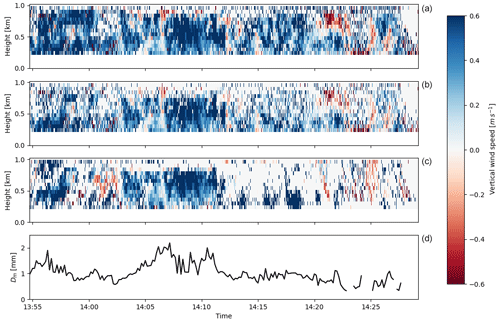
Figure 6Colours show the retrieved wind speed using the Mie notch technique with (a) the G-band radar, (b) the G-band radar requiring the first two Mie minima, and (c) the W-band radar. Panel (d) shows the Dm time series retrieved from disdrometer observations.
It can be seen throughout Fig. 6b (but particularly from 14:15 to 14:25 UTC) that the number of points using two G-band Mie notches is (as expected) smaller than the overall number of retrieved points. The difference in the number of retrieved points is largely toward the top of the liquid portion of the cloud. This is due to the large amount of attenuation suffered by the G-band, which quickly prevents the second G-band Mie notch from being resolved well compared to the noise. This is also why the two Mie notch retrievals miss some of the points that the W-band does manage to retrieve toward the top of this layer. While the accuracy of the vertical wind retrieval cannot be verified here, there will be a reduction in the uncertainty in the retrieved vertical wind (by a factor of ) due to the extra Mie notch included in the retrieval. The presence of noise in the Mie notches makes accurate retrieval of the exact minima difficult, and having two minima helps to reduce the errors associated with this noise. Further, the two Mie notches improve the reliability of the retrieval technique; as the spectra are noisy, it is possible, no matter how rigorous the procedures in place, to mistake a spurious, noisy minimum for a genuine Mie minimum. When the first two Mie notches are included within the retrieval, the fact that the distance between them is known greatly improves our ability to filter out inaccurate data.
4.2 Drop size distribution retrieval
Figure 7 shows the optimal estimation of the DSD using triple-frequency radar observations in the top row, dual-frequency (no G-band included) radar observations in the second row, and dual-frequency (no W-band included) radar observations in the bottom row. Example retrievals at the two time stamps are shown here, one where the G-band is expected to help improve the retrieval and one where the impact of the G-band's inclusion is expected to be less. One major effect of not including the G-band observations is the inability to retrieve the vertical wind speed (as is the case for the low-Dm example in Fig. 7c, d, g, h, k, and l); this reduces how constrained that parameter is, thereby increasing the possibility of the optimal estimation converging to a badly fitted solution. For this specific example, there is a 0.21 m s−1 difference in the retrieved wind speed between the two methods; this is enough to result in substantial differences in the retrieved rainfall rate and Dm.
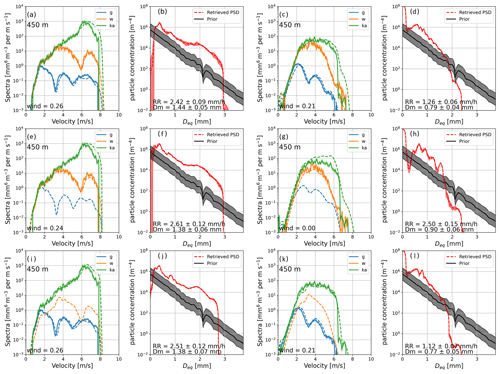
Figure 7Optimal estimation of DSD using Ka-, W-, and G-band radars (a–d); using Ka- and W-band radars only (e–h); and using Ka- and G-band radars only (i–l). Panels (a), (c), (e), (g), (i), and (k) show observed (solid lines) and forward modelled (dashed lines) Doppler radar spectra at a height of 450m. Panels (b), (d), (f), (h), (j), and (l) show the a priori and retrieved DSD; uncertainties are shown in the shaded areas. The six right-hand plots show a small-Dm case at 14:17:23 UTC; the six left-hand plots show a large-Dm case at 14:10:16 UTC.
It can be seen in Fig. 7 that there is a substantial difference in the retrieved DSD for the smallest particles between the Ka–W and triple-frequency methods. For the small-Dm case (panels c, d, g, and h), the retrieval without the G-band has a sudden drop in the retrieved number concentration of droplets at around 0.4 mm. This is a direct consequence of the vertical wind not being retrieved in the no-G-band method, moving the spectra to the right in panel (g) and thereby reducing the spectral reflectivity at a smaller Doppler velocities. Further, the non-Rayleigh scattering shown in the simulated spectra in Fig. 1 adds extra information about the size of the droplets that allows the OE retrieval of the DSD to better characterise the smallest particles. This non-Rayleigh scattering (a departure from the Rayleigh counterpart of more than 3 dB in the backscatter cross section) begins for droplets with a diameter of 0.37 mm and brings a strong constraint to the retrieval of the DSD at those smaller sizes.
The second way in which the methods differ is in the reduction in error of the retrieved DSD. It can be seen in Fig 7d that the error in the DSD (red-shaded region around the dashed line) is smaller than that of the error in the DSD in the Ka–W retrieval in Fig. 7h. This is most noticeable in the 0.3 mm region, where the error in the Ka–W retrieval is larger than that in the Ka–W–G retrieval and the Ka–G retrieval. Part of the cause of this error is the incorrect placement of the Ka- and W-band spectral observations due to the incorrect vertical wind speed. This region is also where the G-band is providing a large differential reflectivity signal that would help to reduce the error.
The bottom two panels on the right-hand side show the same retrieval with the Ka- and G-bands to demonstrate the improvement that can be attained with a dual-frequency retrieval including the G-band. While the retrieved DSD in Fig. 7l does not produce spectra that fit the observed spectra (W-band simulated spectra in Fig. 7k) as well as in the triple-frequency case (Fig. 7c), it is still more similar to the DSD and forward modelled spectra from the triple-frequency case than the Ka–W retrieval is to the triple-frequency case. The similarity between the Ka–G retrieval and the triple-frequency retrieval (the retrieval with the most information) suggests that the Ka–G retrieval is closer to the truth than the Ka–W retrieval; this cannot, however, be verified without independent high-quality measurements of the DSD.
For the six left-hand panels in Fig. 7 (the large-Dm example), the reduction in the impact of the inclusion of the G-band when the vertical wind is retrievable by the W-band radar is clear to see. The Dm and rainfall rate are much more similar in this retrieval than for the small-Dm case. There is, however, still a difference in the retrieval of the smallest (less than 0.2 mm) droplets between the Ka–W and triple-frequency methods. However, the error in both is large, here making comparisons between the two methods difficult. As before, the retrieval using the Ka–G combination is similar to the triple-frequency method in almost every aspect. The values of Dm, RR, and vertical wind speed are all very similar between the two methods, and further, the DSD is also similar to that of both the Ka–W and triple-frequency retrievals.
4.3 Characteristic diameter retrieval using dual-Doppler velocity
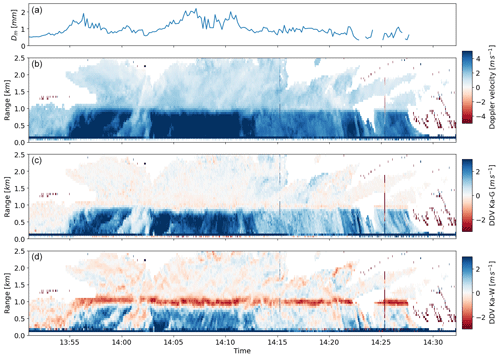
The improvements that the G-band can make to the dual-Doppler velocity are clearly shown in Fig. 8. The Ka-band Doppler velocity is shown in the top panel, and the DDV between the Ka- and G-bands is shown in the middle panel. The DDV here is very large, and the maximum values reaching almost 4 m s−1 are equivalent to the peak for a gamma distribution with μ = 0 where the maximum occurs at a Dm of slightly over 1 mm. The DDV in the ice cloud above the melting layer is consistently close to 0 m s−1, as is expected in ice and snow where the particle fall speeds are smaller, and therefore the difference between the Ka-band and the G-band is impacted less by non-Rayleigh effects. The values of DDV for the Ka–W combination are generally much lower than for the Ka–G combination, rarely exceeding 2 m s−1, and at some points (for example, the light-rain period between 14:13 and 14:22 UTC) the Ka–W DDV is near zero. Any retrieval made at this time would be highly unreliable if we used the Ka–W combination alone.
The DDV values taken close to the ground (that is, the first usable range gate at 450 m in order to best match the disdrometer observations) are compared to the disdrometer observations of Dm. These are shown in Fig. 9a for the Ka–G combination and in Fig. 9c for the Ka–W combination. They are plotted together with theoretical curves of Dm versus DDV, assuming gamma distributions with μ values of 0, 2, and 6. It can be seen that the observations are scattered through the region predicted by theory at large Dm and DDV, but for Dm between about 0.5 and 1 mm, the observations generally underestimate the DDV expected from theory. This underestimation could be due to the inability of the disdrometer to measure droplets smaller than 0.3 mm, which will skew the mass mean diameter to larger values than should be measured.
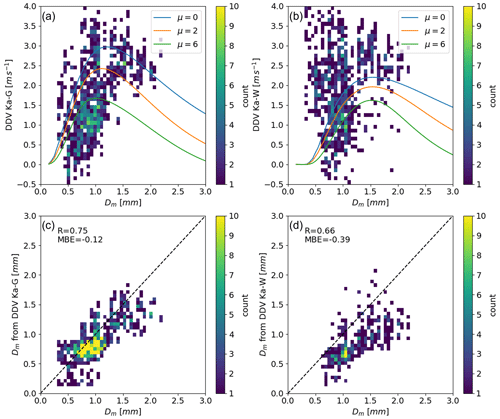
Figure 9Panel (a) shows a density plot of radar-observed DDV between the Ka- and G-bands and Dm as retrieved by the Joss–Waldvogel impact disdrometer; overplotted are theoretical curves for the relationship between DDV and Dm using a gamma distribution and the values of μ shown. DDV were taken from the lowest-usable bin in the radar observations. Panel (b) is the same as panel (a) except that the DDV is for a Ka–W combination. Panel (c) shows a density plot of the retrieved Dm from the Ka–G DDV radar observations and the disdrometer-observed Dm. Panel (d) is the same as panel (c) except for the Ka–W DDV observations.
To investigate this, a simple Dm retrieval was used based on lookup tables generated from the NASA GPM disdrometer observation network. The lookup tables related the Dm measured by the disdrometers and the Doppler velocity simulated from those observations with the DDV calculated from forward modelled Doppler spectra based on the DSDs observed by the disdrometers.
When the Dm is retrieved from the Ka–G DDV observations using the lookup tables, there is a much better fit between the radar observations and the disdrometer observations (see Fig. 9c) compared to the relationship between the DDV observations and the disdrometer observations with the theoretical curves in Fig. 9a. This is likely because the retrieval is based on disdrometer observations (although these are largely two-dimensional video disdrometers (2DVDs) rather than impact disdrometers). Williams et al. (2000) show that there is good agreement between measurements of 2DVDs and the Joss–Waldvogel impact disdrometer (JWD) for DSDs with a low Dm, while for larger Dm this relation breaks down, and the impact disdrometer measures the Dm to be larger than the 2DVD. This relationship is also shown in Fig. 9c, where the radar-based observations of Dm retrieved are smaller than the JWD-based observations. It is therefore likely that the overestimation of Dm by the disdrometer is the cause of the theoretical curves in Fig. 9a not fitting well for small values of Dm. This also raises a potential issue with the use of disdrometers or disdrometer-based retrieval methods for DSDs with a small Dm. Because the theoretical curves converge for small Dm, it is likely that below a Dm of around 0.7 mm, a retrieval based on theoretical gamma distributions (with any reasonable value of μ) will be an improvement on disdrometer-based retrievals.
For the comparison between theoretical DDV measurements and Dm and the comparison between Dm calculated from a lookup table and the observed Dm, the Ka–G combination is closer to the expected answer than the Ka–W combination is. The Ka–W measurements are generally more spread out and fit less closely to the theoretical curves in Fig. 9b. This is a symptom of the smaller dynamic range in the Ka–W measurements, meaning that the noisiness in the retrieved measurements is more apparent. This effect can also be seen in the retrieved Dm (shown in Fig. 9d) for the Ka–W. Again, there is an increased spread of the Dm in the y axis compared to the Ka–G retrieval in Fig. 9c. This increased spread is combined with an increased negative bias; the reasons for this negative bias are likely the same as the reasons for the negative bias in the Ka–G measurements (as described above) but exacerbated due to the decreased dynamic range of the Ka–W DDV measurements.
4.4 Retrieval of extensive drop size distribution properties
After retrieving intensive quantities (i.e. factors affecting the shape of the DSD such as Dm or μ), extensive quantities (i.e. factors dependent on the intensity of the DSD) such as rainfall rate or LWC can be retrieved. One method of retrieving the LWC involves using the differential attenuation between two frequencies (Hogan et al., 2005).
Here the retrieval of path-integrated attenuation is shown with the inclusion of the G-band radar. Because the G-band radar is strongly attenuated, it often does not see through to the top of ice clouds, and so the common methods of comparing the reflectivity of small ice crystals between frequencies or matching the Rayleigh regions of spectra (Tridon et al., 2013) cannot be used to retrieve differential attenuation. Instead, the differential attenuation induced by the rain between 450 and 950 m (Fig. 10) is computed using the method described in Sect. 3. At each range gate, the attenuation is calculated based on the simulated DSD. The two case studies show the added value of the inclusion of the G-band for DSDs with low Dm. In the first case (top row), the Dm is below 1 mm through most of the column considered (just surpassing 1 mm at the last range gate). With these sizes, the G-band attenuation is considerably greater than the attenuation at the W-band, at times even more than twice the attenuation at the W-band. The second case (bottom row) shows an example with larger characteristic diameters; here the added value from the G-band is smaller and the attenuation estimated at the G-band and W-band is very similar, although the attenuation at the G-band is still consistently greater than that at the W-band.
In the first case (Fig. 10a), the stronger differential attenuation at Ka–G across this small (500 m) layer enables the retrieval of LWC with greater accuracy compared to the Ka–W combination. With an average Dm of 0.86 mm and an average LWC of 0.23 g m−3 across the layer, the two-way differential attenuation across the 500 m layer is 5.2 dB km−1 for the Ka–G combination, whereas it is 3.1 dB km−1 for the Ka–W combination; this is in line with the expectations for each frequency combination shown in Fig. 4a, where the Ka–G combination should have a differential attenuation just less than twice that of the Ka–W combination. This means that for DSDs such as this, consisting of small droplets, the Ka–G combination should result in an accuracy almost 2 times more accurate than the Ka–W combination; however, this improvement cannot be verified here due to a lack of supporting measurements.
In the second case (Fig. 10b), the average differential attenuation for both the Ka–G and Ka–W combinations is larger across this very shallow layer. The average Dm is 1.70 mm, and the average LWC is 0.54 g m−3 for this case. This equates to a two-way differential attenuation of 5.7 dB km−1 for Ka–G and a two-way differential attenuation of 3.8 dB km−1 for Ka–W. While the Ka–G and Ka–W measurements are more similar than in the small-Dm case, there is still an increase in the differential attenuation while using the G-band (as can also be seen in Fig. 4a), again giving the Ka–G combination the ability to be more accurate for profiling LWC in the atmosphere.
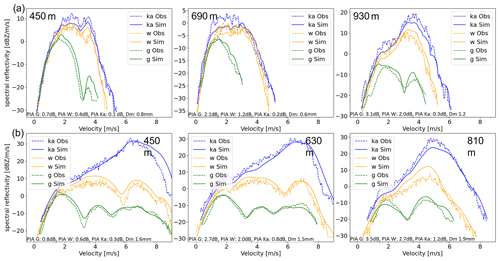
Figure 10Observed (dashed lines) and simulated (solid lines) spectra at three levels within the liquid portion of the cloud. Attenuation, Dm, and LWC calculated from the simulated DSD are annotated for each range gate shown. Panel (a) shows a case at 14:01:00 UTC with a small Dm; panel (b) shows a case at 14:07:00 UTC with a large Dm.
In both examples, the differential attenuation matches the expectations from the theory presented in Sect. 2. For the first example, the differential attenuation between the G-band and the W-band is large, while the LWC for each range gate is small. This leads to small values of total attenuation even in the G-band. For the second example, the observations again match the theory closely in that the two-way differential attenuation between the W- and G-bands is significantly reduced. This should be the case, as the G–W differential attenuation is significantly reduced at a Dm of 1 mm and becomes negative at 2.5 mm. However, because of the greater amount of liquid water in the column, the overall value of the average differential attenuation in the layer is still larger than that of the small-Dm case.
G-band radars can provide substantial extra information for rain microphysical characterisation through both the non-Rayleigh scattering from small droplets and the associated Mie notches and the increased attenuation experienced at this frequency. The added value of using the G-band in combination with other frequencies is demonstrated through a number of retrieval methods. The improvement in the vertical wind retrieval has a solid foundation: the two Mie notches occur in the 200 GHz G-band spectra corresponding to raindrops with sizes smaller than for the Mie notch in the W-band spectra. This means that the vertical wind can be retrieved from the G-band spectra at much lower rainfall rates and droplet diameters than when using the W-band, thus enabling retrievals of the vertical wind to be extended to regimes of smaller raindrop size and lower typical rain rates. Moreover, the presence in some spectra of two Mie notches means that there is increased precision and certainty in the value of the vertical wind that has been retrieved. This is especially important for turbulence-broadened spectra or for noisy spectra where the exact location of the Mie minima may be more uncertain. The improvement in the DSD retrieval is more pronounced for the smallest droplets (i.e. for droplets with diameters less than 0.5 mm). This has an impact on the values of the rainfall rate and the mass-mean droplet diameter calculated from the DSD. For the retrieval of mass-mean diameter using the DDV method, the G-band adds considerable value for the smallest values of Dm; this is especially important as these are the cases where disdrometers have trouble retrieving an accurate value for the mass-mean diameter. The increased dynamic range for the Ka–G DDV pairing reduces the uncertainty in the retrieval of the Dm for a given error in the Doppler measurements.
There is a similar enhancement in the dynamic range of differential attenuation. Compared to the W-band, the increase in the value of differential attenuation for large diameters is relatively small. However, for low rainfall rates and, in particular, low values of LWC, the improvement in the differential attenuation between the Ka- and G-bands compared to the Ka- and W-bands is very impactful and allows for the reliable retrieval of LWC down to much lower values of LWC. Overall, the use of G-band radar in appropriate environments (e.g. cold and dry air) has the potential to enable more accurate retrievals of LWC, DSDs, and Dm and to extend such retrievals to regimes of drizzle and low rain rates.
Data are available from the Zenodo online repository at https://doi.org/10.5281/zenodo.5548069 (Courtier et al., 2021).
BMC wrote the paper and conducted the analysis. AB supervised the data analysis. AB and KM contributed to the retrieval methods and analysis. AB and KM contributed to the writing and editing of the paper.
The contact author has declared that none of the authors has any competing interests.
Publisher’s note: Copernicus Publications remains neutral with regard to jurisdictional claims made in the text, published maps, institutional affiliations, or any other geographical representation in this paper. While Copernicus Publications makes every effort to include appropriate place names, the final responsibility lies with the authors.
The authors acknowledge the financial support of the UK NERC project GRACES and the National Centre for Earth Observation.
The work done by Benjamin M. Courtier and Alessandro Battaglia was funded by the UK NERC project GRACES (G-band RAdar for Cloud and prEcipitation Studies; grant no. RP16G1219). The work by Kamil Mroz was performed at the University of Leicester under grant no. RP1890005 from the National Centre for Earth Observation.
This paper was edited by Stefan Kneifel and reviewed by two anonymous referees.
Battaglia, A., Westbrook, C. D., Kneifel, S., Kollias, P., Humpage, N., Löhnert, U., Tyynelä, J., and Petty, G. W.: G band atmospheric radars: new frontiers in cloud physics, Atmos. Meas. Tech., 7, 1527–1546, https://doi.org/10.5194/amt-7-1527-2014, 2014. a, b, c, d
Battaglia, A., Kollias, P., Dhillon, R., Roy, R., Tanelli, S., Lamer, K., Grecu, M., Lebsock, M., Watters, D., Mroz, K., Heymsfield, G., Li, L., and Furukawa, K.: Spaceborne Cloud and Precipitation Radars: Status, Challenges, and Ways Forward, Rev. Geophys., 58, e2019RG000686, https://doi.org/10.1029/2019RG000686, 2020. a
Cooper, K. B., Rodriguez Monje, R., Millan, L., Lebsock, M., Tanelli, S., Siles, J. V., Lee, C., and Brown, A.: Atmospheric Humidity Sounding Using Differential Absorption Radar Near 183 GHz, IEEE Geosci. Remote S., 15, 163–167, https://doi.org/10.1109/LGRS.2017.2776078, 2018. a
Courtier, B., Westbrook, C., Battlaglia, A., Huggard, P., Walden, C., McCusker, K., and Rumi, E.: Triple-frequency (Ka-, W- and G-band) radar observations of a light precipitation event, Zenodo [data set], https://doi.org/10.5281/zenodo.5548069, 2021. a
Courtier, B. M., Battaglia, A., Huggard, P. G., Westbrook, C., Mroz, K., Dhillon, R. S., Walden, C. J., Howells, G., Wang, H., Ellison, B. N., Reeves, R., Robertson, D. A., and Wylde, R. J.: First Observations of G-Band Radar Doppler Spectra, Geophys. Res. Lett., 49, e2021GL096475, https://doi.org/10.1029/2021GL096475, 2022. a, b, c, d
Firda, J. M., Sekelsky, S. M., and Mcintosh, R. E.: Application of Dual-Frequency Millimeter-Wave Doppler Spectra for the Retrieval of Drop Size Distributions and Vertical Air Motion in Rain, J. Atmos. Ocean. Tech., 16, 216–236, 1999. a, b, c
Giangrande, S. E., Luke, E. P., and Kollias, P.: Automated retrievals of precipitation parameters using non-Rayleigh scattering at 95 GHz, J. Atmos. Ocean. Tech., 27, 1490–1503, https://doi.org/10.1175/2010JTECHA1343.1, 2010. a
Hogan, R. J.: A variational scheme for retrieving rainfall rate and hail reflectivity fraction from polarization radar, J. Appl. Meteorol. Clim., 46, 1544–1564, https://doi.org/10.1175/JAM2550.1, 2007. a
Hogan, R. J., Gaussiat, N., and Illingworth, A. J.: Stratocumulus Liquid Water Content from Dual-Wavelength Radar, J. Atmos. Ocean. Tech., 22, 1207–1218, 2005. a, b
Kidd, C.: Satellite rainfall climatology: A review, Int. J. Climatol., 21, 1041–1066, https://doi.org/10.1002/joc.635, 2001. a
Kollias, P., Lhermitte, R., and Albrecht, B. A.: Vertical air motion and raindrop size distributions in convective systems using a 94 GHz radar, Geophys. Res. Lett., 26, 3109–3112, https://doi.org/10.1029/1999GL010838, 1999. a, b
Lamer, K., Oue, M., Battaglia, A., Roy, R. J., Cooper, K. B., Dhillon, R., and Kollias, P.: Multifrequency radar observations of clouds and precipitation including the G-band, Atmos. Meas. Tech., 14, 3615–3629, https://doi.org/10.5194/amt-14-3615-2021, 2021. a
Lhermitte, R.: Attenuation and Scattering of Millimeter Wavelength Radiation by Clouds and Precipitation, J. Atmos. Ocean. Tech., 7, 464–479, https://doi.org/10.1175/1520-0426(1990)007<0464:AASOMW>2.0.CO;2, 1990. a
Lhermitte, R. M.: Observation of rain at vertical incidence with a 94 GHz Doppler radar: An insight on Mie scattering, Geophys. Res. Lett., 15, 1125–1128, https://doi.org/10.1029/GL015i010p01125, 1988. a, b
Mason, S. L., Chiu, J. C., Hogan, R. J., and Tian, L.: Improved rain rate and drop size retrievals from airborne Doppler radar, Atmos. Chem. Phys., 17, 11567–11589, https://doi.org/10.5194/acp-17-11567-2017, 2017. a, b
Mason, S. L., Hogan, R. J., Bozzo, A., and Pounder, N. L.: A unified synergistic retrieval of clouds, aerosols, and precipitation from EarthCARE: the ACM-CAP product, Atmos. Meas. Tech., 16, 3459–3486, https://doi.org/10.5194/amt-16-3459-2023, 2023. a
Matrosov, S. Y.: Characteristic raindrop size retrievals from measurements of differences in vertical doppler velocities at Ka- and W-band radar frequencies, J. Atmos. Ocean. Tech., 34, 65–71, https://doi.org/10.1175/JTECH-D-16-0181.1, 2017. a, b
Mead, J. B., McIntosh, R. E., Vandemark, D., and Swift, C. T.: Remote Sensing of Clouds and Fog with a 1.4-mm Radar, J. Atmos. Ocean. Tech., 6, 1090–1097, https://doi.org/10.1175/1520-0426(1989)006<1090:RSOCAF>2.0.CO;2, 1989. a
Mróz, K., Battaglia, A., Kneifel, S., D'Adderio, L. P., and Dias Neto, J.: Triple-Frequency Doppler Retrieval of Characteristic Raindrop Size, Earth Space Sci., 7, e2019EA000789, https://doi.org/10.1029/2019EA000789, 2020. a
Mróz, K., Battaglia, A., Kneifel, S., von Terzi, L., Karrer, M., and Ori, D.: Linking rain into ice microphysics across the melting layer in stratiform rain: a closure study, Atmos. Meas. Tech., 14, 511–529, https://doi.org/10.5194/amt-14-511-2021, 2021. a, b, c, d, e, f
Tian, L., Heymsfield, G. M., Li, L., and Srivastava, R. C.: Properties of light stratiform rain derived from 10- and 94-GHz airborne Doppler radars measurements, J. Geophys. Res.-Atmos., 112, D11211, https://doi.org/10.1029/2006JD008144, 2007. a, b, c
Tridon, F. and Battaglia, A.: Dual-frequency radar doppler spectral retrieval of rain drop size distributions and entangled dynamics variables, J. Geophys. Res., 120, 5585–5601, https://doi.org/10.1002/2014JD023023, 2015. a, b, c, d, e
Tridon, F., Battaglia, A., and Kollias, P.: Disentangling Mie and attenuation effects in rain using a Ka-W dual-wavelength Doppler spectral ratio technique, Geophys. Res. Lett., 40, 5548–5552, https://doi.org/10.1002/2013GL057454, 2013. a, b, c, d
Tridon, F., Battaglia, A., and Watters, D.: Evaporation in action sensed by multiwavelength Doppler radars, J. Geophys. Res.-Atmos., 122, 9379–9390, https://doi.org/10.1002/2016JD025998, 2017. a, b
Tridon, F., Battaglia, A., and Kneifel, S.: Estimating total attenuation using Rayleigh targets at cloud top: applications in multilayer and mixed-phase clouds observed by ground-based multifrequency radars, Atmos. Meas. Tech., 13, 5065–5085, https://doi.org/10.5194/amt-13-5065-2020, 2020. a, b
von Terzi, L., Dias Neto, J., Ori, D., Myagkov, A., and Kneifel, S.: Ice microphysical processes in the dendritic growth layer: a statistical analysis combining multi-frequency and polarimetric Doppler cloud radar observations, Atmos. Chem. Phys., 22, 11795–11821, https://doi.org/10.5194/acp-22-11795-2022, 2022. a
Williams, C. R., Kruger, A., Gage, K. S., Tokay, A., Cifelli, R., Krajewski, W. F., and Kummerow, C.: Comparison of simultaneous rain drop size distributions estimated from two surface disdrometers and a UHF profiler, Geophys. Res. Lett., 27, 1763–1766, https://doi.org/10.1029/1999GL011100, 2000. a
Williams, C. R., Beauchamp, R. M., and Chandrasekar, V.: Vertical Air Motions and Raindrop Size Distributions Estimated Using Mean Doppler Velocity Difference from 3- and 35-GHz Vertically Pointing Radars, IEEE T. Geosci. Remote, 54, 6048–6060, https://doi.org/10.1109/TGRS.2016.2580526, 2016. a


