the Creative Commons Attribution 4.0 License.
the Creative Commons Attribution 4.0 License.
Validation of ACE-FTS version 5.2 ozone data with ozonesonde measurements
Jiansheng Zou
Patrick E. Sheese
Chris D. Boone
Ryan M. Stauffer
Anne M. Thompson
David W. Tarasick
Two decades of ACE-FTS, the Atmospheric Chemistry Experiment – Fourier Transform Spectrometer, version 5.2 (v5.2) ozone data (2004–2023) are evaluated with ozonesonde data from across the globe. The biases between the ACE-FTS and ozonesonde measurements are first estimated by analyzing coincident data pairs. A second approach is taken for the validation by comparing the ACE-FTS and ozonesonde monthly mean time series, with the former generated by sampling the ACE-FTS data within latitude/longitude boxes (i.e., ± 5°/± 30°) surrounding the stations and calculating the monthly averages. The biases, correlations, variation patterns, and the mean states of the two time series are compared. The biases estimated in this way exhibit more consistent and smoother features than using the coincident pair method. The ACE-FTS and ozonesonde monthly mean time series are highly correlated and exhibit similar variation patterns in the lower stratosphere at all latitudes. The ACE-FTS instrument drifts for each station are assessed in terms of the long-term linear trends relative to ozonesondes, which, although highly stable, may have their own minor changes with time. The ACE-FTS ozone profiles exhibit in general high biases in the stratosphere for altitudes above ∼ 20 km, increasing with altitude up to ∼ 10 % at around 30 km. For altitudes between 20 km and the tropopause, biases of up to ± 10 % are found, depending on altitude and latitude with the largest biases found in the tropics and southern mid-latitudes. The ACE-FTS instrument drifts are generally non-significant overall in the stratosphere with high variation between the stations. Averaging the individual station instrument drifts within several latitude bands results in small non-significant drifts of within ± 1 %–2 % per decade in the northern mid-latitudes to high latitudes and the southern high latitudes. It also results in a positive but non-significant drift of up to 5 % per decade in the tropics and southern mid-latitudes, with overall uncertainties in this region ranging up to 5 %–10 % per decade (2σ level) in the low stratosphere. As part of this assessment, an analysis of ozonesonde measurement stability using ACE-FTS as a transfer standard is conducted and finds small step changes in ozonesonde response at some stations. These results are in general agreement with recent findings using other satellite data sources.
- Article
(22142 KB) - Full-text XML
-
Supplement
(14166 KB) - BibTeX
- EndNote
ACE-FTS, the Atmospheric Chemistry Experiment – Fourier Transform Spectrometer, launched aboard the Canadian satellite SCISAT-1 on 13 August 2003, has measured atmospheric constituents for 20 years (e.g., Bernath et al., 2005). The ACE measurement period (2004–present) overlaps the period of ozone recovery following the successful implementation of the Montreal Protocol in the late 1980s and its subsequent amendments, which prohibit the use of halogen-containing ozone-depleting substances (ODSs) on the global scale (Salawitch et al., 2019), preventing further ozone depletion in the atmosphere. Observational evidence shows that the declining trends in ozone stopped around 1997, and since 2000 ozone increases have been observed in the upper stratosphere and in total column ozone over the Antarctic as well (Salawitch et al., 2019; Steinbrecht et al., 2018). The reversal of the ozone trend is, however, not hemispherically symmetric, and the ozone recovery rate is 3–4 times slower than the rate of decline prior to the 1990s (Steinbrecht et al., 2018). In the lower stratosphere, ozone has exhibited declining trends between 60° S and 60° N (Ball et al., 2018). The mechanisms causing these ozone changes can be complex. Besides the reduction in releasing anthropogenic ODSs, climate change (Ball et al., 2020) plays a compounding role in that the increase of greenhouse gases (GHGs) causes cooling of the stratosphere, thus slowing the temperature-dependent ozone destruction processes and causing ozone increases in the upper stratosphere, while the increase of GHGs causes acceleration of the Brewer–Dobson circulation (BDC), bringing more low-ozone-concentration air from the troposphere to the low stratosphere. The negative ozone trends in the lower stratosphere from 60° S to 60° N, although appearing as non-significant, were further verified by Godin-Beekmann et al. (2022) using multivariable linear regression analyses of multiple independent merged satellite datasets. Using several merged satellite ozone datasets, Szeląg et al. (2020) investigated the seasonality of the ozone profile trends between 60° S and 60° N, confirming the positive trends in the upper stratosphere and revealing the strong variability of the sign of the ozone trend between positive and negative as a function of altitude and season in the equatorial region. These studies (e.g., Ball et al., 2018; Szeląg et al., 2020; Godin-Beekmann et al., 2022) are based on merged satellite datasets spanning multiple decades. The ACE-FTS data are part of some of these merged satellite datasets, e.g., GOZCARDS (Froidevaux et al., 2015) and SAGE-CCI-OMPS (Sofieva et al., 2017). In contrast, in Thompson et al. (2021; update in Stauffer et al., 2024) tropical ozonesondes were found not to show a net annual trend in the lowermost stratosphere (100–50 hPa). Although there are decreases of 5 %–15 % per decade in ozone in this region during July–September over stations such as Samoa, Paramaribo, Ascension, and Kuala Lumpur, the tropopause height during this period has increased more than 100 m per decade. When tropopause-height-referenced ozone columns are analyzed, the trend in the lowermost stratosphere disappears. These different conclusions for ozone trends in the lowermost stratosphere can be drawn depending on how the tropopause height is referenced.
A comprehensive validation study of ACE-FTS v4.1/4.2 ozone data in the stratosphere and mesosphere has been carried out with satellite instrument datasets by Sheese et al. (2022). This current study compares the new ACE-FTS v5.2 ozone data with global ozonesonde data to assess the data quality in the upper troposphere and lower stratosphere (UTLS). For the UTLS region, ozonesonde records have been widely used as a reference for validating other instruments such as satellite instruments (e.g., Thompson et al., 2021). Ozonesondes have a long history of use in ozone measurements; for example, Resolute Bay ozone sounding began routine recording in 1966 and has the longest record in the world (Tarasick et al., 2016). Despite its long history, the ozonesonde measurements have been experiencing hardware changes and processing corrections from time to time (Tarasick et al., 2021). Nevertheless, because of its reliability and its availability at low altitudes, some researchers (e.g., Adams et al., 2012; Bognar et al., 2019) have used ozonesonde data to extend satellite measurements such as ACE-FTS ozone profiles to the ground level to calculate the total column ozone (TCO) for ground-based comparisons. Ozonesonde data have often been used to estimate the biases and long-term stability of limb-viewing satellite ozone datasets such as the ACE-FTS v2.2 update (Dupuy et al., 2009), Aura-MLS (Microwave Limb Sounder) v2.2 (Jiang et al., 2007), MIPAS (Michelson Interferometer for Passive Atmospheric Sounding) IMK-IAA version V3O_O3_7 for the HR (High Resolution) period (July 2002–March 2004) (Steck et al., 2007), SCIAMACHY (SCanning Imaging Absorption SpectroMeter for Atmospheric CHartographY) v2.9 and v3.0 (Jia et al., 2015), OMPS (Ozone Mapping Profiler Suite) Antarctic data from both the Limb Profiler (LP) version 1 and Nadir Profiler (NP) version 1 (Kramarova et al., 2014), and SAGE III/ISS v5.1 ozone profile data (McCormick et al., 2020; Wang et al., 2020), as well as a collection of 14 limb scatter, limb emission, and solar occultation datasets (Hubert et al., 2016). Note that for solar occultation instruments such as ACE-FTS and SAGE III/ISS, there are fewer profiles (two profiles per orbit) than for other limb-viewing instruments, whose sampling densities are much higher, e.g., 240 profiles per orbit for Aura-MLS. When using coincident data pairs to compare satellite and ozonesonde data, there are no definitive criteria to select coincident data pairs. For limb emission or limb solar scattering instruments, it can be sufficient to use relatively tight temporal criteria such as time differences within ± 6 h, while for solar occultation instruments relatively relaxed criteria such as ± 24 h of time differences are often used (e.g., Dupuy et al., 2009; McCormick et al., 2020).
In recent years the data quality of ozonesonde measurements at some stations has been an issue. Stauffer et al. (2020) found that about 14 stations using electrochemical concentration cell (ECC) ozonesondes, primarily in Canada and the tropics, experienced TCO drop-offs after 2013. The drop-off was found to be associated with only one type of ECC device: that from the manufacturer Environmental Science (EnSci) after certain production lots (serial numbers) (Stauffer et al., 2022; Nakano and Morofuji, 2023). With the progress in understanding of the drop-off issue, Stauffer et al. (2022) showed that using recently updated data from 37 stations, which have been re-processed through the homogenization process (e.g., Ancellet et al., 2022), overall improvements in the long-term ozone data quality have been achieved, particularly for those at the Canadian sites. The ozonesonde network data continue to be a reliable data source with caveats only for a subset of drop-off stations in the tropics and subtropics (Stauffer et al., 2022).
In this study, the ACE-FTS version 5.2 ozone data spanning almost 20 years (2004–2023) are compared with the global ozonesonde data to derive the biases and drifts of ACE-FTS ozone measurements relative to the ozonesonde measurements. Section 2 describes the ACE-FTS ozone data products and the ozonesonde data from the four data centres: Network for the Detection of Atmospheric Composition Change (NDACC), World Ozone and Ultraviolet Radiation Data Centre (WOUDC), Southern Hemisphere ADditional OZonesondes (SHADOZ), and Harmonization and Evaluation of Ground-based Instruments for Free Tropospheric Ozone Measurements (HEGIFTOM). Section 3 introduces the method of selecting coincident data pairs; the method of generating ACE-FTS time series around an ozonesonde station; the formulae for calculating the biases and errors, the linear trends, and standard errors; and the formulae used for the aggregated averages. In Sect. 3, a summary of the drop-off analysis based on the ACE-FTS data is also given. This is the basis used to select stations for the data analyses presented in Sect. 4, including bias determination, time series comparisons, and drift determination. The conclusions are given in Sect. 5. In Appendix A and in the Supplement, details for the drop-off analysis are given.
2.1 ACE-FTS ozone data products
ACE-FTS is an infrared solar occultation instrument on board the Canadian satellite SCISAT-1, which follows a non-sun synchronous orbit with high inclination (Bernath et al., 2005). ACE circles the Earth approximately 15 times per day and takes two profile measurements per orbit with the highest density of samples towards high latitudes. This study uses the most recent ozone profile data from the ACE-FTS v5.2 (Boone et al., 2023), which evolved from previous versions, e.g., v2.2 (Boone et al., 2005), v3.0 through v3.5/3.6 (Boone et al., 2013), and v4.1/4.2 (Boone et al., 2020).
Initial ACE-FTS v1.0 ozone data were first validated with other satellite instruments (SAGE III/Meteor-3M and POAM III) (Walker et al., 2005). The ACE-FTS version v2.2 ozone update product was validated with nearly 20 satellite-borne, balloon-borne, airborne, and ground-based instruments including global ozonesondes to determine the ACE-FTS biases with respect to other instruments for the period 2004–2009 (Dupuy et al., 2009). In Sheese et al. (2017), ACE-FTS v3.5 data for O3, N2O, H2O, HNO3, and CO were compared with collocated data from MIPAS and Aura-MLS for the period February 2004 to April 2012, and the comparisons show that ACE ozone is within ± 5 % of MIPAS and Aura-MLS data in the mid-stratosphere and exhibits a positive bias of 10 %–20 % in the upper stratosphere. Sheese et al. (2022) extended the ACE-FTS ozone data validation study with five satellite datasets for both v3.5/3.6 and v4.1/4.2 to assess biases and drifts and concluded that v4.1/4.2 showed larger biases than v3.5/3.6 by 2 %–6 % between ∼ 22 and 42 km, but it is stable to within 1 % per decade, whereas v3.5/3.6 exhibited a significant negative drift on the order of 1 %–3 % per decade.
This work utilizes the ACE-FTS v5.2 ozone volume mixing ratio (VMR) profile data provided on a 1 km regular grid from 0.5 to 149.5 km with the actual retrieval extending from 5 to 95 km. An additional flag file, in which the data quality of each profile point is assigned a flag value from 0 to 9 based on Sheese et al. (2015), was used to filter the data. The ACE-FTS profile data with flag values greater than 2 were removed such that bad profiles with excessive retrieval statistical fitting error, physically unrealistic outliers, and known instrumental/processing errors were discarded (Sheese et al., 2015).
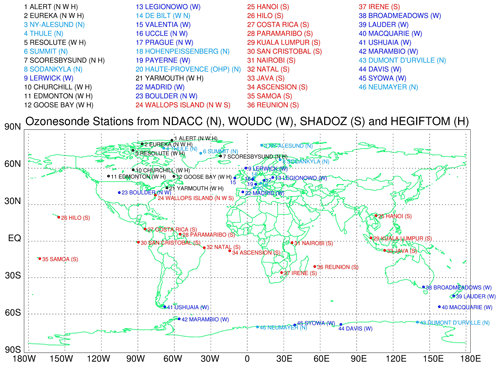
Figure 1The ozonesonde stations from the four networks: NDACC (N), WOUDC (W), SHADOZ (S), and HEGIFTOM (H). At some stations multiple data sources are available with the last letter denoting the data source used in the analysis. The stations from NDACC (N) are written in light blue, from WOUDC (W) in dark blue, from SHADOZ (S) in red, and from HEGIFTOM (H) in black. Stations 14–20 are all located in Europe, and their names are listed at the top of the figure.
2.2 Ozonesonde data
An ozonesonde is a small, lightweight, balloon-borne instrument consisting of a pump and an ozone sensing cell coupled to a standard meteorological radiosonde to measure ozone concentration and ambient air pressure, temperature, humidity, and other meteorological parameters. The measurement principle is based on the redox reaction of ozone with potassium iodide in aqueous solution, which releases free iodine molecules I2 (e.g., Tarasick et al., 2021). With the free I2 molecules in the sensing cell and the anode and cathode at the two ends, an electric current, which is proportional to the ozone molecule amount, is generated, and this measurement can be converted to the ozone amount (Tarasick et al, 2021). Different ozonesonde instrumentation has been used in the networks and over time. In the case of ozonesondes at Canadian sites, Brewer–Mast-type ozonesondes were predominant before the 1980s; thereafter ECC ozonesondes have been used. The ozonesonde data used in this study are all ECC type except at the Hohenpeißenberg station, where Brewer–Mast ozonesondes are used. The ozonesonde measures ozone concentrations from the ground up to ∼ 32 km before the balloon bursts. The vertical intervals of the data records may vary from a few metres to hundreds of metres. However, these data are not necessarily independent, and the vertical resolution is dependent on the response time of the sonde and the rise rate of the balloon and is therefore about 100–150 m.
The most recent quality-assured ozonesonde data reported from four data centres, NDACC, WOUDC, SHADOZ, and HEGIFTOM, are used in this validation study. The locations of those ozonesonde stations are listed in Fig. 1 and Table 1. The SHADOZ ozonesonde data (Witte et al., 2017, 2018; Thompson et al., 2017; Sterling et al., 2018), managed by NASA GSFC, are composed of a network of ozonesonde stations operating in the tropics, subtropics, and the Southern Hemisphere. The ozonesonde data in the tropical area are all taken from SHADOZ. The extratropical sondes are taken from NDACC and WOUDC, with the former managed by a steering committee under which various working groups are responsible for the access and standardization of the data, with the latter operated by the Meteorological Service of Canada (MSC), a branch of Environment and Climate Change Canada (ECCC). For those stations having both NDACC and WOUDC datasets, only the dataset with the larger volume is used (see Table 1). For the Canadian sites and Greenland's Scoresbysund, the data downloaded from HEGIFTOM, which are the products after the recent homogenization, are finally used in the analysis.
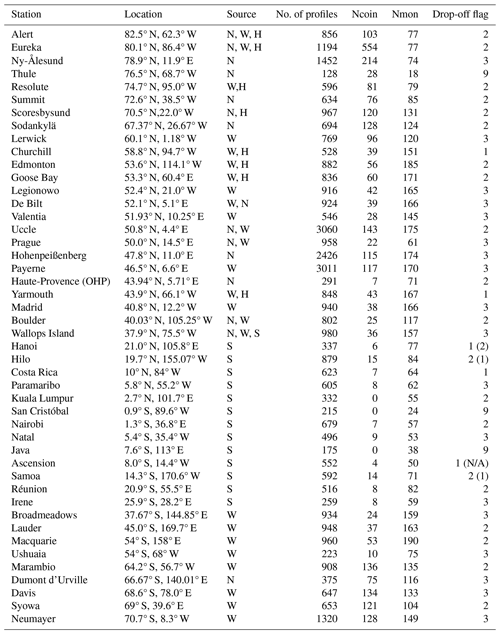
Table 1The ozonesonde stations from the NDACC (N), WOUDC (W), SHADOZ (S), and HEGIFTOM (H) networks indicated by the letter in the parentheses. For some stations with multiple sources, the last letters in column 3 indicate the data sources used in the study. Column 4 denotes the numbers of ozonesonde measurements during 2004–2023, column 5 the numbers of coincident data pairs, and column 6 the numbers of common months in the ozonesonde and ACE-FTS monthly mean time series. Column 7 lists the drop-off flags: 1 for drop-off and 2 for non-drop-off stations as identified in Appendix A, 3 for not subject to drop-off analysis and deemed as non-drop-off stations, and 9 as having issues of data gaps in analysis. The stations indicated by asterisks are those having different drop-off flags determined in this study and in Stauffer et al. (2022) (Table A1) with the latter indicated in parentheses. Stations having insufficient comparison points are marked by N/A.
In the analysis of ozonesonde records, the first step is to reject bad data points such as negative or excessively large values of ozone partial pressure (typically occurring at only a few stations) and to unify the units of temperature, pressure, geopotential height, altitude, and ozone partial pressure. In this study, there is no limit on the data altitude (e.g., including data points above 10 hPa (32 km) and data profiles with top altitudes below 30 hPa (25 km)), thus allowing more data to be used at lower altitudes while continuing examination of profiles at high altitudes (e.g., > 32 km). In the results the data points at top altitudes sometimes appear to be outliers, and it is due to the limit at high-altitude measurements before the balloon bursts. However, these top-altitude thresholds are not fixed. The next step is to apply a low-pass filter to get smoothed ozonesonde profiles at the ACE-FTS regular 1 km grid points. A Gaussian function was applied to the ozonesonde profile data, where Δz is the distance between an ozonesonde data point and an ACE-FTS point on the regular 1 km grid, s set to be 1 km, which makes a data point at 1 km distance have a relative weighting coefficient to be 0.61 in comparison with a data point at 0 km distance. Other similar but slightly different approaches for the smoothing (convolution) of the high-vertical-resolution ozonesonde data have been used in other studies (e.g., Dupuy et al., 2009; Kar et al., 2007). Thus, the smoothed ozonesonde profile data have the same grid as the ACE-FTS, ready for the calculations in the next sections.
3.1 Determining the biases using coincident data
The first validation task for this work is to determine the biases of the ACE-FTS ozone profiles versus coincident ozonesonde measurements. As often applied for satellite validations (e.g., Jiang et al., 2007; Dupuy et al., 2009), the method of using coincident data, i.e., sets of data pairs from the two instruments at close times and locations, to calculate the ensemble mean differences, is used in this study. As there are no perfectly coincident pairs (Sheese et al., 2021), the differences calculated from these coincident pairs actually consist of contributions from the random and systematic errors of the two instruments, the sampling error due to the mismatch in time and space of the coincident pair, which is also called the “geophysical variability” or the “natural variability”, and the smoothing error due to the different footprints of the measurements (Laeng et al., 2022). Geophysical variability is impacted by the choice of coincidence criteria for the data pairs. Intuitively, the smaller the temporal and spatial separations are, the lower the geophysical variability is, but on the other hand, fewer sampled data are used. A balance is required, whether setting stricter or more relaxed criteria. Sheese et al. (2021) showed that the ozone geophysical variability is independent of the chosen time criterion up to 12 h in the lower stratosphere, and conversely, in the upper stratosphere the geophysical variability tends to be independent of the chosen distance separation up to within 2000 km. In a case study, Laeng et al. (2022) showed that the geophysical variability grows with time difference for values smaller than 5 h but becomes stabilized for time differences larger than 10 h; as for the spatial differences, the geophysical variability increases with the spatial distance and becomes exceptionally large as spatial distance exceeds a certain threshold, such as 1000 km. Therefore, the spatial difference should be limited. Although these results are derived from high-resolution models, they provide some insight into choosing coincident pairs.
As a solar occultation sounder, ACE has sparse sampling in time and space (∼ 15 sunrise and 15 sunset occultations per day), and due to the ACE orbit the measurements are densest towards high latitudes and sample less frequently at low latitudes. If coincidence criteria are set too tightly, there will be few coincident data pairs for many stations at lower latitudes. In this study, the upper limits are set for time differences of within ± 24 h and for latitude/longitude ranges of ± 5°/± 15° with adjustments depending on the latitude (see Sect. 4.1). After collecting the coincident data pairs, each individual difference is calculated, where z is the altitude, N(z) the number of coincident pairs at z, and the pair (ACEi(z), Sondei(z)) is the ith coincident ACE-FTS and ozonesonde measurements, e.g., VMR values, at z. The mean absolute difference profile is obtained by . For simplicity since the variables are always a function of z, the argument z is omitted in the following formulae. The mean relative difference profile is thus given by
, where the individual relative difference is calculated as
, and the denominator is the ensemble mean of the ACE-FTS and ozonesonde values to suppress possible impacts from some outliers (Sheese et al., 2022). Letting σ and σrel be the debiased standard deviations of δi and time series, , in a similar way, we calculate σrel. The standard errors of the estimated means and are and .
3.2 ACE-FTS and ozonesonde monthly mean time series
Besides using “instantaneous” coincident pairs, the monthly mean comparison method is utilized for bias assessment in this study. For an ozonesonde station, the monthly mean time series can be calculated from its records. Typically, the frequency of ozonesonde launches is about once per week for most stations. For the comparison, the ACE-FTS data points within certain latitude and longitude ranges surrounding each of the ozonesonde stations are used to generate the monthly average time series.
In choosing the latitude/longitude range with the ozonesonde station at its centre, the widths of the boxes were examined to test the results. The latitude width was chosen as ± 5° of the ozonesonde station latitude. Various values were tried for the longitude widths: ± 10, ± 20, ± 30, and ± 45°. Because of the generally zonal distribution of atmospheric species, the ACE-FTS time series generated using these longitude ranges capture roughly similar temporal variations of timescales of several months with differences in detailed features at smaller timescales. For comparison with ozonesonde records that will be averaged monthly, the longitude range of ± 30° was selected for this study as a trade-off between collocating with the ozonesonde station and obtaining sufficient data points. Figure 2a and b are examples of monthly mean time series at Nairobi and Hohenpeißenberg stations, representative of low and mid-latitude stations, showing the ACE-FTS and ozonesonde records at 23.5 km. Nairobi is located near the Equator, where ACE has fewer samples than at higher latitudes, such as near Hohenpeißenberg. Also, 23.5 km is an altitude where active atmospheric dynamic motions occur. The Nairobi time series is characterized by the equatorial quasi-biennial oscillation (QBO), and the Hohenpeißenberg time series shows the annual cycle strongly. Both the ACE-FTS and ozonesonde time series agree very well at these two stations. The absolute and relative differences between the two time series can be derived using the same formulae outlined in Sect. 3.1 by treating the same months as coincidences.
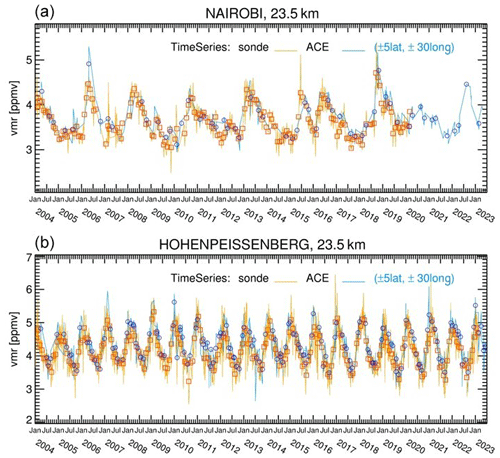
Figure 2The ACE-FTS ozone VMR time series (blue curves) from the data points at 23.5 km collected over the areas of the latitude/longitude range of ± 5°/± 30° around Nairobi (1.3° S, 36.8° E) (a) and Hohenpeißenberg (47.8° N, 11.0° E) (b) together with the monthly means (blue circles). Also shown are the corresponding ozonesonde records (yellow curves) with the monthly means (red squares).
3.3 The linear trend estimation
During the ACE mission (2004–present), ozone is in its recovery phase (e.g., Steinbrecht et al. 2018). Estimation of the ACE-FTS instrument long-term drifts relative to the ozonesonde measurements is another objective of this study. A linear model is chosen for the instrument drift. This is in line with the recommendation of the LOTUS (Long-term Ozone Trends and Uncertainties in the Stratosphere) regression model, in which long-term ozone trends after 2000 are fitted as linear trends (SPARC/IO3C/GAW, 2019). As a result, the instrument drifts are also fitted with linear trends. The ozone time series contain not only long-term trends, but also other temporal variation components such as annual and semi-annual cycles, the QBO, and El Niño–Southern Oscillation (ENSO). One can separate the linear trends from the cyclic components by employing multivariable linear regression to the ozone time series (Eckert et al., 2014; Moreira et al., 2016; Toihir et al., 2018). In the ACE-FTS time series (as generated in this study), there are often data gaps in certain months, and the gaps occur yearly throughout the entire mission, because the ACE orbit essentially repeats every year. Therefore, there may not be enough data points to emulate the cyclic components at some latitudes. Since the annual cycle is the largest temporal component outside of the equatorial region, deseasonalized time series are used to calculate the linear trends (SPARC/IO3C/GAW, 2019). An annual cycle was generated by averaging the data for each month over the entire period, which allows data gaps in certain months, and then was removed from the monthly mean time series, resulting in deseasonalized monthly mean time series. Figure 3a and b are examples of deseasonalized time series for Nairobi and Hohenpeißenberg at 23.5 km derived from the data in Fig. 2a and b, respectively. At the Nairobi station, the QBO features are still dominant, while at the Hohenpeißenberg station, the annual cycles are largely removed, leaving residual signals of other temporal components with smaller amplitudes. As the time series are nearly 2 decades long, the shorter-term variations may have a small impact on the long-term trend estimation. For illustration, the lines shown in Fig. 3a and b are the linear trends obtained by fitting the differences between the ACE-FTS and ozonesonde deseasonalized time series, i.e., the ACE-FTS instrument drift relative to the ozonesonde (herein called the instrument drift). The calculation for the instrument drift is based on the formulae below.
Letting , i=1..., N represents a time series with time ti at month i, with yi the differences between the two deseasonalized monthly mean time series, a the initial difference term, and b the instrument drift. The simple least squares regression gives an estimate of b and a, and , where and are the means of yi and ti. The residual errors are , and the standard error of is
, with representing the 95 % confidence level for .
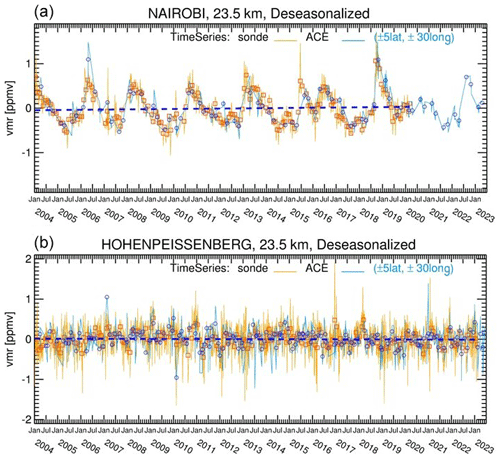
Figure 3The deseasonalized ACE-FTS (blue curves) and ozonesonde (yellow curves) ozone VMR time series at 23.5 km at the Nairobi (a) and Hohenpeissenberg (b) stations and their respective monthly means (blue circles and red squares). The dashed dark-blue lines are the linear fits to the differences of ACE-FTS and ozonesonde deseasonalized monthly mean time series, defined as the instrument drift.
3.4 Averaging over latitude bands
To highlight the validation results from more than 40 stations, individual comparisons are grouped into several latitude band averages. For each latitude band, the aggregated statistical quantities can be expressed in terms of the individual station quantities , σk, and Nk, i.e., the mean, standard deviation, and the number of measurement points at station k, respectively. The aggregated mean can then be expressed as the weighted average over the individual means, . There are different ways to choose wk, such as Nk or the inverse variance of the sample data (Sheese et al., 2022). This study uses the first approach, which is equivalent to averaging the entire dataset for each latitude band with all points equally weighted, and the resulting statistical formulae are straightforward. The standard deviation of the aggregated dataset is , and the standard error of the aggregated mean is
. For the calculation of relative differences, the formulae follow the above equations.
To obtain the aggregated mean of the instrument drifts from the individual stations within a latitude band, a formula for a scalar-weighted average (Hubert et al., 2016; Sheese et al., 2022) is adopted: , where the weighting factor , is the estimated standard error of the linear drift at station k (Sect. 3.3), and the aggregated standard error for is .
3.5 Ozonesonde data selection for trend calculations
Among the ozonesonde stations, only those ozonesonde records overlapping with the ACE period (2004–2023) and having a time span longer than 10 years between 2004 and 2023 are selected for the drift analysis. Both ACE-FTS and ozonesonde monthly mean time series are calculated in the months common to both datasets.
3.6 Selection of “drop-off” ozonesonde stations
The current study uses the ozonesonde data as a reference for ACE-FTS data validation. It is also interesting to use ACE-FTS data to examine the drop-off features from the perspective of employing solar occultation measurement data. Detailed drop-off analyses are given in the Appendix and the Supplement. The results are summarized in Table 1 with flags in column 7 highlighting the drop-off status verified with ACE-FTS data. Flag 1 indicates a likely drop-off station (with drop-off magnitude of 3 %–4 %). They are operated with EnSci sondes and comprise some Canadian sites (Churchill and Yarmouth) and the tropical stations in Hanoi, Costa Rica, and Ascension. The results (Tables 1 and A1 in the Appendix) are generally consistent with Stauffer et al. (2022) with differences for some tropical stations. Stauffer et al. (2022) found Hanoi is not a drop-off site, while Samoa is, and Ascension is denoted by N/A due to insufficient comparison points (Table A1). In an earlier analysis, Hilo was found to be a drop-off station (Thompson et al., 2021). Flag 2 indicates those stations operated with EnSci ECC sondes but not likely affected by drop-off features. The stations with flag 3 are operated mostly with ECC sondes manufactured by Science Pump Corporation (SPC), which are unlikely affected by drop-offs (Stauffer et al., 2022). Stations with flag 9, Thule, San Cristóbal, and Java, have issues with missing data, which have impacts on trend and drop-off analyses but are valid for bias analyses (see Sect. 4.2). In the analyses below, the drop-off stations identified by either Stauffer et al. (2022) or this study are removed for the non-drop-off station data analyses.
3.7 The polar spring data
To evaluate the impact of data within the polar vortices on these validation results such as on the instrument drift estimation, different tests were performed by including and excluding data within the polar vortices. In this study, a coarse definition was used to define periods affected by the polar vortex such that the data from January to March, north of 65° N, and from September to November, south of 65° S, are regarded as within the polar vortices. Test results obtained by including or excluding the polar vortex data points do not show significant differences. For the results reported below, no additional data screening was made to exclude data within the polar vortex.
4.1 Biases from coincident data pair comparisons
Given the background of the geophysical variability as discussed above, this paper presents results using a coincidence criterion that is latitude-dependent for the distance separation and time differences that are within ± 24 h for all latitudes: at 75°–90° N (S), spatial distances between ACE-FTS measurements and ozonesonde stations are < 500 km; at 60°–75° N (S), spatial distances are < 800 km; and at other latitudes, the latitude and longitude differences are ± 5 and ± 10°, respectively. This criterion is generally comparable to other studies. Dupuy et al. (2009) adopted a criterion of ± 24 h and 800 km as coincidence criteria to validate ACE-FTS v2.2 ozone update data using ozonesondes. McCormick et al. (2020) used ± 24 h in time, ± 5° in latitude, and ± 10° in longitude for validating ozone data from the SAGE III/ISS solar occultation instrument, using the ozonesonde data from Lauder and Hohenpeißenberg. When validating satellite data with higher sampling density, the criteria can be stricter, such as those used in Sepúlveda et al. (2021), where the coincidence criteria were chosen as ± 12 h and 500 km when comparing OMPS-LP ozone data with ozonesonde measurements at Antarctic stations, because OMPS measures 160–180 profiles in each orbit.
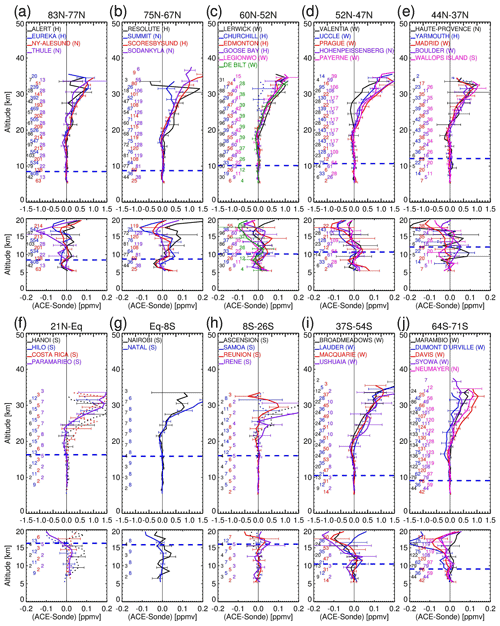
Figure 4The mean difference profiles between ACE-FTS and ozonesondes calculated from the coincident data pairs of ozone VMR vertical profiles (in ppmv; ACE–ozonesonde). The dotted profiles are those from drop-off stations. The panels in the second and fourth rows are expanded views of the lower altitudes (below 20 km) of the panels in the first and third rows, respectively. The ozonesonde stations are grouped in latitude ranges as indicated on the top of set of panels. Different ozonesonde stations are indicated by different colours. The numbers of coincident pairs in the mean difference profiles are indicated on the left side at a 3 km interval using the same colour codes as for the stations. The horizontal bars plotted every 3 km are , where are the standard errors of the estimated means. The horizontal dashed blue lines are the average tropopause heights in the latitude bands estimated from the temperature profiles in the ozonesonde data.
Figure 4a–j show the ACE-FTS and ozonesonde mean difference profiles (in ppmv), together with the standard error bars calculated from the coincident data pairs at the individual stations identified in Fig. 1. It should be noted that at seven stations, Churchill (Fig. 4c), Yarmouth (Fig. 4e), Hanoi (Fig. 4f), Hilo (Fig. 4f), Costa Rica (Fig. 4f), Ascension (Fig. 4h), and Samoa (Fig. 4h), the ozonesonde measurements might be affected by drop-offs (see details in Table 1), and the differences at these stations are plotted with dotted lines. Each figure contains two panels, with the lower one re-plotting the lower-altitude sections (< 20 km) with an enlarged x-axis scale. In all plots, the tropopause heights divide the stratospheric and tropospheric regions, which are calculated using ozonesonde temperature profile data according to the WMO 1957 definition as the lowest level at which the lapse rate decreases to 2° C km−1 or less. The stations, starting from the northernmost one in latitude-decreasing sequence, are grouped in 10 latitude ranges. The numbers of coincident data pairs used to calculate the difference profiles are indicated in the plots on a 3 km vertical interval. The maximum numbers of coincident data pairs used across the stations are also listed in Table 1. At both northern and southern higher latitudes, there are larger numbers of coincident pairs from about 20 up to > 100 compared to those at low latitudes, resulting from the ACE sampling pattern. Eureka is the station with the most coincident data points, 554 at ∼ 15 km (resulting from an annual springtime validation campaign for ACE taking place at this location). In the tropics (Fig. 4f–h), the numbers of coincident pairs are from a few to ∼ 15. Despite the different numbers of coincident data pairs, the mean difference profiles show some consistent features across stations. The upper-altitude parts (> 20 km) exhibit generally positive biases, increasing gradually with altitude from ∼ 0 ppmv at around 20 km to about ∼ 0.5–1.5 ppmv at about 30–32 km. These positive biases are mostly significant, as shown by the same sign of the values at the low and high ends of the standard error bars. For those ozonesonde stations reporting low ozone due to drop-offs, the effect would be high-bias differences as shown in some tropical stations, including Hanoi, Costa Rica, and Ascension, while at the Yarmouth station, the differences are not distinct from those in other stations at the similar latitudes, and at the Churchill station, the differences are remarkably lower than those in other stations for unknown reasons. There are also variabilities among the stations in the same latitude bands on the order of ∼ 0.2 ppmv. Apart from those low-bias stations, these positive biases in the lower to middle stratosphere are consistent with the findings of Sheese et al. (2022) that earlier ACE v4.1/4.2 ozone data are biased high versus other satellite datasets. In the troposphere (from ∼ 5 km up to the tropopause), in the extratropics the mean differences exhibit high variability around ∼ 0.04 ppmv across stations (Fig. 4a–e, i–j), while in the tropics the biases are non-significant with variations around ∼ 0.02 ppmv (Fig. 4f–h).
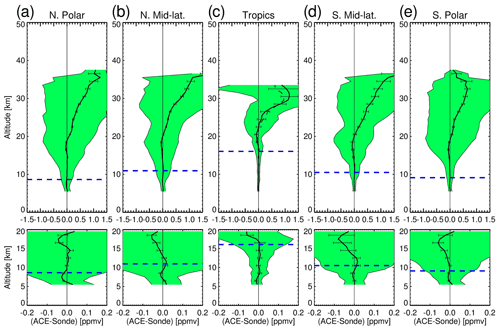
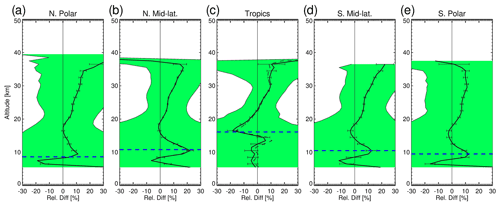
Figure 5The aggregated mean ozone profile differences (in ppmv) between coincident ACE-FTS and ozonesonde measurements averaged over the stations for the latitude bands: the northern polar region (a, stations in Fig. 4a–b), northern mid-latitudes (b, stations in Fig. 4c–e), the tropics (c, stations in Fig. 4f–h), the southern mid-latitudes (d, stations in Fig. 4i), and the southern polar region (e, stations in Fig. 4j). The shaded areas represent ranges, the standard deviations over the aggregated data points, and the horizontal bars () show the standard errors of the aggregated means. The dashed lines in (b) and (c) are the mean differences by including the drop-off stations (shown only for reference purpose). The horizontal dashed blue lines are the average tropopause heights in the latitude bands estimated from the temperature profiles in the ozonesonde data.
Figure 5a–e are, respectively, the aggregated mean biases averaged over the stations in Fig. 4a–b for the northern polar region, over the stations in Fig. 4c–e for the northern mid-latitudes, over the stations in Fig. 4f–h for the tropics, over the stations in Fig. 4i for the southern mid-latitudes, and over the stations in Fig. 4j for the southern polar region. In the averaging the seven “low-bias” ozonesonde stations as mentioned above are excluded for the final result (solid lines). For reference, companion calculations by including those seven stations are shown by dashed lines (Fig. 5b, c), and the overall impact of the low-bias stations is small. The latitude-band-averaged biases show two distinct regions that differ by altitude. In the stratosphere, where there are mostly consistent positive biases for ACE-FTS versus the ozonesondes, these biases start from negative values in the extratropics at about 17 km or near-zero in the tropics at about 22 km and then increase with altitude. At altitudes higher than ∼ 32 km, as no altitude cut-off was applied to the ozonesonde data, the bias assessment may be unreliable due to increasing ozonesonde measurement errors. In the UTLS regions the differences are a non-significant small amount of around ± 0.02 ppmv.
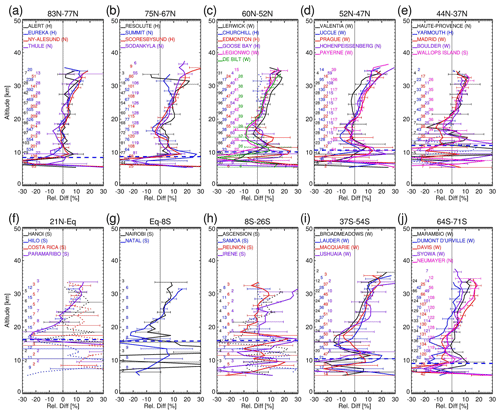
Figure 6Similar to Fig. 4 but for the mean relative differences (%) between the ACE-FTS and ozonesonde profiles calculated from the coincident data pairs (ACE−sonde)/[(ACE+sonde)/2]. The horizontal bars are standard error, where are the standard errors of the estimated means.
Figure 6a–j show the relative mean differences in percent (%) together with the standard error bars as companion plots to Fig. 4a–j. As before, the seven stations mentioned above are excluded from the discussion here. Because the relative differences are derived by dividing the absolute differences as shown in Fig. 4a–j by the mean ozone profiles, the upper parts show similar structures as in Fig. 4a–j, i.e., “tilted” differences across the stations, increasing with altitude starting from ∼ 20 km and reaching a maximum of 10 % at ∼ 30 km. In the lower stratosphere at altitudes around 20 km and a few kilometres below, particularly for the mid- and high latitudes (Fig. 6a–e, i–j), there are often negative differences seen for these ozonesonde stations. The large relative difference values in the troposphere (Fig. 6a–j) are attributed to the small tropospheric ozone concentrations. Figure 7a–e present the ACE-FTS versus ozonesonde relative differences averaged over the five latitude bands. In the stratosphere, the bias structures show similar features to those in Fig. 5a–e at altitudes higher than 20 km. Below 20 km the absolute differences shown in Fig. 5a–e are amplified in the relative differences in Fig. 7a–e, specifically in the UTLS region where high variabilities are seen but no distinctive structures are seen, in contrary to the plots derived from the monthly mean time series in Sect. 4.2.1.
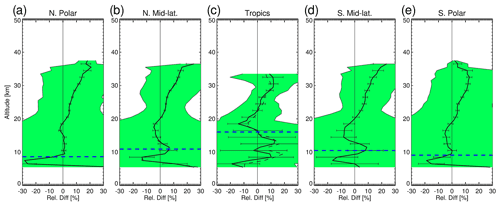
Figure 7Similar to Fig. 5 but for the aggregated mean relative differences (%) between the ACE-FTS and ozonesonde profiles calculated from the coincident data pairs (ACE–sonde)/[(ACE+sonde)/2] in the five latitude bands. The shaded areas represent ranges, where is the standard deviations over the aggregated data points, and the horizontal bars represent , where is the standard error of the aggregated means.
4.2 ACE-FTS versus ozonesonde monthly mean time series
4.2.1 Biases between ACE-FTS and ozonesonde monthly mean time series
This section reports the results of determining ACE-FTS ozone profile biases against ozonesonde data using the monthly mean comparison method. By choosing data within the latitude/longitude ranges of ± 5°/± 30° surrounding the ozonesonde stations, the ACE-FTS monthly mean time series were generated for all the ozonesonde stations. The absolute and relative differences between the ACE-FTS and ozonesonde monthly mean time series are calculated using the method in Sect. 3.1 and 3.2, where the data pairs used are the monthly mean time series for the common months. Here only the relative differences are shown in Fig. 8a–j, where the numbers of monthly mean points used for difference calculations are indicated, and the maximum numbers in the vertical profiles are also listed in Table 1. These are generally larger than the numbers of coincident data pairs used (as shown in Fig. 6a–j), especially in the tropical regions. Relative to the coincident data analysis, the bias determination using monthly mean time series employs more relaxed coincidence criteria with a possible outcome that averaging over more samples to produce the monthly means likely outweighs larger geophysical variability. The benefit can be seen below.
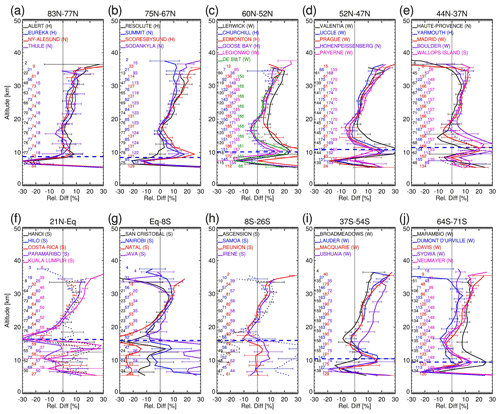
Figure 8Similar to Fig. 6 but for the mean ACE-FTS and ozonesonde relative difference profiles in percentage (%) estimated from their respective monthly mean time series at all the stations.
The difference profiles shown in Fig. 8a–j are generally consistent with those in Fig. 6a–j in terms of the altitude-dependent positive biases seen in the upper-altitude parts of the profiles. In particular, the time series difference profiles at mid-latitudes in Europe (Fig. 8c–e) and in tropics (Fig. 8f–h) exhibit more smooth and consistent features than those in Fig. 6c–e and in Fig. 6f–h, respectively. In the troposphere, the time series difference profiles (e.g., Fig. 8c–e) are also more consistent than those for coincident pairs in Fig. 6c–e. This is attributed to more points utilized in the monthly mean time series for the comparison. For three sites in the tropics, namely Kuala Lumpur, San Cristóbal, and Java, coincident pair comparisons were not obtained. However, monthly mean time series comparisons are possible and appear in Fig. 8f and h. At the Churchill station the difference profile in Fig. 6c, calculated from 39 coincident pairs, is distinct from other profiles, while in Fig. 8c, with 150 months used, the Churchill profile is similar to the other profiles at comparable latitudes. The latitude-band-averaged mean difference profiles (Fig. 9a–e) are also calculated from the ACE-FTS and ozonesonde monthly mean time series. The positive biases seen in the stratosphere are very similar to those seen from the coincident pair comparisons in Fig. 7a–e, while in the UTLS region the averaged differences show more consistent and structured features. One remarkable feature is that one of the profile “turning points” is coincident with the tropopause heights at all latitude bands. The differences shown in Fig. 9a–e at the tropopause altitudes are negative by about −20 % in the tropics and positive by 7 %–20 % in the extratropical regions. These differences may be related to the large ozone gradients near the tropopause. Similar features, albeit with smaller magnitudes, are seen in the coincident profile comparisons in Fig. 7a–d and may suggest that these differences result from dynamic variability in this region and the range of coincidence criteria used in this study. The method of using monthly mean time series for the bias estimation as presented in this section demonstrates it is an alternative way to the conventional coincident data analysis and is particularly useful when strict coincidence criteria do not yield sufficient data points for comparisons.
4.2.2 Variation patterns and mean states in the ACE-FTS and ozonesonde monthly mean time series
Figure 10 displays the ACE-FTS and ozonesonde monthly mean ozone VMR time series for their common months at selected altitudes in the lower stratosphere from 2004 to 2023. These are shown for 17 representative ozonesonde stations in each 10°-wide latitude band. The altitudes are selected such that temporal variations are predominant with the distinct periods attributed to atmospheric dynamics. The monthly samples as shown in Fig. 10 are not evenly distributed across latitudes. In the Arctic region (e.g., Eureka and Resolute), the common ACE-FTS and ozonesonde monthly samples appear in only two seasons: northern spring (February–March) and northern fall (August–October). At mid-latitudes in the Northern Hemisphere (NH; e.g., Lerwick and Goose Bay) and in the Southern Hemisphere (SH; e.g., Broadmeadows, Lauder, and Macquarie), the monthly samples appear to be dense, as is also seen in the Antarctic region (e.g., Davis and Neumayer). In the tropics, the monthly samples are much less dense than those at higher latitudes, but there are samples available in every season.
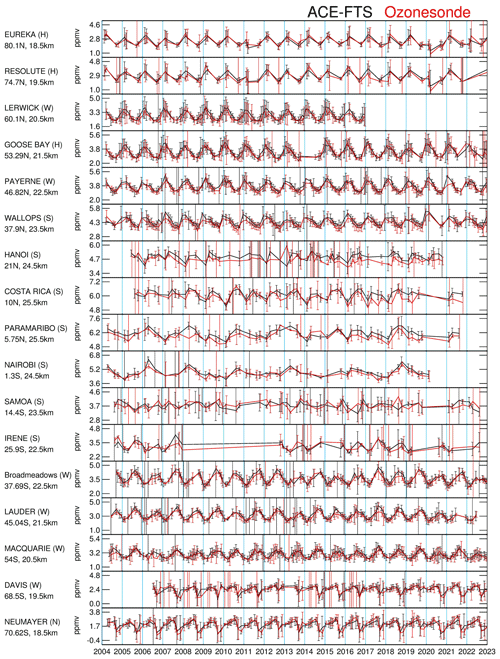
Figure 10The ACE-FTS (black) vs. ozonesonde (red) monthly mean time series at selected altitudes for the stations from north to south (from top to bottom panels). The data points are at the common months when both ACE-FTS and ozonesondes have valid monthly means. The vertical bars represent ±2σ, with σ the standard deviations from those values which generated monthly means.
The ACE-FTS and ozonesonde time series in Fig. 10 appear to have very good agreement at mid-latitudes and high latitudes in both the NH (e.g., Eureka, Resolute, Lerwick, Goose Bay, Payerne, Wallops Island) and the SH (e.g., Broadmeadows, Lauder, Macquarie, Davis, and Neumayer) with the annual cycle as the dominant variation pattern. Variations in the NH and the SH show the expected 6-month phase difference. In the tropics, the ACE-FTS and ozonesonde time series agree well, except at the Hanoi station. In the equatorial region, it is not the annual cycle but other temporal patterns such as the QBO (e.g., Nairobi (1.3° S, 36.8° E), Paramaribo (5.8° N, 55.2° W)) that are the apparent dominant patterns. In general, the ACE-FTS time series at these stations and altitudes agree very well with the ozonesonde monthly mean time series. Figure 11 is the altitude/station section of the correlation coefficients between the ACE-FTS and ozonesonde monthly mean time series (including those seven drop-off stations) with the horizontal axis in the order of the station latitudes. High correlations (≥ 0.75) are present at the altitudes where the time series are characterized by prominent temporal variation patterns. These are located above the tropopause and extend to higher altitudes up to ∼ 30 km and even 35 km in the polar regions. There are some areas where the correlations appear to be poorer, with values of ∼ 0.5, such as in the tropical stratosphere (27–32 km) and northern mid-latitude stratosphere (25–28 km), as well as at some stations (e.g., Ushuaia, Samoa, Ascension, Java, Hanoi, and Prague). Those variations with good agreement are attributed to the dynamic forcing on the ozone field, as ozone is a tracer gas in the lower stratosphere where ozone changes primarily result from transport rather than photochemistry-induced ozone creation or destruction (Toihir et al., 2018). Several researchers have used multivariable linear regression methods to extract typical atmospheric modes from ozone measurements. The QBO, annual oscillation, and semi-annual oscillation modes, for example, have been derived from MIPAS global ozone data up to 50 km (Eckert et al., 2014), from SHADOZ ozonesonde data for the tropics (Toihir et al., 2018), and from ozonesonde data at the Lauder station representing the mid-latitude Southern Hemisphere (Zeng et al., 2017). The amplitudes and significance of these modes are a function of altitude and latitude. With the general good agreement and high correlations between ACE-FTS and ozonesonde data, similar analyses can be done using the ACE-FTS monthly mean time series data.
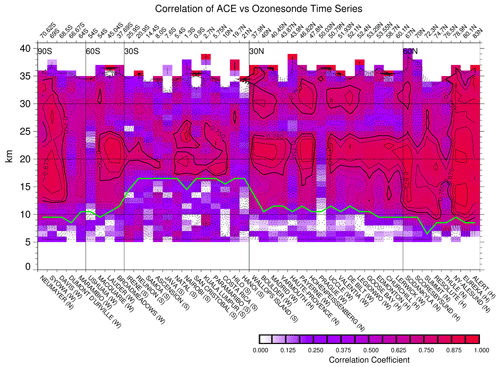
Figure 11The correlation coefficient profiles between the ACE-FTS and ozonesonde monthly average time series for all the stations. The horizontal axis denotes the ozonesonde station latitudes as shown on the top of the panel with the station names shown at the bottom. The contour isolines have an interval of 0.05, and the solid (rather than dotted) isolines represent the high correlation coefficients ≥ 0.75. The solid green line separating the troposphere and stratosphere shows the average tropopause height line across the stations.
Figure 12 shows the averaged values and standard deviations calculated from the ACE-FTS and ozonesonde monthly mean time series (including the seven drop-off stations) displayed on an altitude grid with an interval of 3 km. This plot was made in a similar way to the comparison study between Aura-MLS and ozonesonde data (Jiang et al., 2007). The averaged values represent the mean state of ozone, which is a function of altitude and latitude, and the standard deviations give the variability of the ozone changes such as those presented by the time series shown in Fig. 10. Both the ACE-FTS and ozonesondes show similar mean ozone patterns characterized by high values in the tropical mid-stratosphere (∼ 30 km), where ozone is generated and the latitude distribution driven by transport via the BDC, which is poleward and directed downwards in the extratropical regions. The tropical area in the UTLS, between 9.5 and 21.5 km, exhibits low values of ozone, as this is where ozone is least accumulated. There are clearly discrepancies in that the ACE-FTS mean values are larger than the ozonesonde values across the stations. This occurs at higher altitudes, such as above 21.5 km, and is consistent with the features revealed in Figs. 4 and 5, for example. Regarding ozone variability together with the measurement uncertainty, the ACE-FTS variabilities in the troposphere (i.e., at 6.5 and 9.5 km in Fig. 11) exhibit larger values than those of the ozonesondes. In the lower stratosphere, both the ACE-FTS and ozonesondes exhibit variabilities of similar magnitudes. In regions of low ozone concentration, such as the tropical troposphere, the variabilities from both ACE-FTS and ozonesondes are lower than those in the other regions.
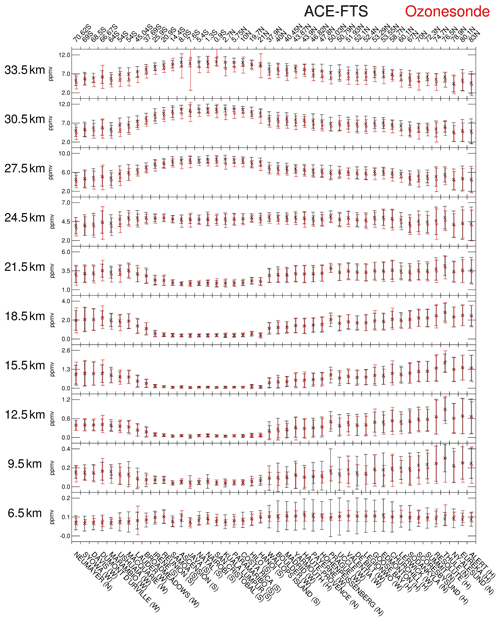
Figure 12The averaged values calculated from the ACE-FTS (black “x”) and ozonesonde (red “x”) monthly mean time series displayed on 3 km altitude grid. The vertical bars of each colour show ±2σ, where σ is the respective standard deviation. The horizontal axis denotes the station latitudes (given at the top) with the station names at the bottom.
4.3 Instrument drifts relative to the ozonesonde measurements
The ACE-FTS instrument drift is estimated as the linear trend of the differences between the ACE-FTS and ozonesonde deseasonalized time series and was calculated at all ozonesonde stations (including the seven “drop-off” stations) listed in Table 1. Although ozone trend estimation is not the focus of this study, it is helpful to keep in mind that the underlying ozone concentrations in the lower stratosphere (< 35 km) during the study period (2004–2023) are generally small with non-significant trends after 2000 (e.g., Steinbrecht et al., 2018; Tarasick et al., 2016; SPARC/IO3C/GAW, 2019). The ACE-FTS ozone measurement drifts in the v4.1/4.2 data have been assessed by comparing them with other satellite data at 15–40 km for the period 2004–2021 (Sheese et al., 2022). This study serves to extend this validation work to lower altitudes covering between 5–33 km.
Figure 13a–j show the instrument drifts (in ppmv per decade) at all the ozonesonde stations over the period 2004–2023, with dotted lines for the seven drop-off stations and solid lines for the remaining non-drop-off stations (as identified in Table 1). The plots at low altitudes (< 20 km) with enlarged graphs are also displayed. Figure 14a–j are the corresponding plots for the relative instrument drifts (in % per decade). To consider the impact of the polar vortex as mentioned in Sect. 3.7, additional analyses were carried out by reducing the ACE-FTS data sampling areas by setting the longitudinal range to ± 10° and removing data in northern polar springtime (January–March) north of 65° N and southern polar springtime (September–November) south of 65° S. The results obtained by removing possible polar vortex data did not change the general features in the drift and uncertainty plots. At some stations such as Eureka, restricting data to those outside of the polar vortex resulted in no ACE-FTS samples at all.
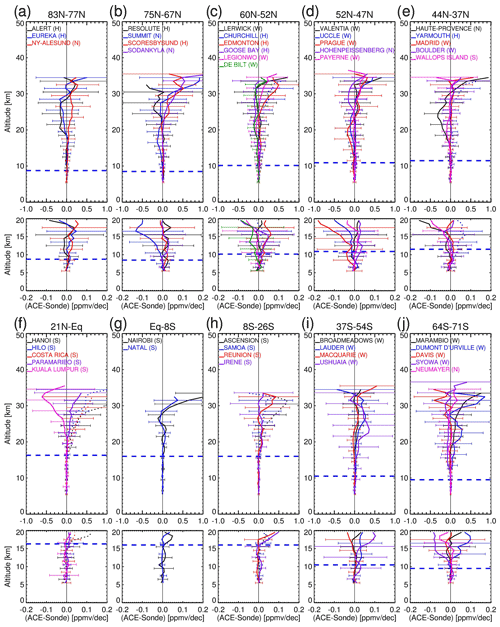
Figure 13The instrument drifts (in ppmv per decade) derived from the linear trends of the differences between the ACE-FTS and ozonesonde deseasonalized monthly mean ozone profile time series at the ozonesonde stations. As before, the dotted profiles are those from “drop-off” stations. The standard error bars are given at the 3 km vertical interval. The horizontal dashed blue lines are the average tropopause heights in the latitude bands estimated from the temperature profiles in the ozonesonde data.
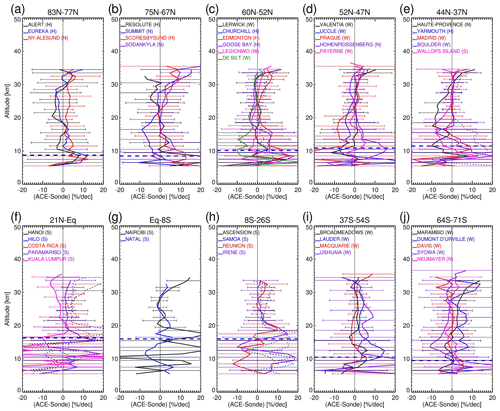
Figure 14Similar to Fig. 13 but for the instrument drift calculated as relative differences (in % per decade).
The plots for the “drop-off” stations as shown in Figs. 13 and 14 (dotted profiles) are included for reference and evaluation purposes. At the Churchill, Yarmouth, Hilo, and Samoa stations, the drifts are not different from the other drift profiles at the similar latitudes. At the Costa Rica and Ascension stations, the positively biased drifts may be caused by the drop-offs.
At northern high latitudes (> 65° N) (Figs. 13a, b and 14a, b), the instrument drifts at individual stations are around −5 % to +2 % per decade with changing signs at different stations and with large uncertainties on the order of ± 10 % per decade, and at the Summit station the drifts can be as large as −10 % below 20 km with uncertainties of ± 20 % per decade. The high variability in the polar region is consistent with the study of Tarasick et al. (2016) that showed the linear trends derived from the Canadian ozonesonde data can change signs between positive and negative. This is especially the case when the underlying long-term ozone trends are small.
Figure 13c–e and Fig. 14c–e present the instrument drifts at northern mid-latitude ozonesonde stations (37–60° N). Most of them are in Europe and show generally consistent features with drifts within ± 2 % per decade and uncertainties of ± 5 % per decade for altitude ranges of around 20–33 km, except at the Observatoire de Haute Provence (OHP) station, which has seemly unrealistic negative drifts of −10 % at about 18–25 km.
In the tropics (Fig. 13f–h and Fig. 14f–h), the instrument drifts in general exhibit positive drifts at 0 %–5 % per decade above 20 km with magnitudes that vary with altitude except at the Kuala Lumpur station where the negative drifts are seen with values between −2 % per decade and −8 % per decade above 22 km. Below this altitude, the relative drifts are characterized by larger values at ± 20 % per decade but are non-significant due to large uncertainties. As analyzed by Thompson et al. (2021) using SHADOZ ozonesonde data in the tropical troposphere, ozone trends are characterized by high regional, seasonal, and altitude variability attributed to dynamics. This feature, together with the low ozone amounts in the tropical troposphere, results in high relative drifts and variabilities (in % per decade) and small absolute drifts (in ppmv per decade).
In the southern mid-latitudes (Figs. 13i and 14i), there are four stations: Broadmeadows, Lauder, Macquarie, and Ushuaia. The instrument drifts at the Lauder and Ushuaia stations show non-significant positive drifts of about 2 %–8 % per decade above the tropopause, while at the Macquarie station the instrument drifts are around ± 1 % per decade.
In the Antarctic region the instrument drifts vary among stations (Fig. 13j and j), just as those in the Arctic region. This high variability is attributed to the strong seasonality of Antarctic ozone and the interannual variation of this seasonality as found by Sepúlveda et al. (2021) in the difference time series between the OMPS-LP ozone profiles and the Antarctic ozonesonde data.
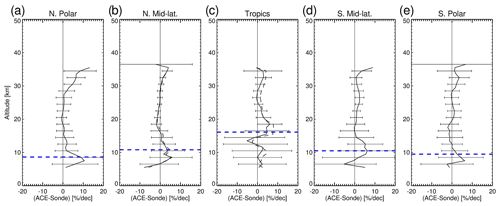
Figure 15The aggregated mean instrument drifts (in % per decade) averaged over the ozonesonde stations excluding those with drop-offs (solid lines) at five latitude bands for the northern polar region (a), for northern mid-latitudes (b), for the tropics (c), for southern mid-latitudes (f), and for the southern polar region (e). The dashed lines are the mean instrument drifts from the entire set of stations including those drop-off stations (b, c). The stations aggregated for each region are the same as those indicated in Fig. 4. The error bars represent ± 2, the standard errors of the aggregated mean drifts. The horizontal dashed blue lines are the average tropopause heights in the latitude bands estimated from the temperature profiles in the ozonesonde data.
Figure 15a–e present the aggregated mean ACE-FTS instrument drifts averaged over the five latitude bands by excluding those drop-off stations (solid lines). For reference, the aggregated mean drifts obtained by including all ozonesonde stations are shown as well (dashed lines in Fig. 15b and c) – small changes at 1 % per decade compared with the solid lines. In the northern polar region and mid-latitudes (Fig. 15a, b), the aggregated mean instrument drifts show small non-significant drifts within ± 1 %–2 % per decade from ∼ 2 km above the tropopause up to ∼ 30 km. In the tropics (Fig. 15c) and the southern mid-latitudes (Fig. 15d), positive drifts at 0 %–3 % per decade varying with height are seen at most altitudes above the tropopause. In the southern polar region, the averaged ACE-FTS instrument drifts exhibit small non-significant drifts at ± 1 %–2 % per decade above the tropopause. The small values of the aggregated drifts are attributed to averaging over several ozonesonde stations available in the latitude bands, although the individual station drifts feature high variabilities.
This study validated ACE-FTS v5.2 ozone data using ozonesonde data from 46 stations from four global networks: NDACC, WOUDC, SHADOZ, and HEGIFTOM. As part of this study, the ozonesonde network data were examined for drop-off features using ACE-FTS data, and they were found to be generally consistent with the results obtained by Stauffer et al. (2022). These seven affected sonde stations were not included in further analysis. The biases between the ACE-FTS and ozonesonde profiles were examined by analyzing coincident data pairs. In general, the biases are small at lower altitudes and increase with altitude up to 10 % at the higher altitudes (just below the balloon burst altitudes). This is consistent with the findings that the earlier ACE-FTS v4.1/4.2 ozone data are larger than other satellite instruments in the mid-stratosphere (Sheese et al., 2022). This bias structure is consistent across all the ozonesonde station latitudes.
This study also presents the result of using the monthly mean comparison method. The biases between the ACE-FTS and ozonesonde monthly mean time series exhibit similar bias patterns to those derived from the coincident data analysis. Moreover, these monthly mean time series comparisons display smoother curves and achieve more consistency among stations at similar latitudes than the coincident pair analysis. In the UTLS region they show structured features correlated with the tropopause altitudes. The ACE-FTS time series can also capture distinct temporal variation patterns such as annual variability and QBO at certain latitudes and altitudes, display the mean state of ozone, and are highly correlated with the ozonesonde time series at certain altitudes. All these results support the feasibility of the method presented here for generating and validating ACE monthly mean ozone time series.
The ACE-FTS instrument drifts are assessed at all individual stations for 2004–2023, and the drifts determined in the same latitude band are compared individually. These show variability among the stations in the same latitude band, except at northern mid-latitudes (a cluster of European sites) where individual drifts are mostly consistent. Averaging the individual drifts for each latitude band results in small non-significant drifts for stratospheric ozone within ± 1 % per decade in the polar regions (Arctic and Antarctic) and < 1 % per decade at northern mid-latitudes and positive drifts of 0 %–3 % per decade in the tropics and at the southern mid-latitudes. In the troposphere, the ACE-FTS instrument drifts, aggregated by latitude band, vary with altitude and are generally within ± 10 % per decade with uncertainties of 10 % per decade.
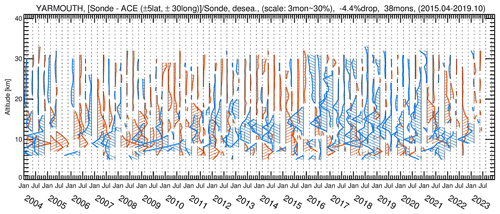
Figure A1Seasonally averaged relative differences (%) between the ozonesonde and ACE-FTS deseasonalized monthly mean time series at the Yarmouth station, Canada. The red colours indicate the positive differences. The blue colours indicate the negative differences. A scale of 30 % relative difference is represented by the distance between the two adjacent dashed lines (3 months). The drop-off amount and the period and the months of operating EnSci sondes with serial numbers > 25 000 are indicated at the top.
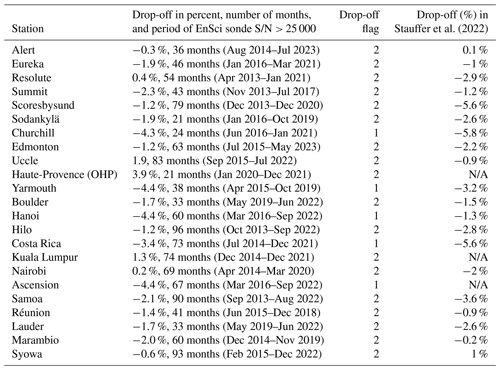
Table A1The drop-off analysis result for those stations operated with EnSci ozonesondes. Listed are the drop-off in percent, number of months, and the period of the EnSci sondes with serial numbers larger than 25 000. In column 3, flag 1 indicates drop-offs larger than 3 % and flag 2 drop-offs less than 3 % or even positive. Column 4 lists the drop-off in percent from Stauffer et al. (2022) with stations having insufficient comparison points marked by N/A.
The drop-off analyses using ACE-FTS data were performed only for the stations operated with EnSci ECC ozonesondes (described as Z models in the metadata), as drop-offs occurred only in this type of ozonesondes with specific production lots (serial numbers > 25 000) and correlated with the associated changes in the characteristics of the mechanical pumps (Stauffer et al., 2022; Nakano and Morofuji, 2023). For another type of ECC ozonesondes manufactured by SPC (described by 6A model in the metadata), no drop-offs are found (Stauffer et al., 2022). The ozonesonde data used here were re-processed recently through the homogenization procedure and achieved substantial improvements in drop-offs for most of the affected stations (Stauffer, et al., 2022). Using ACE-FTS data to check the drop-offs provides another independent examination from the perspective of employing a solar occultation satellite instrument which has much less sampling density than those used in Stauffer et al. (2020, 2022) for identification and quantification purposes (e.g., Aura-MLS, Aura–OMI (Ozone Monitoring Instrument) and OMPS-LP).
To investigate the drop-off features, the differences between the ozonesonde and ACE-FTS deseasonalized monthly mean time series are examined. The differences largely remove their respective annual cycles and other common temporal components (e.g., QBO, ENSO), leaving the long-term drifts and residuals. Dividing the differences by the corresponding ozonesonde monthly mean values, the relative differences are calculated. For better visualization of the difference profile time sequence (see Fig. A1 and figures in Supplement), the monthly mean time series in absolute values (ppmv) were further re-binned into seasonally averaged time series. The 3-month re-binning is based on the consideration that ACE-FTS monthly mean time series often have missing data in certain months. Re-binning results in new time series with reduced samples but a more even distribution of the data in time for easy display.
To quantify the drop-off, the partial column ozone (PCO) change between the potential drop-off period and the prior period since 2004 (non-drop-off period) is estimated. The drop-off periods are specified based on the serial numbers of EnSci sondes (serial numbers > 25 000), which are usually provided in the ozonesonde metadata. The use of PCO instead of TCO is based on the consideration that at lower altitudes the ACE-FTS ozone data are either not available or exhibit high variability, while drop-offs usually occur at above 50 mbar (∼ 20 km) (Thompson et al., 2021; Stauffer et al., 2022). From their respective data of ozone VMR, atmospheric pressure, and temperature, the ozonesonde and ACE-FTS difference profiles for the deseasonalized number density time series are calculated first. The mean number density difference profiles averaged over the potential drop-off period and the prior non-drop-off period are calculated, respectively. Integrations of the two profiles from 15 to 25 km give two PCO differences. The difference between the two PCO differences, divided by the ozonesonde PCO averaged over the entire period, gives the drop-off estimate.
For drop-off analyses 24 stations operated with the EnSci sondes were selected (Table A1). The estimated drop-off, the number of months, and the period of serial numbers > 25 000 are given for each station in Table A1, where the TCO drop-offs from Stauffer et al. (2022) are also listed. The ozone profile difference time series at these stations are shown in the Supplement. As a representative example, Fig. A1 shows the relative difference profile time series (in percent) between ozonesondes and ACE-FTS at the Yarmouth station. The drop-off features are visible as step changes in the lower stratosphere with persistent negative values occurring around 2016–2020, approximately consistent with the period of April 2015–October 2019 when serial numbers are > 25 000. After October 2019 drop-off is no longer considered as the sonde model switches from EnSci to SPC. To identify a drop-off station, a step change in TCO larger than 3 %–4 % was used in Stauffer et al. (2020, 2022). Here, if a PCO drop is larger than 3 %–4 %, the station is regarded as a drop-off station. In Table A1, the drop-off stations are labelled by flag 1. They are primarily at the Canadian sites, Churchill (−4.3 %) and Yarmouth (−4.4 %), and at the tropical sites, Ascension (−4.4 %), Costa Rica (−3.4 %), and Hanoi (−4.4 %). Stations with flag 2 are those having drop-offs less than 3 % and are deemed not affected by drop-offs.
The data used in this study are all available publicly. The ACE-FTS v5.2 ozone data were downloaded from the ACE data archive at the University of Waterloo: https://databace.uwaterloo.ca/level2/ace_v5.2 (ACE-FTS, 2013; registration required). The ACE-FTS data quality flags for ACE-FTS Level 2 version 5.2 dataset are available from https://doi.org/10.5683/SP3/NAYNFE (Sheese and Walker, 2023). The ozonesonde data were downloaded from the following sources: Network for the Detection of Atmospheric Composition Change (NDACC) at https://www-air.larc.nasa.gov/missions/ndacc/data.html (NDACC, 2022), World Ozone and Ultraviolet Data Centre (WOUDC) at https://doi.org/10.14287/10000008 (WOUDC, 2022), Southern Hemisphere Additional OZonesondes (SHADOZ) at https://doi.org/10.57721/SHADOZ-V06 (NASA/GSFC, 2019), and Harmonization and Evaluation of Ground-Based Instruments for Free Tropospheric Ozone Measurements (HEGIFTOM) at https://hegiftom.meteo.be/ (RMI, 2022).
The supplement related to this article is available online at: https://doi.org/10.5194/amt-17-6983-2024-supplement.
JZ performed and coded the analyses and wrote the manuscript. KAW initiated the project, coordinated with the co-authors, and helped to edit and finalize the manuscript. PES produced the ACE-FTS data quality flag files. CDB produced the ACE-FTS ozone data. RMS shared his expertise to ensure the study was in line with the progress in the field. AMT provided insightful suggestions for improving the manuscript. DWT provided expertise in the analysis of the ECC data with the Canadian ozonesonde data.
The contact author has declared that none of the authors has any competing interests.
Publisher's note: Copernicus Publications remains neutral with regard to jurisdictional claims made in the text, published maps, institutional affiliations, or any other geographical representation in this paper. While Copernicus Publications makes every effort to include appropriate place names, the final responsibility lies with the authors.
This study was funded by a contract from the Canadian Space Agency (CSA). The Atmospheric Chemistry Experiment (ACE) is a Canadian-led mission mainly supported by the CSA. We thank Peter Bernath for his leadership of the ACE mission. The authors thank the principal investigators and the organizations and institutions that create and maintain the datasets at NDACC, WOUDC, SHADOZ, and HEGIFTOM.
This research has been supported by the Canadian Space Agency (contract no. 9F045-200582/001/SA).
This paper was edited by Sandip Dhomse and reviewed by two anonymous referees.
ACE-FTS: Level 2 Data, Version 5.2, ACE-FTS [data set], https://databace.scisat.ca/level2/ (last access: 4 July 2023), 2023.
Adams, C., Strong, K., Batchelor, R. L., Bernath, P. F., Brohede, S., Boone, C., Degenstein, D., Daffer, W. H., Drummond, J. R., Fogal, P. F., Farahani, E., Fayt, C., Fraser, A., Goutail, F., Hendrick, F., Kolonjari, F., Lindenmaier, R., Manney, G., McElroy, C. T., McLinden, C. A., Mendonca, J., Park, J.-H., Pavlovic, B., Pazmino, A., Roth, C., Savastiouk, V., Walker, K. A., Weaver, D., and Zhao, X.: Validation of ACE and OSIRIS ozone and NO2 measurements using ground-based instruments at 80° N, Atmos. Meas. Tech., 5, 927–953, https://doi.org/10.5194/amt-5-927-2012, 2012.
Ancellet, G., Godin-Beekmann, S., Smit, H. G. J., Stauffer, R. M., Van Malderen, R., Bodichon, R., and Pazmiño, A.: Homogenization of the Observatoire de Haute Provence electrochemical concentration cell (ECC) ozonesonde data record: comparison with lidar and satellite observations, Atmos. Meas. Tech., 15, 3105–3120, https://doi.org/10.5194/amt-15-3105-2022, 2022.
Ball, W. T., Alsing, J., Mortlock, D. J., Staehelin, J., Haigh, J. D., Peter, T., Tummon, F., Stübi, R., Stenke, A., Anderson, J., Bourassa, A., Davis, S. M., Degenstein, D., Frith, S., Froidevaux, L., Roth, C., Sofieva, V., Wang, R., Wild, J., Yu, P., Ziemke, J. R., and Rozanov, E. V.: Evidence for a continuous decline in lower stratospheric ozone offsetting ozone layer recovery, Atmos. Chem. Phys., 18, 1379–1394, https://doi.org/10.5194/acp-18-1379-2018, 2018.
Ball, W. T., Chiodo, G., Abalos, M., Alsing, J., and Stenke, A.: Inconsistencies between chemistry–climate models and observed lower stratospheric ozone trends since 1998, Atmos. Chem. Phys., 20, 9737–9752, https://doi.org/10.5194/acp-20-9737-2020, 2020.
Bernath, P. F., McElroy, C. T., Abrams, M. C., Boone, C. D., Butler, M., Camy-Peyret, C., Carleer, M., Clerbaux, C., Coheur, P.-F., Colin, R., DeCola, P., DeMazière, M., Drummond, J. R., Dufour, D., Evans, W. F. J., Fast, H., Fussen, D., Gilbert, K., Jennings, D. E., Llewellyn, E. J., Lowe, R. P., Mahieu, E., McConnell, J. C., McHugh, M., McLeod, S. D., Michaud, R., Midwinter, C., Nassar, R., Nichitiu, F., Nowlan, C., Rinsland, C. P., Rochon, Y. J., Rowlands, N., Semeniuk, K., Simon, P., Skelton, R., Sloan, J. J., Soucy, M.-A., Strong, K., Tremblay, P., Turnbull, D., Walker, K. A., Walkty, I., Wardle, D. A., Wehrle, V., Zander, R., and Zou, J.: Atmospheric Chemistry Experiment (ACE): Mission overview, Geophys. Res. Lett., 32, L15S01, https://doi.org/10.1029/2005GL022386, 2005.
Bognar, K., Zhao, X., Strong, K., Boone, C. D., Bourassa, A. E., Degenstein, D. A., Drummond, J. R., Duff, A., Goutail, F., Griffin, D., Jeffery, P. S., Lutsch, E., Manney, G. L., McElroy, C. T., McLinden, C. A., Millán, L. F., Pazmino, A., Sioris, C. E., Walker, K. A., and Zou, J.: Updated validation of ACE and OSIRIS ozone and NO2 measurements in the Arctic using ground-based instruments at Eureka, Canada, J. Quant. Spectrosc. Ra., 238, 106571, https://doi.org/10.1016/j.jqsrt.2019.07.014, 2019.
Boone, C. D., Nassar, R., Walker, K. A., Rochon, Y., McLeod, S. D., Rinsland, C. P., and Bernath, P. F.: Retrievals for the Atmospheric Chemistry Experiment Fourier-Transform Spectrometer, Appl. Opt., 44, 7218–7231, https://doi.org/10.1364/AO.44.007218, 2005.
Boone, C. D., Walker, K. A., and Bernath, P. F.: Version 3 Retrievals for the Atmospheric Chemistry Experiment Fourier Transform Spectrometer (ACE-FTS), The Atmospheric Chemistry Experiment ACE at 10: A Solar Occultation Anthology, A. Deepak Publishing, Hampton, Virginia, USA, 103–127 pp., https://api.semanticscholar.org/CorpusID:221710947 (last access: 19 November 2024), 2013.
Boone, C. D., Bernath, P. F., Cok, D., Jones, S. C., and Steffen, J.: Version 4 retrievals for the Atmospheric Chemistry 20 Experiment Fourier Transform Spectrometer (ACE-FTS) and imagers, J. Quant. Spectrosc. Ra., 247, 106939, https://doi.org/10.1016/j.jqsrt.2020.106939, 2020.
Boone, C. D., Bernath, P. F., and Lecours, M.: Version 5 retrievals for ACE-FTS and ACE-imagers, J. Quant. Spectrosc. Ra., 310, 108749, https://doi.org/10.1016/j.jqsrt.2023.108749, 2023.
Dupuy, E., Walker, K. A., Kar, J., Boone, C. D., McElroy, C. T., Bernath, P. F., Drummond, J. R., Skelton, R., McLeod, S. D., Hughes, R. C., Nowlan, C. R., Dufour, D. G., Zou, J., Nichitiu, F., Strong, K., Baron, P., Bevilacqua, R. M., Blumenstock, T., Bodeker, G. E., Borsdorff, T., Bourassa, A. E., Bovensmann, H., Boyd, I. S., Bracher, A., Brogniez, C., Burrows, J. P., Catoire, V., Ceccherini, S., Chabrillat, S., Christensen, T., Coffey, M. T., Cortesi, U., Davies, J., De Clercq, C., Degenstein, D. A., De Mazière, M., Demoulin, P., Dodion, J., Firanski, B., Fischer, H., Forbes, G., Froidevaux, L., Fussen, D., Gerard, P., Godin-Beekmann, S., Goutail, F., Granville, J., Griffith, D., Haley, C. S., Hannigan, J. W., Höpfner, M., Jin, J. J., Jones, A., Jones, N. B., Jucks, K., Kagawa, A., Kasai, Y., Kerzenmacher, T. E., Kleinböhl, A., Klekociuk, A. R., Kramer, I., Küllmann, H., Kuttippurath, J., Kyrölä, E., Lambert, J.-C., Livesey, N. J., Llewellyn, E. J., Lloyd, N. D., Mahieu, E., Manney, G. L., Marshall, B. T., McConnell, J. C., McCormick, M. P., McDermid, I. S., McHugh, M., McLinden, C. A., Mellqvist, J., Mizutani, K., Murayama, Y., Murtagh, D. P., Oelhaf, H., Parrish, A., Petelina, S. V., Piccolo, C., Pommereau, J.-P., Randall, C. E., Robert, C., Roth, C., Schneider, M., Senten, C., Steck, T., Strandberg, A., Strawbridge, K. B., Sussmann, R., Swart, D. P. J., Tarasick, D. W., Taylor, J. R., Tétard, C., Thomason, L. W., Thompson, A. M., Tully, M. B., Urban, J., Vanhellemont, F., Vigouroux, C., von Clarmann, T., von der Gathen, P., von Savigny, C., Waters, J. W., Witte, J. C., Wolff, M., and Zawodny, J. M.: Validation of ozone measurements from the Atmospheric Chemistry Experiment (ACE), Atmos. Chem. Phys., 9, 287–343, https://doi.org/10.5194/acp-9-287-2009, 2009.
Eckert, E., von Clarmann, T., Kiefer, M., Stiller, G. P., Lossow, S., Glatthor, N., Degenstein, D. A., Froidevaux, L., Godin-Beekmann, S., Leblanc, T., McDermid, S., Pastel, M., Steinbrecht, W., Swart, D. P. J., Walker, K. A., and Bernath, P. F.: Drift-corrected trends and periodic variations in MIPAS IMK/IAA ozone measurements, Atmos. Chem. Phys., 14, 2571–2589, https://doi.org/10.5194/acp-14-2571-2014, 2014.
Froidevaux, L., Anderson, J., Wang, H.-J., Fuller, R. A., Schwartz, M. J., Santee, M. L., Livesey, N. J., Pumphrey, H. C., Bernath, P. F., Russell III, J. M., and McCormick, M. P.: Global OZone Chemistry And Related trace gas Data records for the Stratosphere (GOZCARDS): methodology and sample results with a focus on HCl, H2O, and O3, Atmos. Chem. Phys., 15, 10471–10507, https://doi.org/10.5194/acp-15-10471-2015, 2015.
Godin-Beekmann, S., Azouz, N., Sofieva, V. F., Hubert, D., Petropavlovskikh, I., Effertz, P., Ancellet, G., Degenstein, D. A., Zawada, D., Froidevaux, L., Frith, S., Wild, J., Davis, S., Steinbrecht, W., Leblanc, T., Querel, R., Tourpali, K., Damadeo, R., Maillard Barras, E., Stübi, R., Vigouroux, C., Arosio, C., Nedoluha, G., Boyd, I., Van Malderen, R., Mahieu, E., Smale, D., and Sussmann, R.: Updated trends of the stratospheric ozone vertical distribution in the 60° S–60° N latitude range based on the LOTUS regression model , Atmos. Chem. Phys., 22, 11657–11673, https://doi.org/10.5194/acp-22-11657-2022, 2022.
Hubert, D., Lambert, J.-C., Verhoelst, T., Granville, J., Keppens, A., Baray, J.-L., Bourassa, A. E., Cortesi, U., Degenstein, D. A., Froidevaux, L., Godin-Beekmann, S., Hoppel, K. W., Johnson, B. J., Kyrölä, E., Leblanc, T., Lichtenberg, G., Marchand, M., McElroy, C. T., Murtagh, D., Nakane, H., Portafaix, T., Querel, R., Russell III, J. M., Salvador, J., Smit, H. G. J., Stebel, K., Steinbrecht, W., Strawbridge, K. B., Stübi, R., Swart, D. P. J., Taha, G., Tarasick, D. W., Thompson, A. M., Urban, J., van Gijsel, J. A. E., Van Malderen, R., von der Gathen, P., Walker, K. A., Wolfram, E., and Zawodny, J. M.: Ground-based assessment of the bias and long-term stability of 14 limb and occultation ozone profile data records, Atmos. Meas. Tech., 9, 2497–2534, https://doi.org/10.5194/amt-9-2497-2016, 2016.
Jia, J., Rozanov, A., Ladstätter-Weißenmayer, A., and Burrows, J. P.: Global validation of SCIAMACHY limb ozone data (versions 2.9 and 3.0, IUP Bremen) using ozonesonde measurements, Atmos. Meas. Tech., 8, 3369–3383, https://doi.org/10.5194/amt-8-3369-2015, 2015.
Jiang, Y. B., Froidevaux, L., Lambert, A., Livesey, N. J., Read, W. G., Waters, J. W., Bojkov, B., Leblanc, T., McDermid, I. S., Godin-Beekmann, S., Filipiak, M. J., Harwood, R. S., Fuller, R. A., Daffer, W. H., Drouin, B. J., Cofield, R. E., Cuddy, D. T., Jarnot, R. F., Knosp, B. W., Perun, V. S., Schwartz, M. J., Snyder, W. V., Stek, P. C., Thurstans, R. P., Wagner, P. A., Allaart, M., Andersen, S. B., Bodeker, G., Calpini, B., Claude, H., Coetzee, G., Davies, J., De Backer, H., Dier, H., Fujiwara, M., Johnson, B., Kelder, H., Leme, N. P., König-Langlo, G., Kyro, E., Laneve, G., Fook, L. S., Merrill, J., Morris, G., Newchurch, M., Oltmans, S., Parrondos, M. C., Posny, F., Schmidlin, F., Skrivankova, P., Stubi, R., Tarasick, D., Thompson, A., Thouret, V., Viatte, P., Vömel, H., von Der Gathen, P., Yela, M., and Zablocki, G.: Validation of Aura Microwave Limb Sounder Ozone by ozonesonde and lidar measurements, J. Geophys. Res.-Atmos., 112, D24S34, https://doi.org/10.1029/2007JD008776, 2007.
Kar, J., McElroy, T., Drummond, J. R., Zou, J., Nichitiu, F., Walker, K. A., Randall, C. E., Nowlan, C. R., Dufour, D. G., Boone, C. D., Bernath, P. F., Trepte, C. R., Thomason, L. W., and McLinden, C.: Initial comparison of ozone and NO2 profiles from ACE-MAESTRO with balloon and satellite data, J. Geophys. Res., 112, D16301, https://doi.org/10.1029/2006JD008242, 2007.
Kramarova, N. A., Nash, E. R., Newman, P. A., Bhartia, P. K., McPeters, R. D., Rault, D. F., Seftor, C. J., Xu, P. Q., and Labow, G. J.: Measuring the Antarctic ozone hole with the new Ozone Mapping and Profiler Suite (OMPS), Atmos. Chem. Phys., 14, 2353–2361, https://doi.org/10.5194/acp-14-2353-2014, 2014.
Laeng, A., von Clarmann, T., Errera, Q., Grabowski, U., and Honomichl, S.: Satellite data validation: a parametrization of the natural variability of atmospheric mixing ratios, Atmos. Meas. Tech., 15, 2407–2416, https://doi.org/10.5194/amt-15-2407-2022, 2022.
McCormick, M. P., Lei, L., Hill, M. T., Anderson, J., Querel, R., and Steinbrecht, W.: Early results and validation of SAGE III-ISS ozone profile measurements from onboard the International Space Station, Atmos. Meas. Tech., 13, 1287–1297, https://doi.org/10.5194/amt-13-1287-2020, 2020.
Moreira, L., Hocke, K., Navas-Guzmán, F., Eckert, E., von Clarmann, T., and Kämpfer, N.: The natural oscillations in stratospheric ozone observed by the GROMOS microwave radiometer at the NDACC station Bern, Atmos. Chem. Phys., 16, 10455–10467, https://doi.org/10.5194/acp-16-10455-2016, 2016.
Nakano, T. and Morofuji, T.: Development of an automated pump-efficiency measuring system for ozonesondes utilizing an airbag-type flowmeter, Atmos. Meas. Tech., 16, 1583–1595, https://doi.org/10.5194/amt-16-1583-2023, 2023.
NASA/GSFC: Southern Hemisphere Additional Ozonesondes version 6 ozonesonde profile data, National Aeronautics and Space Administration Goddard Space Flight Center (NASA/GSFC) [data set], https://doi.org/10.57721/SHADOZ-V06, 2019.
NDACC: Network for the Detection of Atmospheric Composition Change ozonesonde profile data, Network for the Detection of Atmospheric Composition Change (NDACC) [data set], https://www-air.larc.nasa.gov/missions/ndacc/data.html (last access: 3 March 2023), 2022.
RMI: Harmonization and Evaluation of Ground Based Instruments for Free Tropospheric Ozone Measurements, Royal Meteorological Institute of Belgium (RMI) [data set], http://hegiftom.meteo.be (last access: 12 August 2024), 2022.
Salawitch, R. J. (Lead Author), Fahey, D. W., Hegglin, M. I., McBride, L. A., Tribett, W. R., Doherty, S. J.: Twenty Questions and Answers About the Ozone Layer: 2018 Update, Scientific Assessment of Ozone Depletion: 2018, 84 pp., World Meteorological Organization, Geneva, Switzerland, http://ozone.unep.org/science/assessment/sap (last access: 19 November 2024), 2019.
Sepúlveda, E., Cordero, R. R., Damiani, A., Feron, S., Pizarro, J., Zamorano, F., Kivi, R., Sánchez, R., Yela, M., Jumelet, J., Godoy, A., Carrasco, J., Crespo, J. S., Seckmeyer, G., Jorquera, J. A., Carrera, J. M., Valdevenito, B., Cabrera, S., Redondas, A., and Rowel, P. M.: Evaluation of Antarctic Ozone Profiles derived from OMPS-LP by using Balloon-borne Ozonesondes, Sci. Rep. 11, 4288, https://doi.org/10.1038/s41598-021-81954-6, 2021.
Sheese, P. E. and Walker, K.: Data Quality Flags for ACE-FTS Level 2 Version 5.2 Data Set, Borealis, V1 [data set], https://doi.org/10.5683/SP3/NAYNFE, 2023.
Sheese, P. E., Boone, C. D., and Walker, K. A.: Detecting physically unrealistic outliers in ACE-FTS atmospheric measurements, Atmos. Meas. Tech., 8, 741–750, https://doi.org/10.5194/amt-8-741-2015, 2015.
Sheese, P. E., Kaley A. W., Boone, C. D., Bernath, P. F., Froidevaux, L., Funke, B., Raspollini, P., and von Clarmann, T.: ACE-FTS ozone, water vapour, nitrous oxide, nitric acid, and carbon monoxide profile, comparisons with MIPAS and MLS, J. Quant. Spectrosc. Ra., 186, 63–80, https://doi.org/10.1016/j.jqsrt.2016.06.026, 2017.
Sheese, P. E., Walker, K. A., Boone, C. D., Degenstein, D. A., Kolonjari, F., Plummer, D., Kinnison, D. E., Jöckel, P., and von Clarmann, T.: Model estimations of geophysical variability between satellite measurements of ozone profiles, Atmos. Meas. Tech., 14, 1425–1438, https://doi.org/10.5194/amt-14-1425-2021, 2021.
Sheese, P. E., Walker, K. A., Boone, C. D., Bourassa, A. E., Degenstein, D. A., Froidevaux, L., McElroy, C. T., Murtagh, D., Russell III, J. M., and Zou, J.: Assessment of the quality of ACE-FTS stratospheric ozone data, Atmos. Meas. Tech., 15, 1233–1249, https://doi.org/10.5194/amt-15-1233-2022, 2022.
Sofieva, V. F., Kyrölä, E., Laine, M., Tamminen, J., Degenstein, D., Bourassa, A., Roth, C., Zawada, D., Weber, M., Rozanov, A., Rahpoe, N., Stiller, G., Laeng, A., von Clarmann, T., Walker, K. A., Sheese, P., Hubert, D., van Roozendael, M., Zehner, C., Damadeo, R., Zawodny, J., Kramarova, N., and Bhartia, P. K.: Merged SAGE II, Ozone_cci and OMPS ozone profile dataset and evaluation of ozone trends in the stratosphere, Atmos. Chem. Phys., 17, 12533–12552, https://doi.org/10.5194/acp-17-12533-2017, 2017
SPARC/IO3C/GAW: SPARC/IO3C/GAW Report on Long-term Ozone Trends and Uncertainties in the Stratosphere, edited by: Petropavlovskikh, I.,Godin-Beekmann, S., Hubert, D., Damadeo, R., Hassler, B., and Sofieva, V., SPARC Report No. 9, GAW Report No. 241, WCRP-17/2018, https://doi.org/10.17874/f899e57a20b, 2019.
Stauffer, R. M., Thompson, A. M., Kollonige, D. E., Witte, J. C., Tarasick, D. W., Davis, J., Vömel, H., Morris, G. A., Van Malderen, R., Johnson, B. J., Querel, R. R., Selkirk, H. B., Stübi, R., and Smit, H. G. J.: A Post-2013 Dropoff in Total Ozone at a Third of Global Ozonesonde Stations: Electrochemical Concentration Cell Instrument Artifacts?, Geophys. Res. Lett., 47, e2019GL086791, https://doi.org/10.1029/2019GL086791, 2020.
Stauffer, R. M., Thompson, A. M., Kollonige, D. E., Tarasick, D. W., van Malderen, R., Smit, H. G. J., Vömel, H., Morris, G. A., Johnson, B. J., Cullis, P. D., Stübi, R., Davis, J., and Yan, M. M.: An examination of the recent stability of ozonesonde global network data, Earth Space Sci., 9, e2022EA002459, https://doi.org/10.1029/2022EA002459, 2022.
Stauffer, R. M., Thompson, A. M., Kollonige, D. E., Komala, N., Al-Ghazali, H. K., Risdianto, D. Y., Dindang, A., Fairudz bin Jamaluddin, A., Sammathuria, M. K., Zakaria, N. B., Johnson, B. J., and Cullis, P. D.: Dynamical drivers of free-tropospheric ozone increases over equatorial Southeast Asia, Atmos. Chem. Phys., 24, 5221–5234, https://doi.org/10.5194/acp-24-5221-2024, 2024.
Steck, T., von Clarmann, T., Fischer, H., Funke, B., Glatthor, N., Grabowski, U., Höpfner, M., Kellmann, S., Kiefer, M., Linden, A., Milz, M., Stiller, G. P., Wang, D. Y., Allaart, M., Blumenstock, Th., von der Gathen, P., Hansen, G., Hase, F., Hochschild, G., Kopp, G., Kyrö, E., Oelhaf, H., Raffalski, U., Redondas Marrero, A., Remsberg, E., Russell III, J., Stebel, K., Steinbrecht, W., Wetzel, G., Yela, M., and Zhang, G.: Bias determination and precision validation of ozone profiles from MIPAS-Envisat retrieved with the IMK-IAA processor, Atmos. Chem. Phys., 7, 3639–3662, https://doi.org/10.5194/acp-7-3639-2007, 2007.
Steinbrecht, W., Hegglin, M. I., Harris, N., and Weber M.: Is global ozone recovering?, C. R. Geoscience, 350, 368–375, https://doi.org/10.1016/j.crte.2018.07.012, 2018.
Sterling, C. W., Johnson, B. J., Oltmans, S. J., Smit, H. G. J., Jordan, A. F., Cullis, P. D., Hall, E. G., Thompson, A. M., and Witte, J. C.: Homogenizing and estimating the uncertainty in NOAA's long-term vertical ozone profile records measured with the electrochemical concentration cell ozonesonde, Atmos. Meas. Tech., 11, 3661–3687, https://doi.org/10.5194/amt-11-3661-2018, 2018.
Szeląg, M. E., Sofieva, V. F., Degenstein, D., Roth, C., Davis, S., and Froidevaux, L.: Seasonal stratospheric ozone trends over 2000–2018 derived from several merged data sets, Atmos. Chem. Phys., 20, 7035–7047, https://doi.org/10.5194/acp-20-7035-2020, 2020.
Tarasick, D. W., Davies, J., Smit, H. G. J., and Oltmans, S. J.: A re-evaluated Canadian ozonesonde record: measurements of the vertical distribution of ozone over Canada from 1966 to 2013, Atmos. Meas. Tech., 9, 195–214, https://doi.org/10.5194/amt-9-195-2016, 2016.
Tarasick, D. W., Smit, H. G. J., Thompson, A. M., Morris, G. A., Witte, J. C., Davies, J., Nakano, T., van Malderen, R., Stauffer, R. M., Johnson, B. J., Stübi, R., Oltmans, S. J., and Vömel, H.: Improving ECC ozonesonde data quality: Assessment of current methods and outstanding issues, Earth Space Sci., 8, https://doi.org/10.1029/2019EA000914, 2021.
Thompson, A. M., Witte, J. C., Sterling, C., Jordan, A., Johnson, B. J., Oltmans, S. J., Fujiwara, M., Vömel, H., Allaart, M., Piters, A., Coetzee, G. J. R., Posny, F., Corrales, E., Andres Diaz, J., Félix, C., Komala, N., Lai, N., Ahn Nguyen, H. T., Maata, M., Mani, F., Zainal, Z., Ogino, S., Paredes, F.,Bezerra Penha, T., L., Raimundo da Silva, F., Sallons-Mitro, S., Selkirk, H. B., Schmidlin, F. J., Stübi, R., Thiongo, K.: First reprocessing of Southern Hemisphere Additional Ozonesondes (SHADOZ) ozone profiles (1998–2016): 2. Comparisons with satellites and ground-based instruments, J. Geophys. Res.-Atmos., 122, 13000–13025, https://doi.org/10.1002/2017JD027406, 2017.
Thompson, A. M., Stauffer, R. M., Witte, J. C., Kollonige, D. E., Wargan, K., and Ziemke, J. R.: Regional and seasonal trends in tropical ozone from SHADOZ profiles: reference for models and satellite products, J. Geophys. Res.-Atmos., 126, e2021JD034691, https://doi.org/10.1029/2021JD034691, 2021.
Toihir, A. M., Portafaix, T., Sivakumar, V., Bencherif, H., Pazmiño, A., and Bègue, N.: Variability and trend in ozone over the southern tropics and subtropics, Ann. Geophys., 36, 381–404, https://doi.org/10.5194/angeo-36-381-2018, 2018.
Walker, K. A., Randall, C. E., Trepte, C. R., Boone, C. D., and Bernath, P. F.: Initial validation comparisons for the Atmospheric Chemistry Experiment (ACE-FTS), Geophys. Res. Lett., 32, L16S04, https://doi.org/10.1029/2005GL022388, 2005.
Wang, H. J. R., Damadeo, R., Flittner, D., Kramarova, N., Taha, G., Davis, S., Thompson, A. M., Strahan, S., Wang, Y., Froidevaux, L., Degenstein, D., Bourassa, A., Steinbrecht, W., Walker, K. A., Querel, R., Leblanc, T., Godin-Beekmann, S., Hurst, D., and Hall, E.: Validation of SAGE III/ISS solar occultation ozone products with correlative satellite and ground-based measurements, J. Geophys. Res.-Atmos., 125, e2020JD032430, https://doi.org/10.1029/2020JD032430, 2020.
Witte, J. C., Thompson, A. M., Smit, H. G. J., Fujiwara, M., Posny, F., Coetzee, G. J. R., Northam, E., T., Johnson, B. J., Sterling, C. W., Mohamad, M. Ogino, S.-Y., Jordan, A., and da Silva1, F. R.: First reprocessing of Southern Hemisphere ADditional OZonesondes (SHADOZ) profile records (1998-2015): 1. Methodology and evaluation, J. Geophys. Res.-Atmos., 122, 6611–6636, https://doi.org/10.1002/2016JD026403, 2017.
Witte, J. C., Thompson, A. M., Smit, H. G. J., Vömel, H., Posny, F., and Stübe, R.: First reprocessing of Southern Hemisphere ADditional OZonesondes profile records: 3. Uncertainty in ozone profile and total column, J. Geophys. Res.-Atmos., 123, 3243–3268, https://doi.org/10.1002/2017JD027791, 2018.
WOUDC: OzoneSonde, World Ozone and Ultraviolet Data Centre (WOUDC) [data set], https://doi.org/10.14287/10000008, 2022.
Zeng, G., Morgenstern, O., Shiona, H., Thomas, A. J., Querel, R. R., and Nichol, S. E.: Attribution of recent ozone changes in the Southern Hemisphere mid-latitudes using statistical analysis and chemistry–climate model simulations, Atmos. Chem. Phys., 17, 10495–10513, https://doi.org/10.5194/acp-17-10495-2017, 2017.


