the Creative Commons Attribution 4.0 License.
the Creative Commons Attribution 4.0 License.
An economical tunable diode laser spectrometer for fast-response measurements of water vapor in the atmospheric boundary layer
Emily D. Wein
Lars E. Kalnajs
Darin W. Toohey
Water vapor in the atmospheric boundary layer poses a significant measurement challenge, with abundances varying by an order of magnitude over short spatial and temporal scales. Herein, we describe the design and characterization of an economical and flexible open-path, fast-response instrument for measurements of water vapor. The in situ method of tunable diode laser absorption spectroscopy in the shortwave infrared was chosen based on a heritage with previous instruments developed in our laboratory and flown on research aircraft. The instrument is constructed from readily available components and based on low-cost distributed feedback laser diodes that enjoy widespread use for high-speed fiber-optic telecommunications. A pair of versatile, high-speed Advanced RISC Machine-based microcontrollers drive the laser and acquire and store data. High precision and reproducibility are obtained by tight temperature regulation of the laser with a miniature commercial proportional-integral controller. The instrument is powered by two rechargeable 3.6 V lithium-ion batteries, consumes 2 W of power, weighs under 1 kg, and is constructed from hardware costing less than USD 3000. The new tunable diode laser spectrometer (TDLS) agreed to within 2 % compared to a laboratory standard and displayed a precision of 10 ppm at a sample rate of 10 Hz. The new instrument is robust and simple to use, allowing users with little previous experience in laser spectroscopy to acquire high-quality, fast-response observations of water vapor for a variety of applications. These include frequent horizontal and vertical profiling by uncrewed aerial vehicles (UAVs); long-term eddy covariance measurements from fixed and portable flux towers; and routine measurements of humidity from weather stations in remote locations such as the polar ice caps, mountains, and glaciers.
- Article
(2234 KB) - Full-text XML
- BibTeX
- EndNote
The sources, sinks, and transport of water vapor within the atmospheric boundary layer (ABL) are key components of radiation budgets and meteorology (Trenberth et al., 2005). Water vapor mixing ratios in the ABL display high spatiotemporal variability due to the complex nature of land–surface interactions that drive sources and the clouds and precipitation that drive sinks (Santanello et al., 2018). At large scales, mixing ratios vary from 1500 parts per million by volume (“ppm” here and throughout) in the Arctic to 25 000 ppm in the tropics, whereas they can range over 5 orders of magnitude from the surface to the upper troposphere (Wulfmeyer et al., 2015). On scales of 100 to 1000 m, mixing ratios vary by tens of percent because of differences in local land surface, temperature dynamics, and wind fields (Fischer et al., 2012; Kiemle et al., 2011; Shivers et al., 2019). Observations of this variability are essential for elucidating the underlying micrometeorological processes and quantifying local-scale (100 m) radiation budgets important to the prediction of turbulent and convective processes and their impacts (Couvreux et al., 2009; Fabry, 2006; Ogunjemiyo et al., 2002). However, observations have been limited by the relatively high cost of existing instruments and the lack of high-quality data from more economical ones (Geerts et al., 2018).
Satellite-based remote sensing measurements are too coarse to resolve important variations of water vapor on very small scales (Trent et al., 2018). Therefore, fast-response in situ and lidar-based instruments have become the primary methods for observing water vapor from the surface and from mobile platforms for process-oriented studies. The latter (e.g., differential absorption lidars and Raman lidars), capable of multidimensional measurements with spatiotemporal resolutions of 10 to 100 m and greater than 1 s, are deployed frequently for profiling the ABL (Wulfmeyer et al., 2015). However, relatively high cost and operational demands limit their usefulness for more widespread deployment. Alternatively, fast-response in situ instruments have found increasing use in a variety of applications for measurements of small-scale variations in the ABL. They capture the smallest and fastest atmospheric variations near the surface where the atmosphere is not well mixed (Geerts et al., 2018). Incorporating high sampling rates faster than 1 Hz, instruments such as infrared gas analyzers (IRGAs) that rely on non-dispersive infrared light are typically used to monitor surface-based fluxes of H2O and CO2 within ecosystems (Aubinet et al., 2012). These research-grade instruments are used predominantly at multi-instrumented flux towers and weather stations and tend to be expensive, often costing USD 20 000 or more. In addition, they can incur additional costs for factory service to maintain high accuracy. Consequently, their use in remote locations has been relatively limited.
At the other end of the cost spectrum are various versions of capacitive humidity sensors that employ thin-film water-sensitive polymers sandwiched between two electrodes. These tiny sensors, costing only tens to hundreds of dollars, have found frequent use among hobbyists and research scientists for routine measurements from surface weather stations (Muller et al., 2015). They have been used in radiosondes for more than 40 years, and they can be accurate to ∼ 0.8 % over a wide range of humidities. Although they are small and relatively inexpensive, they respond slowly to changes in water vapor, and they exhibit measurement biases that limit their usefulness for high-frequency observations (e.g., Miloshevich et al., 2004, 2009; Segales et al., 2022).
High-resolution in situ observations of H2O are essential for numerical weather prediction and for investigations of the evolution of the ABL and its turbulence characteristics (e.g., large eddy simulations), and there is a need for more frequent measurements from remote locations (Helbig et al., 2021; Petersen, 2016). We report here on the development of a new economical fast-response laser spectrometer. The instrument is capable of high-resolution measurements of water vapor in the ABL while demonstrating high accuracy and precision comparable to that of commercially available research-grade instruments. Built from low-cost components that are readily available commercially, the instrument exhibits relatively low up-front costs, with the ability to replace critical components, thus bridging the gap between the more expensive and highly accurate fast-response instruments and the relatively inexpensive, but slower-response capacitive instruments.
The design described here is an adaptation of previous instruments that have a 30-year history of use on research aircraft including the NASA ER-2, DC-8, WB-57F, and NCAR GV (May and Webster, 1993; May, 1998; Newell et al., 1996; Hallar et al., 2004; Davis et al., 2007; Dorsi et al., 2014). As in those instruments, it employs a commercial telecommunications fiber-coupled distributed feedback (DFB) laser in a common butterfly package with self-contained thermoelectric coolers (TECs) for precise selection of wavelength and for reducing absorption by water vapor in trapped spaces in complex coupling optics (Dorsi et al., 2014). The instrument is built from commercial off-the-shelf components, and it exhibits performance comparable to instruments costing an order of magnitude more. The new design is flexible and simple, allowing for accurate and reliable measurements of water vapor for investigators with little previous experience in laser spectroscopy while being easily adaptable to different contexts and other atmospheric species.
Several immediate applications are envisioned for this new instrument. One involves fast-response, open-path observations of water vapor from a small UAV, such as a hexacopter. While this application has already been explored, such as in Bärfuss et al. (2023), Pillar-Little et al. (2021), Segales et al. (2020), and Varentsov et al. (2023), the instruments used have slow response times, resulting in limited vertical resolution (Segales et al., 2022). The instrument described in this paper would be ideal for obtaining observations over very small scales (e.g., centimeters), including obtaining frequent high-resolution thermodynamic profiles at locations such as remote land and ocean regions where observational gaps limit numerical weather prediction and climate modeling (Brotzge et al., 2023; Kämpfer, 2013). Another application is tracking water-resource loss from reservoirs with ground-based flux measurements. There is a need to increase the density of measurements on specific reservoirs to map out the large spatial and temporal gradients in humidity due to adjacent complex terrain that contributes to significant errors in latent heat fluxes derived from those measurements (Friedrich et al., 2018). Expanding sensor networks with economical instruments that maintain high accuracy and precision to monitor evaporation in regions of complex terrain can open up new areas of study and fill gaps where there is limited knowledge of the importance of evaporation to water availability, especially in arid regions (Roth and Blanken, 2023). Such a capability will also enable new studies of ecosystem exchange in geographic regions that have been historically underserved, for example, in developing countries (Markwitz and Siebicke, 2019; Kim et al., 2022).
2.1 Hardware description
The TDLS instrument described here is based on a design reported previously for measurements of condensed water contents from research aircraft (Dorsi et al., 2014). A DFB laser diode (NLK1E56AA, NTT Innovative Devices, Yokohama, Japan) emitting radiation with a wavelength centered at 1368.6 nm at room temperature is rapidly scanned over a strong water vapor absorption line. To avoid damping of high-frequency variations, a short (∼ 20 cm), open-path, single-pass optical cell was constructed of low-cost commercial components. Water vapor mixing ratios in the range 2000–20 000 ppm are readily retrieved with high precision (± 10 ppm). The primary novelty of the new TDLS is a low-power, low-cost electronics package that simultaneously drives the laser with rapid linear current ramps over a highly stable wavelength range while acquiring data for subsequent processing of the scans into accurate mixing ratios based on laboratory calibrations. An overview of the instrument is depicted in Fig. 1.
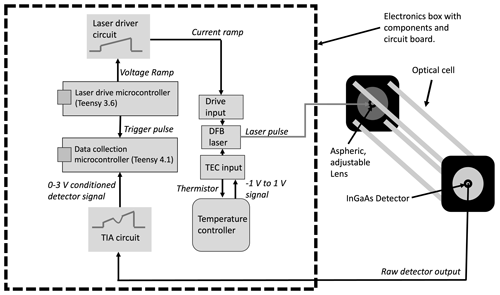
Figure 1Schematic diagram of the new TDLS. Arrows represent the direction of information flow between individual components, including microcontrollers, laser, and temperature controller, or individual circuits, such as the transimpedance amplifier (TIA) and laser driver circuit. The components surrounded by the bold dashed line are contained on a single printed circuit board (schematic shown in Fig. 3). The output fiber from the laser is passed to the external optics through a FC/APC style fiber optic bulkhead coupler, and a twisted wire pair brings the detector signal back into the electronics box through a hermetic seal.
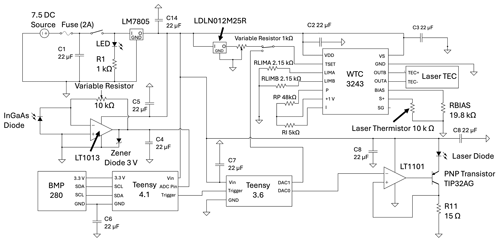
The laser is tuned to the wavelength of a strong water absorption feature at 1368.59 nm by changing the temperature of a TEC in the laser butterfly package with a commercial proportional-integral (PI) TEC controller (WTC 3243, Wavelength Electronics, Bozeman, MT) (Gordon et al., 2022). Temperature is maintained at ± 0.002 K of the set point, consistent with the manufacturer's specification. This set point is derived from a voltage divider sourced with a high-precision reference (e.g., LDLN025M25R, STMicroelectronics, Geneva, Switzerland) and a variable resistor. This stability is important for maintaining a reproducible output wavelength of the laser. If desired, a voltage from a digital-to-analog (DAC) output can be used for dynamic temperature control.
Two independent Arduino-compatible microcontrollers (PJRC, Sherwood, OR) were chosen for separately driving the laser (a Teensy 3.6) and for data acquisition (a Teensy 4.1). These microcontrollers employ low-cost Advanced RISC Machine (ARM) Cortex-M-series processors, exhibiting a balance of speed and flexibility. Previous instruments developed in our lab that employ the same measurement technique as reported here use single or multi-core general-purpose processors running full operating systems such as Linux on a PC-104 form-factor single-board computer (Hallar et al., 2004; Dorsi et al., 2014). Unpublished work in our lab showed that imprecise timing of the output ramp for the laser caused by software interrupts produced an unstable PI temperature of the laser TEC that resulted in wavelength “jitter” (movement of the position of the line center in the laser scan) (Rainwater, 2022). Separating the input and output functions allows for precise control of the laser and highly reproducible scans up to ∼ 1 kHz. The microcontrollers simplify the electronics while also allowing for uninterrupted laser scanning while the detector signal is acquired, processed, and stored.
An integrated 12-bit, 100 ksps (kilosamples per second) DAC on the Teensy 3.6 provides the drive voltage for scanning the laser current. The middle panel in Fig. 2 shows an example of a series of linear ramps used as the drive function, each consisting of 1366 discreet 1-bit steps from 0.80 to 1.9 V. This voltage is conditioned with an operational amplifier (LT1101, Analog Devices, Wilmington, MA) that controls the current required to scan the laser from a transistor (TIP 32AG PNP transistor) in a textbook voltage-to-current converter circuit (Fig. 6.31 of Horowitz and Hill, 1983). A complete electronics circuit diagram is shown in Fig. 3. The scan rate, the current range, and a pause for background time are configured in software.
Before the start of each scan, the Teensy 3.6 produces a voltage pulse (trigger), shown on the bottom panel of Fig. 2, that initiates the data acquisition and storage process on the Teensy 4.1. At this time, the internal clock is recorded into a buffer, and the output from the detector transimpedance amplifier (TIA) is recorded onto a microSD card as a single scan consisting of 445 discreet samples at 12-bit resolution. Although the Teensy 4.1 samples at 300 ksps, we oversampled 32 times using a software function that reduces noise inherent in the analog-to-digital converter (ADC). This resulted in a minimum resolvable signal of ∼ 0.2 mV.
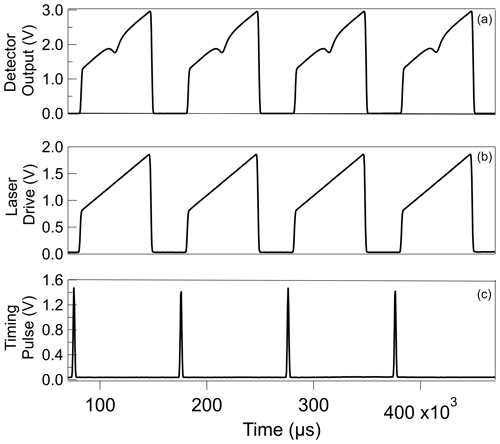
Figure 2Important elements of the TDLS laser scans as a function of time. The detector output (a) is the continuous voltage from the TIA. About one-third of the time the laser is powered off, and the signal is the background for the detector and TIA circuit. The laser drive (b) represents the voltage output by the Teensy 3.6 used to set the current of the laser. A trigger pulse signal (c) sent by the Teensy 3.6 is read by the Teensy 4.1 to initiate sampling and recording of the scan.
For this work, a single-pass, open-path, 21.5 cm optical cell was constructed with a fixed 30 mm cage-plate assembly (Thorlabs, Newton, NJ). One end housed an adjustable aspheric collimating lens (CFC11A-C Adjustable Fiber Collimator, FC/APC, f=11.0 mm, 1050–1620 nm AR, Thorlabs) that was attached to the FC/APC output of the laser. The lens was configured so that the laser beam was divergent to fully illuminate the active area of a low-noise broadband indium gallium arsenide (InGaAs) semiconductor photodiode and reduce variations in intensity due to vibration and turbulent fluctuations of air density in the optical path. Several photodiodes from different manufacturers (FDGA05, Thorlabs; FC1500, Fermionics, Simi Valley, CA) were used in this work at various times with no significant difference in results or performance. The photodiode was operated in photovoltaic mode, and the photocurrent was converted to a voltage up to a maximum of 3.3 V with a custom-built low-noise transimpedance amplifier (TIA) circuit using a single-supply operational amplifier amp (LT1013, Analog Devices). The amplifier gain was tuned using a 10 kΩ variable resistor. The top panel in Fig. 2 shows the continuous output of this circuit over ∼ 400 ms.
The two Teensy microcontrollers, laser temperature controller, detector amplifier, batteries, and power conditioning were placed on a custom-built circuit board (OSH Park, Portland, OR). The instrument was powered on or off with a single-pole–single-throw toggle switch, with a small light-emitting diode (LED) that indicates when the instrument is running. An LED on the Teensy 4.1 indicated when data were being written to the microSD card. The instrument consumes 2.0 W of power, and it can operate for 2 h when powered by two 3.6 V rechargeable lithium-ion batteries (e.g., ARB-L16-700UP, Fenix Lighting, Littleton, CO). Alternatively, it can be run indefinitely from a 7.5 V (or greater) DC power supply, as well as either of the Teensy microUSB 5 V inputs. All components, except the optical cell, coupling laser fiber-optic cable, and twisted-pair of electrical wires leading to the detector, were packaged in a box with dimensions of cm (PN-1324-C, Solutions Direct, Riverside, CA).
2.2 Spectral processing
Water vapor concentrations are derived using the approach described previously (Dorsi et al., 2014). Figure 4a shows a single scan over the absorption line consisting of 445 individual measurements of the amplified detector signal. Briefly, a small detector/amplifier offset is determined from 10 points at the start and 10 points at the end of each scan while the laser is powered off. Then, short segments near the beginning and end of the current ramp outside of the water vapor absorption feature are identified for calculating the background (i.e., I0(t)) based on a linear fit (dashed line in Fig. 4a).
To account for possible drift of laser wavelength (e.g., the position of the absorption feature in a scan), the relationship between scan position and laser wavelength was estimated using a pair of closely spaced water absorption lines at 1373.3002 and 1373.2878 nm emitted by a similar model DFB laser centered on a different wavelength than the one used for the measurements in this paper. The position of this pair was systematically scanned across the full temperature range of a single current ramp by slowly varying the set point of the laser TEC temperature controller, and the spacing between the two lines (i.e., Δλ=0.0124 nm) was determined in units of scan index (e.g., see Fig. 4). A linear fit to the ratio of this spacing to the difference in scan index was determined as a function of scan position:
where s(x) is the change in wavelength per scan index (of the 445 points) and x is the scan index value. Using this function results in a near-constant line width as a function of wavelength if the position of the absorption feature shifts due to variations in laser baseplate temperature. Although such a shift was never observed in these experiments, it is a consideration for measurements in an environment where ambient temperature may vary significantly (e.g., by many tens of degrees). This method also allowed for the determination of the full width of the scan to be 0.279 nm for the specific scan start and end points and scan rate used in these experiments.
Based on the Beer–Lambert law, water concentration is proportional to the integral of absorbance A= ln() over the full width of the absorption line. This integral is estimated as the sum of discreet points as in Eq. (1).
An example of a single laser scan converted to absorbance is shown in Fig. 4b. The resulting integral is related to concentration of water vapor by a response factor determined by laboratory calibration using a high-accuracy cavity ring-down spectrometer, or CRDS (L-2120i, Picarro, Santa Clara, CA), referenced to a dew-point generator (LI-610, LI-COR, Lincoln, NE). Ambient water concentrations and mixing ratios are interchangeable through the ideal gas law using concurrent measurements of temperature and pressure, which, for this work, were measured with a small sensor (BMP280, Bosch Sensortec, Reutlingen, Germany) placed midway between the output lens of the laser and the detector just outside the laser beam (Noone et al., 2011; Henze et al., 2023). The precision of this sensor was measured to be ± 1 Pa and ± 0.01 °C, with an accuracy of ± 1 % when compared to laboratory standards.
For this work, we store the raw scan data with T, P, and a timestamp and perform data analysis in post-processing using code written in Python. This maximizes precision and flexibility while allowing us to evaluate performance with various diagnostic variables (e.g., those investigating stability or interference) that are readily derivable from raw scans. Future iterations of this design will be simplified to include real-time processing of the spectra on the Teensy 4.1 before data are written on the microSD card. Processing of spectra in real time takes a fraction of the clock cycles needed for writing an entire raw scan and will not affect instrument time response. The Arduino processing codes used in this study are available on GitHub.
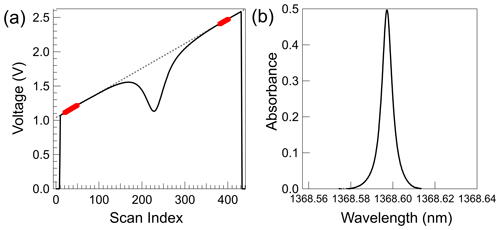
Figure 4(a) Example of the output of the TIA for a single scan of the DFB laser consisting of 445 discreet points. The dashed line is a linear fit in a region where absorbance by H2O is negligible (defined as Io). The fit is made between the points highlighted in red. For all results shown, except Fig. 6, we have used 30 points at the start of the scan and 20 points at the end. (b) Absorbance is defined as ln() for a single scan of the DFB laser. The integral signal is calculated by summing over the calculated absorbance with respect to wavelength.
The TDLS integrals were calibrated by sampling a range of mixing ratios in an unsealed 250 L polycarbonate chamber from 6970 to 25 700 ppm as reported by the CRDS. The TDLS optical cell was placed in the center of the chamber, and a fan was used to ensure the chamber was well mixed. The sampling line of the CRDS was aligned with the midpoint of the TDLS open-path cell and positioned just outside the path of the laser beam. A beaker containing warm water was placed inside the chamber to humidify the air to a value just below the saturation point at lab temperature. Over the next 2 h, mixing ratios were reduced to 13 520 ppm by stepwise addition of relatively dry ambient air from the laboratory into the chamber. Values below 13 000 ppm were produced by further dilutions using a flow of dry air from a cylinder of Ultra Zero Air (H2O < 2 ppm, total hydrocarbons < 0.1 ppm, Airgas, Dacono, CO). TDLS concentrations were converted to mixing ratios using pressure and temperature as measured from the BMP280 sensor, and the results are shown in Fig. 5. The deviation between the two data sets is less than 2 % over the full range of the calibration. This is larger than the precision of the CRDS, which is ∼ 10 ppm, and so the deviation is mostly due to small differences in water vapor in the paths sampled by the two instruments.
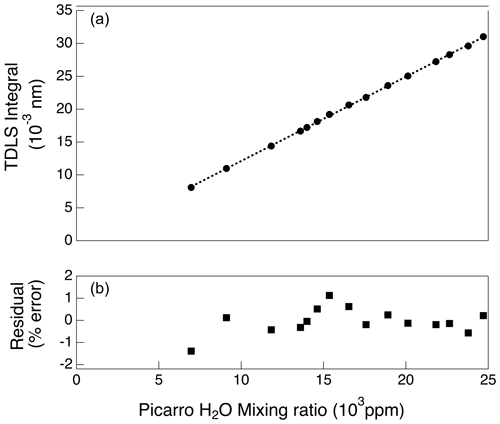
Figure 5(a) Integral signal of the TDLS calculated as described in the text as a function of water vapor mixing ratio (black points) determined by simultaneous measurements with a Picarro L-2120i CRDS. The dotted line represents a linear fit to the results over the range 6970–24 970 ppm. (b) Residual error, as percent of measurement, plotted for each of the points in panel (a). Fit parameters: slope ; intercept = 0.0069; R2=0.9998.
The precision and stability of the TDLS under controlled laboratory conditions were assessed using a standard Allan-variance analysis (Werle et al., 1993). Precision is taken to be the square root of the Allan variance at the highest sample rate. To reduce variations in ambient water vapor, the output fiber of the laser was attached to one end of the 53.3 cm long sample cell of the CU second-generation closed-path laser hygrometer (CLH-2) that was held at fixed pressure and temperature. The signal was detected with an InGaAs FC/APC-coupled detector (FGA04, Thorlabs) as described elsewhere (Dorsi et al., 2014). In this manner, electronic noise and drift could be assessed independent of variations in pressure, temperature, and water concentration. The results, shown in Fig. 6, demonstrate a precision of 10 ppm at 0.1 s response time for a water abundance of 11 800 ppm for a 20 cm optical path. This represents a fractional absorbance of 10−3 for the conditions of the test. Averaging (increased integration time) allows the precision to be improved by an order of magnitude down to 0.9 ppm at 78 s, corresponding to a sensitivity of 1 part in 104.
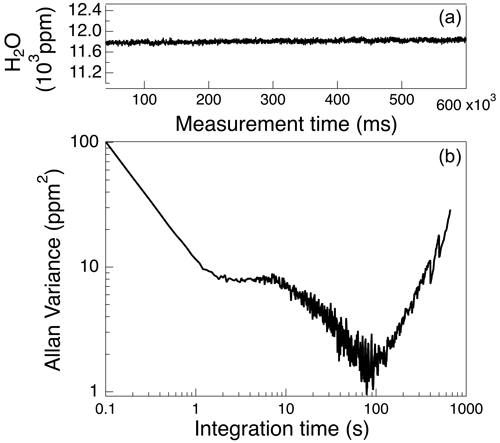
Figure 6(a) Time series of water vapor mixing ratio for a ∼ 10 min segment from a laboratory measurement in a sealed absorption cell held at constant temperature and pressure. (b) Allan Variance calculated for a 20 000 sample segment of data during a period with low H2O variance, such as that shown in panel (a). The instrument demonstrates a precision of 10 ppm at 10 Hz (the intercept in panel b) with 50 points used for each of the background segments (e.g., red points in Fig. 4).
The performance of the TDLS was assessed in several real-world demonstrations. The goals were to demonstrate stability for long-term observations and accurate quantification of fast variations of water vapor. The first demonstration was an intercomparison with a commercial analyzer with a long history of eddy covariance measurements of CO2 and H2O in a variety of environments (e.g., Burns et al., 2009; Ocheltree and Loescher, 2007; Pokorný et al., 2012; Zhao and Tans, 2006). The LI-7000 (LI-COR, Lincoln, NE, 2004) is a high-performance, dual-cell nondispersive infrared (NDIR) instrument with an accuracy for H2O of ± 1 % and a precision (rms noise) of 2 ppm at 5 Hz (LI-7000 instruction manual; publication 984-07364, 2007). The site chosen for this test was the exterior of our laboratory, where large variations in H2O would be expected from local sources such as vegetation and passing pedestrians. Figure 7 shows the power series densities (PSDs) for both instruments for 2000-sample segments of data.
At frequencies up to ∼ 1 Hz, the two instruments exhibit similar behavior, with power dropping with increasing frequency following a −2/3 power law typical of long-lived atmospheric variations (Wu et al., 2015). Above 2 Hz, the LI-7000 power spectrum deviates below this power law due to the damping of higher frequencies characteristic of closed-path measurements (Aslan et al., 2021). Conversely, the power spectrum of the TDLS trends above the power law at > 2 Hz exhibit a measurement precision of ∼ 10−3 absorbance, consistent with that determined from the Allan-variance analysis in the static cell shown in Fig. 6.
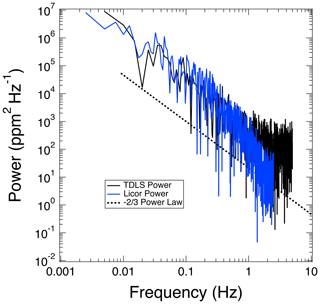
Figure 7Power spectral density (PSD) of the LI-7000 and new TDLS as a function of measurement frequency. The dotted line is a power law scaled by Hz−1 that is expected for variability of ambient H2O. The maximum frequency determined by the PSD calculation is one-half of the sample rate – e.g., 2.5 Hz for the LI-7000 and 5 Hz for the TDLS.
To test the stability of the TDLS over a period of days, we performed a 3 d intercomparison with the same CRDS used for the calibration described above. Both instruments sampled air from the top of a shipping container used for housing electronics in the Department of Atmospheric and Oceanic Sciences (ATOC) Skywatch Observatory located on the East Campus (40.01° N, 105.24° W; elevation: 1600 m) of the University of Colorado Boulder. The CRDS and associated vacuum pump were placed insider the container, pulling air from a 3 m long, 1/4 in. o.d. copper line running vertically up the side of the container and terminating with a 3.8 cm radius, 180° bend to avoid ingesting precipitation. The optical cell for the TDLS was installed at the same elevation approximately ∼ 1.5 m from this inlet. A 25 m fiber optic patch cable connected the output of the laser to the collimating lens on the input of the optical cell, and a 10 m twisted pair of wires brought the detector signal back to the TDLS electronics box, which was housed in the shipping container. It is important to note that a better design would have placed the detector amplifier close to the detector to reduce noise pickup; therefore, this setup likely represents the worst-case noise of the TDLS for such a remote installation.
Observations from the TDLS and the CRDS instruments at their native resolutions of 10 and 0.55 Hz, respectively, are shown for 3 continuous days in Fig. 8a. Over this period, H2O mixing ratios varied from around 5000 to 12 000 ppm, while ambient temperature varied from around 10 to 34 °C. There were multiple occurrences of precipitation and virga and periods of variable cloud cover and direct sunlight. There were several important outcomes from this test. First, the detector/amplifier zero signal from the TDLS (not shown here) varied from 0.006 to 0.26 V (i.e., < 10 % of average laser signal) from direct sunlight or reflections, thus providing a good test of the validity of the method described above for extracting water vapor mixing ratios from individual spectra. The background was successfully subtracted out before calculation, but this issue could be readily addressed in a proper field experiment by suitable baffling of the optics to block the incoming solar radiation. Second, the robustness and reliability of the spectroscopic foundation of the measurement were demonstrated by the successful acquisition of 4.17×10⁶ unique and independent spectra over this period, with rejection of fewer than 0.05 % due to detector signal that was clipped or filtered when the scan background used to calculate Io varied by more than 2 %. These losses of signal, which typically lasted only a few seconds and self-corrected, occurred during precipitation. They were likely due to condensed water blocking the light path.
A scatterplot of several days of continuous measurements by both instruments is shown in Fig. 8b. Over 5000 observations of 30 s averages are represented in this plot. The TDLS measurements were first averaged in bins of 20 measurements (e.g., to a 2 s time base), and the results were then merged with the matching times recorded by the CRDS. Both observations were then bin-averaged down to ∼ 30 s to correspond with the digital smoothing inherent in the Picarro L-2120i software. The instruments show remarkable agreement over the entire sampling period, with a < 4 % deviation from a 1:1 correspondence and a 0.993 coefficient of determination (R2). It is noteworthy that this averaging has removed 80 % of the variability of ambient H2O largely due to what is occurring on the fastest timescales, including variability due to the CRDS inlet and optical cell being separated by 1.5 m.
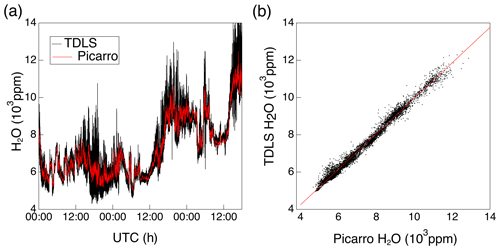
Figure 8(a) Time series of CRDS and TDLS traces for continuous sampling starting at 00:00 UTC (coordinated universal time) on 5 May and ending at 17:45 UTC on 8 May. (b) Scatterplot of 30 s averages of measurements from the TDLS (y axis) and CRDS (x axis).
Table 1List of components used in the TDLS.
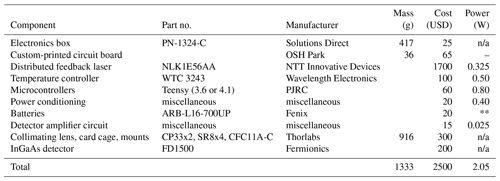
We use “n/a” to refer to components that are non-electronic. For the batteries, ** means power is provided by the batteries.
The stability of the new TDLS was also assessed by examining three metrics of system performance, including detector signal at the start and end of each laser scan (representative of laser stability and optical efficiency), the ratio of these values (representative of laser and detector stability), and the position of the line center of the water vapor absorption feature (a direct measure of the temperature of the laser TEC). In all experiments described here, the ratio of amplified detector signal at the start and end of each scan was found to vary by less than 2 % after subtracting the zero signal measured when the laser is powered off. In addition, the center position of the water vapor line drifted by ± 1 scan index point or less from scan to scan. Based on a calibration of the temperature dependence of line position using the set point of the PI controller to vary laser TEC temperature, it was found that this stability corresponds to < 0.001 K, a result that is consistent with the specifications of the WTC-3243.
The goal of this work was to design, build, and characterize an economical and flexible fast-response instrument suitable for measurements of water vapor in the ABL. The entire electronics package is inexpensive and built with generalized components separated from the optical cell. A primary consideration was the use of low-cost, low-power, commercial off-the-shelf components that, when combined with readily available lasers used by the telecom industry, allow for high-quality, high-frequency observations at a fraction of the cost of commercial instruments with similar measurement characteristics. The key enabler for this new TDLS is the family of ARM-based microcontrollers based on the Cortex-M4 and M7 RISC integrated circuits. In this case, one controller is dedicated to controlling the laser in a highly reproducible manner required for maintaining tight temperature control with a commercial PI temperature controller package. In large part, the use of highly efficient microcontrollers resulted in a system that consumed only 2.0 W and could run for several hours on a pair of small, rechargeable batteries. The resulting total hardware cost of the instrument is mainly due to the laser, detector, and optics. The remaining components (Teensy, circuit board, and various electronics) total around USD 300. A list of components with manufacturer, model, mass, power consumption, and price at the time of purchase is shown in Table 1.
Since this project was undertaken, the Teensy family of microcontrollers has been impacted by global supply chain shortages of chips. Thus, the Teensy 3.6 is no longer available, and an alternative is needed to drive the laser. The primary consideration is that the laser-driving function must be highly reproducible, both in ramp frequency and in power, to maintain precise tuning of the DFB output wavelength across the scan window. Replicating the measurements shown here would require generating ∼ 1000 points per scan at a rate of 10 Hz (i.e., 10 ksps), with 12-bit resolution and uniform time steps for each update of the DAC. Several microcontrollers have demonstrated this level of performance, including the ItsyBitsy M4 Express (Adafruit Industries, Brooklyn, NY), which also employs the Cortex-M4 processor and fast 12-bit true analog DAC. It would also be straightforward to use the Teensy 4.1 digital lines to drive a commercial DAC chip such as the AD5638 series from Analog Devices. Also noteworthy is that we have carried out tests showing that full scans of ∼ 1000 Hz are possible with some of these alternatives, potentially enabling high-accuracy sampling at 10 times to 100 times the rates shown here, albeit with reduced precision.
Throughout this work, we experimented with other designs, including the components that convert the voltage into current to drive the laser output, different configurations for the transimpedance amplifier, and lower-voltage electronics that allow for the operation of a single 3.6 V lithium battery. In all cases, similar high performance was maintained. For example, we have successfully powered the laser with a miniature low-power diode laser driver (FL500, Wavelength Electronics). The FL500 also offers additional useful features such as overvoltage protection and enable/disable pins to protect the laser. Out of convenience, all the results shown here were obtained with the InGaAs detector operated with zero bias and a simple transimpedance amplifier circuit powered by 5 V. It is possible to further reduce detector/amplifier noise by biasing the InGaAs detector with −2.5 V. Finally, we have successfully demonstrated that significantly lower power consumption is possible by using components that operate at 3.3 V, thus eliminating the need for two 3.6 V batteries in series.
One of the initial goals of this work was to develop a package that allows for quick swapping of lasers and optics in the field. This is achieved by using a DFB laser in a standard butterfly package with integrated thermistor and TEC and a fiber-coupled FC/APC connector. Such an approach allows for swapping electronics with different lasers for probing different gases or for swapping optical systems allowing for different optical path lengths required to achieve adequate sensitivity, including options for employing folded optics such as Herriott cells or retroreflectors. Future applications envisioned by our laboratory include measurements of water vapor from stratospheric balloons, on small unattended aerial vehicles, and autonomous measurements from meteorological stations in remote locations, such as on buoys, the Antarctic Plateau, or mountain peaks.
We have developed an economical and flexible fast-response TDLS suitable for measurements of water vapor in the ABL. The instrument bridges the current gap between research-grade instruments costing tens of thousands of dollars and low-cost sensors commonly employed in portable meteorological stations and handheld devices. The novel feature of the new instrument is the use of a pair of low-cost, low-power microprocessors based on the Cortex-M-series ARM family of integrated circuits. A series of intercomparisons with existing instruments used for high-accuracy measurements of water vapor, including for eddy covariance, demonstrates that the new instrument is well suited for similar measurements at a fraction of the cost of existing instruments. Such a capability allows users with little previous expertise in instrumentation to acquire high-quality, fast-response observations of water vapor for a variety of applications, including frequent horizontal and vertical profiling by uncrewed aerial vehicles; long-term eddy covariance measurements from fixed and portable flux towers; and routine measurements of humidity from weather stations in remote locations such as the polar ice caps, mountains, and glaciers.
The extraction codes and Arduino sketches are available open source on GitHub (https://doi.org/10.5281/ZENODO.14291449, emiwein, 2024).
The data and circuit designs used in this paper are available from the corresponding author upon request.
DT conceived and managed the project, including acquiring funding. The new TDLS was designed and fabricated by DWT, EDW, and LEK. EDW developed code for operating and extracting data from the TDLS. EDW performed experimental work and data analysis, with assistance from DWT. The drafting of the manuscript was coordinated by EDW, with contributions from all three authors.
At least one of the (co-)authors is a member of the editorial board of Atmospheric Measurement Techniques. The peer-review process was guided by an independent editor, and the authors also have no other competing interests to declare.
Any opinions, findings, conclusions or recommendations expressed in this material are those of the authors and do not necessarily reflect the views of the National Science Foundation, NASA, or the University of Colorado Boulder.
Publisher’s note: Copernicus Publications remains neutral with regard to jurisdictional claims made in the text, published maps, institutional affiliations, or any other geographical representation in this paper. While Copernicus Publications makes every effort to include appropriate place names, the final responsibility lies with the authors.
We thank David Noone and Adriana Bailey for assistance with the operation and maintenance of the Picarro CRDS. We thank Scott Kittelman for access to the ATOC Skywatch Observatory and for technical support for field measurements.
Seed funding for this project was provided by the University of Colorado Boulder. Some material is based upon work supported by the National Science Foundation (grant no. AGS-2233136) and by the National Aeronautics and Space Administration Earth Sciences Division (award no. 80NSSC20K0729).
This paper was edited by Ulrich Platt and reviewed by two anonymous referees.
Aslan, T., Peltola, O., Ibrom, A., Nemitz, E., Rannik, Ü., and Mammarella, I.: The high-frequency response correction of eddy covariance fluxes – Part 2: An experimental approach for analysing noisy measurements of small fluxes, Atmos. Meas. Tech., 14, 5089–5106, https://doi.org/10.5194/amt-14-5089-2021, 2021.
Aubinet, M., Vesala, T., and Papale, D. (Eds.): Eddy Covariance: A Practical Guide to Measurement and Data Analysis, Springer Netherlands, Dordrecht, https://doi.org/10.1007/978-94-007-2351-1, 2012.
Bärfuss, K. B., Schmithüsen, H., and Lampert, A.: Drone-based meteorological observations up to the tropopause – a concept study, Atmos. Meas. Tech., 16, 3739–3765, https://doi.org/10.5194/amt-16-3739-2023, 2023.
Brotzge, J. A., Berchoff, D., Carlis, D. L., Carr, F. H., Carr, R. H., Gerth, J. J., Gross, B. D., Hamill, T. M., Haupt, S. E., Jacobs, N., McGovern, A., Stensrud, D. J., Szatkowski, G., Szunyogh, I., and Wang, X.: Challenges and opportunities in numerical weather prediction, B. Am. Meteorol. Soc, 104, E698–E705, https://doi.org/10.1175/BAMS-D-22-0172.1, 2023.
Burns, S. P., Delany, A. C., Sun, J., Stephens, B. B., Oncley, S. P., Maclean, G. D., Semmer, S. R., Schröter, J., and Ruppert, J.: An evaluation of calibration techniques for in situ carbon dioxide measurements using a programmable portable trace-gas measuring dystem, J. Atmos. Ocean. Tech., 26, 291–316, https://doi.org/10.1175/2008JTECHA1080.1, 2009.
Couvreux, F., Guichard, F., Austin, P. H., and Chen, F.: Nature of the mesoscale boundary layer height and water vapor variability observed 14 June 2002 during the IHOP_2002 Campaign, Mon. Weather Rev., 137, 414–432, https://doi.org/10.1175/2008MWR2367.1, 2009.
Davis, S. M., Hallar, A. G., Avallone, L. M., and Engblom, W.: Measurement of total water with a tunable diode laser hygrometer: Inlet Analysis, Calibration Procedure, and Ice Water Content Determination, J. Atmos. Ocean. Tech., 24, 463–475, https://doi.org/10.1175/JTECH1975.1, 2007.
Dorsi, S. W., Kalnajs, L. E., Toohey, D. W., and Avallone, L. M.: A fiber-coupled laser hygrometer for airborne total water measurement, Atmos. Meas. Tech., 7, 215–223, https://doi.org/10.5194/amt-7-215-2014, 2014.
emiwein: emiwein/TDLS_code: TDLS Instrument and Extraction Code, Zenodo [code], https://doi.org/10.5281/ZENODO.14291449, 2024.
Fabry, F.: The spatial variability of moisture in the boundary layer and its effect on convection initiation: project-long characterization, Mon. Weather Rev., 134, 79–91, https://doi.org/10.1175/MWR3055.1, 2006.
Fischer, L., Kiemle, C., and Craig, G. C.: Height-resolved variability of midlatitude tropospheric water vapor measured by an airborne lidar, Geophys. Res. Lett., 39, L06803, https://doi.org/10.1029/2011GL050621, 2012.
Friedrich, K., Grossman, R. L., Huntington, J., Blanken, P. D., Lenters, J., Holman, K. D., Gochis, D., Livneh, B., Prairie, J., Skeie, E., Healey, N. C., Dahm, K., Pearson, C., Finnessey, T., Hook, S. J., and Kowalski, T.: Reservoir Evaporation in the Western United States: Current Science, Challenges, and Future Needs, B. Am. Meteorol. Soc., 99, 167–187, https://doi.org/10.1175/BAMS-D-15-00224.1, 2018.
Geerts, B., Raymond, D. J., Grubišić, V., Davis, C. A., Barth, M. C., Detwiler, A., Klein, P. M., Lee, W.-C., Markowski, P. M., Mullendore, G. L., and Moore, J. A.: Recommendations for in situ and remote sensing capabilities in atmospheric convection and turbulence, B. Am. Meteorol. Soc., 99, 2463–2470, https://doi.org/10.1175/BAMS-D-17-0310.1, 2018.
Gordon, I. E., Rothman, L. S., Hargreaves, R. J., Hashemi, R., Karlovets, E. V., Skinner, F. M., Conway, E. K., Hill, C., Kochanov, R. V., Tan, Y., Wcisło, P., Finenko, A. A., Nelson, K., Bernath, P. F., Birk, M., Boudon, V., Campargue, A., Chance, K. V., Coustenis, A., Drouin, B. J., Flaud, J. –M., Gamache, R. R., Hodges, J. T., Jacquemart, D., Mlawer, E. J., Nikitin, A. V., Perevalov, V. I., Rotger, M., Tennyson, J., Toon, G. C., Tran, H., Tyuterev, V. G., Adkins, E. M., Baker, A., Barbe, A., Canè, E., Császár, A. G., Dudaryonok, A., Egorov, O., Fleisher, A. J., Fleurbaey, H., Foltynowicz, A., Furtenbacher, T., Harrison, J. J., Hartmann, J. –M., Horneman, V. –M., Huang, X., Karman, T., Karns, J., Kassi, S., Kleiner, I., Kofman, V., Kwabia–Tchana, F., Lavrentieva, N. N., Lee, T. J., Long, D. A., Lukashevskaya, A. A., Lyulin, O. M., Makhnev, V. Yu., Matt, W., Massie, S. T., Melosso, M., Mikhailenko, S. N., Mondelain, D., Müller, H. S. P., Naumenko, O. V., Perrin, A., Polyansky, O. L., Raddaoui, E., Raston, P. L., Reed, Z. D., Rey, M., Richard, C., Tóbiás, R., Sadiek, I., Schwenke, D. W., Starikova, E., Sung, K., Tamassia, F., Tashkun, S. A., Vander Auwera, J., Vasilenko, I. A., Vigasin, A. A., Villanueva, G. L., Vispoel, B., Wagner, G., Yachmenev, A., and Yurchenko, S. N.: The HITRAN2020 molecular spectroscopic database, J. Quanti. Spectrosc. Ra., 277, 107949, https://doi.org/10.1016/j.jqsrt.2021.107949, 2022.
Hallar, A. G., Avallone, L. M., Herman, R. L., Anderson, B. E., and Heymsfield, A. J.: Measurements of ice water content in tropopause region arctic cirrus during the SAGE III Ozone Loss and Validation Experiment (SOLVE), J. Geophys. Res., 109, 2003JD004348, https://doi.org/10.1029/2003JD004348, 2004.
Helbig, M., Gerken, T., Beamesderfer, E. R., Baldocchi, D. D., Banerjee, T., Biraud, S. C., Brown, W. O. J., Brunsell, N. A., Burakowski, E. A., Burns, S. P., Butterworth, B. J., Chan, W. S., Davis, K. J., Desai, A. R., Fuentes, J. D., Hollinger, D. Y., Kljun, N., Mauder, M., Novick, K. A., Perkins, J. M., Rahn, D. A., Rey-Sanchez, C., Santanello, J. A., Scott, R. L., Seyednasrollah, B., Stoy, P. C., Sullivan, R. C., De Arellano, J. V.-G., Wharton, S., Yi, C., and Richardson, A. D.: Integrating continuous atmospheric boundary layer and tower-based flux measurements to advance understanding of land-atmosphere interactions, Agr. Forest Meteorol., 307, 108509, https://doi.org/10.1016/j.agrformet.2021.108509, 2021.
Henze, D., Noone, D., and Toohey, D.: Detection of dilution due to turbulent mixing vs. precipitation scavenging effects on biomass burning aerosol concentrations using stable water isotope ratios during ORACLES, Atmos. Chem. Phys., 23, 15269–15288, https://doi.org/10.5194/acp-23-15269-2023, 2023.
Horowitz, P. and Hill, W. (Eds.): The art of electronics, Reprint., Cambridge Univ. Press, Cambridge, 716 pp., ISBN 978-0-521-37095-0, 1988.
Kämpfer, N. (Ed.): Monitoring atmospheric water vapour: ground-based remote sensing and in situ methods, Springer New York, New York, NY, https://doi.org/10.1007/978-1-4614-3909-7, 2013.
Kiemle, C., Wirth, M., Fix, A., Rahm, S., Corsmeier, U., and Di Girolamo, P.: Latent heat flux measurements over complex terrain by airborne water vapour and wind lidars, Q. J. Roy. Meteor. Soc., 137, 190–203, https://doi.org/10.1002/qj.757, 2011.
Kim, D.-G., Bond-Lamberty, B., Ryu, Y., Seo, B., and Papale, D.: Ideas and perspectives: Enhancing research and monitoring of carbon pools and land-to-atmosphere greenhouse gases exchange in developing countries, Biogeosciences, 19, 1435–1450, https://doi.org/10.5194/bg-19-1435-2022, 2022.
LI-COR: LI-7000 Instruction Manual, LICOR Biosciences, https://www.licor.com/env/pdf/gas_analyzers/7000/LI-7000Manual.pdf (last access: 3 November 2023), 2004.
Markwitz, C. and Siebicke, L.: Low-cost eddy covariance: a case study of evapotranspiration over agroforestry in Germany, Atmos. Meas. Tech., 12, 4677–4696, https://doi.org/10.5194/amt-12-4677-2019, 2019.
May, R. D.: Open-path, near-infrared tunable diode laser spectrometer for atmospheric measurements of H 2 O, J. Geophys. Res., 103, 19161–19172, https://doi.org/10.1029/98JD01678, 1998.
May, R. D. and Webster, C. R.: Data processing and calibration for tunable diode laser harmonic absorption spectrometers, J. Quant. Spectrosc. Ra., 49, 335–347, https://doi.org/10.1016/0022-4073(93)90098-3, 1993.
Miloshevich, L. M., Paukkunen, A., Vömel, H., and Oltmans, S. J.: Development and validation of a time-lag correction for vaisala radiosonde humidity measurements, J. Atmos. Ocean. Technol., 21, 1305–1327, https://doi.org/10.1175/1520-0426(2004)021<1305:DAVOAT>2.0.CO;2, 2004.
Miloshevich, L. M., Vömel, H., Whiteman, D. N., and Leblanc, T.: Accuracy assessment and correction of Vaisala RS92 radiosonde water vapor measurements, J. Geophys. Res., 114, D11305, https://doi.org/10.1029/2008JD011565, 2009.
Muller, C. L., Chapman, L., Johnston, S., Kidd, C., Illingworth, S., Foody, G., Overeem, A., and Leigh, R. R.: Crowdsourcing for climate and atmospheric sciences: current status and future potential, Int. J. Climatol., 35, 3185–3203, https://doi.org/10.1002/joc.4210, 2015.
Newell, R. E., Zhu, Y., Browell, E. V., Ismail, S., Read, W. G., Waters, J. W., Kelly, K. K., and Liu, S. C.: Upper tropospheric water vapor and cirrus: Comparison of DC-8 observations, preliminary UARS microwave limb sounder measurements and meteorological analyses, J. Geophys. Res., 101, 1931–1941, https://doi.org/10.1029/95JD01373, 1996.
Noone, D., Galewsky, J., Sharp, Z. D., Worden, J., Barnes, J., Baer, D., Bailey, A., Brown, D. P., Christensen, L., Crosson, E., Dong, F., Hurley, J. V., Johnson, L. R., Strong, M., Toohey, D., Van Pelt, A., and Wright, J. S.: Properties of air mass mixing and humidity in the subtropics from measurements of the D/H isotope ratio of water vapor at the Mauna Loa Observatory, J. Geophys. Res., 116, D22113, https://doi.org/10.1029/2011JD015773, 2011.
Ocheltree, T. W. and Loescher, H. W.: Design of the AmeriFlux portable eddy covariance system and uncertainty analysis of carbon measurements, J. Atmos. Ocean. Tech., 24, 1389–1406, https://doi.org/10.1175/JTECH2064.1, 2007.
Ogunjemiyo, S., Roberts, D. A., Keightley, K., Ustin, S. L., Hinckley, T., and Lamb, B.: Evaluating the relationship between AVIRIS water vapor and poplar plantation evapotranspiration, J. Geophys. Res., 107, ACL20-1–ACL20-15, https://doi.org/10.1029/2001JD001194, 2002.
Petersen, R. A.: On the Impact and benefits of AMDAR observations in operational forecasting – Part I: A review of the impact of automated aircraft wind and temperature reports, B. Am. Meteorol. Soc., 97, 585–602, https://doi.org/10.1175/BAMS-D-14-00055.1, 2016.
Pillar-Little, E. A., Greene, B. R., Lappin, F. M., Bell, T. M., Segales, A. R., de Azevedo, G. B. H., Doyle, W., Kanneganti, S. T., Tripp, D. D., and Chilson, P. B.: Observations of the thermodynamic and kinematic state of the atmospheric boundary layer over the San Luis Valley, CO, using the CopterSonde 2 remotely piloted aircraft system in support of the LAPSE-RATE field campaign, Earth Syst. Sci. Data, 13, 269–280, https://doi.org/10.5194/essd-13-269-2021, 2021.
Pokorný, R., Slípková, R., Havránková, K., and Pavelka, M.: Ecosystem water use efficiency of Norway spruce monoculture from eddy-covariance and ecophysiological measurements, in: ISHS Acta Horticulturae 951: VII International Symposium on Sap Flow, Volterra, Italy, 1 June 2012, https://doi.org/10.17660/ActaHortic.2012.951.36, 2012.
Rainwater, B. J.: A New Approach for Ratiometric Measurements of Water Isotopologues, University of Colorado Boulder, https://scholar.colorado.edu/concern/graduate_thesis_or_dissertations/kp78gh82s (last access: 27 June 2024), 2022.
Roth, H. A. and Blanken, P. D.: Controls and rates of evaporation from a water supply reservoir in the Colorado Front Range, J. Hydrol, 617, 129139, https://doi.org/10.1016/j.jhydrol.2023.129139, 2023.
Santanello, J. A., Dirmeyer, P. A., Ferguson, C. R., Findell, K. L., Tawfik, A. B., Berg, A., Ek, M., Gentine, P., Guillod, B. P., Van Heerwaarden, C., Roundy, J., and Wulfmeyer, V.: Land–atmosphere interactions: the LoCo perspective, B. Am. Meteorol. Soc., 99, 1253–1272, https://doi.org/10.1175/BAMS-D-17-0001.1, 2018.
Segales, A. R., Greene, B. R., Bell, T. M., Doyle, W., Martin, J. J., Pillar-Little, E. A., and Chilson, P. B.: The CopterSonde: an insight into the development of a smart unmanned aircraft system for atmospheric boundary layer research, Atmos. Meas. Tech., 13, 2833–2848, https://doi.org/10.5194/amt-13-2833-2020, 2020.
Segales, A. R., Chilson, P. B., and Salazar-Cerreño, J. L.: Considerations for improving data quality of thermo-hygrometer sensors on board unmanned aerial systems for planetary boundary layer research, Atmos. Meas. Tech., 15, 2607–2621, https://doi.org/10.5194/amt-15-2607-2022, 2022.
Shivers, S. W., Roberts, D. A., McFadden, J. P., and Tague, C.: An analysis of atmospheric water vapor variations over a complex agricultural region using airborne imaging spectrometry, Plos one, 14, e0226014, https://doi.org/10.1371/journal.pone.0226014, 2019.
Trenberth, K. E., Fasullo, J., and Smith, L.: Trends and variability in column-integrated atmospheric water vapor, Clim. Dynam., 24, 741–758, https://doi.org/10.1007/s00382-005-0017-4, 2005.
Trent, T., Boesch, H., Somkuti, P., and Scott, N.: Observing water vapour in the planetary boundary layer from th short-wave infrared, Remote Sens.-Basel, 10, 1469, https://doi.org/10.3390/rs10091469, 2018.
Varentsov, M., Konstantinov, P., Repina, I., Artamonov, A., Pechkin, A., Soromotin, A., Esau, I., and Baklanov, A.: Observations of the urban boundary layer in a cold climate city, Urban Clim., 47, 101351, https://doi.org/10.1016/j.uclim.2022.101351, 2023.
Werle, P., Mücke, R., and Slemr, F.: The limits of signal averaging in atmospheric trace-gas monitoring by tunable diode-laser absorption spectroscopy (TDLAS), Appl. Phys. B, 57, 131–139, https://doi.org/10.1007/BF00425997, 1993.
Wu, J. B., Zhou, X. Y., Wang, A. Z., and Yuan, F. H.: Comparative measurements of water vapor fluxes over a tall forest using open- and closed-path eddy covariance system, Atmos. Meas. Tech., 8, 4123–4131, https://doi.org/10.5194/amt-8-4123-2015, 2015.
Wulfmeyer, V., Hardesty, R. M., Turner, D. D., Behrendt, A., Cadeddu, M. P., Di Girolamo, P., Schlüssel, P., Van Baelen, J., and Zus, F.: A review of the remote sensing of lower tropospheric thermodynamic profiles and its indispensable role for the understanding and the simulation of water and energy cycles, Rev. Geophys. 53, 819–895, https://doi.org/10.1002/2014RG000476, 2015.
Zhao, C. L. and Tans, P. P.: Estimating uncertainty of the WMO mole fraction scale for carbon dioxide in air, J. Geophys. Res., 111, 2005JD006003, https://doi.org/10.1029/2005JD006003, 2006.


