the Creative Commons Attribution 4.0 License.
the Creative Commons Attribution 4.0 License.
 | 06 Mar 2025
Inversion algorithm of black carbon mixing state based on machine learning
Zeyuan Tian
Jiaping Wang
Chao Liu
Jia Xing
Jinbo Wang
Zhouyang Zhang
Yuzhi Jin
Sunan Shen
Bin Wang
Xin Huang
Aijun Ding
The radiative properties of black carbon (BC) are significantly influenced by its mixing state. The single-particle soot photometer (SP2) is a widely recognized instrument for quantifying BC mixing state. However, the derivation of BC mixing state from SP2 is quite challenging. Since the SP2 records individual particle signals, it requires complex data processing to convert raw signals into particle size and mixing states. Furthermore, the rapid accumulation of substantial data volumes impedes real-time analysis of BC mixing states. This study employs the Light Gradient-Boosting Machine (LightGBM), an advanced tree-based ensemble learning algorithm, to establish an inversion model that directly correlates SP2 signals with the mixing state of BC-containing particles. Our model achieves high accuracy for both particle size inversion and optical cross-section inversion of BC-containing particles, with a coefficient of determination R2 higher than 0.98. We further employ the SHapley Additive exPlanation (SHAP) method to analyze the importance of input features from SP2 signals in the inversion model of the entire particle diameter (Dp) and explore their underlying physical significance. Compared to the widely used leading-edge-only (LEO) fitting method, the machine learning (ML) method utilizes a larger coverage of signals encompassing the peak of scattering signal rather than the leading-edge data. This allows for more accurate capture of the diverse characteristics of particles. Moreover, the ML method uses signals with a high signal-to-noise ratio, providing better noise resistance. Our model is capable of accurately and efficiently acquiring the single-particle information and statistical results of the BC mixing state, which provides essential data for BC aging mechanism investigation and the assessment of further BC radiative effects.
- Article
(5325 KB) - Full-text XML
-
Supplement
(2340 KB) - BibTeX
- EndNote


Black carbon (BC) is the dominant absorbing aerosol, making it an important contributor to positive radiative forcing in the present-day atmosphere (Bond et al., 2013; Bond and Bergstrom, 2006; Fierce et al., 2020; Liu et al., 2017; Matsui et al., 2018; Ramanathan and Carmichael, 2008). As the product of incomplete combustion of fossil fuel and biomass (Jacobson, 2001), BC is refractory, with a vaporization temperature near 4000 K. During atmospheric transport, freshly emitted BC evolves from an externally mixed state to an internally mixed structure due to coagulation and condensation with other aerosol components. Changes in the mixing state can alter the light absorption and other properties of BC, thereby affecting its climate effect. For example, the presence of coating materials on BC can increase its mass absorption cross-section (MAC) relative to uncoated BC through the lensing effect (Bond and Bergstrom, 2006; Cappa et al., 2012; Fuller et al., 1999). Therefore, identifying the mixing states of BC-containing particles and their relative abundance is essential for evaluating their climate effects.
The single-particle soot photometer (SP2) is a well-recognized instrument that can be used for measuring the mixing state of BC (Moteki and Kondo, 2007; Schwarz et al., 2006; Sedlacek et al., 2012; Stephens et al., 2003). By analyzing the signals observed by SP2, quantitative characterization of the mixing states of BC can be obtained. Because of the vaporization of the non-refractory material in BC-containing particles, the scattering signals of BC-containing particles obtained by SP2 will be distorted, which poses significant difficulties in defining the original particle size (Dp). The leading-edge-only (LEO) fitting method is widely used (Gao et al., 2007; Moteki and Kondo, 2008; Schwarz et al., 2008) to obtain Dp, wherein the complete Gaussian function is reconstructed by fitting the scattering signal before particle vaporization (Liu et al., 2014; Shiraiwa et al., 2008; Zhang et al., 2016). Since SP2 can track the incandescence and scattering signal of each particle, field observation using SP2 will generate a large amount of data. Performing physical inversion of particle size requires complex data processing and fitting processes, making it difficult to obtain real-time online BC mixing states.
As an alternative, data-driven models such as machine learning (ML) can provide a good supplement to physical-process-based models. ML can efficiently capture the nonlinear relationship between inputs and outputs, and has found widespread application in various fields (Carleo et al., 2019; Jordan and Mitchell, 2015; Liakos et al., 2018; Tarca et al., 2007). In recent years, tree-based machine learning models have gained considerable popularity due to their extremely high computational speed, satisfactory accuracy, and interpretability (Keller and Evans, 2019; Li et al., 2022; Wei et al., 2021; Yang et al., 2020). Among these, the Light Gradient-Boosting Machine (LightGBM) has shown particularly outstanding performance. As a novel distributed gradient-boosting framework based on decision tree algorithms, LightGBM can extract information from data more effectively than traditional tree models, excelling in handling complex nonlinear relationships and high-dimensional features (Ke et al., 2017; Liu et al., 2024; Zhong et al., 2021). It employs innovative techniques such as gradient-based one-side sampling (GOSS) and exclusive feature bundling (EFB), which significantly improve computational efficiency while maintaining high predictive performance (Ke et al., 2017; Sun et al., 2020). Furthermore, different from some black-box models, LightGBM maintains the interpretability characteristic of tree-based models (Gan et al., 2021; Zhang et al., 2019), which can provide decision path analysis, allowing for deeper insights into the decision-making process. Considering these advantages, LightGBM can be an ideal tool for analyzing large SP2 datasets and retrieving BC mixing states.
In this study, an inversion model based on LightGBM is developed to establish a relationship between the SP2 time-dependent signals and both the size and optical characteristics of individual BC-containing particles. This method can simplify the process of quantitative analysis of BC mixing states, making it capable of real-time mixing state analysis. In addition, the SHapley Additive explanation (SHAP) approach is incorporated to interpret the developed model, providing insights into how different signal features contribute to the model's predictions. The LightGBM-based inversion model is then compared with the LEO fitting method to validate its performance. Finally, through this innovative modeling approach, the mixing state characteristics of BC-containing particles can be analyzed in detail, including both the single-particle scale and a bulk of BC-containing particles.
2.1 Experimental site
The SP2 observational data used in this study are from 1 April to 31 May 2022 and were gathered at SORPES (Station for Observing Regional Process of the Earth system), which is located at Xianlin Campus of Nanjing University in Nanjing, Jiangsu Province (a regional background site in the Yangtze River Delta region in China).
2.2 SP2 apparatus and detection principle
The SP2 consists of an intracavity Nd:YAG laser and four optical detectors. The laser operates in a TEM00 mode, with a Gaussian intensity distribution. The laser intensity within the cavity is approximately 106 W cm−2, which is sufficient to vaporize absorbing particles as they pass through the beam (Stephens et al., 2003). The refractory particle absorbs light and has a high vaporization temperature. When heated by the laser beam to the boiling point (about 4000 K), it emits visible thermal radiation (“incandescent light”). The intensity of this thermal radiation depends on the composition and mass of the refractory components, regardless of the particle morphology and mixing state (Schwarz et al., 2006; Slowik et al., 2007). Purely scattering particles cannot absorb enough energy to heat themselves and therefore do not emit incandescent light. Particle size, therefore, can be measured based on the amount of light they scatter from the laser, which exhibits a Gaussian dependence with time (Gao et al., 2007).
Four optical detectors are synchronously sampled at 2.5 MHz. One avalanche photodiode (APD) is optically filtered to pass only 1064 nm radiation and measures the scattering signal from all particles, including both purely scattering particles and absorbing particles. The two other APDs measure incandescence signal in the visible range, optically filtered to pass broadband light at 400–650 nm and narrowband light at 610–650 nm. The ratio of signals from these two detectors can be employed to ascertain the vaporization temperature of the particles (Schwarz et al., 2006), ensuring that the measured particle is BC. The fourth two-element APD (TEAPD) measures the location of leading-edge data in the laser beam, which can be used to analyze the amount of coating or the mixing state of the incandescent particles.
3.1 Overview of the inversion model
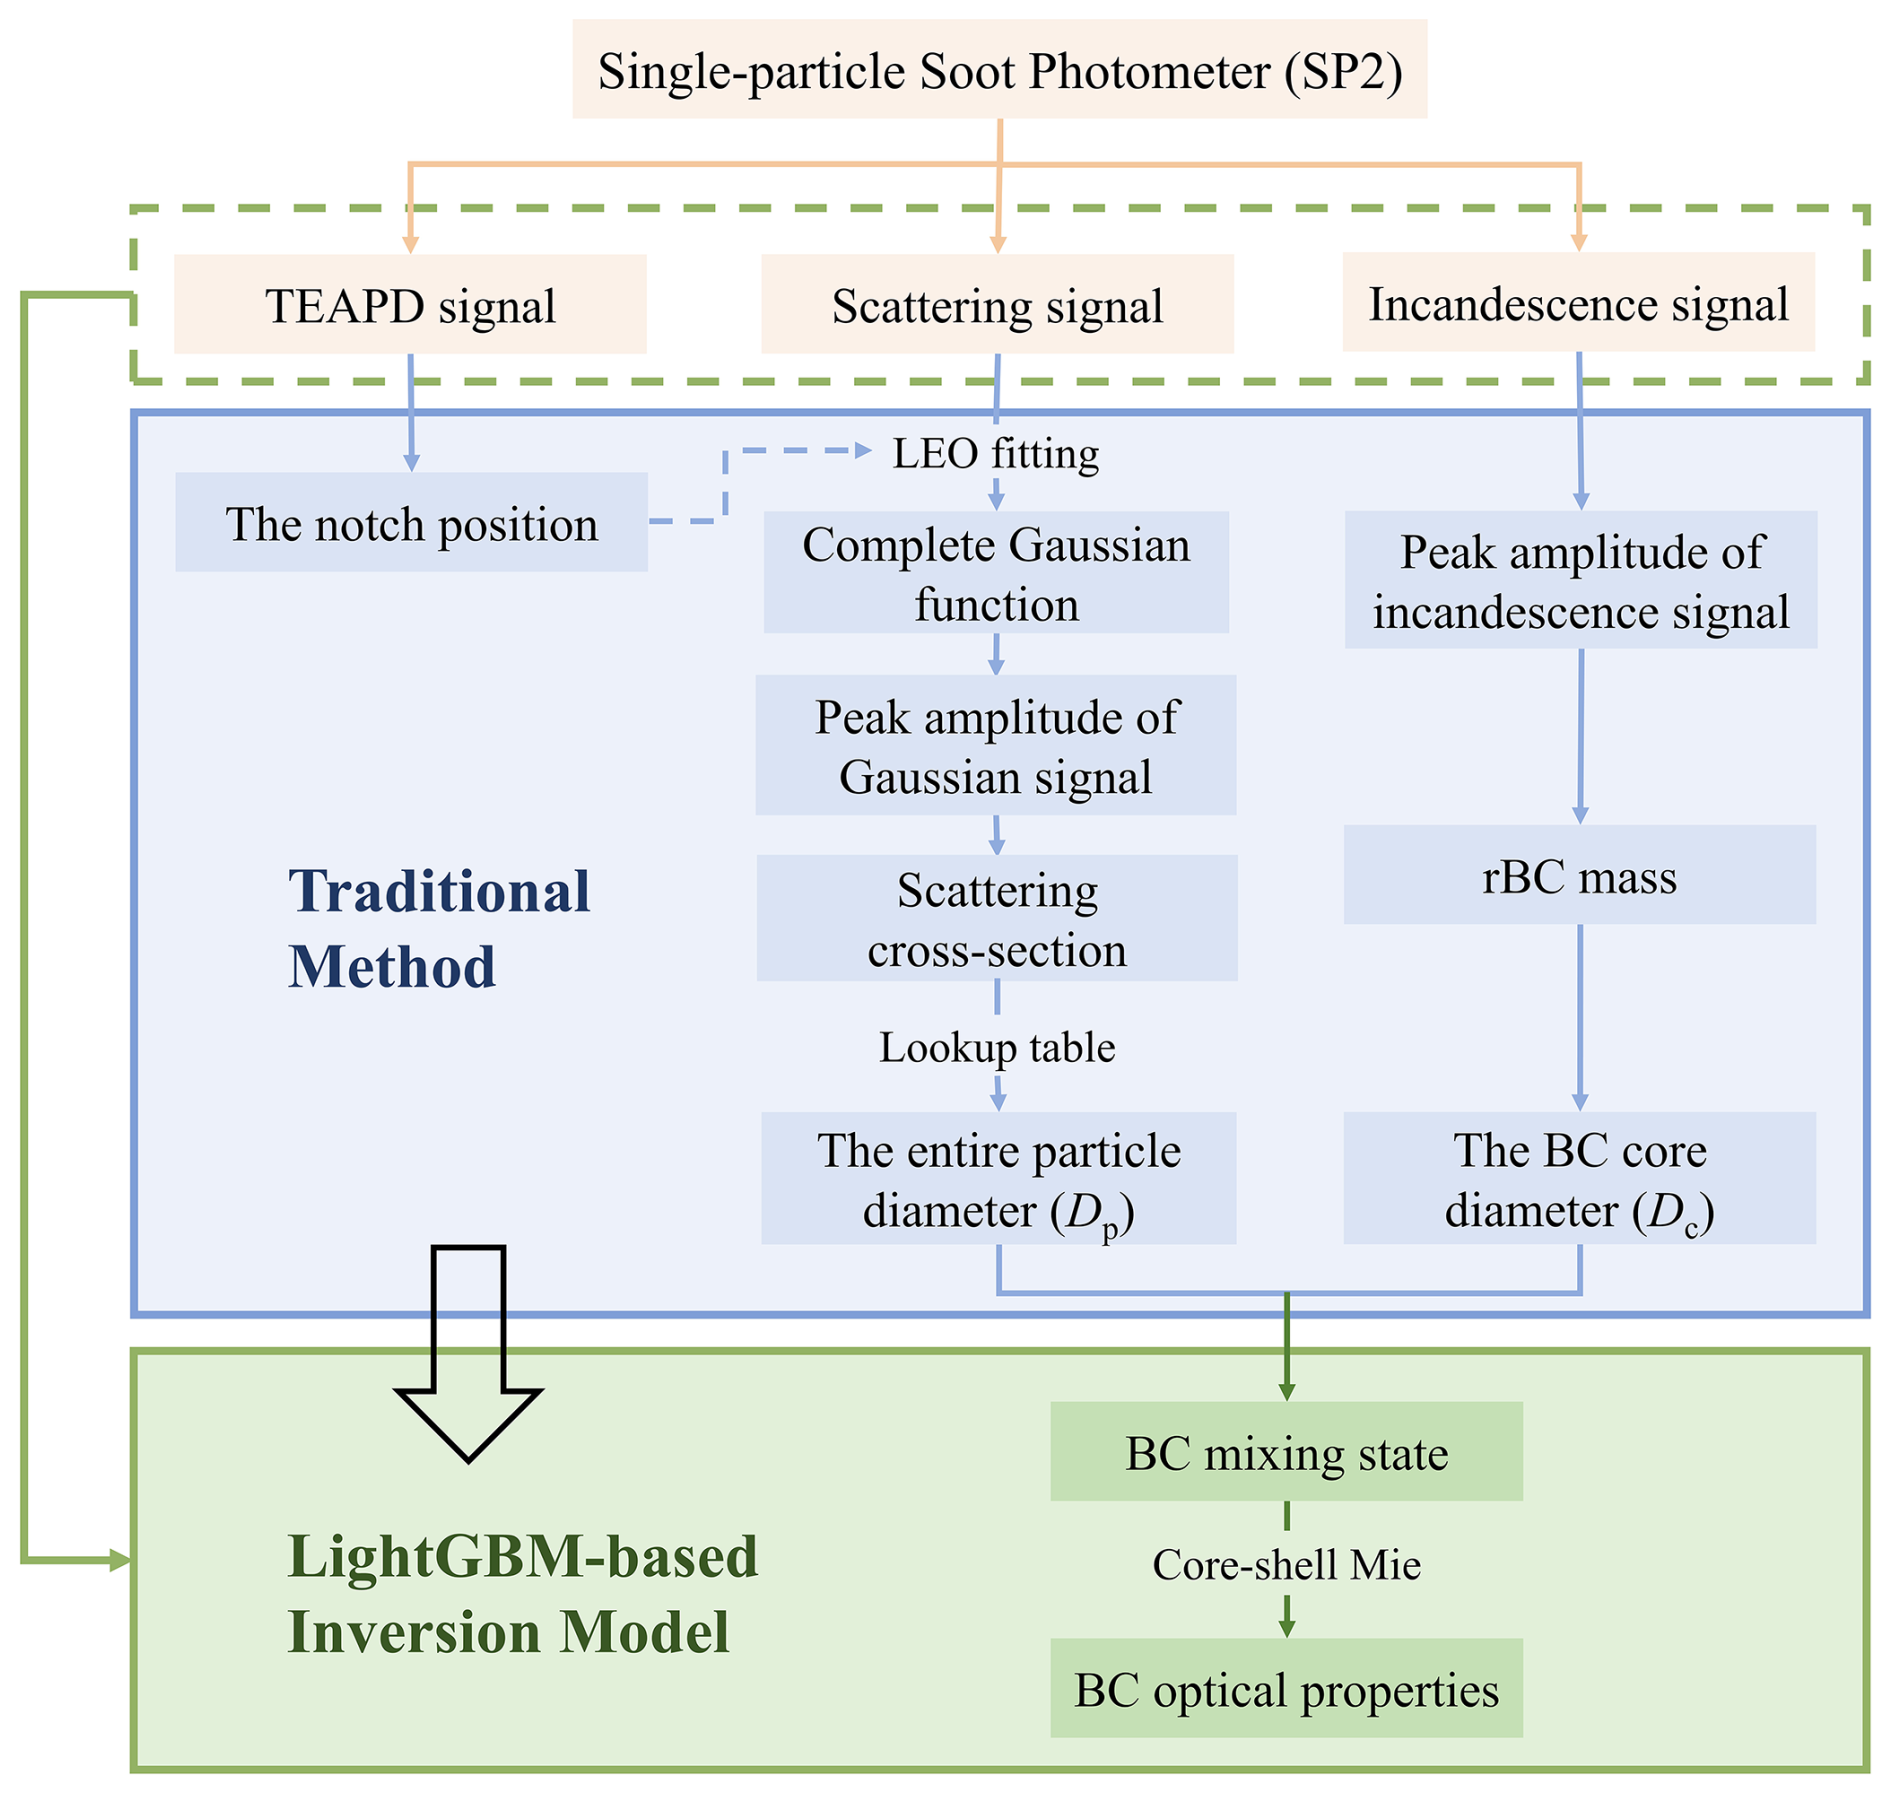
To better apply the information obtained by SP2 as well as to efficiently estimate particle size and optical properties, this study employs an innovative approach. We utilize SP2 scattering and incandescence signals as feature data, while particle size and optical properties derived through traditional physical inversion methods serve as label data. By employing the LightGBM algorithm, we establish a nonlinear mapping relationship between SP2 signals and particle physical properties, aiming to provide an effective alternative to traditional inversion methods (Fig. 1).
3.2 Classification of particles measured by SP2
The physical properties of different particle types are reflected through various dimensions of SP2 signals, making particle classification essential for both SP2 data analysis and feature selection in machine learning model development. In this study, ambient particles measured by SP2 are classified into purely scattering particles and BC-containing particles. Purely scattering particles are those that only scatter light without significant absorption, while BC-containing particles, which contain refractory BC (rBC), both scatter and absorb light. BC-containing particles are further subdivided into externally mixed BC and internally mixed BC. Externally mixed BC refers to freshly emitted BC particles that have not yet mixed with other aerosol components, while internally mixed BC describes BC that has undergone atmospheric aging processes and that has been coated with other materials (Oshima et al., 2009). Operationally, we differentiate the purely scattering particle and BC-containing particle depending on whether it has the incandescence signal. When the amplitude of the incandescence signal exceeds a certain degree, the particle will be considered to be a BC-containing particle. Otherwise, it will be considered to be a purely scattering particle (Fig. 2a). The classification between externally and internally mixed BC is determined by the time delay (Δt), defined as the time difference between the peak of the incandescence signal and the scattering signal (Moteki and Kondo, 2007; Schwarz et al., 2006). The incandescence signal peak occurs when all non-BC material has evaporated, and the BC reaches its incandescence temperature. Thus the magnitude of Δt correlates with the thickness of the coating on BC particles: a larger Δt corresponds to a thicker coating that takes longer to evaporate. By examining the distribution of Δt values in the SP2 measurements, as illustrated in Fig. 2d (Sedlacek et al., 2012; Subramanian et al., 2010; Zhang et al., 2016), BC-containing particles with Δt < 2 µs are classified as externally mixed BC (Fig. 2b), while those with Δt≥ 2 µs are categorized as internally mixed BC (Fig. 2c). It is worth noting that while some studies consider BC-containing particles with Δt < 2 µs to be bare BC or thinly coated BC, we do not make this distinction in this study and treat them all as externally mixed. Additionally, relying solely on time delay may not be sufficient to distinguish certain types of BC-containing particles, such as “attached type” (Sedlacek et al., 2015). Therefore, in this study, no further classification is made regarding the detailed morphology of BC-containing particles.
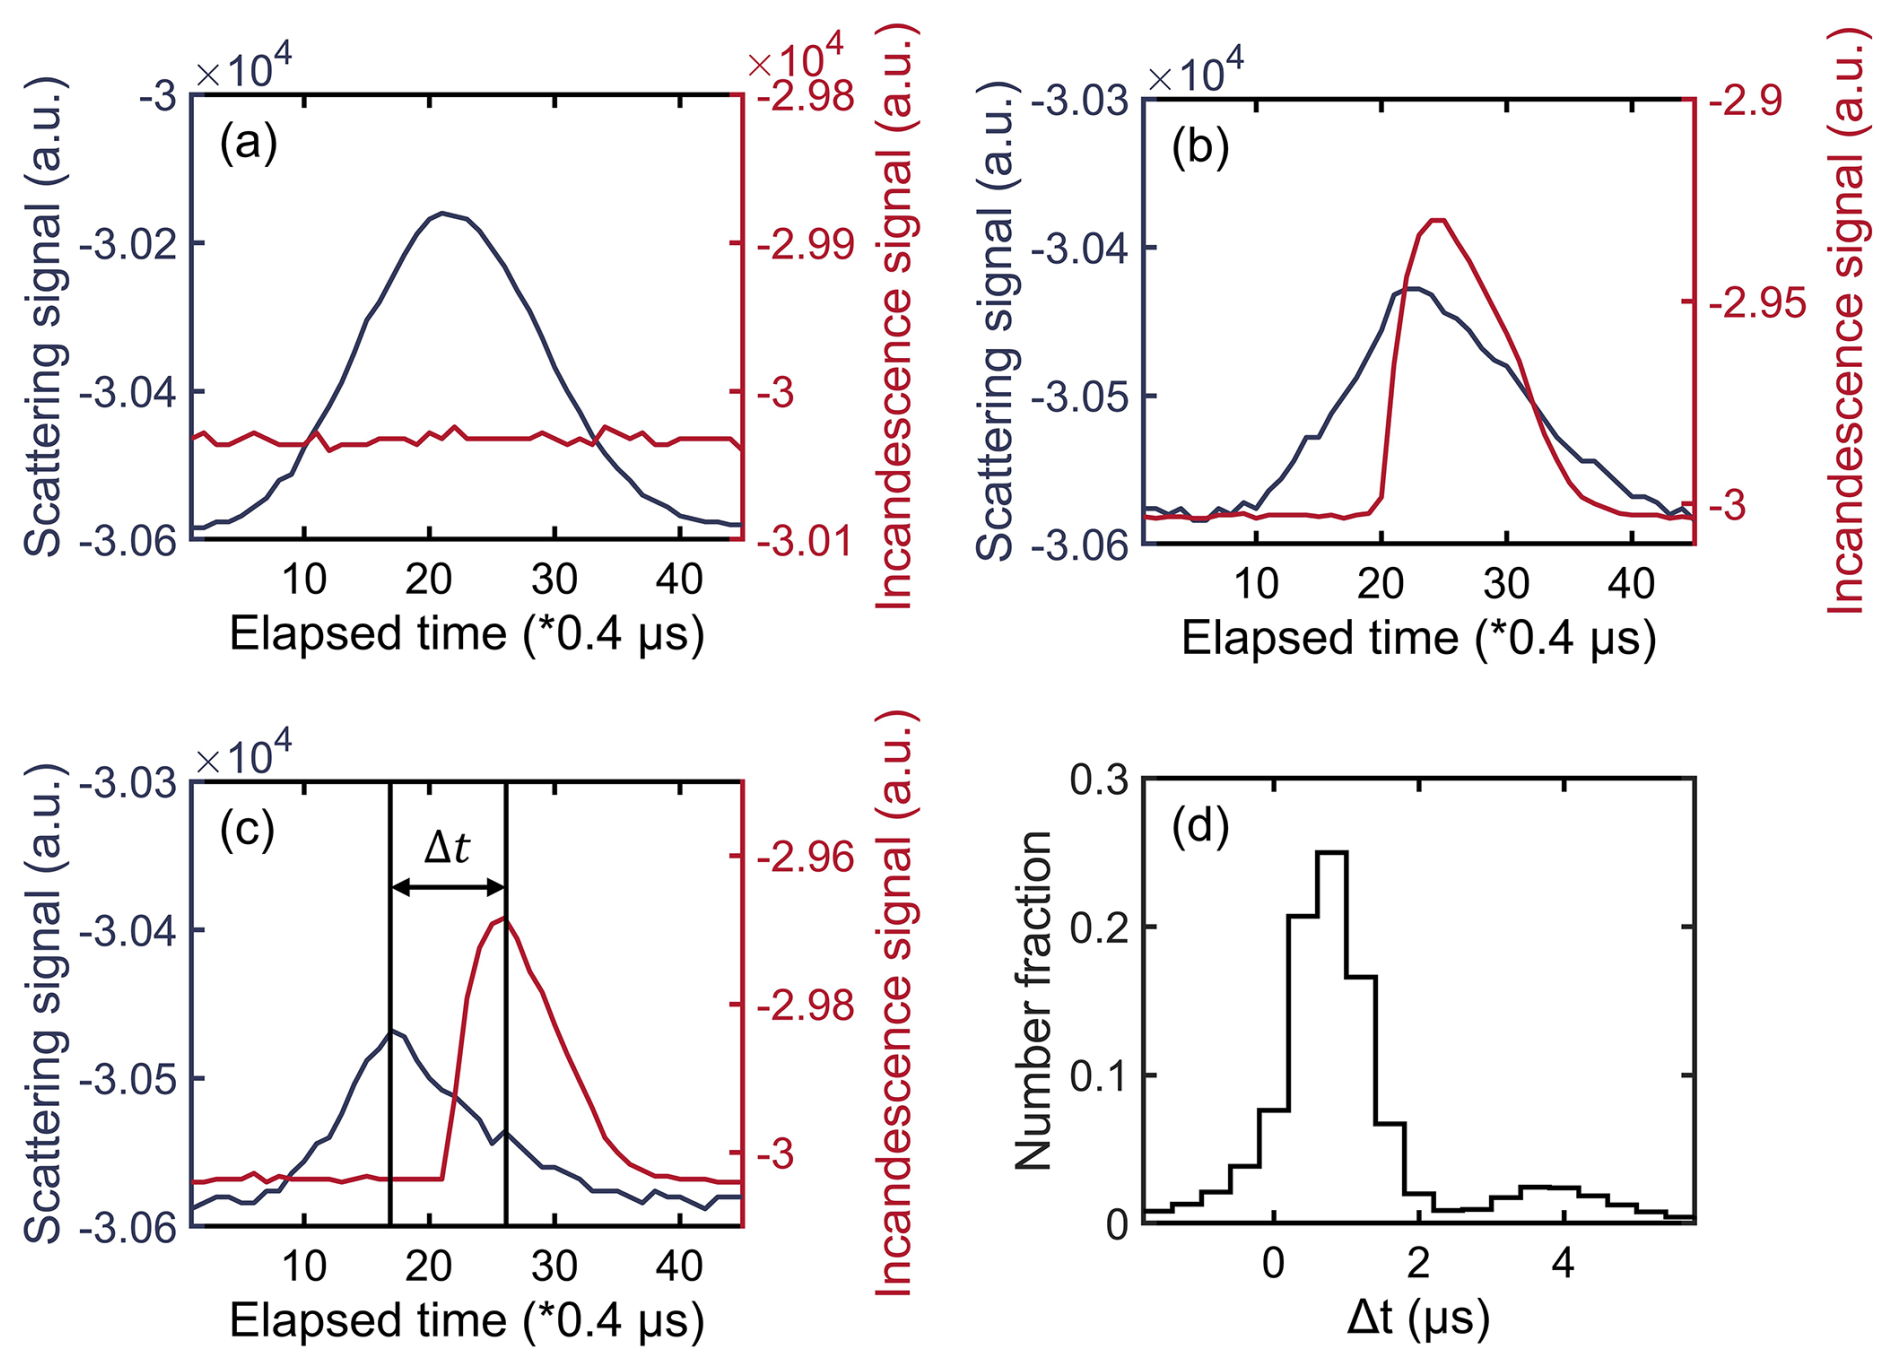
Figure 2(a–c) Time series of the scattering signal and incandescence signal of different types of particles: (a) purely scattering particle, (b) externally mixed BC, (c) internally mixed BC. (d) Histogram of the time delay (Δt) of BC-containing particles. Note that the signals shown in panels (a)–(c) represent portions of the original signals rather than the complete original signals. These displayed signal portions are related to the feature signal introduced in Sect. 3.3.
Based on the aforementioned classification framework, this study develops specialized inversion models for each particle type. For purely scattering particles, the model retrieves the entire particle diameter (Dp) and scattering cross-section (Csca). For BC-containing particles, the model retrieves the BC core diameter (Dc). For internally mixed BC, the model retrieves Dp along with both Csca and absorption cross-sections (Cabs). Additionally, for externally mixed BC, the model focuses on retrieving Csca and Cabs. These targeted inversion models collectively provide a comprehensive analytical toolkit for accurate characterization of particle physical properties across different mixing states.
3.3 Construction of feature dataset
The SP2 signal is recorded based on the elapsed time, with each time window corresponding to information about a single particle. For each particle, the original scattering signal and incandescence signal are both 100-dimensional. The position of particles within the instrument is not known in advance. Additionally, the presence of instrumental background noise in the original signals would interfere with the learning process and degrade ML model performance. Therefore, it is necessary to preprocess the original signals, retaining only the signal features that are most relevant to particle size and optical properties. This study implements specific feature selection methods for different particle types to extract the most informative characteristics from the original signals.
For purely scattering particles, when they traverse the laser beam, they only scatter laser light. Therefore, when constructing an ML model for purely scattering particles, scattering signals are typically used as feature data to obtain relevant information about the particles. Due to the Gaussian distribution of laser beam intensity, the scattering signal of particles passing through the laser beam is influenced by two primary factors: the particle size and laser intensity. To accurately retrieve particle size and scattering cross-section, it is necessary to eliminate the influence of laser intensity distribution, which means ensuring that particles are positioned at consistent locations within the instrument for each corresponding dimension. As mentioned in Sect. 2.2, one of the four detectors in the SP2 is a split APD detector. This detector has a gap perpendicular to the particle's direction of motion, resulting in a notch in the TEAPD signal, as shown in Fig. 3a. Given the stability of SP2's optical alignment and constant sample flow rate, this notch provides a precise time reference for a particle's position within the instrument. In practice, the signal from the leading element is inverted, transforming the notch into a zero-crossing point (Fig. 3b) (Gao et al., 2007). Since SP2 simultaneously records data from all four detector channels, this time reference is valid for the signals from the other three detectors as well. We locate the zero-crossing point in the scattering signal and then extract 22 data points both before and after it, creating a 45-dimensional feature dataset (Fig. S1a in the Supplement). Through this standardization, the differences in signal intensity can be accurately attributed to the inherent physical properties of the particles.
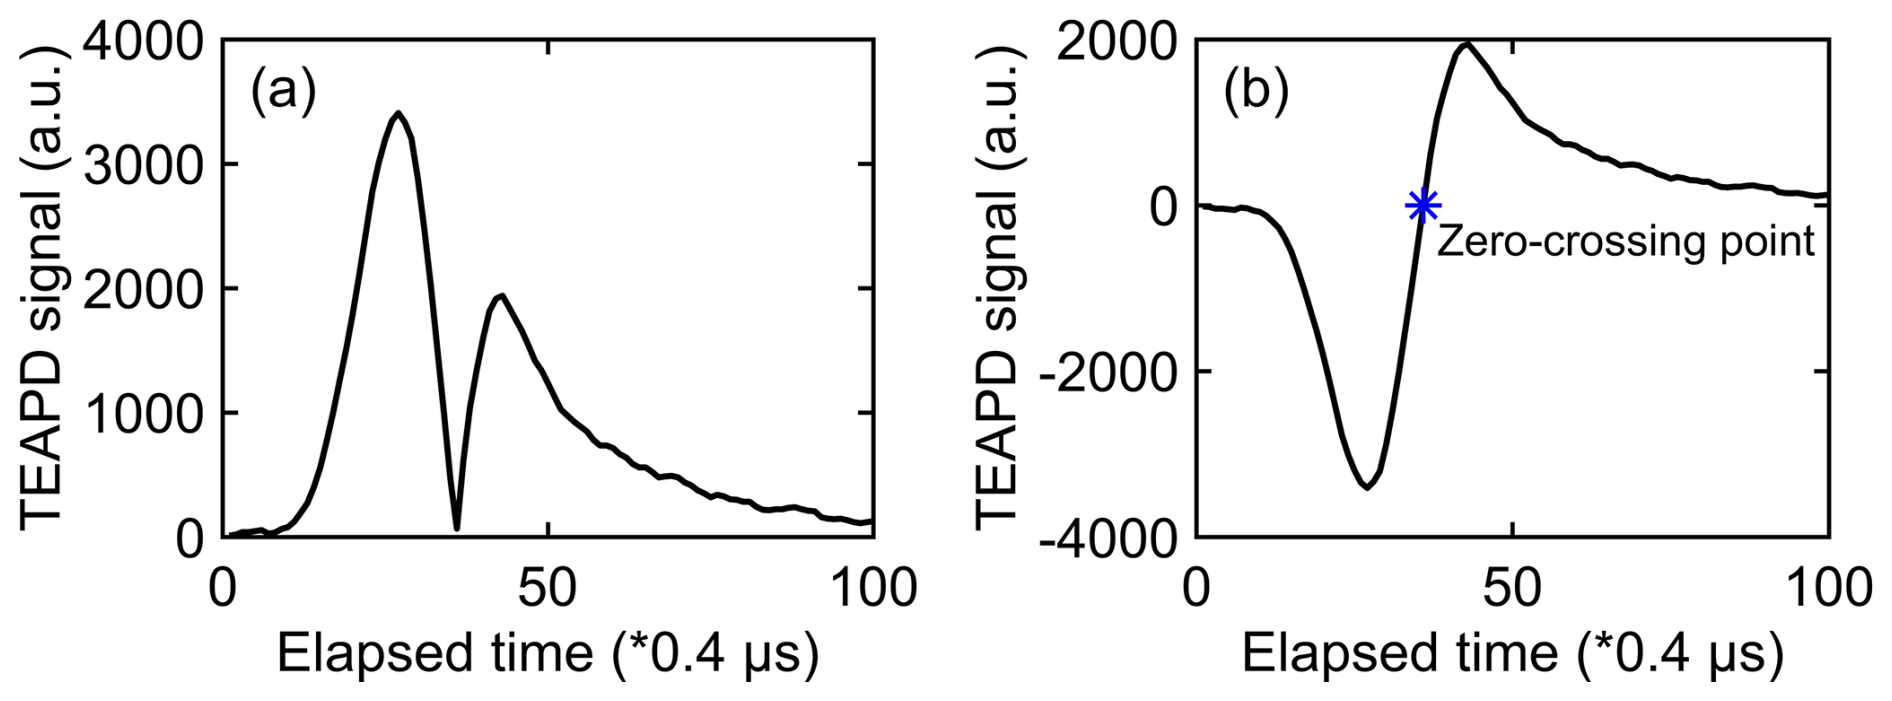
Figure 3(a) The original scattering signal measured by TEAPD before the signal from the leading element is inverted. (b) The TEAPD signal obtained by SP2, with the blue asterisk indicating the position of the zero-crossing point.
When BC-containing particles pass through the laser beam, their rBC component absorbs laser energy and reaches an incandescent state, generating incandescent radiation. The peak intensity of the incandescence signal exhibits a linear correlation with the rBC mass of the particle (Moteki and Kondo, 2010). Based on this characteristic, the peak of the incandescence signal is selected as a reference point, from which 22 data points are extracted both preceding and following this point (Fig. S1b), yielding a 45-dimensional feature dataset used for retrieving the Dc of BC-containing particles. This method ensures the incandescence signal peaks from different BC-containing particles are positioned at the same dimension within the feature dataset, facilitating direct comparisons between particles while preserving comprehensive information about the incandescence process.
For externally mixed BC, their optical cross-section is determined by the rBC component. Consequently, when retrieving the optical cross-section of externally mixed BC, we employ the same approach used for retrieving Dc of BC-containing particles, that is, selecting 45-dimensional feature signals centered on the peak of the incandescence signal to construct the inversion model.
Compared with other particle types, the internally mixed BC has a more complex structure. Its diameter and optical cross-section are jointly characterized by the scattering and incandescence signals produced when passing through the laser. To construct an inversion model for internally mixed BC, both types of signals are applied as feature data. For the scattering signal, we employ the same feature extraction method as used for purely scattering particles, selecting 22 data points of the scattering signal before and after the zero-crossing point. Simultaneously, considering that the relative relationship between the original incandescence and scattering signals can reflect particle characteristics, such as coating thickness (Moteki and Kondo, 2007; Schwarz et al., 2006; Subramanian et al., 2010), the incandescence signal is selected with 22 data points before and after the zero-crossing point in a similar way (Fig. S1c). The feature extraction process yields a 90-dimensional feature dataset, comprising a 45-dimensional scattering signal and a 45-dimensional incandescence signal. This ensures that we can comprehensively capture the key characteristics of internally mixed BC.
3.4 Construction of label dataset
In this study, the label dataset is constructed by containing particle sizes and optical properties, which were derived from SP2 signals through physical inversion methods. For purely scattering particles, when they pass through the laser, their scattering cross-section remains unchanged, resulting in an undistorted scattering signal with a Gaussian profile. Mie calculations indicate that, for spherical particles with diameters less than 1 µm, the scattering amplitude detected by SP2 exhibits a monotonic relationship with scattering cross-section (Gao et al., 2007), and this relationship can be determined by the calibration using polystyrene latex (PSL) spheres. To obtain the Dp of purely scattering particles, the scattering signal amplitude is first used to determine the particle's scattering cross-section, which is then compared with that of PSL spheres of known diameter to determine the Dp.
When the BC-containing particle crosses the laser, the rBC component absorbs the laser energy, causing the coating (if present) to evaporate. The absorbed energy heats the rBC until it reaches incandescence, producing detectable amounts of thermal radiation. The peak intensity of thermal radiation emitted by the rBC is proportional to its mass (MBC) (Moteki and Kondo, 2007). According to the empirical relationship between the incandescent light intensity and the particle mass calibrated using fullerene soot, the MBC of each BC-containing particle can be quantified. Assuming a density of 1.8 g cm−3 (Bond and Bergstrom, 2006), the measured MBC can be further converted into the mass-equivalent diameter Dc.
As the evaporation of the particle, the scattering signal deviates from a Gaussian distribution, making it inappropriate to directly use the scattering amplitude to calculate Dp. To properly size these particles, the LEO fitting method is employed to reconstruct the Gaussian signal. As described in Sect. 3.3, the zero-crossing point in the TEAPD signal can serve as a position reference for particles in the SP2. Moreover, the position difference between the zero-crossing point and the peak laser intensity remains constant during measurements. The width of the laser intensity distribution and the position of peak laser intensity relative to the zero-crossing point, both determined by Gaussian fitting of numerous unsaturated purely scattering particles, are used to constrain the LEO fitting, leaving the fitting amplitude as the only free parameter. Using leading-edge data from the signal onset to 5 % of the maximum laser intensity for LEO fitting, we can obtain the reconstructed scattering amplitude and further convert it to particle scattering cross-section. The Dp of internally mixed BC can be derived by inputting the LEO-fitted scattering cross-section, the BC core diameter, and the corresponding refractive indices of the core and coating into the Mie calculation model (Laborde et al., 2012; Liu et al., 2014; Schwarz et al., 2008; Taylor et al., 2015).
Based on the particle size calculations, the optical properties of particles can be further derived. For purely scattering particles and externally mixed BC, Mie theory can be used to calculate the Csca and Cabs with known refractive index and optical size of particles. For internally mixed BC, a core–shell model is applied, considering the particle to have an ideal BC core surrounded by a uniform, non-absorbing coating material. The Mie algorithm of core–shell-structured particles is used to obtain the optical cross-section of internally mixed BC. In these calculations, a complex refractive index of 1.95 + 0.96i is used for the BC core (Moteki et al., 2023), while a complex refractive index of 1.5 + 0i is applied for the coating of internally mixed BC and purely scattering particles (Schnaiter et al., 2005).
Considering the low signal-to-noise ratio for small particles in SP2, this study applies specific size limits for different particle types. For the purely scattering particles, the smallest size limit for Dp is set at 170 nm (Schwarz et al., 2006; Sedlacek et al., 2015), and for BC-containing particles, the smallest size limits for Dc and Dp are set as 90 and 120 nm, respectively. Additionally, the largest size limit of 600 nm is applied to all particle types. In addition to these size limits, particles that produce signals exceeding the SP2 detection threshold are also excluded from the ML dataset due to incomplete signal recordings. Although the original particle sizes for these saturated signals can often be estimated through the LEO fitting method, these particles are not included in the ML dataset to ensure data quality.
3.5 LightGBM model
LightGBM is a novel GBDT (gradient-boosting decision tree) algorithm. In resemblance to GBDT, the objective output of each tree is determined by the discrepancy between the prediction and the expected output from the preceding tree, while the input features remain unchanged. The final prediction is generated through an ensemble of decision trees. Different from traditional GBDT algorithms, LightGBM employs a histogram-based algorithm to avoid calculating all continuous features and takes discrete bins as the unit, which consumes less memory and reduces the complexity of data separation to speed up the training process (Fan et al., 2019). Additionally, LightGBM implements a leaf-wise strategy to grow trees, identifying the leaf with the maximum gain in split variance to perform the split, which is greedier than the traditional level-wise strategy (Gan et al., 2021). Furthermore, LightGBM incorporates two key optimization techniques: gradient-based one-side sampling and exclusive feature bundling (Sun et al., 2020). These innovations effectively address the challenges associated with processing large-scale datasets and high-dimensional feature spaces, respectively, enhancing the algorithm's scalability and computational efficiency while maintaining predictive accuracy.
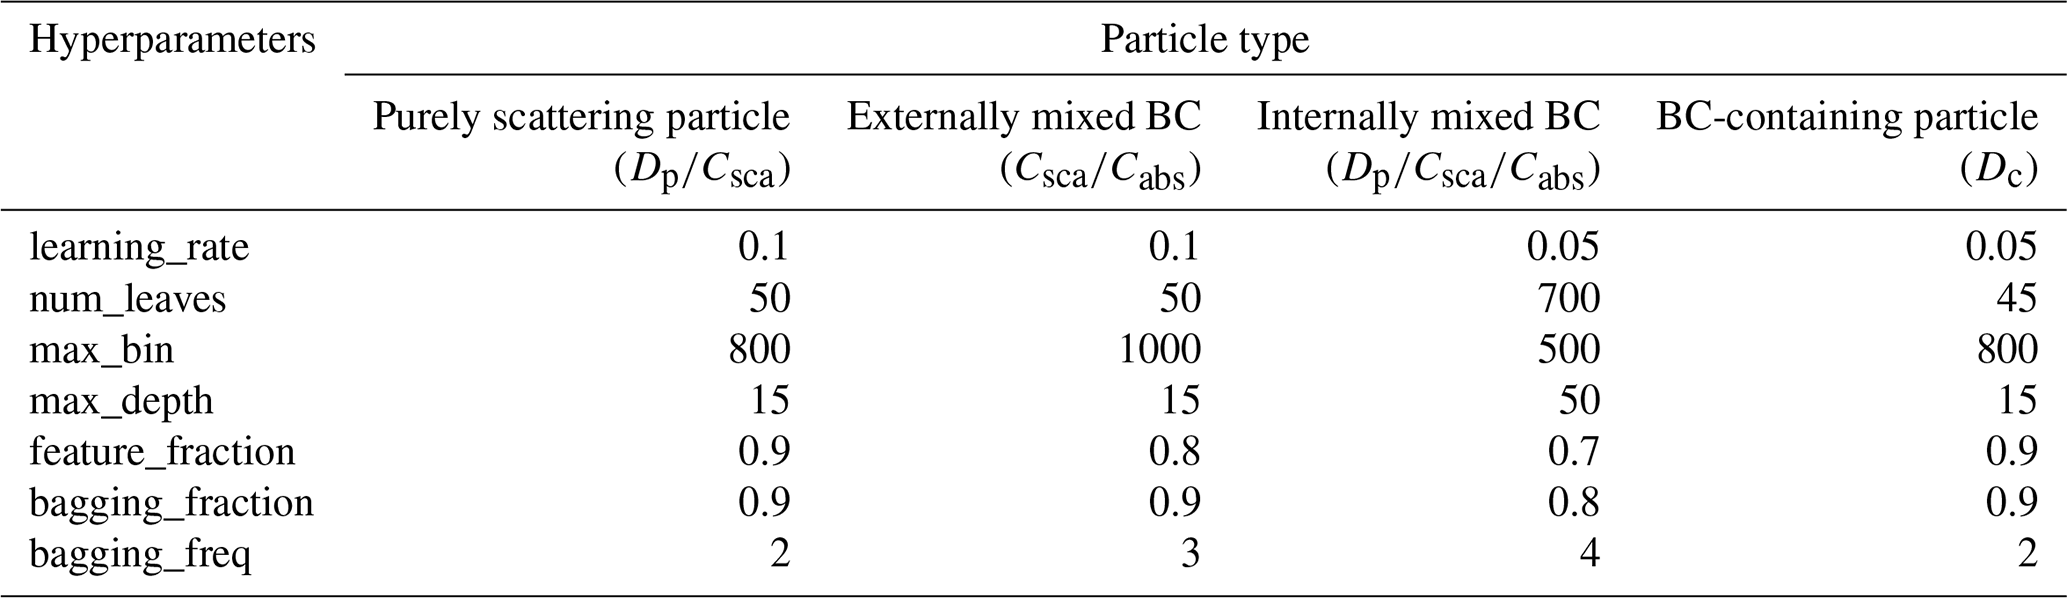
The development of an effective LightGBM model requires careful optimization of multiple hyperparameters which significantly influence the model's performance across different applications. Table 1 lists the hyperparameters adjusted in this study and their corresponding descriptions. In this study, the SP2 data collected from 11 to 25 May 2022 are used for establishing the model. The dataset is randomly partitioned into training and testing sets with a ratio of 7:3, as shown in Fig. S2. The training set is used to train the LightGBM regression model, while the testing set is used to evaluate the accuracy of the model. The GridSearchCV with 5-fold cross-validation is employed to optimize the hyperparameter configuration of the LightGBM inversion model. This comprehensive approach facilitates an exhaustive search for the optimal hyperparameter combination within a predefined parameter space (Ahmad et al., 2022). By utilizing cross-validation, the methodology effectively mitigates the risk of overfitting and provides robust estimates of the model's generalization performance. Additionally, an early stopping mechanism is integrated to further prevent potential model overfitting. All optimized hyperparameters are presented in Table 2.
Table 1The main hyperparameters of the LightGBM model tuned in this study.
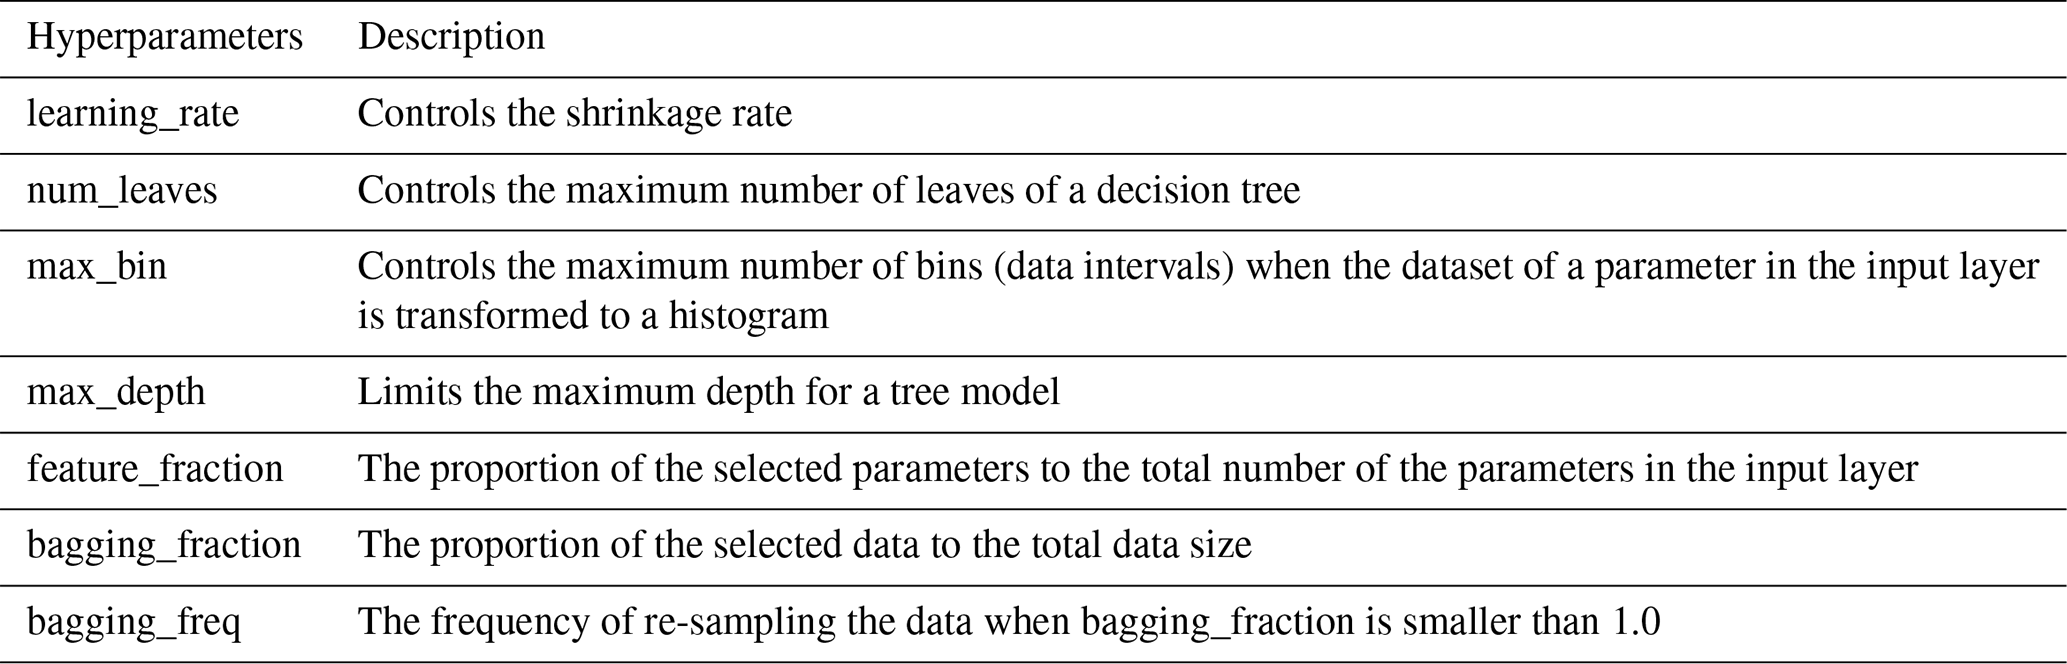
Table 2The optimal hyperparameters for each particle type. The content in parentheses following the particle type name indicates the physical properties that need to be retrieved for that type of particle.
3.6 Model performance evaluation
A comprehensive evaluation of the LightGBM inversion model is essential for validating its reliability. The evaluation metrics employed in this study include the coefficient of determination (R2), root mean square error (RMSE), and mean absolute error (MAE). The R2 metric, ranging from 0 to 1, serves as the most important indicator of model accuracy, where a value of 1 indicates perfect prediction without bias. In general, higher R2 indicates better model performance. RMSE quantifies the standard deviation of the residuals between the predicted value and observed value and is calculated as
where m is the number of samples, yi is the observed value, and is the predicted value of ith sample. MAE is another statistical measure to evaluate the bias between predicted value and observed value, which is defined as
In general, the lower RMSE and MAE values represent the better-fitting results of the model.
3.7 Model explanation
The increasing complexity of machine learning models often creates a “black box” effect, making it challenging to interpret how input parameters influence prediction results. To address this limitation and enhance model transparency, we implement the SHAP method, which provides insights into the model's decision-making process.
SHAP is a state-of-the-art approach to model interpretation, combining optimal feature attribution with local explanations using Shapley values from game theory (Lundberg and Lee, 2017). It can be used in conjunction with different ML models for model interpretation. Tree-SHAP (Lundberg et al., 2019) is specifically employed in this study. It utilizes a linear explanatory model and Shapley values to estimate the original prediction model, as defined by Eq. (3):
where f(x) represents the machine learning model's prediction; Φ0 is the base value of the model, which denotes the average prediction of all inputs; Φi is the SHAP value for feature i, indicating the contribution of feature i to the prediction; and p is the total number of features. The SHAP framework provides a unified measure of feature importance, enabling detailed analysis of how individual features influence the model's predictions.
4.1 Inversion results of particle size
The model performance is evaluated using testing sets. Figure 4 illustrates the particle size inversion results for three different particle types. The LightGBM model demonstrates excellent capability in predicting particle sizes. The Dc inversion of BC-containing particles shows superior performance (Fig. 4b), with an R2 value of 0.99. Additionally, the RMSE and MAE values are 0.36 and 0.14 nm, respectively, which are the smallest among the three particle size inversion models and can be attributed to the linear correlation between the peak intensity of incandescence signals and the mass of rBC. The minor discrepancies observed between the predictions and observations for BC-containing particles with large Dc can be attributed to limited representation of these larger particles in the training set, which constrains the model's learning capability in this size range. The Dp inversion for purely scattering particles also exhibits high accuracy (Fig. 4a), achieving an R2 value of 0.99, with RMSE and MAE values of 0.95 and 0.51 nm, respectively. The slightly lower accuracy compared to the Dc inversion for BC-containing particles may be due to laser intensity fluctuations caused by instrument voltage variations, which affect the scattering amplitude used for Dp calculation. The significant deviations (> 30 nm) observed in a small number of particles are primarily attributed to the instrument noise that produces abnormal scattering signals.
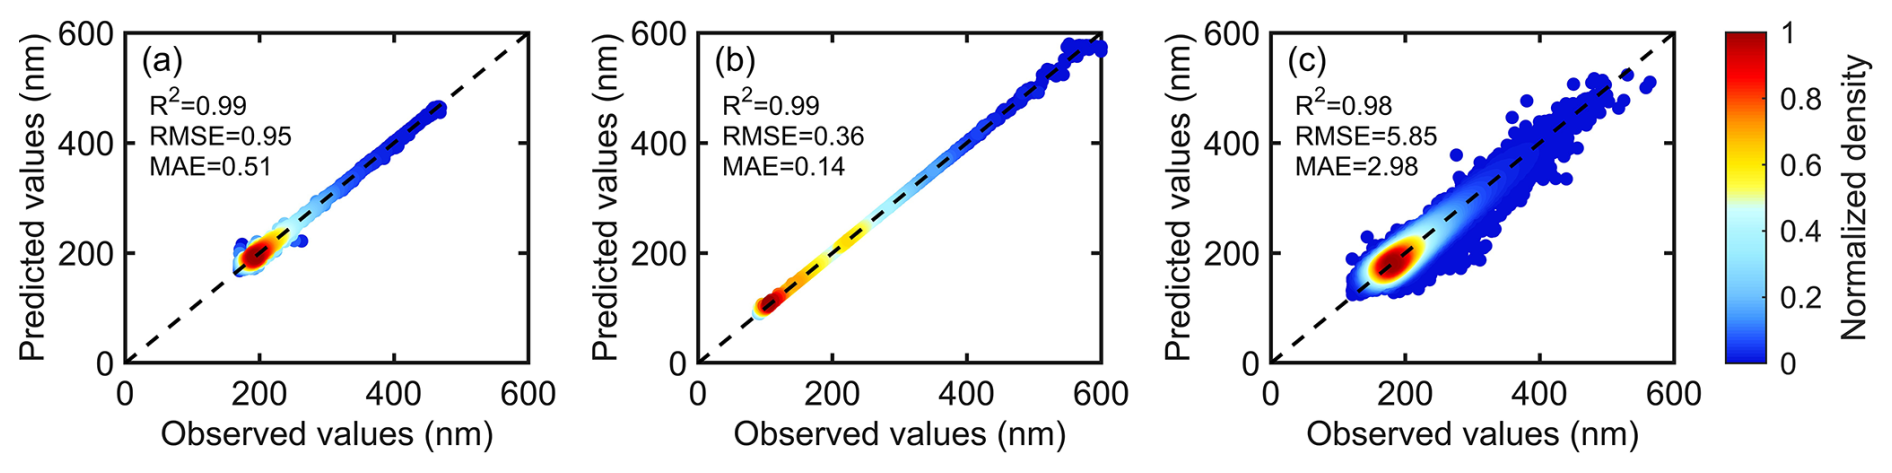
Figure 4Inversion results of particle size for different types of particles: (a) Dp of purely scattering particles, (b) Dc of BC-containing particles, (c) Dp of internally mixed BC.
For internally mixed BC, the Dp inversion model achieves an R2 value of 0.98, with RMSE and MAE values of 5.85 and 2.98 nm, respectively (Fig. 4c). The close R2 values for the training and testing sets demonstrate the model's excellent generalization performance (Fig. S3). According to density distribution, the predicted values are closely aligned with the observations for most particles. Compared to the previous two particle types, the relationship between Dp and both scattering and incandescence signals is nonlinear, making the physical inversion process more complex and involving more input variables, which increases the difficulty of inversion.
To comprehensively assess the model's performance across different particle size ranges, we further analyzed the prediction error distribution for the Dp inversion model of internally mixed BC, as shown in Fig. 5. For particles smaller than 150 nm, the prediction errors average around 4 nm, primarily due to the low signal-to-noise ratio of their scattering signals, which introduces larger uncertainties in the LEO fitting process. The model exhibits optimal performance for particles between 150 and 300 nm, with an average prediction error of approximately 1.5 nm. Furthermore, based on the 25 % and 75 % percentiles of the error distribution, the model's prediction errors exhibit minimal fluctuation within this size range. However, prediction errors gradually increase with particle size, becoming particularly significant for particles larger than 480 nm. This trend can be attributed to occasional irregular signals at larger sizes, such as scattering or incandescence signals with abnormally broad peak widths. These signal irregularities pose challenges to the accurate characterization of particles' physical properties, affecting both LEO fitting accuracy and ML model predictions and potentially leading to more pronounced discrepancies between the two methods. The number size distribution of internally mixed BC in the testing set indicates that most particles fall within the 150–300 nm range, where the model demonstrates the highest accuracy. Although the prediction errors are relatively larger at both ends of the size distribution (< 150 nm and > 400 nm), the number of particles in these ranges is comparatively small, thus having a limited impact on the overall performance of the model.
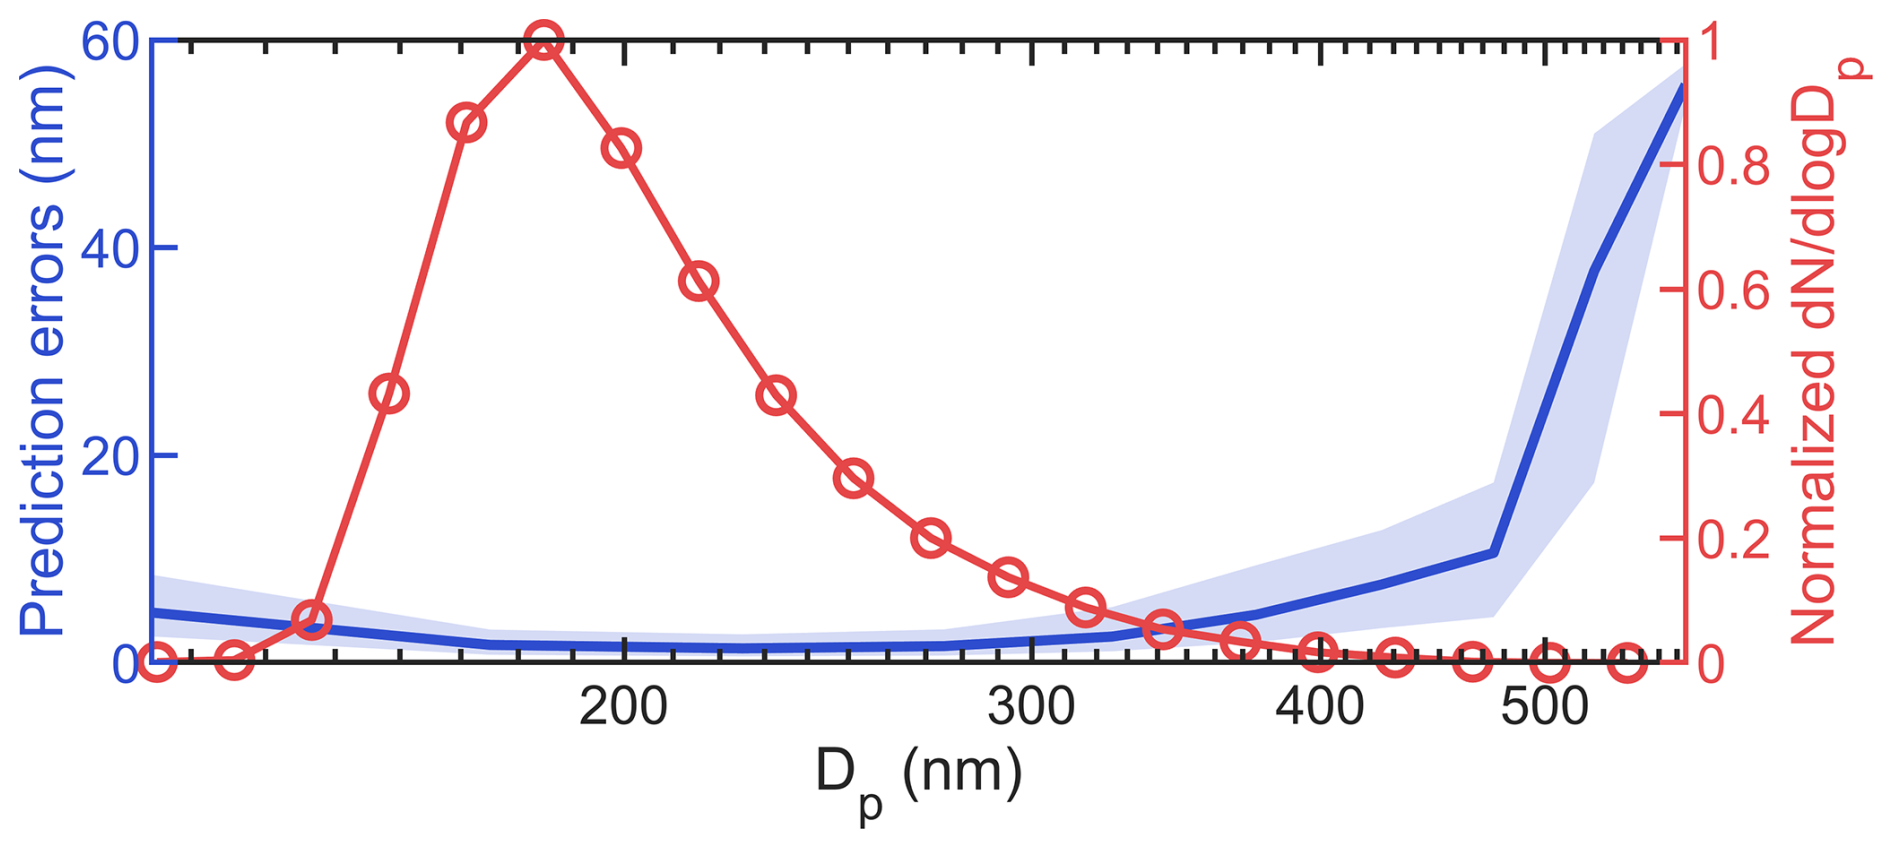
Figure 5The prediction error distribution for the Dp inversion model of internally mixed BC and normalized number size distribution for Dp of internally mixed BC in the testing set. The solid line of the error distribution represents the median value, and the upper and lower boundaries of the shaded area are between the 25 % and 75 % quantiles.
It is worth noting that the LEO fitting method and ML method utilize different parts of original signals, which can lead to discrepancies in Dp values. A detailed discussion of this deviation is presented in Sect. 4.3. Furthermore, the complex mixing structures and morphologies of BC-containing particles also affect the accuracy of both methods (Pang et al., 2022; Wang et al., 2017, 2021a, b). Given that the quantitative impact of these factors is challenging to determine currently, this study does not involve a discussion related to this aspect, leaving it as a direction for future research.
4.2 Inversion results of optical properties
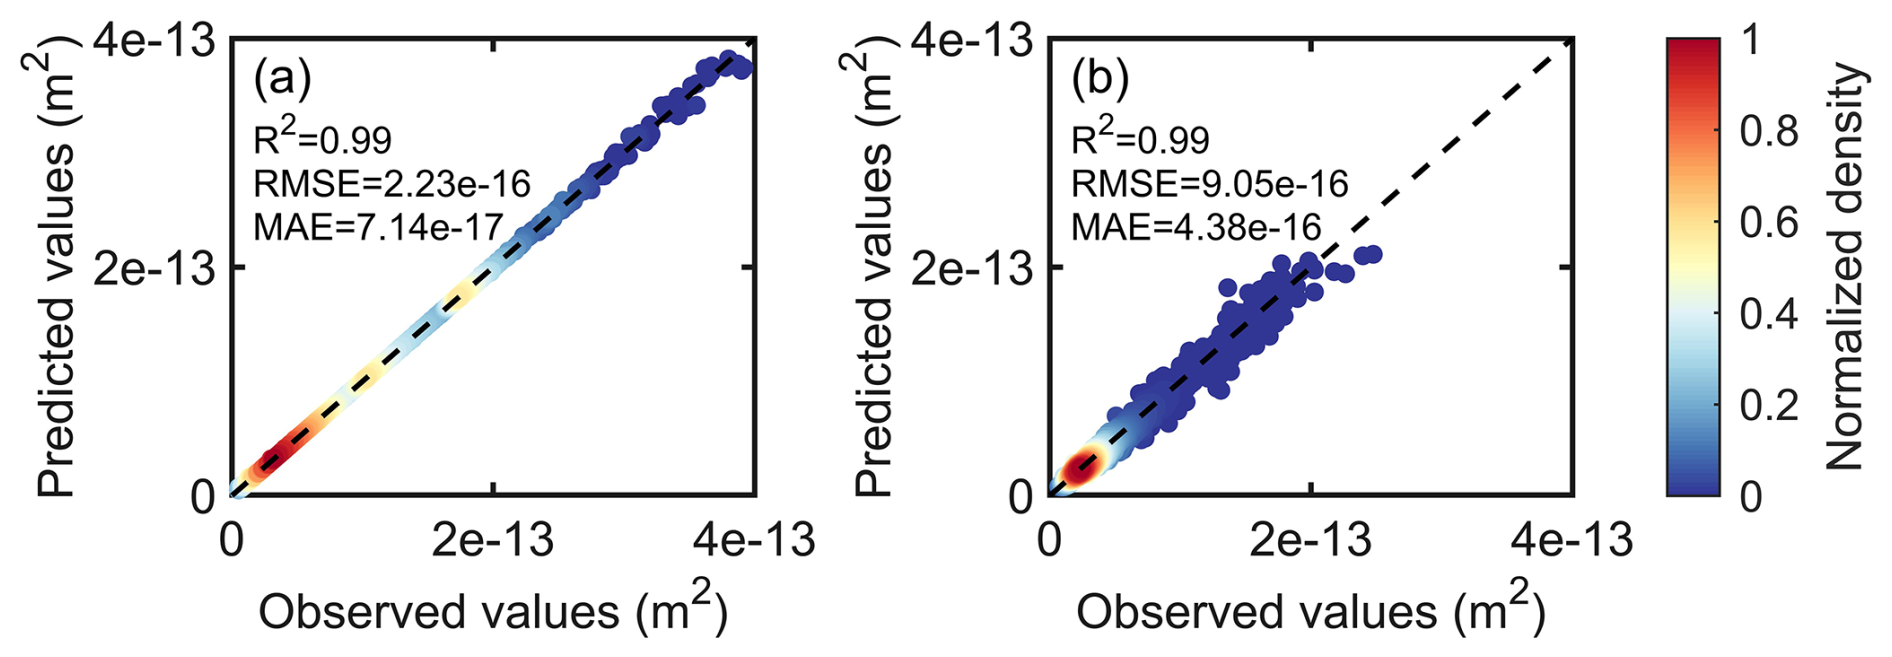
The inversion results for the scattering and absorption cross-sections across three particle types are shown in Figs. 6 and 7. Overall, the LightGBM model shows excellent performance in predicting both Csca and Cabs for all particle types, with R2 exceeding 0.98. For purely scattering particles, the Csca inversion model exhibits particularly high accuracy with an R2 value of 0.99 (Fig. 6a), indicating strong agreement between model predictions and observed values. Similarly, for externally mixed BC, both Csca and Cabs inversion models achieve remarkable accuracy with R2 values of 0.99 (Figs. 6b and 7a). For internally mixed BC (Figs. 6c and 7b), the model achieves R2 values of 0.98 and 0.99 for Csca and Cabs inversions, respectively, with Cabs predictions showing slightly superior performance. While a small number of particles exhibit notable deviations, the model predictions demonstrate strong consistency with observed values for the majority of particles.
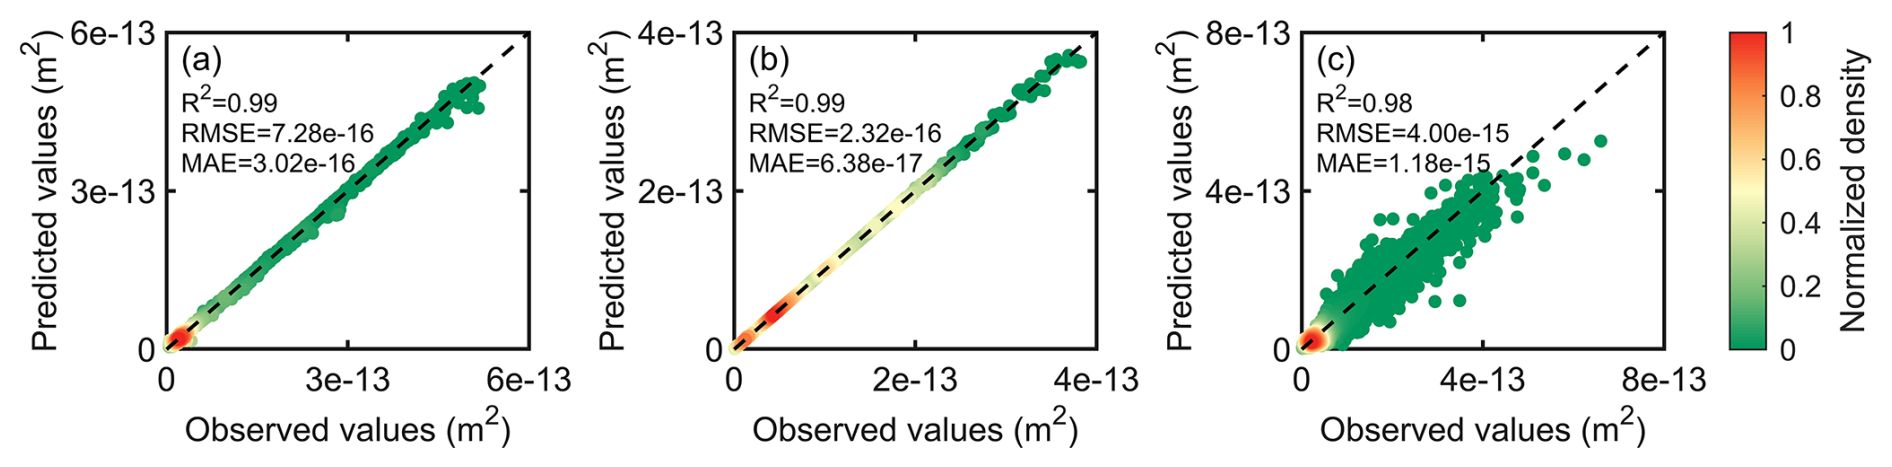
Figure 6Inversion results of Csca for three types of particles: (a) purely scattering particles, (b) externally mixed BC, (c) internally mixed BC.
4.3 SHAP interpretations
To understand the relative contributions of input features to the model predictions, the SHAP method is employed for feature importance analysis. Figure 8 presents the analysis results, where individual data points from the dataset are represented, with colors indicating their corresponding feature values (blue to red for increasing values). The features are ranked by importance along the y axis, with higher positions denoting greater significance. The position of each point on the x axis represents its SHAP value, quantifying the impact of the feature value corresponding to that point on the model prediction. Points on the right side of the zero line indicate a positive contribution to the model prediction, whereas those on the left side indicate a negative effect. The magnitude of impact is represented by the distance from the zero line. For clarity, the 45-dimensional scattering signals of the input model are designated as SCLG1, SCLG2, …, SCLG45, and the 45-dimensional incandescent signals are similarly named BBLG1, BBLG2, …, BBLG45.
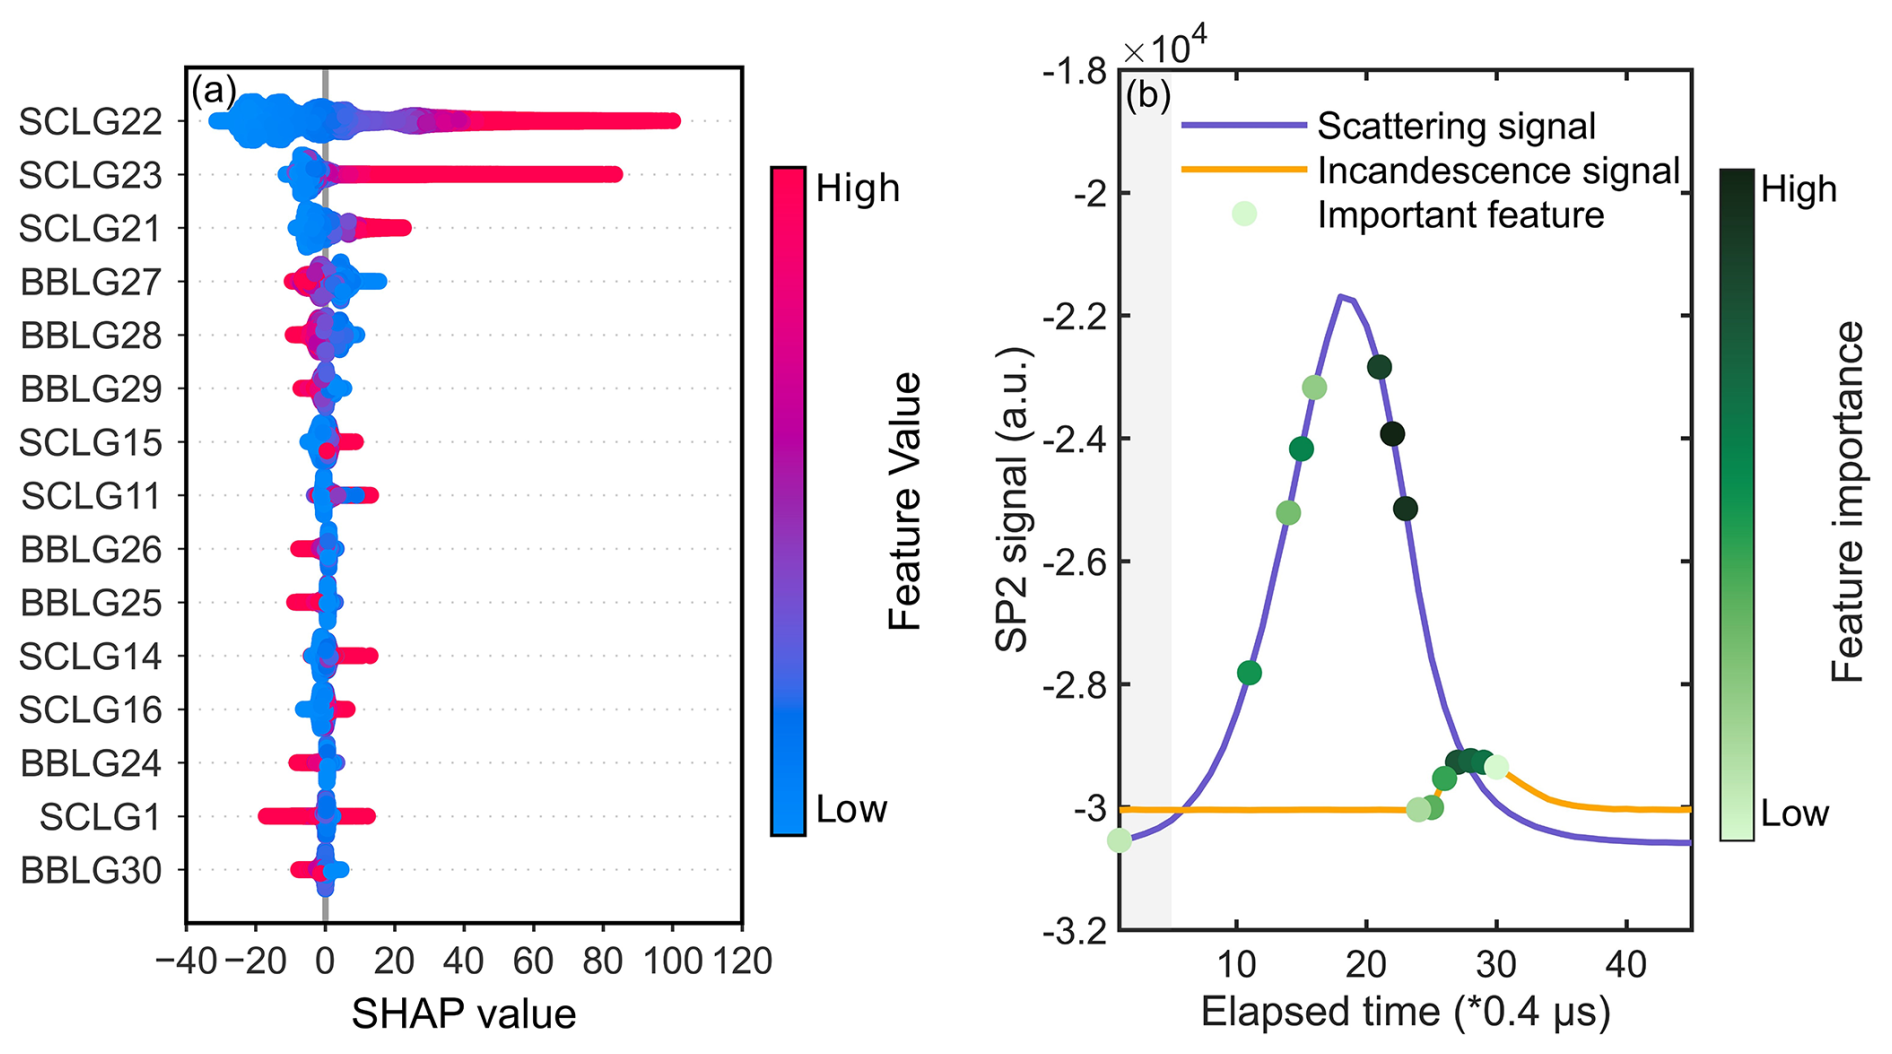
Figure 8SHAP analysis for the Dp inversion model of internally mixed BC. (a) The SHAP summary plot showing the top 15 features ranked by importance. (b) The specific positions of the top 15 important features within the scattering and incandescence signals input to the ML model. Scatter points are colored based on their importance ranking (darker colors indicate higher importance). The shaded gray area represents the portion of the scattering signal used for LEO fitting, which is included in the ML model input features.
The SHAP summary plot for the Dp inversion model of internally mixed BC highlights the top 15 contributing features (Fig. 8a), comprising 8 scattering signal features and 7 incandescence signal features. The specific distribution of these features within the signals is shown in Fig. 8b. According to the SHAP summary plot, the top three important features are SCLG22, SCLG23, and SCLG21, which correspond to three consecutive scattering signal positions. Similarly, the features SCLG15, SCLG14, and SCLG16 – ranked 7th, 11th, and 12th, respectively – form another continuous segment of the scattering signal. These six features, located near the peak of the scattering signal, show a positive correlation between their values and predicted Dp, as evidenced by their SHAP values. This part of the signal represents a nonlinear combination of coating evaporation and incident laser intensity changes. Although this portion of the scattering signal deviates from the original Gaussian profile, it still correlates with the characteristics of the original particle. The intensity of the scattering signal is proportional to the particle's scattering cross-section; more pronounced signals indicate a larger scattering cross-section and, consequently, a larger Dp value. Among the remaining scattering features, SCLG11 exhibits similar behavior, while SCLG1 shows variable influence (both positive and negative) due to its position at the signal baseline, where instrument noise significantly affects the signal quality.
The seven incandescence signal features (BBLG24 to BBLG30) represent a continuous segment spanning from the onset of the incandescence signal to the near-peak position. Their SHAP values all exhibit a trend where their contribution to the prediction transitions from positive to negative as the feature values increase. This behavior reflects potential physical relationships. The peak height of the incandescence signal exhibits a positive correlation with Dc. Under equivalent scattering cross-sections, given that the BC core has a higher scattering coefficient than the coating material, particles with larger Dc values require thinner coating thickness to maintain the same scattering property, resulting in smaller Dp. Additionally, for internally mixed BC with identical Dc, while the peak height of the incandescence signal remains constant, the timing of peak occurrence varies with the coating thickness. When the coating is thicker, it takes longer to evaporate, resulting in a delayed onset of the incandescence signal. Consequently, more data points from BBLG24 to BBLG30 are concentrated near the baseline of the incandescence signal, resulting in lower corresponding values (Fig. S4).
According to the contribution of each feature indicated by SHAP values, it can be observed that the important features in the ML model differ from the leading-edge data used during the physical inversion process. The ML model focuses on the signal near the peak, as shown in Fig. 8b, while the LEO fitting method utilizes signals observed as the BC-containing particle first encounters the laser edge, before coating evaporation occurs. Figure 9 illustrates the LEO fitting results for two different BC-containing particles. Despite nearly identical leading-edge data resulting in similar Gaussian distributions and consequently the same Dp values through LEO fitting, the complete scattering signals of these particles exhibit significant differences. The ML model, by incorporating these distinctive signal features, can effectively capture these variations, leading to different Dp predictions. Moreover, the leading edge is traditionally defined as the portion of the baseline-subtracted signal ranging from 0 % to 5 % of the maximum laser intensity (Taylor et al., 2015). As shown in Fig. 9, this portion of the signal (in the shaded gray area) is close to the baseline, making it particularly susceptible to noise interference. Compared to the LEO fitting method, the ML model utilized a broad range of signals with a high signal-to-noise ratio, demonstrating enhanced noise resistance.
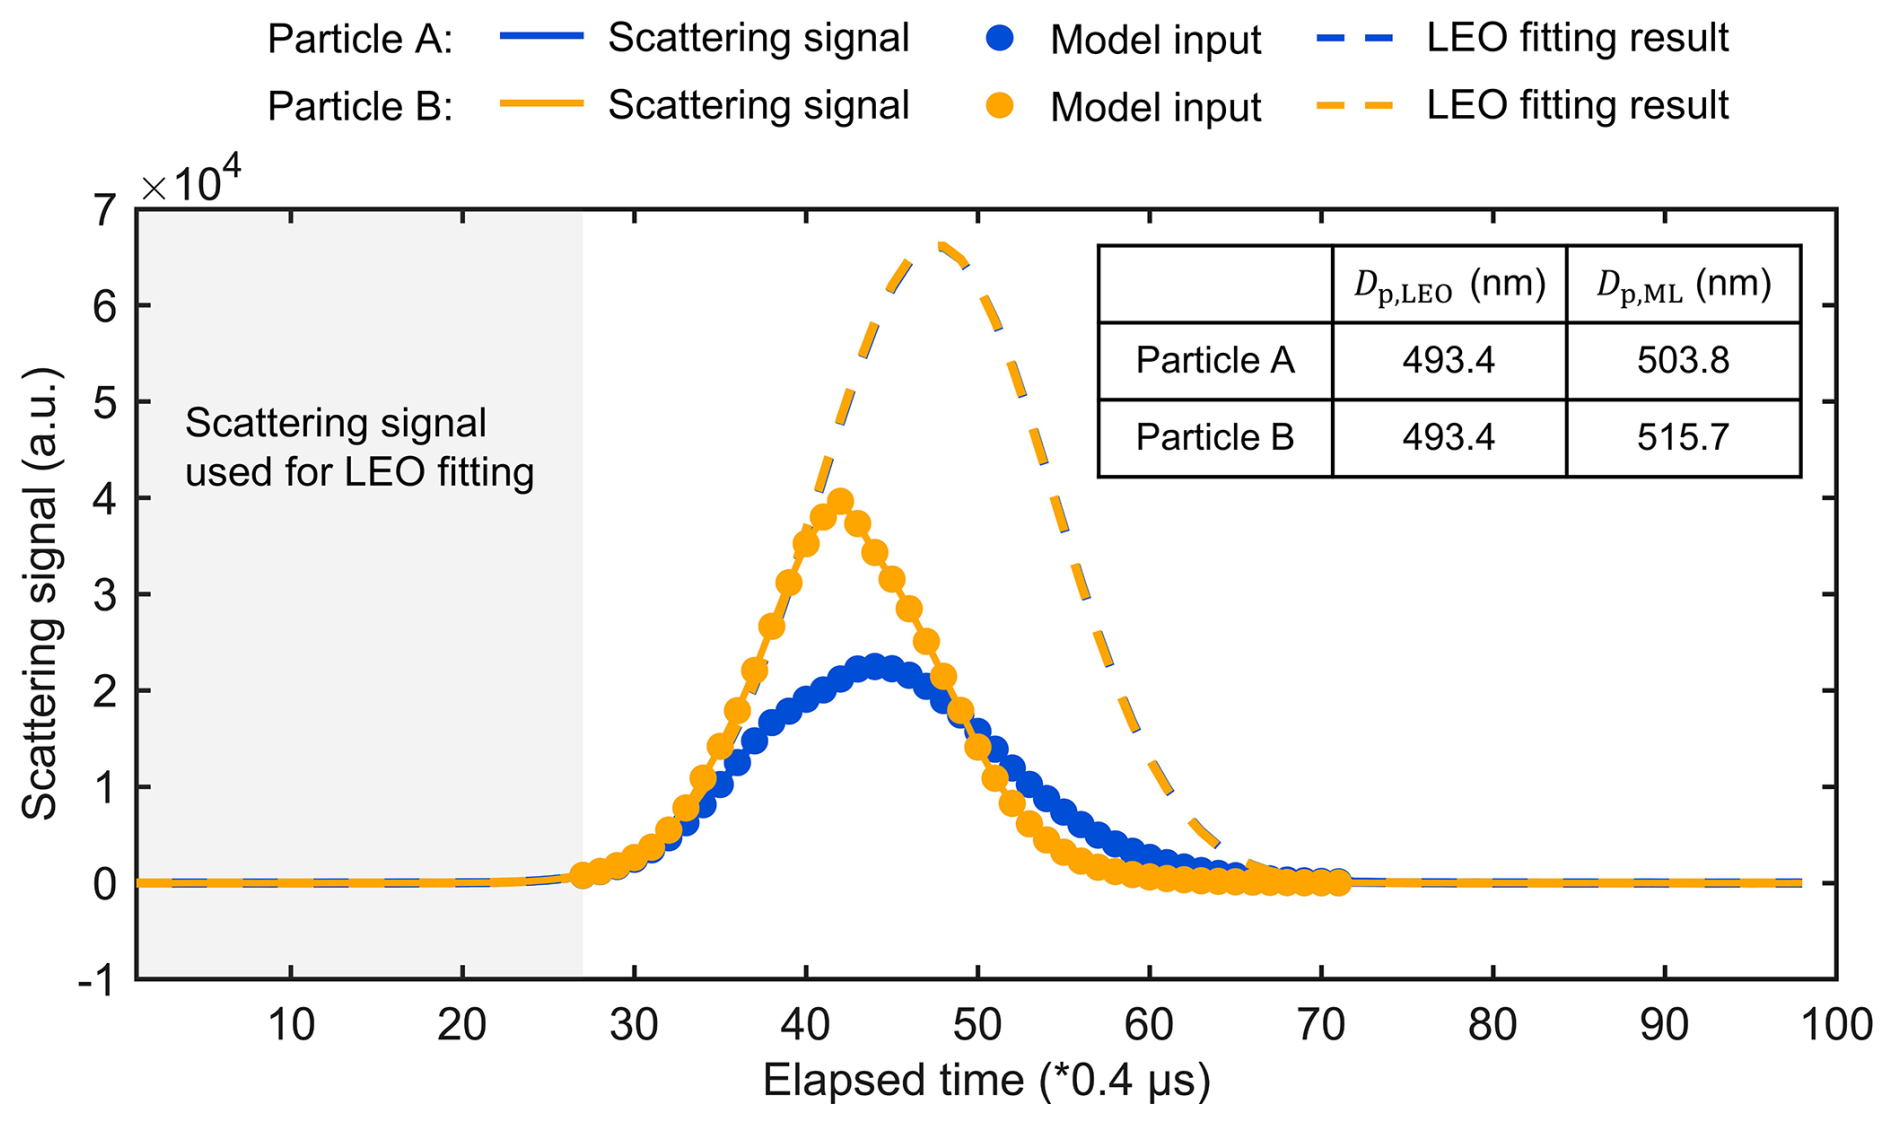
Figure 9Comparison of the scattering signal used in the Dp inversion process for internally mixed BC and corresponding calculation results from both the LEO fitting and the ML methods. The solid line represents the scattering signal obtained by SP2, and the part marked with solid dots is the scattering signal input to the ML model. The shaded gray area shows the leading-edge data used in the LEO fitting process, and the dashed line represents the scattering signal of the original particle reconstructed by LEO fitting.
The SHAP analysis results for the optical cross-section inversion models of internally mixed BC are detailed in Sect. S4.2 in the Supplement. For other particle types, the relationship between target physical properties and feature signals follows relatively straightforward patterns. This study focuses on the more complex case of internally mixed BC and does not elaborate on the SHAP results of these relatively simple scenarios.
4.4 Model application
The BC mixing state inversion model developed in this study demonstrates broad applicability and can be effectively applied to SP2 data obtained across different observation periods. To validate the model's performance, we applied it to the SP2 dataset from April 2022. The results confirm that the model can rapidly and accurately retrieve the single-particle size information of BC-containing particles. Specifically, the model achieved an R2 value of 0.99 for Dc inversion and 0.98 for Dp inversion (Table S1 in the Supplement). Based on the inversion results, we analyze the overall size distribution of internally mixed BC in April. The number size distributions shown in Fig. 10 reveal that Dc is predominantly concentrated around 130 nm, while Dp is mainly distributed around 185 nm. The particle size distribution of particles in the two-dimensional histogram indicates that for particles with relatively small Dc (< 100 nm), Dp is primarily distributed around 180 nm. When Dc is small, some particles with thin coatings are not detected due to the detection limits of the SP2, resulting in an overall thicker coating in the SP2 measurement. As Dc gradually increases to the range of 120 to 140 nm, the primary distribution of Dp shifts to around 165 nm, corresponding to a reduction in coating thickness.
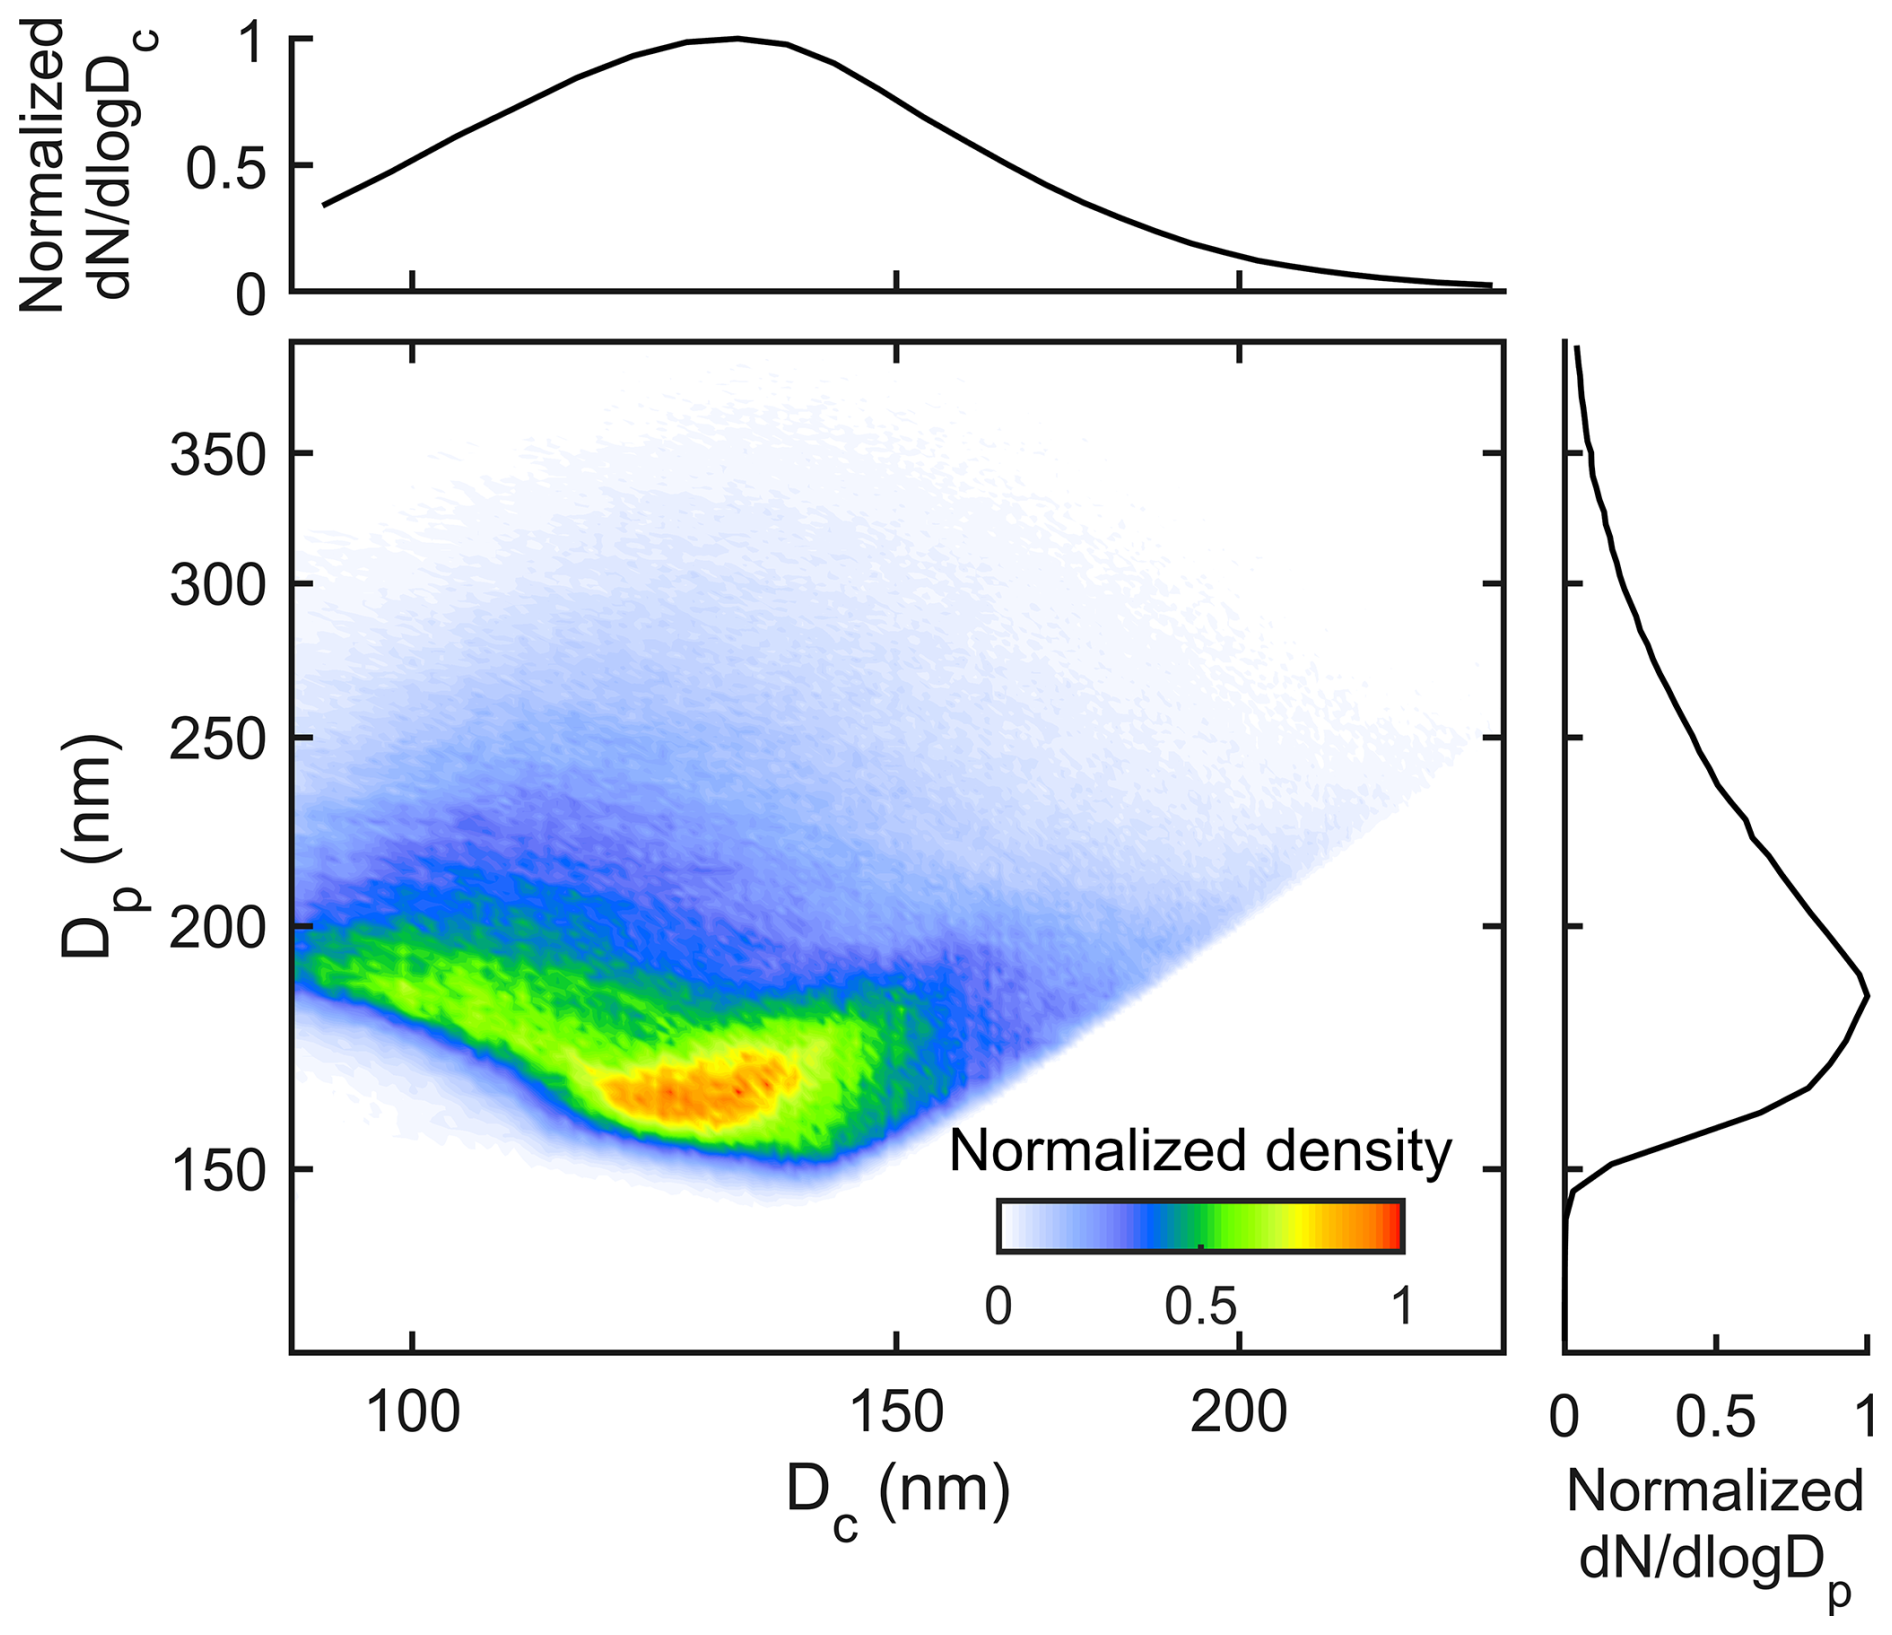
Figure 10Distribution of Dp and Dc of internally mixed BC retrieved from the LightGBM inversion model. The main panel is a two-dimensional histogram, where the color represents the normalized number of particles within a specific size range. Side panels display the normalized number size distributions of Dc and Dp, each scaled to its peak value. Both Dp and Dc axes use logarithmic scales.
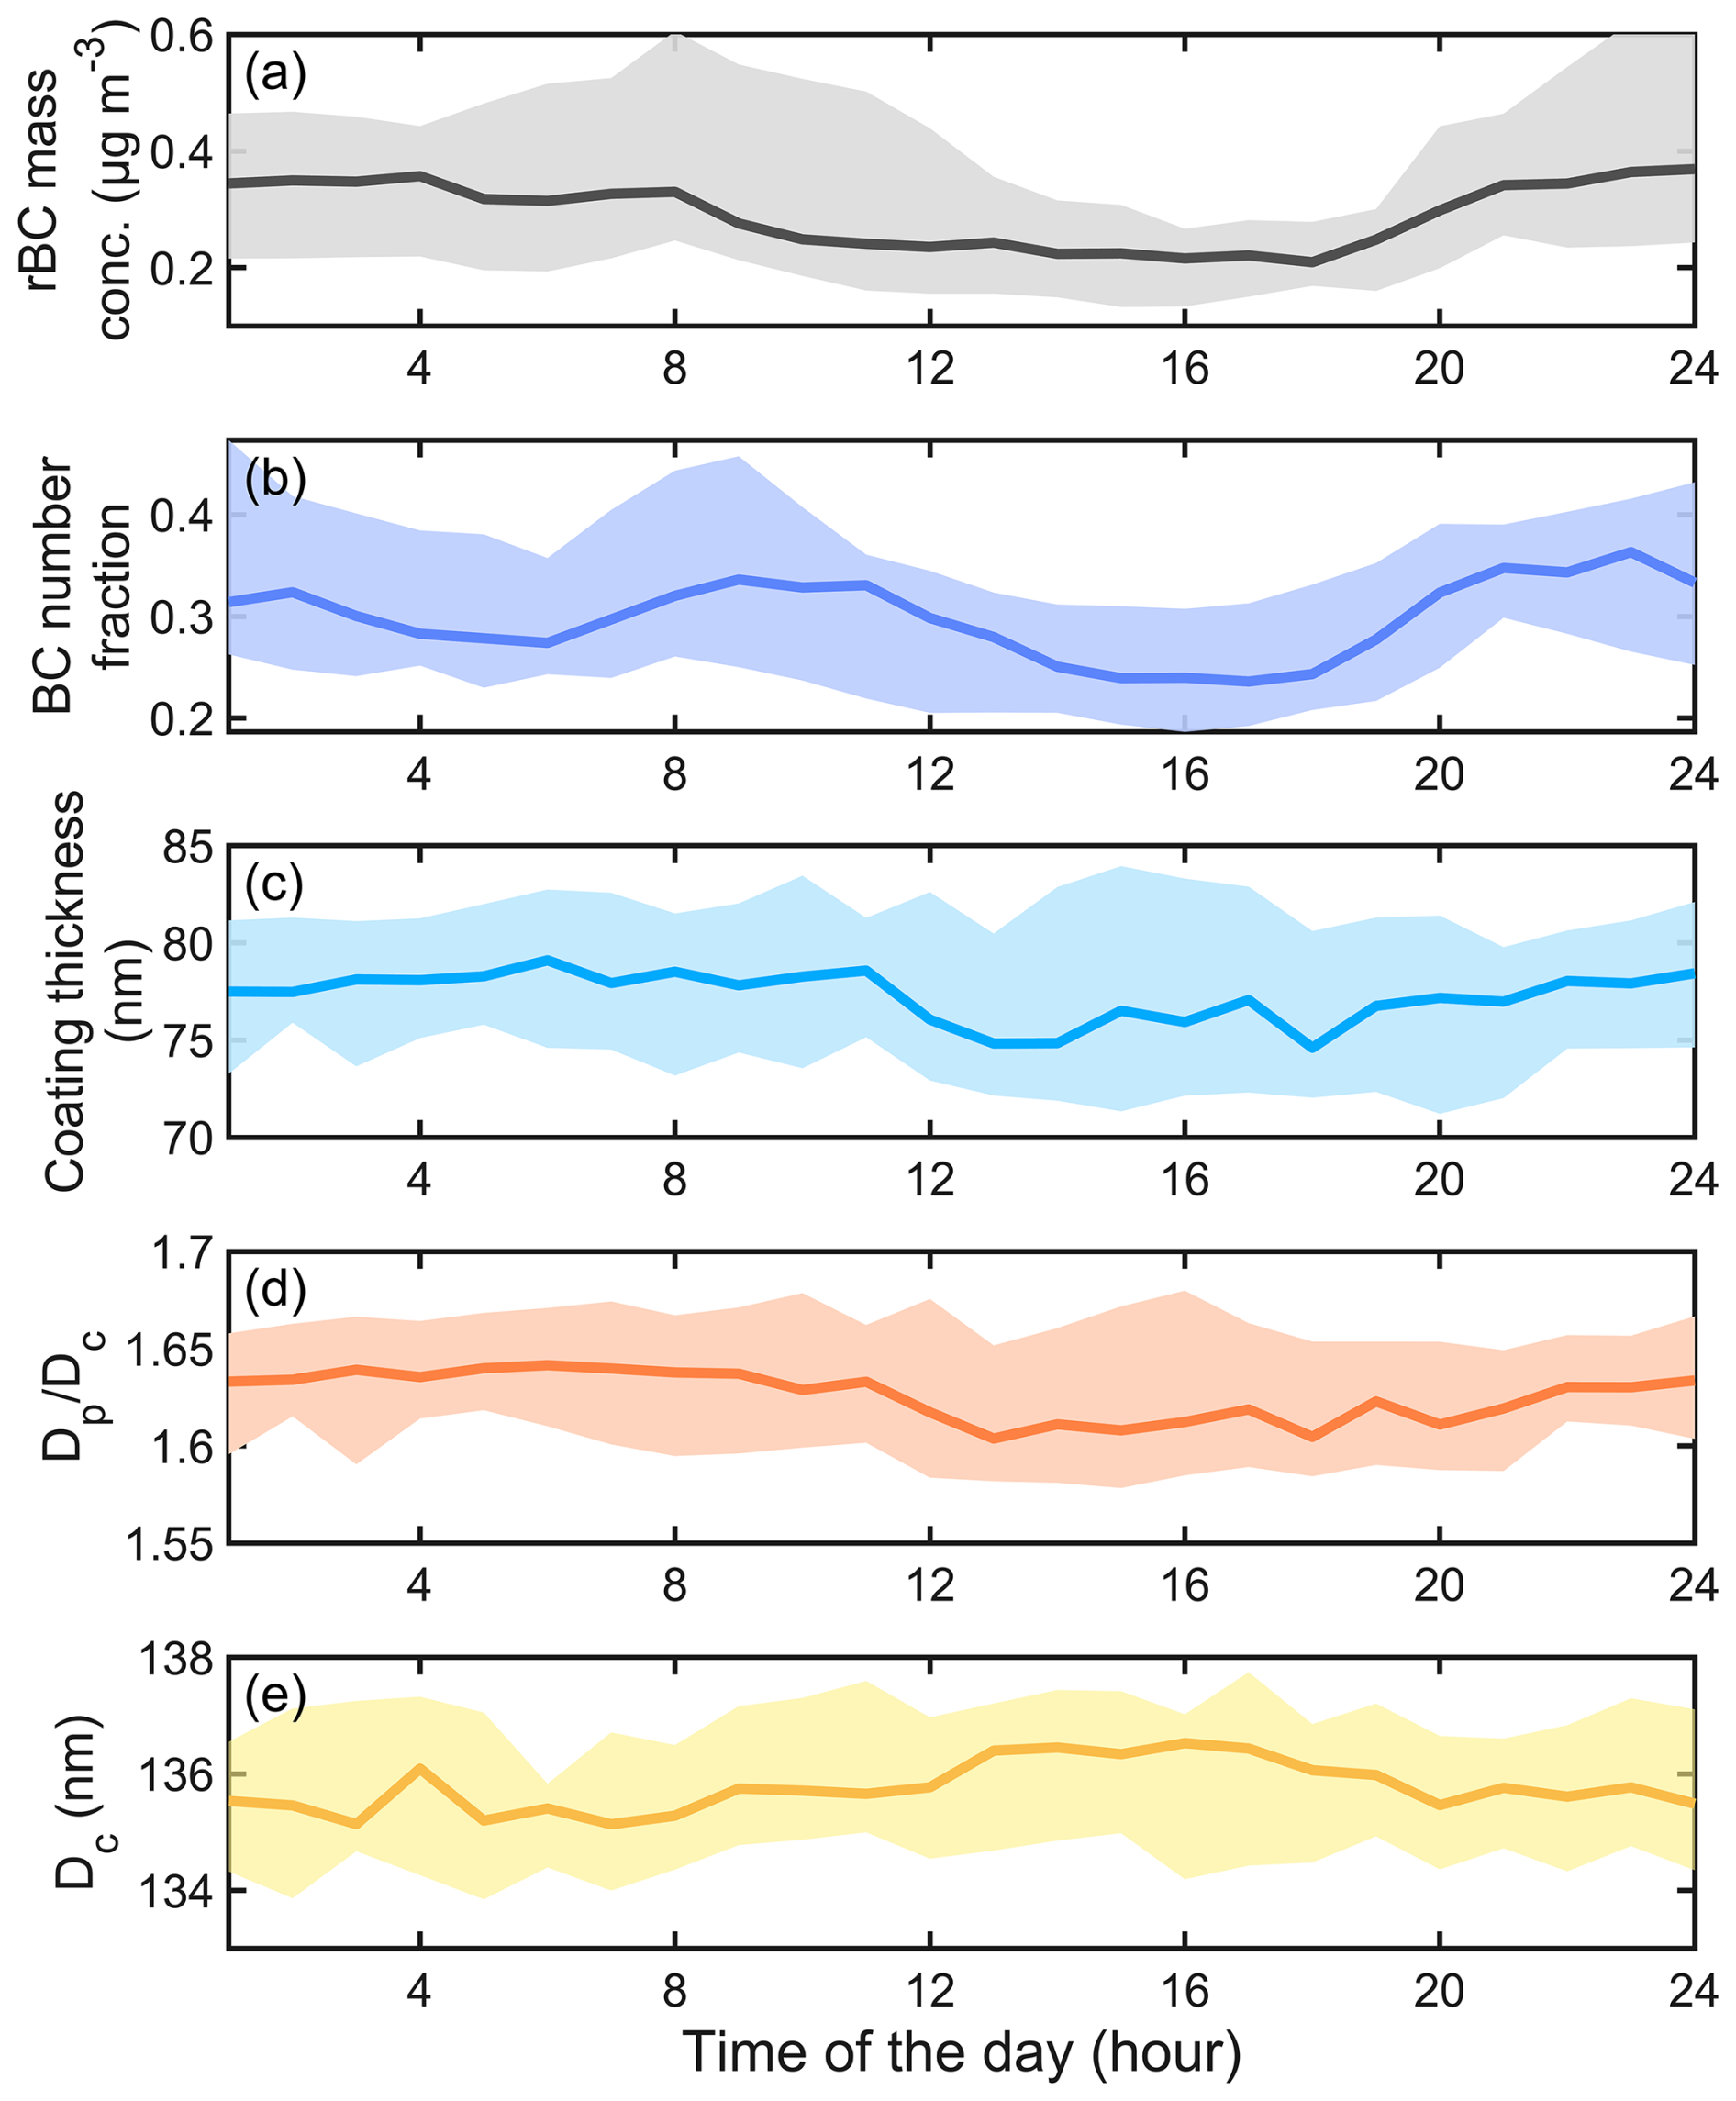
Figure 11The diurnal cycles of (a) the rBC mass concentration; (b) the relative number fraction of BC-containing particles to the total number of particles; (c–e) the coating thickness, Dp/Dc, and Dc values of internally mixed BC. The solid lines represent the median value. The upper and lower boundaries of the shaded area are between the 25 % and 75 % quantiles.
Furthermore, comprehensive statistical analysis of BC-containing particles can be derived by combining the BC particle size results with SP2 sampling data. Figure 11 presents the statistical analysis of various physical properties of BC-containing particles in April 2022. The rBC mass concentration varies between 0.24 and 0.36 µg m−3 (Fig. 11a), while the relative number fraction of BC-containing particles to the total number of particles ranges from 0.26 to 0.36, with a mean value of 0.31 (Fig. 11b). Both parameters exhibit similar diurnal patterns, showing minimum values in the afternoon due to reduced emissions and the development of the planetary boundary layer (PBL) in the daytime while maintaining elevated levels throughout the evening. The formation of the nocturnal boundary layer facilitates the accumulation of pollutants, leading to increased rBC mass concentrations during the nighttime and early morning hours (Zhang et al., 2020). During busy traffic periods in the morning and evening, rBC mass concentration and the relative abundance of BC-containing particles increase significantly due to traffic emissions. Figure 11c shows the diurnal variation in coating thickness (calculated as Dp−Dc) of internally mixed BC, with an average value of 78 nm. While the coating thickness remains relatively stable throughout the day, it exhibits greater variability (as indicated by the shaded area in Fig. 11c) during afternoon hours, potentially due to the enhanced BC aging under favorable photochemical conditions. There is a pronounced decrease in the coating thickness of internally mixed BC at 10:00 LT, which can be attributed to fresh BC emissions from morning traffic. As this newly emitted BC undergoes initial aging processes and atmospheric mixing, some particles transition from external to internal mixing states. Due to the brief aging period, these newly internally mixed BC particles exhibit thinner coatings, contributing to a reduction in the mean coating thickness of the BC population. After 21:00 LT, the coating thickness gradually increases, resulting from the nighttime aging process. Figure 11d and e present the diurnal variations in and Dc values for internally mixed BC, which serve as important physical parameters for analyzing BC aging processes. Both parameters show minor fluctuations over the 24 h. The average is approximately 1.63, with its diurnal variation pattern closely following that of the coating thickness. The mean Dc value is around 136 nm, showing a slight increase during afternoon hours.
This study comprehensively explored the relationship between SP2 data and BC mixing state, developing a LightGBM-based inversion model to correlate SP2 signals with particle size and optical properties. Our results demonstrate that the inversion model can efficiently retrieve the size of various particle types along with their optical properties. The R2 between the predicted and observed values can reach 0.98 or higher. This model can serve as an effective alternative to traditional physical inversion methods, simplifying the quantitative analysis process of particle size and optical properties.
Further, we employed the SHAP method to evaluate the relative importance of SP2 signal features in the Dp inversion model for internally mixed BC and investigated their underlying physical mechanisms. Compared to the LEO fitting method, the ML method utilizes a broader range of signals, including the scattering signal peak, rather than solely relying on leading-edge data. This comprehensive signal utilization enables a more accurate characterization of the diverse particle properties. Moreover, the ML method uses signals with a high signal-to-noise ratio, providing better noise resistance. The LightGBM algorithm further strengthens the model's robustness by determining output values through averaging samples within leaf nodes.
Based on our developed model, we can extract statistical characteristics of BC-containing particles, including rBC mass concentration, coating thickness of internally mixed BC, and BC number fraction. These characteristics provide valuable insights into the physical properties of BC particles. We validated the model's effectiveness and applicability using the SP2 dataset from the SORPES station. The results confirm that our model can rapidly and accurately derive various physical properties of BC-containing particles. Analysis revealed that the BC number fraction ranges from 0.26 to 0.36, with a mean value of 0.31. The diurnal variations in coating thickness and of internally mixed BC exhibit relatively stable patterns, with average values of 78 nm and 1.63, respectively. With this model, online real-time mixing state analysis of single-particle measurement is realized. Additionally, given its simplicity and practicality, this approach holds significant potential for wide application in environmental monitoring and climate studies.
The data and codes related to this article are available upon request from the corresponding author.
The supplement related to this article is available online at https://doi.org/10.5194/amt-18-1149-2025-supplement.
JianW and JiapW designed and directed the study. ZT contributed to algorithm development and data analysis and wrote the manuscript. JX provided guidance on machine learning models. JiapW and JinW provided support for data collection. YJ, ZZ, SS, and BW helped modify the grammar of the manuscript. JianW, JiapW, CL, WN, XH, and AD contributed to the data interpretation and review of the manuscript.
The contact author has declared that none of the authors has any competing interests.
Publisher's note: Copernicus Publications remains neutral with regard to jurisdictional claims made in the text, published maps, institutional affiliations, or any other geographical representation in this paper. While Copernicus Publications makes every effort to include appropriate place names, the final responsibility lies with the authors.
We acknowledge the High Performance Computing Center of Nanjing University of Information Science and Technology for their support of this work.
This work was supported by the National Natural Science Foundation of China (grant nos. 42422505, 42475116, and 42075098) and the National Key Research and Development Program of China (grant no. 2022YFC3701000, Task 5).
This paper was edited by Cheng Liu and reviewed by two anonymous referees.
Ahmad, G. N., Fatima, H., Ullah, S., and Saidi, A. S.: Efficient medical diagnosis of human heart diseases using machine learning techniques with and without GridSearchCV, IEEE Access, 10, 80151–80173, https://doi.org/10.1109/ACCESS.2022.3165792, 2022.
Bond, T. C. and Bergstrom, R. W.: Light Absorption by Carbonaceous Particles: An Investigative Review, Aerosol Sci. Tech., 40, 27–67, https://doi.org/10.1080/02786820500421521, 2006.
Bond, T. C., Doherty, S. J., Fahey, D. W., Forster, P. M., Berntsen, T., DeAngelo, B. J., Flanner, M. G., Ghan, S., Kärcher, B., Koch, D., Kinne, S., Kondo, Y., Quinn, P. K., Sarofim, M. C., Schultz, M. G., Schulz, M., Venkataraman, C., Zhang, H., Zhang, S., Bellouin, N., Guttikunda, S. K., Hopke, P. K., Jacobson, M. Z., Kaiser, J. W., Klimont, Z., Lohmann, U., Schwarz, J. P., Shindell, D., Storelvmo, T., Warren, S. G., and Zender, C. S.: Bounding the role of black carbon in the climate system: A scientific assessment, J. Geophys. Res.-Atmos., 118, 5380–5552, https://doi.org/10.1002/jgrd.50171, 2013.
Cappa, C. D., Onasch, T. B., Massoli, P., Worsnop, D. R., Bates, T. S., Cross, E. S., Davidovits, P., Hakala, J., Hayden, K. L., Jobson, B. T., Kolesar, K. R., Lack, D. A., Lerner, B. M., Li, S.-M., Mellon, D., Nuaaman, I., Olfert, J. S., Petäjä, T., Quinn, P. K., Song, C., Subramanian, R., Williams, E. J., and Zaveri, R. A.: Radiative Absorption Enhancements Due to the Mixing State of Atmospheric Black Carbon, Science, 337, 1078–1081, https://doi.org/10.1126/science.1223447, 2012.
Carleo, G., Cirac, I., Cranmer, K., Daudet, L., Schuld, M., Tishby, N., Vogt-Maranto, L., and Zdeborová, L.: Machine learning and the physical sciences, Rev. Mod. Phys., 91, 045002, https://doi.org/10.1103/RevModPhys.91.045002, 2019.
Fan, J., Ma, X., Wu, L., Zhang, F., Yu, X., and Zeng, W.: Light Gradient Boosting Machine: An efficient soft computing model for estimating daily reference evapotranspiration with local and external meteorological data, Agr. Water Manage., 225, 105758, https://doi.org/10.1016/j.agwat.2019.105758, 2019.
Fierce, L., Onasch, T. B., Cappa, C. D., Mazzoleni, C., China, S., Bhandari, J., Davidovits, P., Fischer, D. A., Helgestad, T., Lambe, A. T., Sedlacek, A. J., Smith, G. D., and Wolff, L.: Radiative absorption enhancements by black carbon controlled by particle-to-particle heterogeneity in composition, P. Natl. Acad. Sci. USA, 117, 5196–5203, https://doi.org/10.1073/pnas.1919723117, 2020.
Fuller, K. A., Malm, W. C., and Kreidenweis, S. M.: Effects of mixing on extinction by carbonaceous particles, J. Geophys. Res., 104, 15941–15954, https://doi.org/10.1029/1998JD100069, 1999.
Gan, M., Pan, S., Chen, Y., Cheng, C., Pan, H., and Zhu, X.: Application of the Machine Learning LightGBM Model to the Prediction of the Water Levels of the Lower Columbia River, Journal of Marine Science and Engineering, 9, 496, https://doi.org/10.3390/jmse9050496, 2021.
Gao, R. S., Schwarz, J. P., Kelly, K. K., Fahey, D. W., Watts, L. A., Thompson, T. L., Spackman, J. R., Slowik, J. G., Cross, E. S., Han, J.-H., Davidovits, P., Onasch, T. B., and Worsnop, D. R.: A Novel Method for Estimating Light-Scattering Properties of Soot Aerosols Using a Modified Single-Particle Soot Photometer, Aerosol Sci. Tech., 41, 125–135, https://doi.org/10.1080/02786820601118398, 2007.
Jacobson, M. Z.: Strong radiative heating due to the mixing state of black carbon in atmospheric aerosols, Nature, 409, 695–697, 2001.
Jordan, M. I. and Mitchell, T. M.: Machine learning: Trends, perspectives, and prospects, Science, 349, 255–260, https://doi.org/10.1126/science.aaa8415, 2015.
Ke, G., Meng, Q., Finley, T., Wang, T., Chen, W., Ma, W., Ye, Q., and Liu, T.-Y.: LightGBM: a highly efficient gradient boosting decision tree, in: NIPS'17: Proceedings of the 31st International Conference on Neural Information Processing Systems, Long Beach, California, USA, 4–9 December 2017, Curran Associates Inc., Red Hook, NY, USA, 3149–3157, 2017.
Keller, C. A. and Evans, M. J.: Application of random forest regression to the calculation of gas-phase chemistry within the GEOS-Chem chemistry model v10, Geosci. Model Dev., 12, 1209–1225, https://doi.org/10.5194/gmd-12-1209-2019, 2019.
Laborde, M., Mertes, P., Zieger, P., Dommen, J., Baltensperger, U., and Gysel, M.: Sensitivity of the Single Particle Soot Photometer to different black carbon types, Atmos. Meas. Tech., 5, 1031–1043, https://doi.org/10.5194/amt-5-1031-2012, 2012.
Li, J., An, X., Li, Q., Wang, C., Yu, H., Zhou, X., and Geng, Y.: Application of XGBoost algorithm in the optimization of pollutant concentration, Atmos. Res., 276, 106238, https://doi.org/10.1016/j.atmosres.2022.106238, 2022.
Liakos, K., Busato, P., Moshou, D., Pearson, S., and Bochtis, D.: Machine Learning in Agriculture: A Review, Sensors, 18, 2674, https://doi.org/10.3390/s18082674, 2018.
Liu, D., Allan, J. D., Young, D. E., Coe, H., Beddows, D., Fleming, Z. L., Flynn, M. J., Gallagher, M. W., Harrison, R. M., Lee, J., Prevot, A. S. H., Taylor, J. W., Yin, J., Williams, P. I., and Zotter, P.: Size distribution, mixing state and source apportionment of black carbon aerosol in London during wintertime, Atmos. Chem. Phys., 14, 10061–10084, https://doi.org/10.5194/acp-14-10061-2014, 2014.
Liu, D., Whitehead, J., Alfarra, M. R., Reyes-Villegas, E., Spracklen, D. V., Reddington, C. L., Kong, S., Williams, P. I., Ting, Y.-C., and Haslett, S.: Black-carbon absorption enhancement in the atmosphere determined by particle mixing state, Nat. Geosci., 10, 184–188, 2017.
Liu, Z.-H., Weng, S.-S., Zeng, Z.-L., Ding, M.-H., Wang, Y.-Q., and Liang, Z.: Hourly land surface temperature retrieval over the Tibetan Plateau using Geo-LightGBM framework: Fusion of Himawari-8 satellite, ERA5 and site observations, Advances in Climate Change Research, 15, 623–635, https://doi.org/10.1016/j.accre.2024.06.007, 2024.
Lundberg, S. M. and Lee, S.-I.: A unified approach to interpreting model predictions, in: NIPS'17: Proceedings of the 31st International Conference on Neural Information Processing Systems, Long Beach, California, USA, 4–9 December 2017, Curran Associates Inc., Red Hook, NY, USA, 4768–4777, 2017.
Lundberg, S. M., Erion, G. G., and Lee, S.-I.: Consistent Individualized Feature Attribution for Tree Ensembles, arXiv [preprint], https://doi.org/10.48550/arXiv.1802.03888, 7 March 2019.
Matsui, H., Hamilton, D. S., and Mahowald, N. M.: Black carbon radiative effects highly sensitive to emitted particle size when resolving mixing-state diversity, Nat. Commun., 9, 3446, https://doi.org/10.1038/s41467-018-05635-1, 2018.
Moteki, N. and Kondo, Y.: Effects of Mixing State on Black Carbon Measurements by Laser-Induced Incandescence, Aerosol Sci. Tech., 41, 398–417, https://doi.org/10.1080/02786820701199728, 2007.
Moteki, N. and Kondo, Y.: Method to measure time-dependent scattering cross sections of particles evaporating in a laser beam, J. Aerosol Sci., 39, 348–364, https://doi.org/10.1016/j.jaerosci.2007.12.002, 2008.
Moteki, N. and Kondo, Y.: Dependence of Laser-Induced Incandescence on Physical Properties of Black Carbon Aerosols: Measurements and Theoretical Interpretation, Aerosol Sci. Tech., 44, 663–675, https://doi.org/10.1080/02786826.2010.484450, 2010.
Moteki, N., Ohata, S., Yoshida, A., and Adachi, K.: Constraining the complex refractive index of black carbon particles using the complex forward-scattering amplitude, Aerosol Sci. Tech., 57, 678–699, https://doi.org/10.1080/02786826.2023.2202243, 2023.
Oshima, N., Koike, M., Zhang, Y., Kondo, Y., Moteki, N., Takegawa, N., and Miyazaki, Y.: Aging of black carbon in outflow from anthropogenic sources using a mixing state resolved model: Model development and evaluation, J. Geophys. Res., 114, 2008JD010680, https://doi.org/10.1029/2008JD010680, 2009.
Pang, Y., Wang, Y., Wang, Z., Zhang, Y., Liu, L., Kong, S., Liu, F., Shi, Z., and Li, W.: Quantifying the Fractal Dimension and Morphology of Individual Atmospheric Soot Aggregates, J. Geophys. Res.-Atmos., 127, e2021JD036055, https://doi.org/10.1029/2021JD036055, 2022.
Ramanathan, V. and Carmichael, G.: Global and regional climate changes due to black carbon, Nat. Geosci., 1, 221–227, 2008.
Schnaiter, M., Linke, C., Möhler, O., Naumann, K. -H., Saathoff, H., Wagner, R., Schurath, U., and Wehner, B.: Absorption amplification of black carbon internally mixed with secondary organic aerosol, J. Geophys. Res., 110, 2005JD006046, https://doi.org/10.1029/2005JD006046, 2005.
Schwarz, J. P., Gao, R. S., Fahey, D. W., Thomson, D. S., Watts, L. A., Wilson, J. C., Reeves, J. M., Darbeheshti, M., Baumgardner, D. G., Kok, G. L., Chung, S. H., Schulz, M., Hendricks, J., Lauer, A., Kärcher, B., Slowik, J. G., Rosenlof, K. H., Thompson, T. L., Langford, A. O., Loewenstein, M., and Aikin, K. C.: Single-particle measurements of midlatitude black carbon and light-scattering aerosols from the boundary layer to the lower stratosphere, J. Geophys. Res., 111, 2006JD007076, https://doi.org/10.1029/2006JD007076, 2006.
Schwarz, J. P., Spackman, J. R., Fahey, D. W., Gao, R. S., Lohmann, U., Stier, P., Watts, L. A., Thomson, D. S., Lack, D. A., Pfister, L., Mahoney, M. J., Baumgardner, D., Wilson, J. C., and Reeves, J. M.: Coatings and their enhancement of black carbon light absorption in the tropical atmosphere, J. Geophys. Res., 113, 2007JD009042, https://doi.org/10.1029/2007JD009042, 2008.
Sedlacek, A. J., Lewis, E. R., Kleinman, L., Xu, J., and Zhang, Q.: Determination of and evidence for non-core-shell structure of particles containing black carbon using the Single-Particle Soot Photometer (SP2), Geophys. Res. Lett., 39, 2012GL050905, https://doi.org/10.1029/2012GL050905, 2012.
Sedlacek, A. J., Lewis, E. R., Onasch, T. B., Lambe, A. T., and Davidovits, P.: Investigation of Refractory Black Carbon-Containing Particle Morphologies Using the Single-Particle Soot Photometer (SP2), Aerosol Sci. Tech., 49, 872–885, https://doi.org/10.1080/02786826.2015.1074978, 2015.
Shiraiwa, M., Kondo, Y., Moteki, N., Takegawa, N., Sahu, L. K., Takami, A., Hatakeyama, S., Yonemura, S., and Blake, D. R.: Radiative impact of mixing state of black carbon aerosol in Asian outflow, J. Geophys. Res., 113, 2008JD010546, https://doi.org/10.1029/2008JD010546, 2008.
Slowik, J. G., Cross, E. S., Han, J.-H., Davidovits, P., Onasch, T. B., Jayne, J. T., Williams, L. R., Canagaratna, M. R., Worsnop, D. R., Chakrabarty, R. K., Moosmüller, H., Arnott, W. P., Schwarz, J. P., Gao, R.-S., Fahey, D. W., Kok, G. L., and Petzold, A.: An Inter-Comparison of Instruments Measuring Black Carbon Content of Soot Particles, Aerosol Sci. Tech., 41, 295–314, https://doi.org/10.1080/02786820701197078, 2007.
Stephens, M., Turner, N., and Sandberg, J.: Particle identification by laser-induced incandescence in a solid-state laser cavity, Appl. Optics, 42, 3726–3736, 2003.
Subramanian, R., Kok, G. L., Baumgardner, D., Clarke, A., Shinozuka, Y., Campos, T. L., Heizer, C. G., Stephens, B. B., de Foy, B., Voss, P. B., and Zaveri, R. A.: Black carbon over Mexico: the effect of atmospheric transport on mixing state, mass absorption cross-section, and BC/CO ratios, Atmos. Chem. Phys., 10, 219–237, https://doi.org/10.5194/acp-10-219-2010, 2010.
Sun, X., Liu, M., and Sima, Z.: A novel cryptocurrency price trend forecasting model based on LightGBM, Financ. Res. Lett., 32, 101084, https://doi.org/10.1016/j.frl.2018.12.032, 2020.
Tarca, A. L., Carey, V. J., Chen, X., Romero, R., and Drăghici, S.: Machine Learning and Its Applications to Biology, PLoS Comput. Biol., 3, e116, https://doi.org/10.1371/journal.pcbi.0030116, 2007.
Taylor, J. W., Allan, J. D., Liu, D., Flynn, M., Weber, R., Zhang, X., Lefer, B. L., Grossberg, N., Flynn, J., and Coe, H.: Assessment of the sensitivity of core/shell parameters derived using the single-particle soot photometer to density and refractive index, Atmos. Meas. Tech., 8, 1701–1718, https://doi.org/10.5194/amt-8-1701-2015, 2015.
Wang, Y., Liu, F., He, C., Bi, L., Cheng, T., Wang, Z., Zhang, H., Zhang, X., Shi, Z., and Li, W.: Fractal Dimensions and Mixing Structures of Soot Particles during Atmospheric Processing, Environm. Sci. Tech. Let., 4, 487–493, https://doi.org/10.1021/acs.estlett.7b00418, 2017.
Wang, Y., Pang, Y., Huang, J., Bi, L., Che, H., Zhang, X., and Li, W.: Constructing Shapes and Mixing Structures of Black Carbon Particles With Applications to Optical Calculations, J. Geophys. Res.-Atmos., 126, e2021JD034620, https://doi.org/10.1029/2021JD034620, 2021a.
Wang, Y., Li, W., Huang, J., Liu, L., Pang, Y., He, C., Liu, F., Liu, D., Bi, L., Zhang, X., and Shi, Z.: Nonlinear Enhancement of Radiative Absorption by Black Carbon in Response to Particle Mixing Structure, Geophys. Res. Lett., 48, e2021GL096437, https://doi.org/10.1029/2021GL096437, 2021b.
Wei, J., Li, Z., Pinker, R. T., Wang, J., Sun, L., Xue, W., Li, R., and Cribb, M.: Himawari-8-derived diurnal variations in ground-level PM2.5 pollution across China using the fast space-time Light Gradient Boosting Machine (LightGBM), Atmos. Chem. Phys., 21, 7863–7880, https://doi.org/10.5194/acp-21-7863-2021, 2021.
Yang, L., Xu, H., and Yu, S.: Estimating PM2.5 concentrations in Yangtze River Delta region of China using random forest model and the Top-of-Atmosphere reflectance, Journal of Environmental Management, 272, 111061, https://doi.org/10.1016/j.jenvman.2020.111061, 2020.
Zhang, L., Shen, F., Gao, J., Cui, S., Yue, H., Wang, J., Chen, M., and Ge, X.: Characteristics and potential sources of black carbon particles in suburban Nanjing, China, Atmos. Pollut. Res., 11, 981–991, https://doi.org/10.1016/j.apr.2020.02.011, 2020.
Zhang, Y., Zhang, Q., Cheng, Y., Su, H., Kecorius, S., Wang, Z., Wu, Z., Hu, M., Zhu, T., Wiedensohler, A., and He, K.: Measuring the morphology and density of internally mixed black carbon with SP2 and VTDMA: new insight into the absorption enhancement of black carbon in the atmosphere, Atmos. Meas. Tech., 9, 1833–1843, https://doi.org/10.5194/amt-9-1833-2016, 2016.
Zhang, Y., Wang, Y., Gao, M., Ma, Q., Zhao, J., Zhang, R., Wang, Q., and Huang, L.: A Predictive Data Feature Exploration-Based Air Quality Prediction Approach, IEEE Access, 7, 30732–30743, https://doi.org/10.1109/ACCESS.2019.2897754, 2019.
Zhong, J., Zhang, X., Gui, K., Wang, Y., Che, H., Shen, X., Zhang, L., Zhang, Y., Sun, J., and Zhang, W.: Robust prediction of hourly PM2.5 from meteorological data using LightGBM, Natl. Sci. Rev., 8, nwaa307, https://doi.org/10.1093/nsr/nwaa307, 2021.