the Creative Commons Attribution 4.0 License.
the Creative Commons Attribution 4.0 License.
 | 10 Mar 2025
Turbulence kinetic energy dissipation rate estimated from a WindCube Doppler lidar and the LQ7 1.3 GHz radar wind profiler in the convective boundary layer
Masanori Yabuki
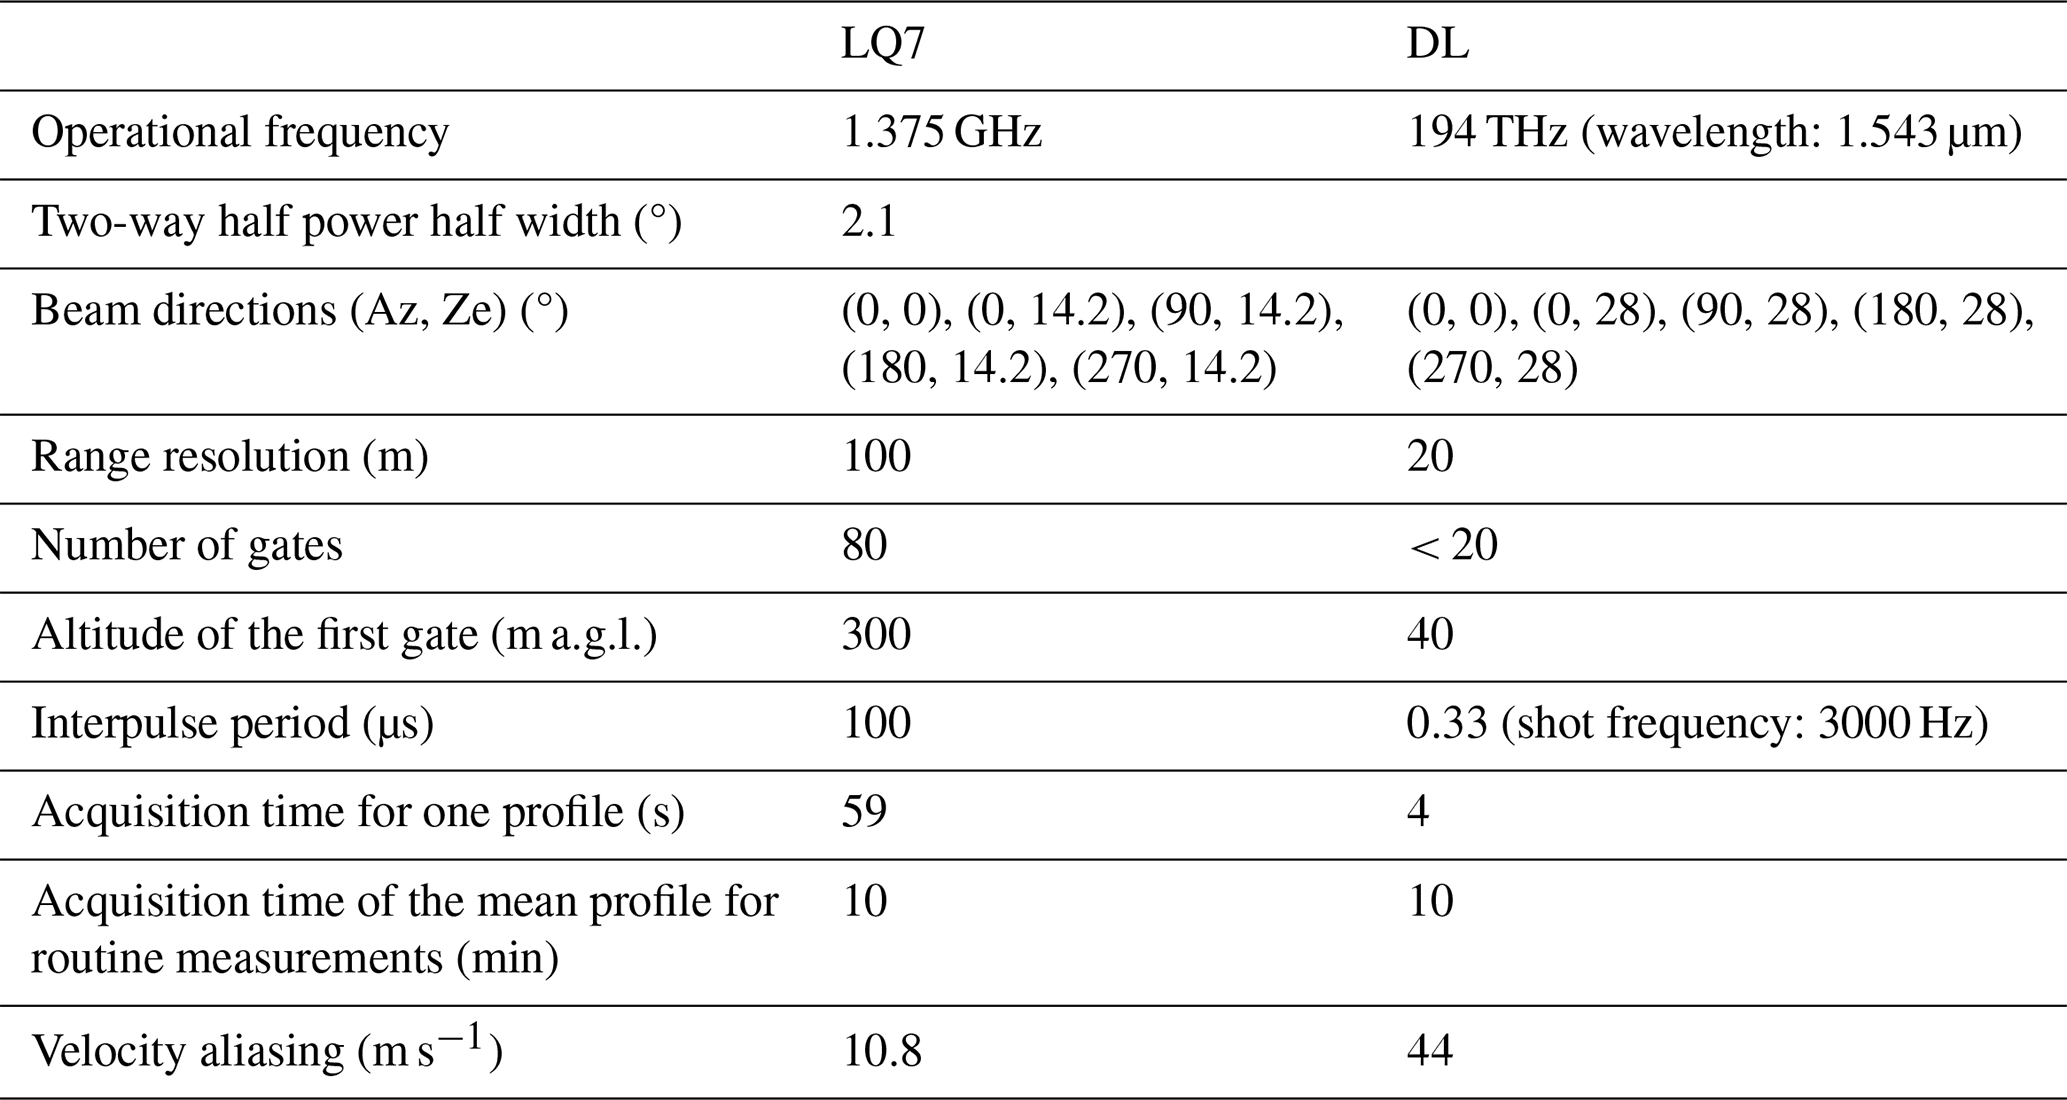
From 21 August to 15 September 2022, a WindCube v2 infrared coherent Doppler lidar (DL) supplied by EKO Instruments Co. (Japan) was deployed at the Shigaraki MU Observatory (Japan) near the LQ7 UHF (1.357 GHz) wind profiler in routine operation. Horizontal and vertical velocity measurements from the DL were reliably obtained in the [40–300] m height range with vertical and temporal resolutions of 20 m and 4 s, respectively. The LQ7 wind measurements are collected with range and temporal resolutions of 100 m and 59 s, respectively, and 10 min average profiles are calculated after data quality control. Reliable LQ7 Doppler data are collected from a height of 400 m. Despite the lack of overlap in the height range, we compared the turbulence kinetic energy (TKE) dissipation rate ε in the daytime planetary boundary layer estimated by the two instruments. A method based on the calculation of the one-dimensional transverse line spectrum of the vertical velocity W from mean W time series (TS method) was applied to DL (εDL). The same method was also applied to 1 min LQ7 data () to assess its performance with respect to DL despite the poorer time resolution. A more standard method based on the Doppler spectral width (DS) was also applied to LQ7 () from the 10 min average profiles. We tested recently proposed models of the form , where σ is half the spectral width corrected for non-turbulent effects, and L is assumed to be a constant or a fraction of the depth D of the convective boundary layer (CBL). The main results are the following: (1) For the deepest CBLs ( km) that develop under high atmospheric pressure, the time–height cross-sections of and εDL show very consistent patterns and do not show any substantial gaps in the transition region of 300–400 m when is evaluated with L∼70 m, which is found to be about one-tenth of the average of the CBL depth (L∼0.1D). (2) Hourly mean εDL averaged over the [100–300] m height range is on average about twice the hourly mean averaged over the [400–500] m height range when km. (3) Hourly mean εDL averaged over the [100–300] m height range and hourly mean averaged over the [400–500] m height range with L∼0.1D are identical on average. Consistent with the fact that ε is expected to decrease slightly with height in the mixed layer, results (2) and (3) imply an uncertainty as to the exact value of the ratio: . We have also studied in detail the case of a shallow ( km) convective boundary layer that developed under low atmospheric pressure and cloudy conditions. Despite the fact that hourly mean εDL averaged over the [100–300] m height range and hourly mean averaged over the [400–500] m height range show more significant discrepancies, maybe due to the different properties of the shallow convection, the time–height cross-sections of εDL and show more consistent patterns and levels.
- Article
(4606 KB) - Full-text XML
- BibTeX
- EndNote


The planetary boundary layer is the interface between the Earth's surface and the free atmosphere. It plays an essential role in exchanges of matter, energy and momentum as well as in the mechanisms governing atmospheric circulation from local scales to planetary scales (Stull, 1988). It is still the subject of many studies because of the large variety of cases related to various meteorological and surface conditions. The turbulence kinetic energy (TKE) dissipation rate ε is one of the key parameters characterizing the dynamics of the convective boundary layer (CBL). Reliable and continuous measurements of this parameter covering the whole CBL depth (hereafter denoted as D throughout the paper) are necessary to assess and improve the subgrid turbulence schemes in numerical weather forecast models. In the present work, we show the results of measurements of ε in convective boundary layers (CBLs) from a Doppler lidar and a ultrahigh-frequency (UHF) wind profiler. During a period of about 4 weeks, from 21 August to 15 September 2022, a WindCube v2 infrared coherent Doppler lidar (DL) supplied by EKO Instruments Co., Japan, (Fig. 1a) was deployed at Shigaraki middle and upper atmosphere (MU) Observatory (Japan) for another project related to temperature and humidity profile measurements. The 1.357 GHz wind profiler WPR LQ7 is a UHF Doppler radar developed by Sumitomo Corp. (Imai et al., 2007) (Fig. 1b), routinely operating for boundary layer and lower troposphere observations. The DL provided reliable measurements from a height of 40 to 300 m at a time resolution of 4 s, and LQ7 provided data from a height of 400 m at a time resolution of 59 s. The LQ7 data are also processed to provide deliverables at a time resolution of 10 min after averaging and data quality control. These data are available (http://www.rish.kyoto-u.ac.jp/radar-group/blr/shigaraki/data/, last access: 7 March 2025). The main specifications of DL and LQ7 are given in Table 1.
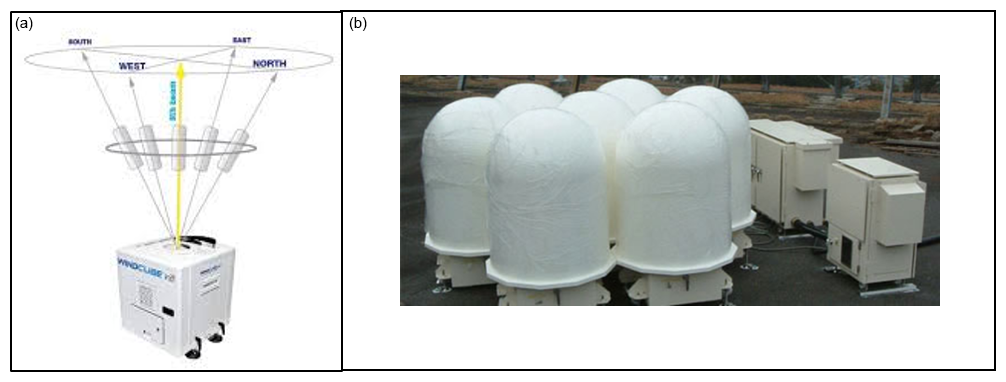
Figure 1(a) The WindCube v2 infrared Doppler lidar, manufactured by Leosphere and provided by EKO Instruments Co., Ltd. (Japan) along with the five beam directions. (b) The WPR LQ7 antenna array.
Despite the lack of height range overlap, comparisons of ε estimated by different methods can be made when sampling the mixed layer of the CBL (i.e., , typically), as mean values of ε are not expected to vary much in this region. ε from the DL (hereafter noted εDL) is estimated from the one-dimensional line spectrum of the vertical velocity W from mean W time series (e.g., Lothon et al., 2009; O'Connor et al., 2010; Banakh et al., 2021; Sanchez Gomez et al., 2021). The high time resolution of DL should allow us to characterize the inertial subrange of Kolmogorov–Obukhov turbulence in the CBL from which ε can be determined. Despite the poorer time resolution of the LQ7 (59 s), we also applied the time series (TS) method to LQ7 from 64-point W time series to estimate and to compare with εDL. In the past, the TS method has rarely been tested with very high frequency (VHF) and UHF radars because of probable contaminations from (Doppler shifted) gravity waves in the free atmosphere when the total acquisition time exceeds ∼100 min (e.g., Hocking et al., 2016). This constraint seems totally incompatible with the total duration (∼ 1 h) used to apply the TS method, but we nevertheless show that the TS method applied to LQ7 can give results consistent with those obtained with DL when both LQ7 and DL measurements are made in the CBL. The Doppler spectral width (DS) method is an alternative method that relates the part of the variance of Doppler spectrum peaks due to turbulence to ε using different models, depending on the characteristics of the radar and the turbulence properties. It is commonly applied to clear-air VHF stratosphere–troposphere (ST) radars as well as wind profilers (e.g., Hocking et al., 2016) and weather radars (e.g., Doviak and Zrnic', 1993). The DS method was applied to LQ7 to estimate but not to DL, because the full Doppler spectrum was not available during the campaign. In the present work, we used a very simple model obtained by Luce et al. (2018) for the VHF MU radar and assessed with LQ7 by Luce et al. (2023a, b) for shear-generated turbulence. The aim was to assess the performance of this simple model to convectively generated turbulence in the CBL from comparisons with DL measurements.
In Sect. 2, we describe the methods for estimating εDL, and and the practical procedure used for the comparisons between the two instruments. We show the results for two case studies and statistics based on data collected during the whole campaign in Sect. 3. Summary and conclusions are shown in Sect. 4.
2.1 TS method
The accuracy of ε and velocity variance estimates from the time series (TS) method is the subject of many sophisticated derivations (e.g., Banakh et al., 2021, and references therein). They are particularly necessary for turbulence in the sheared stratified atmospheric boundary layer and in the presence of gravity waves (e.g., Banakh and Smalikho, 2018). In the present work, we use the following representation of the one-dimensional turbulence energy frequency spectrum of vertical velocity (e.g., Banakh et al., 1999):
where CK=0.52 is the Kolmogorov constant, is the mean wind speed, and α is the angle between the beam axis and the mean (3D) wind direction. For a horizontal wind and a vertical beam, the measurements are transverse (α=90°) so that . By default, we will apply this coefficient, even if it is not self-evident in the CBL because the horizontal wind speed U can be on the order of or even smaller than the mean vertical velocities W, so the measurements would not be transverse but longitudinal for the asymptotic case U≪W. In addition, in the case where the root mean square (rms) value Vrms of the turbulent wind fluctuations are not small compared to the mean wind velocity , the Taylor hypothesis would be violated. Wilczek et al. (2014) showed that the consequence is a dependence of CK with (their Fig. 1) and an underestimation of CK that can be on the order of 50 % for ξ=1. In practice, we checked that this correction remains small for our observations. However, it should be kept in mind that the constant can deviate significantly from in extreme cases, i.e., when the mean wind is weak and not horizontal and when turbulent velocity fluctuations are strong.
Strictly speaking, Eq. (1) is valid for point measurement spectra. Banakh et al. (1999) proposed to include the effects of the measurement volume by multiplying (1) by the transfer function H(f) of a low-pass filter: SD(f)=Sw(f)H(f) (their Eq. 37, p. 1051). For , where Δz is the range resolution, the weighted spectrum is expected to vary as not . In many cases, the condition for observing a slope or a slope steeper than was potentially met in our lidar data, especially when is weak. However, we did not observe such a characteristic but rather a very clear slope when the horizontal wind is weak (∼ 2–5 m s−1). We will therefore restrict ourselves to using Eq. (1), keeping in mind that it is an approximation, widely accepted for other radar and lidar applications (e.g., Hocking et al., 2016).
For applying the TS method, we used W time series sampled at 4 s for the DL and 59 s for the LQ7. As suggested by one of the reviewers, vertical velocities can also be derived from radial velocity measurements taken by pairs of oblique beams that lie in the same vertical plane (namely, north–south and west–east). A possible advantage is a reduced influence of the ground clutter (which affects the Doppler spectra around 0 Hz). We compared the results from measured and reconstructed vertical velocities and found no significant differences in the statistics, suggesting that the impact of ground clutter is negligible for the datasets used in this study. Although we did not include these results in the paper to save space, they may be worth exploring further in future research.
W time series of 512 points for the DL (64 points for the LQ7), corresponding to ∼ 34 min (63 min), are first detrended by removing a linear fit of the time series. They are then weighted by a (variance preserved) Hanning window. Because of the loss of energy at the edges of the time series resulting from the weighting function, a time oversampling by a factor of 2 is applied. The frequency spectra S(f) are then calculated using the fast Fourier transform (FFT) method. The Nyquist frequency is 0.125 s−1 for the DL and 0.0085 s−1 for the LQ7. The spectral levels in the [0.01–0.08] s−1 frequency band for the DL and [0.002–0.007] s−1 frequency band for the LQ7 are then obtained. εDL and are finally deduced by identification with the theoretical Eq. (1). This differs from O'Connor et al. (2010), who calculated the total variance by assuming that all the resolved scales lie within the inertial subrange. Here, we only need to assume that the selected and limited frequency band is consistent with the Kolmogorov law. The consistency with a slope has been tested by calculating the spectral slopes in the selected bands. They are obtained by (a) dividing the spectral band into two equal sub-bands (in log scale), (b) calculating the variance for each sub-band and (c) determining the slope of the straight line passing through these two points. The procedure described above was applied to frequency spectra and fixed spectral bands. We also applied it to wavenumber spectra and fixed wavenumber bands. The results were found to be very similar and are not shown. However, because the spectra are not obtained with the same mean horizontal wind speed due to the altitude offset, we compared the wavenumber spectra S(k) obtained from the DL and LQ7.
2.2 DS method
The Doppler spectral width (DS) method applied to LQ7 was described by Luce et al. (2023a, b). It is based on the results presented by Luce et al. (2018) using the MU radar. We showed a simple formulation:
where L=70 m, and σ2 is the variance of Doppler spectral peaks caused by turbulence. A brief description of the assumptions and method used to derive σ2 is provided in Appendix A. More details are given in Luce et al. (2018). For estimating , we used the LQ7-processed data of spectral width and horizontal wind speed at a time resolution of 10 min as in Luce et al. (2023a, b).
Equation (2) provides the best statistical results of comparisons with ε directly estimated from in situ measurements with Pitot sensors aboard DataHawk uncrewed aerial vehicles (UAVs) (Lawrence and Balsley, 2013; Kantha et al., 2017). This apparent scale can be interpreted as the vertical integral length scale lw of vertical velocities W if σ2 is the variance of W (Albrecht et al., 2015). It was later found that Eq. (2) is a first approximation to a more general expression that depends on the depth of the turbulent layer (Luce et al., 2023b):
Here, D represents the depth of the shear-generated turbulent layer. Note that Albrecht et al. (2015) found a similar result on average (i.e., lw≈0.1D) in the entrainment zone of a convective boundary layer of depth D topped by stratocumulus clouds. Lenschow and Stankov (1986) found a dependence of with altitude in the convective boundary layer, but 0.1 seems to be a typical value (their Fig. 2).
We will first test Eq. (2) for two reasons: it is very simple and does not require a priori information on the CBL depth D, so it can be applied in real time if acceptable. Equation (3) is a hypothesis and requires a posteriori information on D. We will consider this model in a second stage.
2.3 Comparison methods
As explained above, the DL and LQ7 comparisons were not made at the same height range, although the instrument parameters were set to allow measurements to be made up to 390 m for the DL and from 300 m (height of the center of the first radar gate) for the LQ7. To assess the quality of the DL and LQ7 data, we tested the height continuity of daily averaged horizontal wind speeds (not shown). After removing spurious DL data due to low carrier-to-noise ratios and rain contaminations, we found a negative bias (systematic for all days) for heights above 300 m for the DL and for the first sampled height of the LQ7 (i.e., 300 m). For these reasons, we discarded the corresponding data for the DL and LQ7, and there was no longer any altitude overlap between the two instruments. With our objective being to compare spectra of W and dissipation rates, which are expected to be rather uniform on average in the mixed layer of the CBL, we showed results of observations between 07:00 and 17:00 LT (local time), enclosing the whole evolution of the CBL during the day. Outside this time window, the CBL is not sampled by the two instruments. In addition, LQ7 is highly sensitive to biological targets (birds, bats or insects) from sunset to sunrise. The raw data are strongly corrupted, so it is not possible to produce reliable estimates of atmospheric parameters at a time resolution of 59 s. Algorithms are used to discard these outliers in the 10 min averaged processed data.
To improve the precision of the estimated quantities (velocities, spectra, ε), we average these quantities in heights between 100 and 300 m for the DL (i.e., 11 consecutive gates) and between 400 and 500 m (i.e., 2 consecutive gates) for the LQ7 (see, for example, the black rectangular contour in Fig. 5a), assuming that they are weakly variable in these height ranges during convection. This assumption has been verified in practice, and examples will be shown.
3.1 Meteorological background conditions
Figure 2 shows the contour plots of sea level pressure, surface horizontal winds (vectors) and temperature (color levels) around Japan on 11 September 2022 (left) and 27 August (right) at 12:00 LT obtained from Japan Meteorological Agency's (JMA) grid point value (GPV) data generated from the Meso-Scale Model (MSM). These two dates will be analyzed in detail in Sect. 3.2. A shallow low-pressure trough extending from a depression (∼ 1000 hPa) centered over the Vladivostok region to the west of Japan, including the region of the Shigaraki MU Observatory (34.85° N, 136.10° E), can be seen on 27 August. On 11 September, at 12:00 LT, high atmospheric pressure conditions (∼ 1014 hPa) and a shallow ridge extending from a small anticyclone around (24° N, 138° E) were observed. The high-pressure conditions did not change until 15 September at least (day of the field campaign end). Two representative cloud cover conditions from a fisheye camera at 10:30 LT are shown in Fig. 3 (left panel: 27 August, right panel: 11 September). On 11 September, only fair weather cumulus clouds were present, and the conditions were conducive to the formation of a convective boundary layer. On 27 August, stratiform clouds with a base located at about 2 km altitude were observed until ∼ 17:00 LT, interspersed with short sunny spells. The low-intensity incoming solar radiation prevented the development of the CBL, but on some occasions, lower-level cumulus clouds (such as those in the lower left of the photo) developed and dissipated.
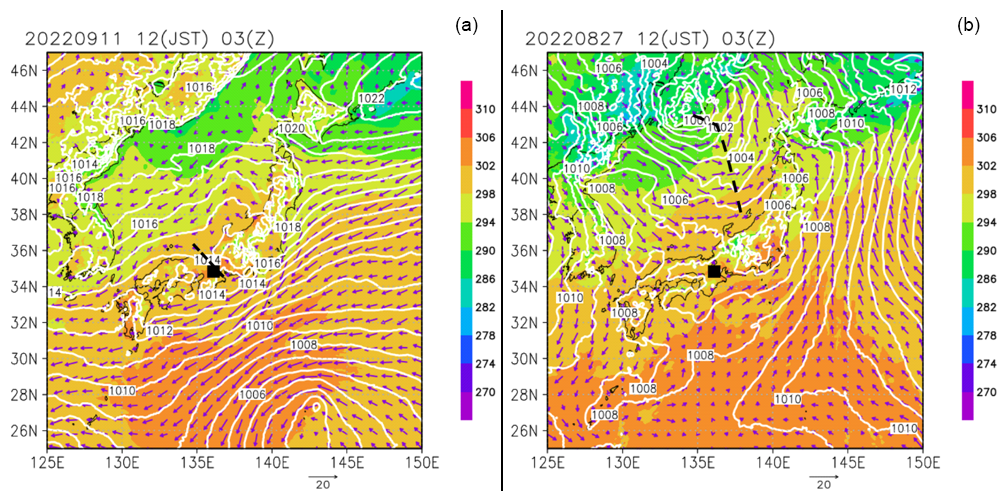
Figure 2Sea level pressure isobars, horizontal winds (vectors) and temperature (color levels) around Japan on 11 September 2022 (a) and on 27 August (b) at 12:00 LT. The small black squares show the Shigaraki MU Observatory location (GrADS/COLA: Grid Analysis and Display System / Center for Ocean-Land-Atmosphere Studies).
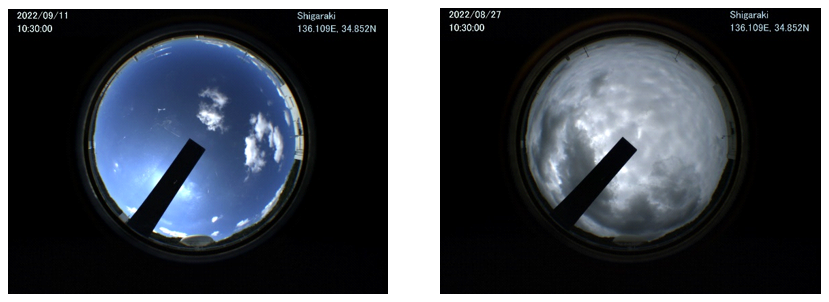
Figure 3Two examples of fisheye camera photos on 11 September and 27 August 2022 at 10:30 LT at Shigaraki MU Observatory.
Figure 4 shows time–height cross-sections of backscatter data measurements (in log 10 scale) from a Vaisala CL31 ceilometer and hourly horizontal winds measured by the DL averaged over the 40–300 m height range for 11 September and 27 August 2022. The ceilometer shows the vertical distribution of aerosols and cloud base. Approximately, red levels (around log 10(105 sr km−1) ≈2) indicate high concentrations of aerosols, and dark-red levels (log 10(105 sr km−1) ≥2.5) indicate clouds and (light) precipitation.1 The cloud base is highlighted by white dots. The 910 nm ceilometer laser does not penetrate clouds.
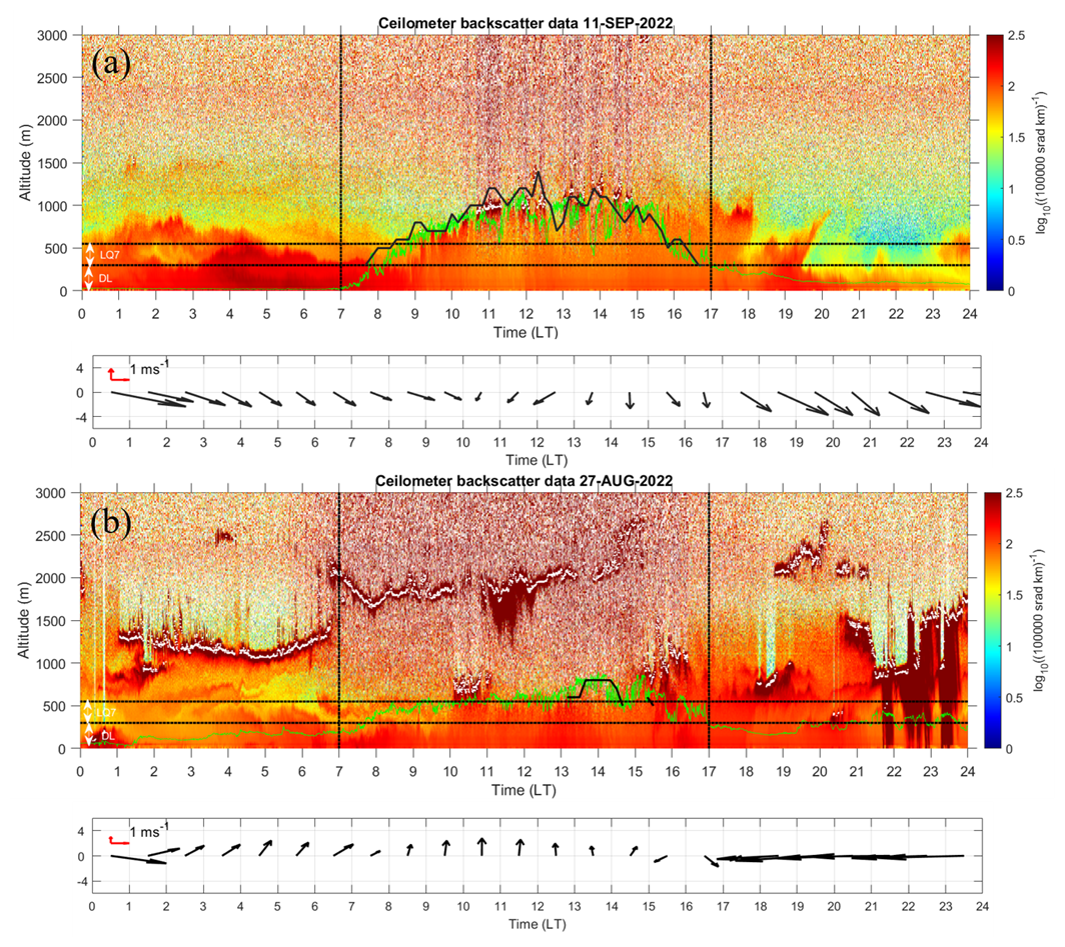
Figure 4Time–height cross-sections of Vaisala ceilometer CL31 (910 nm) backscatter data (in log 10(105 sr km−1)) at a time and range resolution of 15 s and 20 m, respectively, from the ground to a height of 3000 m for 11 September 2022 (a) and 27 August 2022 (b). The black arrows indicate the hourly winds measured by the DL in the 40–300 m height range. The green curve shows the height of the lifting condensation level (LCL), calculated from the surface meteorological data from the automatic weather station (AWS). The cloud base is indicated by white dots. The thick black curve shows the height of the CBL top estimated from the identification of the maximum of the LQ7 echo power. The double-headed arrows and horizontal lines indicate the range used to calculate the TKE dissipation rates from the LQ7 and DL. The vertical solid black lines show the [07:00–17:00] LT time window used for the comparisons between LQ7 and DL.
On 11 September (upper panels), the evolution of the aerosol distribution during the day followed the standard evolution of CBLs with fair weather cumulus clouds developing above the mixed layer. The winds near the surface were dominantly southward during CBL development. The height of the cloud base is consistent with the height of the lifting condensation level (LCL) (green curve) calculated from surface meteorological data collected at the observatory using derivations by Emanuel (1994, pp. 129–130). LCL exceeded a height of 1.0 km in the afternoon. Also superimposed is a radar-derived CBL top height (thick black curve) at a vertical resolution of 100 m. This height is independently defined according to the height at which the LQ7 echo power begins to decrease, as it should correspond to the top of the turbulent entrainment zone of the CBL (e.g., Angevine et al., 1994; Kumar and Jain, 2006). The figure shows that there is a very close correspondence between the daily variations of the radar-derived CBL top height, LCL and the cumulus cloud base (when there is one). The radar-derived CBL top height is generally slightly higher than LCL and cloud base altitudes except during the decaying stage of the CBL after ∼ 14:00 LT, when the CBL top height is slightly lower. This feature is sometimes more pronounced for other days (not shown). In the present study, the radar-derived CBL top height is used as a proxy of the CBL depth D. This estimate of D is not necessarily the one defined in Eq. (3) and may introduce a small uncertainty, but it has the advantage of being obtained from the radar measurement alone.
On 27 August (lower panel of Fig. 4), a much shallower convective structure developed during daytime, probably due to weaker solar heating. The stratiform cloud layer revealed by the fisheye camera photo (Fig. 3) was present from a height of ∼ 2.0 km between ∼ 07:00 and 15:00 LT during northward wind near the surface. The low-pressure synoptic conditions were likely favorable for the formation of convective plumes because of the systematic upward motions prevalent in the low-pressure systems. The lower cumulus clouds in the same image had a base of about 700 m between 10:00 and 11:00 LT, relatively consistent with the LCL estimate. Another cumulus cloud development occurred after 15:00 LT. Associated with easterly winds, precipitation started after ∼ 20:00 LT. Consistent with the ceilometer data, the LQ7 echo power measurements (not shown) do not show a CBL top evolution similar to 11 September. A CBL top was perhaps detected between 13:30 and 15:30 LT due to a late development caused by increasing incoming solar radiation from early afternoon sunshine spells. If we refer to LCL and to altitude of aerosol concentration decrease after ∼ 10:00 LT (lower panel of Fig. 4), LQ7 sampled the upper part of the convective cells at the altitudes of 400–500 m selected for the LQ7 analysis. It is therefore expected that the conditions are a priori not optimal for good agreements between εDL, and .
3.2 Vertical velocity comparisons
The upper panels of Fig. 5a and b show time–height cross-sections of vertical velocities measured by the DL in the [40–300] m height range above the ground level (AGL) and by the LQ7 in the [400–1500] m height range from 07:00 to 17:00 LT for 11 September and 27 August, respectively. For this figure, the time series were smoothed with a 3 min rectangular window for both instruments to reduce the random noise fluctuations and the effect of the horizontal distance between the two instruments (∼ 80 m). The dashed curve in Fig. 5a is the proxy for the CBL top height shown in Fig. 4a.
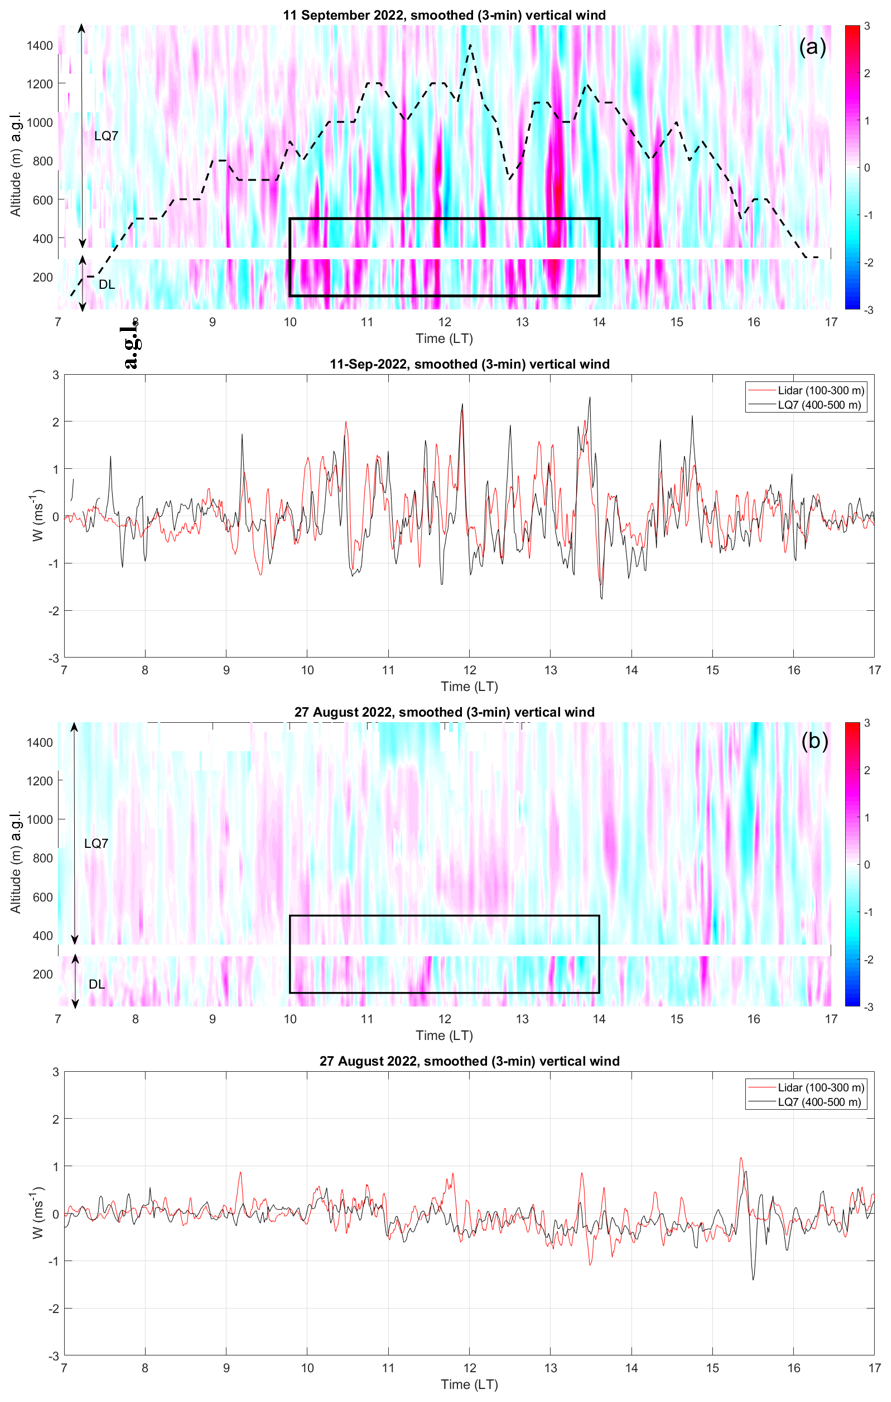
Figure 5(a) (top) Time–height cross-section of smoothed (3 min) values of vertical winds from the LQ7 (400–1500 m) and DL (20–300 m) on 11 September 2022 and from 07:00 to 17:00 LT. The proxy for the CBL top height is given by the dashed line. The black rectangle shows the time–height domain used to estimate W spectra shown in Fig. 6. (bottom) The corresponding time series of W for the DL (red) averaged in the [100–300] m height range and for the LQ7 (black) averaged over two consecutive sampled heights (400 and 500 m). (b) Same as panel (a) but for 27 August 2022.
On 11 September, the vertical velocities measured by the DL and LQ7 show a remarkable height continuity. With a Pearson correlation coefficient of 0.57, the time series of W from the DL and LQ7 averaged over height (bottom panel of Fig. 4a) are very similar. Between 07:00 and 17:00 LT, the mean values of W are 0.07 and −0.01 m s−1 for the DL and LQ7, respectively. The rms values, 0.57 and 0.65 m s−1for the DL and LQ7, respectively, are very close. However, there are some significant differences, e.g., between 09:00 and 10:00 LT. Unfortunately, they cannot be interpreted due to the height offset. As cross-validation of the vertical velocity measurements is not possible, it is not investigated further in this paper, and we assume that the differences are real (i.e., not instrumental). The W fluctuations are significantly enhanced below the CBL (in particular between 10:00 and 14:00 LT, up to 2.2 m s−1 and down to −1.7 m s−1).
On 27 August, the W fluctuations were weaker than those observed on 11 September. Between 07:00 and 17:00 LT, the mean and rms values of W are [−0.05, 0.30] and [−0.09, 0.26] m s−1 for the DL and LQ7, respectively. The correlation coefficient between the time series of W from the DL and LQ7 is 0.50, slightly less than for 11 September. Between 10:00 and 11:00 LT, when convection lead to cumulus cloud formation, the vertical velocities measured by the DL and LQ7 are dominantly positive up to LCL (∼ 700 m). Between 15:00 and 16:00 LT, when cumulus clouds also formed, stronger updrafts and downdrafts exceeding 1 m s−1 were observed at least up to 1500 m, consistent with the very irregular pattern of the cloud base in the ceilometer data (Fig. 4). The largest difference between the rms values of W from the DL and LQ7 is observed between these two events, i.e., between 11:00 and 15:00 LT: 0.34 and 0.18 m s−1, respectively.
It is well known that vertical velocity measurements by wind profiler radars are negatively biased (typically by a few tens of cm s−1) during the day in the CBL (e.g., Angevine, 1997). It is difficult to confirm or rule out this bias with the data described in this paper, as we are limited to daytime measurements only, and DL and LQ7 measurements are not taken in the same altitude range. However, if this bias does exist, it should not affect the spectral analyses, as they are made over durations well below the timescale of the bias identified in the literature.
3.3 εDL and comparisons
Figure 6a shows the wavenumber spectra of W(DL) (red) and W(LQ7) (black) for the data collected on 11 September between 10:00 and 14:00 LT, i.e., when the CBL was the deepest, using the procedures described in Sect. 2. The dashed red line shows the theoretical inertial spectrum ( slope), and the dotted red curve shows the best fit of the DL spectrum with the theoretical Kristensen et al. (1989) 1D line spectrum using μ=1 (see Lothon et al., 2009, for a more detailed description and the definition of the parameter μ). A good fit indicates that the calculated spectrum is consistent with the turbulence spectrum expected for a CBL. Even if the calculated slopes are flatter than , the two spectra are not inconsistent with an inertial subrange as suggested by the dashed blue line. The LQ7 spectrum agrees well with the low-wavenumber part of the DL spectrum in slope, shape and level, suggesting that the same turbulent regime was detected by both instruments. In this case, we therefore expect consistent values of εDL and .
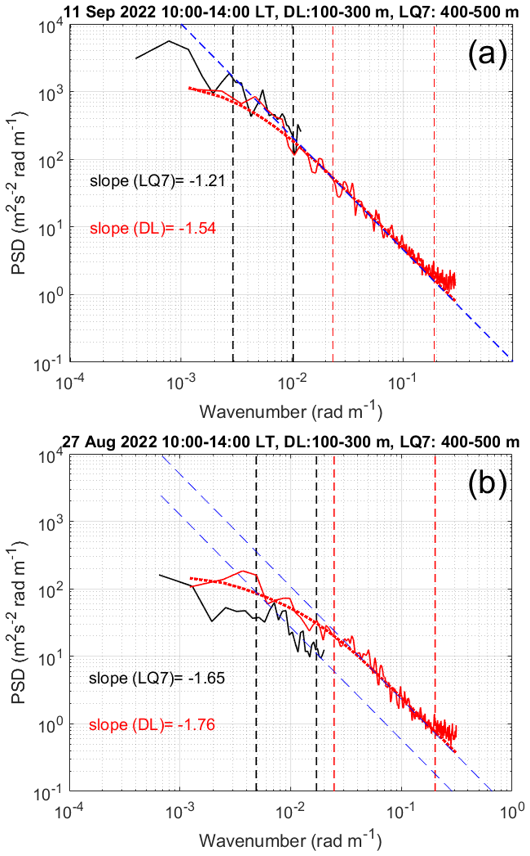
Figure 6(a) Mean wavenumber spectra of W obtained on 11 September 2022 for 10:00–14:00 LT from the DL 4 s time series (red) between heights of 100 and 300 m and LQ7 59 s time series (black) between heights of 400 and 500 m. The dotted red curve shows the best fit of the DL spectrum with the theoretical Kristensen et al. (1989) 1D line spectrum. The frequency-to-wavenumber conversion was made using the mean horizontal wind speed: 2.6 m s−1 between 100 and 300 m and 4.3 m s−1 between 400 and 500 m. The dashed blue line shows the slope for reference. The calculated slopes are for the wavenumber ranges indicated by vertical dashed red and black lines. (b) Same as panel (a) but for 27 August 2022. The frequency-to-wavenumber conversion was made using the mean horizontal wind speed: 2.5 m s−1 between 100 and 300 m and 2.6 m s−1 between 400 and 500 m.
Figure 6b shows the corresponding wavenumber spectra for data collected on 27 August. Note that the two wavenumber ranges of the spectra are closer together than those shown in Fig. 6a as the wind speed was ∼ 2.5 m s−1 in both altitude ranges selected for the DL and LQ7. It can be seen that (1) the two spectral levels are significantly lower than those for 11 September (Fig. 6a) and the deviation from for the DL spectrum occurs at higher wavenumbers ( rad m−1). (2) The LQ7 spectrum shows a level 3 to 4 times lower than the DL spectrum, a lower level consistent with the weaker fluctuations and smaller rms values of W shown in Fig. 5b. Incidentally, the LQ7 spectrum exhibits a peak at rad m−1, a slope at higher wavenumbers and a flat spectrum at lower wavenumbers down to rad m−1. This resembles an inertia gravity wave spectrum for k<km for quiet conditions, as a flat spectrum (i.e., 0 slope) is expected from gravity wave theory (e.g., VanZandt, 1982). However, this interpretation does not seem consistent with the context of convection described in Sect. 3.1, and this hypothesis will not be explored further.
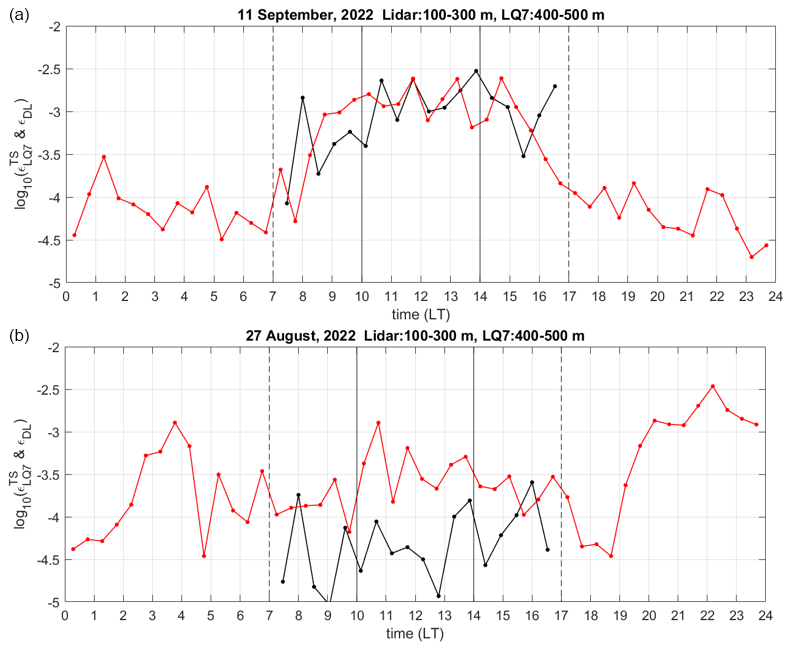
Figure 7Time series of (black) in the [400–500] m height range and log 10(εDL) (red) in the [100–300] m height range on 11 September 2022 (a) and 27 August 2022 (b) at a time resolution of 1 h sampled every 30 min. The vertical solid black lines show the [10:00–14:00] LT time range used to compute the mean spectra shown in Fig. 6. The vertical dashed black lines show the [07:00–17:00] LT time range shown in Fig. 5. before 07:00 LT and after 17:00 LT is not shown as the raw LQ7 data are strongly corrupted by biological targets (birds and/or bats).
Figure 7 shows the time series of log 10(εDL) (red) averaged in the [100–300] m height range and ) (black) averaged in the [400–500] m height range at a time resolution of 1 h every 30 min for 11 September (top panel) and 27 August (bottom panel). As the time resolution of εDL is 30 min every 15 min, the two values for each hour were averaged. before 07:00 LT and after 17:00 LT is not shown as data are corrupted by biological targets or rain echoes. On 27 August, εDL was also corrupted by precipitation after ∼ 20:00 LT.
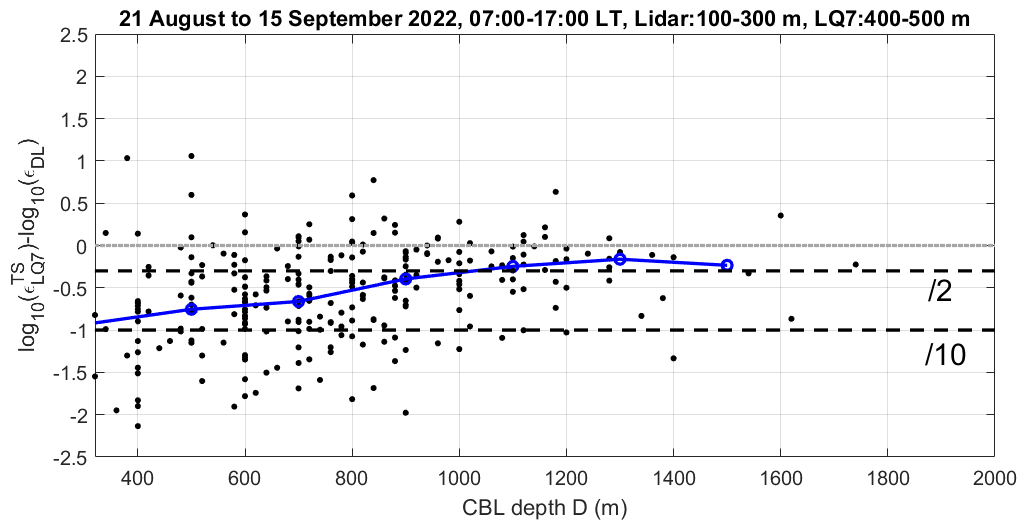
Figure 8Scatter plot of 1 h averaged vs. CBL depth D (m) for 23 d during the period from 21 August to 15 September 2022, excluding periods of precipitation. The blue curve shows the trend obtained by averaging over segments of 200 m.
On 11 September, the increased dissipation rate (typically 10−3 m2 s−3) associated with turbulence in the CBL is clearly visible, and εDL and time series show similar trends and levels. The most significant differences between the two estimates are observed before 08:30 LT and after 15:30 LT, i.e., during the development and decay phases of the CBL, and when the CBL top height was less than 600 m. On 27 August, dissipation rates are significantly weaker than on 11 September (typically ∼ to m2 s−3). In addition, as expected from the spectral levels (Fig. 6b), is weaker than εDL by a factor consistent with to on average. This result may indicate that either the conditions are not met for reliable estimates from the TS method applied to LQ7 data (assuming that εDL is a reference) or that dissipation rates are indeed significantly lower above 400 m altitude, or both. The largest discrepancies are obviously expected when the convection (or CBL) top height is too low (compared with the altitude range used for the LQ7). In order to check this assertion, we made a statistical comparison between (i.e., the differences between the black and red curves in Fig. 7) and the CBL depths. Figure 8 shows the scatter plot of vs. CBL depth D (m) for all the available data between 21 August and 15 September after removing all data corrupted by precipitation echoes. The blue curve shows obtained by averaging over segments of 200 m. is statistically weaker than εDL for all CBL depths. The dispersion is maximum and is minimum (most negative) when D is minimum: it is a generalization of the results obtained for 27 August. In contrast, the dispersion is minimum and is less than a factor of 2 when D>1000 m. Therefore, when the DL and LQ7 sample CBLs deeper than 1000 m, is statistically larger than εDL by no more than a factor of 2 in their respective height ranges (100–300 and 400–500 m).
3.4 εDL and comparisons
Since the comparison of εDL and is the main objective of the present work, initiated by the results of Luce et al. (2018, 2023a, b), we present the results for more CBL case studies. The left panel of Fig. 9a shows time–height cross-sections of log 10(εDL) and using Eq. (2) with L=70 m for 4 consecutive days from 11 to 14 September when the deepest CBLs were observed. The grey translucent rectangles partially hide the values of when they are corrupted by biological targets and rain echoes. The LQ7-derived CBL top heights are represented by the thick black curves. The right panel of Fig. 9a shows the corresponding profiles averaged between 07:00 and 17:00 LT. The horizontal bars indicate the standard deviations for each height sampled by the two instruments. The most striking feature is the high consistency of the and εDL patterns for each day. Between 300 and 400 m, there are virtually no discontinuities in height between the two mean profiles. The largest discrepancy is observed on 12 September but it does not exceed a factor of 2 ( and ). Moreover, this can largely be explained by the very low availability of DL data (∼ 10 %) in the highest DL gates, so the effective time average for εDL, over 1 h rather than 10 h, may not be representative of the whole period. Therefore, our results suggest that the DS method (with L=70 m) applied to a UHF radar can provide estimates of dissipation rates in the CBL that are very consistent with lidar estimates with the TS method. Given (1) the different methods of analysis, (2) the different nature of the data and instruments, (3) the arbitrary nature of the choice of L, and (4) the difference between the height ranges, such a result was hardly expected.
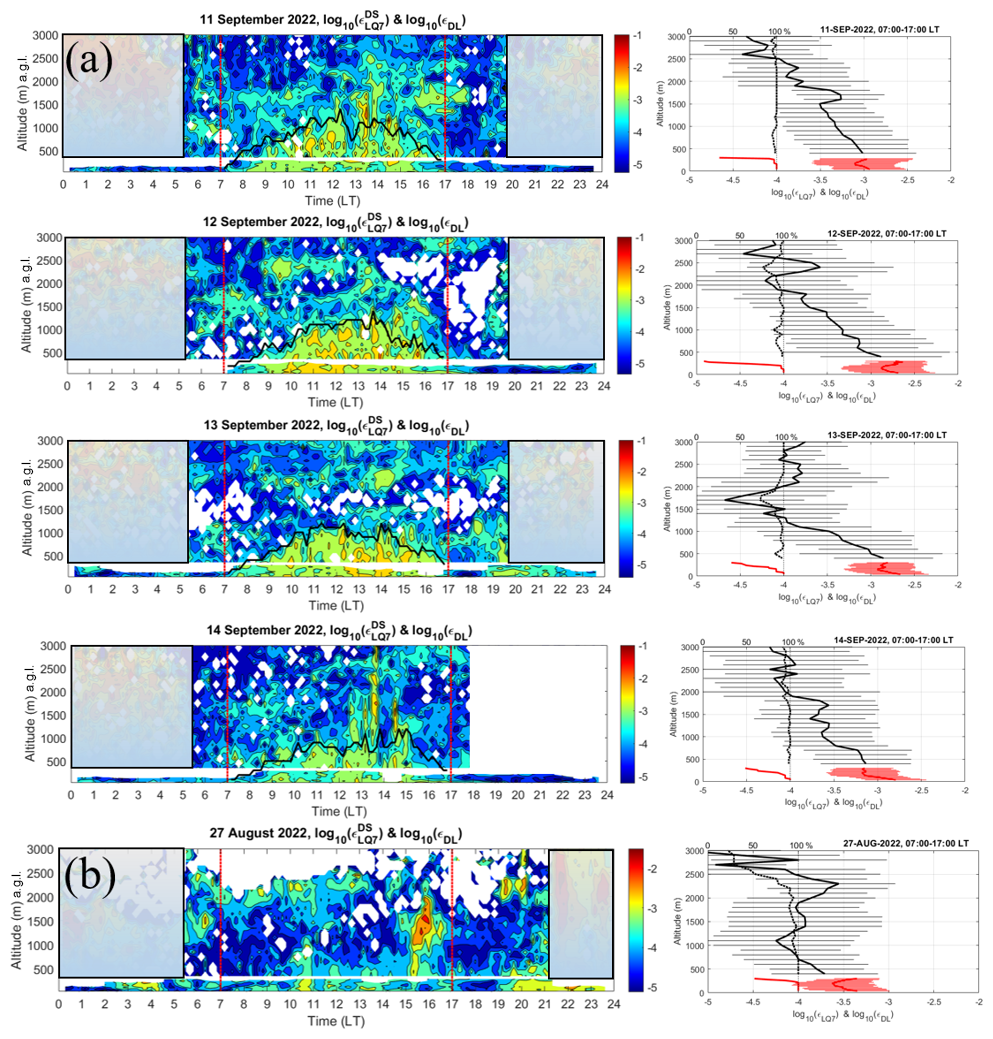
Figure 9(a) (left) Time–height cross-section of estimated from Eq. (2) and log 10(εDL) for 4 successive days from 11 to 14 September 2022 up to a height of 3000 m. The translucent rectangles in cover areas strongly affected by biological targets. The bold solid line shows the CBL top height from the LQ7 echo power data. The two vertical red lines mark 07:00 and 17:00 LT. (right) The corresponding profiles of (black) and log 10(εDL) (red) averaged over 10 h between 07:00 and 17:00 LT. The horizontal lines show the standard deviation. The thick dotted black and red curves show the data availability between 0 % and 100 % for the LQ7 and DL, respectively. (b) Same as panel (a) but for 27 August 2022.
Even more surprising are the results for 27 August 2022 (Fig. 9b). The time–height cross-section of log 10(εDL) and also shows a good continuity in height despite a weaker and more fluctuating pattern. In particular, increased dissipation rates around 10:30 and 15:30 LT, during which cumulus clouds formed, and 12:00 LT, 13:00 LT are detected by both instruments without substantial anomalies in level. The mean profiles of log 10(εDL) and show an almost linear decrease with height up to ∼ 1000 m, except for log 10(εDL) in the [240–300] m height range and this feature may be due to the reduced data availability (the 50 % of εDL values that are missing occur when is minimum). Although the quantitative agreement may be partly coincidental, it is unlikely that the detection of the successive maxima of dissipation rates by the two instruments in their respective height ranges is purely coincidental. In addition, similar agreements are also found for other similar days (not shown). Therefore, the DS method applied to LQ7 data gives much better agreement with the TS method applied to DL data than the TS method applied to LQ7 data for shallow convective layers.
Incidentally, the increased dissipation rates above cloud base up to ∼ 1200 m around 10:30 LT and, even more so, up to ∼ 2000 m around 15:30 LT ( greater than −2) are not the result of outliers and are associated with strongly enhanced spectral widths (not shown), alternating with updrafts and downdrafts (see Fig. 5b).
By averaging over 10 h (07:00–17:00 LT), the dissipation rates in the CBL are mixed with lower values estimated above the CBL, so the mean profiles decrease smoothly with height in the range of the CBL. However, peaks of mean values are also observed above the CBL. They are mainly distributed in layers (e.g., ∼ 1600 m on 11 September, ∼ 2500 m on 12 September). They are not (at least directly) related to CBL dynamics and are probably due to other mechanisms, such as shear instabilities or other convective instabilities associated with clouds.
Figure 10 shows the scatter plot of hourly averaged log 10(εDL) and for all data available from 27 August to 15 September (i.e., 23 d) between 07:00 and 17:00 LT, after excluding data from rain periods. As for the previous figures, the εDL values have been obtained after averaging in the [100–300] m height range. The values have been averaged over height in two ways to highlight the fact that the high correlation between the two estimates is not coincidental: (a) between 400 and 800 m (grey dots), ignoring the time variations in CBL top height, and (b) between 400 and CBL top height (red dots). When the average is limited to the CBL top height, the dispersion is significantly reduced, especially for . This is due to the rejection of values outside the boundary layer when the height of the CBL is less than 800 m. The blue dots show the results using (c): Eq. (3) with L=0.1D, averaged between 400 m and the CBL top height. The scatter plot is very similar to the scatter plot with (b). For both cases (b) and (c), ∼ 80 % of the estimates differ by less than a factor of 2, confirming the conclusions made from the case studies (Fig. 9).
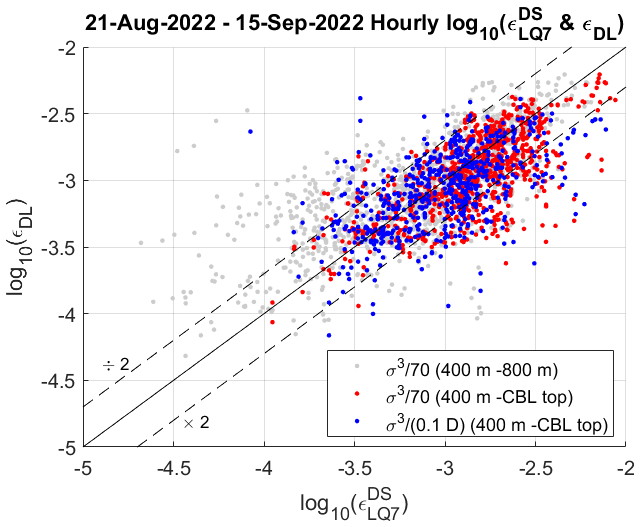
Figure 10Scatter plot of range (100–300 m) and hourly mean log 10(εDL) using the TS method vs. hourly mean averaged between 400 and 800 m with L=70 m (grey dots), between 400 m and the (variable) altitude of the CBL top (red dots) and between 400 m and the (variable) altitude of the CBL top with L=0.1D (blue dots) in the [07:00–17:00] LT time range and for 23 d between 21 August and 15 September 2022, excluding rain periods.
The fact that Eq. (2) with L=70 m and Eq. (3) with L=0.1D lead to the same statistical agreement indicates that they should not differ much. Indeed, as shown by Fig. 11, the distribution of CBL depth D is between 300 and 1200 m, with a mean value of 770 m. Therefore, the mean value of L=0.1D is 77 m, i.e., very close to the value used by default (70 m). We can therefore interpret the value of 70 m for the CBL as a fraction of a typical boundary layer depth, i.e., one-tenth according to our radar definition of D. Since Eq. (3) was established for turbulent layers generated by Kelvin–Helmholtz (shear flow) instabilities (Luce et al., 2023b), supposed to be associated with small Richardson numbers (Ri≪1), it can be concluded that this expression does not depend on the nature of the instabilities and is thus universal as long as we can overlook the effect of the stable stratification, i.e., for Ri≪1 or negative.
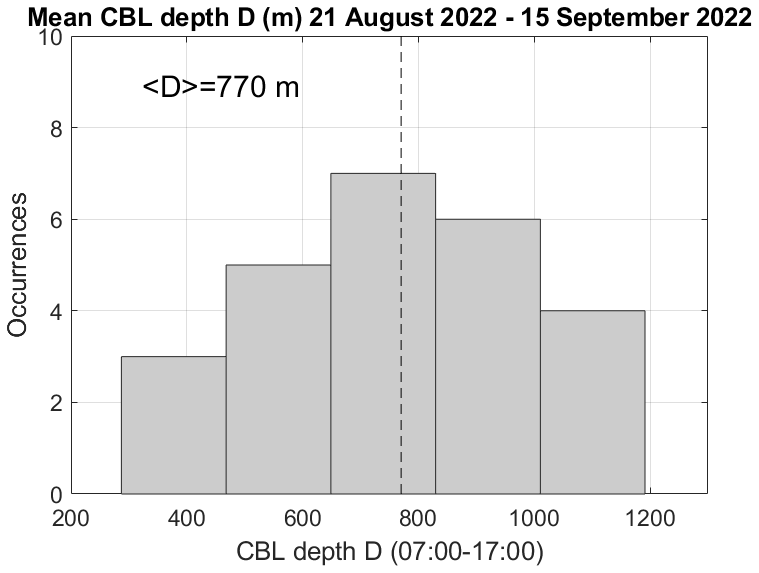
Figure 11Histogram of CBL depth D between 07:00 and 17:00 LT for 23 d between 21 August and 15 September 2022. 〈D〉=770 m is the mean value.
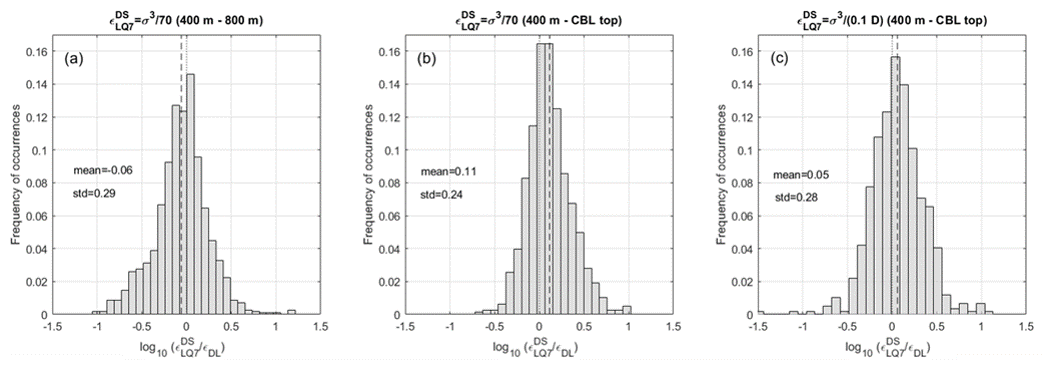
Figure 12Histogram of the difference for (a) averaged between 400 and 800 m, (b) averaged between 400 and the CBL top height and (c) averaged between 400 and the CBL top height.
Figure 12 shows the histograms of for panels (a), (b) and (c). The statistics for each case (mean and standard deviation) are quite similar. However, the histogram for (a) is asymmetric due to the inclusion of low values from above the CBL top height. The histogram for (b) is also slightly asymmetric. The chi-squared test for normality applied to the three histograms indicates that only distribution (c) is log-normal. This property may confirm a dependence of L with D, because a log-normal law is expected when comparing two methods of estimation of the same parameter (or there is an estimation bias).
The mean value of for (c) is 0.05, i.e., the ratio is 1.12 on a linear scale. The mean values of and εDL are thus virtually identical, suggesting that the dissipation rates are nearly uniform in the whole column of the CBL (above the surface layer). However, it is known from theory and observations that TKE dissipation rates slightly decrease with height. Figure 13 shows experimental evidence from measurements obtained by DataHawk UAVs at Shigaraki MU Observatory (Luce et al., 2020) and from a Doppler lidar in the USA (De Szoeke et al., 2021). The two profiles have been normalized using the standard normalization procedures for CBL dynamics (Stull, 1988). The reader may find more information in the aforementioned references. Here, we focus on the fact that ε should decrease by a factor of ∼ 2 at least in the mixed layer. The slightly lower levels of with respect to εDL (a factor of ∼ 2) described in Sect. 3.2 when the CBL is deep are very consistent with this property. Therefore, we cannot exclude that the equivalence between and εDL may be fortuitous and may hide a slight uncertainty in the relationship between L and D. Therefore, from our analyses, we propose
with .
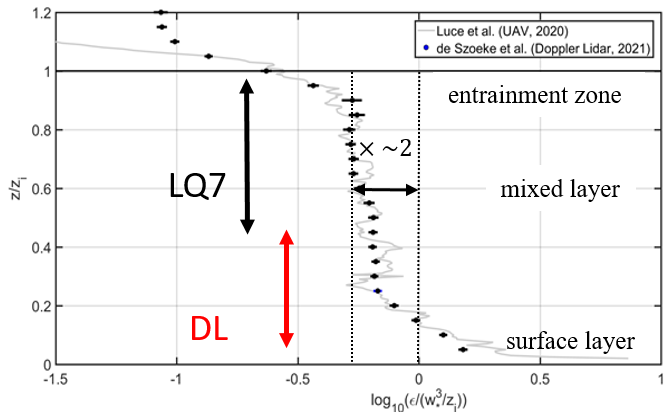
Figure 13Vertical mean profiles of normalized TKE dissipation rates measured by DataHawk UAVs (Luce et al., 2020) and by a Doppler lidar (De Szoeke et al., 2021). The range of observations from the DL and LQ7 are indicative. zi is the CBL depth, noted D in the present paper.
In the present work, we compared the estimates of TKE dissipation rates from a Doppler lidar (DL) and a UHF wind profiler (LQ7). Due to the lack of range overlap, comparisons make sense for well-developed convective boundary layers only, for which we expect some degree of homogeneity with height in the mixed layer. For DL, we used a method based on the calculation of 1D frequency spectra, already tested in the literature. εDL constitutes the reference for the comparisons with dissipation rates estimated from the LQ7, even though it has not been validated by comparisons with independent in situ measurements (such as those carried out by Luce et al. (2018) with the MU radar and instrumented UAVs, for example). However, the assumption that DL and the analysis method give reliable values is a posteriori accepted in view of the agreements obtained with LQ7. For LQ7, we used the method based on frequency spectra (), despite the poor time resolution (59 s instead of 4 s for the DL) and the more commonly used method based on the Doppler spectral width (). In general, the former has to be avoided in the free atmosphere because it is expected to be contaminated by gravity waves even for frequencies higher than N due to Doppler shift effects. As the convective boundary layer is a dynamical and thermodynamic framework that is inefficient for the development and maintenance of gravity waves, they are unlikely to make a significant contribution. For the first time, we tested the method in CBLs during anticyclonic conditions and low-pressure cloudy conditions. We found that gives similar results on some occasions when the CBL is deep and persistent so that the LQ7 frequency spectra can be representative of turbulence in the inertial subrange. When the CBL depth D exceeds 1000 m, hourly estimates of in the [400–500] m height range are statistically consistent with hourly averaged εDL in the [100–300] m height range and smaller by a factor of 2 or less. This small difference may be significant, because dissipation rate is expected to decrease slightly with height in the mixed layer. This result was useful for the interpretation of the results obtained with the spectral width method. We first applied the model with a constant L=70 m, in accordance with the results found by Luce et al. (2018, 2023a, b) for shear generated turbulent layers. A good agreement with εDL was found despite the disconcerting simplicity of the model, even for shallow convective layers (D < ∼ 600 m). An even better agreement was obtained with . The relevance of the simple model with L=70 m is due to the fact that the numerical value is close to one-tenth of the typical value of D. A similar observation was made by Luce et al. (2023b) as L ∼ 70 m is also one-tenth of the typical thickness of turbulent layers generated by shear instabilities detectable by the LQ7 in the troposphere. For much deeper CBLs (e.g., 2000 m or more), should be more adapted than . The quantitative agreement between and εDL should conceal a disagreement, since the two estimates are not obtained in the same range, and the dissipation should decrease with height, as shown by the comparisons between and εDL. Therefore, is uncertain, and a coefficient between 0.1 and 0.2 should be considered instead. A clarification of this point should be obtained by comparing dissipation rates in the same altitude range with another Doppler lidar and another wind profiler. More decisive results may be obtained with a Doppler lidar providing spectral width as well.
The spectral width measured at vertical incidence is primarily influenced by beam broadening effects due to the finite radar beam aperture and the horizontal wind. While shear broadening effects also play a role at oblique incidence, they are generally much weaker. Additional broadening effects due to gravity waves can be neglected for two reasons: they do not contribute within the CBL, and their impact is negligible for acquisition times of 1 min or less (e.g., Naström and Eaton, 1997; Hocking et al., 2016). The procedure used to compute the turbulent contribution to the spectral width is as follows.
The measured spectral half width (i.e., σm) is first converted to half power . The turbulent contribution, σ, used in Eqs. (2) and (3), is then calculated using the following formula:
where (Uθ0)2 is the beam broadening correction, θ0=2.1° is the two-way half power half width of the radar beam and U is the wind speed. In practice, U is the mean wind speed estimated every 10 min by the LQ7.
The quantity σ2 is expected to be an unbiased estimate of the variance of the vertical velocity w due to turbulence if all the scales of turbulence contribute to σ2. The finite radar volume (noted 2a=2θ0z and 2b=Δr, the range resolution in the radial and transverse directions, e.g., Hocking et al., 2016) and the limited acquisition time (temporal resolution) ΔT can play the role of spatial filters if the outer scales of turbulence Lout are much larger than 2a, 2b and UΔT. For such a case, and ε is proportional to , where LR depends on 2a, 2b and UΔT (e.g., White et al., 1999). This expression was found to underestimate ε from statistical comparisons between MU radar and UAV data (Luce et al., 2018), indicating that Lout≪2a, 2b and UΔT. In the present case, 2b=100 m, m for m and m for m s−1 and ΔT=59 s. Therefore, ΔT likely plays an important role in the validity of Eqs. (2) and (3).
The WPR LQ7 data are available at http://www.rish.kyoto-u.ac.jp/radar-group/blr/shigaraki/data/ (RISH, 2025a), https://www2.rish.kyoto-u.ac.jp/mu/ceilometer/ (RISH, 2025b), https://www2.rish.kyoto-u.ac.jp/radar-group/surface/shigaraki/camera/ (RISH, 2025c), and http://database.rish.kyoto-u.ac.jp/index-e.html (RISH, 2025d).
HL and MY acquired and processed the data and wrote the paper.
The contact author has declared that neither of the authors has any competing interests.
Publisher's note: Copernicus Publications remains neutral with regard to jurisdictional claims made in the text, published maps, institutional affiliations, or any other geographical representation in this paper. While Copernicus Publications makes every effort to include appropriate place names, the final responsibility lies with the authors.
We warmly thank the reviewers for the evaluation of the paper. A particular thank you to reviewer 2 for the time they dedicated to it. Their valuable input has significantly contributed to the quality of the paper.
This research has been partially supported by JSPS KAKENHI (grants nos. 19H04238, 20K21844, 22H03732 and 24H00291).
This paper was edited by Laura Bianco and reviewed by two anonymous referees.
Albrecht, B., Fang, M., and Ghate, V.: Exploring stratocumulus cloud-top entrainment processes and parameterizations by using Doppler cloud radar observations, J. Atmos. Sci., 73, 729–742, https://doi.org/10.1175/JAS-D-15-0147.1, 2015.
Angevine, W. M.: Errors in mean vertical velocities measured by boundary layer wind profilers, J. Atmos. Sci., 14, 565–569, https://doi.org/10.1175/1520-0426(1997)014<0565:EIMVVM>2.0.CO;2, 1997.
Angevine, W. M., White, A. B., and Avery, S. K.: Boundary-layer depth and entrainment zone characterization with a boundary-layer profiler, Bound.-Lay. Meteorol., 68, 375–385, https://doi.org/10.1007/BF00706797, 1994.
Banakh, V. A. and Smalikho, I. N.: Lidar Studies of wind turbulence in the stable atmospheric boundary layer, Remote Sens., 10, 1219, https://doi.org/10.3390/rs11182115, 2018.
Banakh, V. A., Smalikho, I. N., Falits, V. A., and Sherstobitov, A. M.: Estimating the Parameters of Wind Turbulence from Spectra of Radial Velocity Measured by a Pulsed Doppler Lidar, Remote Sens., 13, 2071, https://doi.org/10.3390/rs13112071, 2021.
Banakh, V. A., Smalikho, I. N., Köpp, F., and Werner, C.: Measurements of turbulent kinetic energy dissipation rate with a CW Doppler lidar in the atmospheric boundary layer, J. Atmos. Ocean. Tech., 16, 1044–1061, https://doi.org/10.1175/1520-0426(1999)016<1044:MOTEDR>2.0.CO;2, 1999.
De Szoeke, S. P., Marke, T., and Brewer, W. A.: Diurnal ocean surface warming drives convective turbulence and clouds in the atmosphere, Geophys. Res. Lett., 48, e2020GL091299, https://doi.org/10.1029/2020GL091299, 2021.
Doviak, R. J. and Zrnic', D. S.: Doppler radar and weather observations, Academic Press, San Diego, ISBN 0122214226, 1993.
Emanuel, K. A.: Atmospheric convection, Oxford University Press, 580 pp., ISBN 9780195066302, 1994.
Hocking, W. K., Röttger, J., Palmer, R. D., Sato, T., and Chilson P. B.: Atmospheric radar, Cambridge University Press, ISBN 1107147468, 2016.
Imai, K., Nakagawa, T., and Hashiguchi, H.: Development of tropospheric wind profiler radar with Luneberg lens antenna (WPR LQ-7), Electric Wire & Cable, Energy, 64, 38–42, 2007.
Kantha, L., Lawrence, D., Luce, H., Hashiguchi, H., Tsuda, T., Wilson, R., Mixa, T., and Yabuki, M.: Shigaraki UAV-Radar Experiment (ShUREX 2015): An overview of the campaign with some preliminary results, Prog. Earth Planet. Sci., 4, 19, https://doi.org/10.1186/s40645-017-0133-x, 2017.
Kristensen, L., Lenschow, D. H., Kirkegaard, P., and Courtney, M.: The spectral velocity tensor for homogeneous boundary layer turbulence, Bound-Lay. Meteorol., 47, 149–193, https://doi.org/10.1007/978-94-009-0975-5_10, 1989.
Kumar, K. K. and Jain, J. R.: L band wind profiler observations of convective boundary layer over Gadanki, India (13.5° N, 79.2° E), Radio Sci., 41, RS2004, https://doi.org/10.1029/2005RS003259, 2006.
Lawrence, D. A. and Balsley, B. B.: High-Resolution Atmospheric Sensing of Multiple Atmospheric Variables Using the DataHawk Small Airborne Measurement System, J. Atmos. Ocean. Tech., 30, 2352–2366, https://doi.org/10.1175/JTECH-D-12-00089.1, 2013.
Lenschow, D. H. and Stankov, B. B.: Length scales in the convective boundary layer, J. Atmos. Sci., 43, 1198–1209, https://doi.org/10.1175/1520-0469(1986)043<1198:LSITCB>2.0.CO;2, 1986.
Lothon, M., Lenschow, D. H., and Mayor, S. D.: Doppler lidar measurements of vertical velocity spectra in the convective planetary boundary layer, Bound.-Lay. Meteorol., 132, 205–226, https://doi.org/10.1007/s10546-009-9398-y, 2009.
Luce, H., Kantha, L., Hashiguchi, H., Lawrence, D., and Doddi A.: Turbulence Kinetic Energy Dissipation Rates Estimated from Concurrent UAV and MU Radar Measurements, Earth Planets Sci., 70, 207, https://doi.org/10.1186/s40623-018-0979-1, 2018.
Luce, H., Kantha, L., Hashiguchi, H., Doddi, A., Lawrence, D., and Yabuki, M.: On the relationship between the TKE dissipation rate and the temperature structure function parameter in the convective boundary layer, J. Atmos. Sci., 77, 2311–2346, https://doi.org/10.1175/JAS-D-19-0274.1, 2020.
Luce, H., Kantha, L., Hashiguchi, H., Lawrence, D., Doddi, A., Mixa, T., and Yabuki, M.: Turbulence kinetic energy dissipation rate: assessment of radar models from comparisons between 1.3 GHz wind profiler radar (WPR) and DataHawk UAV measurements, Atmos. Meas. Tech., 16, 3561–3580, https://doi.org/10.5194/amt-16-3561-2023, 2023a.
Luce, H., Kantha, L., and Hashiguchi, H.: Statistical assessment of a Doppler radar model of TKE dissipation rate for low Richardson numbers, Atmos. Meas. Tech., 16, 5091–5101, https://doi.org/10.5194/amt-16-5091-2023, 2023b.
Naström, G. G. and Eaton, F. D.: Turbulence eddy dissipation rates from radar observations at 5–20 km at White Sands Missile Range, New Mexico, J. Geophys. Res.-Atmos., 102, 19495–19505, https://doi.org/10.1029/97JD01262, 1997.
O'Connor, J. E., Illingworth, A. J., Brooks, I. M., Westbrook, C. D., Hogan, R. J., Davies, F., and Brooks, B. J.: A method for estimating the turbulent kinetic energy dissipation rate from a vertically pointing Doppler lidar, and independent evaluation from balloon-borne in situ measurements, J. Atmos. Ocean. Tech., 27, 1652–1664, https://doi.org/10.1175/2010JTECHA1455.1, 2010.
RISH: Boundary Layer Radar (BLR)/Lower Troposphere Radar (LTR)/LQ7 Observation Data, Version 02.0212, Research Institute for Sustainable Humanosphere of Kyoto University [data set], http://www.rish.kyoto-u.ac.jp/radar-group/blr/shigaraki/data/ (last access: 7 March 2025), 2025a.
RISH: Ceilometer data, Research Institute for Sustainable Humanosphere of Kyoto University [data set], https://www2.rish.kyoto-u.ac.jp/mu/ceilometer/ (last access: 7 March 2025), 2025b.
RISH: All Sky Camera images, Research Institute for Sustainable Humanosphere of Kyoto University [data set], https://www2.rish.kyoto-u.ac.jp/radar-group/surface/shigaraki/camera/ (last access: 7 March 2025), 2025c.
RISH: The Japan Meteorological Agency's (JMA) Grid Point Values (GPV) generated from the Meso Scale Model (MSM), Research Institute for Sustainable Humanosphere of Kyoto University [data set], http://database.rish.kyoto-u.ac.jp/index-e.html (last access: 7 March 2025), 2025d.
Sanchez Gomez, M., Lundquist, J. K., Klein, P. M., and Bell, T. M.: Turbulence dissipation rate estimated from lidar observations during the LAPSE-RATE field campaign, Earth Syst. Sci. Data, 13, 3539–3549, https://doi.org/10.5194/essd-13-3539-2021, 2021.
Stull, R. B.: An Introduction to Boundary Layer Meteorology, Kluwer Academic, 666 pp., ISBN 9027727686, 1988.
VanZandt, T. E.: A universal spectrum of buoyancy waves in the atmosphere, Geophys. Res. Lett., 9, 575–578, https://doi.org/10.1029/GL009i005p00575, 1982.
White, A. B., Lataitis, R. J., and Lawrence, R. S.: Space and time filtering of remotely sensed velocity turbulence, J. Atmos. Sci., 16, 1967–1972, https://doi.org/10.1175/1520-0426(1999)016<1967:SATFOR>2.0.CO;2, 1999.
Wilczek, M., Xu, H., and Narita, Y.: A note on Taylor's hypothesis under large-scale flow variation, Nonlin. Processes Geophys., 21, 645–649, https://doi.org/10.5194/npg-21-645-2014, 2014.
steradian symbol “sr” is denoted as “srad” in the figures.