the Creative Commons Attribution 4.0 License.
the Creative Commons Attribution 4.0 License.
 | 12 Mar 2025
Implementation and application of an improved phase spectrum determination scheme for Fourier transform spectrometry
Frank Hase
Paolo Castracane
Angelika Dehn
Omaira Elena García
David W. T. Griffith
Lukas Heizmann
Nicholas B. Jones
Tomi Karppinen
Rigel Kivi
Martine de Mazière
Justus Notholt
Mahesh Kumar Sha
Correct determination of the phase spectrum is a highly relevant task in Fourier transform spectrometry for concluding which spectral distribution most likely gave rise to the measured interferogram. We present implementation of an improved scheme for phase determination in the operational Collaborative Carbon Column Observing Network (COCCON) processor. We introduce a robust unwrapping scheme for retrieving a spectrally smooth phase spectrum at intermediate spectral resolution, which uses all spectral positions carrying enough signal to allow a significant determination of the phase. In the second step, we perform a least-squares fit of model parameters of a suitable analytical phase spectrum model through all reliable phase values constructed in the first step. The model fit exploits the fact that we expect the phase to be spectrally smooth. Still, it can be refined to reflect specific characteristics inherent to the optical and electronic layout of the interferometer. The proposed approach avoids the problems of the classical phase reconstruction method, which enforces a spectrally smooth phase by directly limiting spectral resolution when calculating the complex phase. Thereby, the phase is created from a very low number of interferogram points around the centerburst of the interferogram, which results in a suboptimal noise propagation from the interferogram into the spectral domain. Moreover, the interpolation of the phase spectrum across spectral subsections with reduced spectral signal is not well behaved, and results depend strongly on the numerical apodization function used for creating the low-resolution phase.
- Article
(1444 KB) - Full-text XML
-
Supplement
(41038 KB) - BibTeX
- EndNote


Fourier transform spectrometry is an important technique for remote observation of atmospheric composition, especially in the near- and mid-infrared spectral regions, where it is mostly referred to as Fourier transform infrared (shortened to FTIR) spectrometry. Ground-based networks contribute to the long-term monitoring of chemical composition, such as the Network for the Detection of Atmospheric Composition Change (NDACC) network (De Mazière et al., 2018), the Total Carbon Column Observing Network (TCCON) (Wunch et al., 2011), and the COllaborative Carbon Column Observing Network (COCCON) (Frey et al., 2019; Sha et al., 2020; Alberti et al., 2022), which focus on the provision of precise and accurate observations of column-averaged greenhouse and other climate and air quality relevant gas abundances. The first high-resolution Fourier transform spectrometer (FTS) in space was the Atmospheric Trace Molecule Spectroscopy (ATMOS) experiment on the Space Shuttle (Farmer, 1987). Moreover, highly successful spaceborne sensors such as Michelson Interferometer for Passive Atmospheric Sounding (MIPAS) on board the Environmental Satellite (ENVISAT) (Fischer et al., 2008), Atmospheric Chemistry Experiment – Fourier transform spectrometer (ACE-FTS) on board SCISAT (Bernath et al., 2005), and the Thermal And Near infrared Sensor for carbon Observation – Fourier transform spectrometer (TANSO-FTS) on board Greenhouse gases Observing SATellite (GOSAT) (Yokota et al., 2009) and its successors have proven the usefulness of FTIR spectrometry for atmospheric observations. Recently, the airborne imaging FTIR sensor Gimballed Limb Observer for Radiance Imaging of the Atmosphere (GLORIA) for chemical and thermal limb imaging has been realized (Friedl-Vallon et al., 2014), and the imaging FTIR satellite mission Changing Atmosphere Infrared Tomography (CAIRT) derived from GLORIA is under phase A study by ESA (https://www.cairt.eu/, last access: 25 February 2025).
All FTIR spectrometers have in common that they use a two-beam interferometer for creating modulated intensity levels as a function of the path difference between the two arms of the interferometer. The path difference is varied as a function of time, and during such a scan, the variable intensity is recorded by a detector element. By use of a co-recorded reference modulation generated from a reference laser fed through the same interferometer, the variable intensity level recorded by the infrared detector as a function of time can be sampled as a function of optical path difference x. It can be shown that the Fourier transform of the AC-coupled interferogram is associated with the spectral distribution of the incident radiation. If the interferogram I(x) were symmetric around a common zero path difference (ZPD) of the interferometer for any wavenumber ν, the spectral radiance as a function of wavenumber S(ν) would be connected with the interferogram via a simple cosine transform:
We only claim proportionality here for any selected wavenumber position because, from the practical viewpoint, the determination of radiances in absolute units requires proper calibration measurements using reference sources providing a known radiance level. This is a very laborious task, and it is difficult to achieve sub-percent accuracy in the realization of absolute units. In the case of emission spectrometry, this task needs to be solved, while atmospheric absorption spectrometry generally omits this procedure. In the case of absorption spectrometry, the quantitative trace gas analysis is built on the local contrast between absorption lines and adjacent continuum (assuming that the spectrometer offers sufficient spectral resolution for resolving individual lines). Then, by assuming that the spectrally variable sensitivity of the spectrometer, created by optical, detector, and electronic characteristics, is spectrally smooth, no attempt is made for achieving ordinate calibration. A section of the measured spectrum used for the trace gas analysis is then treated as a transmission spectrum, and an empirical fit of continuum background is included in the analysis scheme. We do not further follow the problem of ordinate calibration here, because it is not related to our aim of an improved phase reconstruction, which, however, can be used for both absorption and emission spectrometry.
In Eq. (1), we have extended the integration over all optical path differences. In practice, only a limited section up to a maximum optical path difference (MPD) is accessible. The truncation of the interferogram is equivalent to a multiplication with a boxcar function. In the spectral domain, this becomes a convolution with a sinc function. The spectral response inherent to an FTIR spectrometer is called instrumental line shape (ILS). It can be adjusted by applying a numerical weighting function along the interferogram (the process of apodization). In particular, numerical apodization allows the sidelobes of the sinc function to be dampened, which allows – at the cost of widening the ILS width – the ringing surrounding unresolved spectral lines to be suppressed. A proper description of the instrumental line shape (ILS) is further complicated due to the presence of practical imperfections of the interferometer as misalignment of optical components or mechanical imprecision of the scanning mechanism (Hase et al., 1999).
In order to provide a proper idea of the practical method of FTIR spectroscopy here, we further need to mention that the data recording and processing is digital. An analogue-to-digital (ADC) converter is used to generate a digitized signal from the detector signal. While sample-and-hold ADCs triggered by the laser sampling were used in the past, many manufacturers of FTIR spectrometers today use widely available audio ADCs, which offer high digitization depth (e.g., 24 bit) and add a final interpolation step from the raw sampling equidistant in the time domain into a sampling record equidistant in space (Brault, 1996). In any case, the signal to be processed is discretely sampled, and in practice fast computational schemes for doing discrete Fourier transforms are applied. Due to the discrete sampling process, integrals as shown in Eq. (1) become sums, and the bandwidth of the recorded signal needs to be properly limited in order to avoid aliasing.
A final aspect, which is closely connected to the considerations developed hereinafter, is the origin of the phase spectrum. Due to residual optical asymmetry of the beamsplitter unit (especially due to a potential mismatch of the substrate carrying the beam-splitting layer system and the compensation plate) and possibly between the arms of the interferometer and due to frequency dependent electronic delays, the resulting interferogram tends to be asymmetric, and a global ZPD position common to all wavenumbers does not exist. The electronic delays introduce a shift between both the laser reference and the signal, as well as frequency-dependent delays in the infrared signal. This requires treatment of the Fourier transform of the real-valued interferogram as a complex quantity (so arising out of cosine and sine contributions) and thereby gives birth to the concept of the phase spectrum. In complex notation, we can state
The uncalibrated signal s(ν) now is a complex quantity. It can be separated into amplitude and phase φ(ν). The phase spectrum φ(ν) describes how the phase angle of the harmonic oscillations which make up the interferogram evolves as a function of wavenumber. From the instrumental viewpoint, we expect the phase spectrum to be spectrally smooth, as the impacting factors (optical dispersion and electronic delays) typically vary slowly as a function of frequency.
The smoothness of the phase spectrum in near- and mid-infrared FTIR spectrometry is verified empirically on scales of several to tens or even hundreds of wavenumbers (cm−1). Given this, the simple approach of interpreting the absolute value of the resulting complex spectrum as the measured spectral signal is clearly suboptimal in the presence of noise in the interferogram. The assumption of uncorrelated white noise typically is adequate for interferogram samples. This noise maps into white noise in the complex spectrum. A contribution of 1/f noise might increase the noise amplitude towards low frequencies, and at very low frequencies, source noise might become dominant. Therefore, working at higher scan speeds is generally preferred.
The assumption of a spectrally smooth phase allows separation of the complex spectrum into two orthogonal components: the component along the direction in the complex plane we expect the spectral signal to be oriented and the component orthogonal to this direction. So, by exploiting the concept of a spectrally smooth phase, the noise mapped into the orthogonal component can be avoided; only the noise along the signal component is unavoidable. Moreover, this approach avoids the spectral noise floor becoming a positive bias in opaque spectral subsections, as would occur when simply using the absolute value of the complex spectrum.
In order to make the scheme of a smooth phase a working concept, not only do we rely on the assumption that it actually is spectrally smooth, but we also need a practical approach for constructing a smooth phase spectrum with a noise level significantly below the noise level of the complex spectrum. In practice, we achieve this using only a short section of the interferogram around ZPD. Thereby, the smooth phase spectrum is set by the following equation:
Here, the dimensionless multiplier ε denotes that only a fraction of the complete interferogram recorded up to MPD is used. The function A(x) denotes a strong numerical apodization function, as any non-local ringing extending out from a spectral position with high signal level would disturb the phase in the surrounding spectral region. The spectral signal s(ν) generally is spectrally structured, so reducing the interferogram to the narrow range of to convolves the spectral signal with the Fourier transform of the truncated apodization function Atrunc.
We finally need to mention that interferograms might be recorded “single-sided” or “double-sided”. Often, when an interferometer is designed for achieving higher spectral resolution, the symmetry of the design is abandoned. Instead, the ZPD position is shifted to be near one end of the mechanical scan range, which still needs to be wide enough to reconstruct the phase spectrum via Eq. (3), but the high-resolution details are inferred from the single remaining side of the interferogram which is recorded. Our proposed method can be used in either situation, but it should be noted that in the case of single-sided interferogram recording, the error propagation of a residual phase error is much more critical, as sine contributions do not cancel out (as one side of the interferogram is missing) (Brault, 1996; Brasunas and Cushman, 1997), so a very accurate reconstruction is even more relevant in this case.
The reader finds detailed presentations of all the aspects of FTIR spectroscopy shortly summarized above in textbooks and articles (Herres and Gronholz, 1985; Davis et al., 2001; Griffiths and De Haseth, 2007).
In Sect. 2, we present the types of spectrometers we used to test the proposed phase correction method. Section 3 describes a robust scheme for phase unwrapping and the fitting procedure for retrieving the parameters of the phase model. Section 4 investigates the characteristics of phase spectra for the spectrometers introduced in Sect. 2.
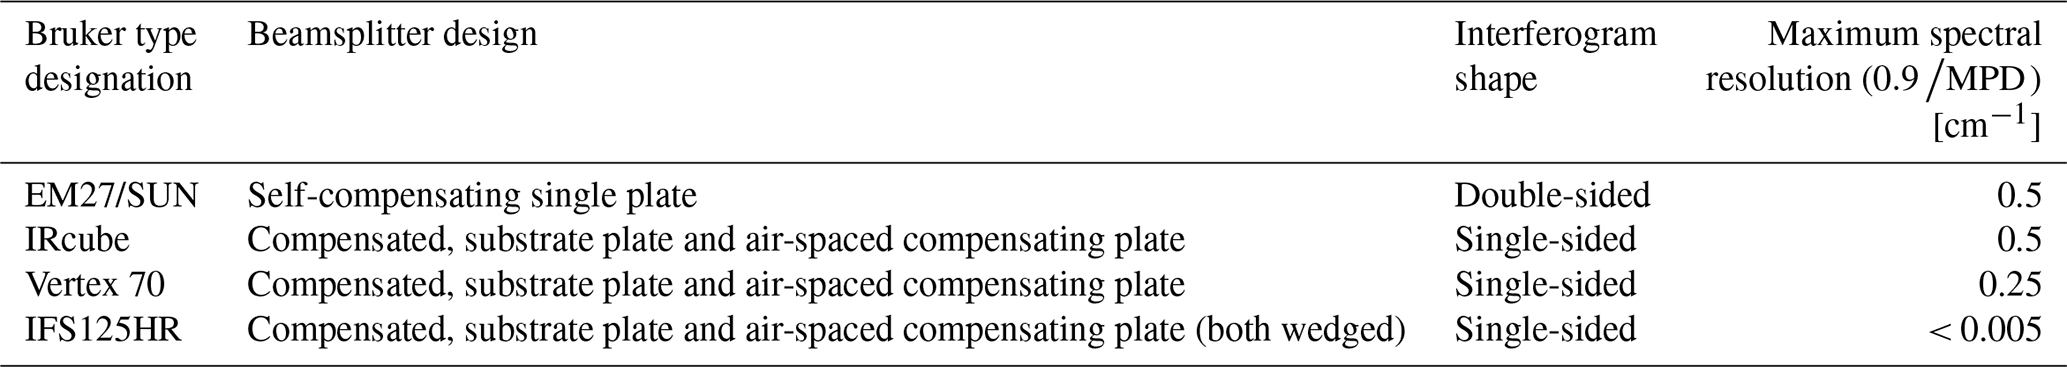
This work has been performed in the framework of the FRM4GHG project (Fiducial Reference Measurements for Greenhouse Gases; https://frm4ghg.aeronomie.be/, last access: 25 February 2025), supported by the European Space Agency (ESA) (Sha et al., 2020). In the framework of this project, among further topics related to fiducial reference measurements (FRMs), the adequacy of different portable spectrometers is investigated. For this purpose, extended measurement campaigns with the portable spectrometers under test are performed at the Sodankylä site operated by the Finnish Meteorological Institute. At this site, regular AirCore measurements are also executed, which provide in situ measurements of greenhouse gas (GHG) profiles. The IFS125HR FTS operated by FMI at the Sodankylä site in the framework of TCCON serves as reference. Further details of the campaign setup are provided by Sha et al. (2020). Interferograms recorded with these portable spectrometers have been used for testing the proposed phase reconstruction algorithm. We briefly present these spectrometers in the following. Table 1 summarizes the main design characteristics of the spectrometers from the viewpoint of the phase spectrum.
The EM27/SUN Fourier transform spectrometer (FTS) prototype has been developed by Karlsruhe Institute of Technology (KIT) in cooperation with Bruker Optics, a well-known manufacturer of FTIR spectrometers. It uses a folded pendulum-corner cube interferometer (“RockSolid”® design) and employs two room temperature InGaAs detectors to cover the near-infrared range from 4000 to 12 000 cm−1. A solar tracker using Camtracker active feedback to control the position of the solar image on the field stop of the spectrometer is directly attached to the spectrometer (Gisi et al., 2011). Further instrumental details of the EM27/SUN FTS design characteristics are provided by Gisi et al. (2012) and Hase et al. (2016). As an operational framework for guaranteeing common instrumental and data analysis standards among the operators, the COCCON has been established since (Frey et al., 2019; Alberti et al., 2022), which is significantly supported by ESA through FRM4GHG and further contracts.
The Bruker IRcube or “MATRIX” FTIR is a compact OEM instrument operating in the mid- or near-IR regions and configurable for a wide range of laboratory and industrial applications using a range of sampling accessories. In its basic form it contains a folded pendulum-corner cube interferometer similar to the EM27/SUN (“RockSolid”® design) with 25 mm beam diameter and either 1 cm−1 double-sided or 0.5 cm−1 single-sided resolution. As used at the University of Wollongong for solar measurements, the interferometer is configured for 0.5 cm−1 single-sided resolution.
The Vertex 70 spectrometer is produced and sold commercially by Bruker Optics. It was recently replaced in Bruker's production line by a successor named Invenio. One Vertex 70 FTS was purchased in the framework of the FRM4GHG campaign to be tested alongside the EM27/SUN and IRcube with the reference IFS125HR and AirCore measurements. The Royal Belgian Institute of Space Aeronomy (BIRA-IASB) and the University of Bremen (UB) performed minor modifications to the optical components of the Vertex 70 and coupled it with a solar tracker to perform solar absorption measurements. The feasibility to accommodate two detectors (InGaAs and InSb) in the spectrometer allows the near- and mid-infrared (NIR and MIR) spectral regions to be covered simultaneously. The measured spectra are analyzed to retrieve column abundances of XCO2, XCH4, XCO, and XH2O in the NIR spectral region and column abundances of methane (CH4), nitrous oxide (N2O), formaldehyde (HCHO), and carbonyl sulfide (OCS) in the MIR spectral region are currently studied (Zhou et al., 2023; Sha et al., 2024).
The Izaña Observatory (IZO) is a high-mountain station located on the island of Tenerife (Canary Islands, Spain) in the subtropical North Atlantic Ocean (28.3° N, 16.5° W) at an altitude of 2.37 km a.s.l. IZO is managed by the Izaña Atmospheric Research Centre (IARC; https://izana.aemet.es/, last access: 5 August 2024), which belongs to the State Meteorological Agency of Spain (AEMet). An IFS125HR spectrometer is operated for TCCON and NDACC (Schneider et al., 2005, 2010; García et al., 2021).
Table 1FTIR spectrometers used for investigating phase spectra characteristics.
The drawback of the classical method described in the Introduction is twofold:
-
The reduction of the phase spectrum to the desired very low resolution is achieved explicitly using a very short section of the interferogram around ZPD for the Fourier transform (Mertz, 1965; Forman et al., 1966). This approach neglects interferogram data points further out, which still could contribute information on the phase.
-
The resulting spectral interpolation as part of the procedure is not well-defined especially across spectral sub-regions of increased opacity, as they occur in solar absorption spectrometry between the atmospheric window regions and in strong absorption bands. Because the phase spectrum across such a region is strongly impacted by the overlapping contributions to the phase emerging from either side of the opaque region, the outcome for the phase at a certain spectral position in the region with reduced transmission will depend on the user-selected resolution for the phase calculation and the chosen apodization function.
We will achieve our enhanced reconstruction of the phase spectrum by fitting a smooth parameterized phase model through a calculated phase spectrum, which preserves higher spectral resolution than required for the desired degree of spectral smoothness. The smoothness of the phase spectrum is ensured by the phase model used, while avoiding the aforementioned problems of the classical method. We use a least-squares fit of the model to the raw phase spectrum, which is a well-defined process with respect to interpolation. A similar method has been proposed by Learner et al. (1995), in the context of emission spectra. The method described in the following consists of two partial steps. First, we need to establish a procedure for constructing a smooth phase spectrum from the complex spectrum. We refer to this step as “phase unwrapping”. The trigonometric functions connecting phase angle and complex spectrum are periodic, and direct use of inverse functions would generate phase jumps. In the second step, we fit the phase values of an analytical phase model to the smooth phase spectrum generated in the first step by adjusting the chosen model parameters.
The phase spectrum is a function of angular orientation, so it is invariant under phase shifts of size ±2πn, with n = 1, 2, 3, … For our fit procedure, we need to ensure that the raw phase used as input does not include jumps between such branches. We suggest the very robust procedure summarized as procedural steps in Table 2.
Table 2Step-by-step procedure for the phase unwrapping algorithm, which develops the raw phase used as input for the model fit.
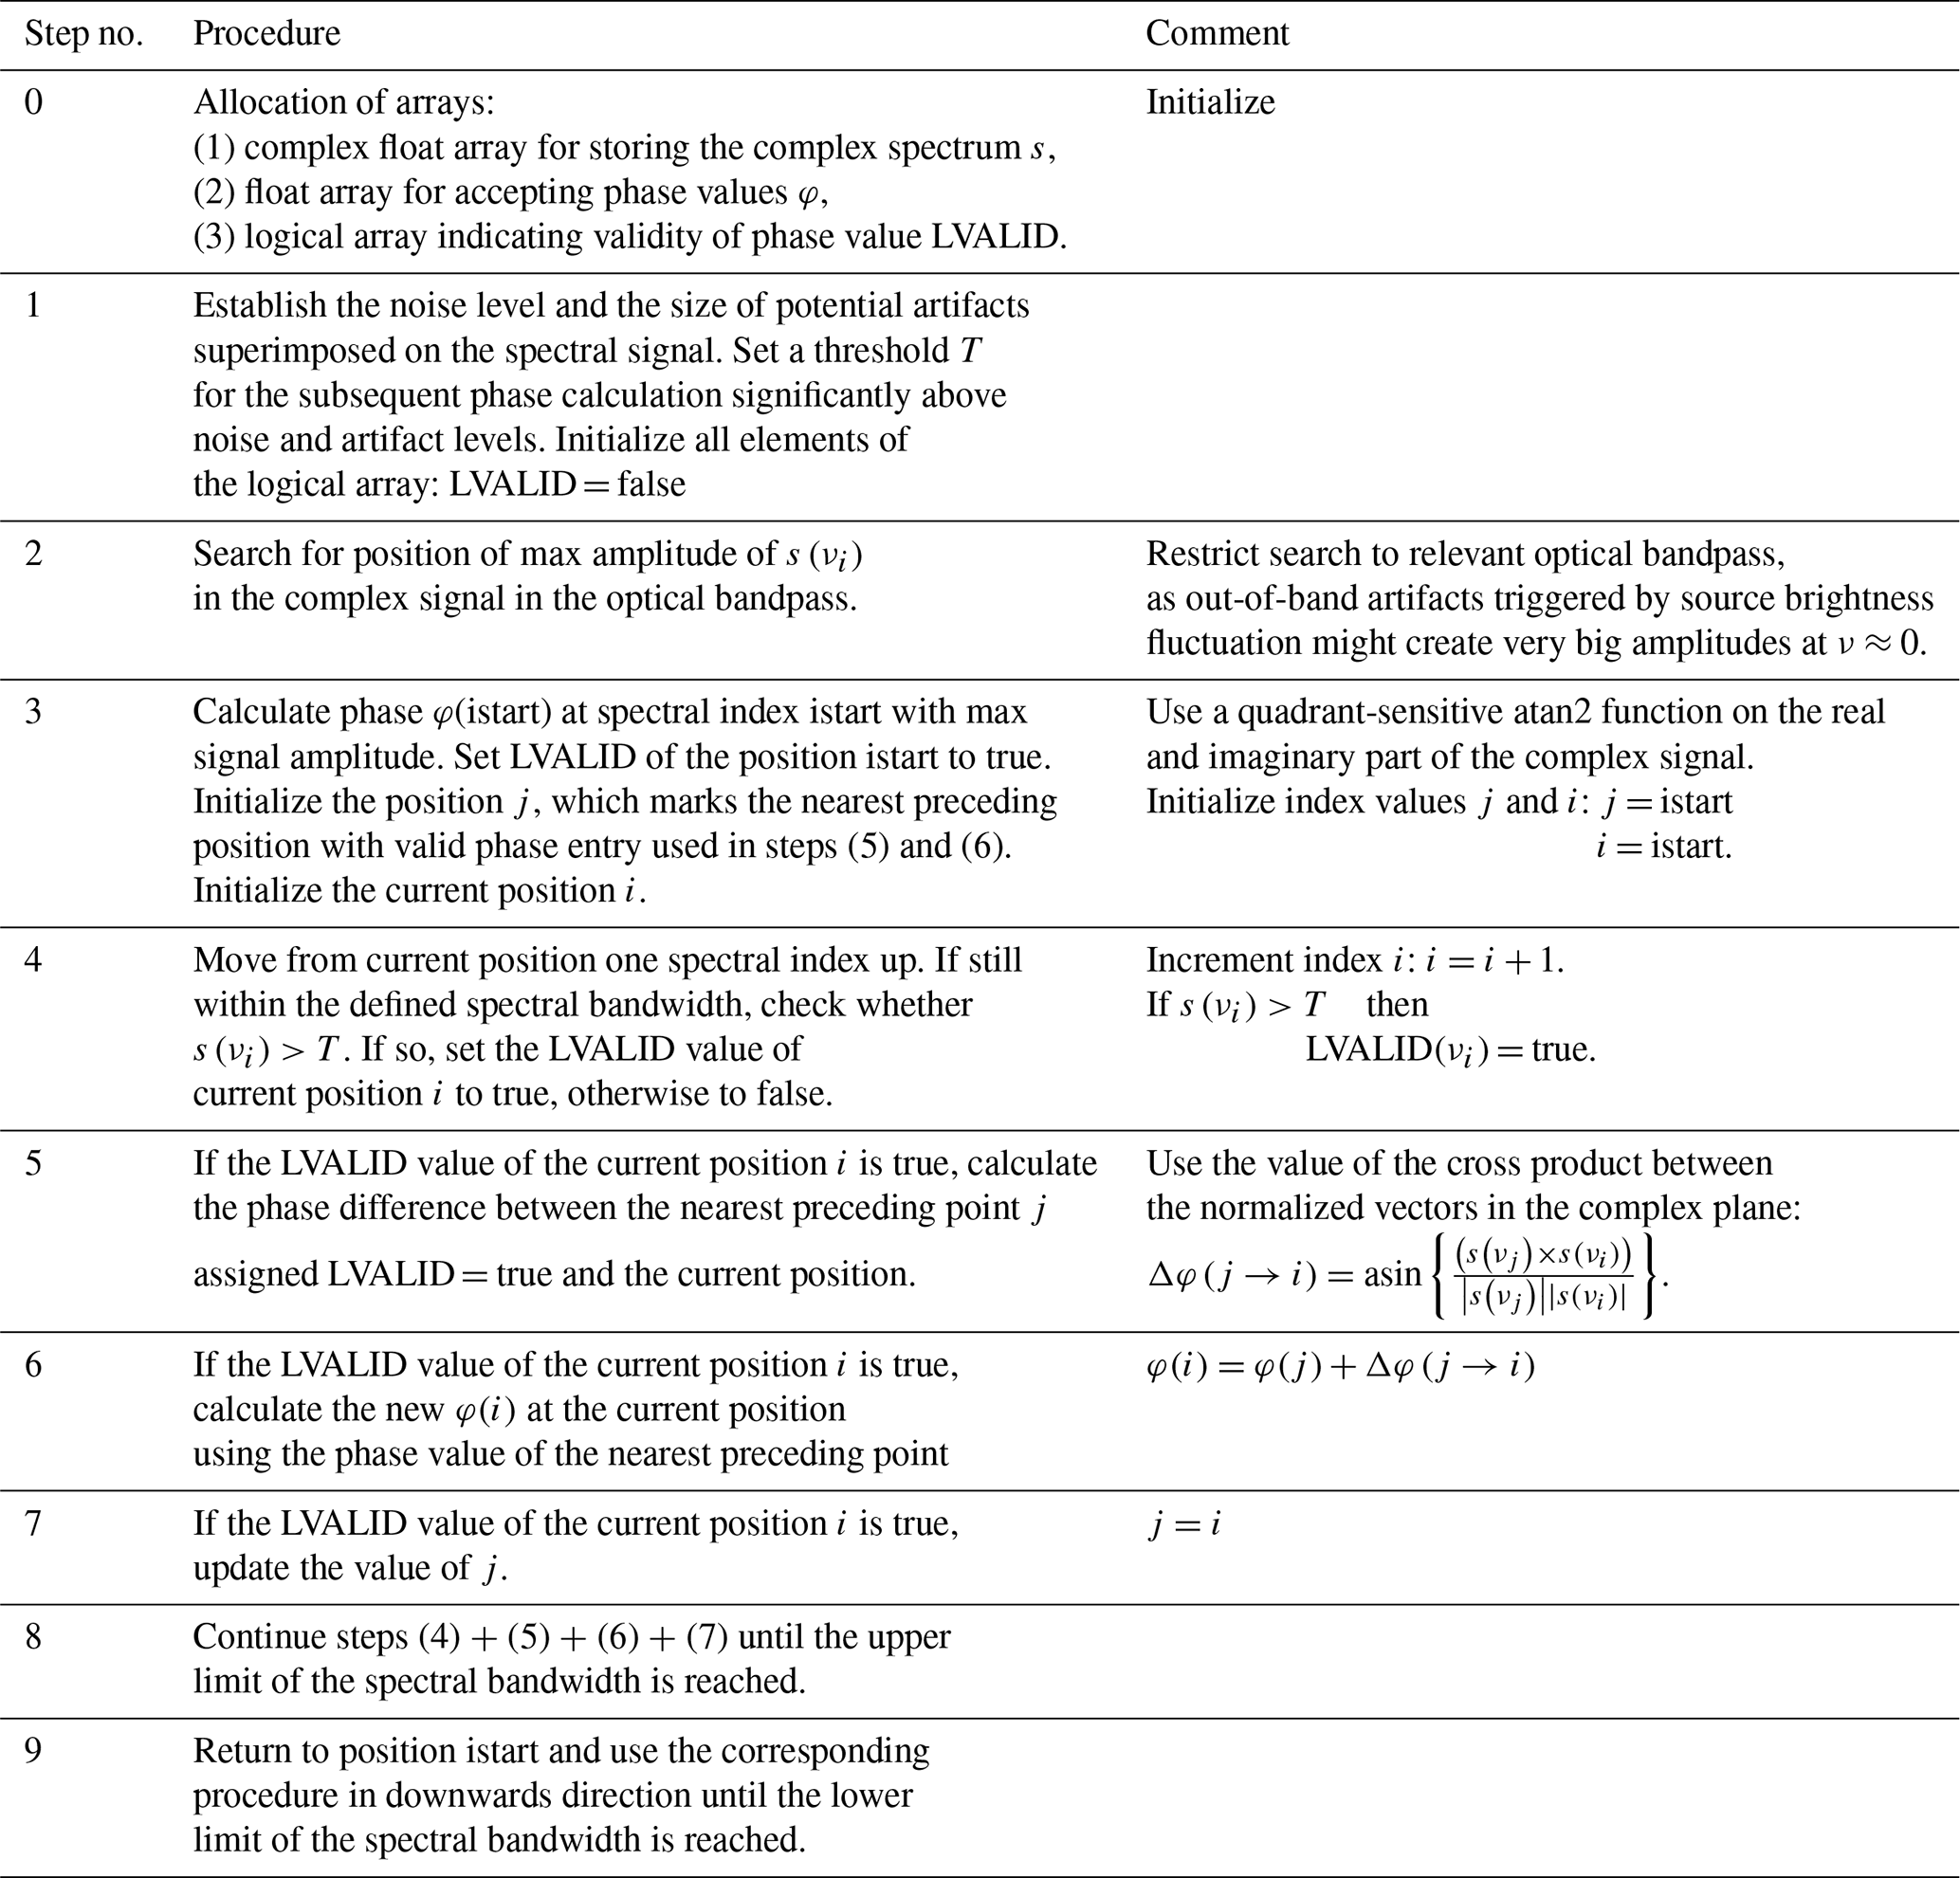
This proposed method can fail if the phase difference calculated in step (5) is greater than ±π. We did not encounter this situation, but it may occur if the phase slope is very steep and can possibly be avoided by appropriate repositioning of the ZPD point when calculating the Fourier transform. For generating a phase point of the raw unwrapped phase, the spectral amplitude is required to exceed the adjustable threshold value T. It should be chosen well above the noise level of the complex spectrum used for the phase determination. Otherwise, the phase difference between adjacent points could occasionally exceed the requirement of phase differences to reside within the ±π range. Moreover, the phase in nearly opaque spectral sections can be dominated by spurious signals (originating from, e.g., nonlinearity, double-passing, or sampling ghosts), so it is desirable to exclude these spectral sections from the calculation of the analytical phase anyway.
The second step is to fit the parameters of the analytical phase model to the raw phase values. We assume here use of a model linear in the model parameters to be fitted. However, nonlinear models also can be handled in our approach by implementing an iterative search for the optimal model parameter values. If a sophisticated model is chosen, which intends to describe actual physical characteristics of the spectrometer (dispersion curves, electronic response characteristics) and retrieves physical quantities (layer thicknesses, capacitances, resistor values), using a model which is nonlinear in the parameters might be unavoidable. When constructing ad hoc models, which simply enforce smoothness, the choice of a simple linear model seems advisable. The fitting procedure needs to be restricted to points for which valid phase values were established in the previous step. The fitting procedure can take into account a weighting according to the squared signal amplitude. We found very little effect of including this refinement in the determination of model parameters, so we did not implement it in the current pre-processing scheme. Taking a weighting into account, the equation for fitting the phase model parameters becomes
Here, is the set of model parameters; K is the Jacobian matrix, which holds the derivatives of the phase model at each spectral grid point with valid raw phase entry; W is a diagonal matrix with entries (again, for each spectral grid point with valid raw phase entry); and is the vector containing all valid raw phases. Note that the vector dimensions of and differ, as after receiving the set of model parameters, can be calculated at all spectral positions, including interpolation across near-opaque spectral sections and extrapolation beyond the first or last spectral point found in the optical bandpass. The predicted model phase values further outside of the relevant spectral bandpass are meaningless and might be suppressed altogether (by allocating the array for to fit the relevant spectral bandpass).
For the actual work on the FTIR spectrometers introduced in Sect. 2, we used a polynomial model of order 7. The raw phase calculation uses 3000 interferogram points on either side of ZPD, equivalent to a resolution of about 10 cm−1, which is supported by all spectrometers we included in the study (sufficient number of points on the short side of the interferogram).
4.1 Phase spectrum of the EM27/SUN FTS
The results achieved for the EM27/SUN are shown in Fig. 1. The spectrometer shows a remarkably linear phase spectrum across the whole spectral region of the main detector (covering 5000 to 12 000 cm−1). The differences between the model fit and the raw phase are below 1 mrad. The level of smoothness and linearity of the phase spectrum is outstanding among all spectrometers tested. This behavior probably is supported by the beamsplitter design. The same optical plate is passed twice by the radiation, acting as substrate of the beam-splitting coating layer in one passage and as compensating plate in the other passage. In addition to this, the analogue electronic chain also seems to introduce only minimal dispersion due to runtime effects. It is not clear why the other spectrometers investigated here, all built by the same manufacturer, show significantly stronger structures in the phase spectrum.

Figure 1EM27/SUN phase spectrum. (a) Raw phase (black) and fitted analytical phase (red). (b) Difference between the model (analytical) and raw phase (raw). The gaps in the raw phase are due to opaque spectral sections.
4.2 Phase spectrum of the IRcube FTS
The phase spectrum of the IRcube is shown in Fig. 2. The spectral bandpass covers the range of 4000 to beyond 12 000 cm−1. The differences between the phase model and the raw phase show more structure than in the case of the EM27/SUN, but still, these oscillatory features are largely within 2 mrad.
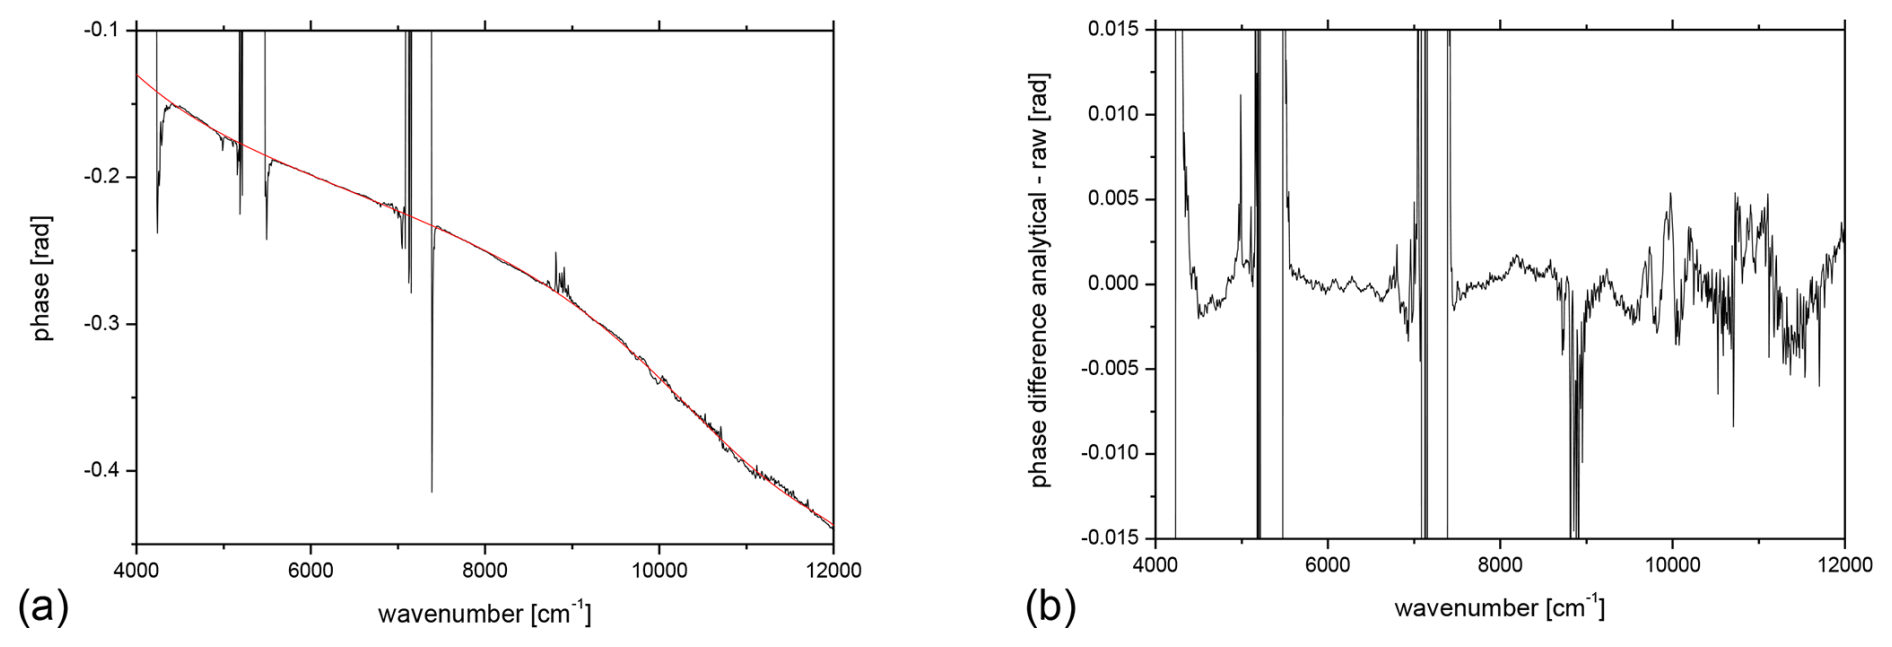
Figure 2IRcube phase spectrum. (a) Raw phase (black) and fitted analytical phase (red). (b) Difference between the model (analytical) and raw phase (raw). The gaps in the raw phase are due to opaque spectral sections.
4.3 Phase spectrum of the IFS125HR FTS operated at Izaña
The phase spectrum of the IFS125HR operated at the Izaña Observatory is shown in Fig. 3. The spectral bandpass covers 4000 to beyond 12 000 cm−1. Due to the fact that Izaña is a high-altitude site and that a low threshold value for the phase calculation was used because of the very low noise level of the measurements, there are no gaps in the raw phase. Some structure can be seen in the model − raw phase difference, but this is still within mostly 2 mrad apart from the highest wavenumbers. The curvature of the phase is somewhat stronger than in the case of the IRcube. The sharp peaks occurring around 5400 and 7200 cm−1 are coinciding with near-opaque regions of the spectrum and might hint at superimposed spurious signals, potentially due to residual nonlinearity. Such spurious signals generally possess a phase orientation different from the real signal. This finding demonstrates that the model-fitting approach presented here might also be useful for detecting different kinds of imperfections in measured spectra.
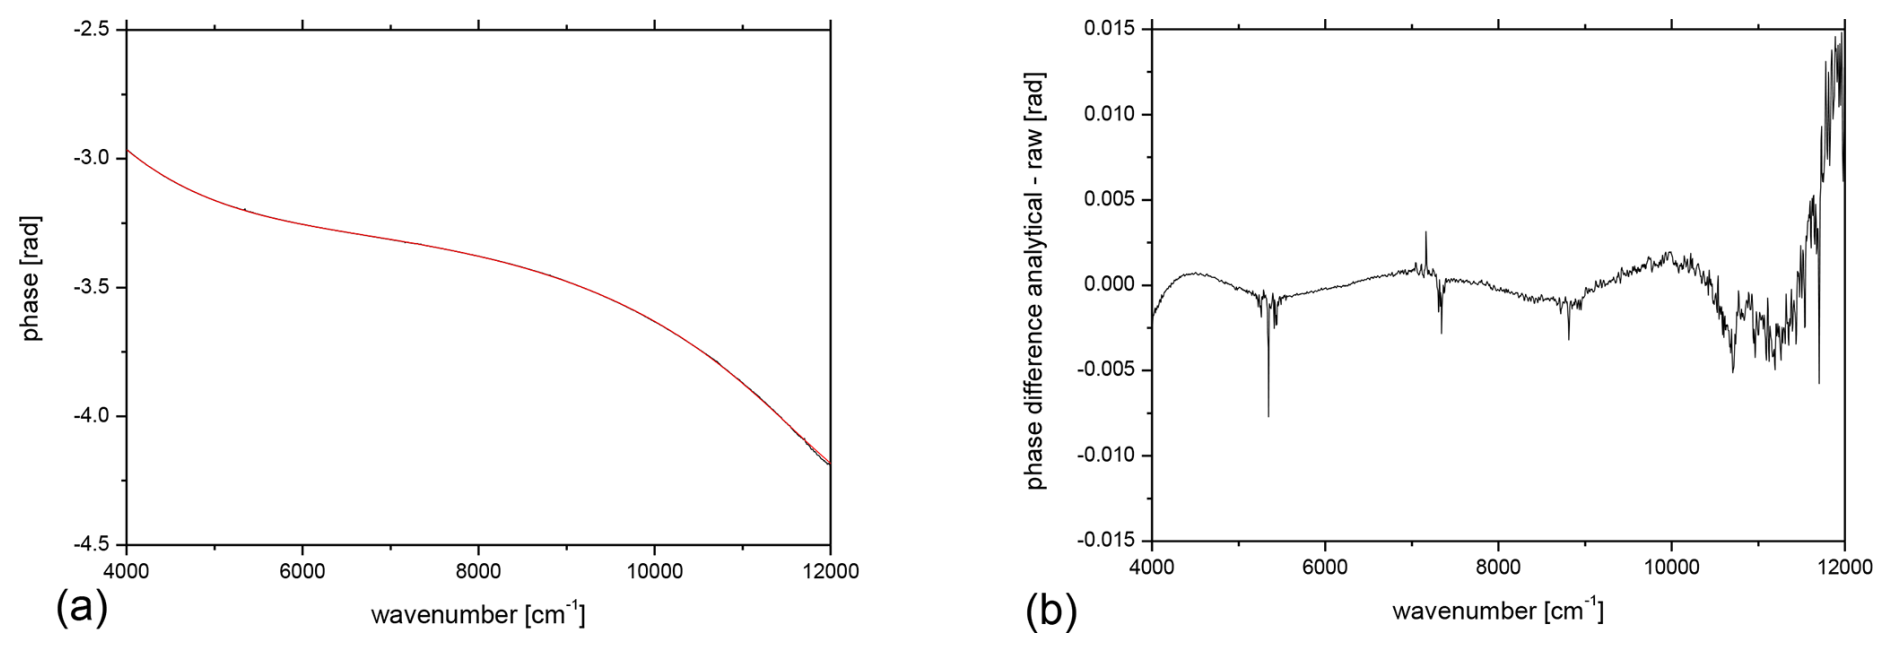
Figure 3IFS125HR phase spectrum. (a) Raw phase (black) and fitted analytical phase (red). (b) Difference between the model (analytical) and raw phase (raw).
4.4 Phase spectrum of the Vertex 70 FTS
Figure 4 shows the phase spectrum of the Vertex 70 FTS. The spectral range covered extends from around 4000 to beyond 12 000 cm−1. It is the most unusual phase spectrum we found, showing pronounced quasi-periodic oscillations of about 600 cm−1 cycle length in the raw phase (see panel b), which cannot be fitted by the polynomial model used. The amplitude of these oscillations amounts to ±5 mrad. A very similar oscillatory structure is present in the successor of this spectrometer offered by Bruker under the model name Invenio (not shown here). We reported back our findings to the manufacturer, but so far no explanation or remedy for the unusual behavior has been found. Again, it turns out that the approach presented here to fit a smooth model phase to the raw phase is useful for discovering such instrumental characteristics which otherwise remain overlooked. If the approach presented here is to be applied in an operational way for Invenio measurements, a specific model extension must be designed that allows the oscillatory features found in the raw phase to be reproduced.
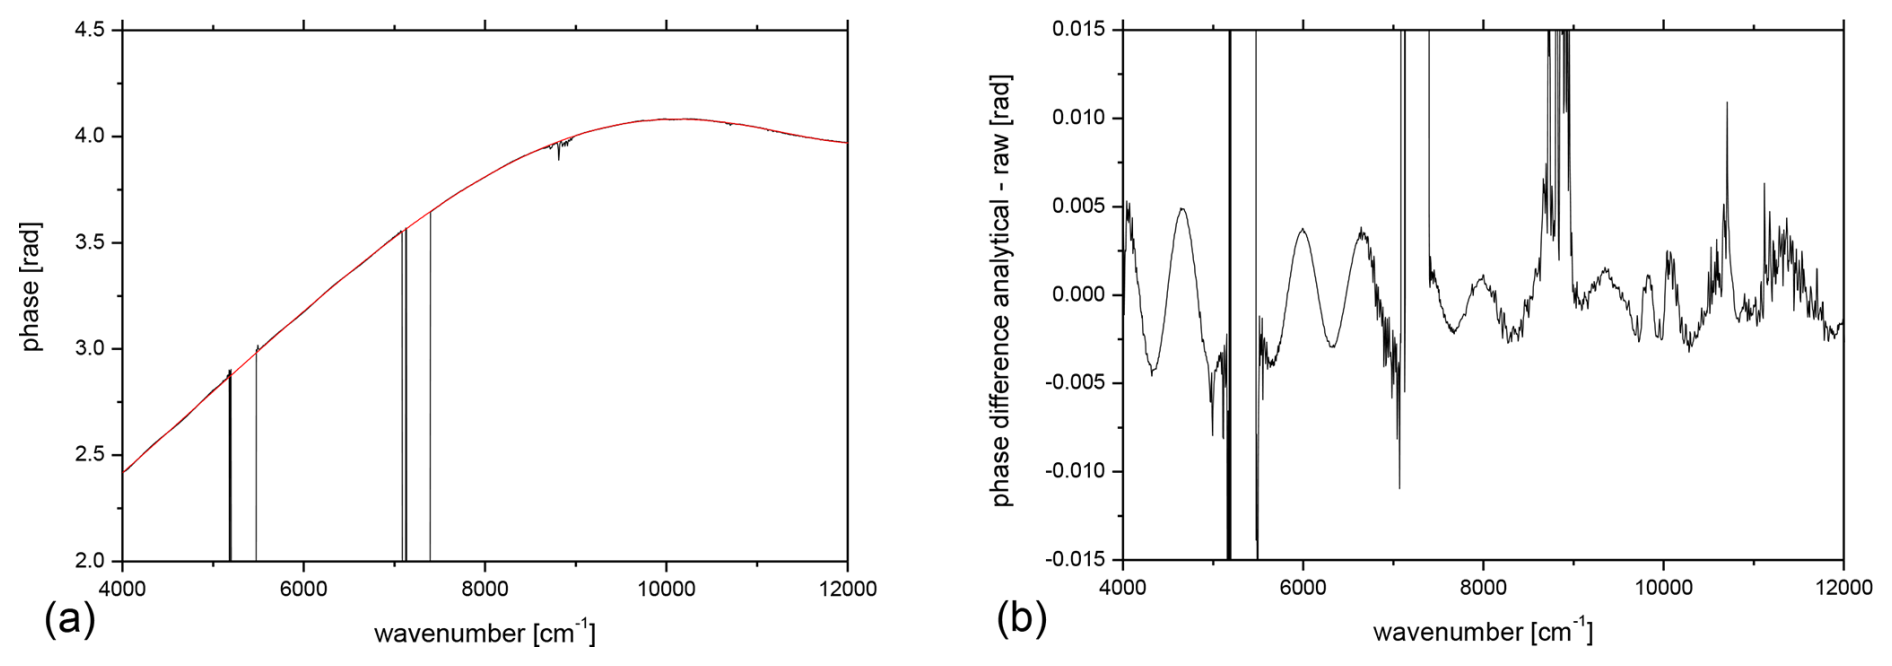
Figure 4Vertex 70 phase spectrum. (a) Raw phase (black) and fitted analytical phase (red). (b) Difference between the model (analytical) and raw phase (raw). The gaps in the raw phase are due to opaque spectral sections.
Figure 5 shows the effect of using either the classical Mertz or the analytical phase when calculating the spectrum from the measured interferogram in a non-opaque spectral region. Here we use the EM27/SUN and the IRcube for illustration, and we investigate the spectral region used for the analysis of CO2 (∼ 6200–6400 cm−1). The EM27/SUN phase spectrum is nearest to a straight line, and the differences between the Mertz and analytical phase are well within 1 mrad in the CO2 region (see Fig. 1). The IRcube phase spectrum has stronger curvature, but the model used for the analytical phase still delivers a good fit. The differences between the Mertz and analytical phase are mostly within 2 mrad in the CO2 region (see Fig. 2).
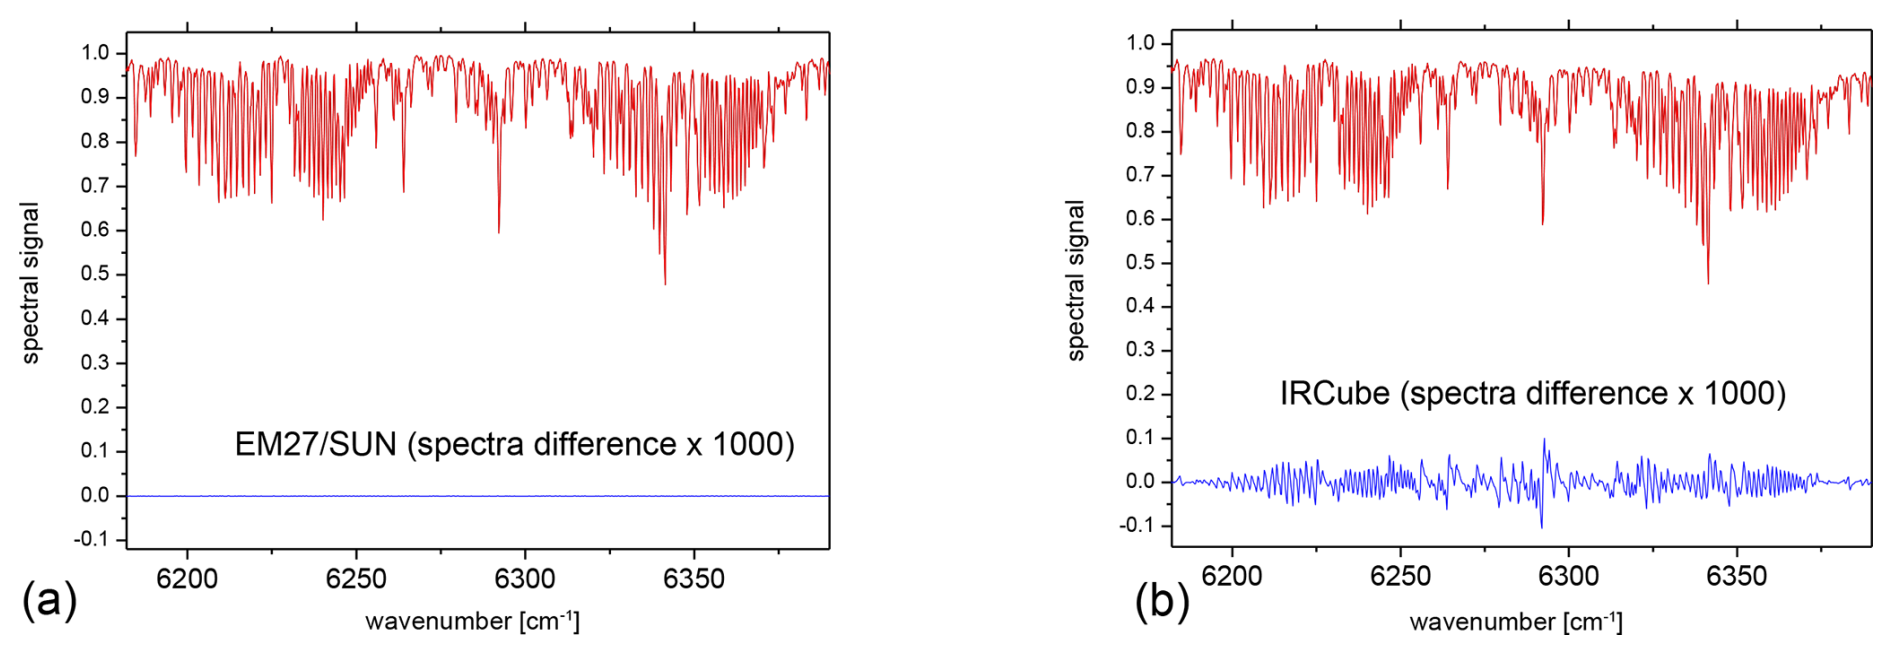
Figure 5Differences of spectra as resulting from the Mertz phase correction scheme and the analytical phase approach. (a) EM27/SUN and (b) IRcube; the spectral residuals are enlarged by a factor of 1000.
According to Fig. 5, the spectral differences of the IRcube spectra are significantly larger than for the EM27/SUN. This is a reminder of the fact that double-sided interferogram recording has an important intrinsic advantage over single-sided interferograms because the propagation of a phase error into the spectrum is much more critical for single-sided interferograms. While sine contributions emerging from ±OPD cancel out in double-sided interferograms, they give rise to point-symmetric residuals around spectral lines in spectra generated from single-sided interferograms. Securing an optimized phase reconstruction is of higher importance for single-sided interferograms (all the spectrometers investigated here apart from the EM27/SUN) than for the EM27/SUN, which essentially is insensitive to phase errors in reasonable limits.
The spectral differences due to using either the analytical phase or the classical Mertz phase found for the IRcube are quite moderate (below the 10−4 level). On the other hand, both the increasing demands to be met for the validation of new spaceborne GHG missions and the desired ability to quantify local sources from differential column measurements make XCO2 measurements with accuracies in the 0.05 ppm range desirable (∼ 10−4). For example, Rißmann et al. (2022) state that the XCO2 gradients across the medium-sized city of Munich typically are well below the 1 ppm level. Let us assume 0.5 ppm as a typical signal amplitude and the uncertainty on the source strength estimate due to imperfect description of transport to reside on the 20 % level. In order to avoid a significant uncertainty contribution from the FTIR observation, we need an accuracy level of 10 % ⋅ 0.5 ppm = 0.05 ppm.
The analysis of the IRcube spectra indicates a relative change of CO2 column of about between the two phase corrections methods, which is not expected to be of any relevance even if the aforementioned very stringent requirement for XCO2 accuracy is used.
However, the inspection of the phase spectra reveals that in near-opaque regions, the differences between the raw (classical Mertz) phase and the analytical phase become significantly larger. The 8730–8850 cm−1 window is a nice study region for this effect. This rather opaque region created by H2O absorption resides isolated between transparent regions covered in the same filter band, and the spectral flux is still sufficient for the determination of raw phase values inside the band. As indicated by Figs. 2 and 4, the IRcube and the Vertex 70 produce significant phase deviations in this spectral region (up to 90 mrad for the Vertex 70 and up to 25 mrad for the IRcube).
Figure 6 shows the relative difference between IRcube XH2O values retrieved either from classical Mertz-phase-corrected spectra or from analytical-phase-corrected spectra. The abscissa shows the air-mass-scaled H2O abundance, which is proportional to the H2O slant column, providing a measure for saturation strength of the observed spectral band. The relative difference of retrieved XH2O for lower degree of saturation of the target species band starts around 0.5 ‰ and reaches 1 ‰ at higher solar zenith angles. This is a relevant result in the context of GHG measurements. The combination of the currently used weak NIR bands with stronger MIR bands for further improving the information content of GHG retrievals is currently under investigation by the networks. The performance of the classical Mertz phase correction is expected to be suboptimal for the stronger MIR GHG bands.
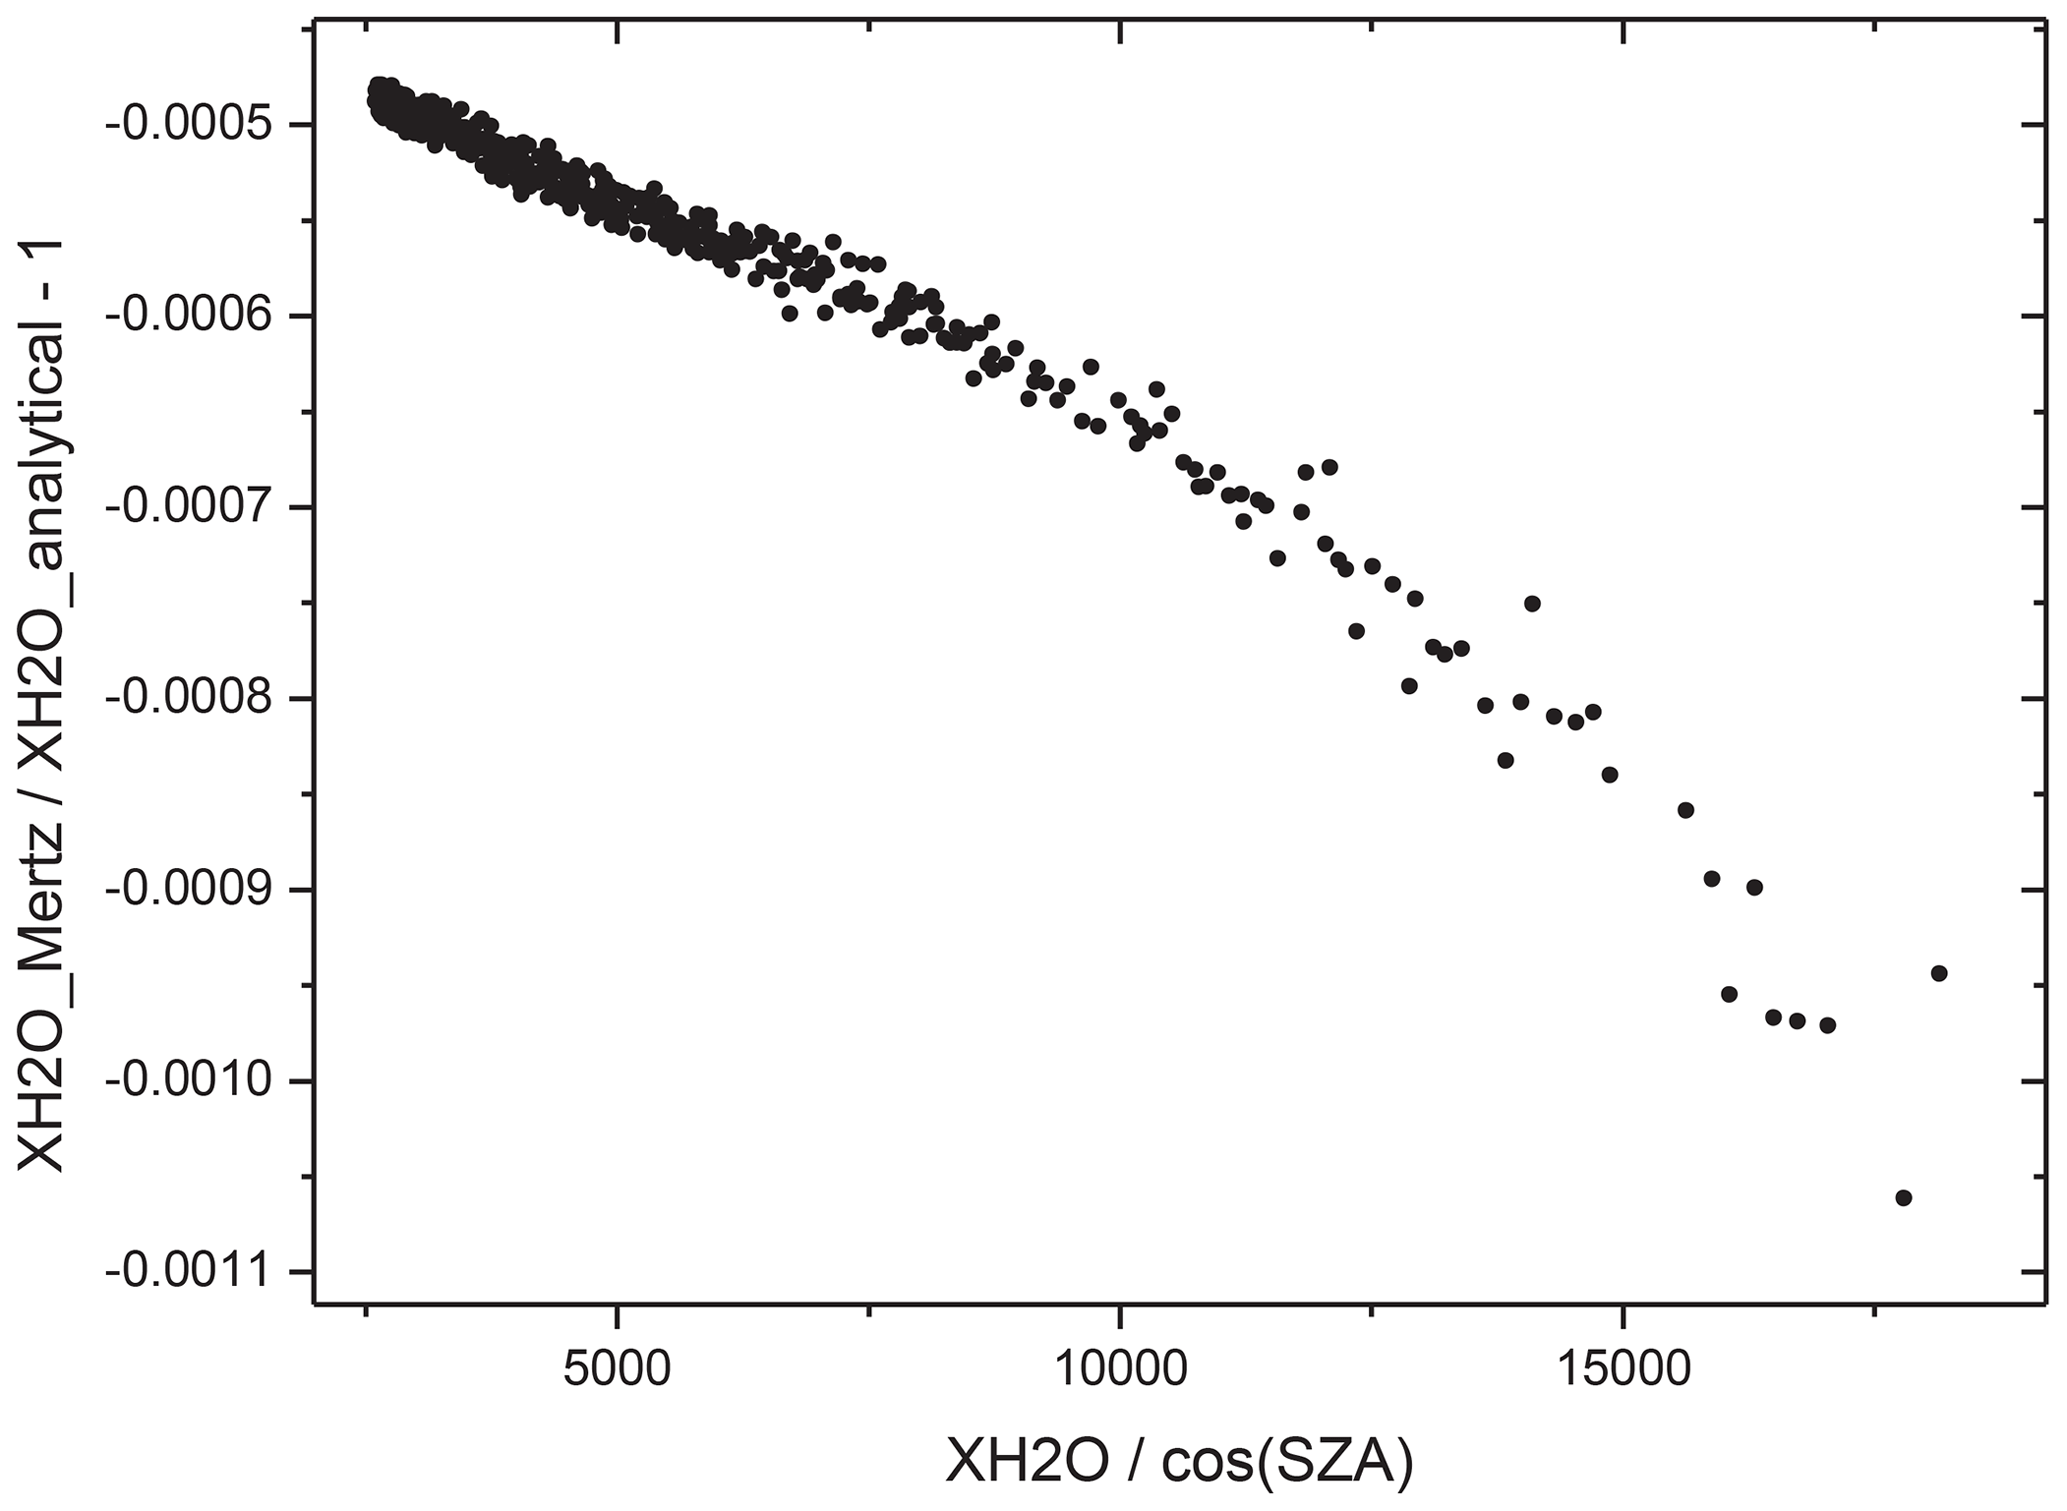
Figure 6Relative difference of retrieved XH2O from the 8730–8850 cm−1 window, which resides in a strong H2O absorption band, using either the classical Mertz phase or the analytical phase for spectra generation. For the abscissa, the product of H2O abundance times air mass is used as a measure for the absorption strength.
In general, there is no guarantee that the analytical phase solution is nearer to the truth than the Mertz phase spectrum. The results always need to be evaluated in context of the specific application. The analytical model might require extensions to include unexpected phase oscillations (as for the Vertex 70). In any case, however, the analytical method is highly useful to carve out unexpected structures in the Mertz phase, which are easily overlooked without performing a comparison to the smooth analytical phase. A careful analysis of such features might help to further improve the design of interferometers and supports recognition of instrumental problems because the non-local spectral artifacts created by various error sources (such as nonlinearity, sampling ghosts, double passing) also create disturbances of the phase spectrum.
We have implemented a refined method for reconstructing the phase spectrum of FTIR spectrometers. We have applied the new method to different types of spectrometers and found pronounced differences in phase imperfections between them. Our findings demonstrate the usefulness of the method proposed for both operational work and instrumental diagnosis, especially for saturated absorption bands. The proposed algorithm has been incorporated into the COCCON pre-processing code, which is available under the GNU General Public License (GPL) version 3.
The COCCON software suite including the preprocessing software PREPROCESS is available under GNU GPL version 3. From version 2.3 onwards, it supports the option of using the analytical phase model implemented in PREPROCESS. Version 2.4 of the COCCON processing suite as used for this work is provided in the Supplement of this article.
The research data used in this work are included in the Supplement of this article.
The supplement related to this article is available online at https://doi.org/10.5194/amt-18-1257-2025-supplement.
FH implemented the new method for phase correction using analytical model fits of the phase spectrum. FH generated the results for the different spectrometers investigated in this work and wrote the predominant part of the manuscript. All authors have studied and commented on the manuscript.
At least one of the (co-)authors is a member of the editorial board of Atmospheric Measurement Techniques. The peer-review process was guided by an independent editor, and the authors also have no other competing interests to declare.
Publisher’s note: Copernicus Publications remains neutral with regard to jurisdictional claims made in the text, published maps, institutional affiliations, or any other geographical representation in this paper. While Copernicus Publications makes every effort to include appropriate place names, the final responsibility lies with the authors.
The establishment of the Izaña TCCON site was supported by grants from NASA's terrestrial carbon cycle program and from the OCO project office.
This research has been supported by the European Space Agency (ESA) (contract no. 400136108/21/I-DT-lr).
The article processing charges for this open-access publication were covered by the Karlsruhe Institute of Technology (KIT).
This paper was edited by Rebecca Washenfelder and reviewed by Geoff Toon and one anonymous referee.
Alberti, C., Hase, F., Frey, M., Dubravica, D., Blumenstock, T., Dehn, A., Castracane, P., Surawicz, G., Harig, R., Baier, B. C., Bès, C., Bi, J., Boesch, H., Butz, A., Cai, Z., Chen, J., Crowell, S. M., Deutscher, N. M., Ene, D., Franklin, J. E., García, O., Griffith, D., Grouiez, B., Grutter, M., Hamdouni, A., Houweling, S., Humpage, N., Jacobs, N., Jeong, S., Joly, L., Jones, N. B., Jouglet, D., Kivi, R., Kleinschek, R., Lopez, M., Medeiros, D. J., Morino, I., Mostafavipak, N., Müller, A., Ohyama, H., Palmer, P. I., Pathakoti, M., Pollard, D. F., Raffalski, U., Ramonet, M., Ramsay, R., Sha, M. K., Shiomi, K., Simpson, W., Stremme, W., Sun, Y., Tanimoto, H., Té, Y., Tsidu, G. M., Velazco, V. A., Vogel, F., Watanabe, M., Wei, C., Wunch, D., Yamasoe, M., Zhang, L., and Orphal, J.: Improved calibration procedures for the EM27/SUN spectrometers of the COllaborative Carbon Column Observing Network (COCCON), Atmos. Meas. Tech., 15, 2433–2463, https://doi.org/10.5194/amt-15-2433-2022, 2022.
Bernath, P. F., McElroy, C. T., Abrams, M. C., Boone, C. D., Butler, M., Camy-Peyret, C., Carleer, M., Clerbaux, C., Coheur, P.-F., Colin, R., DeCola, P., DeMazière, M., Drummond, J. R., Dufour, D., Evans, W. F. J., Fast, H., Fussen, D., Gilbert, K., Jennings, D. E., Llewellyn, E. J., Lowe, R. P., Mahieu, E., McConnell, J. C., McHugh, M., McLeod, S. D., Michaud, R., Midwinter, C., Nassar, R., Nichitiu, F., Nowlan, C., Rinsland, C. P., Rochon, Y. J., Rowlands, N., Semeniuk, K., Simon, P., Skelton, R., Sloan, J. J., Soucy, M.-A., Strong, K., Tremblay, P., Turnbull, D., Walker, K. A., Walkty, I., Wardle, D. A., Wehrle, V., Zander, R., and Zou, J.: Atmospheric Chemistry Experiment (ACE): Missionoverview, Geophys. Res. Lett., 32, L15S01, https://doi.org/10.1029/2005GL022386, 2005.
Brasunas, J. C. and Cushman, G. M.: Uniform Time sampling Fourier Transform Spectroscopy, Appl. Optics, 36, 2206–2210, https://doi.org/10.1364/AO.36.002206, 1997.
Brault, J. W.: New approach to high-precision Fourier transform spectrometer design, Appl. Optics, 35, 2891–2896, https://doi.org/10.1364/AO.35.002891, 1996.
Davis, S. P., Abrams, M. C., and Brault, J. W.: Fourier Transform Spectrometry, Academic Press, San Diego, Hardback ISBN: 9780120425105, eBook ISBN: 9780080506913, 2001.
De Mazière, M., Thompson, A. M., Kurylo, M. J., Wild, J. D., Bernhard, G., Blumenstock, T., Braathen, G. O., Hannigan, J. W., Lambert, J.-C., Leblanc, T., McGee, T. J., Nedoluha, G., Petropavlovskikh, I., Seckmeyer, G., Simon, P. C., Steinbrecht, W., and Strahan, S. E.: The Network for the Detection of Atmospheric Composition Change (NDACC): history, status and perspectives, Atmos. Chem. Phys., 18, 4935–4964, https://doi.org/10.5194/acp-18-4935-2018, 2018.
Farmer, C. B.: High resolution infrared spectroscopy of the sun and the earth's atmosphere from space, Mikrochim. Acta, 93, 189–214, https://doi.org/10.1007/bf01201690, 1987.
Fischer, H., Birk, M., Blom, C., Carli, B., Carlotti, M., von Clarmann, T., Delbouille, L., Dudhia, A., Ehhalt, D., Endemann, M., Flaud, J. M., Gessner, R., Kleinert, A., Koopman, R., Langen, J., López-Puertas, M., Mosner, P., Nett, H., Oelhaf, H., Perron, G., Remedios, J., Ridolfi, M., Stiller, G., and Zander, R.: MIPAS: an instrument for atmospheric and climate research, Atmos. Chem. Phys., 8, 2151–2188, https://doi.org/10.5194/acp-8-2151-2008, 2008.
Forman, M. L., Steel, W. H. & Vanasse, G. A. Correction of asymmetric interferograms obtained in Fourier spectroscopy. J. Opt. Soc. Am. 56, 59–63, 1966.
Frey, M., Sha, M. K., Hase, F., Kiel, M., Blumenstock, T., Harig, R., Surawicz, G., Deutscher, N. M., Shiomi, K., Franklin, J. E., Bösch, H., Chen, J., Grutter, M., Ohyama, H., Sun, Y., Butz, A., Mengistu Tsidu, G., Ene, D., Wunch, D., Cao, Z., Garcia, O., Ramonet, M., Vogel, F., and Orphal, J.: Building the COllaborative Carbon Column Observing Network (COCCON): long-term stability and ensemble performance of the EM27/SUN Fourier transform spectrometer, Atmos. Meas. Tech., 12, 1513–1530, https://doi.org/10.5194/amt-12-1513-2019, 2019.
Friedl-Vallon, F., Gulde, T., Hase, F., Kleinert, A., Kulessa, T., Maucher, G., Neubert, T., Olschewski, F., Piesch, C., Preusse, P., Rongen, H., Sartorius, C., Schneider, H., Schönfeld, A., Tan, V., Bayer, N., Blank, J., Dapp, R., Ebersoldt, A., Fischer, H., Graf, F., Guggenmoser, T., Höpfner, M., Kaufmann, M., Kretschmer, E., Latzko, T., Nordmeyer, H., Oelhaf, H., Orphal, J., Riese, M., Schardt, G., Schillings, J., Sha, M. K., Suminska-Ebersoldt, O., and Ungermann, J.: Instrument concept of the imaging Fourier transform spectrometer GLORIA, Atmos. Meas. Tech., 7, 3565–3577, https://doi.org/10.5194/amt-7-3565-2014, 2014.
García, O. E., Schneider, M., Sepúlveda, E., Hase, F., Blumenstock, T., Cuevas, E., Ramos, R., Gross, J., Barthlott, S., Röhling, A. N., Sanromá, E., González, Y., Gómez-Peláez, Á. J., Navarro-Comas, M., Puentedura, O., Yela, M., Redondas, A., Carreño, V., León-Luis, S. F., Reyes, E., García, R. D., Rivas, P. P., Romero-Campos, P. M., Torres, C., Prats, N., Hernández, M., and López, C.: Twenty years of ground-based NDACC FTIR spectrometry at Izaña Observatory – overview and long-term comparison to other techniques, Atmos. Chem. Phys., 21, 15519–15554, https://doi.org/10.5194/acp-21-15519-2021, 2021.
Gisi, M., Hase, F., Dohe, S., and Blumenstock, T.: Camtracker: a new camera controlled high precision solar tracker system for FTIR-spectrometers, Atmos. Meas. Tech., 4, 47–54, https://doi.org/10.5194/amt-4-47-2011, 2011.
Gisi, M., Hase, F., Dohe, S., Blumenstock, T., Simon, A., and Keens, A.: XCO2-measurements with a tabletop FTS using solar absorption spectroscopy, Atmos. Meas. Tech., 5, 2969–2980, https://doi.org/10.5194/amt-5-2969-2012, 2012.
Griffiths, P. R. and De Haseth, J. A.: Fourier Transform Infrared Spectrometry, John Wiley & Sons Inc., Hoboken, https://doi.org/10.1002/047010631X, 2007.
Hase, F., Blumenstock, T., and Paton-Walsh, C.: Analysis of the instrumental line shape of high-resolution Fourier transform IR spectrometers with gas cell measurements and new retrieval software, Appl. Optics, 38, 3417–3422, 1999.
Hase, F., Frey, M., Kiel, M., Blumenstock, T., Harig, R., Keens, A., and Orphal, J.: Addition of a channel for XCO observations to a portable FTIR spectrometer for greenhouse gas measurements, Atmos. Meas. Tech., 9, 2303–2313, https://doi.org/10.5194/amt-9-2303-2016, 2016.
Herres, W. and Gronholz, J.: Understanding FT-IR data processing. Part 2: Details of the spectrum calculation, Intell. Instrum. Comput., Appl. Lab., 3, 10–19, 1985.
Learner, R. C. M., Thorne, A. P., Wynne-Jones, I., Brault, J. W., and Abrams, M. C.: Phase correction of emission line Fourier transform spectra, J. Opt. Soc. Am. A, 12, 2165–2171, 1995.
Mertz, L.: Transfomations in Optics, John Wiley and Sons, Inc., New York, ISBN-10: 047159640X, ISBN-13: 978-0471596400, 1965.
Rißmann, M., Chen, J., Osterman, G., Zhao, X., Dietrich, F., Makowski, M., Hase, F., and Kiel, M.: Comparison of OCO-2 target observations to MUCCnet – is it possible to capture urban gradients from space?, Atmos. Meas. Tech., 15, 6605–6623, https://doi.org/10.5194/amt-15-6605-2022, 2022.
Schneider, M., Blumenstock, T., Chipperfield, M. P., Hase, F., Kouker, W., Reddmann, T., Ruhnke, R., Cuevas, E., and Fischer, H.: Subtropical trace gas profiles determined by ground-based FTIR spectroscopy at Izaña (28° N, 16° W): Five-year record, error analysis, and comparison with 3-D CTMs, Atmos. Chem. Phys., 5, 153–167, https://doi.org/10.5194/acp-5-153-2005, 2005.
Schneider, M., Sepúlveda, E., García, O., Hase, F., and Blumenstock, T.: Remote sensing of water vapour profiles in the framework of the Total Carbon Column Observing Network (TCCON), Atmos. Meas. Tech., 3, 1785–1795, https://doi.org/10.5194/amt-3-1785-2010, 2010.
Sha, M. K., De Mazière, M., Notholt, J., Blumenstock, T., Chen, H., Dehn, A., Griffith, D. W. T., Hase, F., Heikkinen, P., Hermans, C., Hoffmann, A., Huebner, M., Jones, N., Kivi, R., Langerock, B., Petri, C., Scolas, F., Tu, Q., and Weidmann, D.: Intercomparison of low- and high-resolution infrared spectrometers for ground-based solar remote sensing measurements of total column concentrations of CO2, CH4, and CO, Atmos. Meas. Tech., 13, 4791–4839, https://doi.org/10.5194/amt-13-4791-2020, 2020.
Sha, M. K., De Maziére, M., Notholt, J., Blumenstock, T., Bogaert, P., Cardoen, P., Chen, H., Desmet, F., Garcia, O., Griffith, D. W. T., Hase, F., Heikkinen, P., Herkommer, B., Hermans, C., Jones, N., Kivi, R., Kumps, N., Langerock, B., Macleod, N. A., Makkor, J., Markert, W., Petri, C., Tu, Q., Vigouroux, C., Weidmann, D., and Zhou, M.: Fiducial Reference Measurement for Greenhouse Gases (FRM4GHG), Remote Sensing, 16, 3525, https://doi.org/10.3390/rs16183525, 2024.
Wunch, D., Toon, G. C., Blavier, J.-F. L., Washenfelder, R. A., Notholt, J., Connor, B. J., Griffith, D. W. T., Sherlock, V., and Wennberg, P. O.: The Total Carbon Column Observing Network, Phil. Trans. R. Soc. A, 369, https://doi.org/10.1098/rsta.2010.0240, 2011.
Yokota, T., Yoshida, Y., Eguchi, N., Ota, Y., Tanaka, T., Watanabe, H., and Maksyutov, S.: Global Concentrations of CO2 and CH4 Retrieved from GOSAT: First Preliminary Results, SOLA, 5, 160–163, https://doi.org/10.2151/sola.2009-041, 2009.
Zhou, M., Langerock, B., Sha, M. K., Hermans, C., Kumps, N., Kivi, R., Heikkinen, P., Petri, C., Notholt, J., Chen, H., and De Mazière, M.: Atmospheric N2O and CH4 total columns retrieved from low-resolution Fourier transform infrared (FTIR) spectra (Bruker VERTEX 70) in the mid-infrared region, Atmos. Meas. Tech., 16, 5593–5608, https://doi.org/10.5194/amt-16-5593-2023, 2023.
- Abstract
- Introduction
- Materials and methods
- New phase reconstruction scheme
- Results
- Impact of the phase on the spectrum and on retrieved gas columns
- Summary and conclusion
- Code availability
- Data availability
- Author contributions
- Competing interests
- Disclaimer
- Acknowledgements
- Financial support
- Review statement
- References
- Supplement