the Creative Commons Attribution 4.0 License.
the Creative Commons Attribution 4.0 License.
Validation of 12 years (2008–2019) of IASI-A CO with IAGOS aircraft observations
Brice Barret
Pierre Loicq
Eric Le Flochmoën
Yasmine Bennouna
Juliette Hadji-Lazaro
Daniel Hurtmans
Bastien Sauvage
IASI-A, IASI-B and IASI-C (Infrared Atmospheric Sounding Interferometer) are nadir-looking thermal-infrared sensors which have monitored the atmospheric composition since 2008. Atmospheric carbon monoxide (CO) is retrieved from IASI radiances with two algorithms: the SOftware for a Fast Retrieval of IASI Data (SOFRID) and Fast Optimal Retrievals on Layers for IASI (FORLI). Airborne in situ observations from the In-service Aircraft for a Global Observing System (IAGOS) European research infrastructure have been used to validate IASI CO retrievals. The validation study of IASI CO data performed in 2011 with IAGOS data was limited to two airports (Frankfurt and Windhoek) and 2 years because of the limited sampling at the other IAGOS sites. The extension of the IAGOS infrastructure during the last decade has enabled validation with enough temporal sampling at 33 airports worldwide over the whole IASI-A period (2008–2019).
The retrievals provide between 1.5 and 3 independent pieces of information about the CO vertical profile, and we have chosen to validate the surface–600 hPa and 600–200 hPa partial columns in addition to the total column. The ability of the retrievals to capture the CO variabilities is slightly different for the two retrieval algorithms. The correlation coefficients for the time series are generally larger for SOFRID, especially for the total and lower-tropospheric columns, meaning a better representation of the phase of the variability, while the amplitudes of the variations of FORLI are in better agreement with IAGOS in the middle to upper troposphere.
On average, SOFRID and FORLI retrievals underestimate the IAGOS total column of CO (TCC) by 8 ± 16 % and 6 ± 14 %, respectively. This global TCC agreement between the algorithms hides significant vertical and geographical differences. In the lower troposphere (surface–600 hPa), the bias is larger for FORLI (−11 ± 27 %) than for SOFRID (−4 ± 24 %). In the middle to upper troposphere, the situation is reversed, with biases of −6 ± 15 % for FORLI and −11 ± 13 % for SOFRID. The largest differences between the retrievals are detected south of 13.5° S (latitude of Bangkok), where SOFRID underestimation is systematically larger for the TCC and the mid- to upper-tropospheric column. North of 40° N (latitude of Philadelphia), FORLI biases are significantly larger than SOFRID ones for the TCC and the lower-tropospheric columns. Our validation results provide users with an overview of the quality of IASI CO retrievals and developers with insights into improving the retrievals in the future.
- Article
(8920 KB) - Full-text XML
- BibTeX
- EndNote
The largest sources of carbon monoxide (CO) in the atmosphere are biomass burning and fossil fuel combustion from anthropogenic activities. The oxidation of methane (CH4), whose sources are of natural origin by up to 50 %, and non-methane hydrocarbons accounts for the production of about half of the global CO burden. The main sink of CO (∼ 90 %) is its oxidation by the hydroxyl radical (OH) (Lelieveld et al., 2016). CO thereby impacts the oxidizing capacity of the atmosphere and the lifetime of CH4 (Bergamaschi et al., 2000), which is the second most important greenhouse gas with an anthropogenic origin. Through its oxidation in the presence of nitrogen oxides (NOx), CO is also involved in the production of tropospheric O3. Finally, its lifetime in the troposphere of 1 to 2 months makes CO a good tracer of long-range transport of pollution (Forster et al., 2001).
The IASI (Infrared Atmospheric Sounding Interferometer) sensors launched on board MetOp-A (2006), MetOp-B (2012) and MetOp-C (2018) allow monitoring of meteorological parameters (water vapor and temperature) and a number of atmospheric trace species with unprecedented spatiotemporal coverage (Clerbaux et al., 2009). Two algorithms have been developed for the retrieval of vertical profiles of CO from IASI: the SOftware for a Fast Retrieval of IASI Data (SOFRID; De Wachter et al., 2012) and Fast Optimal Retrievals on Layers for IASI (FORLI; Hurtmans et al., 2012, and George et al., 2009). These retrievals have been used intensively to document biomass burning (Bencherif et al., 2020; Turquety et al., 2020), urban pollution (Stremme et al., 2013; Yarragunta et al., 2019), long-range transport and convective uplift of pollution (Lannuque et al., 2021; Barret et al., 2016; Tsivlidou et al., 2023) and COVID-19 lockdowns' impact on air quality (Zhou et al., 2021; Clark et al., 2021). FORLI-CO data have been compared with data from the Measurement of Pollution in the Troposphere (MOPITT), highlighting the significant impact of the a priori information on the retrieval differences (George et al., 2015). In Buchholz et al. (2021), decadal CO trends were estimated from long-term MOPITT data, and FORLI retrievals displayed consistent hemispheric CO variability and corroborated the results. According to a recent validation report (Langerock et al., 2021), FORLI-CO total columns from IASI's MetOp-C show very good agreement with NDACC-FTIR (Network for the Detection of Climate Change – Fourier Transform Infrared) data, with an average relative difference of 2.7 % and a Pearson correlation coefficient of 0.89. Furthermore, this report shows that the distributions of IASI-A, IASI-B and IASI-C are highly consistent. SOFRID- and FORLI-retrieved profiles from IASI-A were validated in De Wachter et al. (2012) against airborne in situ data from the In-service Aircraft for a Global Observing System (IAGOS) European research infrastructure for the years 2008 and 2009 at the airports of Frankfurt in Germany and Windhoek in Namibia. IAGOS uses commercial aircraft for automatic and routine in situ measurements of the atmospheric composition, including reactive gases (e.g., ozone and CO), greenhouse gases, aerosols and cloud particles as well as essential thermodynamic parameters (Thouret et al., 2006; Nedelec et al., 2015; Petzold et al., 2015). IAGOS provides regular observations in the upper troposphere and lower stratosphere (UTLS) during the cruise phase and vertical profiles in the troposphere during landing and takeoff, in particular over regions that are never or poorly sampled. This long-term quasi-global dataset has been used in a wide range of atmospheric studies, e.g., process studies, trend analyses and validation of climate and air quality models (Clark et al., 2021; Tsivlidou et al., 2023; Cohen et al., 2024), as well as in the calibration of space sensors and the validation of their retrievals (De Wachter et al., 2012; de Laat et al., 2012). George et al. (2015) also used some IAGOS profiles for comparisons with IASI–FORLI and MOPITT data. Since De Wachter et al. (2012), the IASI retrievals have evolved with a number of successive versions and the IAGOS infrastructure has been extended to many airports, particularly in Asia, and we benefit from longer time series. The purpose of this paper is therefore to validate the 12 years of IASI-A CO retrievals with the extended IAGOS database in order to (i) have a validation covering a large number of regions (especially Asia, where anthropogenic pollution is higher) and (ii) document the time stability of the retrievals, focusing on sites such as Frankfurt that provide dense and continuous time series.
The paper is structured as follows. We start with the presentation of the IASI retrievals and the IAGOS data in Sect. 2. The methodology of the validation is introduced in Sect. 3.2, and the results are presented under three different aspects: the comparison of variabilities (Sect. 3.3.1), the biases (Sect. 3.3.2) and the time series with the temporal variabilities at the airports with the densest and longest IAGOS datasets (Sect. 3.4). The syntheses of the main results are finally provided in the conclusions.
2.1 SOFRID-CO IASI retrievals
SOFRID-CO allows fast retrieval of CO profiles at 43 levels from the ground up to 0.1 hPa from MetOp and IASI radiance measurements (De Wachter et al., 2012). It is based on the Radiative Transfer for TOVS (RTTOV; Saunders et al., 1999; Matricardi et al., 2004; Matricardi, 2009) fast radiative transfer model coupled to the UKMO 1D-Var retrieval scheme (Pavelin et al., 2008) based on the optimal estimation method (OEM) described by Rodgers (2000). In the present study we use SOFRID-CO v4.0, which has been updated since v2.0 used in De Wachter et al. (2012). First, SOFRID-N2O (Barret et al., 2021) was recently developed to retrieve N2O profiles from a spectral window (2160–2218 cm−1) partly overlapping the CO window (2143–2181 cm−1) from De Wachter et al. (2012). In order to retrieve N2O together with CO, we have merged the retrieval windows of CO and N2O to 2143–2218 cm−1. The meteorological parameters needed for the radiative transfer calculations (surface pressure, temperature and humidity profiles) are taken from ECMWF operational analyses. RTTOV has been updated from v9.3 to v12.3, and we use UKMO 1D-Var v1.2. The noise of the measurement covariance matrix has been reduced from 1.4 to W (cm2 sr cm−1)−1 in order to better capture the N2O variations. N2O spatiotemporal variations are indeed very low (less than 5 %) compared to CO variations (1 order of magnitude). This noise level is still very conservative and much higher than the radiometric noise of IASI-A estimated to be around W (cm2 sr cm−1)−1 in the CO spectral window (Clerbaux et al., 2009). The retrieval noise indeed takes other sources of errors into account, such as errors in ancillary data (temperature and humidity profiles) or radiative transfer modeling errors. It was optimised with sensitivity tests performed on the CO IAGOS validation database. The a priori covariance matrices are the ones from De Wachter et al. (2012) for CO and H2O and from Barret et al. (2021) for N2O. We only retrieve CO from pixels with a cloud fraction of less than 25 % as in De Wachter et al. (2012). We keep retrieved pixels for which convergence is achieved based on the value of the retrieval cost function (Jcost) output from the 1D-Var analysis, which has to be positive. Jcost is positive if its fractional change between two consecutive iterations remains less than 0.01 (Havemann, 2020). SOFRID-CO daily and monthly data are available for the whole period through the Service de données de l'Observatoire Midi-Pyrénées (https://iasi-sofrid.sedoo.fr/, last access: 6 January 2024).
2.2 FORLI-CO IASI retrievals
In FORLI, CO retrievals are performed in the 2143–2181.25 cm−1 spectral range chosen to minimize interferences by carbon dioxide, N2O and ozone, using the OEM and tabulated absorption cross sections at various pressures and temperatures to speed up the radiative transfer calculation. The a priori information consists of one single CO a priori profile and one single covariance matrix based on a set of model, satellite and aircraft profiles (Hurtmans et al., 2012). The EUMETSAT L2 data (pressure, water vapor, temperature and cloud information) used as input in FORLI have been processed using different versions of the IASI L2 Product Processing Facility between 2008 (v4.2) and 2016 (v6.2) (Schlussel et al., 2005; Van Damme et al., 2017). Retrievals are only processed for scenes with a fractional cloud cover from the EUMETSAT operational processing (August et al., 2012) below 25 %. In addition, no retrieval is performed for pixels characterised by a L1C error due to instruments, processing or missing L2 EUMETSAT data. FORLI-CO provides vertical profiles in 18 layers between the surface and 18 km, with an extra layer from 18 km to the top of the atmosphere. FORLI-CO data also include a general quality flag, the total error profile and the averaging-kernel (AK) matrix. Only pixels with a general quality flag equal to 2, which corresponds to the best quality, are kept for the validation. For this validation study, FORLI-CO v20151001 was used. This version is an update of the one described in Hurtmans et al. (2012) using lookup tables recalculated to cover a larger spectral range with a more recent version of the HITRAN spectroscopic database (HITRAN 2012; Rothman et al., 2013) and implementing numerical corrections. It was validated with NDACC-FTIR data in a recent EUMETSAT report (Langerock et al., 2021). This version was installed in the EUMETSAT ground segment in the AC SAF (Atmospheric Composition monitoring, Satellite Application Facility) (https://www.eumetsat.int/ac-saf, last access: 8 January 2024) framework to generate the CO product (https://navigator.eumetsat.int/product/EO:EUM:DAT:METOP:IASIL2COX, last access: 6 January 2024).
2.3 IAGOS airborne in situ data
We use CO in situ observations from the IAGOS European research infrastructure (Nedelec et al., 2015; Petzold et al., 2015; https://www.iagos.fr, last access: 6 January 2024). CO is measured using a dual-beam ultraviolet absorption monitor (infrared analyzer) with an accuracy of 5 ppbv, a precision of 5 % and a time resolution of 30 s (Blot et al., 2021). Vertical profiles are recorded during ascent and descent phases. Considering the aircraft's vertical speed (7–8 m s−1), the vertical resolution is about 450 m. CO observations have been collected since 2002 based on the same technology.
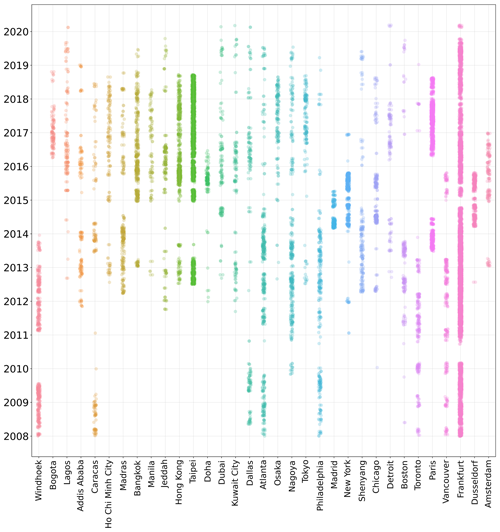
From the IAGOS database, only airports providing at least 60 d with valid data between 2008 and 2020 were selected. This selection criterion leads to 33 airports representing a total of 14 211 profiles (8478 d). The locations of these 33 airports are given in Table A1 and are displayed in Fig. 1. The temporal availabilities of the IAGOS data are also displayed for each of the 33 airports in Fig. 2. The remaining airports provide temporally sparse profiles, which do not allow for sampling of temporal variabilities representative of their locations.
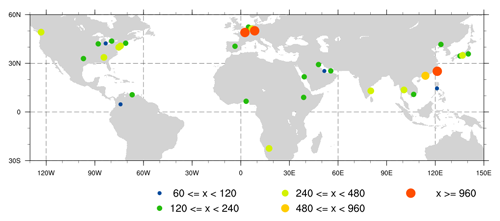
Figure 1Locations of the 33 selected airports with IAGOS data for the 2008–2020 period. The sizes of the symbols are proportional to the number of valid profiles used for validation.
Frankfurt represents 35 % (4917 profiles) of these observations and provides the longest and most continuous time series. In Europe the other four airports have far fewer observations over shorter time periods. Over North America (nine airports), Atlanta represents the longest and densest time series covering the full period with some major gaps. The time series over Asia (10 airports) mostly start after 2012, except for Nagoya, which starts in late 2009. Taipei and Bangkok provide dense and long time series for Southeast and East Asia. During the IASI-A period, only three airports (Addis Ababa, Lagos and Windhoek) were sampled by IAGOS over Africa, of which Windhoek provides the longest and densest time series. The four Middle East airports (Jeddah, Dubai, Doha and Kuwait City) mostly cover the period 2015–2016, with some sparse data earlier and later. Over South America, Caracas provides sparse data from 2008 to 2018 and Bogota less than 3 years of data. In Sect. 3.4, time series are shown for the airports with the densest and longest IAGOS datasets: Frankfurt, Atlanta, Bangkok, Taipei, Nagoya and Windhoek.
3.1 Information content analysis
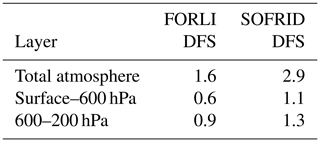
The vertical sensitivity of the retrievals is characterised by the AK matrix. For each retrieval layer, the retrieved quantity is the result of the convolution of the real profile by the corresponding averaging kernel (row of the AK matrix) plus a contribution from the a priori profile (xa) (see Eq. 1). The AKs are bell-shaped functions, of which the width gives an indication of the retrieval's vertical resolution. The trace of the AK matrix, called degrees of freedom for signal (DFS), provides the number of independent pieces of information about the vertical profile from the retrieval. The AKs at Frankfurt averaged over the whole validation period are displayed in Fig. 3 for FORLI and SOFRID for the winter (December–January–February: DJF) and summer (June–July–August: JJA) seasons. The DFS for the total atmosphere and two selected tropospheric layers averaged over the 33 airports (Sect. 2.3) are given in Table 1. For FORLI the retrievals provide a total of 1.6 independent pieces of information against 2.9 for SOFRID. In the former validation study (De Wachter et al., 2012), the SOFRID and FORLI DFS were close to each other, ranging between 1 and 2. The larger information content from the present SOFRID version is due to two effects related to the simultaneous CO and N2O retrievals. First, there is the extension of the spectral window from 2143–2181 cm−1 (De Wachter et al., 2012) to 2143–2218 cm−1. The 2181–2218 cm−1 window contains about half of the ν3 N2O absorption band (Barret et al., 2021). The 0–1 CO absorption band is composed of its P branch below about 2140 cm−1 and the symmetrical R branch between 2140 and 2225 cm−1 (Stepanov et al., 2020). The extension of the spectral window is therefore roughly double the number of CO absorption lines compared to De Wachter et al. (2012). Second, the retrieval noise variance has been reduced by a factor of 2 in order to improve the ability of the retrieval to capture N2O variations, as discussed in Sect. 2.1.
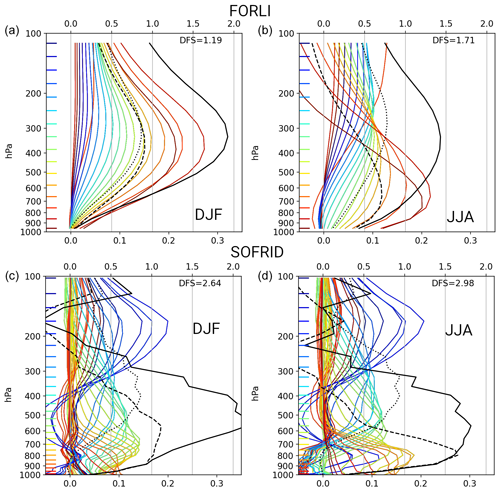
Figure 3FORLI (a, b) and SOFRID (c, d) averaging kernels (bottom x axis, color lines) and normalised averaging kernels for integrated columns (top x axis: black solid line for the total column, black dashed line for the surface to 600 hPa and black dotted line for 600–200 hPa) for daytime retrievals averaged over the validation database at Frankfurt for (a, c) DJF and (b, d) JJA. The nominal height of each averaging kernel is marked by the horizontal tick with the corresponding color.
For both algorithms, the DFS are larger at Frankfurt in JJA than in DJF (Fig. 3) because the surface temperature and the surface–atmosphere thermal contrast are larger in summer. The JJA individual AKs for FORLI display roughly two groups, with one corresponding to layers between 900 and 700 hPa that peak in the lower troposphere and one corresponding to layers between 500 and 250 hPa which are sensitive to the middle and upper troposphere. In DJF there is only one distinct group of AKs with maximum sensitivity between 700 and 200 hPa. For SOFRID and for both seasons, the AKs display roughly three groups with maximum sensitivity at about 800, 500 and 150 hPa. We therefore selected the layers surface–600 hPa and 600–200 hPa as the two pieces of information that can be retrieved by both algorithms. The average DFS for these two partial columns range from 0.6 for FORLI in the lower layer in DJF to 1.3 for SOFRID in the upper layer in JJA, which confirms that they correspond to almost independent pieces of information (Table 1). For the total column of CO (TCC), the retrieval errors (sum of the measurement and smoothing errors; Rodgers, 2000) provided with the retrievals are similar for both algorithms, with a mean value of 5 %.
Table 1DFS for FORLI and SOFRID for the total atmosphere and two tropospheric layers averaged over the validation dataset at the 33 selected airports.
The AKs for the two partial columns have clearly distinct peaks for SOFRID and FORLI in JJA (Fig. 3). In DJF, FORLI's AKs display a single peak following the low total information content (1.19). For the other two seasons (MAM and SON, not shown), the DFS for FORLI are about 1.5 and the AKs for the partial columns are similar to the AKs for JJA. It is noteworthy that, for the different seasons and both algorithms, the AKs display minima at the surface, indicating low sensitivity in the boundary layer (Fig. 3).
3.2 Methodology
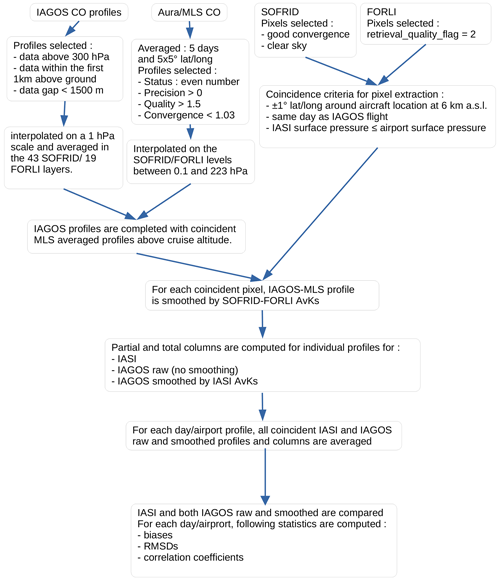
The validation methodology is presented in the flowchart of Fig. 4. The IAGOS profiles are selected according to their vertical completeness below the aircraft cruising altitude. Profiles must not show consecutive intervals of more than 1500 m in altitude without valid data. Furthermore, they are completed in the upper troposphere and stratosphere with the Aura Microwave Limb Spectrometer (MLS) v5.0 CO profiles filtered according to data quality (Livesey et al., 2020) and averaged in 5° latitude × 5° longitude boxes over 5 d with a procedure similar to the one described in De Wachter et al. (2012). Both IAGOS and MLS profiles are interpolated on the 19 FORLI and 43 SOFRID retrieval levels and merged.
IASI pixels were extracted in squares of ± 1° latitude and longitude around the aircraft position at 6 km a.s.l. on the same day as the corresponding IAGOS takeoff or landing profile (Fig. 4). We chose 6 km to be about halfway between the ground and the cruising altitude. Pixels were filtered according to their retrieval quality. In order to take the retrieval vertical sensitivity and a priori impact into account for comparison, the IAGOS profiles xIAG were smoothed with the SOFRID and FORLI AK matrices (A) according to the following equation:
where is the smoothed or convolved IAGOS profile and xa is the a priori profile of the SOFRID or FORLI retrieval. The partial columns for the selected surface–600 hPa and 600–200 hPa layers and the TCC were computed for the IAGOS (raw and smoothed) profiles and for the SOFRID and FORLI retrievals. For each day and airport with an IAGOS profile, all coinciding IASI and IAGOS (raw and smoothed) profiles were averaged.
3.3 General statistics
In this section, we present the comparisons of the results (TCC, surface–600 hPa and 600–200 hPa) from SOFRID and FORLI with the data provided by the IAGOS–MLS association, both raw and smoothed. The validation of satellite retrievals with independent data requires us to compute a number of indicators that quantify the ability of the retrievals to reproduce the absolute values and the variations of the retrieved quantity. The relative or absolute biases document the accuracy of the retrievals. The root mean square difference (RMSD) between the two datasets provides information about the significance of the biases. The Pearson (or correlation) coefficient (R) describes the agreement between the phases of the variabilities of the two datasets. Finally, the ratios of the standard deviations document the agreement between the amplitudes of the variations.
3.3.1 Variabilities
The Taylor diagram used for climate model validation (Taylor, 2001) takes advantage of the relationship between R, the RMSD and the variabilities (standard deviations) of the two datasets to display these three parameters synthetically. Figure 5 presents Taylor diagrams comparing three SOFRID and FORLI columns with raw IAGOS data. The RMSDs between the SOFRID/FORLI and IAGOS datasets and the standard deviations of the SOFRID and FORLI results are normalised by the standard deviation of the reference raw IAGOS data to display the results from multiple experiments (here multiple airports) in a single diagram. We only display the Taylor diagrams for comparison of FORLI and SOFRID with raw IAGOS data because they provide the best assessment of the real differences between the in situ and remotely sensed data. The Taylor diagrams for the smoothed IAGOS data are provided in the Appendix (Fig. A1).
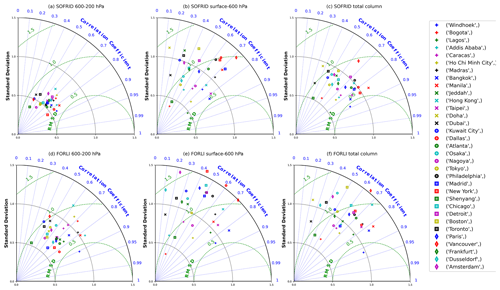
Figure 5Taylor diagrams for the raw SOFRID (a, b, c) and FORLI (d, e, f) data comparisons versus the raw IAGOS data comparison for the 600–200 hPa (a, d), surface–600 hPa (b, e) and total CO (c, f) columns.
The reference (here IAGOS data) corresponds to marker 1 on the x axis (see Fig. 5). The RMSD is proportional to the distance from this reference point (green arcs of the circle centered on the reference point). The Pearson coefficient between the reference (IAGOS) and the test datasets (SOFRID and FORLI) is given by the azimuthal position of the point. Finally, the radial distance from the origin is proportional to the standard deviation of the experiment (i.e., retrievals of one of the algorithms at a given airport). Each airport is represented by a marker of a different shape and color. The better the agreement between SOFRID and FORLI results and raw IAGOS data, the closer the markers will be to the reference point. For example, the point corresponding to Windhoek shows better agreement for the TCC retrieved by FORLI, while the agreement is better for SOFRID at New York.
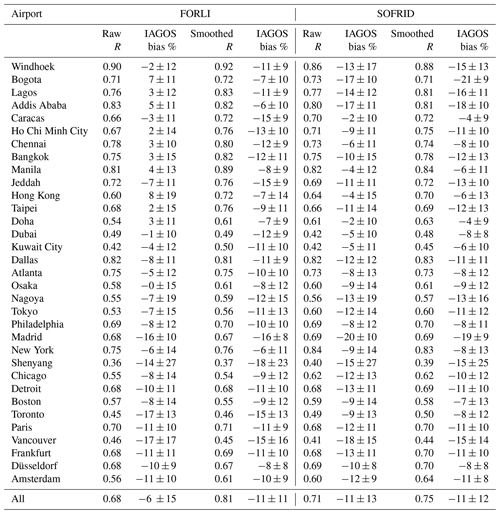
The biases, their standard deviations and the Pearson coefficients are also reported for TCC comparisons with raw and smoothed IAGOS data in Table 2 (the airports are listed in ascending order of latitude). For the two partial columns, the data are provided in Appendix A, Table A2 for surface–600 hPa and in Table A3 for 600–200 hPa.
Table 2Pearson coefficients and biases for FORLI and SOFRID for total column comparisons with raw and smoothed IAGOS data at the 33 selected airports, listed in ascending order of latitude.
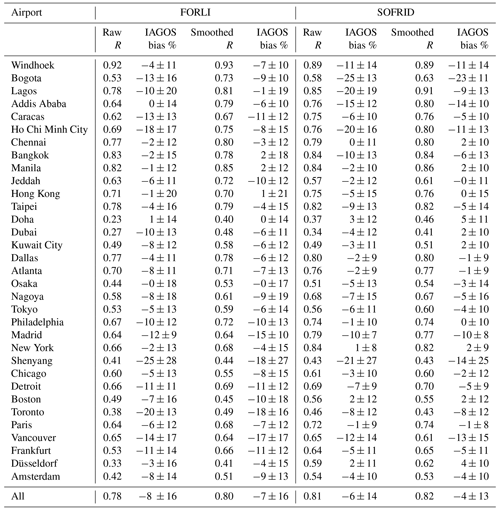
For raw IAGOS data, and concerning the TCC, R is generally larger for SOFRID than for FORLI, with for instance fewer points above the R=0.8 line (seven for SOFRID and three for FORLI) in the diagram (Fig. 5) or 24 airports with R<0.7 (R2<0.5) for FORLI against 17 for SOFRID (Table 2). The most striking example is at Düsseldorf with R=0.59 for SOFRID and 0.33 for FORLI (Table 2). By contrast, variations (standard deviations) are larger for FORLI than for SOFRID. For instance, at Lagos, FORLI has the same amplitude of variations as IAGOS and SOFRID just half of this. At Vancouver, FORLI's variations are about 1.5 times higher than those of IAGOS, whereas SOFRID displays an amplitude of variations closer to IAGOS. For 11 (14) airports the ratios of the standard deviations between the retrievals and the raw IAGOS data are between 0.9 and 1.1 for FORLI (SOFRID). For 4 (12) airports these ratios are between 0.7 and 0.9 for FORLI (SOFRID). Symmetrically, for 13 (3) airports they range from 1.1 to 1.3 for FORLI (SOFRID). For the remaining airports, SOFRID (FORLI) underestimates (overestimates) this amplitude. Therefore, SOFRID reproduces slightly better the phase of the temporal variations of TCC, while both algorithms capture the amplitudes of these variations for about one-third of the airports.
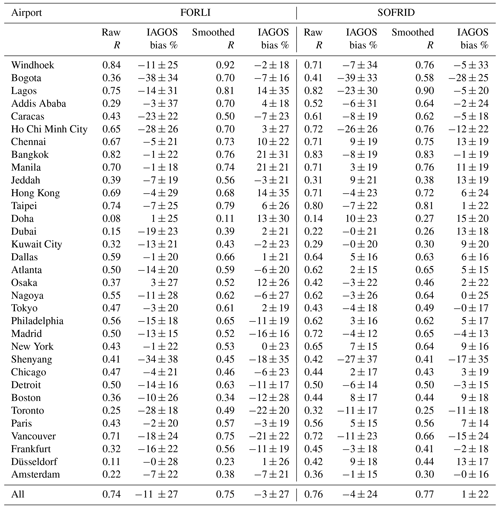
For the lower-tropospheric column (surface–600 hPa), SOFRID and FORLI display larger spreads of indicators across the Taylor diagrams. For instance, the RMSD ranges between 0.55 and 1.4 times the IAGOS standard deviations for SOFRID and between 0.5 and 1.8 for FORLI (Fig. 5b and e). For FORLI, the Doha and Boston variabilities are 1.65 and 1.77 larger than IAGOS, and the corresponding points are therefore outside the Taylor diagram and are not displayed in Fig. 5e. As for the TCC, the SOFRID Pearson coefficients are larger than those of FORLI for the majority of the airports (23; Table A2). For five of the airports, the SOFRID and FORLI Pearson coefficients are equal or nearly equal: Bangkok, Manila, Shenyang, Detroit and Vancouver. For SOFRID and FORLI, 10 (19) and 6 (15) airports are associated with R>0.7 (R>0.5). As for the TCC, variabilities (standard deviations) are larger for FORLI than for SOFRID. For Lagos, Shenyang and Bogota, SOFRID provides variabilities of less than half of IAGOS, and for New York, Dallas and Vancouver, FORLI's variabilities are more than 1.5 times larger than those of IAGOS. For 7 (10) airports, the ratios of the standard deviations are between 0.9 and 1.1 for FORLI (SOFRID). For four (nine) airports, these ratios range from 0.7 to 0.9 and from 1.1 to 1.3 for nine (eight) airports for FORLI (SOFRID). For the remaining airports, the standard deviation ratios are less than 0.7 (5 for SOFRID and 3 for FORLI) or higher than 1.3 (1 for SOFRID and 10 for FORLI). Therefore, SOFRID again reproduces slightly better the phase of the temporal variations of the surface–600 hPa CO column. The low sensitivities of the retrieval algorithms in the lowermost layers documented by the DFS (Table 1) and AKs (Fig. 3) explain the lower level of agreement with the IAGOS data for the lower-tropospheric column than for the TCC.
For the mid- to upper-tropospheric column (600–200 hPa), the Taylor indicators are more compact than for the lower-tropospheric column (Fig. 5a and d), with for instance RMSDs roughly ranging from 0.5 to 1.0 times the IAGOS standard deviations for both SOFRID and FORLI. For both algorithms, the Pearson coefficients associated with this partial column are generally similar to or larger than the ones associated with the TCC. The altitude range between 600 and 200 hPa indeed corresponds to the maximum sensitivity of the algorithms, as shown by the AKs in Fig. 3. For SOFRID (FORLI), 12 (12) airports are associated with R>0.7 and 14 (9) with . For 11 airports, the SOFRID and FORLI Pearson coefficients are equal or nearly equal: Lagos, Bangkok, Manila, Kuwait City, Dallas, Nagoya, Philadelphia, Madrid, Detroit, Frankfurt and Düsseldorf. The ratios of the standard deviations of the retrievals relative to the IAGOS ones are lower than those for the TCC and the lower-tropospheric column, as clearly displayed in Fig. 5. These ratios range from 0.53 (Shenyang) to 1.22 (Hong Kong) for FORLI and from 0.38 (Shenyang) to 0.76 (Hong Kong) for SOFRID. Therefore, for only eight (zero) airports, the ratios of the standard deviations are between 0.9 and 1.1 for FORLI (SOFRID). For 15 (2) airports, the ratios are between 0.7 and 0.9 for FORLI (SOFRID), and for 3 (0) airports the ratios are between 1.1 and 1.3. For 7 (31) airports the ratios are less than 0.7 for FORLI (SOFRID). For the remaining seven airports, the FORLI standard deviations are more than 1.3 times larger than the IAGOS one. Therefore, the standard deviations are generally higher for FORLI than for SOFRID, even if the IASI retrievals both underestimate the amplitude of the IAGOS CO variability. As for the TCC, SOFRID slightly better reproduces the phase of the variations with Pearson coefficients larger than FORLI.
The smoothing of the IAGOS profiles by the retrieval AKs has the general effect of improving the agreement between larger Pearson coefficients and more compact clouds of points with standard deviation ratios closer to the 1:1 circle (Fig. A1). For SOFRID, the smoothing has little effect on the TCC (Table 2) and lower-tropospheric columns (Table A2) but improves the correlations significantly for the mid- to upper-tropospheric columns (Table A3). For FORLI the variability ratios clearly decrease and come closer to 1, and the Pearson coefficients clearly increase for the three columns.
3.3.2 Biases
The biases and corresponding RMSDs for comparisons with raw and smoothed IAGOS data are reported in Table 2 for the TCC, in Table A2 for the surface–600 hPa partial column and in Table A3 for the 600–200 hPa partial column. The median and the 25th and 75th percentiles of the differences are displayed for FORLI and SOFRID with raw and smoothed IAGOS data in the three columns in Fig. 6 (the airports are listed in ascending order of latitude).
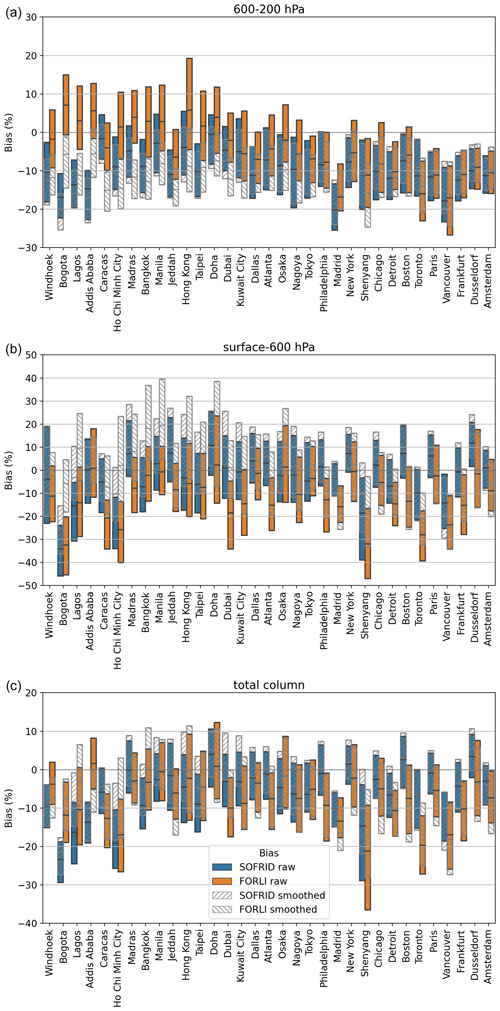
Figure 6Median and 25th and 75th percentiles of the biases between IASI and IAGOS CO columns at the 33 selected airports for 600–200 hPa (a), surface–600 hPa (b) and the total (c). SOFRID (blue) and FORLI (orange) versus IAGOS. SOFRID (hatched clockwise) and FORLI (hatched counterclockwise) versus IAGOS smoothed. The airports are listed in ascending order of latitude.
For both SOFRID and FORLI, the TCC biases at the 33 selected airports are mostly negative, with mean values between −25 % and 3 % (median differences between −23 % and 3 %; Fig. 6) and an average over all the airports of less than 10 % in absolute value for both algorithms. For 24 (14) and 26 (18) of the airports, the biases are less than or equal to 10 % (5 %) in absolute value for FORLI and SOFRID, respectively. Globally, absolute values of FORLI biases are higher than SOFRID ones at the majority (21) of the 33 airports, but the global mean biases of both retrievals are not significantly different. The largest negative (≤ 10 %) TCC biases common to both products occur south of 13.5° N (Bogota, Lagos and Ho Chi Minh City) and north of 40° N (Madrid, Shenyang and Vancouver). At 9 of the 12 airports south of 25° N (latitude of Taipei), SOFRID negative biases are larger than FORLI's in absolute value. By contrast, north of 40° N, FORLI biases are systematically larger than SOFRID ones. These latitudinal behaviors are clearly visible in Fig. 6. The largest discrepancies (>10 % in absolute value) between the two products occur at Bogota, Addis Ababa (SOFRID's absolute value higher) and Toronto (FORLI's absolute value higher). In most cases the differences between raw and smoothed IAGOS data (Table 2) are not significant for the TCC. Over Lagos and Ho Chi Minh City, where the negative biases are large, the smoothing significantly reduces the biases.
In the surface–600 hPa layer, the biases are mostly negative, ranging from −39 % to 10 % with mean biases over all the airports of −4 % (−11 %) for SOFRID (FORLI) (Table A2). For 17 (13) and 27 (15) of the airports, the absolute biases remain below 10 % (5 %) for FORLI and SOFRID. So, SOFRID and FORLI (to a lesser extent) retain low biases for the lower-tropospheric column. The latitudinal behavior of both products is very similar to that of the TCC, with larger negative biases south of 13.5° N and north of 40° N, as can be seen in Fig. 6. For 10 out of the 13 airports north of 40° N, the FORLI absolute biases are larger than the SOFRID ones. As could be expected from the information content analysis, smoothing has a larger impact on this lower-tropospheric column (see Sect. 3.1). This is especially noticeable for FORLI at 12 out of the 15 airports south of 29° N (latitude of Kuwait City) and at Shenyang, where the biases are enhanced by more than 10 % (up to 31 %) when IAGOS data are smoothed, as can be clearly seen in Fig. 6. Over Bogota, Caracas, Ho Chi Minh City, Dubai, Kuwait City and Shenyang, the biases are reduced in absolute value, resulting in better agreement with IAGOS data when smoothing is applied. For SOFRID the biases are enhanced by 10 % to 18 % over Bogota, Lagos, Ho Chi Minh City, Hong Kong, Dubai and Shenyang, resulting in improved agreement with IAGOS data, except at Hong Kong and Dubai (biases larger in absolute value).
In the mid-tropospheric layer the median biases are roughly between −20 % and 8 % (Fig. 6). In contrast to the lower-tropospheric column, the mean bias over the whole dataset is larger for SOFRID (−11 %) than for FORLI (−6 %) (Table A3). For 26 (14) and 16 (6) of the airports, the mean absolute biases are less than 10 % (5 %) for FORLI and SOFRID. SOFRID biases are consistently negative, with almost no difference between raw and smoothed IAGOS data. For FORLI, the biases oscillate around 0, are mostly positive south of 25° N (latitude of Doha) and become significantly negative north of 35° N (latitude of Nagoya). Therefore, as for the TCC, the largest discrepancies between SOFRID and FORLI occur at low latitudes, with SOFRID's absolute biases larger than FORLI's at 9 out of the 12 airports south of 25° N. For FORLI, the application of the AKs gives the biases large negative values south of 29° (latitude of Kuwait City) and makes little difference for airports further north.
From the comparative analysis of the biases for the three different columns, we can conclude that the larger TCC negative biases of SOFRID relative to FORLI south of 25° N are related to the middle to upper troposphere. Conversely, the larger TCC negative biases of FORLI north of 40° N are mostly linked to the lower troposphere. The lower impact of the AK smoothing on SOFRID comparisons results from the larger DFS for SOFRID retrievals (Table 1).
3.4 Time series
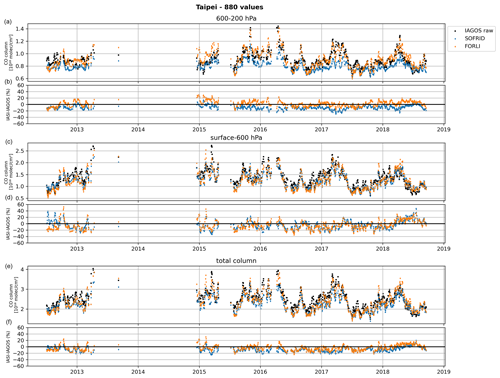
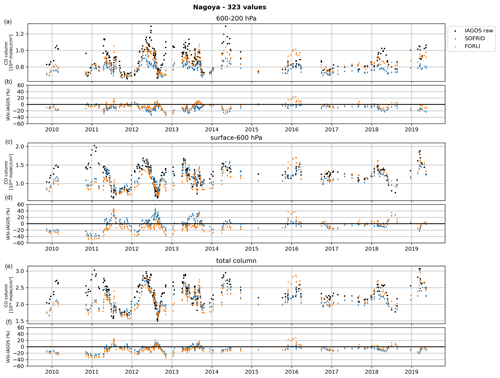
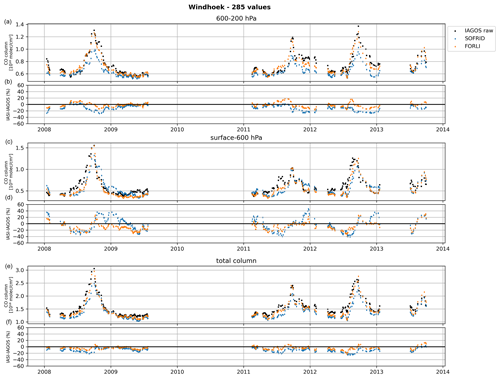
In order to have better insight into the discrepancies between IASI retrievals and IAGOS data, we have plotted the time series of the columns of the three datasets and the differences between the IASI and raw IAGOS columns for coincident dates at six airports (Frankfurt, Atlanta, Bangkok, Taipei, Nagoya and Windhoek) selected for their good temporal sampling during the IASI-A period and for their locations in different regions.
Frankfurt presents the densest sampling over the whole period, with only three periods without observations in 2010, 2014 and 2020 (Fig. 7). As already documented in De Wachter et al. (2012), for SOFRID and FORLI, the TCC biases are negative with a seasonal cycle characterised by large biases in winter–spring and low biases in summer (Fig. 7f). The biases are similar for both algorithms during 2008–2010 and 2015–2019, but FORLI displays larger negative biases for the period 2011–2015. These different behaviors in FORLI retrievals can be related to the two major updates of EUMETSAT L2 data processing that were made in September–December 2010 and at the end of September 2014 according to Van Damme et al. (2017) (see Table 2). These updates improved the retrieval of the vertical temperature profiles and the cloudy data flagging for the second one.
The same behavior is observed for the surface–600 hPa layer, with larger bias variations from −40 % in winter to 20 % in summer (Fig. 7c). The larger biases in winter are related to the lower sensitivity to the lower troposphere when the surface is cold and the surface atmospheric thermal contrast is low, as detailed in Sect. 3.1. As for the TCC, the SOFRID and FORLI biases are similar, except for the period 2011–2015. During this period, FORLI's biases are about 20 % lower than SOFRID's and remain negative during all of the seasons, while the SOFRID biases become positive in summer. On average, FORLI underestimates IAGOS lower-tropospheric columns by 16 % compared to 3 % for SOFRID (Table A2). In the 600–200 hPa layer, the biases of both algorithms display less seasonal variability, with values in the −20 %; 0 % range (Fig. 7a) and very similar mean biases of −11 % and −13 % for FORLI and SOFRID, respectively (Table A3).
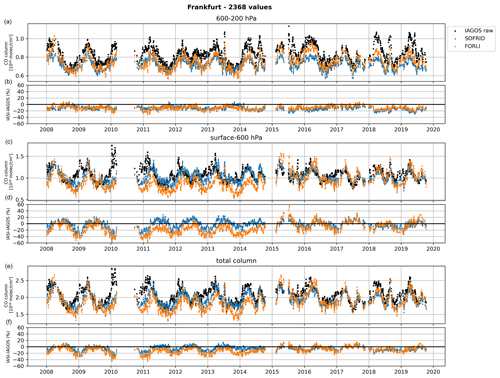
Figure 7Time series of SOFRID (blue diamonds), FORLI (orange diamonds) and raw IAGOS (black diamonds) CO columns at Frankfurt. (a, b) 600–200 hPa, (c, d) surface–600 hPa and (e, f) total columns. The lower panels display the differences between SOFRID and raw IAGOS (blue diamonds) and FORLI and raw IAGOS (orange diamonds).
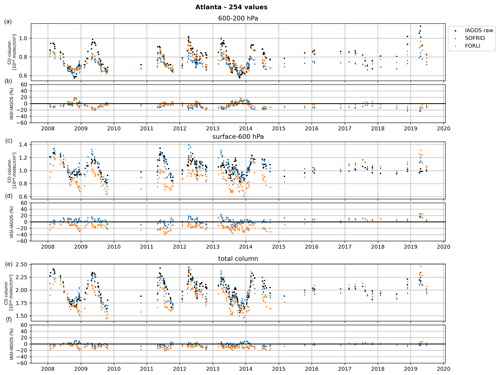
Atlanta provides fewer data than Frankfurt but displays the same behavior (Fig. 8). FORLI underestimates the TCC by up to 20 % with an average of −8 %, and SOFRID biases oscillate around zero with an average of −2 %. The same is true in the lower troposphere, with mean biases of −14 % and 2 % for FORLI and SOFRID. In the middle troposphere, both retrievals are in better agreement, with similar biases of −5 % and −8 % for FORLI and SOFRID. The seasonal and interannual bias variations are not as prominent over Frankfurt due to the more incomplete temporal sampling.
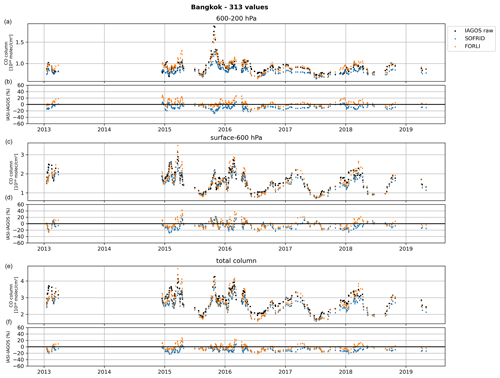
Over Bangkok (Fig. 9), valid data are mostly provided from 2015 to 2018. The IASI-retrieved TCC correctly captured the seasonal variations from IAGOS with winter–spring maxima and summer minima (Fig. 9, bottom). SOFRID underestimates IAGOS by up to 20 % with an average bias of 10 %, and FORLI oscillates between −20 % and 20 % with a mean bias of −2 %. When the AKs are applied to the IAGOS profiles, little differences are observed from comparisons with the raw IAGOS data for SOFRID. For FORLI, the overestimation is slightly higher when the IAGOS profiles are smoothed.
For the surface–600 hPa layer, the general behavior is similar to that of the TCC, with larger bias variations. For raw IAGOS data, both SOFRID and FORLI biases are roughly within the −20 %; 20 % boundaries, but SOFRID's mean bias (−8 %) is larger than FORLI's (−1 %).
In the mid- to upper-tropospheric layer (600–200 hPa), the seasonal variability is lower and SOFRID (FORLI) underestimates (overestimates) IAGOS by up to 20 %, with a mean bias of −10 % (3 %).
Over Taipei, data are available for a short period in 2012–2013 and from 2015 to 2018 with a denser sampling than over Bangkok. The seasonal TCC variations are characterised by marked spring maxima, and both SOFRID and FORLI display very good and similar agreement with mean biases in the −20 %; 0 % range, except in 2018, when they become positive but remain below 20 %. The mean bias relative to IAGOS columns is larger for SOFRID (−9 %) than for FORLI (−4 %). In contrast to Frankfurt, the biases do not display clear seasonal cycles. In the surface–600 hPa layer, the variations are also captured with more variable biases by both algorithms than for the TCC. The biases are mostly in the −20 %; 20 % range until the spring of 2018, when they become positive and remain below 40 %. In the 600–200 hPa layer SOFRID underestimates IAGOS by up to 20 % for the spring maxima and FORLI generally displays better agreement, especially when representing the maxima.
The Nagoya IAGOS data date back to the end of 2010 but are much sparser than over Taipei. The years with the best sampling are 2011–2013. Afterwards, data are too sparse to document the seasonal variability. For the TCC, FORLI and SOFRID display the largest biases (up to −30 % for FORLI) in winter–spring and better agreement in summer. For the surface–600 hPa column, the biases are negative in winter–spring and positive in summer, and FORLI's underestimation (−11 %) is larger than SOFRID's (−3 %). In the 600–200 hPa layer, the biases' seasonal variations are less important and FORLI's bias (−7 %) is lower than SOFRID's (−13 %).
Windhoek is an interesting location to document the ability of IASI retrievals to capture the impact of biomass burning fire plumes on the CO profiles (Fig. 12). In De Wachter et al. (2012), FORLI and SOFRID retrievals were compared to Windhoek IAGOS data for 2008–2009. Here we have data from 2011 to 2013 to improve the comparisons. Both algorithms capture the high spring biomass burning maxima visible over the three layers. The underestimation of TCC by the retrievals is larger for SOFRID (−11 %) than for FORLI (−4 %). As for the other locations, in the surface–600 hPa layer, the biases are larger and display a stronger seasonal cycle. The SOFRID biases are negative in boreal summer and positive in winter at the end of the biomass burning season, and they are smaller on average (−7 %) than FORLI's biases (−11 %). The positive biases in the lower layer are compensated for by an important underestimation in the upper layer. This effect is less noticeable for FORLI.
We have used data from the IAGOS European research infrastructure to validate CO IASI columns retrieved from the SOFRID and FORLI algorithms over the whole MetOp-A period (2008–2019). Only airports providing at least 60 d with valid data have been selected, resulting in 14 211 profiles (8478 d) for 33 airports. From an analysis of the information content of both retrieval algorithms, we have chosen to make comparisons for the total column of CO (TCC), the lower-tropospheric (surface–600 hPa) partial column and the mid- to upper-tropospheric (600–200 hPa) partial column.
SOFRID and FORLI have slightly different behaviors in terms of the reproduction of the CO variations. For the TCC and the surface–600 hPa column, SOFRID provides larger correlation coefficients for the majority (29) of the 33 airports, meaning better agreement for the phase of IAGOS CO temporal variations for these columns. For the 600–200 hPa partial column, the correlation coefficients are closer for both algorithms, with larger coefficients computed for SOFRID at only 18 of the airports.
Concerning the variability of the TCC, the standard deviations are close to the IAGOS ones (ratios within 0.7–1.3) at the majority (29 for SOFRID and 28 for FORLI) of the airports. FORLI (SOFRID) generally overestimates (underestimates) IAGOS variabilities for the three layers. For the lower troposphere, the standard deviation ratios are within 0.7–1.3 for 27 (20) of the airports for SOFRID (FORLI). For the middle to upper troposphere, the FORLI variabilities are in good agreement (ratios within 0.7–1.3) with IAGOS for most (26) of the airports. SOFRID underestimates the mid- to upper-tropospheric CO variability (with ratios lower than 0.7) at the majority (31) of the airports.
On average, over the whole dataset, SOFRID (FORLI) underestimates the IAGOS TCC by 6 ± 14 % (8 ± 16 %), with a correlation coefficient of 0.81 (0.78). For both algorithms, the biases are not geographically uniform. At 9 out of 12 airports, south of 25° N (latitude of Taipei), SOFRID's TCC negative biases are larger in absolute value and, north of 40° N (latitude of Philadelphia, 13 airports), FORLI's underestimations are larger. The larger SOFRID TCC biases mainly result from large biases in the middle to upper troposphere. The SOFRID average bias in the 600–200 hPa layer (−11 ± 13 %) is about twice as large as FORLI's (−6 ± 15 %). The larger FORLI TCC biases are mainly related to the large biases of FORLI in the lower troposphere. Indeed, FORLI's mean bias (−11 ± 27 %) is almost 3 times larger than SOFRID's (−4 ± 24 %) in the surface–600 hPa layer.
Data from Frankfurt, which is the airport with the densest and longest IAGOS time series, show that IASI retrievals allow us to capture the seasonal variations of the TCC correctly with the summer maxima and winter–spring minima. Nevertheless, both retrievals display an important underestimation in winter–spring and almost no bias in summer, and FORLI's biases are significantly larger during the 2011–2015 period. This can be explained by version changes in EUMETSAT L2 data processing. Inspection of the partial column time series highlights that the temporal variability of the TCC biases mostly stems from the surface–600 hPa columns. For Taipei, which is the airport with the second longest and densest IAGOS dataset, there are no clear seasonal variations of the biases for the three different columns. At Windhoek, IASI retrievals are able to capture the large TCC maxima in austral spring, when biomass burning is active over southern Africa. SOFRID tends to underestimate CO and especially the impact of biomass burning on the middle and upper troposphere.
To conclude, SOFRID and FORLI are able to capture the TCC spatiotemporal variability over the 12 years of MetOp-A, with an underestimation of less than 8 %. Nevertheless, this average figure does not represent a homogeneous reality, and we have shown that the IAGOS database highlighted the relative strengths and weaknesses of both retrievals when capturing the 4D variations of CO.
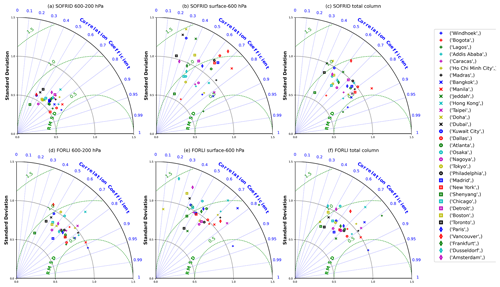
Figure A1Taylor diagrams for the SOFRID (a–c) and FORLI (d–f) versus IAGOS smoothed data comparisons for the 600–200 hPa (a, d), surface–600 hPa (b, e) and total (c, f) CO columns.
Table A1Latitude, longitude and number of days with valid IAGOS profiles at the 33 selected airports.
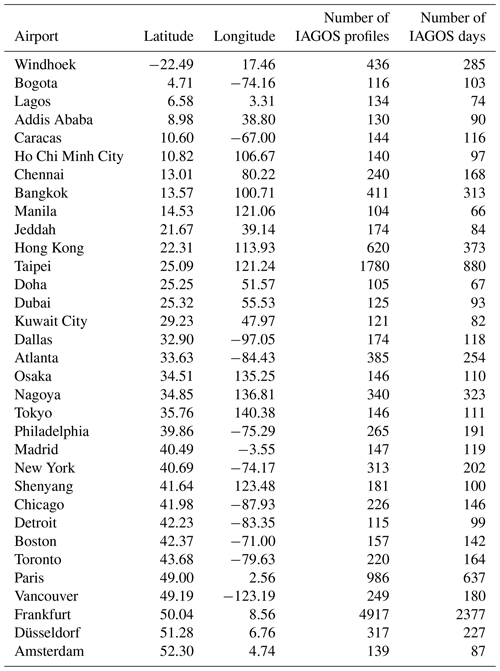
Table A2Pearson coefficients and biases for FORLI and SOFRID for surface–600 hPa column comparisons with raw and smoothed IAGOS data at the 33 selected airports, listed in ascending order of latitude.
The IAGOS data are available at https://doi.org/10.25326/07 (Boulanger et al., 2018). The SOFRID-CO daily and monthly data are available for the whole period from the Service de données de l'Observatoire Midi-Pyrénées (https://iasi-sofrid.sedoo.fr/, LAERO, 2025). The FORLI-CO products are available at https://navigator.eumetsat.int/product/EO:EUM:DAT:METOP:IASIL2COX (ULB-LATMOS, 2017) from 14 May 2019 onwards and through the AERIS data infrastructure for the whole IASI observation period (upon request to http://iasi.aeris-data.fr/contact/, last access: 8 January 2024).
BB is responsible for SOFRID and is the principal investigator (PI) of this study. ELF is in charge of SOFRID operations and development. PL and YB were in charge of the realization of the validation scripts, and they participated in the redaction of the paper. JHL is in charge of the FORLI processing, and she participated in the redaction of the paper. DH is responsible for the development of the FORLI algorithm. BS provided the IAGOS data and expertise and participated in the redaction of the paper.
The contact author has declared that none of the authors has any competing interests.
Publisher's note: Copernicus Publications remains neutral with regard to jurisdictional claims made in the text, published maps, institutional affiliations, or any other geographical representation in this paper. While Copernicus Publications makes every effort to include appropriate place names, the final responsibility lies with the authors.
The IASI mission is a joint mission of EUMETSAT and the Centre National d'Etudes Spatiales (CNES, France). The L1C and L2 operational IASI data were distributed in near real time by EUMETSAT through the EUMETCast system distribution. This research was carried out in the framework of the IASI-Chimie project supported by the TOSCA/CNES program, which financed Pierre Loicq. The MOZAIC/CARIBIC/IAGOS data were created with support from the European Commission, national agencies in Germany (BMBF), France (MESR) and the UK (NERC) and IAGOS member institutions (https://www.iagos.org/organisation/members/, last access: 8 January 2025). The participating airlines (Lufthansa, Air France, Austrian Airlines, China Airlines, Hawaiian Airlines, Air Canada, Iberia, Eurowings Discover, Cathay Pacific, Air Namibia and Sabena) have supported IAGOS by carrying the measurement equipment free of charge since 1994. The data are available at http://www.iagos.fr (last access: 8 January 2025) thanks to additional support from AERIS.
This research has been supported by the Centre National d'Etudes Spatiales (IASI-Chimie grant).
This paper was edited by Lars Hoffmann and reviewed by two anonymous referees.
August, T., Klaes, D., Schlüssel, P., Hultberg, T., Crapeau, M., Arriaga, A., O'Carroll, A., Coppens, D., Munro, R., and Calbet, X.: IASI on Metop-A: Operational Level 2 retrievals after five years in orbit, J. Quant. Spectrosc. Ra., 113, 1340–1371, https://doi.org/10.1016/j.jqsrt.2012.02.028, 2012. a
Barret, B., Sauvage, B., Bennouna, Y., and Le Flochmoen, E.: Upper-tropospheric CO and O3 budget during the Asian summer monsoon, Atmos. Chem. Phys., 16, 9129–9147, https://doi.org/10.5194/acp-16-9129-2016, 2016. a
Barret, B., Gouzenes, Y., Le Flochmoen, E., and Ferrant, S.: Retrieval of Metop-A/IASI N2O Profiles and Validation with NDACC FTIR Data, Atmosphere, 12, 219, https://doi.org/10.3390/atmos12020219, 2021. a, b, c
Bencherif, H., Begue, N., Pinheiro, D. K., du Preez, D. J., Cadet, J.-M., da Silva Lopes, F. J., Shikwambana, L., Landulfo, E., Vescovini, T., Labuschagne, C., Silva, J. J., Anabor, V., Coheur, P.-F., Mbatha, N., Hadji-Lazaro, J., Sivakumar, V., and Clerbaux, C.: Investigating the Long-Range Transport of Aerosol Plumes Following the Amazon Fires (August 2019): A Multi-Instrumental Approach from Ground-Based and Satellite Observations, Remote Sens., 12, 3846, https://doi.org/10.3390/rs12223846, 2020. a
Bergamaschi, P., Hein, R., Heimann, M., and Crutzen, P.: Inverse modeling of the global CO cycle 1. Inversion of CO mixing ratios, J. Geophys. Res.-Atmos., 105, 1909–1927, https://doi.org/10.1029/1999JD900818, 2000. a
Blot, R., Nedelec, P., Boulanger, D., Wolff, P., Sauvage, B., Cousin, J.-M., Athier, G., Zahn, A., Obersteiner, F., Scharffe, D., Petetin, H., Bennouna, Y., Clark, H., and Thouret, V.: Internal consistency of the IAGOS ozone and carbon monoxide measurements for the last 25 years, Atmos. Meas. Tech., 14, 3935–3951, https://doi.org/10.5194/amt-14-3935-2021, 2021. a
Boulanger, D., Blot, R., Bundke, U., Gerbig, C., Hermann, M., Nédélec, P., Rohs, S., and Ziereis, H.: IAGOS final quality controlled Observational Data L2 – Vertical profiles, Aeris [data set], https://doi.org/10.25326/07, 2018. a
Buchholz, R., Worden, H., Park, M., Francis, G., Deeter, M., Edwards, D., Emmons, L., Gaubert, B., Gille, J., Martínez-Alonso, S., Tang, W., Kumar, R., Drummond, J., Clerbaux, C., George, M., Coheur, P.-F., Hurtmans, D., Bowman, K., Luo, M., Payne, V., Worden, J., Chin, M., Levy, R., Warner, J., Wei, Z., and Kulawik, S.: Air pollution trends measured from Terra: CO and AOD over industrial, fire-prone, and background regions, Remote Sens. Environ., 256, 112275, https://doi.org/10.1016/j.rse.2020.112275, 2021. a
Clark, H., Bennouna, Y., Tsivlidou, M., Wolff, P., Sauvage, B., Barret, B., Le Flochmoën, E., Blot, R., Boulanger, D., Cousin, J.-M., Nédélec, P., Petzold, A., and Thouret, V.: The effects of the COVID-19 lockdowns on the composition of the troposphere as seen by In-service Aircraft for a Global Observing System (IAGOS) at Frankfurt, Atmos. Chem. Phys., 21, 16237–16256, https://doi.org/10.5194/acp-21-16237-2021, 2021. a, b
Clerbaux, C., Boynard, A., Clarisse, L., George, M., Hadji-Lazaro, J., Herbin, H., Hurtmans, D., Pommier, M., Razavi, A., Turquety, S., Wespes, C., and Coheur, P.-F.: Monitoring of atmospheric composition using the thermal infrared IASI/MetOp sounder, Atmos. Chem. Phys., 9, 6041–6054, https://doi.org/10.5194/acp-9-6041-2009, 2009. a, b
Cohen, Y., Hauglustaine, D., Bellouin, N., Lund, M. T., Matthes, S., Skowron, A., Thor, R., Bundke, U., Petzold, A., Rohs, S., Thouret, V., Zahn, A., and Ziereis, H.: Multi-model assessment of climatologies in the upper troposphere–lower stratosphere using the IAGOS data, EGUsphere [preprint], https://doi.org/10.5194/egusphere-2024-2208, 2024. a
de Laat, A. T. J., Dijkstra, R., Schrijver, H., Nédélec, P., and Aben, I.: Validation of six years of SCIAMACHY carbon monoxide observations using MOZAIC CO profile measurements, Atmos. Meas. Tech., 5, 2133–2142, https://doi.org/10.5194/amt-5-2133-2012, 2012. a
De Wachter, E., Barret, B., Le Flochmoën, E., Pavelin, E., Matricardi, M., Clerbaux, C., Hadji-Lazaro, J., George, M., Hurtmans, D., Coheur, P.-F., Nedelec, P., and Cammas, J. P.: Retrieval of MetOp-A/IASI CO profiles and validation with MOZAIC data, Atmos. Meas. Tech., 5, 2843–2857, https://doi.org/10.5194/amt-5-2843-2012, 2012. a, b, c, d, e, f, g, h, i, j, k, l, m, n, o
Forster, C., Wandinger, W., Wotawa, G., James, P., Mattis, I., Althausen, D., Simmonds, P., OD́oherty, S., Jennings, S., Kleefeld, C., Schneider, J., Trickl, T., Kreipl, S., Jäger, H., and Stohl, A.: Transport of boreal forest fire emissions from Canada to Europe, J. Geophys. Res., 106, 887–906, https://doi.org/10.1029/2001JD900115, 2001. a
George, M., Clerbaux, C., Hurtmans, D., Turquety, S., Coheur, P.-F., Pommier, M., Hadji-Lazaro, J., Edwards, D. P., Worden, H., Luo, M., Rinsland, C., and McMillan, W.: Carbon monoxide distributions from the IASI/METOP mission: evaluation with other space-borne remote sensors, Atmos. Chem. Phys., 9, 8317–8330, https://doi.org/10.5194/acp-9-8317-2009, 2009. a
George, M., Clerbaux, C., Bouarar, I., Coheur, P.-F., Deeter, M. N., Edwards, D. P., Francis, G., Gille, J. C., Hadji-Lazaro, J., Hurtmans, D., Inness, A., Mao, D., and Worden, H. M.: An examination of the long-term CO records from MOPITT and IASI: comparison of retrieval methodology, Atmos. Meas. Tech., 8, 4313–4328, https://doi.org/10.5194/amt-8-4313-2015, 2015. a, b
Havemann, S.: NWPSAF 1D-Var User Manual Software Version 1.2, AS Mission Report NWPSAF-MO-UD-032, EUMETSAT Numerical Weather Prediction Satellite Applications Facility, Met Office, Exeter, UK, https://nwpsaf.eu/site/download/documentation/1dvar/nwpsaf-mo-ud-032_NWPSAF_1DVar_Manual.pdf (last access: 6 January 2024), 2020. a
Hurtmans, D., Coheur, P.-F., Wespes, C., Clarisse, L., Scharf, O., Clerbaux, C., Hadji-Lazaro, J., George, M., and Turquety, S.: FORLI radiative transfer and retrieval code for IASI, J. Quant. Spectrosc. Rad., 113, 1391–1408, https://doi.org/10.1016/j.jqsrt.2012.02.036, 2012. a, b, c
LAERO: IASI SOFRID CO, https://iasi-sofrid.sedoo.fr/ (last access: 8 January 2025), 2025. a
Langerock, B., Safieddine, S., George, M., Clerbaux, C., Hurtmans, D., Coheur, P.-F., and Astoreca, R.: IASI NRT CO AC SAF validation report, Tech. Rep. SAF/AC/LATMOS/VR/005, EUMETSAT AC SAF, 29 pp., https://acsaf.org/docs/vr/Validation_Report_IASI-C_CO_May_2021.pdf (last access: 6 January 2024), 2021. a, b
Lannuque, V., Sauvage, B., Barret, B., Clark, H., Athier, G., Boulanger, D., Cammas, J.-P., Cousin, J.-M., Fontaine, A., Le Flochmoën, E., Nédélec, P., Petetin, H., Pfaffenzeller, I., Rohs, S., Smit, H. G. J., Wolff, P., and Thouret, V.: Origins and characterization of CO and O3 in the African upper troposphere, Atmos. Chem. Phys., 21, 14535–14555, https://doi.org/10.5194/acp-21-14535-2021, 2021. a
Lelieveld, J., Gromov, S., Pozzer, A., and Taraborrelli, D.: Global tropospheric hydroxyl distribution, budget and reactivity, Atmos. Chem. Phys., 16, 12477–12493, https://doi.org/10.5194/acp-16-12477-2016, 2016. a
Livesey, N. J., Read, W. G., Wagner, P. A., Froidevaux, L., Santee, M. L., Schwartz, M. J., Lambert, A., Millán Valle, L. F., Pumphrey, H. C., Manney, G. L., Fuller, R. A., Jarnot, R. F., Knosp, B. W., and Lay, R. R.: Version 5.0x Level 2 and 3 data quality and description document, JPL D-105336 Rev. B, https://mls.jpl.nasa.gov/data/v5-0_data_quality_document.pdf (last access: 6 January 2024), 2020. a
Matricardi, M.: Technical Note: An assessment of the accuracy of the RTTOV fast radiative transfer model using IASI data, Atmos. Chem. Phys., 9, 6899–6913, https://doi.org/10.5194/acp-9-6899-2009, 2009. a
Matricardi, M., Chevallier, F., Kelly, G., and Thepaut, J. N.: An improved general fast radiative transfer model for the assimilation of radiance observations, Q. J. Roy. Meteorol. Soc., 130, 153–173, https://doi.org/10.1256/qj.02.181, 2004. a
Nedelec, P., Blot, R., Boulanger, D., Athier, G., Cousin, J.-M., Gautron, B., Petzold, A., Volz-Thomas, A., and Thouret, V.: Instrumentation on commercial aircraft for monitoring the atmospheric composition on a global scale: the IAGOS system, technical overview of ozone and carbon monoxide measurements, Tellus B, 67, 27791, https://doi.org/10.3402/tellusb.v67.27791, 2015. a, b
Pavelin, E., English, S., and Eyre, J.: The assimilation of cloud-affected infrared satellite radiances for numerical weather prediction, Q. J. Roy. Meteorol. Soc., 134, 737–749, https://doi.org/10.1002/qj.243, 2008. a
Petzold, A., Thouret, V., Gerbig, C., Zahn, A., Brenninkmeijer, C., Gallagher, M., Hermann, M., Pontaud, M., Ziereis, H., Boulanger, D., Marshall, J., Nedelec, P., Smit, H., Friess, U., Flaud, J.-M., Wahner, A., Cammas, J.-P., and A., V.-T.: Global-scale atmosphere monitoring by in-service aircraft current achievements and future prospects of the European Research Infrastructure IAGOS, Tellus B, 67, 28452, https://doi.org/10.3402/tellusb.v67.28452, 2015. a, b
Rodgers, C. D.: Inverse methods for atmospheric sounding: Theory and Practice, Series on Atmospheric, Oceanic and Planetary Physics – Vol. 2, World Scientific, Singapore, New Jersey, London, Hong Kong, 238 pp., 2000. a, b
Rothman, L., Gordon, I., Babikov, Y. et al.: The HITRAN2012 molecular spectroscopic database, J. Quant. Spectrosc. Rad., 130, 4–50, https://doi.org/10.1016/j.jqsrt.2013.07.002, 2013. a
Saunders, R., Matricardi, M., and Brunel, P.: An improved fast radiative transfer model for assimilation of satellite radiance observations, Q. J. Roy. Meteorol. Soc., 125, 1407–1425, https://doi.org/10.1002/qj.1999.49712555615, 1999. a
Schlussel, P., Hultberg, T., Phillips, P., August, T., and Calbet, X.: The operational IASI Level 2 processor, Adv. Space Res., 36, 982–988, https://doi.org/10.1016/j.asr.2005.03.008, 2005. a
Stepanov, E., Kotelnikov, S., Stavtsev, A., and Kasoev, S.: The best absorption lines for the detection of carbon monoxide at 2.35 micron with tunable diode lasers, J. Phys.: Conf. Ser., 1560, 012053, https://doi.org/10.1088/1742-6596/1560/1/012053, 2020. a
Stremme, W., Grutter, M., Rivera, C., Bezanilla, A., Garcia, A. R., Ortega, I., George, M., Clerbaux, C., Coheur, P.-F., Hurtmans, D., Hannigan, J. W., and Coffey, M. T.: Top-down estimation of carbon monoxide emissions from the Mexico Megacity based on FTIR measurements from ground and space, Environ. Sci. Technol., 13, 1357–1376, https://doi.org/10.5194/acp-13-1357-2013, 2013. a
Taylor, K. E.: Summarizing multiple aspects of model performance in a single diagram, J. Geophys. Res.-Atmos., 106, 7183–7192, https://doi.org/10.1029/2000jd900719, 2001. a
Thouret, V., Cammas, J.-P., Sauvage, B., Athier, G., Zbinden, R., Nédélec, P., Simon, P., and Karcher, F.: Tropopause referenced ozone climatology and inter-annual variability (1994–2003) from the MOZAIC programme, Atmos. Chem. Phys., 6, 1033–1051, https://doi.org/10.5194/acp-6-1033-2006, 2006. a
Tsivlidou, M., Sauvage, B., Bennouna, Y., Blot, R., Boulanger, D., Clark, H., Le Flochmoën, E., Nédélec, P., Thouret, V., Wolff, P., and Barret, B.: Tropical tropospheric ozone and carbon monoxide distributions: characteristics, origins, and control factors, as seen by IAGOS and IASI, Atmos. Chem. Phys., 23, 14039–14063, https://doi.org/10.5194/acp-23-14039-2023, 2023. a, b
Turquety, S., Menut, L., Siour, G., Mailler, S., Hadji-Lazaro, J., George, M., Clerbaux, C., Hurtmans, D., and Coheur, P.-F.: APIFLAME v2.0 biomass burning emissions model: impact of refined input parameters on atmospheric concentration in Portugal in summer 2016, Geosci. Model Dev., 13, 2981–3009, https://doi.org/10.5194/gmd-13-2981-2020, 2020. a
ULB-LATMOS: IASI/METOPA ULB-LATMOS carbon monoxide (CO) L2 products (profiles of partial columns and total columns), EUMESAT [data set], https://navigator.eumetsat.int/product/EO:EUM:DAT:METOP:IASIL2COX (last access: 6 January 2025), 2017. a
Van Damme, M., Whitburn, S., Clarisse, L., Clerbaux, C., Hurtmans, D., and Coheur, P.-F.: Version 2 of the IASI NH3 neural network retrieval algorithm: near-real-time and reanalysed datasets, Atmos. Meas. Tech., 10, 4905–4914, https://doi.org/10.5194/amt-10-4905-2017, 2017. a, b
Yarragunta, Y., Srivastava, S., Mitra, D., Le Flochmoen, E., Barret, B., Kumar, P., and Chandola, H. C.: Source attribution of carbon monoxide and ozone over the Indian subcontinent using MOZART-4 chemistry transport model, Atmos. Res., 227, 165–177, https://doi.org/10.1016/j.atmosres.2019.04.019, 2019. a
Zhou, M., Jiang, J., Langerock, B., Dils, B., Sha, M. K., and de Mazière, M.: Change of CO Concentration Due to the COVID-19 Lockdown in China Observed by Surface and Satellite Observations, Remote Sens., 13, 1129, https://doi.org/10.3390/rs13061129, 2021. a


