the Creative Commons Attribution 4.0 License.
the Creative Commons Attribution 4.0 License.
 | 24 Mar 2025
Research on atmospheric temperature fine measurements from the near surface to 60 km altitude based on an integrated lidar system
Zhangjun Wang
Tiantian Guo
Xianxin Li
Chao Chen
Dong Liu
Luoyuan Qu
Hui Li
Xiufen Wang
Accurate measurement of atmospheric temperature profiles from the surface to the stratosphere is crucial for understanding atmospheric dynamics and climate processes. Traditional methods, such as the use of radiosondes, are limited in spatial and temporal coverage. To address this challenge, a dual-field, integrated lidar system was developed based on the principles of pure rotational Raman scattering and Rayleigh scattering principles to precisely detect atmospheric temperatures in both the troposphere and stratosphere from the near surface to 60 km altitude. The system utilized a 532 nm pulsed laser with 200 mJ and 50 Hz, utilizing a dual-field-of-view (DFOV) setup to receive atmospheric backscatter signals. Pure rotational Raman signals from 5–30 km and Rayleigh signals from 30–60 km are collected using a 800 mm aperture telescope, while a smaller 200 mm aperture telescope receives pure rotational Raman signals below 5 km. By combining these signals, the system derives continuous temperature profiles from the surface to 60 km using a single lidar system. The observed temperature data were compared with simultaneous radiosonde and atmospheric model data. Below 16 km, the lidar-derived temperatures exhibited strong agreement with radiosonde data, with a correlation coefficient of 0.95 and a root-mean-square error (RMSE) of 3.2 K. Between 30 and 60 km, lidar-derived temperatures were also in strong agreement with model data, achieving a correlation coefficient of 0.88. These continuous temperature profiles will support the study of fluctuation phenomena in the middle and upper atmosphere, particularly when integrated with high-altitude observations from sodium fluorescence Doppler lidar operating at 80–105 km in future studies. This integrated lidar system serves as a critical tool for achieving continuous atmospheric measurement across multiple layers, contributing significantly to atmospheric science and remote sensing applications.
- Article
(4209 KB) - Full-text XML
- BibTeX
- EndNote


Atmospheric temperature is one of the most important parameters of the Earth's climate system, and its vertical structure is very important to understand the change of global weather, climate, atmospheric circulation and space environment (Tamarin-Brodsky et al., 2019). The dynamic change process in the Earth's atmosphere, such as the formation and propagation of atmospheric waves, covers multiple layers of atmosphere and affects the change of atmospheric temperature directly (Lindzen, 1990). Therefore, the detection of atmospheric temperature is important for the study of atmospheric science. At present, sounding balloons, rockets and meteorological satellites can be used for the atmospheric temperature detection. These methods have problems such as poor data continuity and low spatial and temporal resolution (Gong et al., 2023a). As an active remote sensing method, light detection and ranging systems (lidars) use the laser beam to interact with molecules or other substances in the atmosphere to obtain the atmospheric temperature profiles with the advantages of real-time online detection, high sensitivity, and high spatial and temporal resolution (Tian et al., 2018).
Lidar commonly used for atmospheric temperature detection mainly includes resonance fluorescence lidar, Rayleigh scattering lidar and pure rotational Raman scattering lidar. Resonance fluorescence lidar uses the resonance fluorescence effect of metal particles and is commonly used to detect atmospheric temperatures between 80 and 110 km. In the early 1990s, the Gardner research group at the University of Illinois and the She research group at Colorado State University jointly built the first narrow-linewidth sodium fluorescence lidar for measuring atmospheric temperature (She and Yu, 1994; Chu et al., 2000). In China, Gong et al. (1997) developed a sodium fluorescent lidar in 1996. Rayleigh scattering lidar can be used to detect 30–80 km atmospheric temperature (Hauchecorne and Chanin, 1980; Wu et al., 2000; Chen and Yi, 2003). Tan et al. (2023) developed a new Rayleigh Doppler lidar based on iodine molecular absorption cell to achieve temperature measurement with high spatiotemporal resolution in the altitude range of 30–70 km. Pure rotational Raman scattering lidar is commonly used to detect 0–30 km atmospheric temperatures (Liu et al., 2019; Arshinov et al., 1983, 2005; Behrendt and Reichardt, 2000). Yang et al. (2024) used side-scanning rotational Raman scattering lidar technology to realize the free blind zone detection of atmospheric temperature.
In order to detect the atmospheric temperature from the troposphere to the stratosphere simultaneously, the combination of multiple lidar systems is commonly used. In Germany in 2004, Alpers et al. (2004) used two lidar systems to combine pure rotational Raman, Rayleigh and potassium resonance lidar technologies for the first time to detect 1–105 km atmospheric temperature (Alpers et al., 2004). Achtert et al. (2013) developed a pure rotational Raman scattering channel on Rayleigh lidar to realize atmospheric temperature detection in the altitude range of 5–75 km. Li et al. (2017) combined Rayleigh and pure rotational Raman lidar to detect 5–80 km atmospheric temperature over Wuhan.
In this paper, we introduce a novel dual-field pure rotational Raman–Rayleigh scattering lidar system to detect atmospheric temperatures from the troposphere to the stratosphere. This integrated lidar system facilitates continuous temperature measurements from the near surface to 60 km, leveraging its large detection range and high system integration for enhanced performance. In this paper, the system structure and measuring principle of the lidar system are described in detail, and the field observation experiment carried out in Qingdao area is reported. The observation results are compared with sounding balloon and atmospheric model data to verify the reliability and stability of the lidar system. This comparison will serve to validate the reliability and stability of the lidar system, confirming its effectiveness as a tool for atmospheric temperature monitoring. The results will demonstrate the potential of this advanced lidar technology to contribute significantly to our understanding of atmospheric dynamics and enhance predictive models in climate science. By bridging the gap between different atmospheric layers, this system paves the way for more comprehensive studies of temperature profiles and their implications for weather forecasting and climate change research.
Figure 1 shows the structure of the dual-field pure rotational Raman–Rayleigh temperature lidar system, which is mainly composed of three subsystems: the transmitting subsystem, receiving subsystem, and data acquisition and data control subsystem. The transmitting subsystem emits 532 nm pulsed laser into the atmosphere through a reflector mirror. The laser serves as the light source, providing the pulsed laser necessary for the lidar measurements. The receiving subsystem uses two telescopes to collect the atmospheric backscatter signals:
- (1)
A 200 mm telescope is used to receive low-altitude atmospheric pure rotational Raman backscattered signals from the troposphere.
- (2)
An 800 mm telescope is employed to receive high-altitude atmospheric pure rotational Raman and Rayleigh backscattered signals from the stratosphere.
The backscattered light received by the telescopes is coupled into the optical receiving unit through optical fiber. The light signals are then extracted into the specific wavelength signals required for temperature retrieval in the optical receiving unit. The optical signals are converted into electrical signals by photomultiplier tubes (PMTs) in the relative channels. Finally, the electrical signals are collected and stored in a computer by the data acquisition and control system. This subsystem manages the overall operation of the lidar system, ensuring synchronization between the transmitting and receiving components.
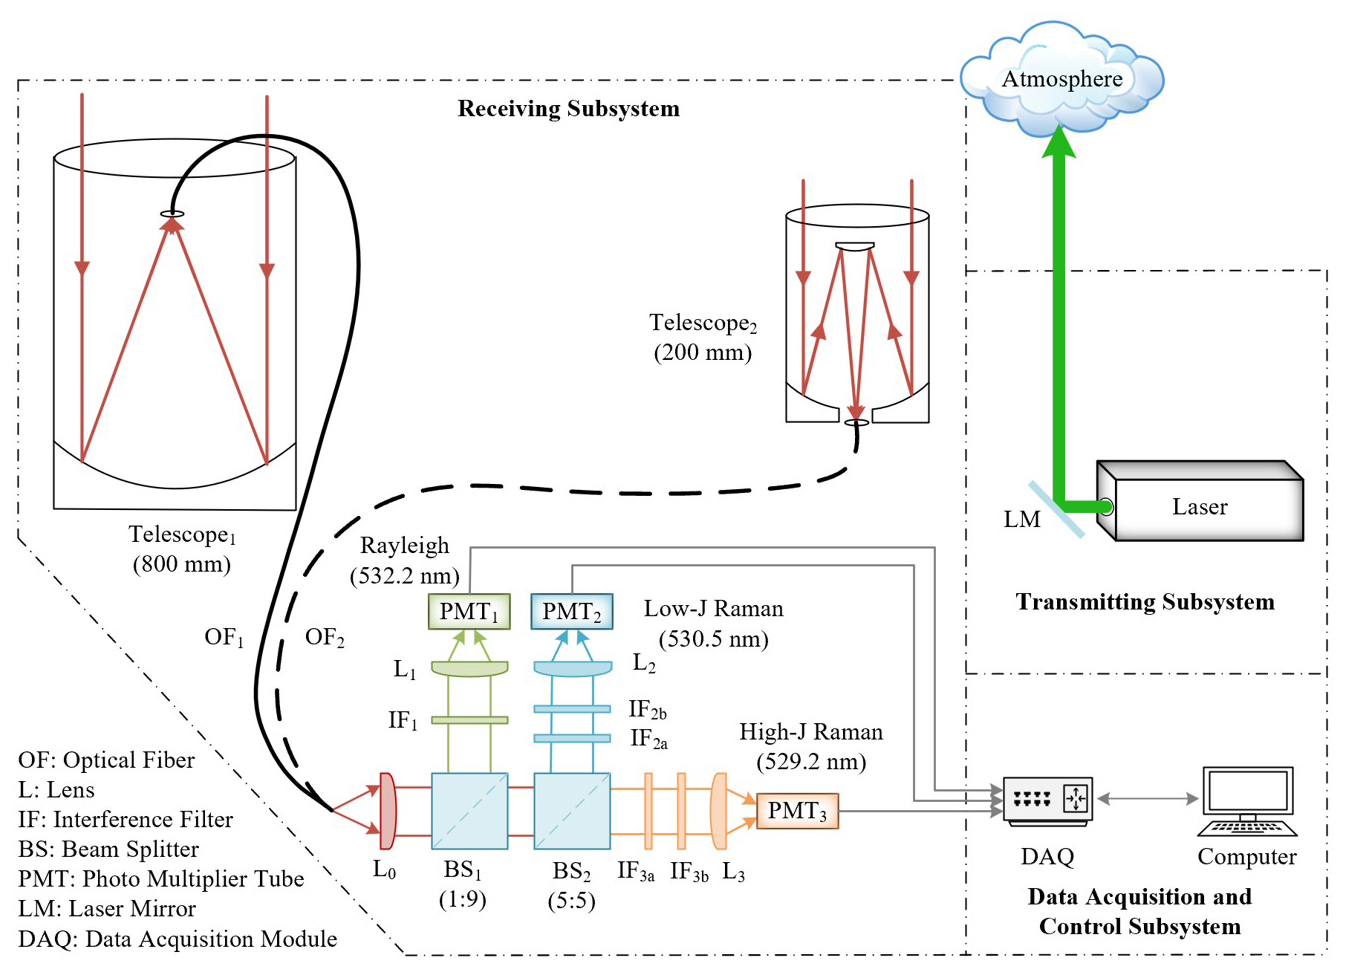
Figure 1The schematic diagram of the dual-field-of-view (DFOV) pure rotational Raman–Rayleigh scattering lidar.
The integration of these three subsystems allows the dual-field pure rotational Raman–Rayleigh temperature lidar system to measure atmospheric temperatures from the near surface to the stratosphere with high spatial and temporal resolution. The use of two telescopes with different apertures enables the efficient collection of backscattered signals across a wide altitude range, while the data acquisition and control subsystem ensure the reliable processing and storage of the measured data for further analysis.
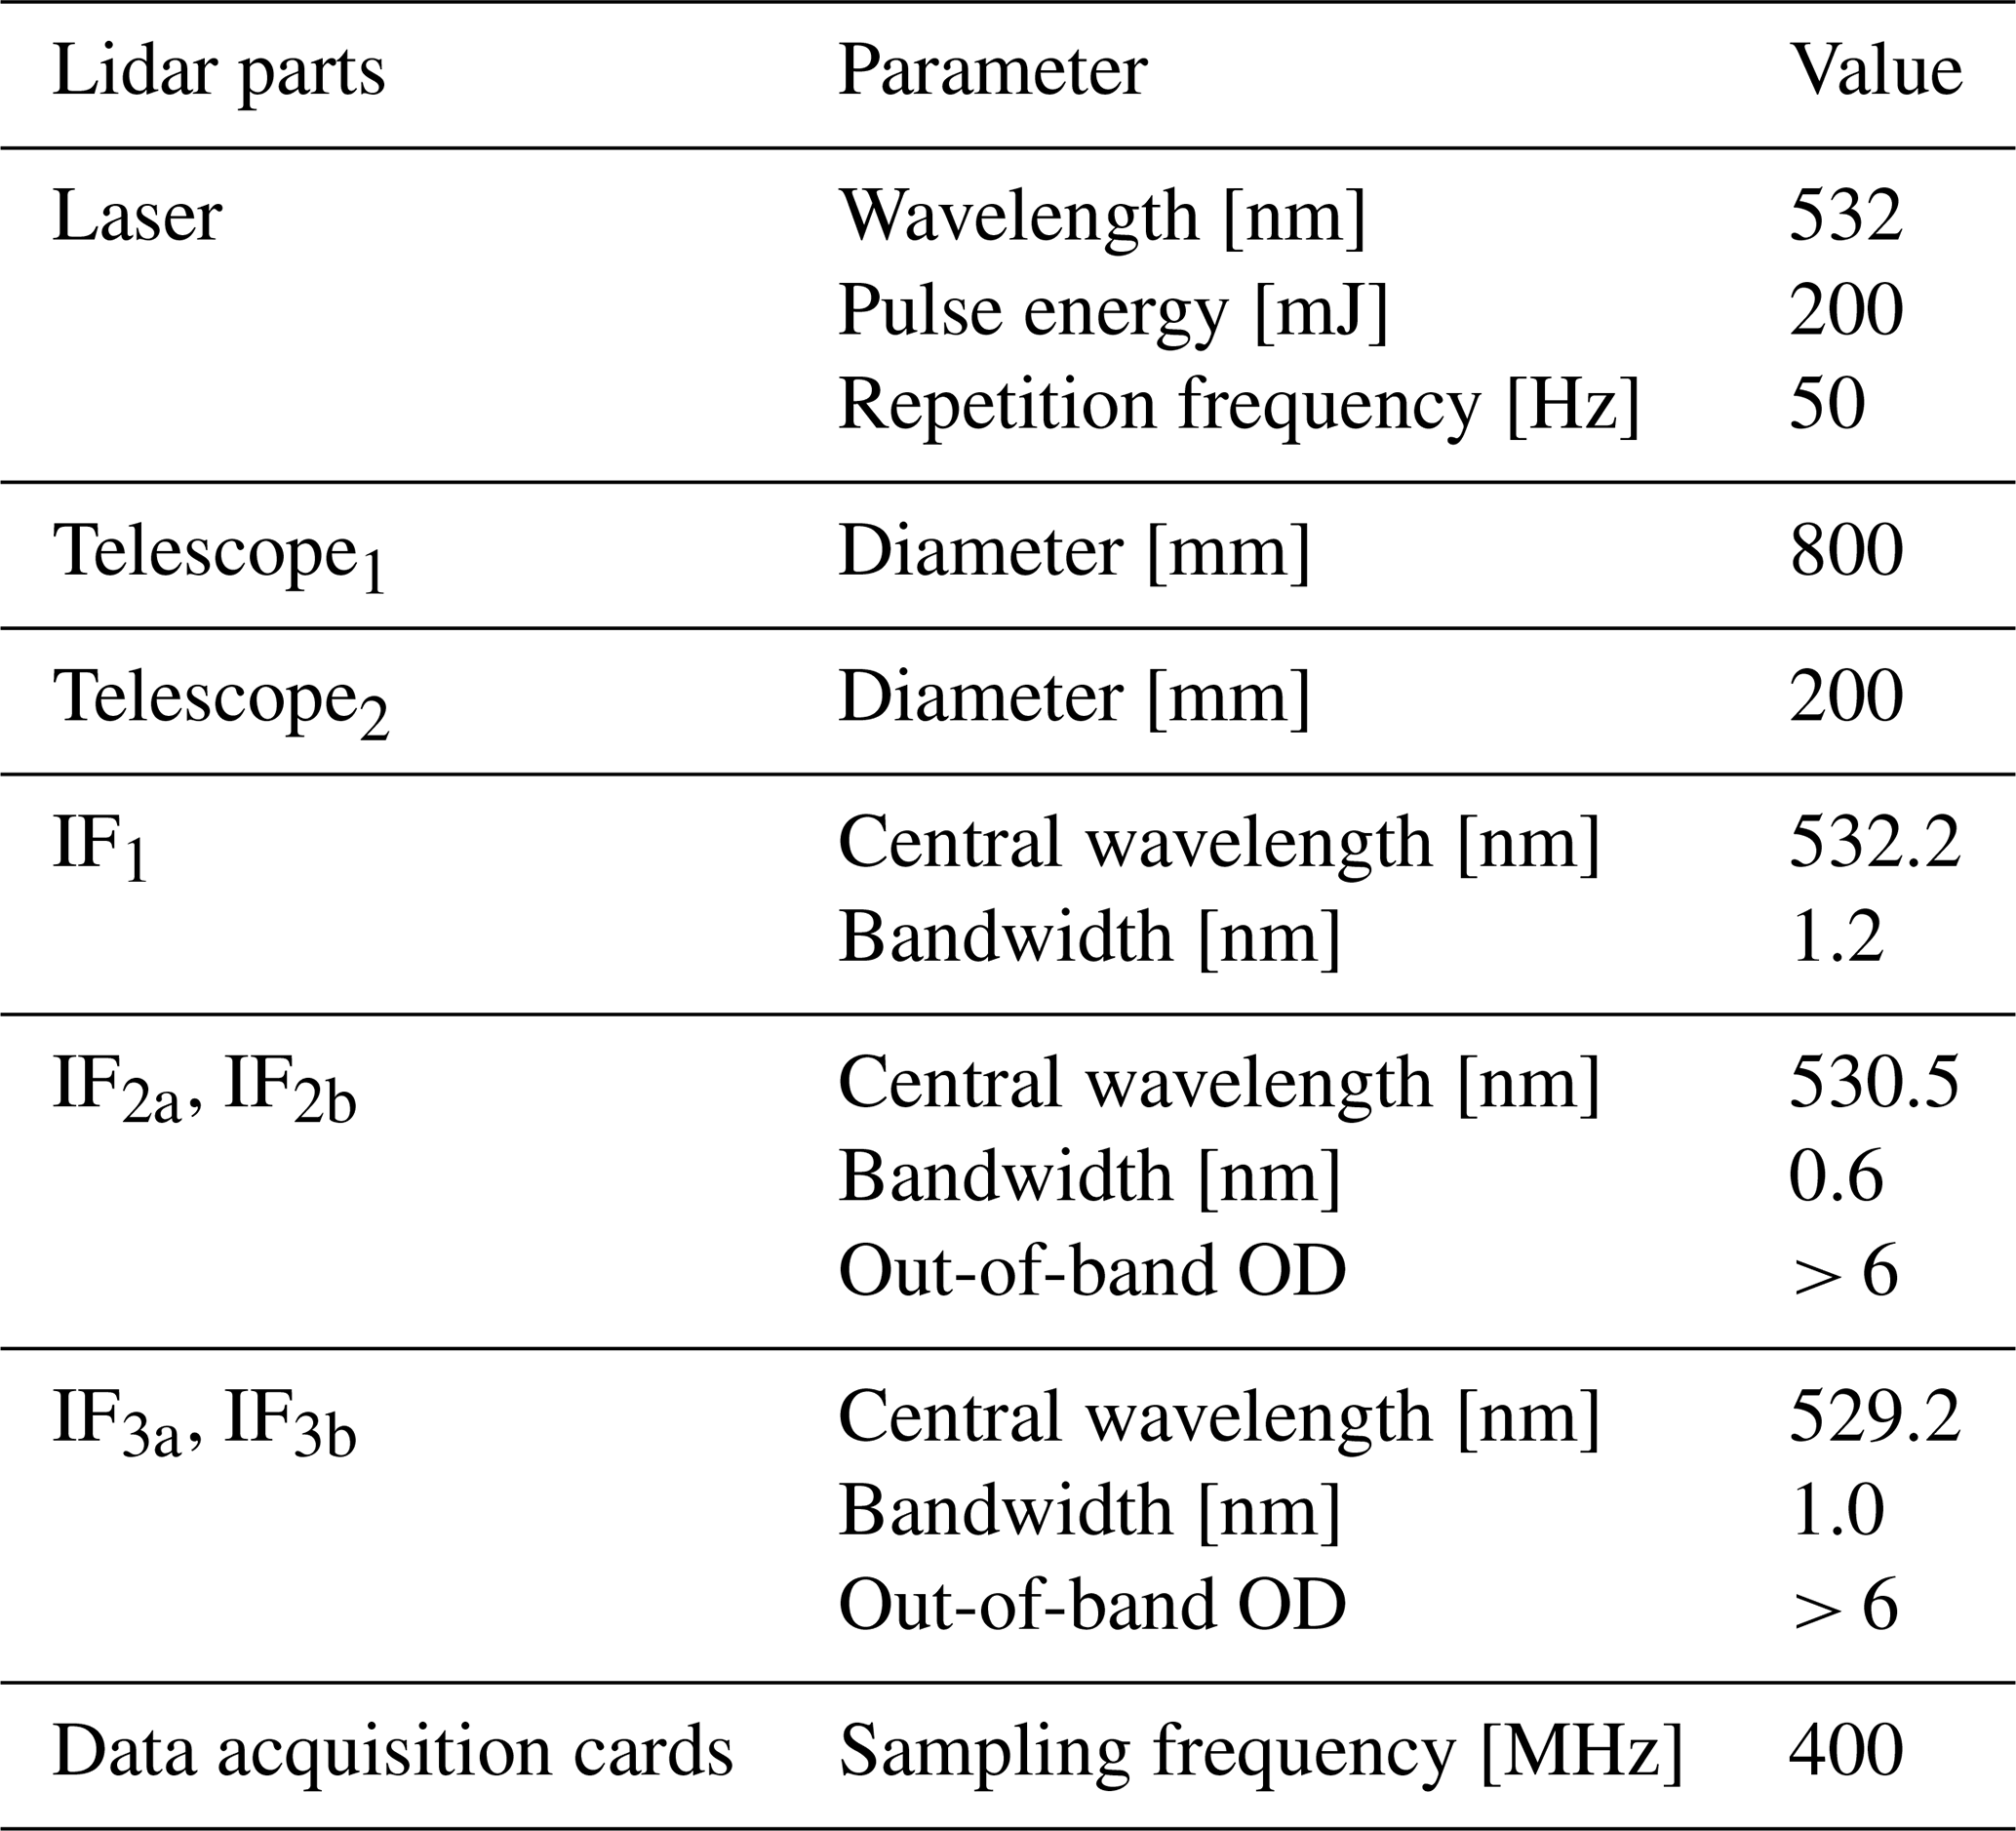
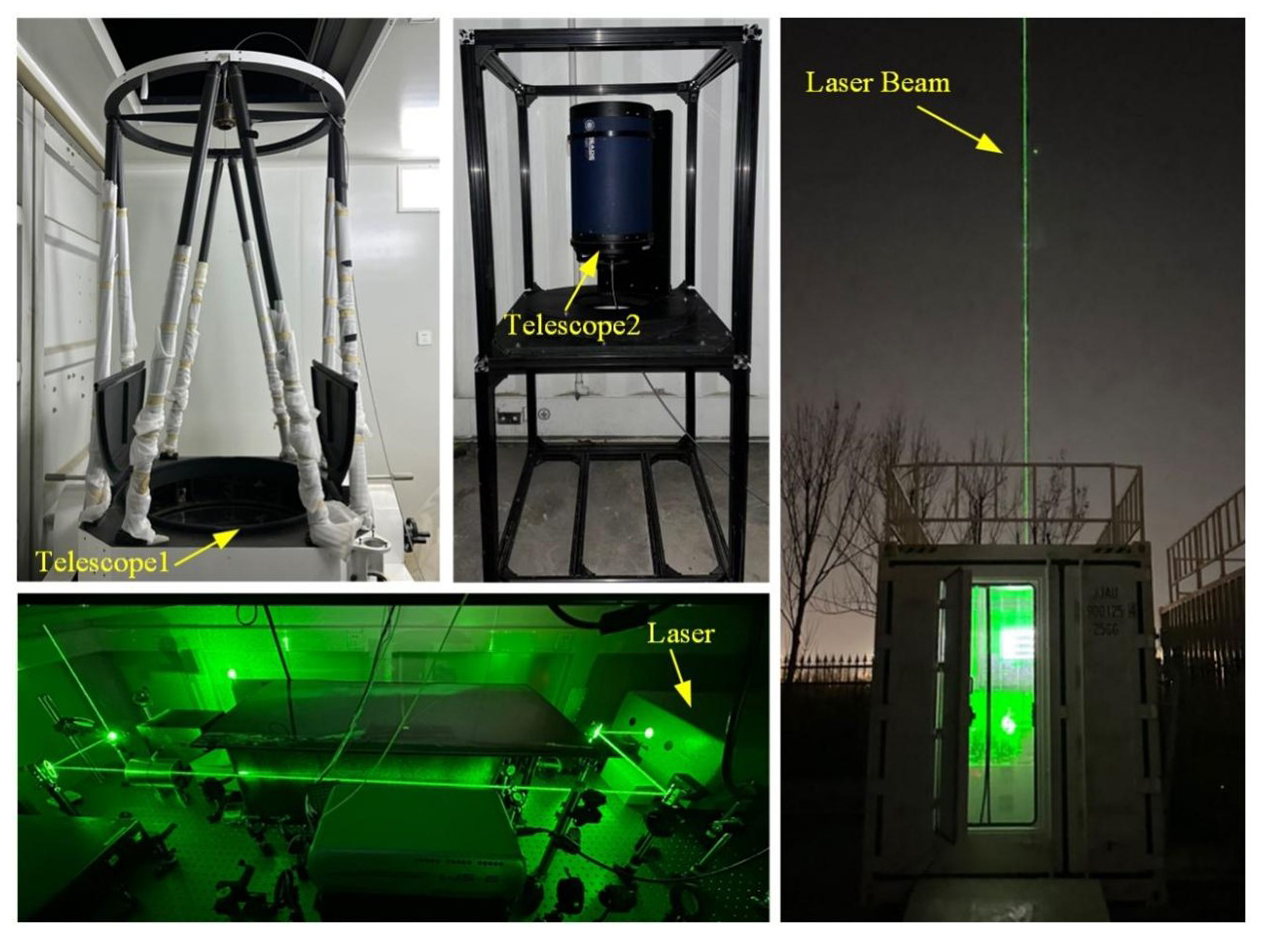
To enable the simultaneous detection of pure rotational Raman and Rayleigh signals, the optical receiving unit is designed with three distinct detection channels: the Rayleigh channel, the low quantum number rotational Raman channel and the high quantum number rotational Raman channel. As shown in Fig. 1, the optical signals transmitted by optical fibers are first collimated using lens L0. These signals are then directed to two unpolarized beam splitters, BS1 and BS2, which have reflection-to-transmission ratios of 1:9 and 5:5, respectively. Following this initial splitting, specific wavelength signals are selected using various interference filters for each channel. The Rayleigh channel is composed of an interference filter (IF1), a focusing lens (L1) and a photomultiplier (PMT1) for signal detection. The low quantum number rotational Raman channel consists of two interference filters (IF2a and IF2b), a focusing lens (L2) and a photomultiplier (PMT2). Similarly, the high quantum number rotational Raman channel is equipped with interference filters (IF3a and IF3b), a focusing lens (L3) and a photomultiplier (PMT3). In the pure rotational Raman channel, two interference filters are cascaded together to suppress the atmospheric elastic scattering signal, enhancing the clarity and accuracy of the detected Raman signals. The technical specifications of the lidar system including key parameters and performance matrices are summarized in Table 1, while the experimental system is shown in Fig. 2. This multi-channel approach allows for the comprehensive analysis of both Raman and Rayleigh scattering signals, facilitating advanced research in atmospheric studies and enhancing the overall capabilities of the lidar system.
Table 1The primary technical parameters of the DFOV pure rotational Raman–Rayleigh scattering lidar system. OD: optical density.
In this paper, we employ the pure rotational Raman temperature measurement method to retrieve data from the Raman channel, allowing us to obtain atmospheric temperature profiles from the near surface up to 30 km (Mahagammulla Gamage et al., 2019; Martucci et al., 2021). The radiosonde data used in this paper for the pure rotational Raman temperature calibration are sourced from Wyoming Weather Web (2024) station 54857 (Qingdao Station; 36.07° N, 120.33° E). The experimental observation site was located in Qingdao (36.13° N, 120.10° E), with a linear distance of about 20 km away from the radiosonde location. Figure 3 shows the temperature measurement principle of the pure rotational Raman lidar system. It depicts the intensity distribution of pure rotational anti-Stokes Raman spectrum lines generated by the interaction between molecules and the laser in the atmosphere under a 532.2 nm laser wavelength and 200 and 300 K temperature for each interference filter. The areas identified by IF2 and IF3 in the figure are two distinct temperature-sensitive areas, critical for accurate temperature retrieval (Gao et al., 2019). This methodology not only enhances our understanding of atmospheric temperature profiles but also demonstrates the effectiveness of using pure rotational Raman techniques in conjunction with radiosonde data for calibration.
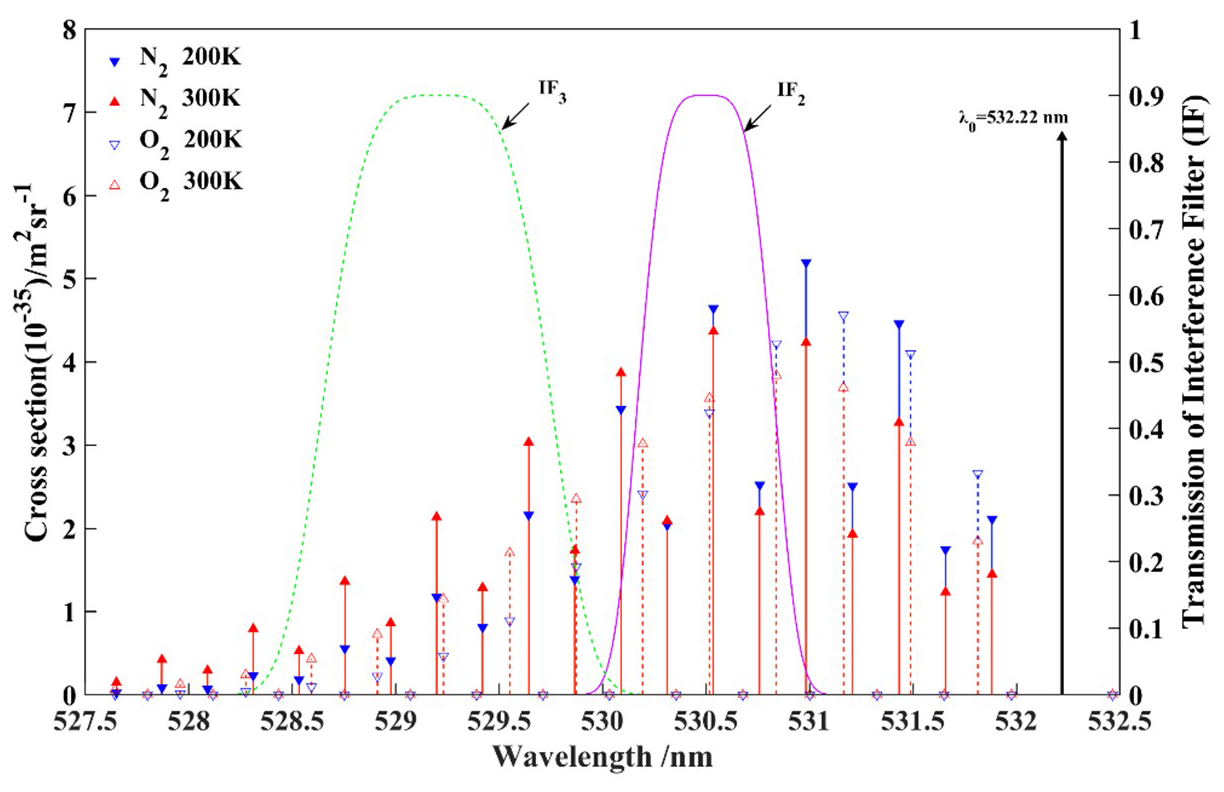
Figure 3Principle of temperature measurement based on pure rotational Raman scattering lidar (the IF2 and IF3 select two opposite temperature-sensitive zones, respectively).
The 30–60 km atmospheric temperature can be retrieved from the Rayleigh channel data by the Rayleigh integral method. The Rayleigh integral method needs the temperature and density at the reference altitude to do the normalization (Chen and Yi, 2003). The reference value required in this paper comes from the NRLMSISE-00 atmospheric model, which is one of the atmospheric empirical models widely used in the lidar detection field and can be used as the criterion for normalization and error correction (Gong et al., 2023b).
On 10 March 2024, the 200 mm telescope was used to receive low-altitude atmospheric pure rotational Raman signals during the observation period of 01:00–01:30 LT. The signals collected by the two rotational Raman channels were analyzed and processed separately. The raw data had a time resolution of 5 min and a spatial resolution of 45 m. In the data processing stage, the temporal and spatial resolutions were set to 30 min and 500 m, respectively. This allowed for the retrieval of the atmospheric temperature profile from the near surface up to 5 km, which was then compared with the radiosonde data, as shown in Fig. 4.
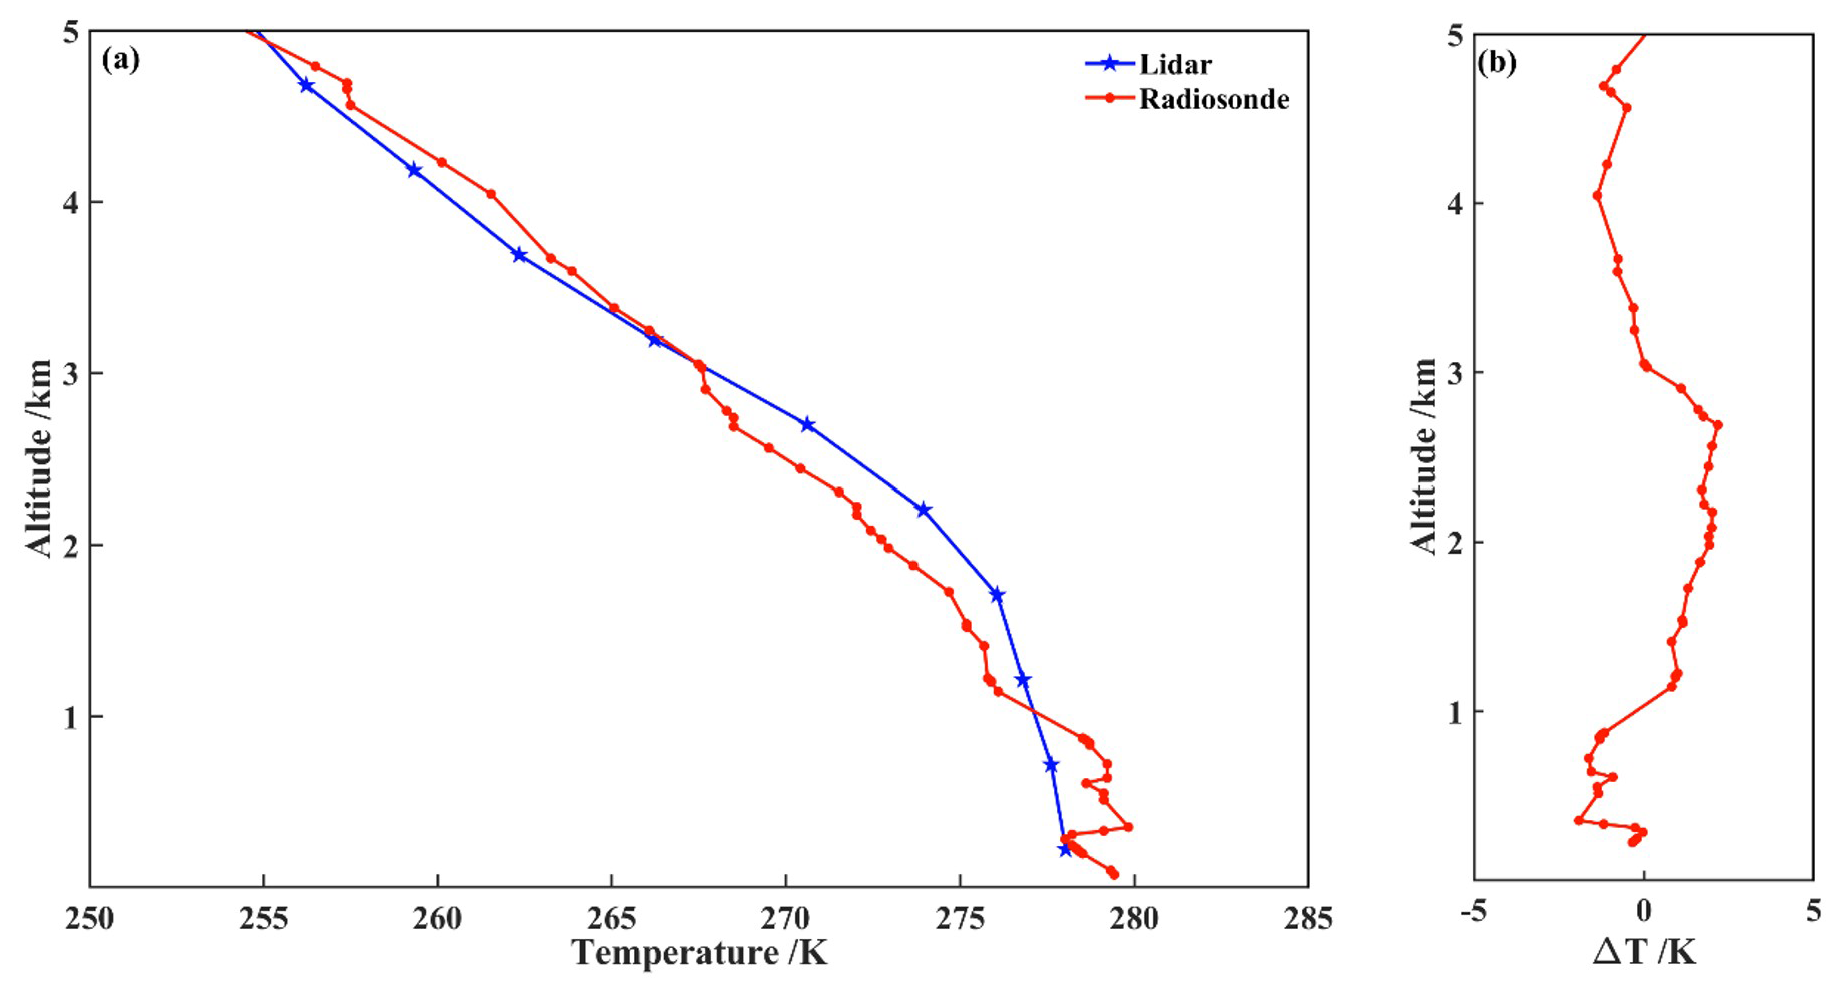
Figure 4The atmospheric temperature measurements result from the surface to 5 km altitude. (a) Comparison between lidar and radiosonde. (b) Deviation profile.
Figure 4a presents the comparison of temperature profiles between the lidar and radiosonde data. The line with stars represents the atmospheric temperature profile retrieved from the low-altitude pure rotational Raman lidar signals, ranging from the near surface to 5 km. The dotted line shows the atmospheric temperature profile detected by the radiosonde at 19:15 LT on 9 March 2024. It can be observed from the figure that the retrieved atmospheric temperature profile agrees well with the radiosonde temperature profile. Figure 4b shows the deviation of temperature between lidar and radiosonde measurements. The maximum deviation is ± 2.18 K, and the root-mean-square error (RMSE) is 1.27 K. This close agreement between the lidar and radiosonde data validates the accuracy of the near-surface temperature measurements obtained by the pure rotational Raman lidar system.
On 10 March 2024, during the observation period from 00:30 to 01:00 LT, the 800 mm telescope was used to receive the 5–30 km atmospheric Raman signals. The raw data collected by the two Raman channels were processed with a time resolution of 30 min and a spatial resolution of 500 m. The retrieved temperature data by lidar were compared with the radiosonde data, as shown in Fig. 5. This comparison between the lidar and radiosonde temperature profiles in the altitude range of 5–30 km further validates the performance of the integrated lidar system in accurately measuring atmospheric temperatures across a wide range of altitudes. The consistency between the lidar and radiosonde measurements demonstrates the reliability and potential of this dual-field, integrated lidar system for continuous monitoring of atmospheric temperature profiles from the surface to the stratosphere.
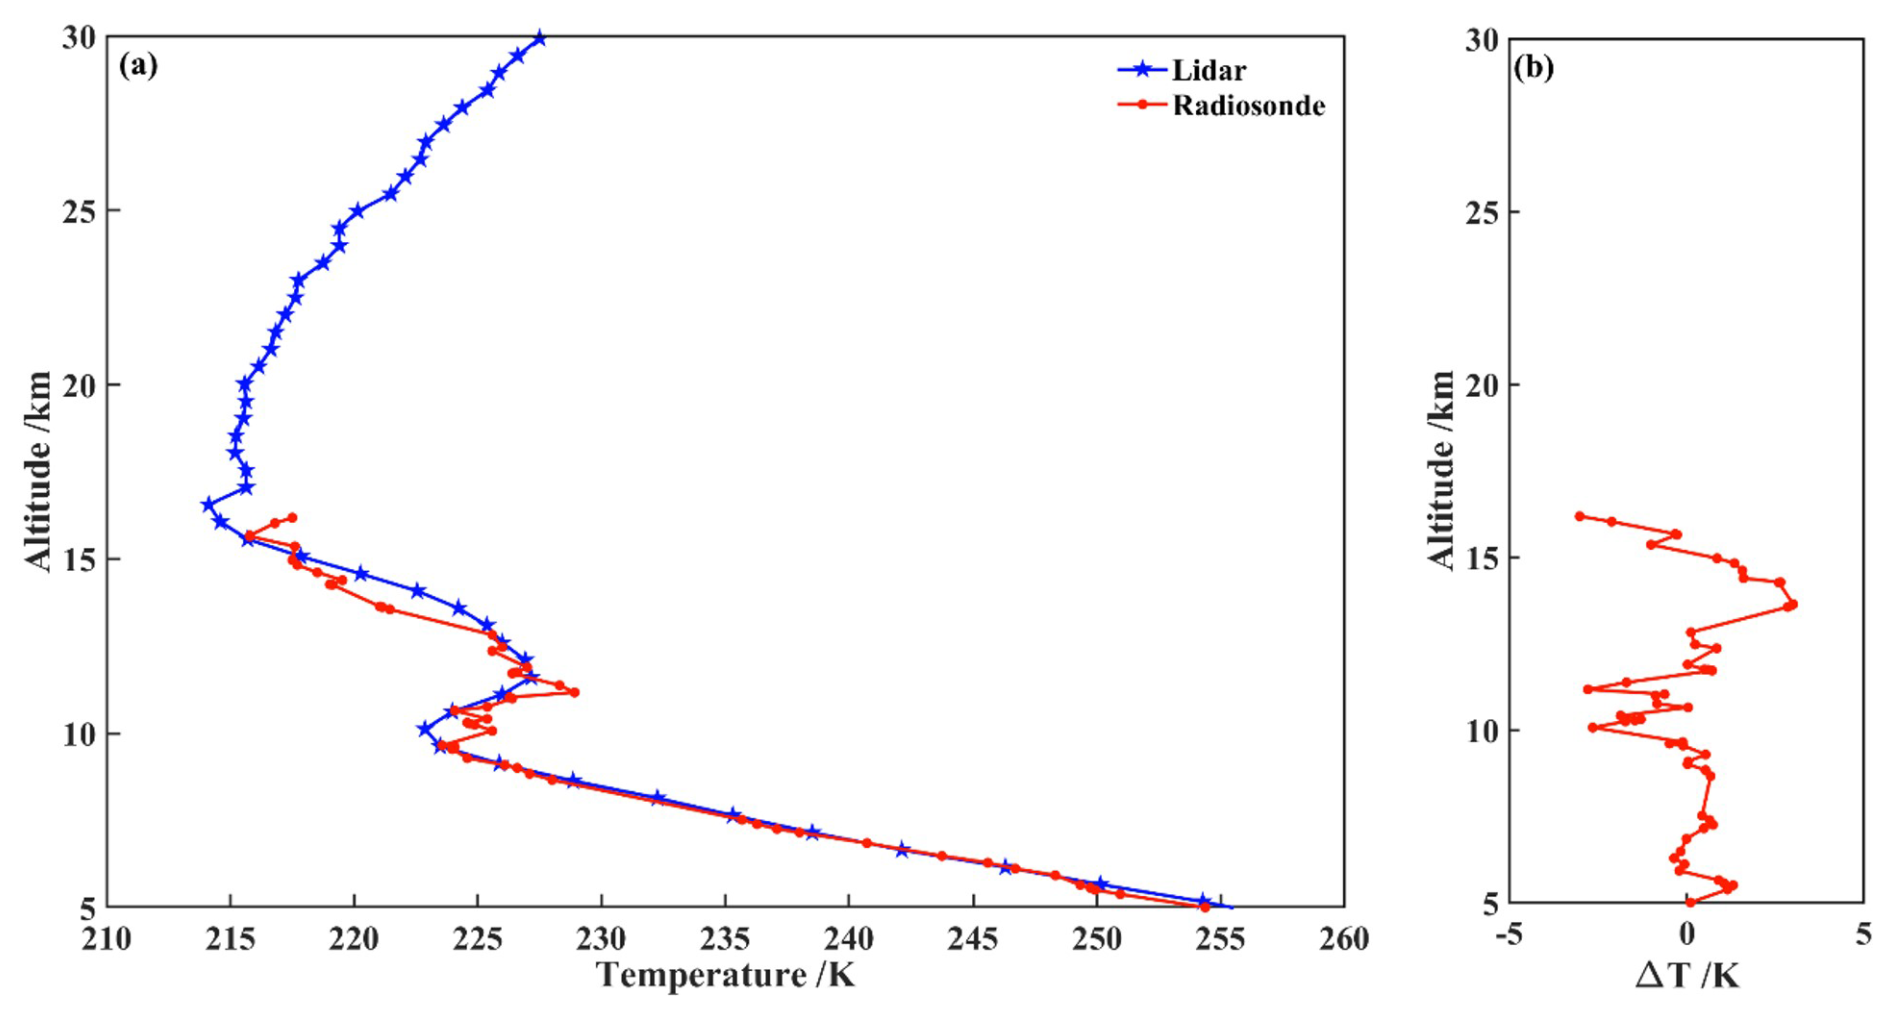
Figure 5The results of atmospheric temperature measurements from 5 to 30 km altitude (10 March 2024 00:30–01:00 LT). (a) Comparison between lidar and radiosonde. (b) Deviation profile.
In Fig. 5a, the line with stars represents the atmospheric temperature profile detected by the pure rotating Raman channel, while the dotted line indicates the atmospheric temperature profile recorded by the radiosonde at 19:15 LT on 9 March 2024. The figure clearly shows a strong correlation between the lidar temperature profile and radiosonde data, indicating that the lidar system is capable of accurately capturing atmospheric temperature variations. The temperature profile from 5 to 30 km exhibits a distinct pattern: the atmospheric temperature initially decreases with altitude, reaching a minimum at 17 km, which corresponds to the tropopause. This layer marks the boundary between the troposphere and stratosphere, where temperature typically stabilizes or begins to increase. Notably, an atmospheric temperature inversion is observed between 10 and 15 km, where temperatures rise with altitude, contrasting with the typical lapse rate found in the lower troposphere. Figure 5b illustrates the deviation between the lidar-derived temperature and the radiosonde measurements. The analysis shows that the maximum deviation in atmospheric temperature between lidar and radiosonde data is within ± 3.0 K for altitudes below 16 km. This level of agreement further underscores the reliability of the lidar system in measuring atmospheric temperatures, reinforcing its potential as a valuable tool for atmospheric research and monitoring. The consistent performance of the lidar across different altitude ranges highlights its capability to provide detailed insights into atmospheric dynamics and temperature profiles.
On 10 March 2024, during the observation period from 00:30 to 01:00 LT, the 800 mm aperture telescope was used to receive the backscattered upper atmospheric Rayleigh signals. The raw lidar signals collected by the Rayleigh channel were processed with a time resolution of 30 min and a spatial resolution of 500 m. Utilizing the Rayleigh integral technique, atmospheric temperature profiles from 30 to 60 km were retrieved. The lidar retrieval results were then compared with data from the NRLMSISE-00 atmospheric model, as shown in Fig. 6.
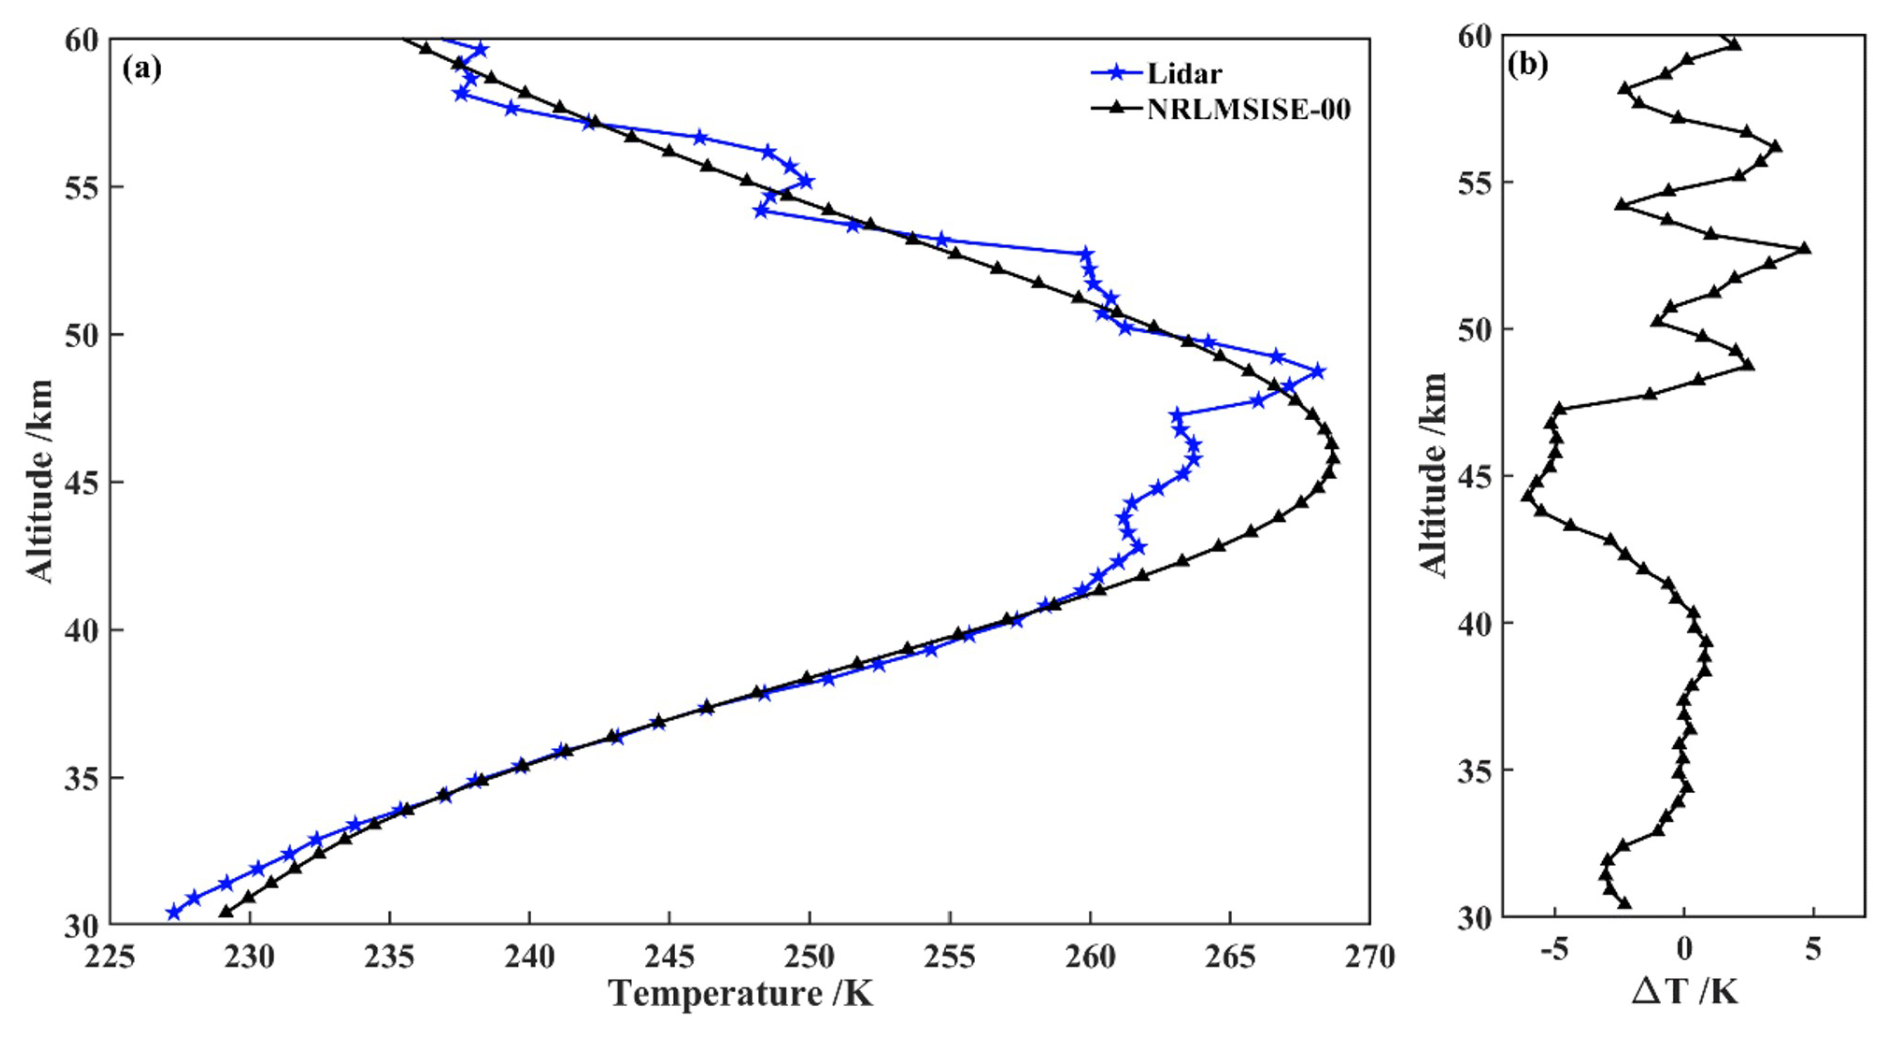
Figure 6The results of atmospheric temperature measurements from 30 to 60 km altitude (10 March 2024 00:30–01:00 LT). (a) Comparison between lidar and model. (b) Deviation profile.
Figure 6a presents a comparison between the atmospheric temperature measured by lidar and the corresponding values from the NRLMSISE-00 model. The line with stars represents the atmospheric temperature profile detected by the Rayleigh scattering channel within the 30–60 km altitude range, while the line with triangles indicates the temperature profile from the NRLMSISE-00 model at the same time. It shows that the retrieved atmospheric temperature profile is in good agreement with the atmospheric model profile. Notably, the temperature profile shows an initial increase followed by a decrease as the altitude increases from 30 to 60 km. The maximum temperature recorded by the lidar was 268 K at 49 km, which corresponds to the stratopause. In contrast, the model predicts the stratopause at a slightly lower altitude of 46 km with a temperature of 269 K. This indicates that the lidar measurements suggest the stratopause is approximately 3 km higher than the model's prediction. Figure 6b shows the deviation between the atmospheric temperature measured by lidar and that predicted by the NRLMSISE-00 model. The deviation values remain within ± 6.0 K, further validating the accuracy of the lidar system in measuring atmospheric temperatures in the upper altitudes. These results underscore the effectiveness of the integrated lidar system in providing reliable temperature profiles in the upper atmosphere, contributing valuable data for atmospheric research and enhancing our understanding of temperature dynamics in this critical region. The agreement between lidar measurements and model data also highlights the potential for using this lidar system in future studies aimed at monitoring atmospheric changes and improving atmospheric models.
In Fig. 7a, a correlation analysis is conducted between the lidar temperature data and the corresponding radiosonde data from the near surface up to 16 km. The results of this analysis reveal a strong correlation between the lidar and radiosonde data, with a correlation coefficient of 0.95 and RMSE of 3.2 K. This high degree of correlation underscores the reliability of the lidar system in accurately measuring atmospheric temperatures at lower altitudes. Figure 7b presents a similar correlation analysis, this time comparing the lidar temperature data with model data for altitudes ranging from 30 to 60 km. The analysis indicates a good correlation between the data retrieved by lidar and NRLMSISE-00 model temperature with the correlation coefficient of 0.88 and RMSE of 7.0 K. These results further validate the effectiveness of the lidar system in measuring atmospheric temperatures in the upper altitudes. The results confirm the accuracy and feasibility of atmospheric temperature measurements obtained through both the pure rotational Raman channels and the Rayleigh scattering channel of the lidar system.
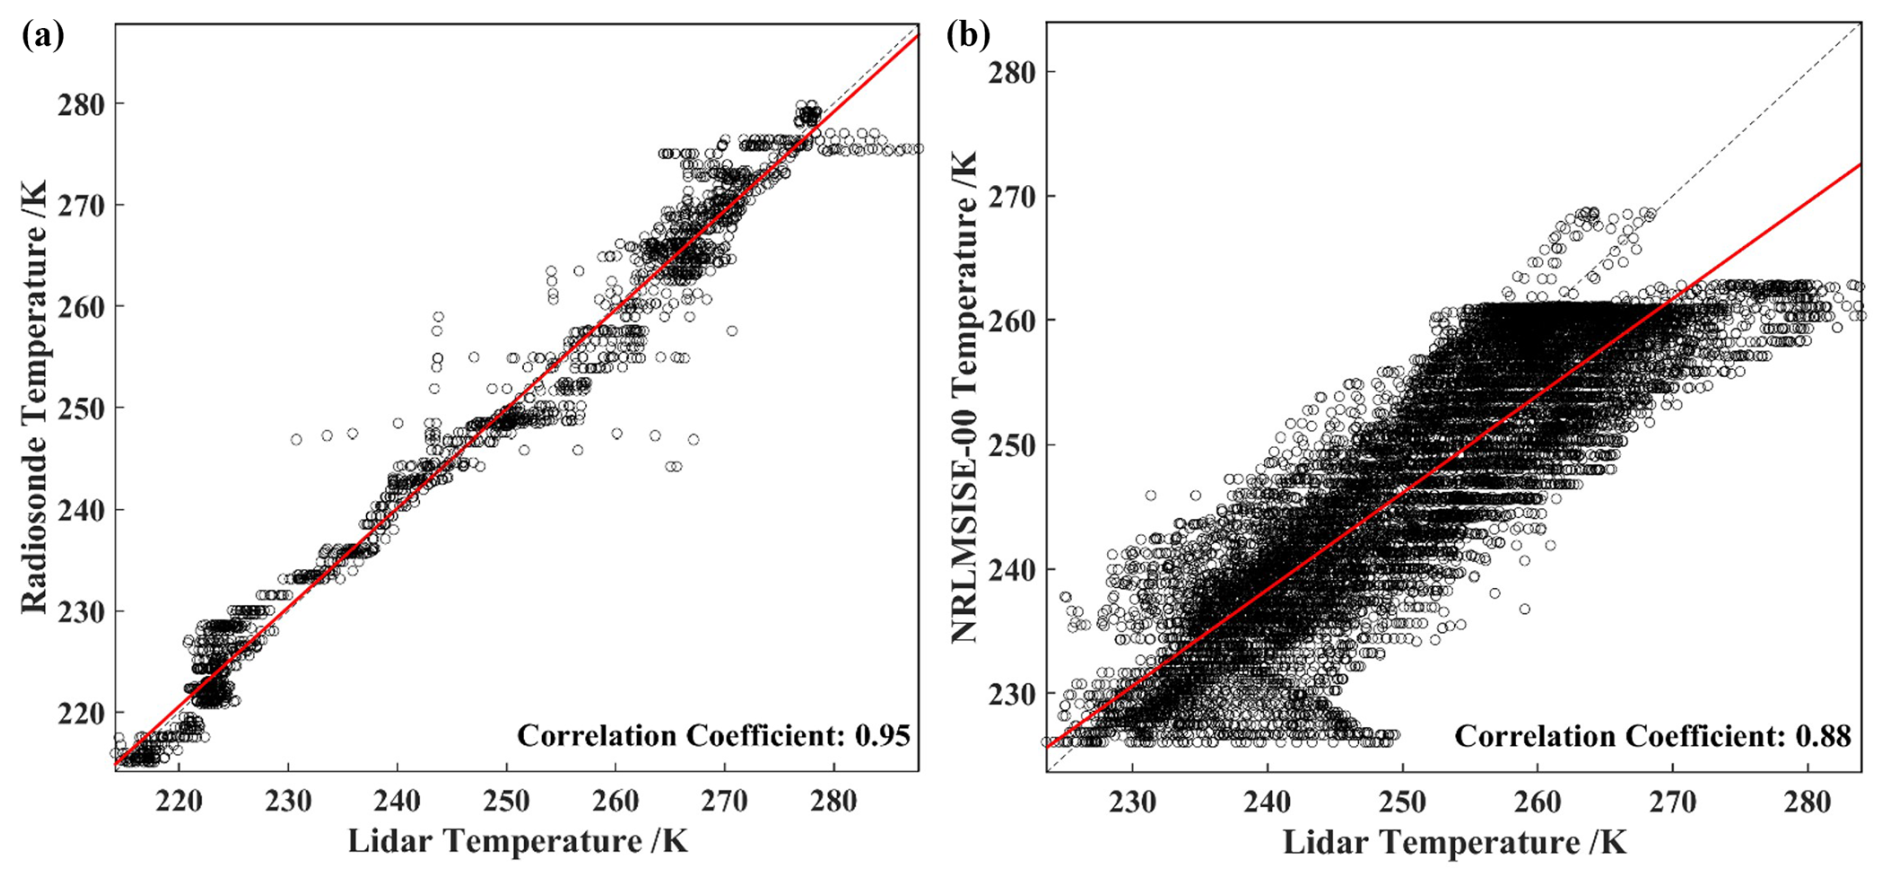
Figure 7Correlation analysis results. (a) Correlation of atmospheric temperature between lidar and radiosonde from the surface to 16 km altitude. (b) Correlation of atmospheric temperature between lidar and the NRLMSISE-00 atmospheric model from 30 to 60 km altitude.
To retrieve the atmospheric temperature profiles, signal received by the 200 mm telescope was utilized for the lower altitude range (30 km) using the pure rotational Raman temperature inversion method. Meanwhile, the 800 mm telescope was employed to obtain signals for the higher altitude range (30–60 km) using the Rayleigh integral method. The retrieved atmospheric temperature data were seamlessly spliced at altitudes of 5 and 30 km as outlined in Li et al. (2016). As a result, a comprehensive atmospheric temperature profile from the near surface to 60 km was generated, as illustrated in Fig. 8. This integrated approach not only enhances the continuity of temperature data across different altitude ranges but also reinforces the lidar system's capability to provide detailed insights into atmospheric temperature dynamics. The successful combination of different retrieval methods demonstrates the system's versatility and effectiveness in atmospheric monitoring and research.
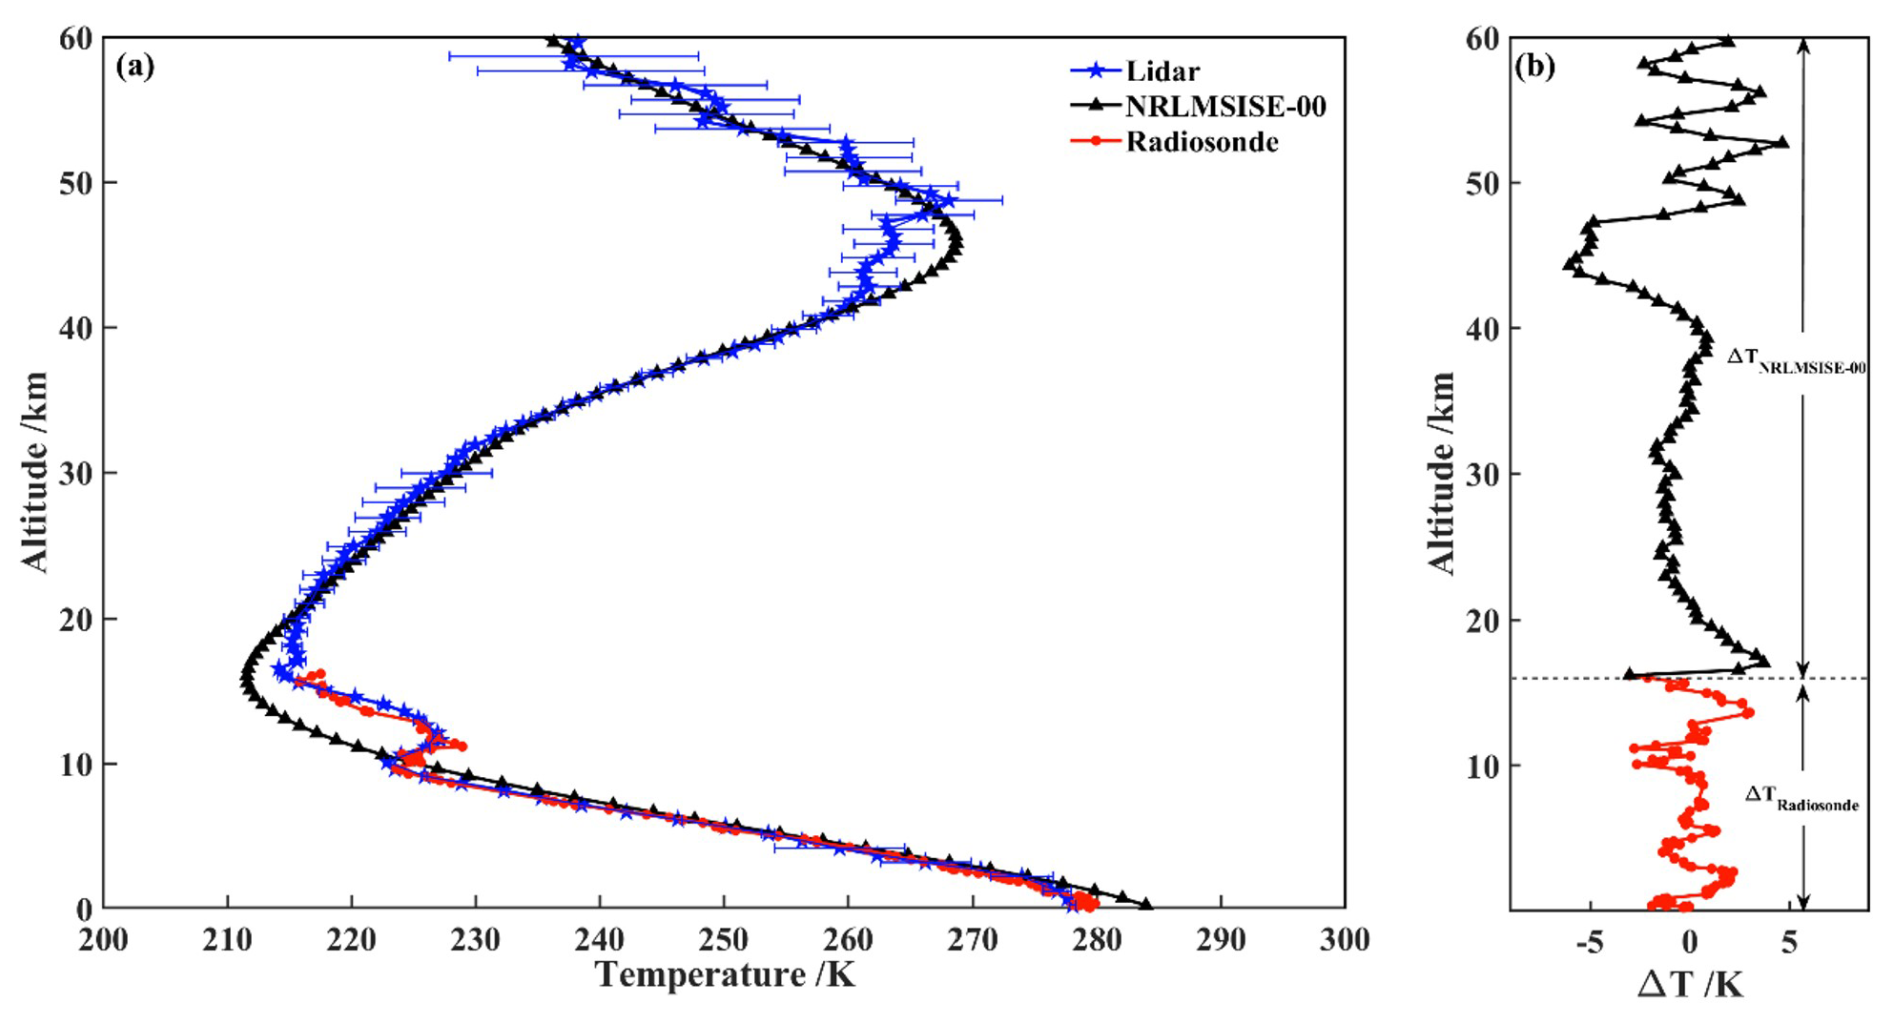
Figure 8Single temperature profile from the near surface to 60 km altitude detected by the DFOV pure rotational Raman–Rayleigh lidar (10 March 2024 00:30–01:30 LT). (a) Comparison of atmospheric temperature among lidar, radiosonde and model data. Error bars show the 1σ statistical uncertainty of the measurements (Li et al., 2016). (b) Deviation profile.
Figure 8a shows a comprehensive comparison of atmospheric temperature profiles from the near surface to 60 km, as measured by lidar, radiosonde and the NRLMSISE-00 atmospheric model. In the figure, the line with stars represents the atmospheric temperature profile detected by lidar from the near surface to 60 km, which operates with a time resolution of 60 min and a spatial resolution of 500 m. The dotted line indicates the temperature profile from the near surface to an altitude of 16 km detected by the radiosonde at 19:15 LT on 9 March 2024. The line with triangles depicts the atmospheric temperature profile in the NRLMSISE-00 model during the same observation time. The data illustrated in the figure reveal that the atmospheric temperature profile detected by lidar is consistent with the radiosonde measurements at low altitude, while also showing strong agreement with the model at higher altitudes. The temperature profile shows a characteristic trend: an initial decrease in temperature with altitude, followed by an increase, and then a subsequent decrease as altitude approaches 60 km. This pattern is consistent with the temperature variations calculated by the NRLMSISE-00 atmospheric model, indicating that both the lidar and the model effectively capture the dynamics of atmospheric temperature changes. Figure 8b shows the deviation of the atmospheric temperature among lidar, radiosonde and model data, where the dotted line represents the deviation of the atmospheric temperature from the near surface to 16 km between lidar and radiosonde data, with a deviation value within ± 3.0 K and a RMSE of 1.33 K. The line with triangles represents the deviation of 16–60 km atmospheric temperature between lidar and the atmospheric model, with a deviation value within ± 6.0 K and a RMSE of 2.23 K. These findings highlight the effectiveness of the lidar system in providing accurate atmospheric temperature profiles across a wide range of altitudes. The close agreement between lidar measurements, radiosonde data and the model reinforces the reliability of this technology for atmospheric research and monitoring.
Figure 9 shows the continuous observation results of atmospheric temperature from the near surface to 60 km during the period of 00:30–05:30 LT on 10 March 2024. Three sets of observation data were obtained, with a time resolution of 60 min and a spatial resolution of 500 m. In the figure, the line with stars is the atmospheric temperature profile from the near surface to 60 km detected by lidar. From the analysis, it is evident that the tropopause height at the observation site is about 16 km, while the stratopause height is about 45 km. The lidar-derived atmospheric temperature profile shows the reliability of the lidar system in capturing temperature variations across different atmospheric layers.
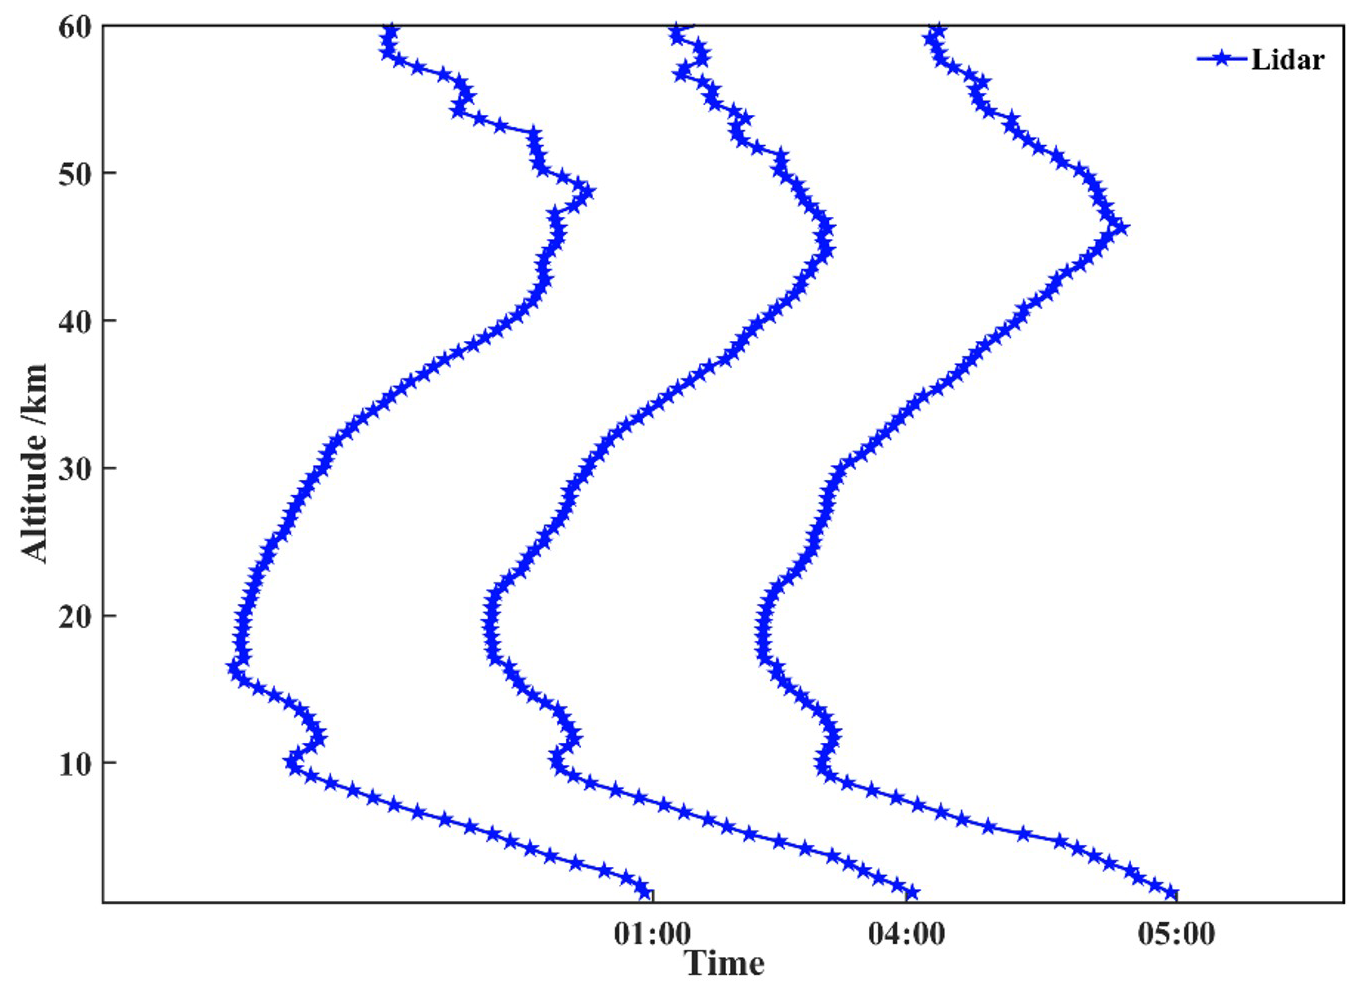
Figure 9Time series results of atmospheric temperature profiles detected by the DFOV pure rotational Raman–Rayleigh lidar from the near surface to 60 km altitude (10 March 2024).
This study addresses the critical need for accurate atmospheric temperature measurements from the near surface to the stratosphere, by developing a novel dual-field lidar system that integrates pure rotational Raman and Rayleigh scattering techniques. The present work details the system's structure, the temperature inversion method and the resulting observational data. The lidar system successfully demonstrated its ability to detect atmospheric temperature from the surface to 60 km altitude over Qingdao, China. This advancement fills a significant gap in the ability to detect atmospheric temperature profiles across this altitude range using a single lidar system in China. Comparative analysis among the lidar observation and radiosonde data, as well as NRLMSISE-00 atmospheric model output, demonstrates strong agreement within the corresponding altitude ranges. Specifically, the lidar measurements validate the reliability and accuracy of temperature readings from the surface to 60 km, with a correlation coefficient indicating high fidelity with the established measurement methods. Looking ahead, the lidar system can be further enhanced by combining it with sodium fluorescence Doppler lidar technology, enabling temperature observations extending from the near surface to 100 km. This expanded capability will provide invaluable data for environmental monitoring and contribute to a deeper understanding of global climate change dynamics. The continuous temperature profiles generated by this integrated system will facilitate comprehensive studies of atmospheric fluctuations, thereby supporting ongoing research in atmospheric science and related fields.
The code presented in this study is available from the corresponding author upon request. The code is not publicly available due to the results of subsequent research not yet being published.
The radiosonde data can be accessed from Wyoming Weather website (http://weather.uwyo.edu/cgi-bin/bufrraob.py?src=bufr&datetime=2024-03-09 12:00:00&id=54857&type=TEXT:LIST, University of Wyoming, 2025). The NRLMSISE-00 atmospheric model data can be accessed on web https://ww2.mathworks.cn/help/aerotbx/ug/atmosnrlmsise00.html?searchHiahliaht=atmosnrmsise00&s tid=srchtitle support results 1 atmosnrlmsise00 (Picone et al., 2002). The lidar data presented in this study are available from the corresponding author upon request. The lidar data are not publicly available due to the results of subsequent research not yet being published.
ZW, XL and CC drafted the manuscript and developed the lidar system and methodology presented in this manuscript. TG, DL and LQ developed pure rotational Raman scattering and Rayleigh scattering temperature retrieval codes and temperature splicing algorithms. TG, HL and XW carried out all the field observations based on the integrated dual-field temperature measurement lidar system.
The contact author has declared that none of the authors has any competing interests.
Publisher's note: Copernicus Publications remains neutral with regard to jurisdictional claims made in the text, published maps, institutional affiliations, or any other geographical representation in this paper. While Copernicus Publications makes every effort to include appropriate place names, the final responsibility lies with the authors.
The authors sincerely acknowledge editor and reviewers for their assistance in evaluating this paper. This work was supported by the National Key Research and Development Program of China, the National Natural Science Foundation of China, the Shandong Province Key Research and Development Program, the Natural Science Foundation of Shandong Province, the Natural Science Foundation of Qingdao, and the Fund Project of Qilu University of Technology (Shandong Academy of Sciences).
This work was supported by the National Key Research and Development Program of China (grant no. 2022YFC2807202), the National Natural Science Foundation of China (grant no. 12204260), the Shandong Province Key Research and Development Program (grant nos. 2020CXGC010104, 2022CXPT020, 2022JMRH0102), the Natural Science Foundation of Shandong Province (grant nos. ZR2021QF015, ZR2022MD068, ZR2023LLZ002), the Natural Science Foundation of Qingdao (grant no. 24-4-4-zrjj-124-jch), and the Fund Project of Qilu University of Technology (Shandong Academy of Sciences) (grant no. 2023RCKY038).
This paper was edited by Wen Yi and reviewed by two anonymous referees.
Achtert, P., Khaplanov, M., Khosrawi, F., and Gumbel, J.: Pure rotational-Raman channels of the Esrange lidar for temperature and particle extinction measurements in the troposphere and lower stratosphere, Atmos. Meas. Tech., 6, 91–98, https://doi.org/10.5194/amt-6-91-2013, 2013.
Alpers, M., Eixmann, R., Fricke-Begemann, C., Gerding, M., and Höffner, J.: Temperature lidar measurements from 1 to 105 km altitude using resonance, Rayleigh, and Rotational Raman scattering, Atmos. Chem. Phys., 4, 793–800, https://doi.org/10.5194/acp-4-793-2004, 2004.
Arshinov, Y. , Bobrovnikov, S. M., Zuev, V. E., and Mitev, V. M.: Atmospheric temperature measurements using a pure rotational Raman lidar, Appl. Optics, 22, 2984, https://doi.org/10.1364/AO.22.002984, 1983.
Arshinov, Y., Bobrovnikov, S. M., Serikov, I., Ansmann, A., Wandinger, U., Althausen, D., Mattis, I., and Müller, D.: Daytime operation of a pure rotational Raman Lidar by use of a Fabry–Perot interferometer, Appl. Optics, 44, 3593–3603, https://doi.org/10.1364/AO.44.003593, 2005.
Behrendt, A. and Reichardt, J.: Atmospheric temperature profiling in the presence of clouds with a pure rotational Raman Lidar by use of an interference-filter-based polychromator, Appl. Optics, 39, 1372–1378, https://doi.org/10.1364/AO.39.001372, 2000.
Chen, H. and Yi, F.: Rayleigh lidar and radiosonde observations of density and temperature in middle atmosphere over Wuhan, Chinese Journal of Space Science, 23, 262–268, https://doi.org/10.3969/j.issn.0254-6124.2003.04.004, 2003.
Chu, X. Z., Liu, A. Z., Papen, G., Gardner, Kelley, M., Drummond, J., and Fugate, R.: Lidar observations of elevated temperatures in bright chemiluminescent meteor trails during the 1998 Leonid Shower, Geophys. Res. Lett., 27, 1815–1818, https://doi.org/10.1029/2000GL000080, 2000.
Gao, F., Huang, B., Shi, D. C., Zhu, Q. S., Zhang, R., Wang, L., Li, S. C., and Hua, D. X.: Design and simulation of pure rotational Raman lidar system for daytime detection of atmospheric temperature, Acta Optica Sinica, 39, 0301004, https://doi.org/10.3788/AOS201939.0301004, 2019.
Gong, S. H., Yang, J., and Yang, G. T.: Temperature variation characteristics in the middle atmosphere studied with Rayleigh lidar at Haikou, Chinese J. Geophys.-Ch., 66, 1876–1887, https://doi.org/10.6038/cjg2022Q0122, 2023a (in Chinese).
Gong, S. H., Chen, W. P., Yang, G., T., Guo, J. C., Xu, J. Y., Li, F. Q., Wang, Y. R., Zhang, Y. H., Fu, Y. L., Shen, Z. J., Liu, H. J., Wang, Y. P., Sun, S. J., Wu, W., Liu, J., Lü, S. Q., and Cheng, X. W.: Retrieval of temperature structure and identification of gravity wave events in the middle atmosphere from Rayleigh lidar observations, Acta Optica Sinica, 43, 2428006, https://doi.org/10.3788/AOS230524, 2023b.
Gong, S. S., Zeng, X. Z., Xue, X. J., Zheng, W. G., Hu, Z. L., Jia, H. C., Zhang, H. Z., and Liu, Y. P.: First time observation of sodium layer over Wuhan, China by sodium fluorescence lidar, Science in China, 27, 369–373, https://doi.org/10.1007/BF02947210, 1997.
Hauchecorne, A. and Chanin, M. L.: Density and temperature profiles obtained by lidar between 35 and 70 km, Geophys. Res. Lett., 7, 565–568, https://doi.org/10.1029/GL007i008p00565, 1980.
Li, Y. J., Lin, X., Song, S. L., Yang, Y., Cheng, X. W., Chen, Z. W., Liu, L. M., Xia, Y., Xiong, J., Gong, S. S., and Li, F. Q.: A combined Rotational Raman–Rayleigh Lidar for atmospheric temperature measurements over 5–80 km with self-calibration, IEEE T. Geosci. Remote, 54, 7055–7065, https://doi.org/10.1109/TGRS.2016.2594828, 2016.
Li, Y. J., Lin, X., Yang, Y., Xia, Y., Xiong, J., Song, S., Liu, L., Chen, Z., Cheng, X., and Li, F.: Temperature characteristics at altitudes of 5–80 km with a self-calibrated Rayleigh–rotational Raman lidar: A summer case study, J. Quant. Spectrosc. Ra., 188, 94–102, https://doi.org/10.1016/j.jqsrt.2016.05.007, 2017.
Lindzen, R.: Dynamics in atmospheric physics, Cambridge University, ISBN: 052136101X, 1990.
Liu, F. C., Yi, F., Zhang, Y. P., and Yi, Y.: Double-Receiver-Based Pure Rotational Raman lidar for measuring atmospheric temperature at altitudes between near ground and up to 35 km, IEEE T. Geosci. Remote, 57, 10301–10309, https://doi.org/10.1109/TGRS.2019.2933461, 2019.
Mahagammulla Gamage, S., Sica, R. J., Martucci, G., and Haefele, A.: Retrieval of temperature from a multiple channel pure rotational Raman backscatter lidar using an optimal estimation method, Atmos. Meas. Tech., 12, 5801–5816, https://doi.org/10.5194/amt-12-5801-2019, 2019.
Martucci, G., Navas-Guzmán, F., Renaud, L., Romanens, G., Gamage, S. M., Hervo, M., Jeannet, P., and Haefele, A.: Validation of pure rotational Raman temperature data from the Raman Lidar for Meteorological Observations (RALMO) at Payerne, Atmos. Meas. Tech., 14, 1333–1353, https://doi.org/10.5194/amt-14-1333-2021, 2021.
Picone, J. M., Hedin, A. E., Drob, D. P., and Aikin, A. C.: NRLMSISE-00 empirical model of the atmosphere: Statistical comparisons and scientific issues, J. Geophys. Res., 107, 1468, https://doi.org/10.1029/2002JA009430, 2002 (data available at: https://ww2.mathworks.cn/help/aerotbx/ug/atmosnrlmsise00.html?searchHiahliaht=atmosnrmsise00&s tid=srchtitle support results 1 atmosnrlmsise00, last access: 14 March 2025).
She, C. Y. and Yu, J. R.: Simultaneous three-frequency Na lidar measurements of radial wind and temperature in the mesopause region, Geophys. Res. Lett., 21, 1771–1774, https://doi.org/10.1029/94GL01417, 1994.
Tamarin-Brodsky, T., Hodges, K., Hoskins, B. J., and Shepherd, T. G.: A dynamical perspective on atmospheric temperature variability and its response to climate change, J. Climate, 32, 1707–1724, https://doi.org/10.1175/JCLI-D-18-0462.1, 2019.
Tan, Z. Q., Bu, L. B., Yang, B.: New Rayleigh doppler lidar based on iodine molecular absorption cell, Acta Optica Sinica, 43, 257–268, https://doi.org/10.3788/AOS230500, 2023.
Tian, X. M., Liu, D., Xu, J. W., Wang, Z. Z., Wang, B. X., Wu, D. C., Zhong, Z. Q., Xie, C. B., and Wang, Y. J.: Review of lidar technology for atmosphere monitoring, Journal of Atmosphere and Environmental Optics, 13, 321–341, https://doi.org/10.3969/j.issn.1673-6141.2018.05.001, 2018.
University of Wyoming: Observations for Station 54857 starting 1115Z 09 Mar 2024, QINGDAO, China, Latitude: 36.070 Longitude: 120.330, Wyoming Weather Web [data set], http://weather.uwyo.edu/cgi-bin/bufrraob.py?src=bufr&datetime=2024-03-0912:00:00&id=54857&type=TEXT:LIST (last access: 12 March 2025), 2024.
Wu, Y. H., Hu, H. L., Hu, S. X., Zhou, J., and Zhang, M.: Atmospheric density and temperature measurement with lidar in the middle and upper stratosphere, Chinese Journal of Quantum Electronics, 17, 426–431, https://doi.org/10.3969/j.issn.1007-5461.2000.05.008, 2000.
Yang, F., Gao, F., Gao, X., Li, X. L., Wang, L., Yan, Q., Shi, D. C., Song, Y. H., Li, S. C., and Hua, D. X.: Non-blind zone detection of atmospheric temperature using lateral raman scattering lidar based on continuous-wave laser, Acta Optica Sinica, 44, 0601015, https://doi.org/10.3788/AOS231243, 2024.