the Creative Commons Attribution 4.0 License.
the Creative Commons Attribution 4.0 License.
 | 09 Apr 2025
Observation of greenhouse gas vertical profiles in the boundary layer of the Mount Qomolangma region using a multirotor UAV
Ying Zhou
Congcong Qiao
Minqiang Zhou
Xiangjun Tian
Yinghong Wang
Minzheng Duan
Understanding the vertical profile of greenhouse gases (GHGs) is crucial for elucidating their sources and sinks, transport pathways, and influence on Earth's radiative balance, as well as for enhancing predictive capabilities for climate change. Remote sensing methods for measuring vertical GHG profiles often involve substantial uncertainties, while in situ measurements are limited by high equipment costs and operational expenses, rendering them impractical for long-term continuous observation efforts. In this study, we have developed an automatic low-cost and user-friendly multi-altitude atmospheric sampling device designed for small- and medium-sized unoccupied aerial vehicles (UAVs), balloons, and other flight platforms. A field campaign was carried out in the Mount Qomolangma (also known as Mount Everest) region, at an average surface altitude of 4300 m above sea level (a.s.l.). During the campaign, we conducted 15 flights and collected 139 samples from the ground surface up to a height of 1215 m using a hexacopter UAV platform equipped with the sampling device. The samples were analyzed using the Agilent gas chromatography (GC) 7890A instrument, enabling the derivation of the vertical profiles for four GHG species (CO2, CH4, N2O, and SF6) within the boundary layer of the Mount Qomolangma region. To enable long-term monitoring using small UAVs, future efforts should prioritize reducing the weight of the equipment and improving the sampling efficiency.
- Article
(8600 KB) - Full-text XML
-
Supplement
(383 KB) - BibTeX
- EndNote


Contemporary global warming, predominantly driven by human activities, is an urgent environmental challenge characterized by a significant increase in the atmospheric concentration of greenhouse gases (GHGs) and has caused a rapid rise in global temperature since the industrial revolution (IPCC, 2018; Friedlingstein et al., 2023). Monitoring the changes in GHG concentration is essential for understanding climate change and promoting environmental protection. Carbon dioxide (CO2) is the most influential GHG, with its radiative forcing reaching in 2019 relative to 1750 (IPCC, 2021), followed by methane (CH4), nitrous oxide (N2O), and other GHGs. The concentrations of GHGs are influenced by surface fluxes and atmospheric chemical transport, leading to non-uniform spatial distributions. As a result, measurements of the spatio-temporal distribution of GHG concentrations can be used to derive the sizes of fluxes and the impacts of atmospheric transports. (Carnell and Senior, 1998; Ren et al., 2011; Xie et al., 2013). For instance, the vertical profiles of CO2 observed by aircraft were used for diagnosing errors in the simulation of surface CO2 fluxes (Jin et al., 2024) and have been integrated into inverse modeling of carbon fluxes (Niwa et al., 2012; Jiang et al., 2013). Additionally, the vertical distribution of GHGs serves as a critical input for satellite remote sensing retrieval algorithms, enhancing the accuracy of satellite retrievals (Ramanathan et al., 2018; Bao et al., 2020). This accuracy is critical for atmospheric inversions, whether assimilating satellite data independently (Chevallier et al., 2019) or in conjunction with surface-based measurements (Byrne et al., 2020).
There are two primary methods for obtaining the vertical distribution of atmospheric GHGs: indirect measurements (remote sensing technique) and direct measurements. The first approach involves analyzing the observed characteristic spectrum through space-based satellites or payloads (Buchwitz et al., 2005; O'Dell et al., 2012; Yoshida et al., 2013), ground-based lidar (Kuma et al., 2021), and high-resolution spectrometers (Wunch et al., 2011). The accuracy of indirect measurement methods is limited by several factors, such as cloud cover, aerosols, and surface reflections. These limitations lead to considerable uncertainty and limited spatial resolution of GHG concentrations, thereby affecting the accuracy of estimation of localized GHG sources and sinks.
The direct measurement technique requires the use of specialized equipment capable of accurately measuring the atmosphere's composition, such as devices using the cavity ring-down spectroscopy (CRDS) technique (Wheeler et al., 1998; Wilkinson et al., 2018). To acquire vertical distribution information, multiple inlets are often installed at different altitudes of a tower, which typically only extends a few hundred meters (Haszpra et al., 2012). Alternatively, lightweight measurement devices can be deployed on aircraft (Sun et al., 2020) or balloons (Li et al., 2014; Bao et al., 2020) to enable in situ measurements at high altitudes. Sampling devices may also be employed to collect high-altitude air masses for subsequent laboratory analysis. Compared to remote sensing, direct measurements provide higher precision and vertical resolution for GHG data that can be easily tied to calibration standards (e.g., the National Institute of Standards and Technology, NIST, scale). Recently, advancements in unoccupied aerial vehicles (UAVs) have provided lightweight, easy-to-operate, and easily recoverable platforms for vertical observations. Due to their small size, portability, and low cost, UAVs have emerged as a popular means to obtain the distribution of atmospheric constituents, effectively overcoming the limitations of traditional methods (Glaser et al., 2003; Neumann and Bartholmai, 2015; Etts et al., 2015; Brosy et al., 2017; Chang et al., 2020).
Many works have used UAVs for in situ measurements of GHGs, primarily utilizing non-dispersive infrared (NDIR) sensors to measure CO2 and CH4 (Kunz et al., 2018; Reuter et al., 2021; Britto Hupsel de Azevedo et al., 2022; Han et al., 2024). While NDIR and other low-cost sensors have the advantage of real-time and continuous monitoring due to their lightweight design, they face challenges such as the need for frequent calibration arising from fluctuations in, for example, pressure, temperature, and water vapor content in ambient environments, which vary across locations and altitudes (Liu et al., 2022). In contrast, flask (usually made of metal) sampling methods enable data collection and subsequent laboratory analysis under controlled conditions (Loftfield et al., 1997), but they require labor-intensive flask evacuation and cleaning procedures and are unsuitable for real-time measurements. We have developed a device similar to those used in flask sampling but with aluminum bags, featuring a lighter design, and have expanded its capabilities to analyze additional GHG components. Note that our system requires a higher payload capacity and a larger platform size than real-time analysis sensors do. This portable device operates automatically and can collect air samples from multiple altitudes in a short period. Comprehensive indoor tests verified the device's sampling speed and liability for field measurements. The device was used in a 5 d campaign of field measurements at Mount Cho Oyu Base Camp (4950 m above sea level (a.s.l.)) and Mount Qomolangma Station (4300 m a.s.l.) between 29 September and 3 October 2023. The device was taken by a medium-sized UAV up to 1250 m above the ground. During the flights, air samples were collected at different altitudes from the ground to the upper air. The samples were then analyzed by chromatography to derive gas concentrations, including CO2, CH4, N2O, and SF6.
The paper is structured as follows: Sect. 2 provides an overview of the gas collection system and outlines the sampling and analysis procedures used in this experiment. Section 3 details the field experiments, including site descriptions and a discussion of the results. Finally, Sect. 4 summarizes the key findings and their implications.
2.1 Gas collection system
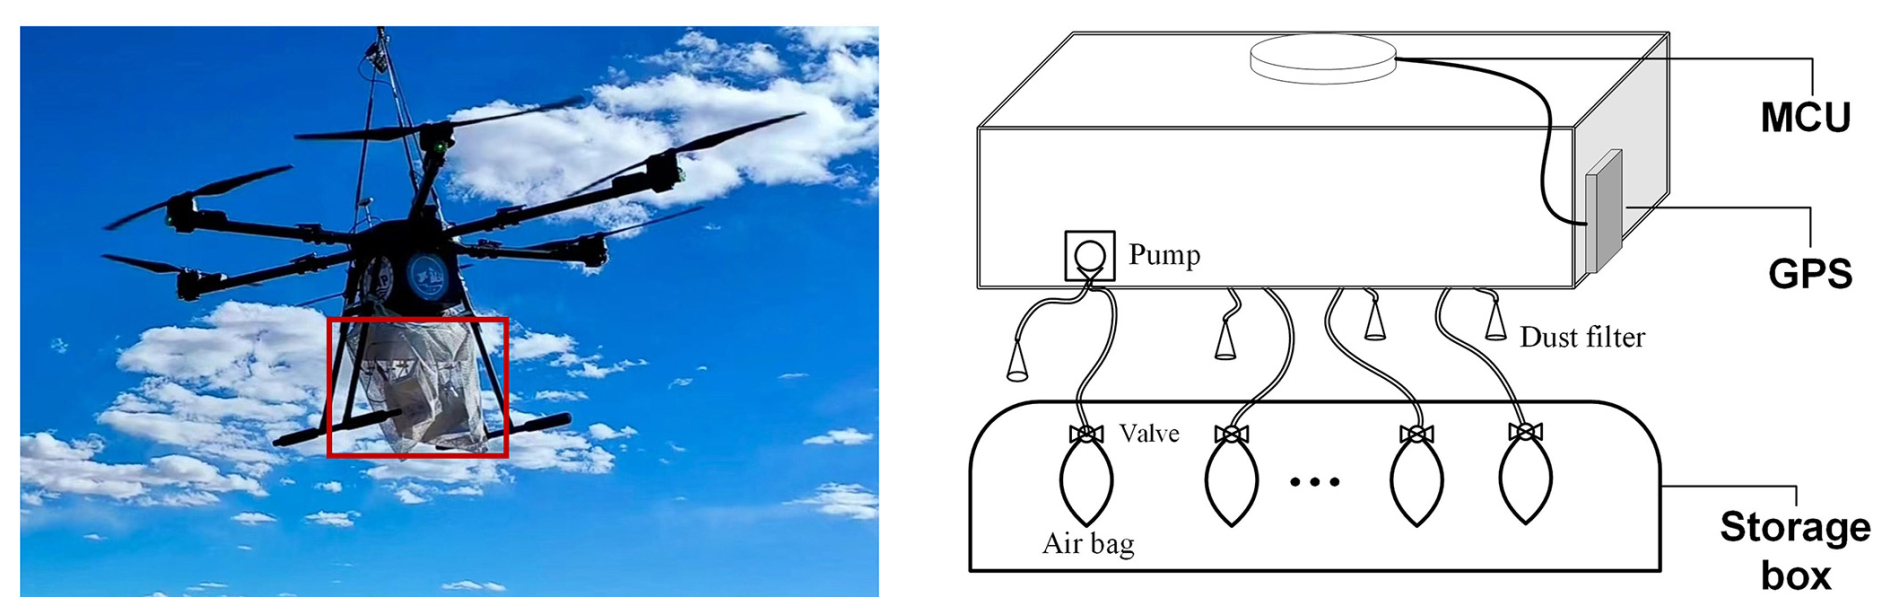
A schematic of the automatic sampling device is shown in Fig. 1. Airbags are used to collect air samples. Each airbag is a 1 L vacuum-sealed, aluminum-foil bag, sized appropriately for gas chromatography (GC) analysis. Ten airbags (illustrated here with four for simplicity) are each equipped with a self-sealing structured polycarbonate (PC) stopcock straight valve and are connected to 10 micro vacuum pumps through airtight, well-sealed tubes, with each pump having an inlet and an outlet. A hydrophobic (PTFE) filter with a 0.45 µm pore size is attached to the inlet to prevent dust contamination. The outlet is tightly connected to the valve of the sampling bag, allowing the collection of air when the valve is opened. All airbags are stored in a storage box to ensure safety in case of strong wind. A GPS receiver and a meteorological sensor (iMET-XQ2, International Met Systems) form an integrated data acquisition system capable of simultaneously recording time and position (longitude, latitude, altitude) and atmospheric parameters (pressure: 10–1200 hPa; temperature: −90 to +50 °C; humidity: 0 %–100 % RH). The whole procedure is programmable through a micro control unit (MCU), and the sampling altitudes are pre-set before each flight.
2.2 Sampling procedure
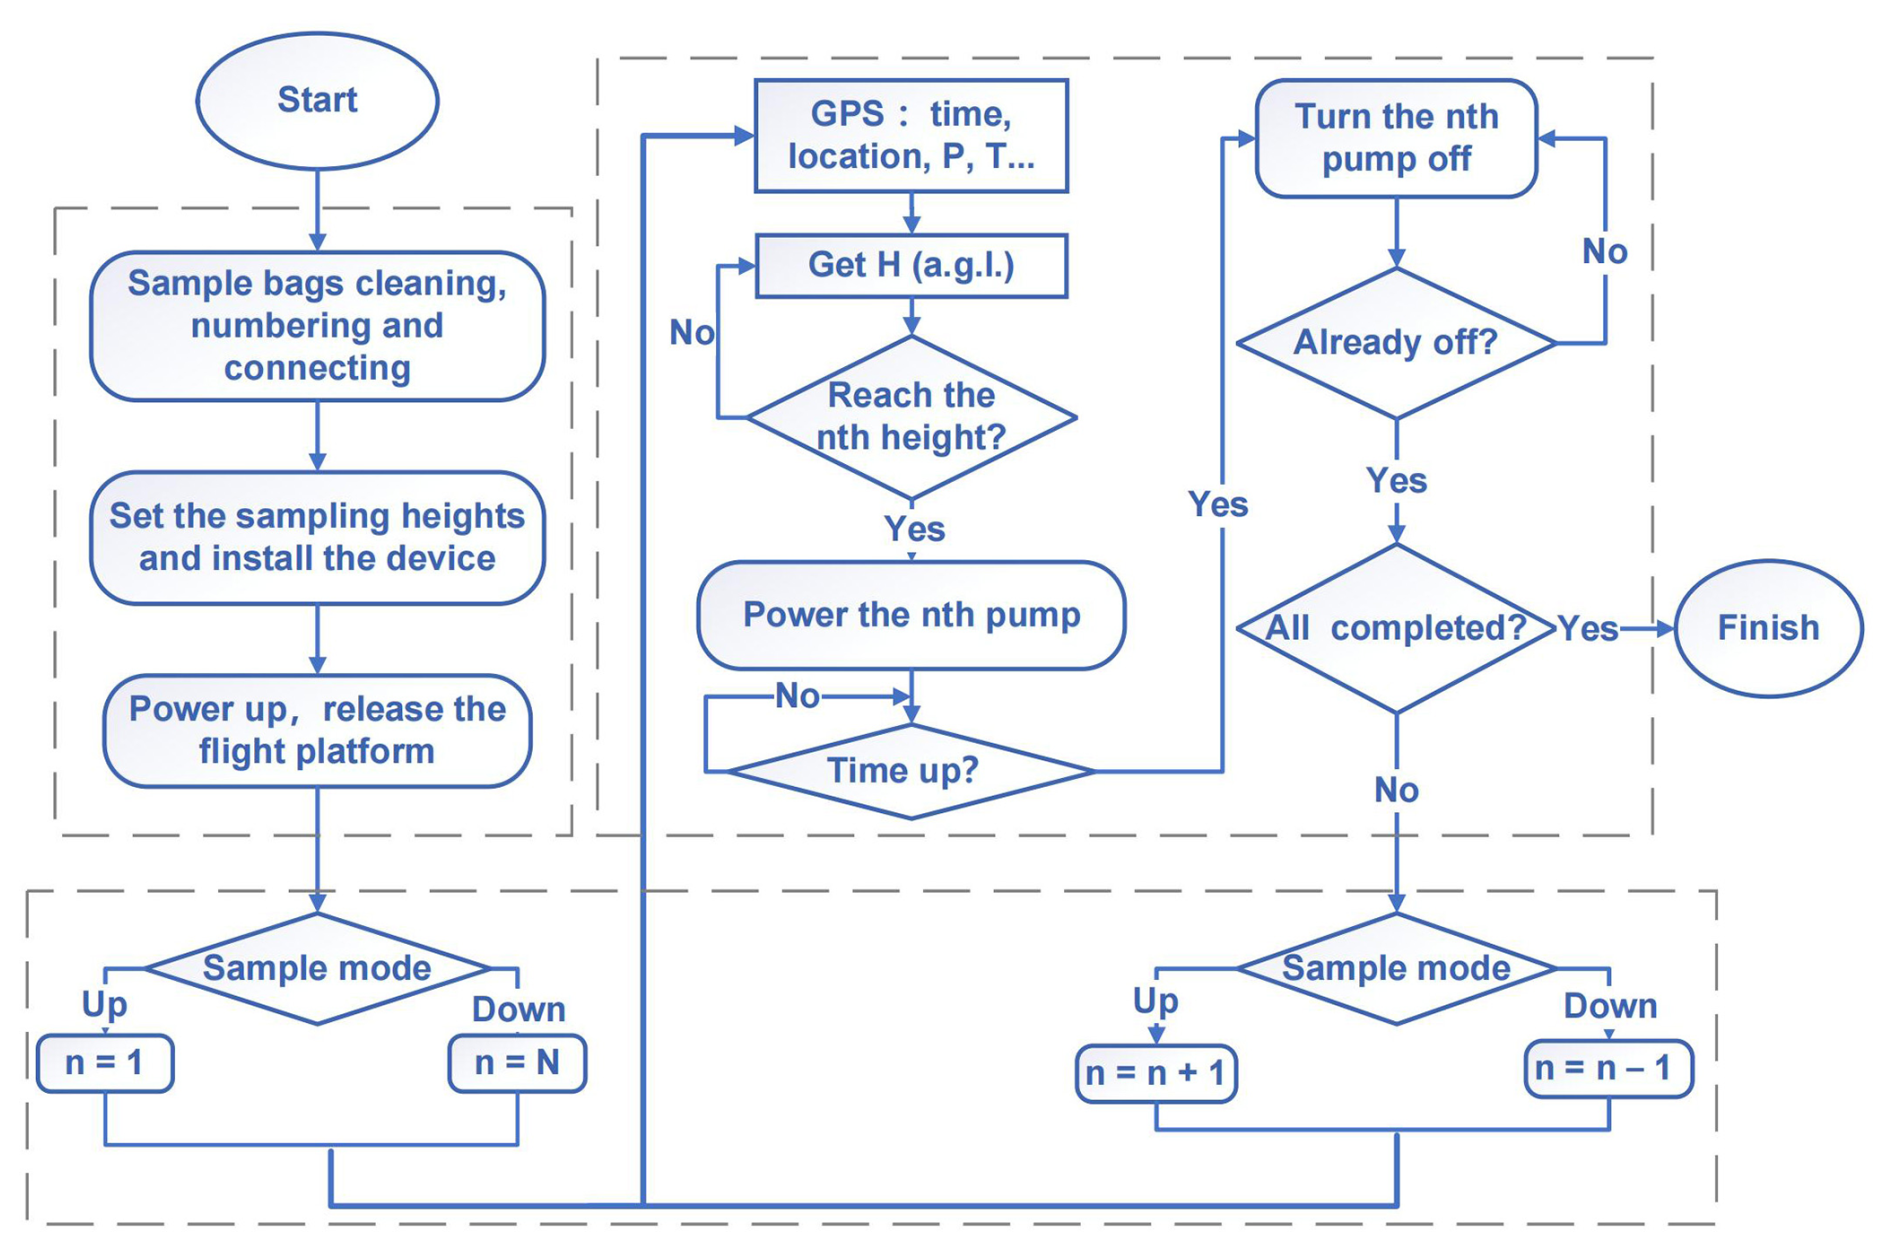
The size of the gas collection system is , and the total weight is 2.4 kg. The peak power of the sampling is about 10.8 W. An extra 12 V small lithium battery (capacity of 2 A h and about 150 g weight) is used to power the pump. The whole system can be carried by UAVs with sufficient capacity. The following operations are performed before each flight: bags must be flushed with high-purity nitrogen at least five times before sampling and each bag must be carefully labeled to register its logging information, such as time, location, and altitude, for future analysis. Precautions must be taken when mounting sensors on the UAV to prevent contamination from human activities. The working flowchart (Fig. 2) provides a detailed view of the procedure, including pre-processing, parameter configuration, and operational steps.
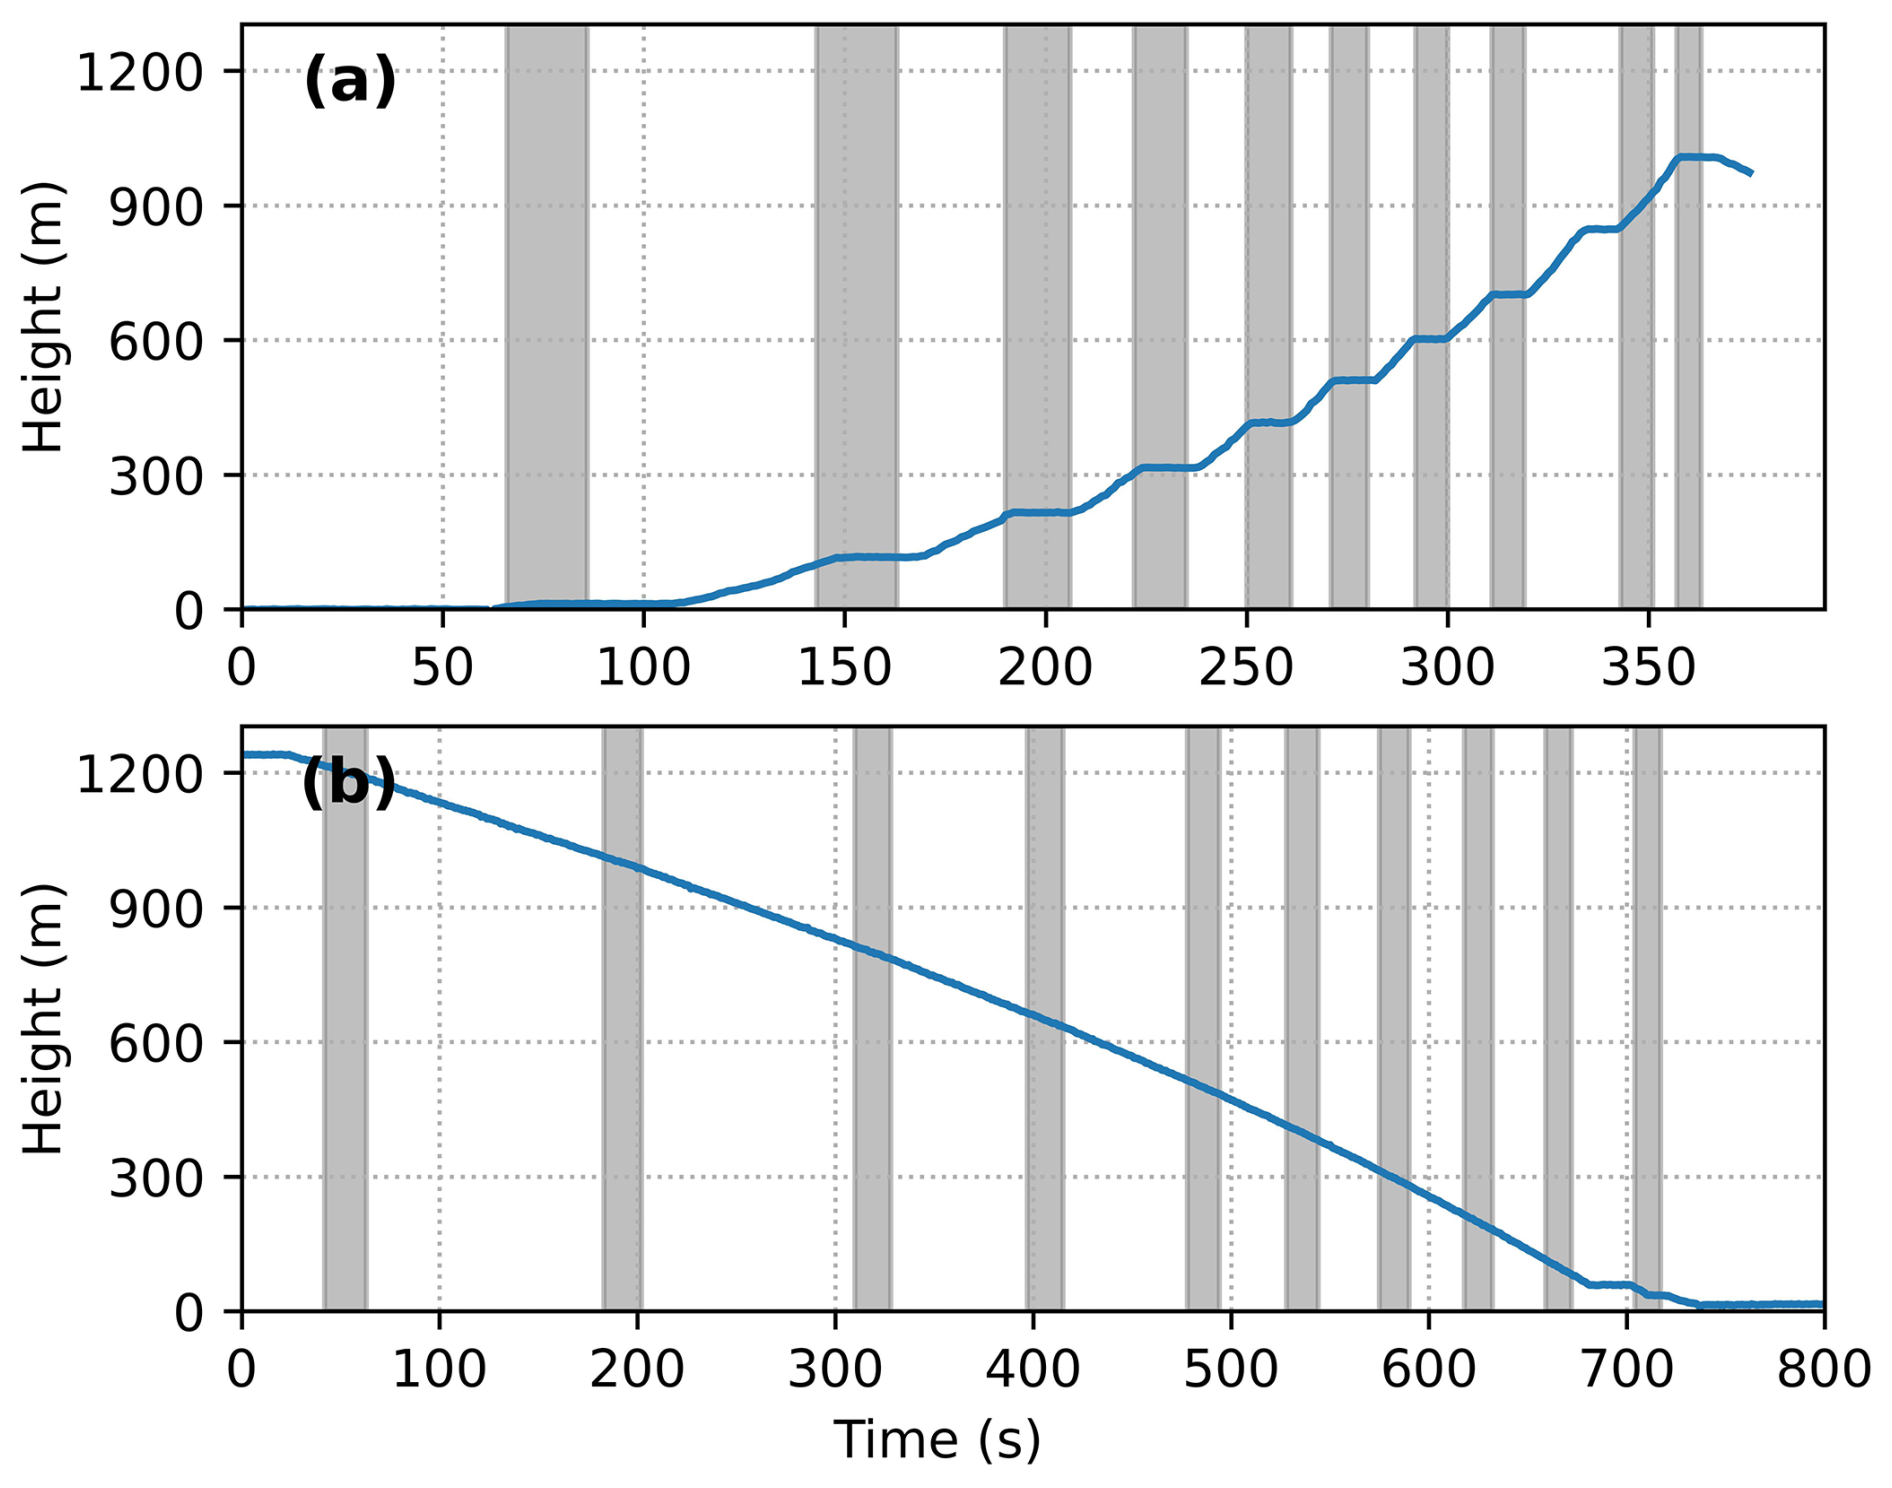
Figure 3An example of sampling modes. The start times are (a) 1 October at 07:31 and (b) 5 October at 07:47 (in local time). The lines indicate flight heights, while the gray shadows represent the operating times of each micro-motor.
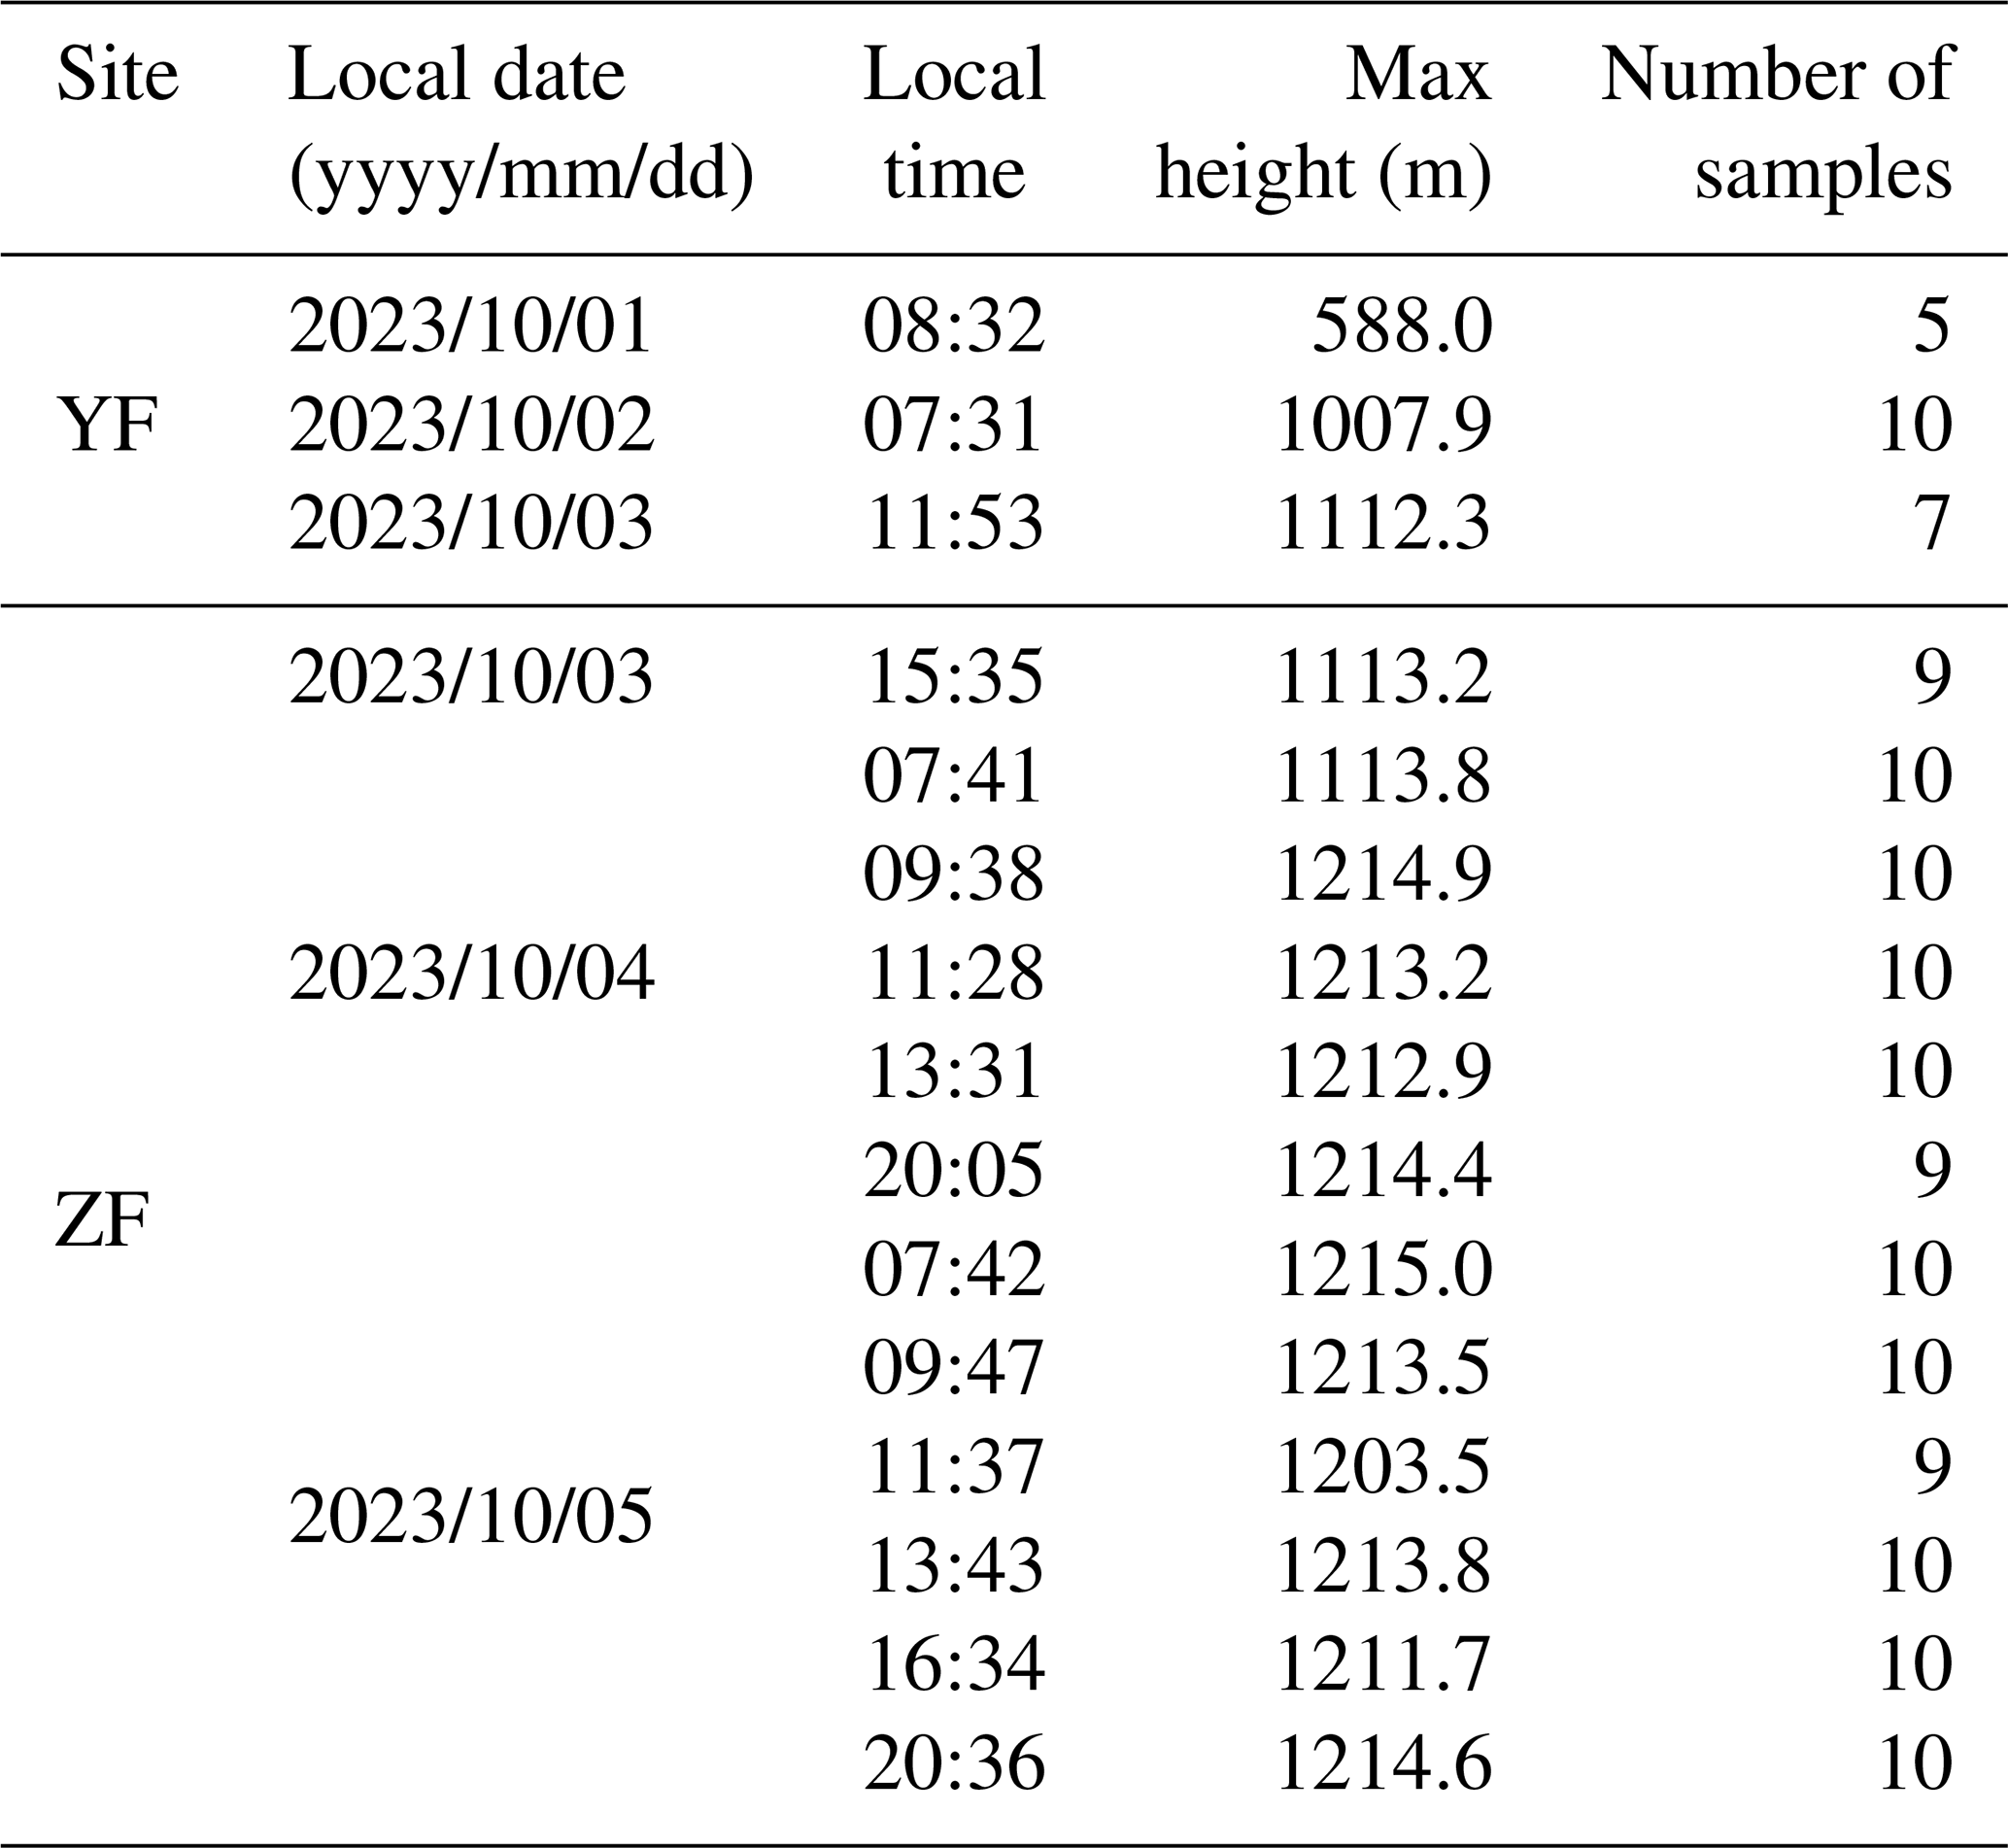
Table 1Sampling log of GHGs measurements during UAV flights in the Mount Qomolangma (also known as Mount Everest) region (YF denotes Mount Cho Oyu Base Camp, and ZF denotes Mount Qomolangma Station).
During the flights, the real-time altitude is calculated at 1 Hz through pressure p and air temperature T collected from the iMET-XQ2 by
where p0 is the surface pressure, R is the ideal gas constant of 287.05 J (kg K)−1, and g is the gravitational acceleration as a constant of 9.80665 m s−2. Note that temperature and humidity data were not utilized for atmospheric boundary layer analysis due to potential interference from UAV heat sources and unshielded solar radiation, but they do not significantly affect altitude computations. A comparison of altitudes obtained from the iMET-XQ2-based calculations with GPS measurements (as shown in Fig. S1 in the Supplement) indicates that given the short flight durations (less than 40 min), the differences are negligible, remaining within 7 m. This is minimal compared to the vertical sampling resolution of approximately 100 m.
The mobility and flexibility of the UAV platform (Fig. 1) make it an ideal autonomous system for vertical profile measurements of greenhouse gases. The sampling system operates in two distinct modes: the ascent (up) and descent (down) modes.
In the up mode, the UAV is operated with a relatively constant velocity of about 4 m s−1 until it reaches the predefined maximum altitude (for example, about 1300 m above ground level). The samplings are collected during the ascent period. To optimize power consumption (Reuder et al., 2016), the system requires a stationary hovering phase at the target altitude to facilitate pump operation (as illustrated in the height stage pattern in Fig. 3a).
In the down mode, the samples are collected during the descent period. The UAV initiates a 10 s hover at the maximum altitude for pump operation, which is followed by a gradual descent to the launch point (Fig. 3b).
During the preliminary field campaign, we collected 15 samples exclusively with the up mode in the two test flights. Maintaining UAV stability during manual altitude adjustments (Fig. 3a) is the main challenge of the operation. Our experimental results demonstrate the superiority of the down mode, which reduces manual intervention and enhances energy efficiency.
Each motor lasts 11–20 s and then stops. This sampling procedure repeats until the UAV lands on the ground and the valves of airbags are closed. Above each valve, there is a sample cap with a silicone septum inside for syringe sampling.
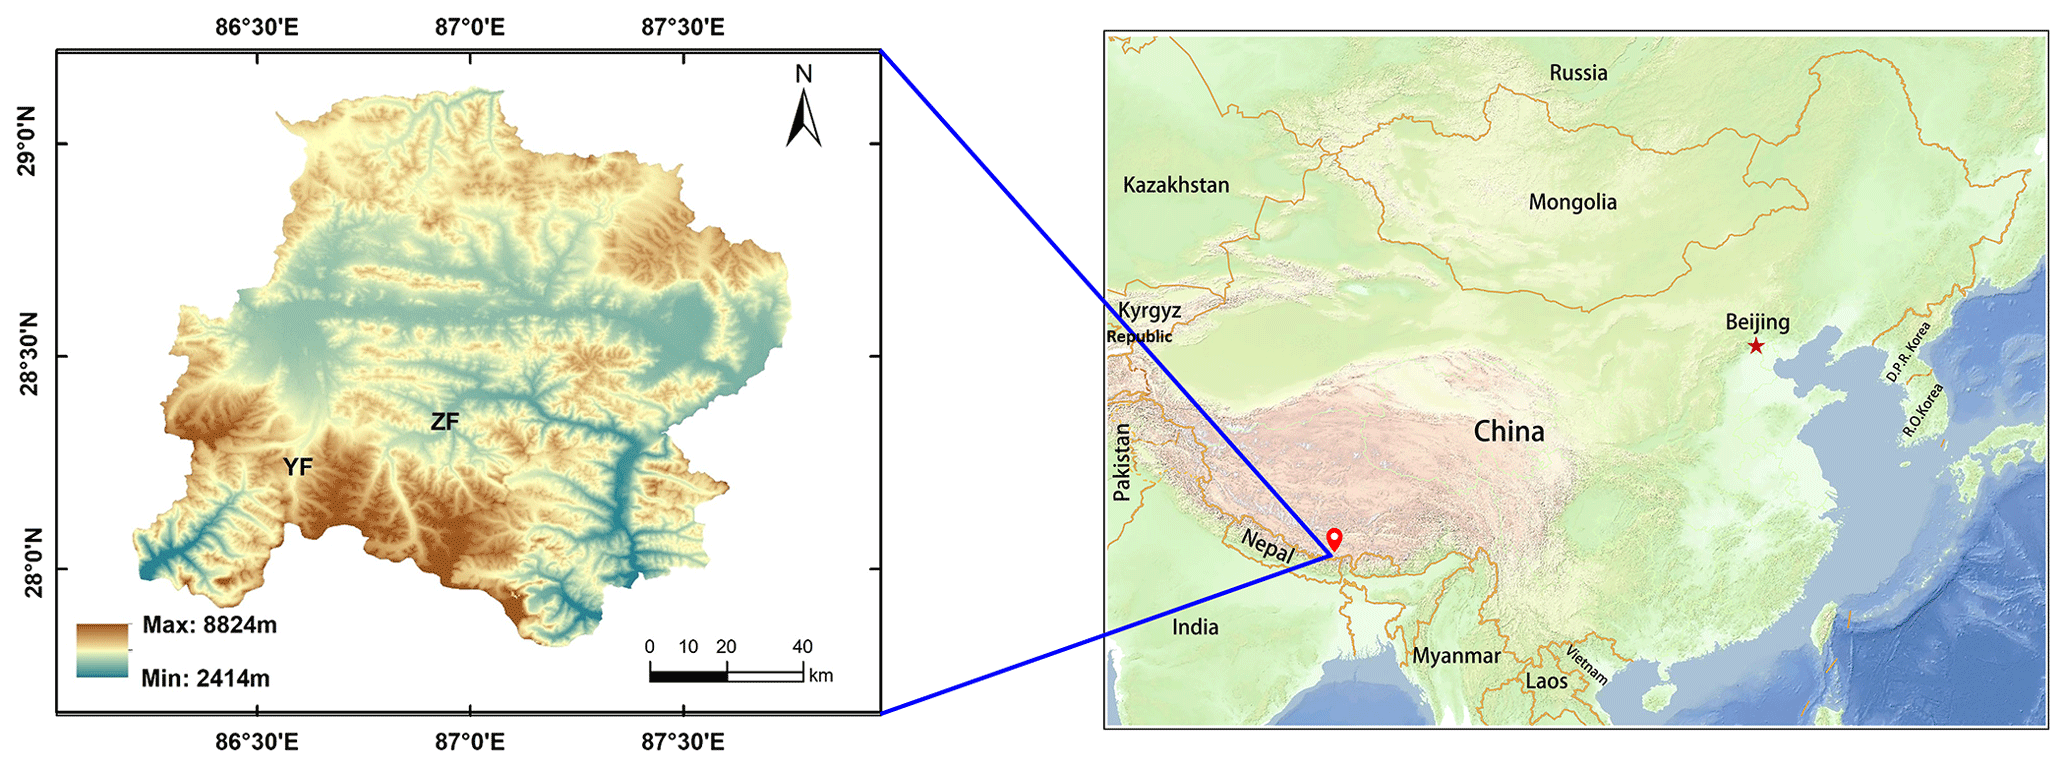
Figure 4The left panel shows the locations of the experimental sites, both situated in Tingri County: YF corresponds to Mount Cho Oyu Base Camp, and ZF corresponds to Mount Qomolangma Station. The digital elevation model (DEM) data are sourced from the Geospatial Data Cloud (http://www.gscloud.cn, last access: 6 March 2024). The right panel shows the location of Tingri County on the map. Publisher's remark: please note that the above figure contains disputed territories.
Table 2Means and standard deviations of gas mixing ratios of all samples.
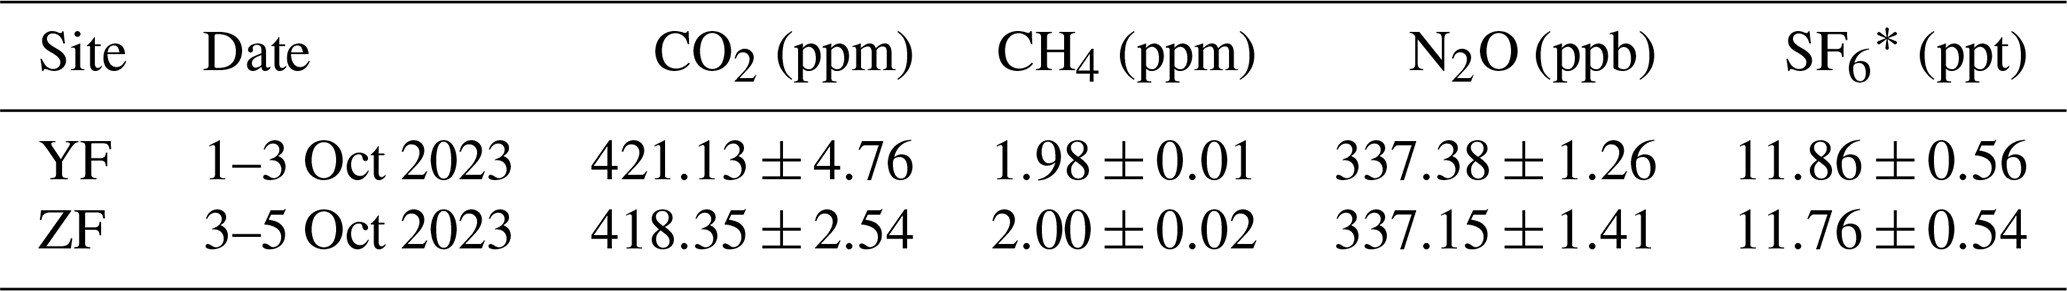
* SF6 mixing ratios are expressed in parts per trillion.
2.3 Air sample analysis
The air masses collected in the bags are analyzed with an Agilent GC 7890A (https://www.agilent.com.cn, last access: 6 November 2024) for four GHG species (CO2, CH4, N2O, SF6). The GC measurement is based on the principle that different components within the sample flow at different speeds through the gas chromatography column, enabling precise separation and accurate quantification of individual constituents. We use a 13X molecular sieve (13XMS) to separate CH4 and a Porapak Q for CO2. Regarding N2O and SF6, they are separated from CO2 by the Porapak Q column and then backflushed to the detector. The GC is equipped with a flame ionization detector (FID) for detecting CH4. CO2 is converted to CH4 using a nickel converter before being detected by the FID, as the FID only responds to carbon-containing organic compounds. Additionally, an electron capture detector (ECD) is used for N2O and SF6. For detailed information about the injector, gas line, valve-driving models, and laboratory accuracy testing, please refer to our previous studies (Yuesi and Yinghong, 2003; Wang et al., 2010). The GC signals, mostly represented by peak area or height due to gas absorption, are directly proportional to gas concentrations. These signals are carefully calibrated with standard gases traceable to the NIST scale. A linear regression is established between the peak area and the concentration of standard gases:
where C represents the concentration of the detected gas, “area” represents the peak area of the detected gas, and a and b are coefficients given through calibration with standard gas. The standard gas is injected multiple times (n≥7), and the standard deviation of parallel determinations is calculated to determine the detection limit and precision using a specific formula. Each type of GHG is measured in terms of its volume mixing ratio (VMR). The precisions, represented by the coefficients of variation, are 0.18 % for CO2, 0.99 % for CH4, 0.22 % for N2O, and 1.7 % for SF6 at the average levels of 0.75 ppm for CO2, 0.02 ppm for CH4, 0.74 ppb for N2O, and 0.20 ppt for SF6. The detection limits of this method are 2.4 ppm for CO2, 0.07 ppm for CH4, 2.6 ppb for N2O, and 1.5 ppt for SF6.
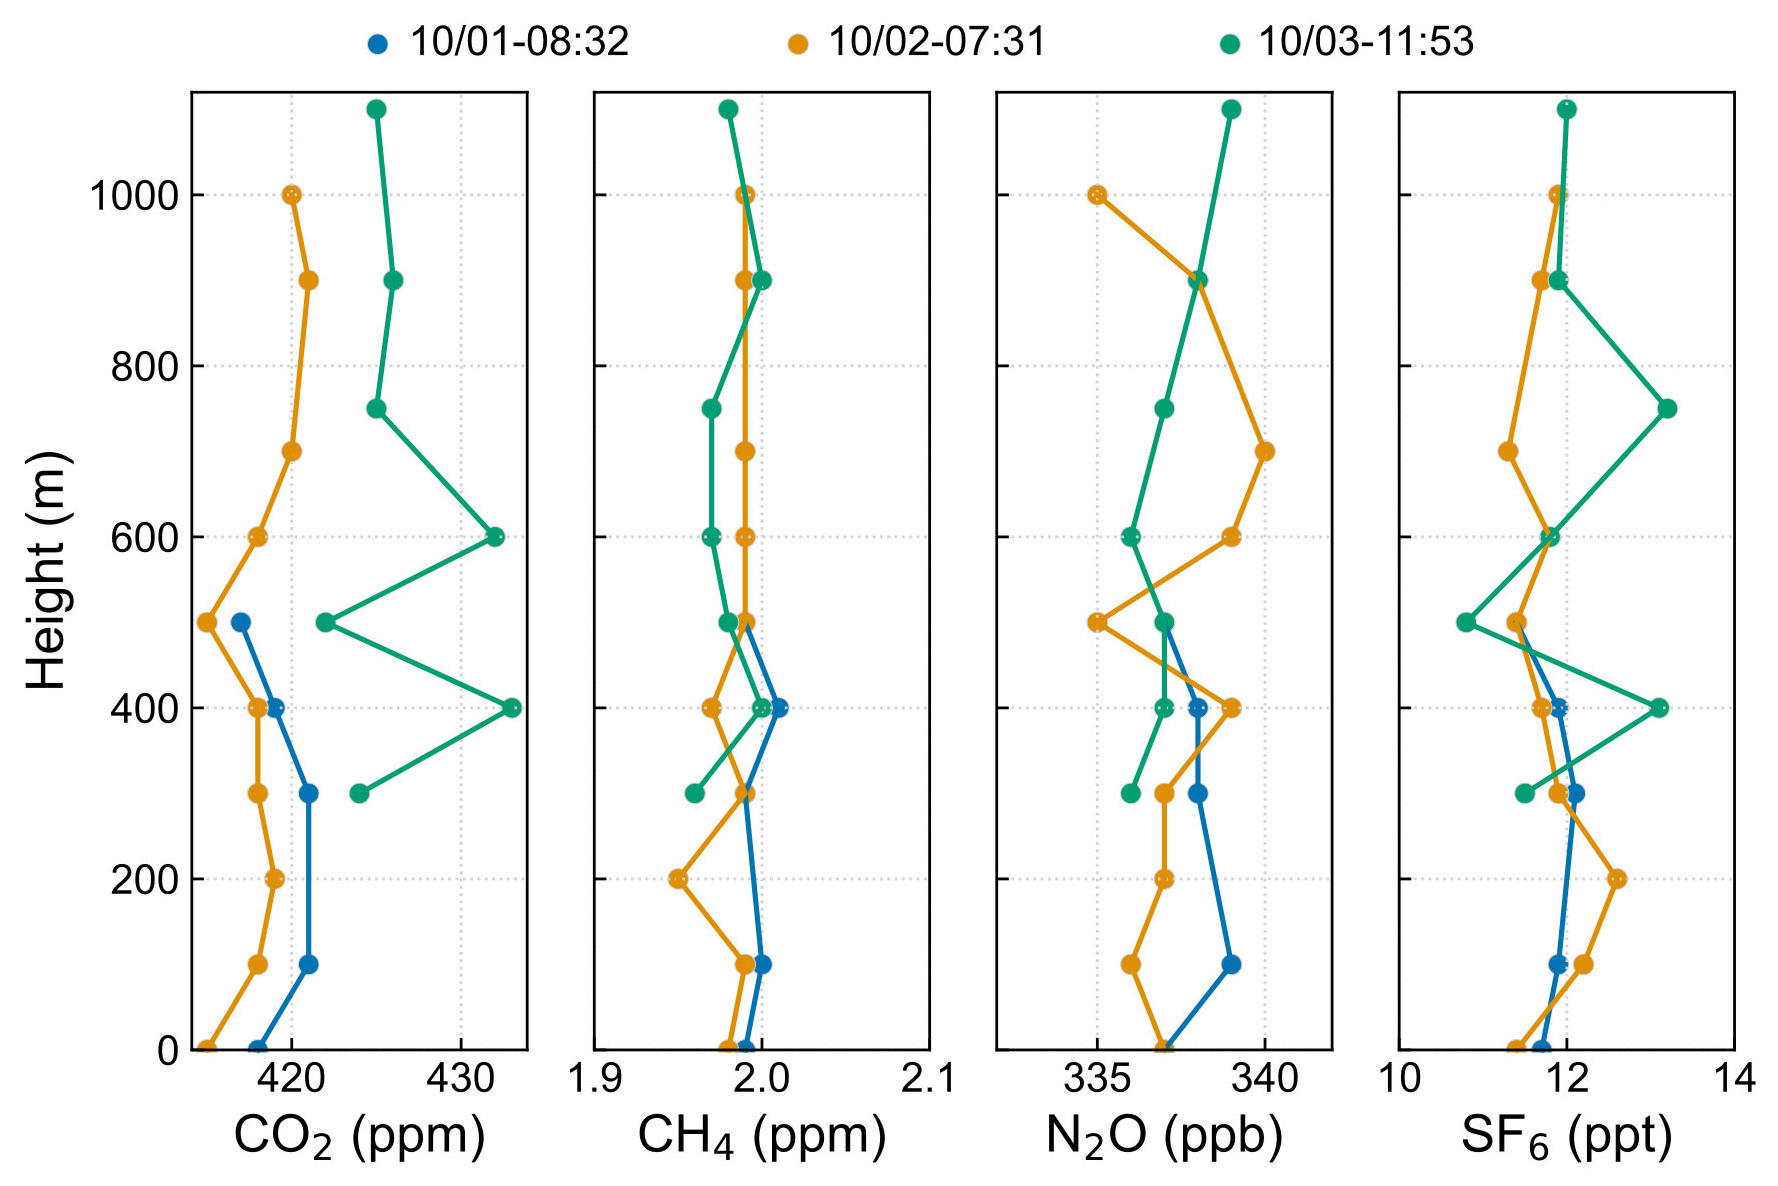
Figure 5Profiles of four components (CO2, CH4, N2O, SF6) analyzed from the Agilent GC 7890A; heights are measured by the iMET-XQ2 obtained in YF from 1 to 3 October. The profiles from 1 and 2 October are measured from ascents, and the profile from 3 October is from a descent. The date format is mm/dd-hh:mm (local time).
3.1 Sites
Field experiments were conducted at two high-altitude stations located on the Tibetan Plateau:
-
Mount Cho Oyu Base Camp (28.24° N, 86.59° E). This is a newly established temporary station with no previous greenhouse gas measurement records. Its base camp, located at 4950 m a.s.l., serves as the starting point for the scientific research team to the summit of Mount Cho Oyu, which is about 8201 m a.s.l., the sixth highest mountain in the world.
-
Mount Qomolangma Station, China Academy of Sciences (CAS; 28.36° N, 86.94° E). This station is located at 4300 m a.s.l. and is on the northern slope of Mount Qomolangma (8848.86 m a.s.l., the highest mountain in the world). This station was established in 2005 by the Institute of Tibetan Plateau Research, Chinese Academy of Sciences (Ma et al., 2023).
Both sites are located in Tingri County, in the jurisdictional area of the city of Rikaze, with detailed geographic location and elevation information provided in Fig. 4.
3.2 Results and analysis
Between 29 September and 3 October 2023, three flights were attempted in Cho Oyu, but only one flight succeeded due to bad weather conditions and MCU failures. On 3 October, the system was transported to Mount Qomolangma Station, and 12 flights were successfully conducted in the following 3 d.
During each flight, 10 bags were collected at 10 different altitudes, and it took about 40 min per flight. The flight and sampling information is listed in Table 1. In total, 139 samples were collected during the whole field campaign. The mean and standard deviation of the four greenhouse gases, as averaged across all samples, are listed in Table 2.
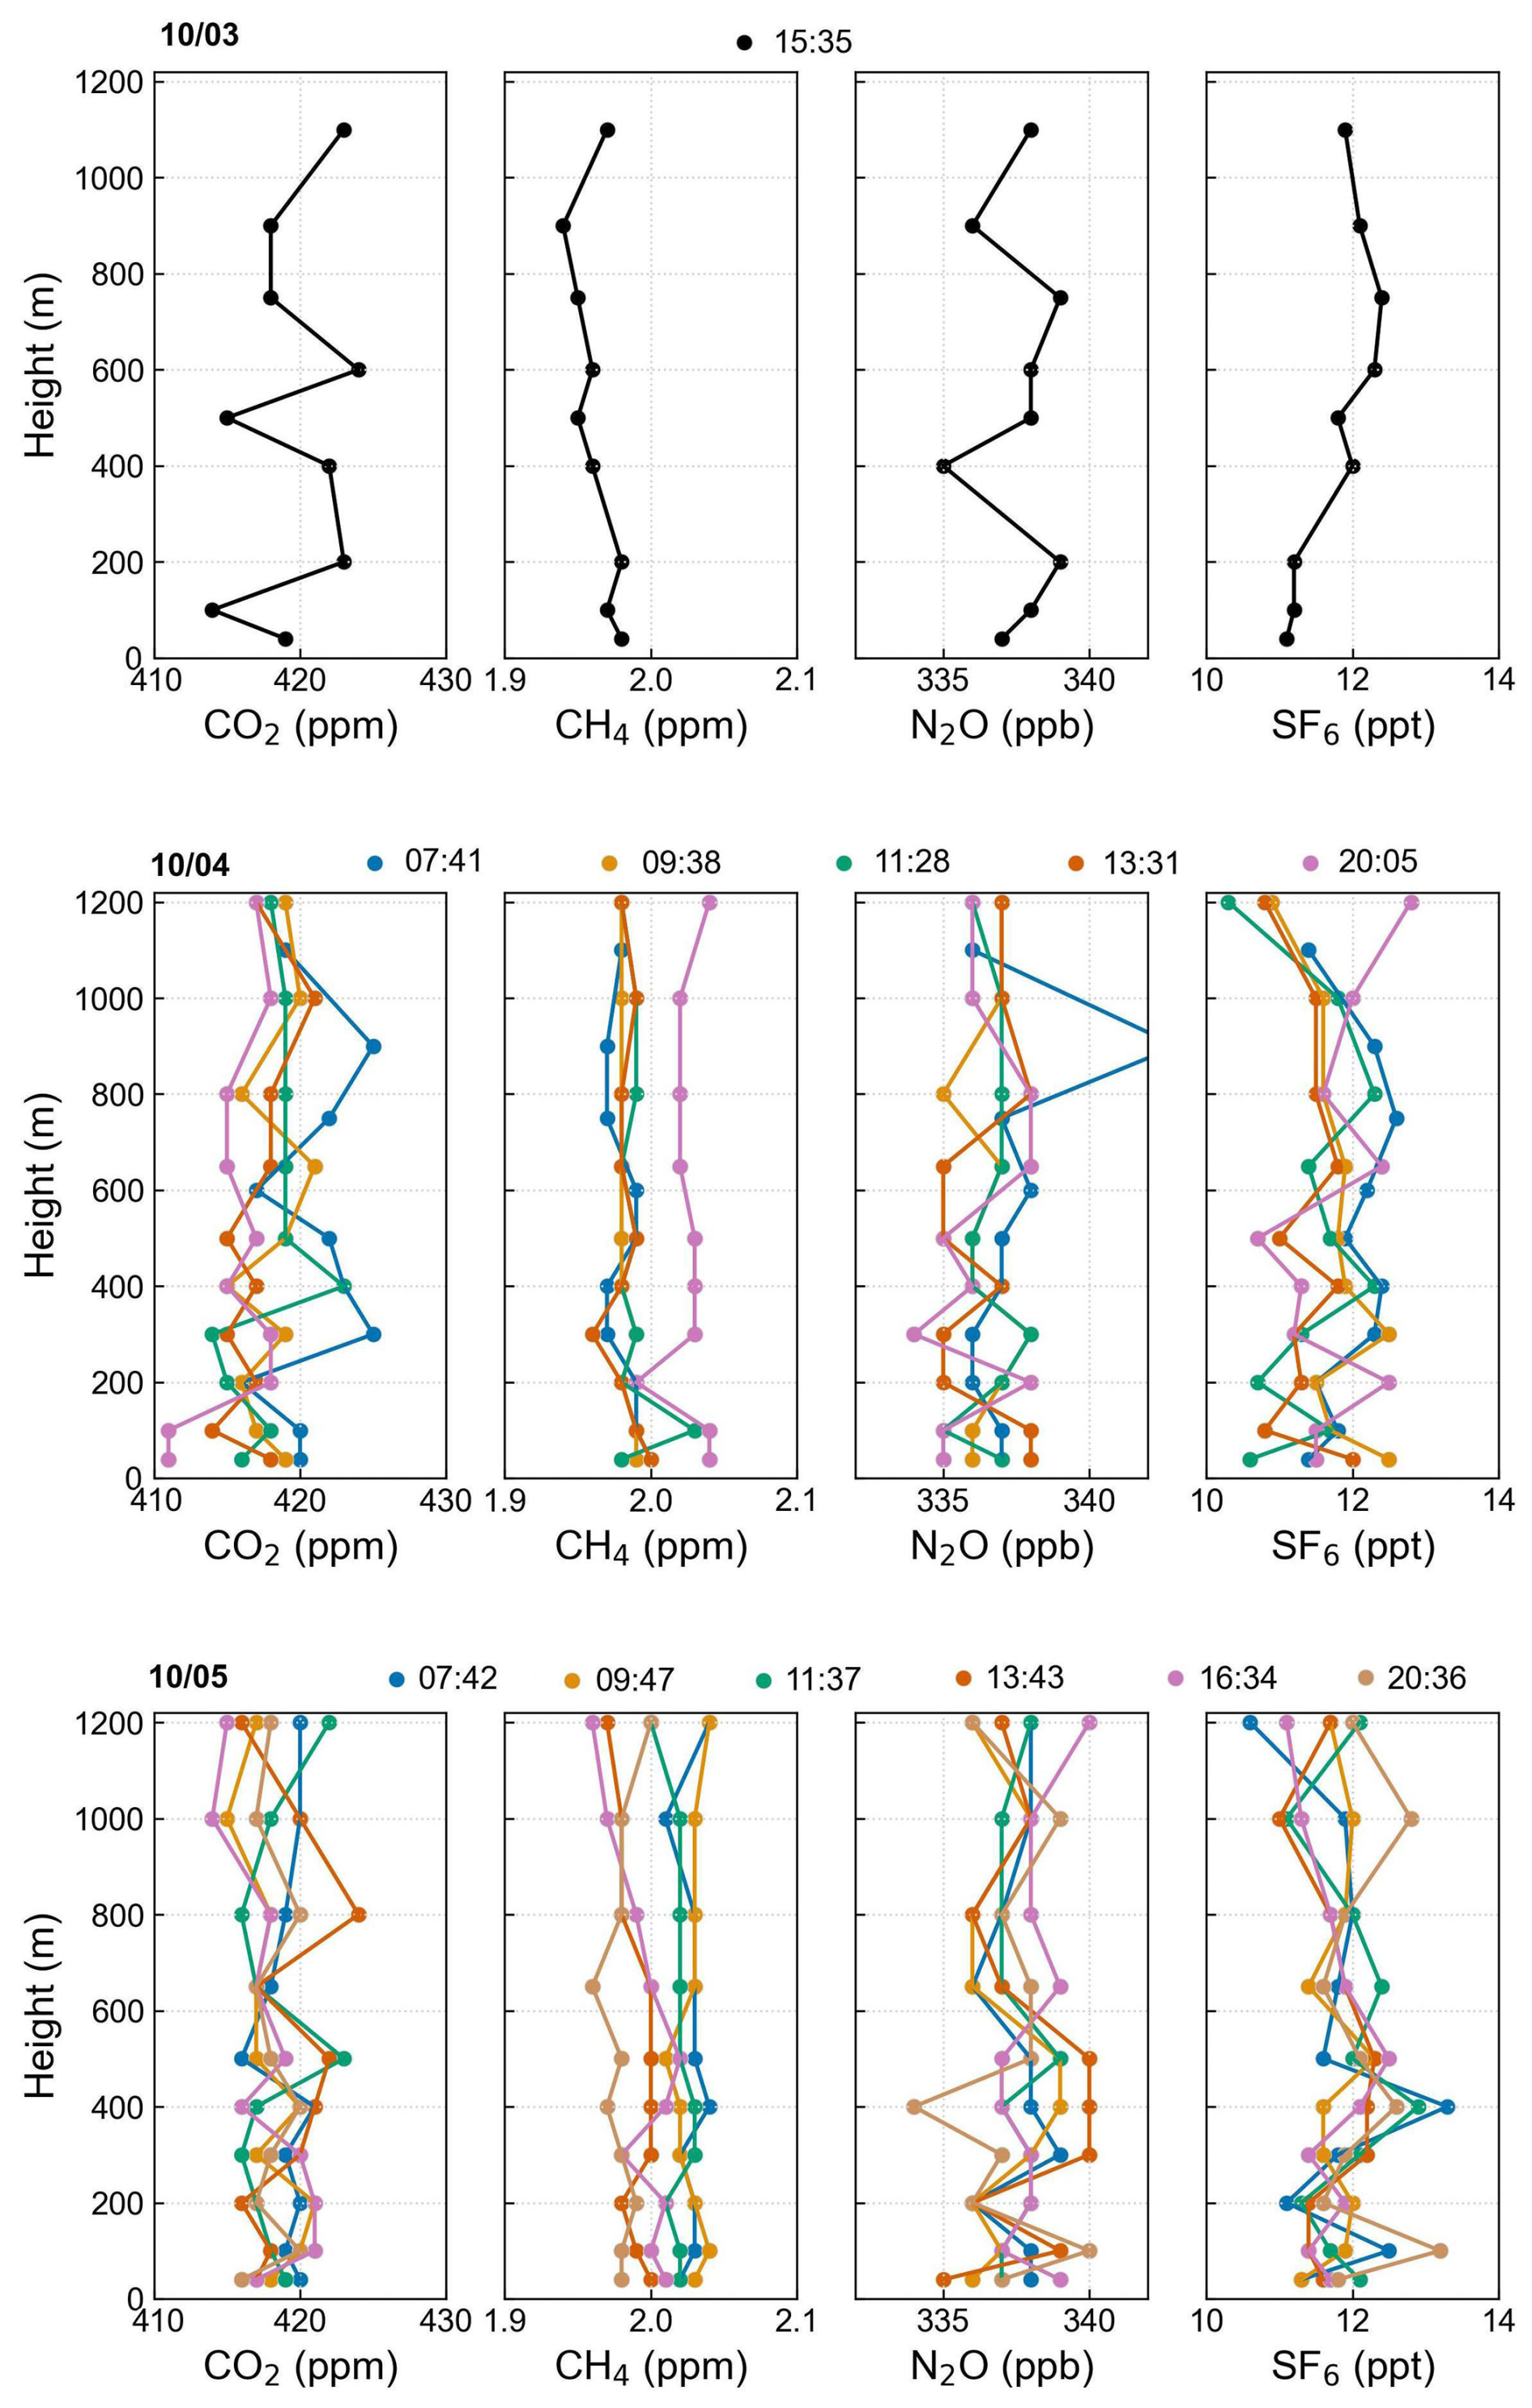
Figures 5 and 6 show the vertical distribution of the four species at the Cho Oyu site and Mount Qomolangma Station, respectively. Small fluctuations along altitude are observed in CO2, N2O, and SF6 profiles, likely due to atmospheric turbulence, whereas CH4 exhibits a more stable vertical distribution, ranging between 1.95 and 2.05 ppmv.
To examine the diurnal variation in GHGs, we compute the integral average of their mixing ratios. We also use ERA5 reanalysis data to determine the boundary layer height (BLH). This method allows us to categorize our samples into two distinct groups: those above the boundary layer and those below it. Figure 7 illustrates two time series of mixing ratios for four different species. The series for CO2, N2O, and SF6 show a consistent pattern; however, the variations in CO2 within the boundary layer height (BLH) are more pronounced than those above it. The downward trend observed on 4 October may reflect the intensification of natural processes due to sunlight and the increase in boundary layer height caused by solar heating. In contrast, CH4 is well mixed; trends were inversely correlated with BLH and showed a slight increase on the night of 4 October compared to the daytime. The increase in CH4 levels exceeded the relative standard deviation (RSD) of our equipment, which may be attributed to local livestock or meadow emissions. Accurately quantifying and assessing the contributions of these factors remains challenging due to limited observational data and insufficient information on emission sources and meteorological conditions.
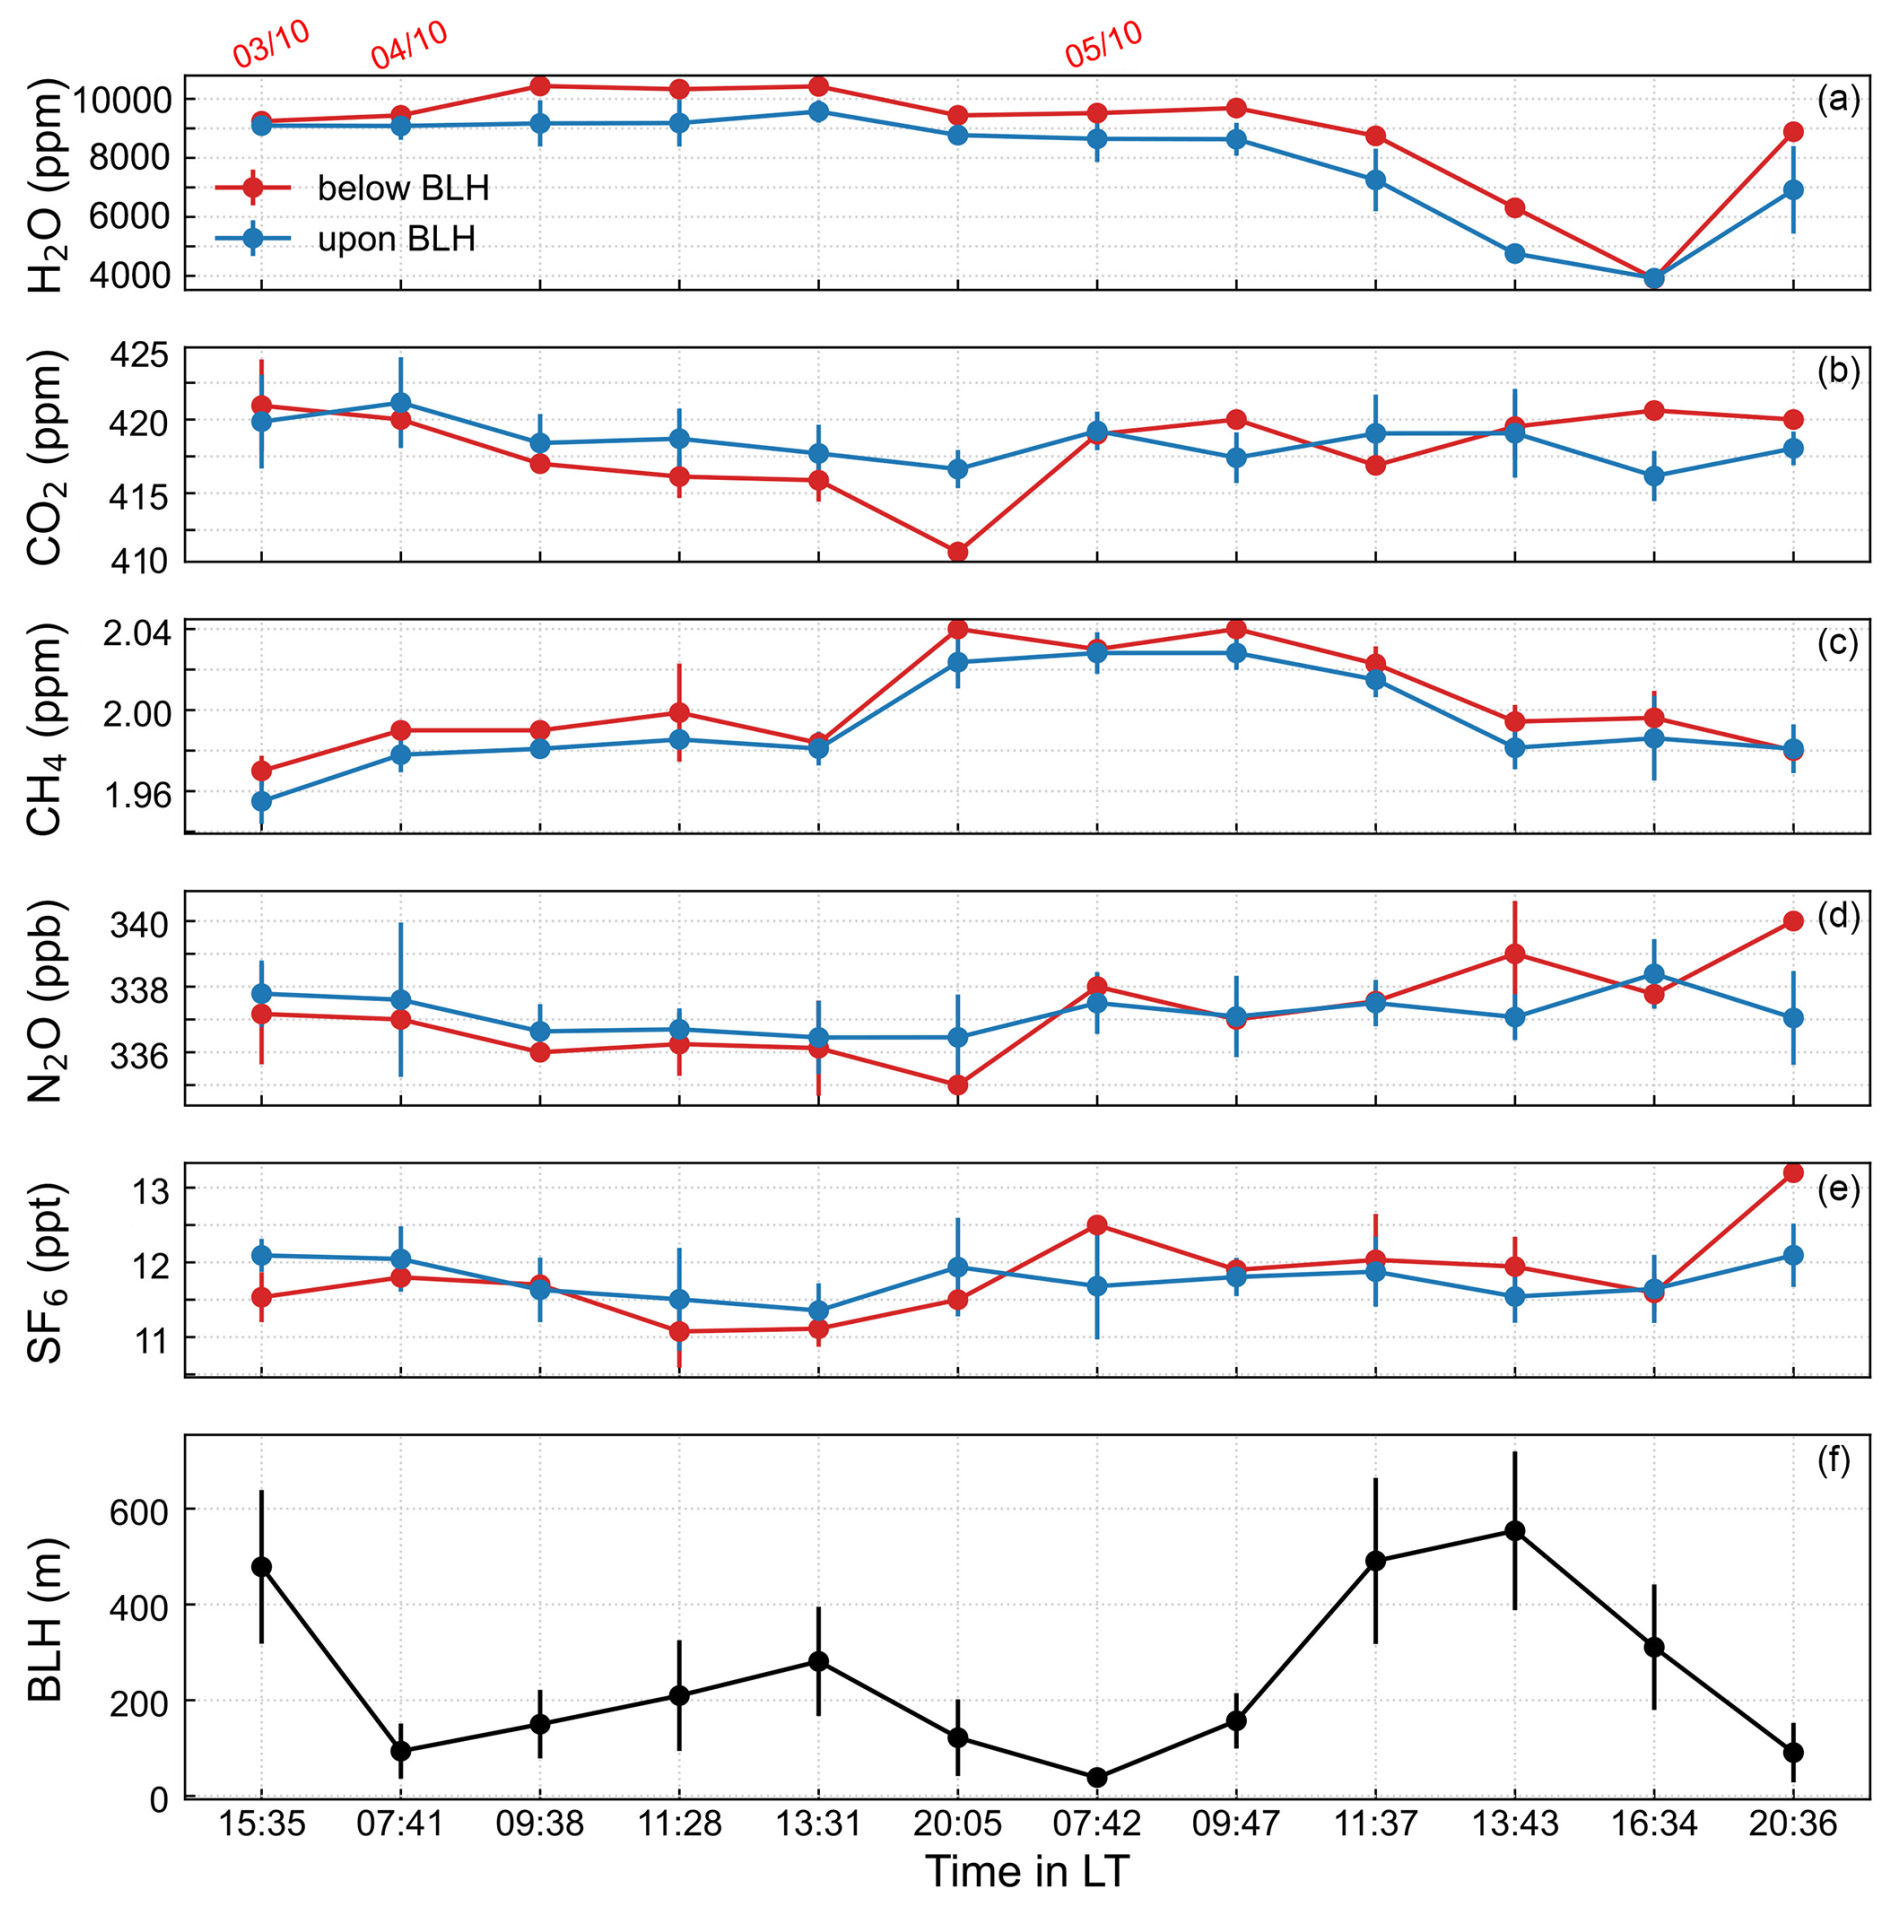
Figure 7(a–e) The time series for five components (H2O, CO2, CH4, N2O, SF6) in ZF from 3 to 5 October, with mixing ratios using integrated average values. (f) BLH at the takeoff location (28.36° N, 86.94° E) in meters above ground level, sourced from ERA5 data. Error bars represent the standard deviation of values across space.
In this study, we developed a simple vertical stratified atmospheric sampling device that can be mounted on a medium-sized UAV, a tethered balloon, or the roof of an electrical car, enabling the collection of air samples at different altitudes or in different locations during a single flight or cruise. After the collection is completed, the gas bag is closed to facilitate subsequent chromatography analysis to obtain the concentration of atmospheric components. At the same time, the device records the atmospheric temperature, pressure, humidity, and location of each air sample.
The device has the following advantages: (1) its flexible design and adaptability make it suitable for integration with a variety of analytical instruments, enabling three-dimensional monitoring across diverse platforms; (2) its cost is less than USD 5000, supporting widespread deployment and facilitating broader adoption in diverse research settings; and (3) once the MCU is pre-set before the flight, its automatic operation and quick response time ensure simplicity and ease of use. As a result, this device is well suited for extended periods of atmospheric observation and is minimally affected by terrain.
A 5 d continuous observation campaign was conducted at Mount Cho Oyu Base Camp and Mount Qomolangma Station. We integrated the sampling system into a medium-sized hexacopter UAV platform and obtained 15 GHG vertical profiles up to 1215 m. While the temporal variations in GHG mixing ratios provide valuable insights, the limited number of data restricts the further analysis on how long-range transport processes and local sources and sinks may have influenced the observed variations. Greenhouse gases like CO2 exhibit more pronounced variations within the boundary layer, while CH4 levels rise slightly at night, potentially due to local emissions. This nocturnal increase in CH4 could be linked to reduced atmospheric mixing during times of lower BLH, which leads to the accumulation of emissions near the surface. To enable continuous atmospheric monitoring (Kunz et al., 2018; Reuter et al., 2021), we still need to reduce the equipment weight for easier long-term deployment. Extending these campaigns to long-term experiments at monthly to seasonal scales would enable the assessment of the GHG distribution, elucidation of GHG sources and sinks, and disentanglement of the signals from local vertical mixing and long-range transport. It also has the potential to provide the prior value of vertical distributions of GHGs to calibrate and evaluate satellite retrievals over complex topography that have never been measured before.
Although using UAVs or balloons to monitor or inspect GHG distributions at various sites has proven to be useful, this method has its limitations, including a relatively low sample resolution, as only 10 samples are collected per deployment. This results in a much coarser atmospheric profile, which is more challenging to relate to the atmospheric boundary layer cycle. Additionally, the weight of the sampling device poses a challenge for smaller UAVs, making it less feasible for lightweight platforms. Adverse weather conditions such as strong winds can interfere with the safe flight of these devices and the GPS signal. Furthermore, it is not advisable to use this technique for monitoring chemically active gas components in case the gas component changes after sampling. To address these issues, we will continue to optimize the design of the device to improve its performance and adaptability. We expect it to be used in a wider range of applications, such as for understanding the sources and formation mechanisms of multiple gas tracers like air pollutants.
The observation data are available upon request from the corresponding author (dmz@mail.iap.ac.cn). The ERA5 data used in this study are accessible from the ECMWF web page: https://doi.org/10.24381/cds.adbb2d47 (Hersbach et al., 2023).
The supplement related to this article is available online at https://doi.org/10.5194/amt-18-1609-2025-supplement.
YZ, CQ, and MD contributed to the manufacturing of the sampling system. YW, MD, MZ, CQ, and YZ designed and conducted the campaign. YW, YZ, and CQ carried out the laboratory analyses, and YZ, MZ, MD, YW, and XT contributed to the preparation of the manuscript.
The contact author has declared that none of the authors has any competing interests.
Publisher’s note: Copernicus Publications remains neutral with regard to jurisdictional claims made in the text, published maps, institutional affiliations, or any other geographical representation in this paper. While Copernicus Publications makes every effort to include appropriate place names, the final responsibility lies with the authors.
We thank all field staff for their dedication and hard work during the experiments. We also appreciate the Public Technology Center for its technical support. Moreover, we are grateful to the reviewers and the editorial team for their feedback and suggestions, which have improved the paper's clarity and quality.
This research has been supported by the National Natural Science Foundation of China (42030107) and the Second Tibetan Plateau Scientific Expedition and Research Program (2022QZKK0101).
This paper was edited by Jian Xu and reviewed by two anonymous referees.
Bao, Z., Han, P., Zeng, N., Liu, D., Cai, Q., Wang, Y., Tang, G., Zheng, K., and Yao, B.: Observation and modeling of vertical carbon dioxide distribution in a heavily polluted suburban environment, Atmospheric and Oceanic Science Letters, 13, 371–379, 2020. a, b
Britto Hupsel de Azevedo, G., Doyle, B., Fiebrich, C. A., and Schvartzman, D.: Low-complexity methods to mitigate the impact of environmental variables on low-cost UAS-based atmospheric carbon dioxide measurements, Atmos. Meas. Tech., 15, 5599–5618, https://doi.org/10.5194/amt-15-5599-2022, 2022. a
Brosy, C., Krampf, K., Zeeman, M., Wolf, B., Junkermann, W., Schäfer, K., Emeis, S., and Kunstmann, H.: Simultaneous multicopter-based air sampling and sensing of meteorological variables, Atmos. Meas. Tech., 10, 2773–2784, https://doi.org/10.5194/amt-10-2773-2017, 2017. a
Buchwitz, M., de Beek, R., Noël, S., Burrows, J. P., Bovensmann, H., Bremer, H., Bergamaschi, P., Körner, S., and Heimann, M.: Carbon monoxide, methane and carbon dioxide columns retrieved from SCIAMACHY by WFM-DOAS: year 2003 initial data set, Atmos. Chem. Phys., 5, 3313–3329, https://doi.org/10.5194/acp-5-3313-2005, 2005. a
Byrne, B., Liu, J., Lee, M., Baker, I., Bowman, K. W., Deutscher, N. M., Feist, D. G., Griffith, D. W. T., Iraci, L. T., Kiel, M., Kimball, J. S., Miller, C. E., Morino, I., Parazoo, N. C., Petri, C., Roehl, C. M., Sha, M. K., Strong, K., Velazco, V. A., Wennberg, P. O., and Wunch, D.: Improved Constraints on Northern Extratropical CO2 Fluxes Obtained by Combining Surface-Based and Space-Based Atmospheric CO2 Measurements, J. Geophys. Res.-Atmos., 125, e2019JD032029, https://doi.org/10.1029/2019JD032029, 2020. a
Carnell, R. and Senior, C.: Changes in mid-latitude variability due to increasing greenhouse gases and sulphate aerosols, Clim. Dynam., 14, 369–383, 1998. a
Chang, C.-C., Chang, C.-Y., Wang, J.-L., Pan, X.-X., Chen, Y.-C., and Ho, Y.-J.: An optimized multicopter UAV sounding technique (MUST) for probing comprehensive atmospheric variables, Chemosphere, 254, 126867, https://doi.org/10.1016/j.chemosphere.2020.126867, 2020. a
Chevallier, F., Remaud, M., O'Dell, C. W., Baker, D., Peylin, P., and Cozic, A.: Objective evaluation of surface- and satellite-driven carbon dioxide atmospheric inversions, Atmos. Chem. Phys., 19, 14233–14251, https://doi.org/10.5194/acp-19-14233-2019, 2019. a
Etts, D., Rossi, M., Nzaou, R., Zhu, R., Lewin, G. C., and de Wekker, S. F.: Development of an autonomous multi-rotor copter for collecting atmospheric data near the ground, in: 2015 Systems and Information Engineering Design Symposium, Charlottesville, VA, USA, 24–24 April 2015, 120–124, https://doi.org/10.1109/SIEDS.2015.7116958, 2015. a
Friedlingstein, P., O'Sullivan, M., Jones, M. W., Andrew, R. M., Bakker, D. C. E., Hauck, J., Landschützer, P., Le Quéré, C., Luijkx, I. T., Peters, G. P., Peters, W., Pongratz, J., Schwingshackl, C., Sitch, S., Canadell, J. G., Ciais, P., Jackson, R. B., Alin, S. R., Anthoni, P., Barbero, L., Bates, N. R., Becker, M., Bellouin, N., Decharme, B., Bopp, L., Brasika, I. B. M., Cadule, P., Chamberlain, M. A., Chandra, N., Chau, T.-T.-T., Chevallier, F., Chini, L. P., Cronin, M., Dou, X., Enyo, K., Evans, W., Falk, S., Feely, R. A., Feng, L., Ford, D. J., Gasser, T., Ghattas, J., Gkritzalis, T., Grassi, G., Gregor, L., Gruber, N., Gürses, Ö., Harris, I., Hefner, M., Heinke, J., Houghton, R. A., Hurtt, G. C., Iida, Y., Ilyina, T., Jacobson, A. R., Jain, A., Jarníková, T., Jersild, A., Jiang, F., Jin, Z., Joos, F., Kato, E., Keeling, R. F., Kennedy, D., Klein Goldewijk, K., Knauer, J., Korsbakken, J. I., Körtzinger, A., Lan, X., Lefèvre, N., Li, H., Liu, J., Liu, Z., Ma, L., Marland, G., Mayot, N., McGuire, P. C., McKinley, G. A., Meyer, G., Morgan, E. J., Munro, D. R., Nakaoka, S.-I., Niwa, Y., O'Brien, K. M., Olsen, A., Omar, A. M., Ono, T., Paulsen, M., Pierrot, D., Pocock, K., Poulter, B., Powis, C. M., Rehder, G., Resplandy, L., Robertson, E., Rödenbeck, C., Rosan, T. M., Schwinger, J., Séférian, R., Smallman, T. L., Smith, S. M., Sospedra-Alfonso, R., Sun, Q., Sutton, A. J., Sweeney, C., Takao, S., Tans, P. P., Tian, H., Tilbrook, B., Tsujino, H., Tubiello, F., van der Werf, G. R., van Ooijen, E., Wanninkhof, R., Watanabe, M., Wimart-Rousseau, C., Yang, D., Yang, X., Yuan, W., Yue, X., Zaehle, S., Zeng, J., and Zheng, B.: Global Carbon Budget 2023, Earth Syst. Sci. Data, 15, 5301–5369, https://doi.org/10.5194/essd-15-5301-2023, 2023. a
Glaser, K., Vogt, U., Baumbach, G., Volz-Thomas, A., and Geiss, H.: Vertical profiles of O3, NO2, NOx, VOC, and meteorological parameters during the Berlin Ozone Experiment (BERLIOZ) campaign, J. Geophys. Res.-Atmos., 108, https://doi.org/10.1029/2002JD002475, 2003. a
Han, T., Xie, C., Liu, Y., Yang, Y., Zhang, Y., Huang, Y., Gao, X., Zhang, X., Bao, F., and Li, S.-M.: Development of a continuous UAV-mounted air sampler and application to the quantification of CO2 and CH4 emissions from a major coking plant, Atmos. Meas. Tech., 17, 677–691, https://doi.org/10.5194/amt-17-677-2024, 2024. a
Haszpra, L., Ramonet, M., Schmidt, M., Barcza, Z., Pátkai, Zs., Tarczay, K., Yver, C., Tarniewicz, J., and Ciais, P.: Variation of CO2 mole fraction in the lower free troposphere, in the boundary layer and at the surface, Atmos. Chem. Phys., 12, 8865–8875, https://doi.org/10.5194/acp-12-8865-2012, 2012. a
Hersbach, H., Bell, B., Berrisford, P., Biavati, G., Horányi, A., Muñoz Sabater, J., Nicolas, J., Peubey, C., Radu, R., Rozum, I., Schepers, D., Simmons, A., Soci, C., Dee, D., and Thépaut, J.-N.: ERA5 hourly data on single levels from 1940 to present, Copernicus Climate Change Service (C3S) Climate Data Store (CDS) [data set], https://doi.org/10.24381/cds.adbb2d47, 2023. a
IPCC: Global warming of 1.5°C. An IPCC special report on the impacts of global warming of 1.5°C above pre-industrial levels and related global greenhouse gas emission pathways, in the context of strengthening the global response to the threat of climate change, sustainable development, and efforts to eradicate poverty, Cambridge University Press, 2018. a
IPCC: Climate Change 2021: The Physical Science Basis, Contribution of Working Group I to the Sixth Assessment Report of the Intergovernmental Panel on Climate Change, Cambridge University Press, Cambridge, United Kingdom and New York, NY, USA, https://doi.org/10.1017/9781009157896, 2021. a
Jiang, F., Wang, H. W., Chen, J. M., Zhou, L. X., Ju, W. M., Ding, A. J., Liu, L. X., and Peters, W.: Nested atmospheric inversion for the terrestrial carbon sources and sinks in China, Biogeosciences, 10, 5311–5324, https://doi.org/10.5194/bg-10-5311-2013, 2013. a
Jin, Z., Tian, X., Wang, Y., Zhang, H., Zhao, M., Wang, T., Ding, J., and Piao, S.: A global surface CO2 flux dataset (2015–2022) inferred from OCO-2 retrievals using the GONGGA inversion system, Earth Syst. Sci. Data, 16, 2857–2876, https://doi.org/10.5194/essd-16-2857-2024, 2024. a
Kuma, P., McDonald, A. J., Morgenstern, O., Querel, R., Silber, I., and Flynn, C. J.: Ground-based lidar processing and simulator framework for comparing models and observations (ALCF 1.0), Geosci. Model Dev., 14, 43–72, https://doi.org/10.5194/gmd-14-43-2021, 2021. a
Kunz, M., Lavric, J. V., Gerbig, C., Tans, P., Neff, D., Hummelgård, C., Martin, H., Rödjegård, H., Wrenger, B., and Heimann, M.: COCAP: a carbon dioxide analyser for small unmanned aircraft systems, Atmos. Meas. Tech., 11, 1833–1849, https://doi.org/10.5194/amt-11-1833-2018, 2018. a, b
Li, Y., Deng, J., Mu, C., Xing, Z., and Du, K.: Vertical distribution of CO2 in the atmospheric boundary layer: Characteristics and impact of meteorological variables, Atmos. Environ., 91, 110–117, https://doi.org/10.1016/j.atmosenv.2014.03.067, 2014. a
Liu, Y., Paris, J.-D., Vrekoussis, M., Antoniou, P., Constantinides, C., Desservettaz, M., Keleshis, C., Laurent, O., Leonidou, A., Philippon, C., Vouterakos, P., Quéhé, P.-Y., Bousquet, P., and Sciare, J.: Improvements of a low-cost CO2 commercial nondispersive near-infrared (NDIR) sensor for unmanned aerial vehicle (UAV) atmospheric mapping applications, Atmos. Meas. Tech., 15, 4431–4442, https://doi.org/10.5194/amt-15-4431-2022, 2022. a
Loftfield, N., Flessa, H., Augustin, J., and Beese, F.: Automated gas chromatographic system for rapid analysis of the atmospheric trace gases methane, carbon dioxide, and nitrous oxide, J. Environ. Qual., 26, 560–564, 1997. a
Ma, Y., Xie, Z., Ma, W., Han, C., Sun, F., Sun, G., Liu, L., Lai, Y., Wang, B., Liu, X., Zhao, W., Ma, W., Wang, F., Sun, L., Ma, B., Han, Y., Wang, Z., and Xi, Z.: QOMS: A Comprehensive Observation Station for Climate Change Research on the Top of Earth, B. Am. Meteor. Soc., 104, E563–E584, https://doi.org/10.1175/BAMS-D-22-0084.1, 2023. a
Neumann, P. P. and Bartholmai, M.: Real-time wind estimation on a micro unmanned aerial vehicle using its inertial measurement unit, Sensor. Actuat. A-Phys., 235, 300–310, https://doi.org/10.1016/j.sna.2015.09.036, 2015. a
Niwa, Y., Machida, T., Sawa, Y., Matsueda, H., Schuck, T. J., Brenninkmeijer, C. A. M., Imasu, R., and Satoh, M.: Imposing strong constraints on tropical terrestrial CO2 fluxes using passenger aircraft based measurements, J. Geophys. Res.-Atmos., 117, https://doi.org/10.1029/2012JD017474, 2012. a
O'Dell, C. W., Connor, B., Bösch, H., O'Brien, D., Frankenberg, C., Castano, R., Christi, M., Eldering, D., Fisher, B., Gunson, M., McDuffie, J., Miller, C. E., Natraj, V., Oyafuso, F., Polonsky, I., Smyth, M., Taylor, T., Toon, G. C., Wennberg, P. O., and Wunch, D.: The ACOS CO2 retrieval algorithm – Part 1: Description and validation against synthetic observations, Atmos. Meas. Tech., 5, 99–121, https://doi.org/10.5194/amt-5-99-2012, 2012. a
Ramanathan, A. K., Nguyen, H. M., Sun, X., Mao, J., Abshire, J. B., Hobbs, J. M., and Braverman, A. J.: A singular value decomposition framework for retrievals with vertical distribution information from greenhouse gas column absorption spectroscopy measurements, Atmos. Meas. Tech., 11, 4909–4928, https://doi.org/10.5194/amt-11-4909-2018, 2018. a
Ren, W., Tian, H., Xu, X., Liu, M., Lu, C., Chen, G., Melillo, J., Reilly, J., and Liu, J.: Spatial and temporal patterns of CO2 and CH4 fluxes in China's croplands in response to multifactor environmental changes, Tellus B, 63, 222–240, 2011. a
Reuder, J., Båserud, L., Jonassen, M. O., Kral, S. T., and Müller, M.: Exploring the potential of the RPA system SUMO for multipurpose boundary-layer missions during the BLLAST campaign, Atmos. Meas. Tech., 9, 2675–2688, https://doi.org/10.5194/amt-9-2675-2016, 2016. a
Reuter, M., Bovensmann, H., Buchwitz, M., Borchardt, J., Krautwurst, S., Gerilowski, K., Lindauer, M., Kubistin, D., and Burrows, J. P.: Development of a small unmanned aircraft system to derive CO2 emissions of anthropogenic point sources, Atmos. Meas. Tech., 14, 153–172, https://doi.org/10.5194/amt-14-153-2021, 2021. a, b
Sun, X., Duan, M., Gao, Y., Han, R., Ji, D., Zhang, W., Chen, N., Xia, X., Liu, H., and Huo, Y.: In situ measurement of CO2 and CH4 from aircraft over northeast China and comparison with OCO-2 data, Atmos. Meas. Tech., 13, 3595–3607, https://doi.org/10.5194/amt-13-3595-2020, 2020. a
Wang, Y., Wang, Y., and Ling, H.: A new carrier gas type for accurate measurement of N2O by GC-ECD, Adv. Atmos. Sci., 27, 1322–1330, https://doi.org/10.1007/s00376-010-9212-2, 2010. a
Wheeler, M., Newman, S., Orr-Ewing, A., and Ashfold, M.: Cavity ring-down spectroscopy, J. Chem. Soc. Faraday T., 94, 337–351, https://doi.org/10.1039/A707686J, 1998. a
Wilkinson, J., Bors, C., Burgis, F., Lorke, A., and Bodmer, P.: Measuring CO2 and CH4 with a portable gas analyzer: Closed-loop operation, optimization and assessment, PloS one, 13, e0193973, https://doi.org/10.1371/journal.pone.0193973, 2018. a
Wunch, D., Toon, G. C., Blavier, J.-F. L., Washenfelder, R. A., Notholt, J., Connor, B. J., Griffith, D. W., Sherlock, V., and Wennberg, P. O.: The total carbon column observing network, P. T. R. Soc. A, 369, 2087–2112, https://doi.org/10.1098/rsta.2010.0240, 2011. a
Xie, S.-P., Lu, B., and Xiang, B.: Similar spatial patterns of climate responses to aerosol and greenhouse gas changes, Nat. Geosci., 6, 828–832, 2013. a
Yoshida, Y., Kikuchi, N., Morino, I., Uchino, O., Oshchepkov, S., Bril, A., Saeki, T., Schutgens, N., Toon, G. C., Wunch, D., Roehl, C. M., Wennberg, P. O., Griffith, D. W. T., Deutscher, N. M., Warneke, T., Notholt, J., Robinson, J., Sherlock, V., Connor, B., Rettinger, M., Sussmann, R., Ahonen, P., Heikkinen, P., Kyrö, E., Mendonca, J., Strong, K., Hase, F., Dohe, S., and Yokota, T.: Improvement of the retrieval algorithm for GOSAT SWIR XCO2 and XCH4 and their validation using TCCON data, Atmos. Meas. Tech., 6, 1533–1547, https://doi.org/10.5194/amt-6-1533-2013, 2013. a
Yuesi, W. and Yinghong, W.: Quick measurement of CH4, CO2 and N2O emissions from a short-plant ecosystem, Adv. Atmos. Sci., 20, 842–844, https://doi.org/10.1007/BF02915410, 2003. a