the Creative Commons Attribution 4.0 License.
the Creative Commons Attribution 4.0 License.
 | 11 Apr 2025
Wet-radome attenuation in ARM cloud radars and its utilization in radar calibration using disdrometer measurements
Scott E. Giangrande
Michael P. Jensen
Karen Johnson
Christopher R. Williams
Jennifer M. Comstock
Ya-Chien Feng
Alyssa Matthews
Iosif A. Lindenmaier
Timothy G. Wendler
Marquette Rocque
Aifang Zhou
Edward Luke
A relative calibration technique has been developed for the US Department of Energy's (DOE's) Atmospheric Radiation Measurement (ARM) user facility Ka-band ARM Zenith Radars (KAZRs). This method uses the signal attenuation caused by water on the radome to estimate reflectivity factor (Ze) offsets. The wet-radome attenuation (WRA) is assumed to follow a log-linear relationship with rainfall rate during light and moderate rain, as measured by a collocated surface disdrometer. The technique has an uncertainty of approximately 3 dB, due to factors such as disdrometer measurement error, rain variability between radar and disdrometer sample volumes, and the fitting function's uncertainty for the WRA behavior. A practical advantage of this WRA-based approach to shorter-wavelength radar monitoring is that, while it requires a reference disdrometer, it proves feasible for a wider range of collocated disdrometer measurements compared to traditional direct disdrometer comparison at the onset of light rain. This technique thus offers a cost-effective monitoring tool for remote or long-term radar deployments.
This calibration technique was applied during the ARM Tracking Aerosol Convection Interactions Experiment (TRACER) from October 2021 through September 2022. The estimated Ze offsets were compared against traditional radar calibration and monitoring methods using available datasets from this campaign. Results show that the WRA-based offsets align closely with mean offsets found between cloud radars and from direct disdrometer comparison near the onset of rain, while also reflecting similar offset and campaign-long trends when compared to collocated, independently calibrated radar wind profilers. Nevertheless, overall, the KAZR Ze offsets estimated during TRACER remained stable at approximately 2 dB lower than the disdrometer estimates from the campaign start until the end of June 2022; afterward, the offsets increased to around 7 dB by the campaign's end. This increase is linked to a drop of about 1 dB in transmitter power toward the end of the project.
- Article
(3502 KB) - Full-text XML
-
Supplement
(461 KB) - BibTeX
- EndNote


The US Department of Energy's (DOE's) Atmospheric Radiation Measurement (ARM) user facility operates millimeter-wavelength cloud radars (35 and 94 GHz) at various global fixed and mobile sites (e.g., Mather and Voyles, 2013; Miller et al., 2016; Kollias et al., 2007, 2020). These “cloud” radars are often more sensitive than traditional centimeter-wavelength weather radars, allowing them to detect cloud droplets more effectively. However, this sensitivity comes with a trade-off, as shorter wavelengths are prone to partial or complete attenuation in clouds and precipitation. Such attenuation introduces uncertainties in key radar-derived properties like reflectivity factor (Ze), affecting cloud and hydrological retrieval accuracy (e.g., Matrosov, 2005; Deng et al., 2014; Zhu et al., 2019).
Given the importance of accurate Ze measurements, the routine deployment and operation of cloud radars necessitate frequent calibration and monitoring activities. In general, more rigorous radar calibration efforts can be implemented (e.g., Yanovsky et al., 2023), but these approaches are often system-specific and require highly skilled engineers or technicians, significant time, and specialized equipment (within ARM; e.g., Mead, 2010). For weather and climate applications, radar-based research has increasingly turned to “relative” calibration techniques, which rely on Ze estimates from nearby reference instruments or expectations based on intrinsic properties of the hydrometeors or other media (e.g., Bringi and Chandrasekar, 2001; Giangrande and Ryzhkov, 2005; Protat et al., 2011; Kollias et al., 2019; Maahn et al., 2019; Williams et al., 2023). Several of these “natural” calibration concepts have proven effective for quantifying radar performance in many hydrological applications requiring Ze estimates within 2–3 dB. The simplest approach is often a cross-comparison of Ze characteristics with collocated, calibrated reference radars. For example, extended comparisons of clouds near ARM ground sites using CloudSat radar measurements have successfully monitored the long-term ARM cloud radar record (Protat et al., 2011; Kollias et al., 2019). For finer-scale comparisons during ARM deployments, the Ka-band ARM Zenith Radar (KAZR) is often collocated with a radar wind profiler (RWP; 915 or 1290 MHz) and the Ka- and X-band Scanning ARM Cloud Radar (KaSACR/XSACR), which are easier to monitor using independent techniques better suited to scanning and/or longer-wavelength radar.
Among the various methods of relative cloud radar monitoring, a common approach relies on surface disdrometer observations. The reflectivity factor can be estimated for assumed rain properties using techniques such as T-matrix scattering algorithms applied to the drop size distribution of rain measured by the surface disdrometer (Mishchenko et al., 1996). Comparing radar-measured reflectivity near the surface with disdrometer-estimated reflectivity provides a common way to estimate radar calibration offsets (e.g., Kollias et al., 2019; Myagkov et al., 2020; Yanovsky et al., 2023; and Lamer et al., 2021). Disdrometer comparison techniques like this have been implemented as routine procedures for radar monitoring, such as in the Aerosol, Clouds and Trace Gases Research Infrastructure (ACTRIS) network in Europe (Dupont et al., 2022). For radars that experience negligible attenuation in rain, such procedures are often straightforward to implement across a variety of widespread precipitating conditions (e.g., Williams et al., 2023). However, for shorter radar wavelengths, where gaseous attenuation, rain attenuation, and wet-radome attenuation are not negligible, applying this approach can be more complicated.
Specifically, the two-way attenuation associated with radome wetting (referred to here as wet-radome attenuation or WRA) is a well-known phenomenon. During rainfall, water droplets bead on the surface of the radar radome, forming a wet film that eventually flows off the radome once it reaches sufficient mass, similarly to the water layer on a car window. Droplets impacting the radome during persistent rain further alter the water depth through bouncing and splashing (Gibble, 1964; Anderson, 1975; Yu et al., 2021). For long-wavelength radars, WRA is often considered negligible (Thompson et al., 2012; Kurri and Huuskonen, 2008). However, for shorter-wavelength radars, the impact of WRA is potentially more significant. For example, at X-band, Bechini et al. (2010) and Gorgucci et al. (2013) observed a loss of 5 dB in moderate rain by comparing simultaneous X-band radar measurements using spherical radomes with a collocated video disdrometer. This WRA has been shown to depend on the thickness of the water film (d) on the radome, which in turn is a function of rain rate, as described by the Gibble formula (Gibble, 1964; Anderson, 1975):
where μk is the kinematic viscosity of water (that also varies with temperature), r is the radome radius, R is the rain rate, and g is the gravitational acceleration. Additional relations between WRA and R were developed based on the Gibble's formula by Frasier et al. (2013) and Gorgucci et al. (2013) for X-band radar calibration studies.
Few studies have considered WRA for assessing cloud radar offsets at Ka-band (35 GHz). As the water absorption coefficient is inversely proportional to wavelength (Bertie et al., 1996; Segelstein, 1981), the WRA at Ka-band is approximately 3 times that at X-band for the same depth of rainwater on the radome. It is understood that WRA will impact direct estimates of the offset between cloud radar and disdrometer Ze estimates in rainy conditions, and faulty offset assessment after rain ends may occur owing to extended radome drying delays. Therefore, direct comparison concepts previously cited typically consider only the periphery cloud, drizzle, or light rain conditions (i.e., R < 1–2 mm h−1) at the onset of a rainfall event to minimize various forms of attenuation. This is often a very stringent and subjective employment of these conditions: firstly, it limits the opportunities for direct disdrometer monitoring of cloud radar to a selected window of rainfall rates and event timing. Identifying these light rain or drizzling conditions is also contingent on the requirements for collecting high-quality disdrometer measurements (i.e., those that require significant droplet number counts), wherein a separate rain rate cut-off may be required to avoid significant WRA. Overall, it is potentially useful to establish other forms of cloud radar monitoring that could benefit from a wider range of observations collected during the precipitation window.
In this study, we first identify intervals of WRA for Ka-band radars by comparing observations from ARM's KAZR with a collocated suite of instruments, including a surface disdrometer, a calibrated RWP, and KaSACR/XSACR observations collected in vertical pointing (VPT) modes during the Tracking Aerosol Convection Interactions Experiment (TRACER). We then develop a new WRA fitting technique and apply it to calibrate the Ze offset for KAZR using TRACER measurements. The performance of this technique is evaluated against three traditional relative calibration or monitoring methods for Ka-band radar: (i) direct disdrometer comparisons of Ze in light rain at the onset of rain events, (ii) a cross-comparison with independently calibrated RWP measurements, and (iii) a cross-comparison with collocated scanning KaSACR measurements.
The paper is organized as follows. Section 2 introduces the radar datasets and supporting TRACER datasets used in this study. In Sect. 3, a relative calibration technique is developed with daily KAZR and KaSACR measurements collected during light and moderate rainfall conditions. In Sect. 4, the technique is applied to the KAZR measurements during the TRACER campaign to assess the long-term calibration offset trend for KAZR, and the result is evaluated against other calibration methods. A summary of the performance of this WRA technique for relative offset monitoring is provided in Sect. 5.
The TRACER campaign took place in the Houston, TX, region from 1 October 2021 to 30 September 2022 (Jensen et al., 2019a, 2022, and 2023) with the goal of studying the interactions of aerosols and convective clouds. The main surface measurement site was located at La Porte, TX, housed the deployment of the first ARM Mobile Facility (AMF1; Miller et al., 2016). The AMF1 consists of several ground-based remote-sensing and profiling instruments, and it included the deployment of the KAZR, KaSACR/XSACR, and radar wind profiler (RWP) units that serve as the radars for this study. The surface instrumentation also included multiple laser and video disdrometers as reference anchors.
2.1 TRACER cloud radars (KAZR and KaSACR/XSACR)
The KAZR (Widener et al., 2012) is a successor to ARM's highly successful millimeter-wavelength cloud radar (MMCR). The KAZR has a flat radome inclined at 4°. A complete list of KAZR specifications is provided in Table 1. The KAZR transmits and receives two types of pulses: (i) the burst pulse, a simple narrow pulse of radio-frequency energy (referred to as the “GE” mode), and (ii) the chirp pulse, a longer, frequency-modulated pulse with higher transmitted energy and greater sensitivity but with data collection starting at a higher range due to the larger blind zone imposed by the longer pulse length (referred to as the “MD” mode). Although the MD mode is more sensitive to clouds (i.e., has a lower minimum detectable Ze), only the KAZR GE-mode data are used for disdrometer comparisons, as near-surface observations are required.
Table 1List of parameters for KAZR GE mode, KaSACR/XSACR in vertical pointing (VPT) mode, and RWP in precipitation mode.
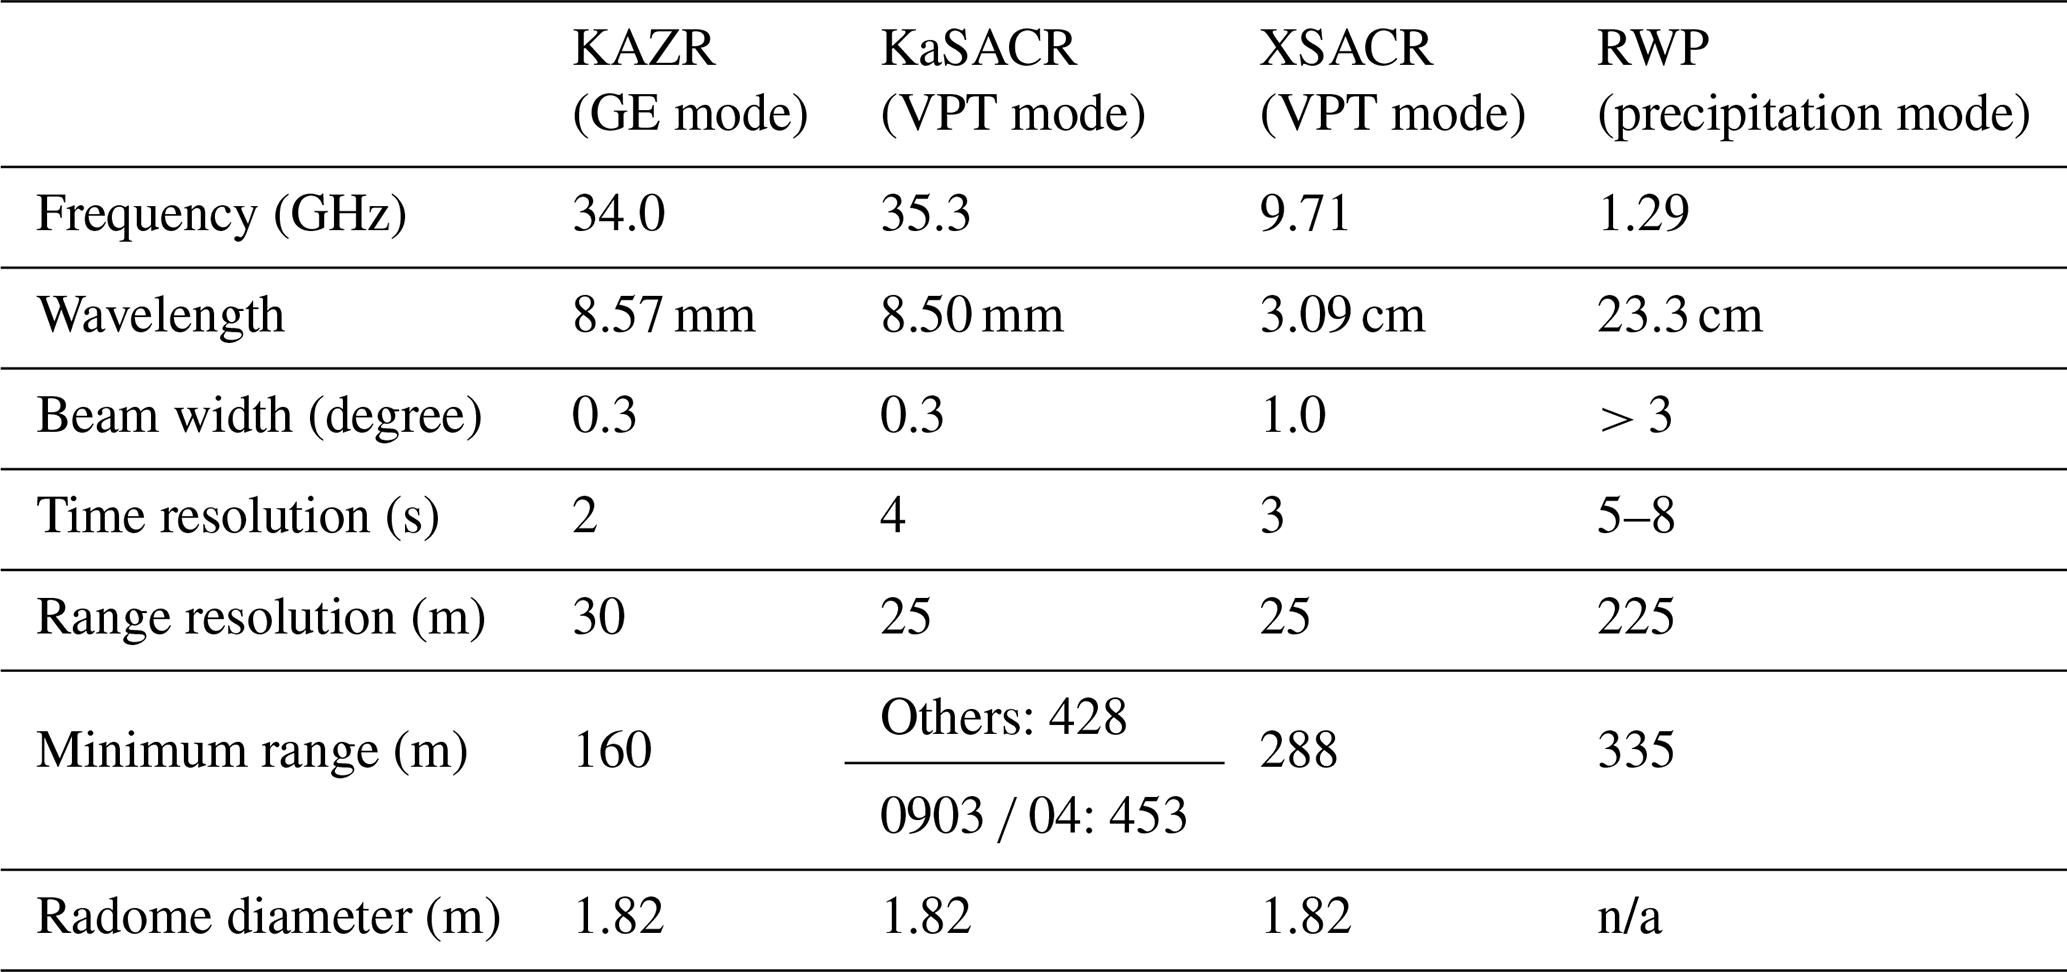
n/a: not applicable.
The KaSACR and XSACR are co-mounted on a scanning pedestal (Kollias et al., 2014a, b). During TRACER, the KaSACR/XSACR typically followed a 10 min scanning pattern: (i) two low-level plan position indicator (PPI) scans at 1 and 2° elevation, followed by (ii) six hemispheric range height indicator (HSRHI) scans at 30° azimuth intervals, and then (iii) 2 min of vertical pointing (VPT) mode. This study utilizes the 2 min VPT mode segment from each 10 min scanning sequence (i.e., nominal scanning VPT mode). The specifications during VPT mode are listed in Table 1. For one event on 3–4 September 2022, the KaSACR/XSACR was temporarily operated exclusively in VPT mode (i.e., stationary VPT mode) for radar cross-calibration purposes. The KaSACR has an inclined radome similar to the KAZR but is relatively newer, with potentially less deterioration of its hydrophobic coating. The XSACR has a conical radome with a slant angle of 45° to the surface. Overall, the WRA effect is expected to be smaller for the XSACR compared to either Ka-band radar, due to both wavelength-dependent differences and the improved radome design. The KaSACR calibration offsets between May and September 2022 are expected to be stable based on ground clutter analysis using relative calibration adjustment (RCA) techniques (Hunzinger et al., 2020) and are reported to be close to 0 dB, according to the ARM TRACER radar b1 data processing report (Feng et al., 2024).
To compare with Ze estimates from disdrometer measurement, radar measurements at 500 m are selected and corrected for gaseous attenuation using nearby radiosonde measurements (e.g., Ulaby et al., 1981). Rain attenuation is also corrected using specific attenuation coefficient (K) estimates from disdrometer measurement, assuming a uniform layer between the surface and 500 m. There is concern that the radar might saturate, particularly for the KaSACR near its minimum range, which could introduce a low bias in measured Ze compared to disdrometer Ze. Based on communication with an ARM radar engineer, the power associated with the highest voltage digitizable by the radar's analog-to-digital converter (ADC) is 5.9 dBm. The corresponding KAZR saturation reflectivity at 500 m is approximately 45 dBZ, given its calibration constant of −12 dBm. Similarly, the KaSACR saturation reflectivity at 500 m is about 31 dBZ, given its calibration constant of −26 dBm. The measured radar reflectivities from both KAZR and KaSACR at 500 m are generally less than 25 dBZ, well below the saturation threshold. Additional supporting evidence through radar profile comparisons can be found in the Supplement.
2.2 Surface disdrometer measurements and value-added products
A Parsivel 2 laser disdrometer (LDIS) and a two-dimensional video disdrometer (VDIS) unit were deployed at the main site during TRACER in very close proximity to the cloud radars. For disdrometer geophysical quantities and data quality control, procedures follow the standard drop size distribution (DSD) filtering in Giangrande et al. (2019) implemented by ARM in their precipitation value-added products (Video Disdrometer Quantities (VDISQUANTS) and Laser Disdrometer Quantities (LDQUANTS); Hardin et al., 2020a). These products employ several fall speed checks; temperature, drop shape, and canting assumptions; larger drop restrictions (no drop sizes > 5 mm); and drop count thresholds (> 20 drops per minute for a valid DSD) that impact estimates of hydrometeor Ze and K for radar frequencies using a T-matrix scattering algorithm (Mishchenko et al., 1996). As further discussed within the disdrometer literature (Tokay et al., 2001, 2014; Giangrande et al., 2019; Wang et al., 2021), the VDIS is considered the more reliable and sensitive disdrometer to a wider range of drop sizes under nominal light rain operating conditions. Therefore, the estimated Ze at Ka-band in VDISQUANTS is used within this study as our ground truth for KAZR calibration and surface rain rate, while the LDIS products have been used as an independent reference for monitoring RWP Ze estimates (e.g., Williams et al., 2023), which is required for additional direct radar comparisons in Sect. 4.
2.3 Radar wind profiler (RWP)
The RWP deployed during TRACER was operated using an adaptive scanning mode, switching between a traditional boundary-layer horizontal wind mode and a vertically pointing precipitation mode adopted by ARM for its recent deep convective cloud campaigns (e.g., Tridon et al., 2013; Giangrande et al., 2013, 2016). When the signal-to-noise ratio in the vertical beam exceeded a predefined threshold, the RWP switched into this precipitation mode and employed a single vertically pointing beam operation. This mode transmitted short and long pulses to observe echoes close to the radar with fine resolution or further from the radar with coarser resolution. Importantly to this study, the TRACER RWP mode switching sometimes prevented the RWP from immediately observing the lightly precipitating clouds on the periphery as they passed over the AMF1 site. However, this mode-switching sampling issue does not impact the bulk KAZR–RWP Ze cross-comparisons because we primarily consider daily average behaviors. As before, the RWP Ze measurements in precipitation mode were calibrated independently using collocated LDIS observations by Williams et al. (2023), who found a standard deviation of 2–4 dB between the RWP at 500 m and LDIS.
3.1 Identification of WRA: KaSACR/XSACR in stationary VPT modes
Figure 1a–c show the measured reflectivity (Ze) from the KaSACR/XSACR and the KAZR GE mode on 3–4 September 2022, when the KaSACR/XSACR was operated exclusively in a stationary vertically pointing (VPT) mode. Two intervals of widespread rainfall were captured: the first around 17:00–19:00 UTC and the second from 20:00–02:00 UTC. A radar “bright-band” signature, indicative of the melting level, appears around 5 km a.g.l. during this event. After 02:00 UTC (20:00 LT), light rain gave way to high, scattered clouds through the night, until thick anvil clouds from nearby convection moved in around 15:00 UTC (09:00 LT). Overall, the KaSACR/XSACR reported similar Ze values under peripheral cloudy conditions and during light rain, where rain attenuation and WRA were minimal. As expected, larger discrepancies between XSACR and KaSACR (with the KaSACR showing lower attenuated Ze values) occurred during heavier rainfall from 22:00–00:00 UTC. The KAZR consistently reported lower Ze values than the KaSACR, with differences often exceeding 5 dB throughout the event.
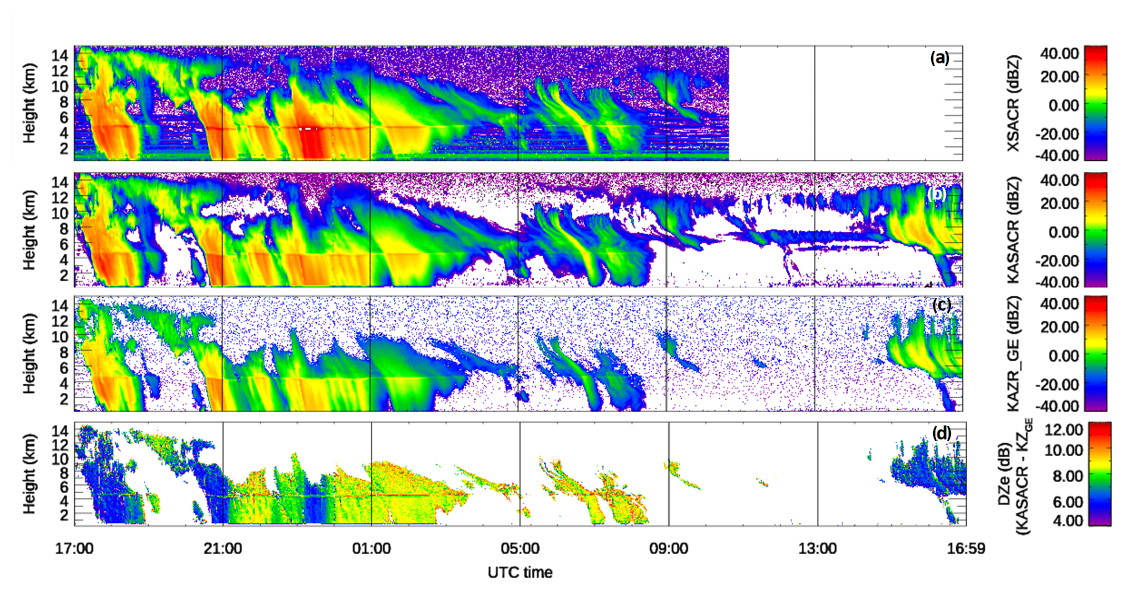
Figure 1Measured radar reflectivity on 3–4 September 2022 from the TRACER field campaign. (a) XSACR, missing data after 10:40 UTC on 4 September 2022; (b) KaSACR; (c) KAZR GE mode; and (d) Ze difference (DZe) between the KaSACR and the KAZR GE mode.
The Ze difference between the KaSACR and KAZR values in Fig. 1d exhibits strong temporal variation but limited vertical variation, indicating that the difference is likely driven by the radar or its local environment (e.g., WRA) rather than atmospheric features. The minimum difference of ∼ 7 dB in high clouds, observed around 17:00–18:00 UTC and again the next morning (15:00–17:00 UTC on 4 September), suggests an overall Ze offset between the KAZR and KaSACR. A minimum difference of ∼ 7 dB in rain (at 19:00, 21:00, and 23:00 UTC) indicates similar WRA behavior for both KAZR and KaSACR. However, a prolonged increase in this difference after moderate rain, especially under humid conditions at night (00:00–12:00 UTC, or 18:00–06:00 LT), suggests that the KAZR and KaSACR may experience additional discrepancies after rain or in high humidity, possibly due to the older, less hydrophobic radome of the KAZR, as noted in the Cloud, Aerosol, and Complex Terrain Interactions (CACTI) campaign (Varble et al., 2021; Hardin et al., 2020b). Accurate correction for KAZR wet-radome attenuation is challenging and beyond the scope of this study; however, WRA behavior in rain can provide a basis for tracking KAZR calibration, as will be demonstrated in the following sections.
The time series of rain rate (R), K, and Ze estimates at Ka- and X-bands from VDISQUANTS for the 3–4 September 2022 case are shown in Fig. 2a and b. The sampled R from the disdrometer is commonly less than 1 mm h−1 but approaches 5 mm h−1 around 23:30 UTC. The Ze values from KAZR and KaSACR/XSACR at 500 m are plotted in Fig. 2b. For all collocated precipitating samples, the XSACR Ze (black crosses) has a high correlation with estimated Ze (r2 = 0.95), while KAZR Ze (blue crosses) is biased low when directly compared to the disdrometer Ze, which is exacerbated further in heavy rain contexts. KaSACR Ze (red cross) falls in between XSACR and KAZR Ze values.
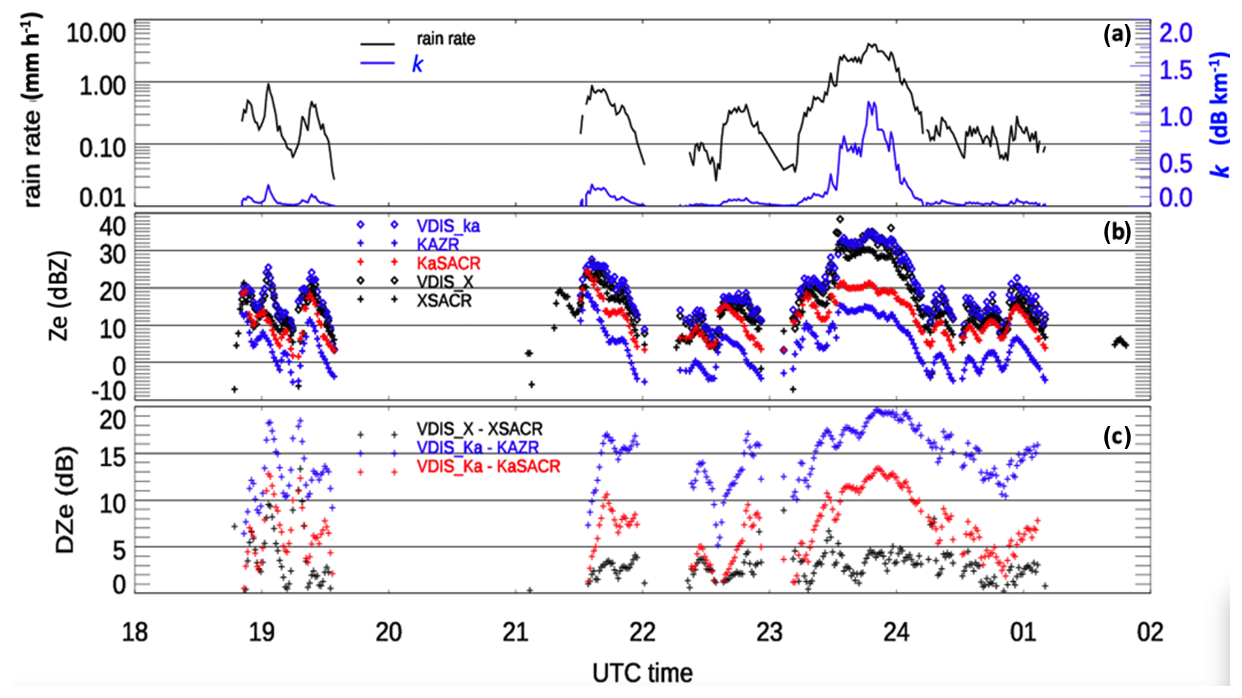
Figure 2Measurements and comparison on 3–4 September 2022 between VDISQUANTS and radars. (a) The time series of VDISQUANTS rain rate (black line) and rain droplet specific attenuation coefficients (K; blue line) at Ka-band. (b) The time series of measured Ze from KAZR GE (blue +), KaSACR (red +), and XSACR (black +) at 500 m after gaseous and rain attenuation corrections and the estimated Ze from VDISQUANTS at Ka-band (blue diamond) and X-band (black diamond). (c) Ze difference (DZe) between the radar and disdrometer for XSACR (black cross), KaSACR (red cross), and KAZR (blue cross). For this case, SACR was operated in the stationary VPT mode.
Figure 2c shows the differences between measured and estimated Ze (DZe) for KAZR, KaSACR, and XSACR. The XSACR exhibits a minimum DZe of 0 dB when the rain rate is below 0.1 mm h−1, but this difference can reach 5 dB around 23:30 UTC. The KaSACR DZe is approximately 1 dB at 18:00 and 21:00 UTC, while the KAZR DZe is around 7 dB, suggesting calibration offsets of around 1 dB for KaSACR and 7 dB for KAZR. Both KaSACR and KAZR Ze are further biased lower by an additional 13 dB when the rain rate reaches approximately 5 mm h−1 around 23:30 UTC. This 13 dB reduction in KAZR and KaSACR estimates is significantly larger than the expected two-way attenuation in rain at Ka-band (∼ 2 dB; Fig. 2a), suggesting that other factors, such as WRA, contribute increasingly to the observed offset in rain. Additionally, WRA for both KAZR and KaSACR likely shows similar dependence on rain rates.
The estimated Ze values from VDISQUANTS during the entire TRACER campaign are plotted as a function of R in Fig. 3. The estimated Ze for both X- and Ka-bands exhibits a log-linear relationship with R. When R exceeds 2 mm h−1, the Ze values begin to diverge, and the difference between the two wavelengths increases as R rises, likely due to resonance effects associated with non-Rayleigh scattering (Baldini et al., 2012). The Z–R relation is fitted in the black line with Z = 200R1.4, which is slightly smaller than the WSR-88D Z–R relation in convective summer deep convection (Z = 300R1.4; Crosson et al., 1996 ). The cumulative probability distribution (CDF) of rain rates (red line in Fig. 3) shows that about 15 % of disdrometer samples have R < 0.1 mm h−1, indicating limited data for traditional direct disdrometer comparison at precipitation onset. However, approximately 85 % of TRACER data samples have R < 5 mm h−1, suggesting that this large range of data samples is suitable for the WRA technique applications discussed in the following sections.
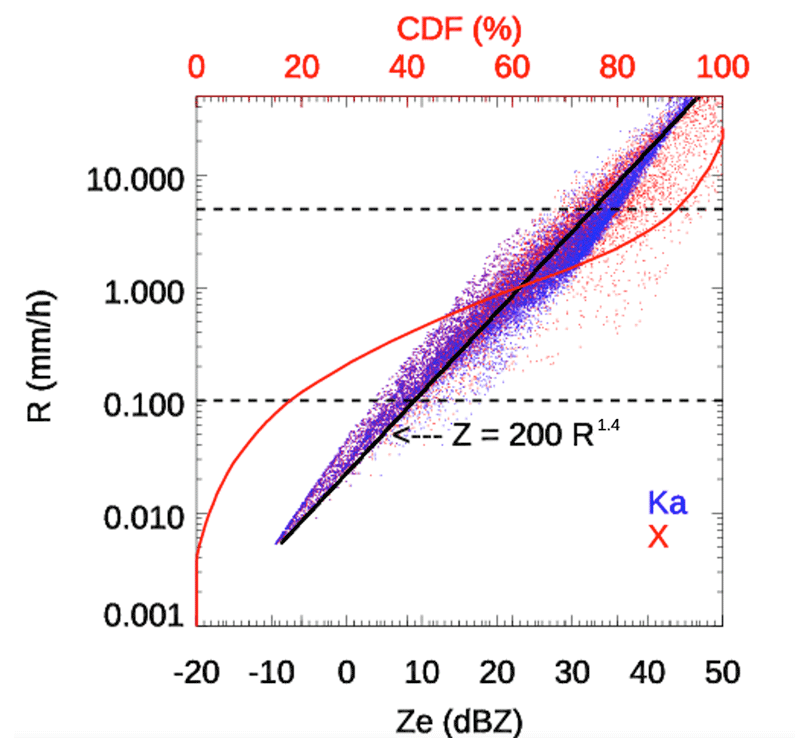
Figure 3The estimated Ze from VDISQUANTS for Ka-band (red dots) and X-band (black dots) during the entire TRACER campaign, plotted as a function of rain rate (R). The red line is the cumulative probability function (CDF) of R. The two vertical black lines are at rain rates of 0.1 and 5.0 mm h−1, respectively. The Z–R relation is fitted as a black line with Z = 200R1.4, which is slightly smaller than the WSR-88D Z–R relation in convective summer deep convection (Z = 300R1.4; Crosson et al., 1996).
3.2 Identification of WRA: KaSACR/XSACR in its scanning-VPT mode
To further illustrate the WRA, we compared radar and disdrometer measurements while the KaSACR/XSACR operated in its nominal 10 min scanning sequence during a stratiform rain event observed on 11 August 2022, between 01:00 and 04:00 UTC (Fig. 4). The radars were exposed to persistent rainfall, ranging from 1 mm h−1 at 01:00 UTC to over 5 mm h−1 around 02:15 UTC, leading to strong radar signal attenuation, particularly visible in the KAZR Ze vertical gradient above 4 km (Fig. 4a). After 03:00 UTC, the surface rain intensity was so low that the disdrometer could not effectively measure rain drop size distributions (DSDs) for Ze estimates due to insufficient drop counts (< 20 drops per minute) (Fig. 4b).
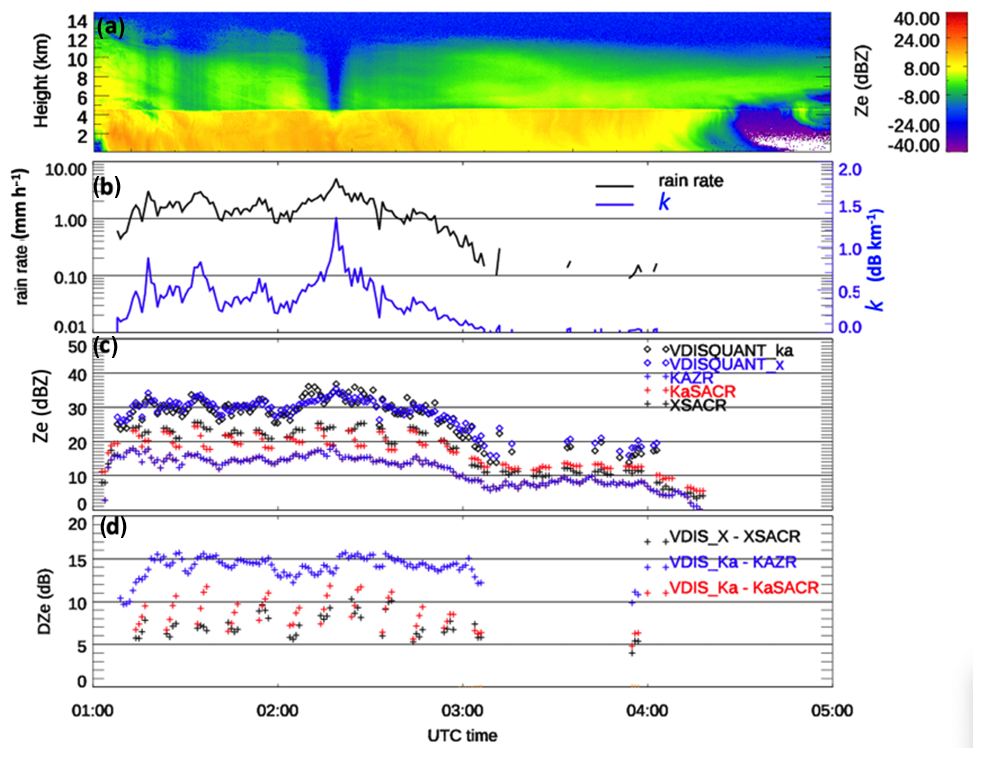
Figure 4Radar and VDISQUANTS comparison for the case on 11 August. (a) Measured radar reflectivity (Ze) from the KAZR GE mode. Panels (b)–(d) are similar to Fig. 2a–c. For this case, KaSACR and XSACR measurements are the scanning VPT mode and collocated with VDISQUANTS with a ±2 min averaging window.
The disdrometer-estimated surface Ze values at Ka-band (black diamonds) and X-band (blue diamonds) in Fig. 4c consistently show values close to 30 dBZ when rain rates are near 1 mm h−1, while the KAZR Ze is around 15 dBZ, resulting in a DZe of 15 dB against the disdrometer, as shown in Fig. 4d. During this event, there is an 8 min gap in every 2 min of VPT measurements due to the PPI and HSRHI scans. The collocation of the 2 min VPT data is extended to a 6 min window by averaging KaSACR/XSACR and VDISQUANTS data over a ±2 min interval.
The KaSACR Ze values (red crosses) in Fig. 4c display a sawtooth pattern within each 10 min scanning cycle. Each cycle begins with Ze values close to the XSACR Ze, followed by a decline towards the KAZR Ze value as time progresses, with the scaling possibly related to the rain rate. In contrast, the 3–4 September 2022 case in Fig. 2b shows parallel Ze trends between the KAZR and KaSACR. The increasing DZe trend in each 6 min period (red crosses) in Fig. 4d is more pronounced, indicating that the sawtooth behavior in KaSACR Ze and DZe results from rainwater accumulation on the radome during the 2 min of vertical pointing. If the KaSACR signal were saturating, it would consistently remain saturated rather than fluctuating. A closer examination of XSACR Ze and DZe trends (black crosses) in Fig. 4c and d reveals minimal variability with rain rates across the scanning cycle, likely due to the weaker water absorption coefficient at X-band and the reduced water accumulation on the conical XSACR radome.
The differing KaSACR patterns between the events in Figs. 2 and 4 are associated with rainwater accumulation and the KaSACR/XSACR radar's cycling between scanning and stationary VPT modes. At the start of each scanning VPT period, the radome is covered by a relatively thin film of rainwater, having shed water during the RHI and PPI scans. In VPT mode, excess rainwater rapidly accumulates on the radome, causing increased attenuation. Consequently, WRA for the KaSACR is modulated by the 10 min scanning cycle. By contrast, during the continuous stationary VPT observations of KAZR and KaSACR on 3–4 September, rainwater accumulated steadily on their radomes, resulting in similar WRA patterns, and the measured Ze and DZe values were parallel, with a consistent offset of approximately 7 dB.
3.3 WRA fitting calibration technique
In this section, we examine the WRA behavior toward developing a relative calibration technique for cloud radar monitoring. Figure 5a shows the estimated Ze by KaSACR at 500 m (black cross) after gaseous and rain attenuation corrections and the corresponding VDISQUANTS-estimated Ze (red cross) as a function of R for the 3–4 September case. A very well correlated monotonic relationship between the VDISQUANTS-estimated Ze and R in logarithmic space is observed. However, the KaSACR-measured Ze is biased low relative to the estimated Ze and to the offset (DZe = Zedis−Zemeas, shown in Fig. 5b) with increasing R. The DZe approaches 0 dB at R < 0.1 mm h−1, when minimal WRA is expected due to the limited water on the radome. However, DZe increases up to 15 dB at R ∼ 5 mm h−1, which is potentially a disadvantage when considering cloud radar observations in precipitation. However, this characteristic range of WRA relative to R provides an opportunity for exploring relative radar calibration techniques.
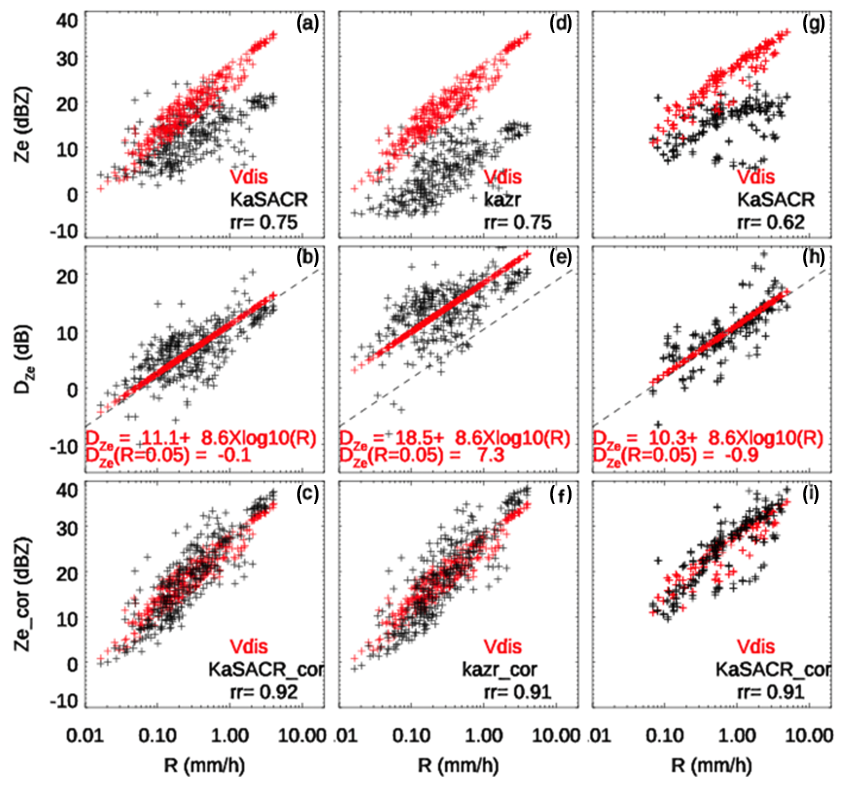
Figure 5(a) Scatter plot of radar-measured Ze (black cross) at 500 m and VDISQUANTS-estimated Ze (red cross) as a function of rain rate R (b). Difference between measured Ze and VDISQUANTS-estimated Ze (DZe in black). The log-linear fitting in Eq. (2) with slope b at 8.6 is plotted as a red cross. (c) Scatter plot of radar-measured Ze (black cross) after log-linear fitting correction along with the VDISQUANTS-estimated Ze (red cross) for KaSACR stationary VPT (a–c) and KAZR GE (d–f) on 3–4 September, along with KaSACR stationary VPT (g–i) collected on 25 May and 5, 11, 19, and 29 August. The correlation coefficients between the measured Ze and estimated Ze (r2) before and after the fitting correction are noted. The dashed black lines in panels (b), (e), and (h) are the log-linear fitting with a = 10.3 and b = 8.6 for KaSACR in Table 2.
Given a quasi-linear correlation between DZe and R in logarithmic space in Fig. 5b, a weighted linear least-squares fit of the DZe, with R in logarithm, can be applied, as described in Eq. (2):
For the cases shown in Fig. 5b, the fitted slope b is estimated to be 8.6. The intercept a captures the radar calibration offset and the WRA when R is 1 mm h−1. Given the KaSACR calibration offset is close to 0, the intercept primarily reflects WRA at this rain rate, yielding an intercept of approximately 11.1 dB.
This log-linear relation between DZe and R is different from the dependence described by Gibble's formula (Eq. 1), which is applied by Frasier et al. (2013) and Gorgucci et al. (2013) in X-band radar calibrations. Since the water absorption coefficient at Ka-band is approximately 3 times that at X-band, we divide the result of Eq. (2) by 3 and compare it with the fitting relations from Frasier et al. (2013; solid blue line) and Gorgucci et al. (2013; solid black line) in Fig. 6. It is important to note that the X-band radars used in the studies by Frasier et al. (2013) and Gorgucci et al. (2013) were equipped with spherical radomes, whereas the ARM KAZR and KaSACR radars used flat inclined radomes. Despite these differences, the relationship derived in this study intersects with those of Frasier et al. (2013) and Gorgucci et al. (2013) at R = 0.2 mm h−1, aligning with the majority of our data. When R > 0.2 mm h−1, our WRA fitting results exceed those of Gorgucci et al. (2013) by less than 0.5 dB, although the relation of Gorgucci et al. (2013) is 0.5–1 dB higher than that of Frasier et al. (2013). When R < 0.2 mm h−1, our WRA fitting result is 0.5–1 dB lower than both previous studies. The observed differences (within 1 dB) are smaller than the data scatter in Fig. 5b (standard deviation of 3 dB) and the discrepancies between the two previous studies, suggesting that the log-linear fitting in Eq. (2) is suitable for WRA correction when R is below 5 mm h−1, the selected threshold for our analysis. The calibration offset calculation associated with the WRA fitting functions will be further examined in Sect. 4.
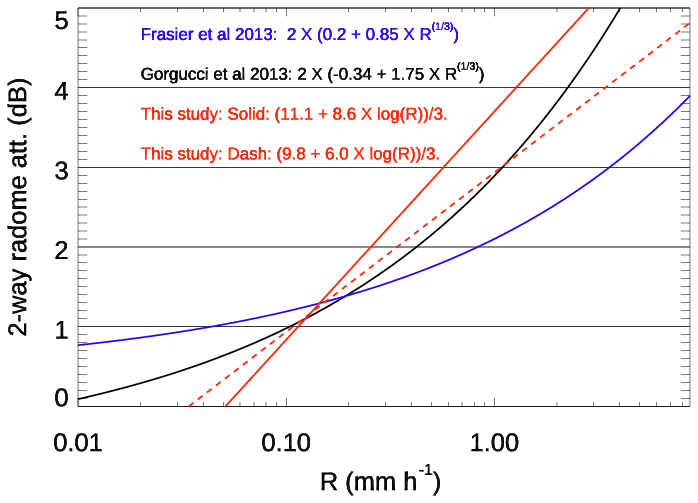
Figure 6Two-way radome attenuation as a function of rain rate (R) using the log-linear WRA fitting relation in Eq. (2) with slopes of 8.6 (solid red) and 6.0 (dashed red) in this study at Ka-band, which are divided by 3 and compared with two previous studies on X-band radars from Frasier et al. (2013) and Gorgucci et al. (2013).
Assuming that radar calibration offsets are independent of R, and that WRA depends intrinsically on R, the radar calibration offset can be determined by monitoring the fitted intercept in Eq. (2). Figure 5e shows the fitted intercept of DZe of KAZR is 18.5 dB, about 7.5 dB higher than that of KaSACR, which is consistent with the observed offset between KaSACR and KAZR in Fig. 1d and the time series in Fig. 2c. Alternatively, we can also assume negligible WRA at very low rain rates, e.g., R = 0.05 mm h−1, making DZe (R = 0.05) a reliable measure of the radar calibration offset (C) for monitoring radar performance. For the KaSACR in the 3–4 September case (Fig. 5a), the DZe (R = 0.05) is −0.1 dB, while, for the KAZR, it is 7.3 dB, consistent with direct comparisons between KaSACR, KAZR, and VDISQUANTS. This finding suggests that the WRA technique provides robust offset estimates for this case. The corrected Ze values using the log-linear fitted DZe in Eq. (2) are compared with VDISQUANTS Ze in Fig. 5c and f for KaSACR and KAZR, respectively. The correlation coefficient (r2) improves to ∼ 0.9, with a mean bias of 0 dB and a standard deviation of 3.0 dB for both KaSACR and KAZR.
To further explore the intrinsic WRA dependence on R, we applied the WRA log-linear fitting calibration technique to KaSACR in its scanning-VPT modes. Due to water shedding during the scanning cycle, we used the last-minute measurement of each 2 min VPT period within the 10 min scanning cycle. To obtain a range of samples, we identified 5 stratiform rain days – 25 May and 5, 11, 19, and 29 August – and combined data from these events. The data collected from those 5 d are plotted along with the corresponding VDISQUANTS-estimated Ze (red cross) as a function of rain rates in Fig. 5g. For these events, DZe (R = 0.05) is −0.9 dB, with slope b fitted to 8.6. The corrected Ze using this log-linear fitted DZe is compared with the VDISQUANTS Ze in Fig. 7i, demonstrating a strong correlation with the reference Ze, along with a smaller standard deviation (r2 = 0.91; mean bias, 0 dB; standard deviation, 2.0 dB).
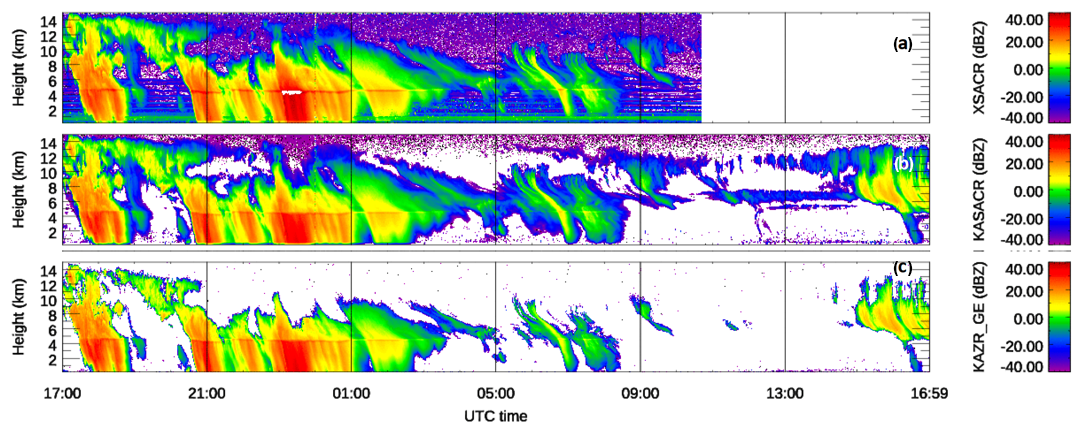
Figure 7The same as Fig. 1a–c except after WRA correction and radar calibration. For the precipitating period, (b) KaSACR is corrected using Eq. (2), with a slope of 8.6 and constant of 11.1. (a) XSACR is corrected with the offset of 3 dB from VDISQUANTS (black cross in Fig. 2d), and (c) KAZR GE mode is corrected using Eq. (2), with a slope of 8.6 and constant of 18.5. For non-precipitating periods, the calibration offsets of KaSACR and XSACR are assumed to be 0 dB, while the KAZR GE mode is calibrated with an offset of 7 dB.
Recall the DZe (R = 0.05) of −0.1 dB for stationary VPT mode in the 3–4 September case: the difference between the two KaSACR offsets is less than 1 dB, which is well within the standard deviation of the estimated Ze (3 dB) as a function of R, and aligns closely with the 1 dB offset from the direct disdrometer comparison at light rain onset in Fig. 2. This suggests that the R dependence of WRA is a valid assumption; therefore the interceptor or DZe (R = 0.05) in the fitting of Eq. (2) can be a useful metric for radar offset monitoring.
The time and height plots of Ze from KaSACR, XSACR, and KAZR GE and MD modes on 3–4 September 2022 (after the WRA correction is applied) are shown in Fig. 7. For the precipitating period, KaSACR is adjusted with Eq. (2) with a slope of 8.6 and constant of 11.1 (Table 2 or Fig. 5b). XSACR is modified with the offset of 3 dB from VDISQUANTS (black cross in Fig. 2d), and KAZR GE mode is corrected using Eq. (2) with a slope of 8.6 and an intercept of 18.5 (Table 2 or Fig. 5b). For non-precipitating periods, the calibration offsets for KaSACR and XSACR are assumed to be 0 dB based on the previous discussion, while the KAZR GE mode is calibrated with an offset of 7 dB. In contrast to the apparent difference of more than 5 dB between KAZR and KaSACR shown in Fig. 1, the corrected Ze values from KAZR and KaSACR are comparable to those from XSACR in cloud and light rain conditions. Under the relatively heavy rain conditions (e.g., 23:30 UTC), XSACR Ze along the fall streaks maintains magnitudes near 30 dBZ from the surface up to the melting layer, while Ze estimates from KAZR and KaSACR gradually decrease from the surface to the melting layer, likely due to increasing attenuation in Ka-band observations. This comparison in Fig. 7 further supports the applicability of the WRA fitting technique to KAZR measurements and KaSACR in VPT modes, providing reasonable estimates for wet-radome corrections during precipitation and radar offset monitoring.
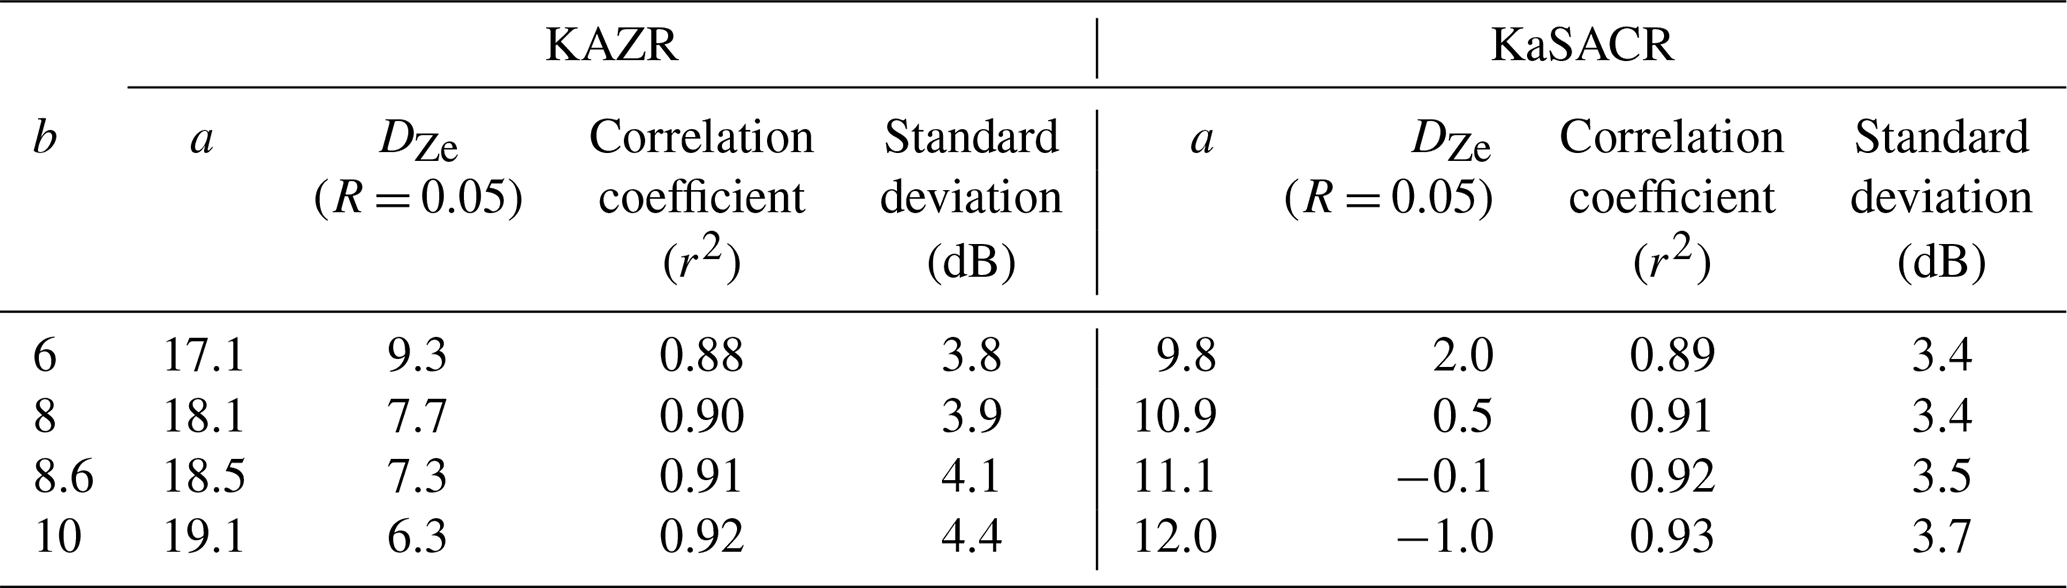
Table 2Sensitivity study of the slope value in the log-linear fitting for KAZR and KaSACR calibration for the 3–4 September 2022 case in Fig. 1. b and a are the slope and constant, respectively, in the log-linear fitting in Eq. (2). DZe (R = 0.05) is the radar calibration offset when the rain rate (R) equals 0.05 mm h−1. More details can be found in Sect. 3.3.
4.1 Daily TRACER KAZR calibration offset applications
We apply the WRA fitting technique to the DZe and R relationship using VDISQUANTS Ze estimates versus KAZR Ze for each day with measured precipitation throughout the TRACER campaign. The fitted slopes from the daily events typically range from 6 to 10, with r2 generally exceeding 0.7. The fitted slopes and associated fitting errors depend on the distribution of data samples. For example, in rain events with short durations or limited variability in intensity, data samples may cluster within a narrower range, resulting in a relatively lower correlation coefficient between the fitted Ze and disdrometer Ze, potentially indicating less reliable results.
To mitigate uncertainty associated with “daily” fitting as above, one may assume that the DZe and R relation has a constant slope over longer windows. In this study, we consider applying the WRA fitting technique with an average slope of 8, selected as a representative value for extended rain conditions across the entire TRACER campaign dataset. As a sensitivity study of this composite slope, we conduct offset calculations with proxy slope values at 6, 8, and 10 for both KAZR and KaSACR in the 3–4 September 2022 case. Table 2 presents the results of these tests. As the slopes increase from 6 to 10, the calibration offsets for both KAZR and KaSACR decrease by approximately 3 dB, as expected. With increasing slope values, the least-squares fit prioritizes the data samples around 0.1–1 mm h−1, resulting in a mathematical decrease in C.
To further illustrate, we applied the WRA fitting with a slope of 6 to the KaSACR observations in Fig. 5a. The fitted relation is represented by the dashed red line in Fig. 6. It can be seen that the fitted Ze with a slope of 6 lies between the results from Frasier et al. (2013) and Gorgucci et al. (2013). For most data samples (concentrated around 0.1–1 mm h−1), the difference between the two WRA fitting results remains within 1 dB. The resulting C with slope of 6 is larger than that with a slope of 8. However, the offset deviation due to possible fitting slope changes (shown in Table 2) is 3 dB, which is within the standard deviation of the estimated Ze as a function of R (∼ 3 dB). Therefore, even with fitting slope errors associated with this relative WRA technique, drifts larger than the 3 dB in the long-term calibration trend would be meaningful and identifiable.
The calculated KAZR calibration offsets during the entire TRACER campaign are shown in Fig. 8a (black asterisk for the daily value, with the thin dashed line representing the mean campaign-wide trend). The calibration offsets remain relatively stable around 2 dB, with a standard deviation of 3 dB until 1 July 2022 (273 d since 1 October 2021 in Fig. 8). After this date, the calibration offset increases to around 7 dB in September. This shift is larger than the uncertainty of the fitting method and the standard deviation of the fitting data, which is found to be linked to a drop of about 1 dB in transmitter power toward the end of the project in TRACER radar b1 data processing (Feng et al., 2024) and in Fig. 9c.
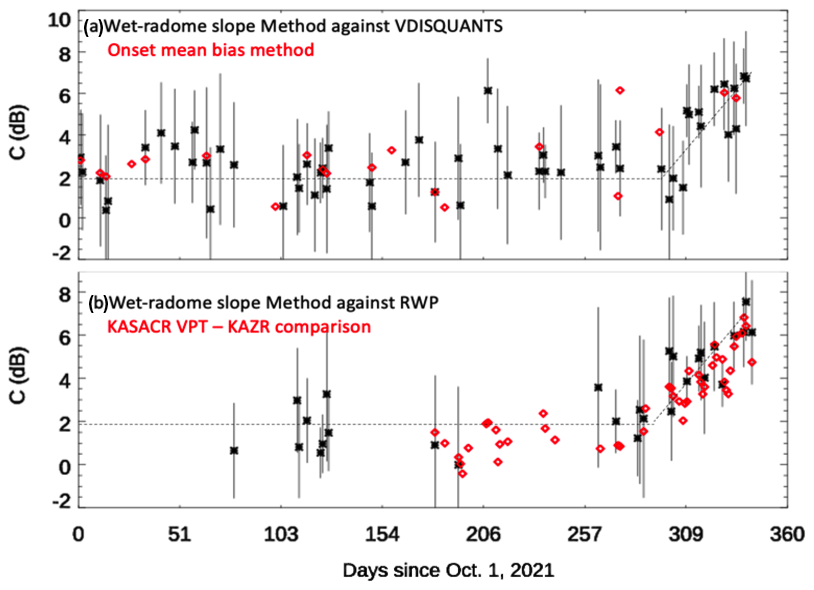
Figure 8(a) KAZR daily calibration offsets (C) from the mean KAZR bias method at the onset of light rain (red diamond) and the WRA fitting technique (black asterisk) against the VDISQUANTS data. The vertical black bar is the standard deviation of corrected Ze against the estimated Ze. (b) KAZR daily calibration offset from the WRA fitting technique against the calibrated RWP measurement as a black asterisk with a vertical standard deviation bar. Red diamonds stand for the daily cross-comparison between the KaSACR VPT mode and the KAZR GE mode in non-precipitating clouds since 26 May 2022. The dashed black line is the mean trend outline from the WRA fitting technique in Fig. 8a.
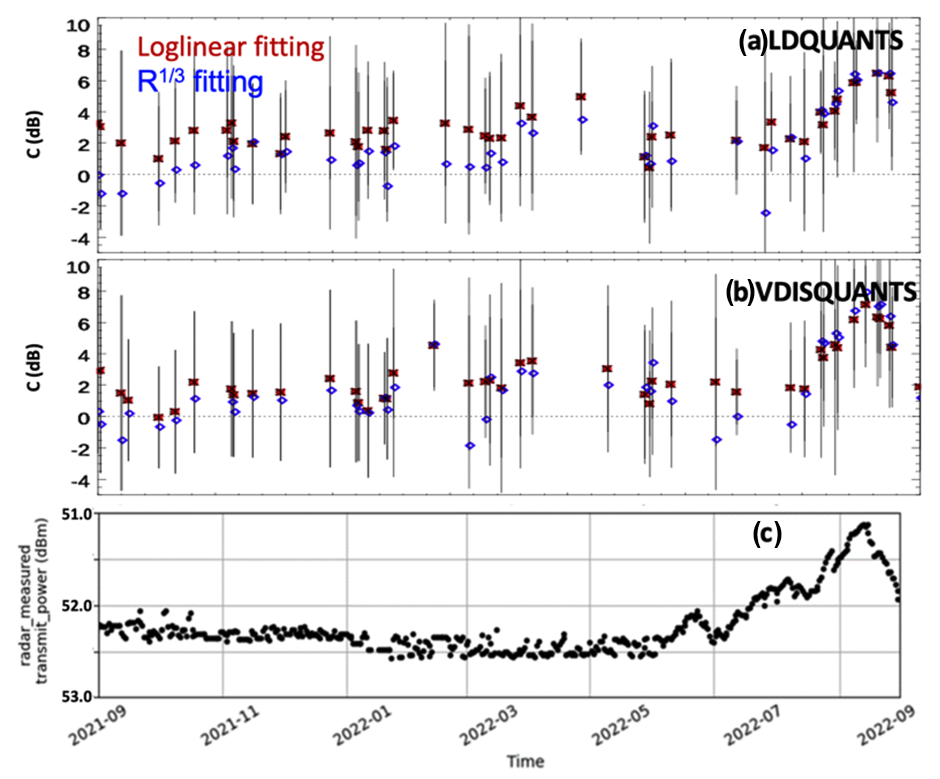
Figure 9KAZR daily calibration offsets (C) from log-linear fitting with Eq. (2) (red asterisk with black standard deviation bar) or the relation (blue diamond) against (a) LDQUANTS and (b) VDISQUANTS data. The daily offsets are smoothed with a 2 d window. (c) KAZR transmitted power. A noticeable decrease in transmitted power is well correlated with the increase in calibration offset.
4.2 Evaluation of the TRACER KAZR calibration trend
By monitoring the DZe (R = 0.05) from each rainy day that meets our stratiform and duration selection criteria, we determine a relative radar calibration offset trend. This offset includes additional uncertainty due to fitting uncertainty and the assumption of negligible WRA at R ∼ 0.05 mm h−1. Combining this WRA fitting technique with other, typically less frequent, absolute radar calibration references would be ideal and cost-effective for KAZR long-term calibration. To evaluate the KAZR calibration offset trend over the entire TRACER campaign, we performed three separate tests to demonstrate the potential offset uncertainty and/or advantages of the current WRA fitting technique compared to other established methods.
4.3 Direct KAZR–disdrometer comparison near light rain onset
As previously noted, a wet-radome film may not form immediately at the onset of light rain, so WRA is often assumed to be negligible when calibrating radar using disdrometer measurements near these rain onset windows. We perform a direct KAZR–disdrometer comparison at or near light rain onset for qualifying KAZR calibration events. The onset mean offset for each day is calculated if there are data samples with R < 0.1 mm h−1 lasting for 5 min consecutively within each observed rain event. The onset mean offsets are shown in Fig. 8a (red diamonds). For days with an onset mean offset, these values are typically close to those calculated using the WRA fitting technique. However, this method's applicability depends on the variation in precipitation rate over the 5 min sampling period and the minimum sensitivity of VDISQUANTS. The former introduces large uncertainty, while the latter limits the number of data samples, as shown in Fig. 8a.
4.3.1 WRA fitting technique against the calibrated RWP Ze
As an independent cross-comparison, we also apply the WRA fitting technique with respect to calibrated RWP Ze at RWP time resolution (less than 8 s), using interpolated disdrometer rain rates over the entire TRACER campaign. Here, DZe is replaced by the difference between KAZR and RWP measurements. The WRA calibration offsets using RWP measurements are shown with black asterisks in Fig. 8b. Firstly, we observe fewer available RWP data points, due to RWP mode switching during transient rain events. For days with available RWP measurements, the calibration offsets closely align with those derived using disdrometer-estimated Ze in Fig. 8a and direct disdrometer comparisons. The offset trend drift from early July to September is smoother and more clearly defined than the trend observed with disdrometer measurements, likely due to better temporal resolution. Overall, the consistency in temporal trend and magnitude of calibration offsets between disdrometer and RWP measurements indicates strong performance of the new WRA fitting technique.
4.3.2 Cross-comparison between KaSACR and KAZR
As previously mentioned, KaSACR calibration offsets remained stable between May and September 2022. Furthermore, its calibration offsets, calculated from the WRA fitting technique with scanning VPT and stationary VPT measurements in Fig. 6, are approximately −0.9 to −0.1 dB, respectively, and around 1 dB from direct disdrometer comparison at light rain onset. We tentatively assign a calibration offset of 0 dB for KaSACR observations. Cross-comparison between KaSACR VPT mode and KAZR observations can then be used to quantify the KAZR calibration offset trend. Since KaSACR and KAZR operate at the same frequency, this cross-comparison uses full-profile samples rather than measurements at a specific height level, as cumulative gaseous and rain attenuation should be consistent across range gates.
For this cross-comparison, we first match the closest KaSACR profiles to KAZR profiles and interpolate KaSACR height ranges to align with KAZR height ranges. We then select data samples using a signal-to-noise ratio threshold of 5 dB for both KaSACR and KAZR. In precipitating events, KaSACR in scanning VPT mode is expected to exhibit a sawtooth or modulated WRA cycling behavior, while KAZR VPT operates under consistent or continuous WRA (see Fig. 2). We categorize the collocated profiles into precipitating and non-precipitating periods using collocated surface rain rates from disdrometer measurements. Finally, the daily mean offsets between KaSACR and KAZR observations in non-precipitating clouds are calculated and shown in Fig. 8b (red diamonds). These calculated offsets display a trend similar to that observed in the WRA fitting technique against RWP measurements in Fig. 8b, further supporting the validity of the WRA calibration offset behaviors and strengthening confidence in the offset drift observed at the end of the campaign.
To extend the method to different disdrometer setups, we applied the WRA fitting technique to LDQUANTS estimates. Additionally, we tested sensitivity to fitting functions of log-linear and dependencies to account for potential discrepancies. Figure 9a and b present the results with a 2 d running average. The daily calibration offsets show slight variations between LDQUANTS and VDISQUANTS, indicating minor differences in disdrometer measurements (Wang et al., 2021). While the calibration offsets from the log-linear and fittings can differ by up to 2 dB for a certain day, the overall trends remain similar, with a mean offset of approximately 2 dB before July 2022, increasing to around 7 dB afterward. The increase of calibration offsets is well correlated with the noticeable decrease in transmitted power (Fig. 9c) observed at the end of the project.
In this study, we have demonstrated the wet-radome influence on Ka-band radar observations through comparisons that included KaSACR VPT observations under scanning (that may shed water buildup) and stationary (non-shedding) conditions. The WRA is attributed to both wet film and cumulative rainwater collecting on the radar radome. This attenuation influence increases as the rain rate increases. In campaign settings, it was found this attenuation may exceed 10 dB under a modest rain rate of 5 mm h−1. Taking advantage of the intrinsic WRA dependence on rain rates as obtained in moderate rain events from the AMF1 deployment in Houston, TX, during the TRACER field campaign, a new relative calibration monitoring technique was developed for use with the ARM KAZR (or similar cloud radar systems) observations.
The well-correlated relation between DZe and R (in logarithmic space) on precipitating days is fitted with a log-linear equation. This rain dependence of WRA serves as the basis for this relative WRA calibration technique. The corrected KAZR Ze with fitted DZe, which includes the WRA and Ze offset, agrees very well with both disdrometer-estimated and RWP-measured Ze. The radar calibration offset is calculated from the fitted DZe–R relation when R equals 0.05 mm h−1, assuming WRA is negligible at this light rain rate. The daily fitted slopes over the course of the TRACER campaign vary between 6 and 10 due to different data sampling in different rain types. A slope sensitivity study suggests that the calibration offset deviations due to slope variation are likely within the standard deviation of the estimated Ze as a function of R and those typical of underlying and collocated disdrometer measurement uncertainty (i.e., ∼ 2–3 dB). The KAZR calibration offsets calculated with a constant slope of 8 during the TRACER campaign are stable near 2 dB compared to the disdrometer estimate with a standard deviation of 3 dB through June 2022. After that time, the calibration offsets increase to more than 7 dB.
The performance of the WRA fitting calibration technique is evaluated by comparing it with direct disdrometer measurements at the onset of rain events. The wet-radome technique consistently identifies a sound calibration offset over the entire project and arguably outperforms the direct disdrometer and radar comparison at the onset of light rain by reducing noise and increasing temporal consistency. The WRA fitting calibration technique is also applied to the KAZR observation against the calibrated RWP Ze reference. This test reveals sound performance and a clear and smooth matching trend in the July to September change in TRACER KAZR offsets, indicating that the new technique can be applicable to other calibrated reference radars with collocated surface rain rate measurements. The KAZR offset assessed from the cross-comparison between the stable and calibrated KaSACR VPT mode and KAZR observations in non-precipitating clouds also agree with the calibration offset trend from the WRA fitting technique. The daily calibration offsets vary due to the uncertainty of disdrometer measurements and the fitting function of WRA; however, the generally long-term trend from the WRA fitting technique seems robust.
Determining the calibration offset and monitoring the long-term trend of ARM KAZR is the first step towards studying cloud seasonal and inter-seasonal variation. Having an easily adjustable cloud radar calibration method with collocated disdrometer or RWP data available will also facilitate cloud microphysical property retrieval, cloud process studies, and cloud variation associated with climate change using ARM KAZR measurements. This technique has the advantage of utilizing data from a broader range of light and moderate rain cases, avoiding the stringent requirements of other shorter-wavelength radar monitoring methods, which often rely on disdrometers or other radars and require observations of cloud, drizzle, or light rain at the onset of precipitation. Future plans include testing this newly developed WRA technique at other ARM fixed sites (e.g., in more humid, marine, or oceanic environments) to assess the extent of any necessary site-specific refinements for different radars and sampling conditions, acknowledging that wet-radome attenuation is inherently dependent on both the radome and radar characteristics. Recently, this WRA monitoring technique has been applied to data from other ARM field campaigns, such as the Surface Atmosphere Integrated Field Laboratory (SAIL) and the Eastern Pacific Cloud Aerosol Precipitation Experiment (EPCAPE). Alongside TRACER, the offset trends derived from these three campaigns have shown favorable agreement with results from other independent KAZR calibration techniques documented in ARM radar b1 data processing reports (Feng et al., 2024; Matthews et al., 2025; Rocque et al., 2025).
The KAZR, KaSACR, and XSACR data from the TRACER campaign in this study are a1-level data. The surface disdrometer VDISQUANTS and interpolated sounding data are c1-level value-added product data. They are all available via ARM data discovery at https://adc.arm.gov/discovery/#/ (last access: 16 March 2025) and through the following DOIs: https://doi.org/10.5439/1469302 (Bharadwaj et al., 2021a), https://doi.org/10.5439/1469303 (Bharadwaj et al., 2021b), https://doi.org/10.2172/1808573 (Hardin et al., 2020a), https://doi.org/10.5439/1592683 (Hardin et al., 2021), https://doi.org/10.5439/1498936 (Isom et al., 2018), and https://doi.org/10.5439/1095316 (Jensen et al., 2019b). The calibrated radar wind profiler data are an ARM PI product and can be obtained from the data developer, Christopher R. Williams, via email (christopher.williams@colorado.edu).
The supplement related to this article is available online at https://doi.org/10.5194/amt-18-1641-2025-supplement.
MD developed the main concept for the WRA calibration technique and led the manuscript preparation. SG, MJ, and KJ contributed to the data analysis process. CW provided the calibrated RWP data and contributed to their analysis and write-up. JC, YF, AM, MR, and MD, as part of the ARM radar data mentor team, provided TRACER-related radar information and additional KAZR calibration used in TRACER b1 data processing. IL and TW, as ARM radar engineers, supplied critical information on radar hardware, software, and saturation. AZ and DW contributed as the disdrometer mentors and VAP developers. ZZ and EL provided valuable insights regarding radar wet-radome attenuation. All co-authors helped to edit and comment on the manuscript draft.
The contact author has declared that none of the authors has any competing interests.
Publisher’s note: Copernicus Publications remains neutral with regard to jurisdictional claims made in the text, published maps, institutional affiliations, or any other geographical representation in this paper. While Copernicus Publications makes every effort to include appropriate place names, the final responsibility lies with the authors.
We acknowledge the radar engineering and data mentor teams for the close to 100 % operation rate of KAZR during the TRACER campaign. We would like to thank the ARM TRACER team for the quality data of KaSACR, XSACR, disdrometer, RWP, and interpolated sounding measurements. Contributions from Brookhaven National Laboratory co-authors were supported by the Atmospheric Radiation Measurement (ARM) facility and the Atmospheric System Research (ASR) program of the Office of Biological and Environmental Research in the US Department of Energy, Office of Science, through contract no. DE-SC0012704. Christopher R. Williams and the RWP work are supported under ASR grant no. DE-SC0021345. The Pacific Northwest National Laboratory (PNNL) is operated by Battelle for the US Department of Energy. The authors from PNNL are also supported by ARM through contract no. DE-SC0015990.
This research has been supported by the US Department of Energy (grant nos. DE-SC0012704, DE-SC0021345, and DE-SC0015990).
This paper was edited by Gianfranco Vulpiani and reviewed by two anonymous referees.
Anderson, I.: Measurements of 20-GHz transmission through a radome in rain, IEEE T. Antenn. Propag., 23, 619–622, 1975.
Baldini, L., Chandrasekar, V., and Moisseev, D.: Microwave radar signatures of precipitation from S band to Ka band: application to GPM mission, Eur. J. Remote Sens., 45, 75–88, https://doi.org/10.5721/EuJRS20124508, 2012.
Bechini, R., Chandrasekar, V., Cremonini, R., and Lim, S.: Radome attenuation at X-band radar operations, in: Proceedings of the 6th European Conference on Radar in Meteorology and Hydrology (ERAD), Sibiu, Romania, 6–10 September 2010, P15.1, https://www.researchgate.net/publication/265383456_Radome_attenuation_at_X-band_radar_operations (last access: 17 March 2025), 2010.
Bertie, J. E. and Lan, Z.: Infrared Intensities of Liquids XX: The Intensity of the OH Stretching Band of Liquid Water Revisited, and the Best Current Values of the Optical Constants of H2O(l) at 25 °C between 15,000 and 1 cm−1, Appl. Spectrosc., 50, 1047–1057, https://doi.org/10.1366/0003702963905385, 1996.
Bharadwaj, N., Hardin, J., Isom, B., Johnson, K., Lindenmaier, I., Matthews, A., Nelson, D., Feng, Y.-C., Deng, M., Rocque, M., Castro, V., and Wendler, T.: Ka-Band Scanning ARM Cloud Radar, Atmospheric Radiation Measurement (ARM) User Facility [data set], https://doi.org/10.5439/1469302, 2021a.
Bharadwaj, N., Hardin, J., Isom, B., Johnson, K., Lindenmaier, I., Matthews, A., Nelson, D., Feng, Y., Deng, M., Wendler, T., Castro, V., and Rocque, M.: X-Band Scanning ARM Cloud Radar, Atmospheric Radiation Measurement (ARM) User Facility [data set], https://doi.org/10.5439/1469303, 2021b.
Bringi, V. N. and Chandrasekar, V.: Polarimetric Doppler Weather Radar, Cambridge University Press, 636 pp., ISBN 978-0-521-62384-1, 2001.
Chandrasekar, V., Baldini, L., Bharadwaj, N., and Smith, P. L.: Recommended Calibration Procedures for GPM Ground Validation Radars, 103.
Crosson, W., Duchon, C., Raghavan, R., and Goodman, S.: Assessment of Rainfall Estimates Using a Standard Z-R Relationship and the Probability Matching Method Applied to Composite Radar Data in Central Florida, J. Appl. Meteorol., 35, 1203–1219, https://doi.org/10.1175/1520-0450(1996)035<1203:AOREUA>2.0.CO;2, 1996.
Deng, M., Kollias, P., Feng, Z., Zhang, C., Long, C. N., Kalesse, H., Chandra, A., Kumar, V. V., and Protat, A.: Stratiform and Convective Precipitation Observed by Multiple Radars during the DYNAMO/AMIE Experiment, J. Appl. Meteorol. Clim., 53, 2503–2523, https://doi.org/10.1175/JAMC-D-13-0311.1, 2014.
Dupont, J. C., Drouin, M. A., Ribaud, J. F., Gibe, A., Delanoe, J., Toledo, F., Pfitzenmaier, L., Ghiggi, G., and Schleiss, M.: Hands-on training on the monitoring of stability of DCR reflectivity using disdrometers, in: ACTRIS-CCRES workshop, 14–15 November 2022, SIRTA Observatory, https://www.actris.eu/sites/default/files/inline-files/Sess05-2022_CCRES_Dupont-DCRCC-DD-monitoring.pdf (last access: 17 March 2023), 2022.
Feng, Y.-C., Matthews, A., Rocque, M., Deng, M., Wendler, T., Johnson, K., Schuman, E., Lindenmaier, I., Castro, V., Giangrande, S. E., Collis, S., Jackson, R., Theisen, A., and Comstock, J.: TRACER b1 Data Processing: Corrections, Calibrations, and Processing Report, U.S. Department of Energy, Atmospheric Radiation Measurement (ARM) User Facility, Richland, Washington, DOE/SC-ARM-TR-297, https://doi.org/10.2172/2229372, 2024.
Frasier, S. J., Kabeche, F., Figueras i Ventura, J., Al-Sakka, H., Tabary, P., Beck, J., and Bousquet, O.: In-Place Estimation of Wet Radome Attenuation at X Band, J. Atmos. Ocean. Tech., 30, 917–928, https://doi.org/10.1175/JTECH-D-12-00148.1, 2013.
Gibble, D.: Effect of rain on transmission performance of a satellite communication system, in: IEEE Int. Conv. Rec., New York, NY, USA, 26–28 March 1964, Part VI, IEEE, 52 pp., 1964.
Giangrande, S. E. and Ryzhkov, A. V.: Calibration of Dual-Polarization Radar in the Presence of Partial Beam Blockage, J. Atmos. Ocean. Tech., 22, 1156–1166, https://doi.org/10.1175/JTECH1766.1, 2005.
Giangrande, S. E., Collis, S., Straka, J., Protat, A., Williams, C., and Krueger, S.: A summary of convective-core vertical velocity properties using ARM UHF wind profilers in Oklahoma, J. Appl. Meteorol. Clim., 52, 2278–2295, 2013.
Giangrande, S. E., Toto, T., Jensen, M. P., Bartholomew, M. J., Feng, Z., Protat, A., Williams, C. R., Schumacher, C., and Machado, L.: Convective cloud vertical velocity and mass-flux characteristics from radar wind profiler observations during GoAmazon2014/5, J. Geophys. Res.-Atmos., 121, 12891–12913, https://doi.org/10.1002/2016JD025303, 2016.
Giangrande, S. E., Wang, D., Bartholomew, M. J., Jensen, M. P., Mechem, D. B., Hardin, J. C., and Wood, R.: Midlatitude oceanic cloud and precipitation properties as sampled by the ARM Eastern North Atlantic Observatory, J. Geophys. Res.-Atmos., 124, 4741–4760, https://doi.org/10.1029/2018JD029667, 2019.
Gorgucci, E., Bechini, R., Baldini, L., Cremonini, R., and Chandrasekar, V.: The Influence of Antenna Radome on Weather Radar Calibration and Its Real-Time Assessment, J. Atmos. Ocean. Tech., 30, 676–689, https://doi.org/10.1175/JTECH-D-12-00071.1, 2013.
Hardin, J., Giangrande, S. E., and Zhou, A.: Laser Disdrometer Quantities (LDQUANTS) and Video Disdrometer Quantities (VDISQUANTS) Value-Added Products Report, U.S. Department of Energy, Atmospheric Radiation Measurement (ARM) User Facility, United States, https://doi.org/10.2172/1808573, 2020a.
Hardin, J., Hunzinger, A., Schuman, E., Matthews, A., Bharadwaj, N., Varble, A., Johnson, K., and Giangrande, S.: CACTI Radar b1 Processing: Corrections, Calibrations, and Processing Report, Tech. Doc. DOE/SC-ARM-TR244, 46 pp., https://arm.gov/publications/brochures/doe-sc-arm-tr-244.pdf (last access: 17 March 2025), 2020b.
Hardin, J., Giangrande, S., Fairless, T., and Zhou, A.: vdisquants: Video Disdrometer derived radar equivalent quantities. Retrievals from the VDIS instrument providing radar equivalent quantities, including dual polarization radar quantities (e.g., Z, Differential Reflectivity ZDR), Atmospheric Radiation Measurement (ARM) User Facility [data set], https://doi.org/10.5439/1592683, 2021.
Hunzinger, A., Hardin, J. C., Bharadwaj, N., Varble, A., and Matthews, A.: An extended radar relative calibration adjustment (eRCA) technique for higher-frequency radars and range–height indicator (RHI) scans, Atmos. Meas. Tech., 13, 3147–3166, https://doi.org/10.5194/amt-13-3147-2020, 2020.
Isom, B., Nelson, D., Andrei, I., Hardin, J., Matthews, A., Johnson, K., Bharadwaj, N., Feng, Y.-C., Rocque, M., Deng, M., Wendler, T., and Castro, V.: ARM: KAZRCFRGE, Atmospheric Radiation Measurement (ARM) User Facility [data set], https://doi.org/10.5439/1498936, 2018.
Jensen, M., Bruning, E., Collins, D., Fridlind, A., Kollias, P., Kuang, C., Rosenfeld, D., Ryzhkov, A., Varble, A., Brooks, S., Defer, E., Fan, J., Flynn, J., Giangrande, S. E., Griffin, R., Hu, J., Jackson, R., Kumjian, M., Logan, T., Matsui, T., McFarquhar, G., Nowotarski, C., Quaas, J., Oue, M., Sheesley, R., Snyder, J., Stier, P., Usenko, S., van den Heever, S., van Lier-Walqui, M., Wang, Y., Xu, Y., and Zhang, G.: TRacking Aerosol Convection Interactions Experiment (TRACER) Science Plan, DOE/SC-ARM-19-017, U.S. Department of Energy, Atmospheric Radiation Measurement (ARM) User Facility, 30 pp., https://doi.org/10.2172/1529098, 2019a.
Jensen, M., Giangrande, S., Fairless, T., and Zhou, A.: Interpolated Sonde (INTERPOLATEDSONDE), Atmospheric Radiation Measurement (ARM) User Facility [data set], https://doi.org/10.5439/1095316, 2019b.
Jensen, M. P., Judd, L., Kollias, P., Sullivan, J., Nadkarni, R., Kuang, C., McFarquhar, G., Powers, H., and Flynn, J.: A succession of cloud, precipitation, aerosol, and air quality field experiments in the coastal urban environment, B. Am. Meteorol. Soc., 103, 103–105, https://doi.org/10.1175/BAMS-D-21-0104.1, 2022.
Jensen, M. P., Flynn, J. H., Kollias, P., Kuang, C., McFarquhar, G., Powers, H., Brooks, S., Bruning, E., Collins, D., Collis, S. M., Fan, J., Fridlind, A., Giangrande, S. E., Griffin, R., Hu, J., Jackson, R. C., Kumjian, M., Logan, T., Matsui, T., Nowotarski, C., Oue, M., Rapp, A., Rosenfeld, D., Ryzhkov, A., Sheesley, R., Snyder, J., Stier, P., Usenko, S., van den Heever, S., van Lier Walqui, M., Varble, A., Wang, Y., Aiken, A., Deng, M., Dexheimer, D., Dubey, M., Feng, Y., Ghate, V., Johnson, K. L., Lamer, K., Saleeby, S., Wang, D., Zawadowicz, M., and Zhou, A.: Tracking Aerosol Convection Interactions Experiment (TRACER) Final Campaign Report, DOE/SC-ARM-23-038, U.S. Department of Energy, 132 pp., https://doi.org/10.2172/2202672, 2023.
Kollias, P., Clothiaux, E. E., Miller, M. A., Albrecht, B. A., Stephens, G. L., and Ackerman, T. P.: Millimeter-Wavelength Radars: New Frontier in Atmospheric Cloud and Precipitation Research. B. Am. Meteorol. Soc., 88, 1608–1624, https://doi.org/10.1175/BAMS-88-10-1608, 2007.
Kollias, P., Bharadwaj, N., Widener, K., Jo, I., and Johnson, K.: Scanning ARM cloud radars. Part I: Operational sampling strategies, J. Atmos. Ocean. Tech., 31, 569–582, https://doi.org/10.1175/JTECH-D-13-00044.1, 2014a.
Kollias, P., Jo, I., Borque, P., Tatarevic, A., Lamer, K., Bharadwaj, N., Widener, K., Johnson, K., and Clothiaux, E. E.: Scanning ARM Cloud Radars. Part II: Data Quality Control and Processing, J. Atmos. Ocean. Tech., 31, 583–598, https://doi.org/10.1175/JTECH-D-13-00045.1, 2014b.
Kollias, P., Puigdomènech Treserras, B., and Protat, A.: Calibration of the 2007–2017 record of Atmospheric Radiation Measurements cloud radar observations using CloudSat, Atmos. Meas. Tech., 12, 4949–4964, https://doi.org/10.5194/amt-12-4949-2019, 2019.
Kollias, P., Bharadwaj, N., Clothiaux, E. E., Lamer, K., Oue, M., Hardin, J., Isom, B., Lindenmaier, I., Matthews, A., Luke, E. P., Giangrande, S. E., Johnson, K., Collis, S., Comstock, J., and Mather, J. H.: The ARM Radar Network: At the Leading Edge of Cloud and Precipitation Observations, B. Am. Meteorol. Soc., 101, E588–E607, https://doi.org/10.1175/BAMS-D-18-0288.1, 2020.
Kurri, M. and Huuskonen, A.: Measurements of the transmission loss of a radome at different rain intensities, J. Atmos. Ocean. Tech., 25, 1590–1599, 2008.
Lamer, K., Oue, M., Battaglia, A., Roy, R. J., Cooper, K. B., Dhillon, R., and Kollias, P.: Multifrequency radar observations of clouds and precipitation including the G-band, Atmos. Meas. Tech., 14, 3615–3629, https://doi.org/10.5194/amt-14-3615-2021, 2021.
Maahn, M., Hoffmann, F., Shupe, M. D., de Boer, G., Matrosov, S. Y., and Luke, E. P.: Can liquid cloud microphysical processes be used for vertically pointing cloud radar calibration?, Atmos. Meas. Tech., 12, 3151–3171, https://doi.org/10.5194/amt-12-3151-2019, 2019.
Matrosov, S. Y.: Attenuation-Based Estimates of Rainfall Rates Aloft with Vertically Pointing Ka-Band Radars, J. Atmos. Ocean. Tech., 22, 43–54, https://doi.org/10.1175/JTECH-1677.1, 2005.
Mather, J. H. and Voyles, J. W.: The ARM Climate Research Facility: A Review of Structure and Capabilities, B. Am. Meteorol. Soc., 94, 377–392, 2013.
Matthews, A., Deng, M., Schuman, E., Feng, Y., and Rocque, M.: SAIL Radar B1 Processing: Corrections, Calibrations, and Processing Report, U.S. Department of Energy, Atmospheric Radiation Measurement User Facility, Richland, Washington, Atmospheric Radiation Measurement user facility, Richland, Washington. DOE/SC-ARM-TR-315, 2025.
Mead, J.: MMCR Calibration Study, U.S. Department of Energy, DOE/SC-ARM/TR-088, https://www.arm.gov/publications/tech_reports/doe-sc-arm-tr-088.pdf (last access is: 03/17/2025), 2010.
Miller, M. A., Nitschke, K., Ackerman, T. P., Ferrell, W. R., Hickmon, N., and Ivey, M.: The ARM Mobile Facilities, Meteor. Monogr., 57, 9.1–9.15, https://doi.org/10.1175/AMSMONOGRAPHS-D-15-0051.1, 2016.
Mishchenko, M. I., Travis, L. D., and Mackowski, D. W.: T-matrix computations of light scattering by nonspherical particles: A review, J. Quant. Spectrosc. Ra., 55, 535–575, 1996.
Myagkov, A., Kneifel, S., and Rose, T.: Evaluation of the reflectivity calibration of W-band radars based on observations in rain, Atmos. Meas. Tech., 13, 5799–5825, https://doi.org/10.5194/amt-13-5799-2020, 2020.
Protat, A., Bouniol, D., O'Connor, E. J., Klein Baltink, H., Verlinde, J., and Widener, K.: CloudSat as a Global Radar Calibrator, J. Atmos. Ocean. Tech., 28, 445–452, https://doi.org/10.1175/2010JTECHA1443.1, 2011.
Rocque, M. M., Deng, Y., Feng, E., Schuman, E., Silber, I., Matthews, A., Wendler, T., Castro, V., and Lindenmaier, I.: EPCAPE Radar b1 Processing: Corrections, Calibrations, and Processing Report, U.S. Department of Energy, Atmospheric Radiation Measurement user facility, Richland, Washington, in preparation, 2025.
Segelstein, D. J.: The complex refractive index of water, University of Missouri-Kansas City, https://mospace.umsystem.edu/xmlui/handle/10355/11599 (last access: 17 March 2025), 1981.
Thompson, R., Illingworth, A., Darlington, T., and Ovens, J.: Correcting attenuation in operational radars from both heavy rain and the radome using the observed microwave emission, in: Proceedings of the Seventh European Conference on Radar in Meteorology and Hydrology (ERAD), Toulouse, France, 25–29 June 2012, ERAD, 8A.5, http://www.meteo.fr/cic/meetings/2012/ERAD/short_abs/DQ_381_sh_abs.pdf (last access: 17 March 2025), 2012.
Tokay, A., Kruger, A., and Krajewski, W. F.: Comparison of Drop Size Distribution Measurements by Impact and Optical Disdrometers, J. Appl. Meteorol., 40, 2083–2097, 2001.
Tokay, A., Wolff, D. B., and Petersen, W. A.: Evaluation of the New Version of the Laser-Optical Disdrometer, OTT Parsivel2, J. Atmos. Ocean. Tech., 31, 1276–1288, 2014.
Tridon, F., Battaglia, A., Kollias, P., Luke, E., and Williams, C. R.: Signal postprocessing and reflectivity calibration of the Atmospheric Radiation Measurement Program 915-MHz Wind Profilers, J. Atmos. Ocean. Tech., 30, 1038–1054, https://doi.org/10.1175/JTECH-D-12-00146.1, 2013.
Ulaby, F. T., Moore, R. K., and Fung, A. K.: Microwave Remote Sensing Active and Passive, Vol. 1, Addison-Wesley, Reading, 456 pp., 1981.
Varble, A. C., Nesbitt, S. W., Salio, P., Hardin, J. C., Bharadwaj, N., Borque, P., DeMott, P. J., Feng, Z., Hill, T. C. J., Marquis, J. N., Matthews, A., Mei, F., Öktem, R., Castro, V., Goldberger, L., Hunzinger, A., Barry, K. R., Kreidenweis, S. M., McFarquhar, G. M., McMurdie, L. A., Pekour, M., Powers, H., Romps, D. M., Saulo, C., Schmid, B., Tomlinson, J. M., van den Heever, S. C., Zelenyuk, A., Zhang, Z., and Zipser, E. J.: Utilizing a Storm-Generating Hotspot to Study Convective Cloud Transitions: The CACTI Experiment, B. Am. Meteorol. Soc., 102, E1597–E1620, https://doi.org/10.1175/BAMS-D-20-0030.1, 2021.
Wang, D., Giangrande, S., Bartholomew, M., and Hardin, J.: Analysis of Three Types of Collocated Disdrometer Measurements at the ARM Southern Great Plains Observatory, DOE/SC-ARM-TR-275, https://www.arm.gov/publications/programdocs/doe-sc-arm-tr-275.pdf (last access: 17 March 2025), 2021.
Widener, K., Bharadwaj, N., and Johnson, K.: Ka-Band ARM Zenith Radar (KAZR) handbook, DOE/SC-ARM/TR-106, U.S. Department of Energy, Atmospheric Radiation Measurement (ARM) User Facility, https://www.arm.gov/publications/tech_reports/handbooks/kazr_handbook.pdf (last access: 17 March 2025), 2012.
Williams, C. R., Barrio, J., Johnston, P. E., Muradyan, P., and Giangrande, S. E.: Calibrating radar wind profiler reflectivity factor using surface disdrometer observations, Atmos. Meas. Tech., 16, 2381–2398, https://doi.org/10.5194/amt-16-2381-2023, 2023.
Yanovsky, F. J., Pitertsev, A. A., Unal, C. M. H., and Russchenberg, H. W. J.: Peculiarities and Experience of W-Band Cloud Radar Calibration, in 2023 Signal Processing Symposium, SPSympo 2023, Karpacz, Poland, 26–28 September 2023, IEEE, 208–213, https://doi.org/10.23919/SPSympo57300.2023.10302660, 2023.
Yu, X., Zhang, Y., Hu, R., and Luo, X.: Water droplet bouncing dynamics, Nano Energy, 81, 105647, https://doi.org/10.1016/j.nanoen.2020.105647, 2021.
Zhu, Z., Lamer, K., Kollias, P., and Clothiaux, E. E.: The vertical structure of liquid water content in shallow clouds as retrieved from dual-wavelength radar observations, J. Geophys. Res.-Atmos., 124, 14184–14197, https://doi.org/10.1029/2019JD031188, 2019.
- Abstract
- Introduction
- TRACER dataset description and comparisons
- Cloud radar Ze calibration and monitoring: development of a new WRA technique
- Application and evaluation of the WRA offset monitoring during TRACER
- Summary
- Data availability
- Author contributions
- Competing interests
- Disclaimer
- Acknowledgements
- Financial support
- Review statement
- References
- Supplement