the Creative Commons Attribution 4.0 License.
the Creative Commons Attribution 4.0 License.
 | 07 May 2025
Aerosol composition retrieval from a combination of three different spaceborne instruments: information content analysis
Ulrike Stöffelmair
Thomas Popp
Marco Vountas
Hartmut Bösch
This study focuses on the information content for retrieving aerosol optical depth (AOD) and its components from satellite measurements. We utilise an optimal estimation retrieval algorithm with data from three satellite-based instruments: the Sea and Land Surface Temperature Radiometer (SLSTR) on Sentinel-3A and Sentinel-3B and the Infrared Atmospheric Sounding Interferometer (IASI) and the Global Ozone Monitoring Experiment-2 (GOME-2) on MetOp-A, MetOp-B and MetOp-C. Data are averaged to a common 40×80 km2 grid, temporally aligned within a 60 min window and cloud masked. A simulation study has been carried out to analyse the information content of the instrument combination, identify retrievable parameters, and initiate the development of a uniform retrieval algorithm for the AOD and aerosol components. The simulation study for the information content analysis is implemented using the radiative transfer model SCIATRAN and MERRA-2 reanalysis data for AOD and mass mixing ratios of different aerosol components. The study shows 6 to 15 degrees of freedom for the determination of aerosol components dependent on AOD and the underlying surface. The results will be used for the development of a synergistic multi-sensor retrieval algorithm for AOD and its components in cloud-free atmospheres across various surface types.
- Article
(4353 KB) - Full-text XML
- BibTeX
- EndNote


Aerosols impact radiation and climate in a multitude of ways, and, after CO2, their combined effects are the second-largest contributor to radiative forcing. Due to the complexity of aerosol–climate effects, aerosols are the largest contributor to uncertainties (Forster et al., 2021; Li et al., 2022).
Their direct (influencing the radiation budget directly by scattering, absorbing or emitting radiation), semi-direct (impacting cloud properties by heating or cooling the atmosphere) and indirect effects (affecting cloud properties by acting as condensation nuclei or ice-nucleating particles) depend not only on aerosol abundance and geospatial distribution but also on aerosol chemical composition (Boucher et al., 2013; Kaufman et al., 2002). Direct radiative effects will lead to warming for strongly absorbing aerosols, e.g. dust and black and organic carbon (Matsui et al., 2018; Samset et al., 2018; Kok et al., 2023), whereas for most other aerosols, direct radiative effects will reduce the radiation and energy input into the atmosphere by reflecting solar radiation and will thus have a cooling effect (Charlson et al., 1992; Kaufman et al., 2002; Arias et al., 2021; Li et al., 2022). Indirect effects due to aerosol–cloud interactions occur because of aerosol particles acting as condensation nuclei for water droplets and nucleating particles for ice crystals in clouds, which also depends on the aerosol composition (Twomey, 1974, 1977; Burrows et al., 2022; Seinfeld et al., 2016; Storelvmo, 2017). Other indirect effects are related to changes in surface albedo due to deposited aerosols. An example of the semi-direct effect is the uneven distribution of radiative heating in the troposphere caused by aerosols, which leads to atmospheric convection and circulation (Sherwood et al., 2015). All these effects depend on the detailed characteristics of atmospheric aerosol (Kaufman et al., 2002; Yin et al., 2002; Wiacek et al., 2010; Arias et al., 2021; Forster et al., 2021; Kok et al., 2023). Atmospheric aerosol is typically described as a mixture of a manageably small number of representative components. A component groups particles with similar characteristics (chemical composition, size range, shape and corresponding optical properties). Further, we differentiate between organic and black carbon, sulfates and sea salt, and mineral dust in different size bins (Kinne et al., 2006; Randles et al., 2017). Due to the major effect of aerosols and their composition on the climate, they play a critical role in climate modelling (Myhre et al., 2017; Gliß et al., 2021; Randles et al., 2017), so observational data are important for validation and assimilation purposes. It is not sufficient to constrain just the quantity and distribution of aerosol; composition information is also needed if we want to reduce uncertainties in climate forcing due to aerosol. Hence, there is an important climate research need for global monitoring of aerosol composition from satellite measurements (Kaufman et al., 2002; Holzer-Popp et al., 2008; Li et al., 2022; Kacenelenbogen et al., 2022).
Typically, the retrieval of aerosol optical depth (AOD) from satellite measurements is an ill-posed mathematical inversion problem which limits the capabilities to identify components of the AOD. This means that there is not enough information about aerosols and their composition; other atmospheric parameters, such as temperature, pressure, or trace gas concentrations; and surface properties in measurement data. By combining data from different satellite instruments, complementary information, like varying spectral ranges and observation geometries, can be combined (Dubovik et al., 2021b), which holds the potential to improve the capabilities to infer AOD and composition. For this purpose, a retrieval algorithm based on optimal estimation (Rodgers, 2000) will be developed, which makes use of data from three different instruments measuring with different observation characteristics, different spectral ranges (ultraviolet (UV), visible (VIS) and thermal infrared (TIR)) and different viewing geometries (nadir and oblique).
The instruments included are the dual-view Sea and Land Surface Temperature Radiometer (SLSTR) on board Sentinel-3A and Sentinel-3B (Coppo et al., 2010), the Infrared Atmospheric Sounding Interferometer (IASI) (Blumstein et al., 2004), and the Global Ozone Monitoring Experiment-2 (GOME-2) spectrometer (Munro et al., 2006; Callies et al., 2000) – both on board MetOp-A, MetOp-B and MetOp-C. The SLSTR measurement with nine channels in the VIS and TIR provides additional information due to the two different viewing directions (nadir and oblique) and therefore provides options for better separation of ground and atmospheric influences. IASI is mostly sensitive to mineral dust and larger particles. The measurement in the UV range by GOME-2 provides information about absorption and thus enables the separation of absorbing and non-absorbing particles. In addition, IASI and GOME-2 are also sensitive to elevated stratospheric sulfate aerosol loadings. Due to the partial overlap of the wavelength ranges, the SLSTR measurements can be used to check the spectral consistency of the three instruments and thus filter out pixels with changes within the half-hour time offset in the overflight that the two satellites have. The temporal overlap of GOME-2 and IASI (both on MetOp-A, MetOp-B and MetOp-C) is important for the combination of the instruments due to the rapid possible changes in aerosol and cloud distribution, which in our case outweighs the advantages that Sentinel-5P, for example, has with a similar wavelength range to GOME-2 but with significantly better resolution. The planned retrieval is designed for the coarsest resolution of the instruments used (GOME-2 with 40 km×80 km), on which the other instruments are averaged to. To analyse the aerosol components for climate research, the longest possible time series is required. The algorithm proposed here has the potential to be applied to predecessor instruments such as ATSR2 and AATSR on SLSTR, GOME and SCIAMACHY on GOME-2, and HIRS on IASI, which provide temporal coverage from 1995 to the present with one interruption (2012 to 2016) (Coppo et al., 2010; Loyola et al., 2009; Inamdar et al., 2023). As all the instruments have planned successors, the time series can be continued at least until 2035. The planned successor to GOME-2 is UV–VIS–NIR–SWIR (UVNS) sounding (Copernicus Sentinel-5), and the successor to IASI is the Infrared Atmospheric Sounding Interferometer – New Generation, both of which will be on MetOp Second Generation (Holmlund et al., 2017), while SLSTR will be continued on Sentinel-3C and Sentinel-3D (World Meteorological Organization (WMO), 2025a, b). The selected resolution is sufficiently fine for the planned use of the retrieval for climate studies, while it would be too coarse for regional air quality analyses.
There exist aerosol retrieval algorithms exploiting data of single instruments, but they do not retrieve aerosol components. For example, AOD and fine-mode AOD can be determined from SLSTR data (Sayer et al., 2010; Bevan et al., 2012; Sogacheva et al., 2017), the absorbing aerosol index from GOME-2 (Hasekamp et al., 2004), and dust AOD from IASI (Vandenbussche et al., 2013; Callewaert et al., 2019; Clarisse et al., 2019; Capelle et al., 2014; Klüser et al., 2012). There are also algorithms using a combination of different instrument types to gain more information about aerosol composition, for example, SYNAER (Holzer-Popp and Schroedter, 1999; Holzer-Popp et al., 2008), which uses the Advanced Along-Track Scanning Radiometer (AATSR) and the Scanning Imaging Absorption Spectrometer for Atmospheric Chartography (SCIAMACHY), both on Envisat – predecessor instruments to SLSTR and GOME-2. Another example is PMAp (Grzegorski et al., 2021), which uses the polarisation channels of GOME-2, IASI and the Advanced Very High Resolution Radiometer (AVHRR).
SYNAER works with predefined aerosol mixtures (fixed mixtures of different aerosol components) and determines these mixtures but not individual aerosol components (Holzer-Popp et al., 2008). PMAp works with aerosol classes, like oceanic, industrial, biomass and dust classes, with different refractive indices and different size distributions (Grzegorski et al., 2021). Another aerosol component algorithm is GRASP/Component (Li et al., 2019, 2020; Zhang et al., 2021; Dubovik et al., 2021a), which is based on the multi-axis and polarimetric data from POLDER on PARASOL.
As a first step towards developing this multi-sensor retrieval algorithm, a simulation-based information content analysis is presented in this study. An information content study shows the amount and type of information which can be extracted from the data. In this context, the degrees of freedom (DOFs) represent the number of parameters that can be retrieved. For SYNAER the information content for aerosol type determination is shown to be 2 to 3 DOFs for fixed AOD and surface albedo (Martynenko et al., 2010) using a principal component analysis. According to Klüser et al. (2015), depending on the spectral database of optical properties, AOD and dust layer temperature used, values of up to 6.7 prevail for the DOF for determining the dust AOD, dust particle size, composition, emission temperature and height. Hasekamp and Landgraf (2005) show that aerosol retrieval based on simulated polarised and unpolarised GOME-2 measurements over the ocean provides 6 to 8 total degrees of freedom calculated with the optimal estimation method, reducing to 3.5 to 5 when only considering the intensity measurements. The determined parameters were the aerosol loading of both modes of the bimodal aerosol size distribution, the effective radius of at least one mode, the refractive index (real and imaginary part), the aerosol layer height and the oceanic pigment concentration. Consistent with the planned retrieval setup, an information content analysis is performed in this study with simulated cloud-free pixels with realistic observation geometry for the instrument ensemble. A set of observations resembling the abovementioned instruments is simulated with the SCIATRAN radiative transfer model (Rozanov et al., 2014; Mei et al., 2023) for different observing conditions and geometries, surface types, aerosol compositions and aerosol amounts in realistic scenarios. With these data, an analysis of the combined information content is then conducted, which focuses on the capability to determine aerosol abundance (total AOD) and aerosol components in a cloud-free atmosphere. This analysis uses the optimal estimation theory developed by Rodgers (2000) to calculate the degrees of freedom. This information content analysis is used to theoretically identify which parameters can be retrieved from the multi-sensor data. It is then used to develop a synergistic multi-sensor retrieval algorithm for AOD and aerosol components. The planned synergistic retrieval focuses on the determination of aerosol composition for further investigation of the described climate influences. This paper starts with a brief theory of information content (Sect. 2) to specify the definitions used. Simulated satellite measurements are used so that the true values are known and are described in Sect. 3. The methods used for the quantitative analysis of the information content are explained in Sect. 4. Section 5.2 presents the results for the information gain and the information content of the instrument combination, which are finally discussed in Sect. 6.
The optimal estimation theory (Rodgers, 2000, 1996; Maahn et al., 2020) describes the forward model as
where y represents the observation vector, i.e. the vector which contains the individual measurements, in our case spectral reflectance and brightness temperatures; x represents the state vector, which contains the parameters that will be retrieved; F represents the forward model, which is in our case the radiative transfer model SCIATRAN; and ϵ represents the experimental error including observation noise and forward-model uncertainty. For the information content analysis the averaging kernel matrix
is used to calculate the degrees of freedom (DOFs). It represents the partial derivation of the retrieval state vector , which is the estimate of the true state vector x obtained by the optimal estimation algorithm with respect to x. Sa is the error covariance matrix corresponding to the a priori state vector xa. The error covariance matrix for the measurements Sϵ contains the instrument measurement uncertainties. K is the Jacobian matrix consisting of the partial derivatives of each measurement, in this study each calculated y value from the forward model, with respect to each state element . The superscripts “T” and “−1” refer to matrix transpose and inversion.
The total DOFs are calculated as
and the diagonal elements of A represent the DOF per element of the state vector x:
The diagonal element values of Aii are in the range of 0 (no information on xi) to 1 (xi can be fully determined) and characterise the sensitivity of each retrieved parameter to its truth. This makes the DOF a good indicator of the number of parameters that can be determined in retrieval. The off-diagonal elements describing the cross-correlation between the parameters indicate how strongly the estimate of one parameter depends on other parameters.
For the simulation of satellite measurements, the radiative transfer model SCIATRAN (Rozanov, 2022; Rozanov et al., 2014; Mei et al., 2023) is used to simulate the collocated data from the three instruments on common GOME-2 pixels: SLSTR on Sentinel-3A and Sentinel-3B (since 2017) and IASI and GOME-2, both on MetOp-A, MetOp-B and MetOp-C (since 2007).
3.1 Radiative transfer forward model
We use SCIATRAN as a forward model to create synthetic measurements for this information content study. SCIATRAN simulates radiance spectra that are appropriate for atmospheric remote sensing observations across the UV to TIR. SCIATRAN is a well-tested radiative transfer model that can be used to compute radiances over a broad spectral range, in particular the UV–VIS and IR ranges needed for this study. A second reason is SCIATRAN's option to take into account different aerosol components as defined in MERRA-2. We calculate the radiance at the top of the atmosphere (TOA) using the assumption of a pseudo-spherical atmosphere with the scalar discrete ordinate technique. For the solar spectrum, the Thekaekara (NREL, 2024; Drummond and Thekaekara, 1973) spectrum is used.
The surface is handled as a Lambertian reflector with wavelength-dependent albedo. The wavelength-dependent emissivity of the surface is set to the climatology values measured with IASI since 2008 (Zhou et al., 2011, 2013, 2018, 2021). The influence of aerosols on TOA radiation is calculated using the different aerosol components defined in the MERRA-2 dataset. The optical database in the MERRA-2 model comprises precomputed values for extinction, scattering efficiency and expansion coefficients of scattering matrix elements at specific wavelengths and humidity levels, as well as cross-sectional area and particle mass at predefined humidity levels for 15 aerosol components. These components include hydrophobic and hydrophilic modes of black carbon (BCPHOBIC, BCPHILIC) and organic carbon (OCPHOBIC, OCPHILIC), sulfate (SO4), and five distinct size bins for sea salt (SS001, …, SS005) and dust (DU001, …, DU005) aerosols (Randles et al., 2017). The aerosol components are listed with their dry effective radius in Table A1.
3.2 Satellite measurements and observation vector
Satellite TOA radiance data for the three instruments are averaged at a common grid of 40×80 km2 within a temporal matching window of 60 min for the planned retrieval. The choice of instruments has been made with the goal that they complement each other in terms of their information content since they measure in different spectral ranges and with different viewing geometries. In addition, the spatial and temporal overlap of their measurements plays an import role in that choice. Moreover, the chosen combination of instruments allows for the possibility of a long time series through their predecessor and successor instruments. The DOF analysis is made from the perspective of a synergistic retrieval algorithm for those three instruments using atmospheric radiative transfer simulations, which do not include an instrument model; i.e. they are done monochromatically at central spectral bins and are one-dimensional. A short overview of the instruments, their characteristics and their contribution to the observation vector is listed below.
3.2.1 Sea and Land Surface Temperature Radiometer (SLSTR)
SLSTR measures using the dual-view principle, observing the same spot on Earth twice along track in the nadir and oblique (rearward) views (55°) and accordingly with two different path lengths through the atmosphere, which enables a better decoupling of the radiation contributions from the ground and the atmosphere (Barton et al., 1989). SLSTR has a swath width of approximately 750 km and a spatial resolution of 0.5 km×0.5 km in the VIS and SWIR range and 1 km×1 km in the thermal range for nadir pixels (Coppo et al., 2010; European Space Agency, 2024). The different measurement channels, listed in the European Space Agency (2024) with their central wavelength and bandwidth, are all used in the observation vector with both viewing directions. For the different channels, the radiative transfer calculations are performed on an internal wavelength grid and averaged using a rectangular function as a simplification of the spectral response function. The instrumental error for the SLSTR radiance channels is 5 % of the measurements and 0.5 K for the infrared channels (European Space Agency, 2024). These are used in the diagonal elements in the measurement error covariance matrix Sy.
3.2.2 Infrared Atmospheric Sounding Interferometer (IASI)
IASI is a passive infrared Fourier transform spectrometer (FTS), which measures in a spectral range from 3.7 to 15.5 µm using a Michelson interferometer and an infrared camera connected to it, which works in the spectral range from 10.3 to 12.5 µm. Through an inverse Fourier transformation and radiometric calibration, a spectrum is calculated in the IASI instrument. IASI has a swath width of 2400 km. The IASI footprints are in nadir circles with a diameter of approximately 12 km (Blumstein et al., 2004; Hébert et al., 2017; Simeoni et al., 2004).
The precise measurements in the infrared spectral range contain information about the quantity and properties of the dust aerosol particles. Following Vandenbussche (2021), the observation vector contains IASI data in the original spectral resolution (0.25 cm−1) from 8914.6 to 9111.6 nm and from 10 796.2 to 11 061.9 nm. For the Level 1C data used, spectral harmonisation is used to remove the impact of the instrument spectral response from the radiance spectra (Clerbaux et al., 2009; EUMETSAT, 2019). For IASI, the measurement uncertainties are supposed to be below 0.2 K (Clerbaux et al., 2009). Following the approach of Vandenbussche (2021), we use 0.5 K as the diagonal elements in the Sy matrix.
3.2.3 Global Ozone Monitoring Experiment-2 (GOME-2)
GOME-2 on board MetOp-A, MetOp-B and MetOp-C is the improved version of the Global Ozone Monitoring Experiment on the second European Remote Sensing Satellite (GOME on ERS-2). GOME-2 is an optical spectrometer with 4096 channels in four bands in the range of 240–790 nm with a high spectral resolution of 0.26–0.51 nm and a spectral range for each pixel from 0.07 to 0.2 (EUMETSAT, 2022). A scan mirror enables across-track scanning in the nadir direction with a swath width of 1920 km and can also be directed to different calibration sources. It has a footprint of 80 km (across track) ×40 km (along track) (Munro et al., 2016; EUMETSAT AC SAF, 2024), which is the driver of the resolution of the study and the planned retrieval. From GOME-2 the data from 342.33 to 792.40 nm with a wavelength step of approximately 10 nm are used in the observation vector. A higher resolution is not necessary because aerosols do not have sharp absorption lines but rather broad structures (Andersson, 2017). The measurement uncertainty is 2 % for GOME-2 (EUMETSAT, 2005), which we use in the Sy matrix.
3.3 State vector
The state vector analysed for its information content contains the different parameters which will be inverted in the retrieval algorithm and which are to be developed in the future. In this study these are 25 parameters containing the following: surface albedo values at different wavelengths (340, 494, 555, 670, 758, 868, 2500 nm), the surface temperature, the AOD at 550 nm and the scaling factors for the 15 different aerosol components (Table A1). Each provided aerosol component height profile is assumed to be scalable with one parameter, in the following called the scaling factor. The scaling factors are applied to 1 kg kg−1 normalised vertical mass mixing ratio profiles, taken from monthly mean MERRA-2 data, to obtain the profile of the aerosol component mass mixing ratio. This means that the sensitivity to aerosol components is a mixture of the composition and optical properties of each component and its typical height profile.
3.4 A priori values and error covariance matrix used in optimal estimation
We use the following data as a priori values for the described parameters of the state vector: for the surface albedo values from 340 to 758 nm, we use the climatological values of the GOME-2 surface Lambertian-equivalent reflectivity (LER) database (Tilstra et al., 2017, 2021) for the geographical position. For the albedo values at 868 and 2500 nm, we set the a priori values to 0.2 and 0.15, as we do not have any climatological values here. The a priori value of the surface temperature is set to 295 K. For the AOD and the scaling factors of the aerosol components, the monthly mean values from MERRA-2 data (Global Modeling And Assimilation Office and Pawson, 2015a, b) are used.
The a priori error covariance matrix Sa has the following diagonal elements: 0.2 for the constrains for the albedo values, 5.0 for the AOD, 30 (K) for the surface temperature and 1 for the scaling factors for the mass mixing ratios of the aerosol components. We use Sa as a diagonal matrix. Consequently, all off-diagonal elements are set to zero because the constrain of one parameter to another is not known.
In this study we use the optimal estimation theory, described in Sect. 2, and the pyOptimalEstimation package (Maahn et al., 2020) to calculate the information content of the forward-model arrangement described previously. To work with realistic aerosol composition and AOD values in the simulated scenarios, we use MERRA-2 data for AOD (Global Modeling And Assimilation Office and Pawson, 2015a) and mass mixing ratios of the different aerosol components (Global Modeling And Assimilation Office and Pawson, 2015b).
To account for a representative range of the true state parameters, global scenarios derived from the MERRA-2 reanalysis are utilised. As we prefer to do this analysis on a 1°×1° grid, the mass mixing ratios from MERRA-2 are re-gridded from 0.5°×0.625° to 1°×1° using bilinear interpolation. The satellite overpasses are at 09:30 for the MetOp satellite, with GOME-2 and IASI on board, and 10:00 for Sentinel-3A and Sentinel-3B, with SLSTR on board. Consequently, we select for each time zone, every 3 h in the MERRA-2 data, the nearest to 09:30 local solar time. The scaling factors are then calculated by normalising the profiles to 1 kg kg−1, as described in Sect. 3.3. The scaling factors are used for the simulation study to calculate the simulated data. The relative humidity is taken from MERRA-2 and is not retrieved in this study.
We use solar angles calculated with the Python package pvlib (Anderson et al., 2023) at a local solar time of 09:30, which approximately corresponds to the satellite overpasses. The minimal solar movements between the satellite overpasses of MetOp and Sentinel-3, which are at most half an hour apart, are neglected in this context. For the satellite viewing geometry, we use the simplified case that all instruments measure as close as possible near nadir above the point under consideration. That means a 0° viewing zenith angle for GOME-2 and IASI and 6° for the nadir view of SLSTR.
In order to consider a representative range of all parameters, global scenarios based on the MERRA-2 reanalysis are used. To analyse the gain in information content (Sect. 5.1) of the instrument combination compared to the individual instruments, the data of the 1st, 15th and 30th of the middle months of each season (January, April, July and October) of the year 2018 are used. For this analysis we select a subset of 1°×1° grid boxes to get a 10°×10° grid in order to consider the best possible coverage of different aerosol compositions with a reduced amount of data. This results in 6948 simulated scenarios for each individual instrument and for the combination. For a more detailed analysis of the information content of the instrument combination (Sect. 5.2), we use data from 15 January, April, July and October on the 1°×1° grid. This larger dataset, 231 805 simulated scenarios for this consideration, also allows us to recognise patterns on global maps of degrees of freedom.
5.1 Increase in information content through the combination of instruments
To analyse the increase in information content from the combination of instruments compared to the individual instruments, we use 6948 simulated scenarios designed as specified in Sect. 4.
The analysis of the total DOFs shows a clear gain in information for the total degrees of freedom of the individual instruments, ranging from 5 to 8 for GOME-2, 8 to 13 for SLSTR and 4 to 10 for IASI to 14 to 20 DOFs by combining the instruments, as shown in Fig. 1.
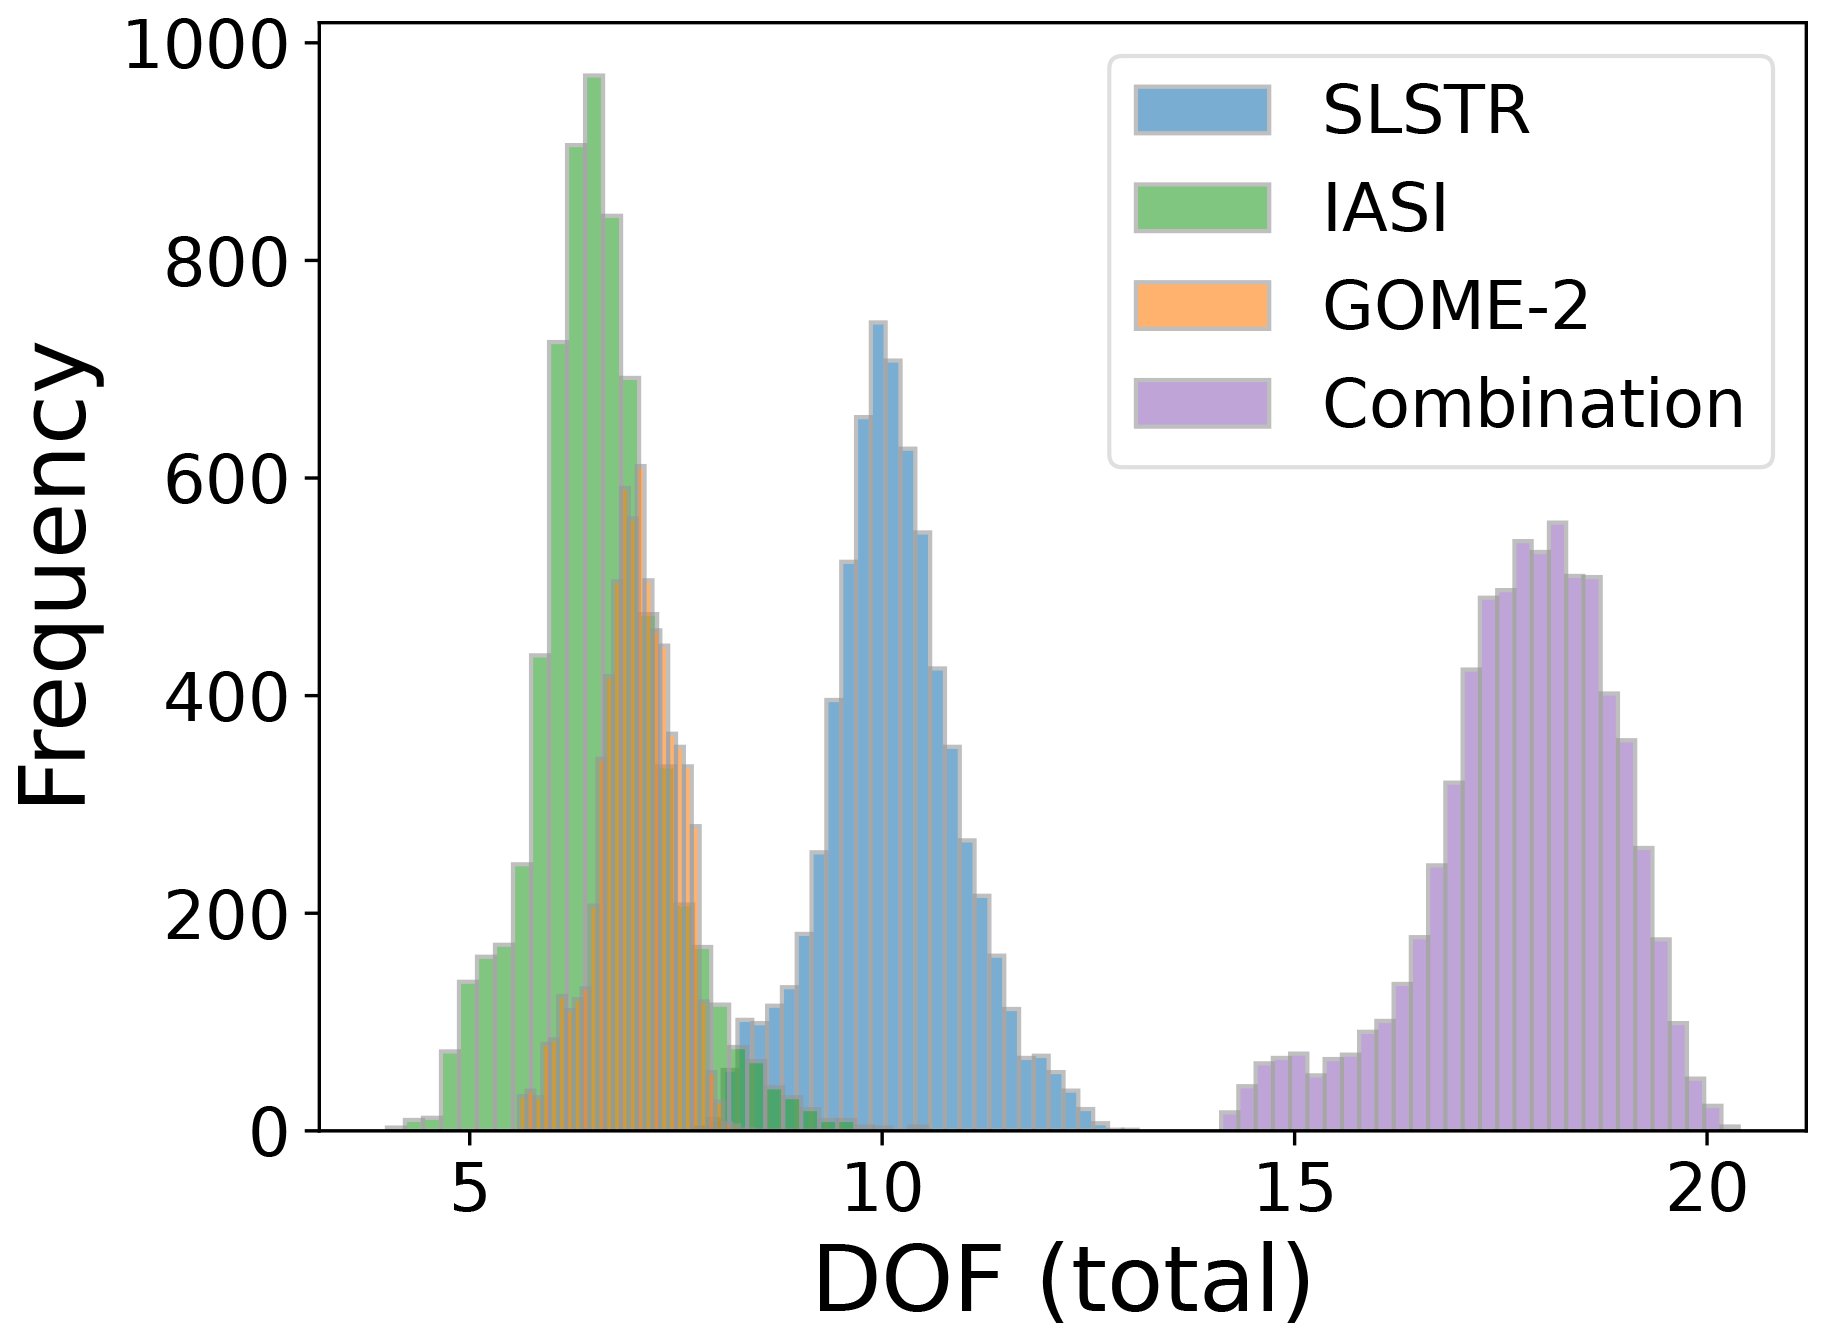
Figure 1Histogram showing the distribution of the total DOFs for the individual instruments (SLSTR in blue from 8 to 13, GOME-2 in orange from 5 to 8 and IASI in green from 4 to 10) and for the combination of these instruments in purple from 14 to 20. This demonstrates a significant gain in the total information content achieved through the combination of instruments.
The degrees of freedom for all aerosol components are defined as the sum of the diagonal elements of the averaging kernel matrix corresponding to the MERRA-2 scaling factors for each component; the DOFs provide the result targeted by the primary goal of this study – determining the aerosol composition. A clear gain in information content is also evident here – from 1 to 6 for GOME-2, 3 to 12 for SLSTR and 2 to 10 for IASI to 6 to 15 for the combination of instruments, as can be seen in Fig. 2.
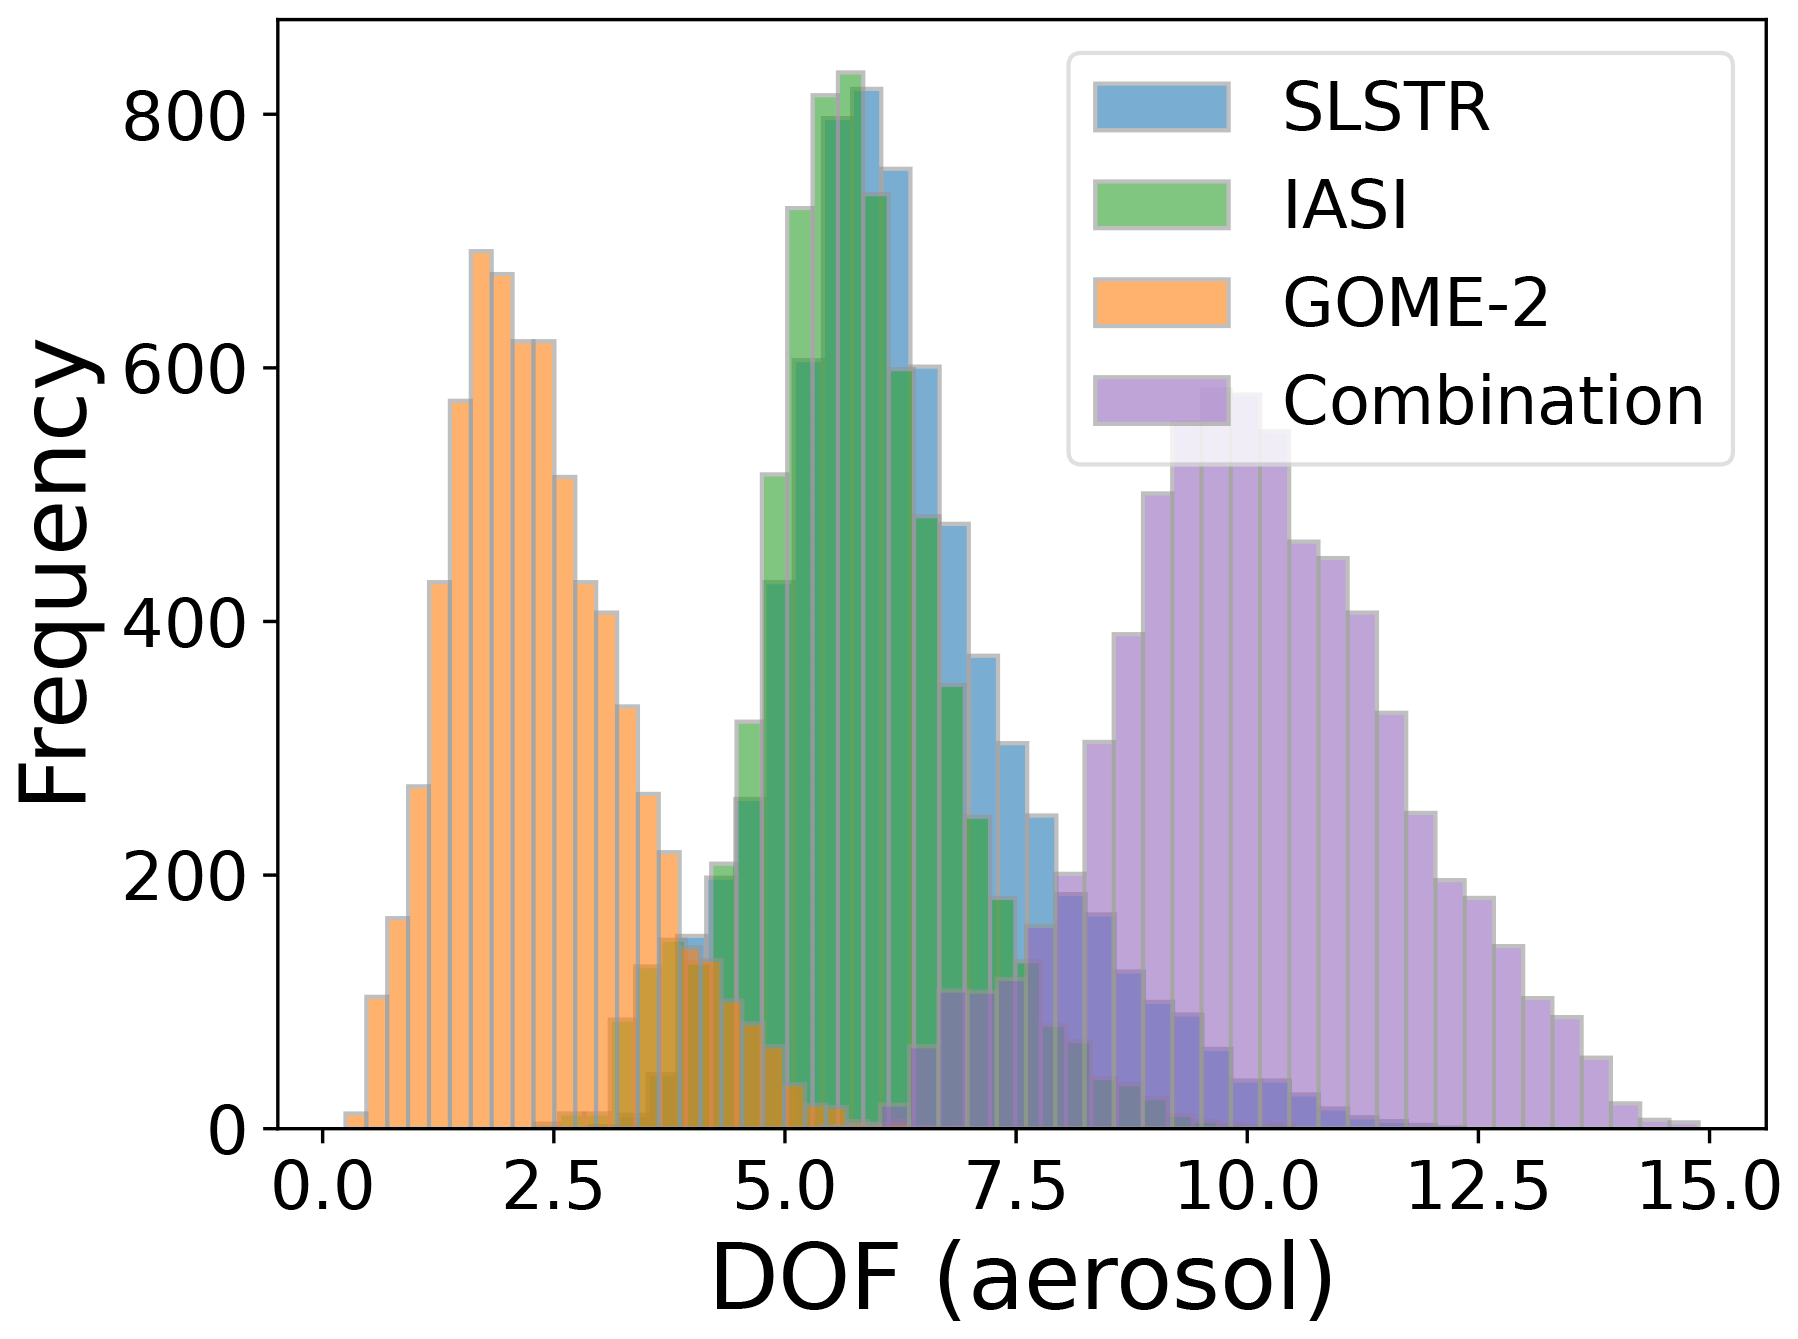
Figure 2Histogram showing the distribution of the sum of DOFs for the aerosol components for the individual instruments (SLSTR in blue from 3 to 12, GOME-2 in orange from 1 to 6 and IASI in green from 2 to 10) and for the combination of these instruments in purple from 6 to 15. This shows a significant information gain for the retrieval of aerosol components obtained through the combination of instruments.
This increase in information content through the combination of these three instruments shows that complementary information adds up to a more detailed picture of the aerosol properties in the atmosphere. This proves the potential of the planned aerosol retrieval to allow retrieving information on aerosol composition, i.e. its contributions to total AOD.
5.2 Information content analyses for the combined datasets
Analysing the information content of data gridded at a higher spatial resolution (1°×1°) for only the 15th of each month reveals the following correlations.
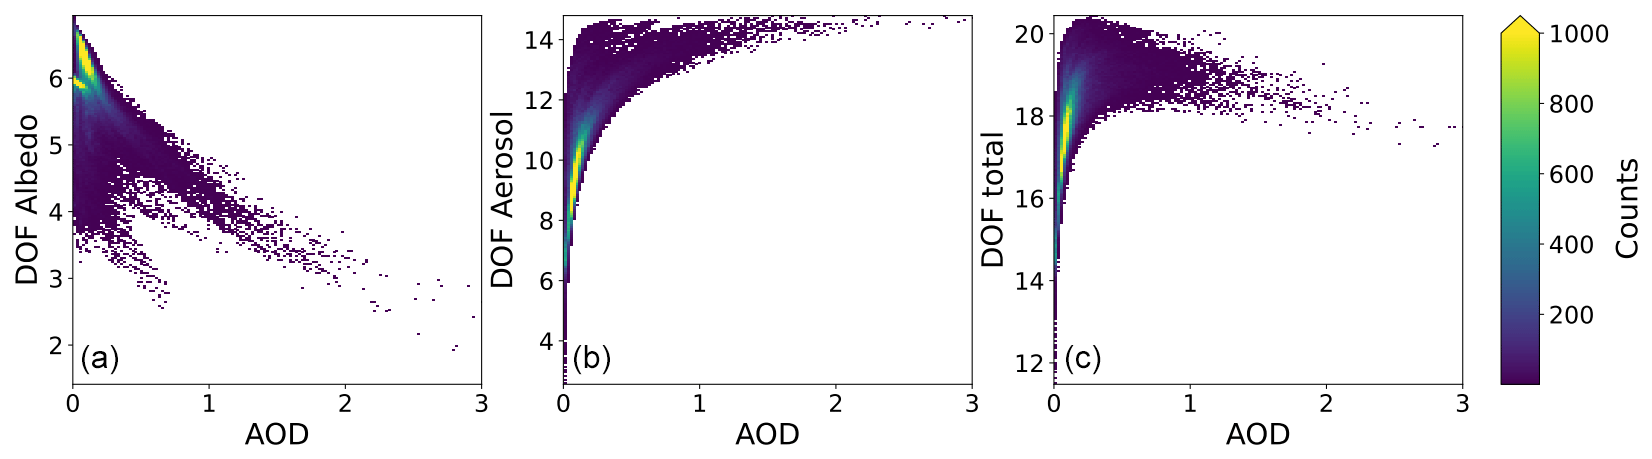
Figure 3Two-dimensional histogram showing the relationship between the DOF for albedo (a), the DOF for the aerosol components (b) and the total DOFs (c) and the AOD. The degrees of freedom for the determination of albedo decrease with increasing AOD, as expected. In contrast, the degrees of freedom for the determination of aerosol components increase with higher AOD. For the total DOFs, a rising trend with increasing AOD is observed at low AOD values, which reverses at an AOD of approximately 0.3. This behaviour can be explained as the sum of the two partial trends shown in the other subplots.
An increase in the degrees of freedom for aerosol component determination can be observed following a logarithmic-shape function with increasing AOD; see Fig. 3 (centre). This means that with a higher aerosol load, more aerosol components can be separated from each other. This is consistent with the results of e.g. Martynenko et al. (2010), Hasekamp and Landgraf (2005), and Hou et al. (2017). When considering the degrees of freedom used to determine the surface albedo as a function of AOD, an opposite behaviour is observed – a decreasing number of degrees of freedom for the spectral albedo determination with increasing AOD, as can be seen in Fig. 3 (left). The determination of surface albedo becomes more difficult at higher aerosol loading because of the shielding effect of aerosols, which is well known and described, for example, in Köpke (2012) and Popp (1995). For the total degrees of freedom, there is also a logarithmic increase of up to approx. AOD=0.3, which turns into a slow linear decrease at higher AOD values; see Fig. 3 (right). This behaviour can be effectively explained as a combination of the two contributing pieces for aerosol and surface information.
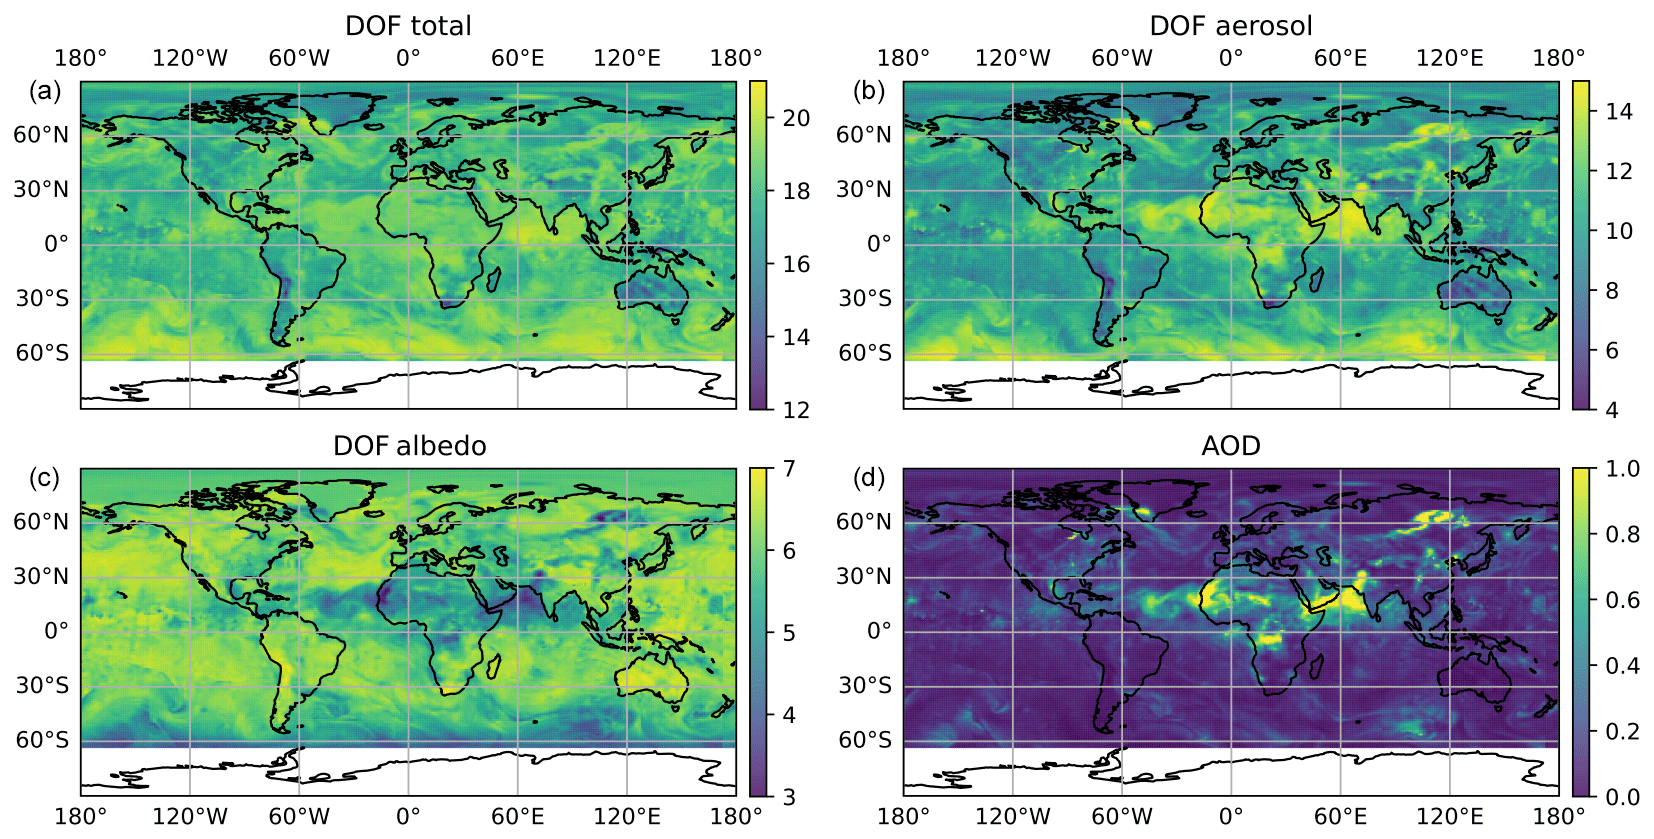
Figure 4Maps showing the distribution of total DOFs (a), DOF for aerosol components (b), DOF for albedo (c) and the AOD (d) on 15 July 2018. Consistent with Fig. 3, DOFs for the determination of aerosol components are higher where there is high AOD, whereas it is the other way around for the determination of the albedo values. Patterns that primarily reflect air movements over oceans can also be observed through the changes in the degrees of freedom for the determination of aerosol components and albedo values.
As an example, the maps in Fig. 4 depict the distribution of the total DOFs (top left), the DOF of the aerosol components (top right), the DOF of the albedo retrieval (lower left) and the AOD (lower right) on 15 July. Data south of 62° S were measured at solar zenith angles of over 90° on this date in the north hemispheric summer. Under these conditions, the amount of reflected UV and VIS radiation is too low, and the retrieval is not performed. It is obvious that in areas with high aerosol amounts (such as over the Sahara and over the Atlantic within the Sahara dust plume), more degrees of freedom are identified for the determination of aerosol components. Moreover, over the roaring forties and furious fifties between 40 and 60° S, higher DOFs for the determination of aerosol components appear, which are probably related to the higher concentration of larger sea salt aerosol components near their source regions. In contrast, we see an opposite effect with a similar spatial pattern when considering the degrees of freedom for albedo determination.
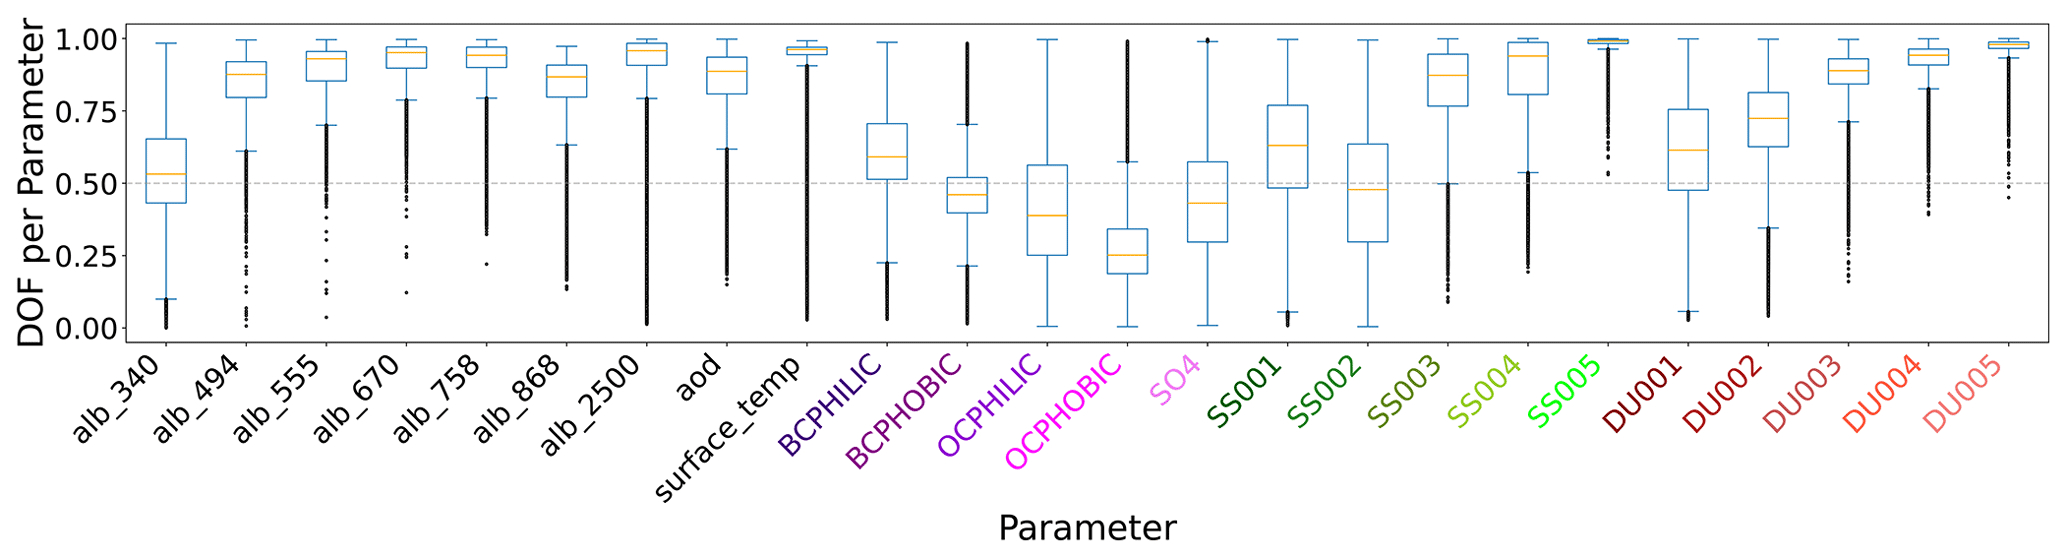
Figure 5Boxplot showing the distribution of DOF values per parameter within all simulated scenarios. A value above 0.5 (dashed grey line) means that this parameter can be retrieved well. The orange line shows the median, the blue box contains the values between the lower and upper quartiles, and the whiskers indicate the minimum and maximum values. If the whiskers are longer than 1.5 times the box, all values exceeding this range are labelled in black as outliers. The albedo values (except the one at 340 nm), the surface temperature and the AOD can be retrieved well in most of the scenarios. For the aerosol components (fine-particle components in purple, sea salt in green and dust in brown), this differs depending on the size and absorption capacity of the components. Larger particles can be determined more reliably than smaller particles, which is clearly visible with dust and sea salt, where the different bins are in ascending order of size. In the case of black and organic carbon, it can be seen that absorbent components can be determined with better quality than (non-)absorbing components.
The observation of higher DOFs for aerosol components over areas with a large sea salt or dust aerosol fraction at a comparatively low total AOD is also supported by Fig. 5. In Fig. 5 we take a closer look at the degrees of freedom for the individual parameters, shown as boxplots, from all 231 805 simulated scenarios. The capability to determine the individual parameters can thus be identified. A value larger than 0.5 (above the dashed grey line) means that this parameter can be determined well (Hou et al., 2018). The spectral albedo values, the surface temperature and the AOD can be determined quite well. When analysing the aerosol components, it is clearly visible that larger particles (e.g. sea salt and dust from bin 003) can be determined reliably in more cases. In the case of carbon compounds, the quantity of hydrophilic aerosols can be determined more frequently than that of hydrophobic aerosols.
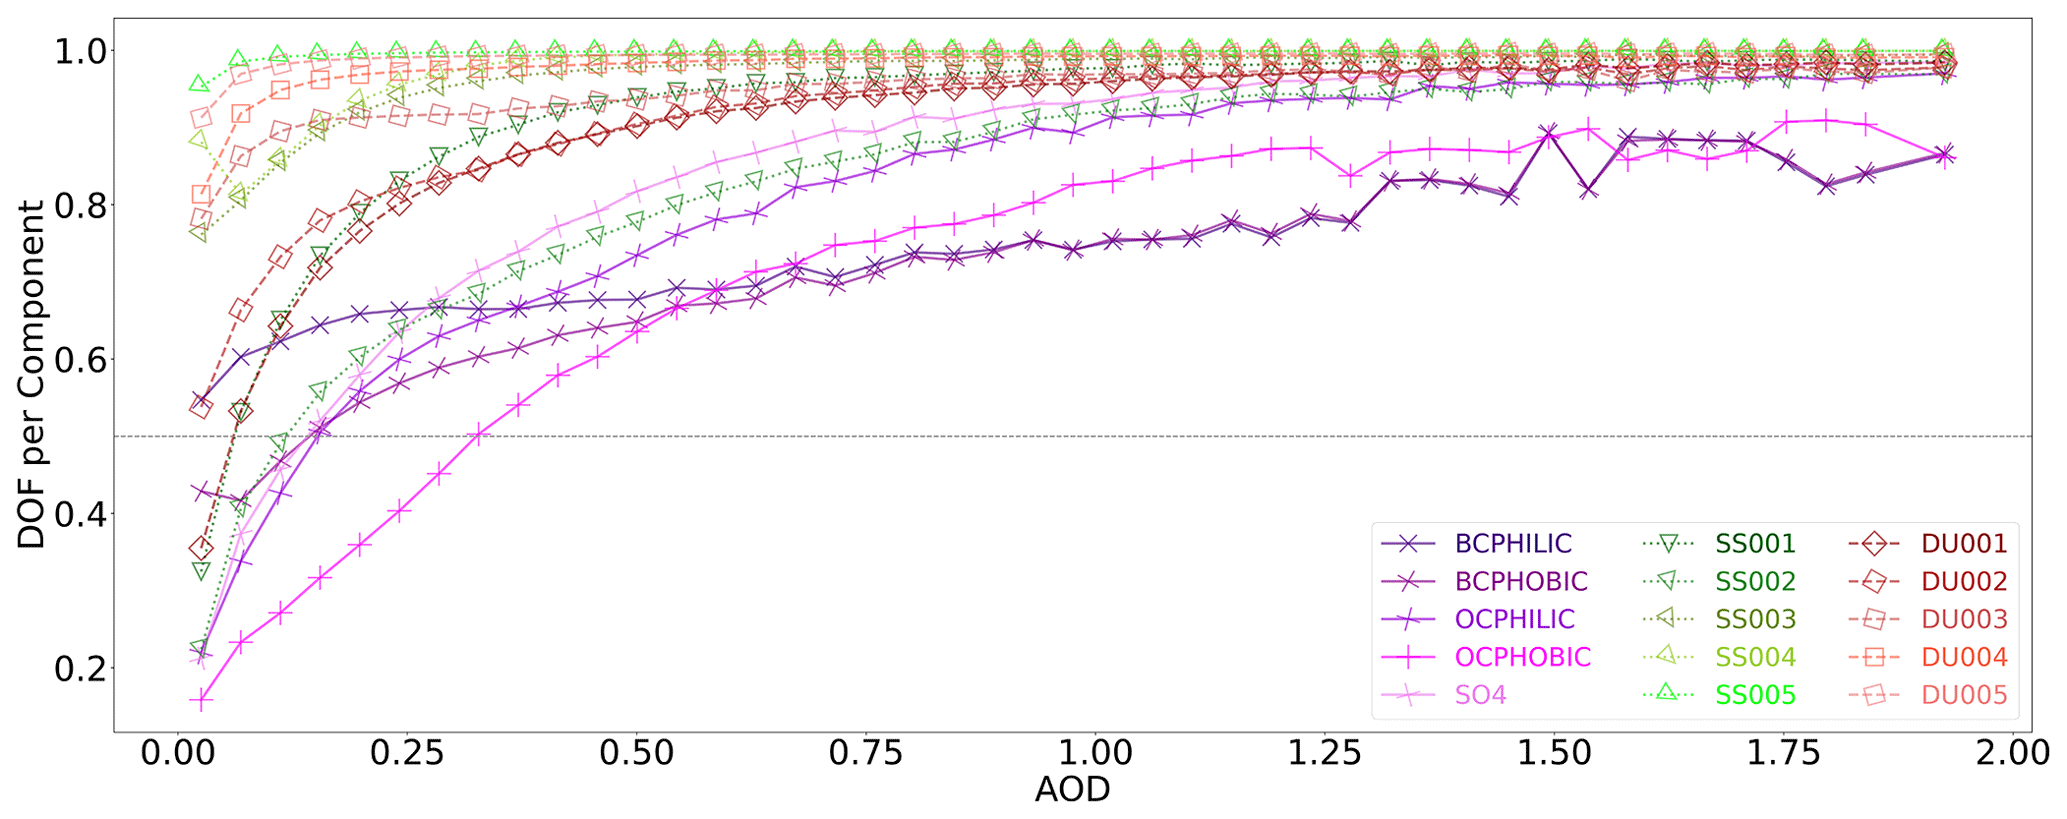
Figure 6Mean values of the binned data of the degrees of freedom per aerosol component plotted against total AOD. The underlying two-dimensional histograms with bin means and standard deviations are shown in Fig. A1. For dust (dashed brown line and squares) and sea salt (dotted green line and triangles), with increasing AOD, an increase in the DOF per component can be seen asymptotically approaching the value 1. With increasing particle size, the initial values at low AOD become higher, and the rise in AOD occurs more rapidly. The different purple graphs, with crosses marking the fine-particle components, carbon components and sulfate, exhibit a less steep increase and overall lower DOF values.
These findings are further supported by Fig. 6, where the different DOFs per aerosol component are plotted against the total AOD. When examining the degrees of freedom of dust and sea salt particles, an increase is observed with rising AOD, asymptotically approaching the value 1. With increasing particle size, a higher initial value at low AOD and a more rapid increase can be observed. The fine-mode aerosol components also show an increase in the degrees of freedom with increasing AOD. However, black carbon aerosols show a less pronounced increase than organic carbon aerosols and sulfates, with black carbon also exhibiting a higher DOF value of 0.45 (hydrophobic) and 0.55 (hydrophilic) at low AOD compared to organic carbon and sulfate with a value of approximately 0.2. Moreover, black carbon saturation levels remain well below 1.
The observations in Figs. 5 and 6 thus show a higher retrieval capability with increasing AOD, increasing particle size and decreasing absorption in the fine mode.
This information content study works with simulated radiative transfer calculations matching the radiances arriving at the three instruments in space. For the simulations, several simplifications are made to reduce calculation efforts. These may have led to increased quantitative values of the DOF as compared to a real retrieval but should not affect the qualitative statements. First, the DOF analysis incorporates realistic measurement noise values (the diagonal elements of the measurement error covariance matrices) for all instruments, but it does not include error correlations between the channels (the off-diagonal elements of the measurement error covariance matrices). This is due to the fact that a comprehensive study of those correlations would require effort that goes beyond this study. Obviously, this simplification holds significant potential to overestimate the information content. Secondly, the assumption of Lambertian surface reflectance is made, which removes one significant source of uncertainty for an aerosol retrieval. However, due to the rather coarse spatial resolution of the collocated measurements at 40 km×80 km and the relatively small observation angle, effects of the bidirectional reflectance distribution function (BRDF) should average out in many situations, leading to a more isotropic and Lambert-like appearance (Zhou et al., 2010) and thus reducing the effect of this simplification. In this study the measured pre-flight instrument response functions are used for the radiometer SLSTR (channel bandwidths of 10–60 nm in the VIS and 380–1000 nm in the TIR range) to model the instrument measurements, while for the narrower measurements from the spectrometers GOME-2 (<0.5 nm resolution) and IASI (0.5 cm−1 resolution), we use the simplification of assuming a delta measurement – a measurement at a sharp wavelength – at the centre wavelength of the spectral bin instead of the instrumental slit function. This simplification reduces the possible measurement errors and could thus lead to higher DOFs in this study compared to a real retrieval, but the effect is expected to remain small. Additionally, a real retrieval will face several practical issues, which violate the assumption of combining observations of exactly identical atmospheric volumes made at exactly the same time, which may reduce DOF values. These include varying time shifts between the satellite overpasses (within the 60 min window allowed), different viewing angle constellations, imperfect co-location of the instruments and calibration inconsistencies or biases between the instruments. For the vertical distribution of the aerosols, we use monthly means for each component on a 1°×1° grid from MERRA-2. As the vertical distribution changes over time, this assumption is not exactly valid in a real case and will thus lead to additional uncertainty for the retrieval of aerosol components. Another important aspect is cloud detection. For this simulation study, we assume cloud-free conditions; in a real retrieval, cloud algorithms are used to detect and mask out clouds. Undetected clouds add further errors and uncertainties and influence the retrieved parameters, thus decreasing the DOFs. On the other hand, the three combined instruments provide significant spectral, spatial and angular information so that strict cloud masking should be possible. All these simplifications result in limitations for the quantitative results of this study. However, all of these limitations are the same both in the study of the information content of individual instruments and in their combination. Therefore, the general conclusions remain unaffected. This concerns the information gain through the combination of the three instruments, the qualitative behaviour of the DOF as a function of the AOD and the capabilities with which aerosol components can be determined with varying precision. In summary, it can be stated that although this information content study has some limitations, it clearly shows the potential of the combination of the three instruments IASI, GOME-2 and SLSTR for a retrieval based on this combination. In addition, the information content analysis can be useful as a tool to identify optimal sensor combinations and select the channels that contribute the most to the information content for the specific target result (e.g. AOD, aerosol composition, surface properties). This information can be extracted from the Jacobian matrix K, which contains the sensitivities of each measurement to each variable in the state vector.
In this paper we analysed the information content for an aerosol retrieval using a combination of the following three instruments: SLSTR on Sentinel-3A and Sentinel-3B and GOME-2 and IASI, both on MetOp-A, MetOp-B and MetOp-C, and the information gain coming from this combination as compared to the individual sensors. The information gained by combining the three instruments for aerosol retrieval was clearly shown and is important for further climate studies. From the simulation study, it can be concluded that in addition to at best seven spectral surface albedo values, the surface temperature and total AOD, the sensor combination offers the possibility of determining the mass mixing ratios for 6 to 15 aerosol components and thus also their contribution to the AOD. The number of parameters that can be determined depends both on the AOD (more parameters can be determined with a higher AOD) and on the surface albedo. How well the aerosol components can be determined also depends on the particle size. This means that the mass mixing ratios of aerosol components can be determined more easily with larger particle sizes.
The results presented here show the capabilities to determine spectral ground albedo, AOD and aerosol composition by combining the data of three instruments; with this simplified simulation-based study, up to 15 DOFs for aerosol components can be shown. This is a significant gain in information compared to single-sensor aerosol retrievals. Currently used single-sensor aerosol retrievals can usually determine total AOD, fine-mode AOD or dust AOD alone, and ground albedo at one wavelength; the best instruments (multi-angle polarimeters such as POLDER) allow us to invert AOD, fine-mode AOD and single-scattering albedo (Holzer-Popp et al., 2013). Retrieving more information on aerosol composition opens up further scientific analyses of aerosol-related geophysical phenomena, for example, the transport of desert dust or aerosols caused by forest fires, not only due to their occurrence outside their source regions but also as a result of industrial combustion and the impact of Covid-19-related restrictions on emissions from industry and the transport sector. A more detailed separation of aerosol components will also enable further research into direct aerosol effects on the climate system and into aerosol–cloud interactions and associated indirect effects on regional radiative forcing.
Table A1Aerosol components used for this study from MERRA-2 (Randles et al., 2017).
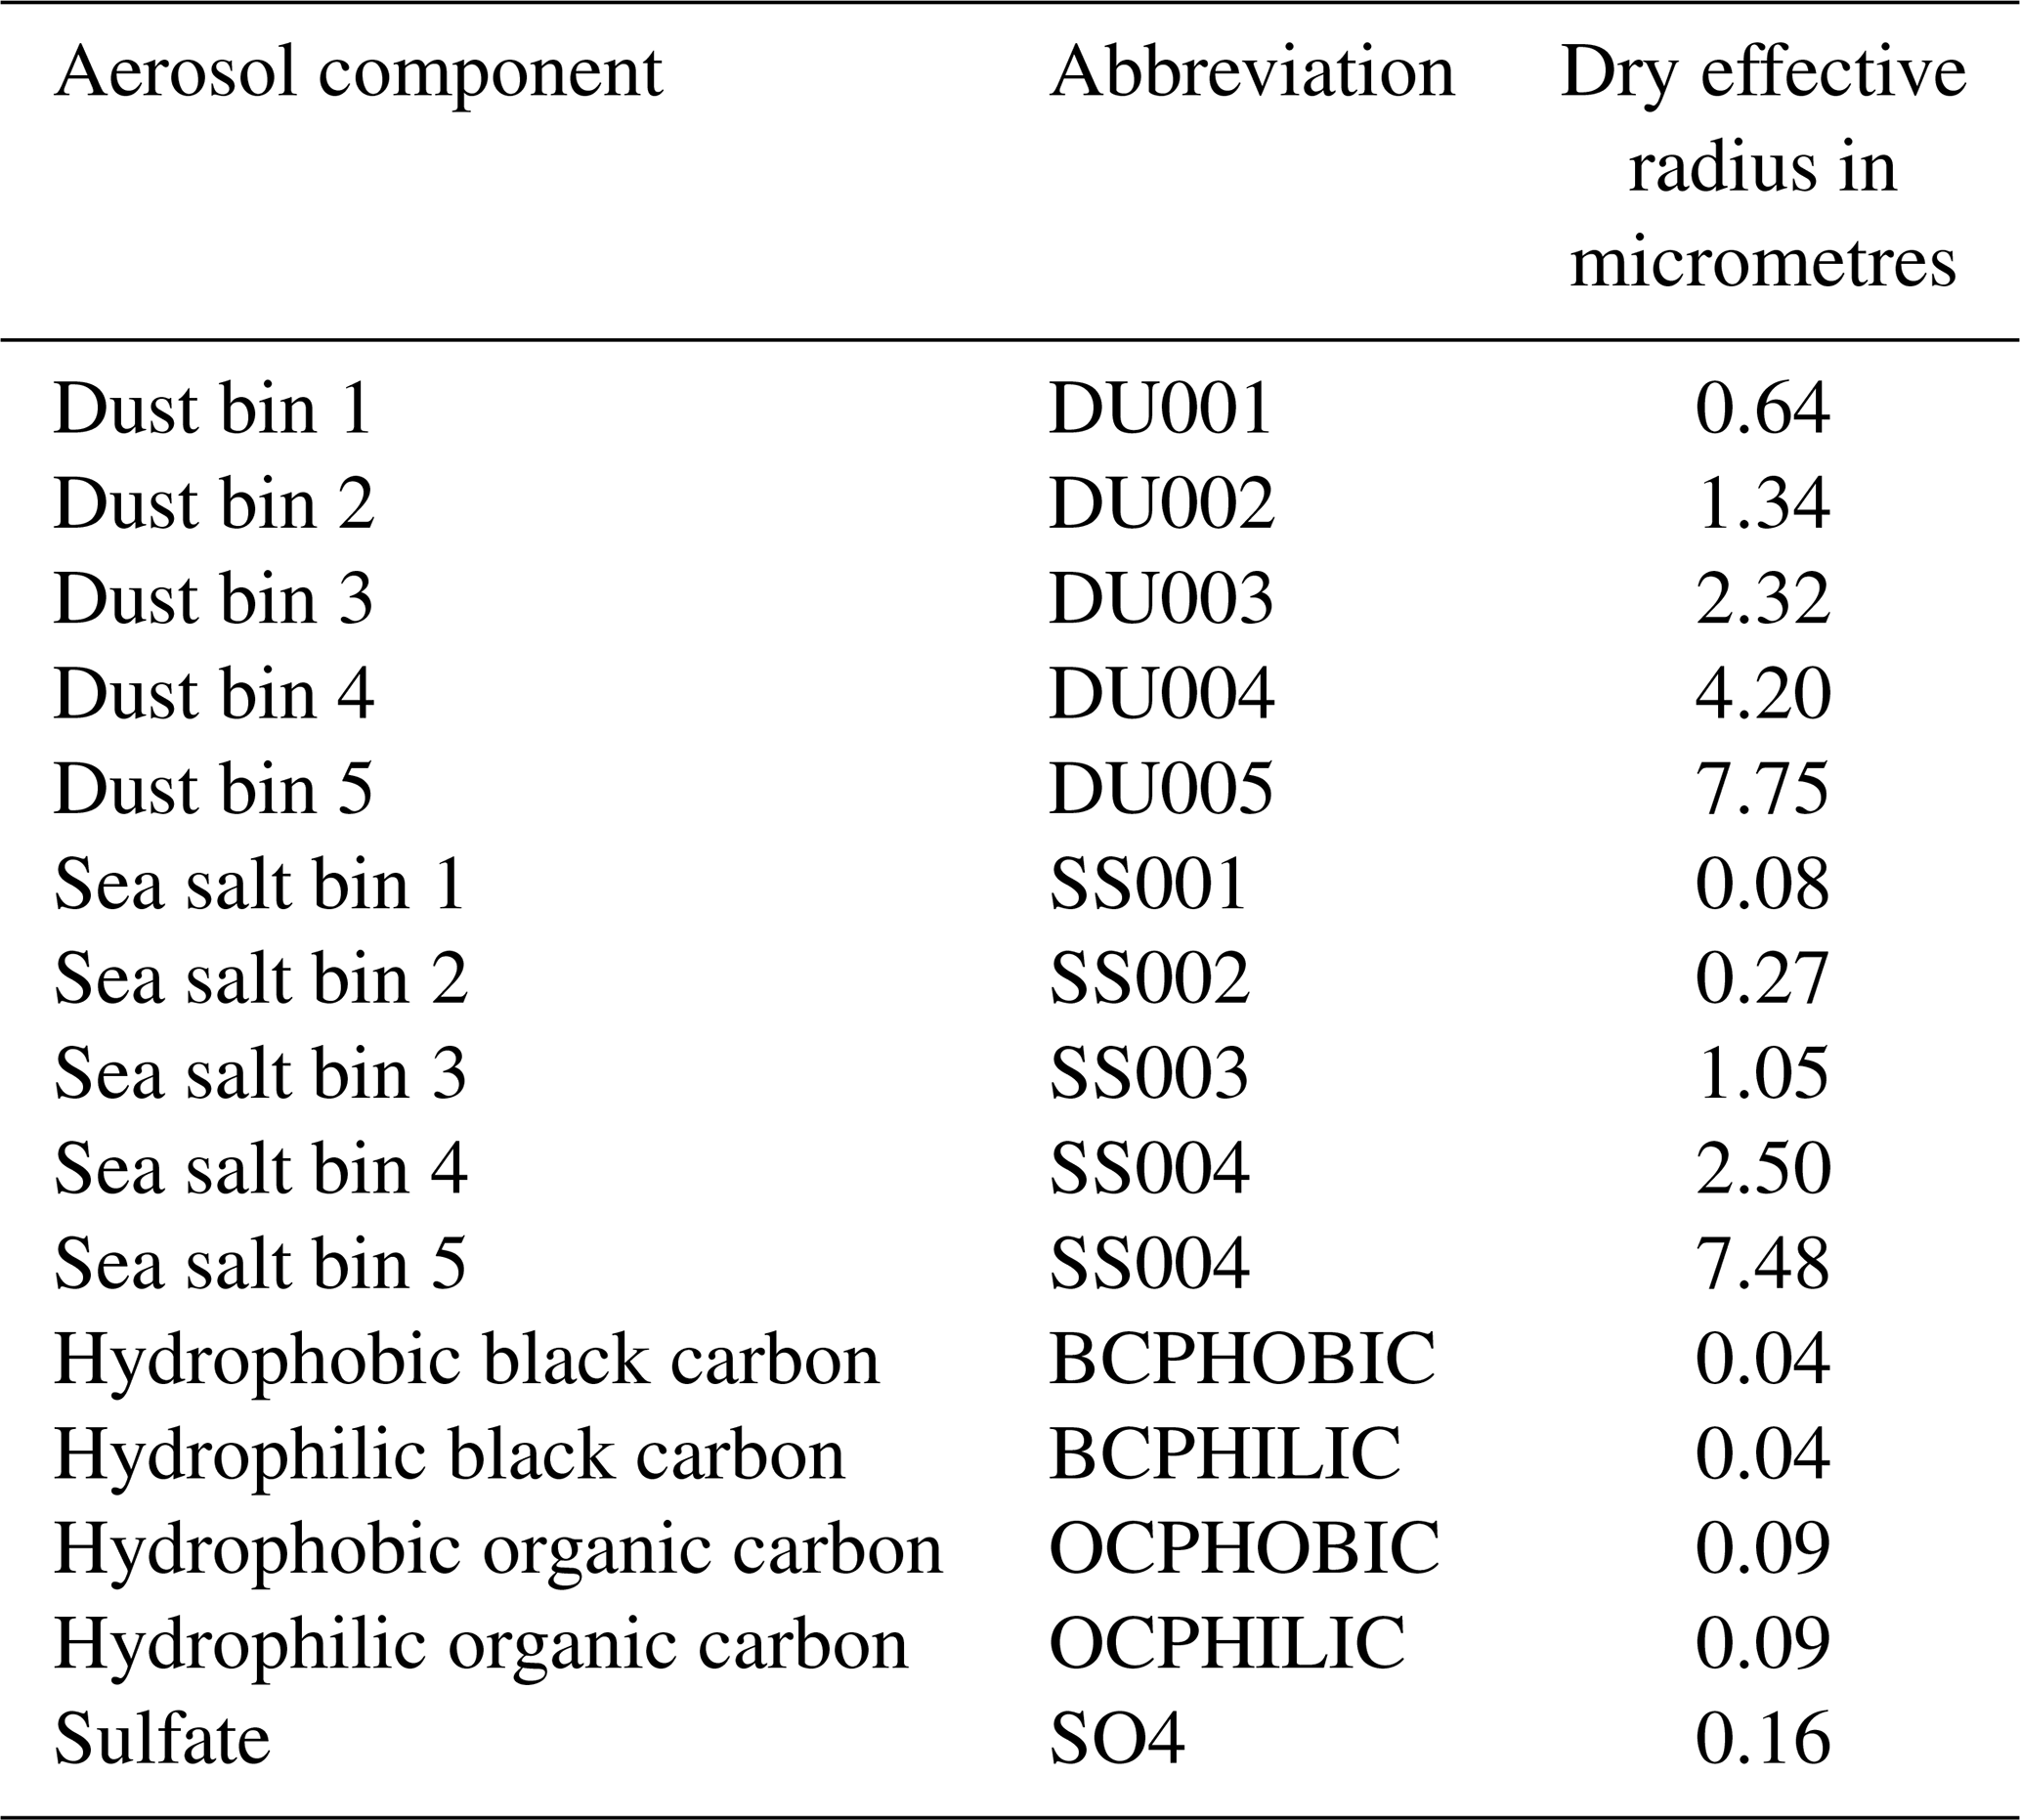
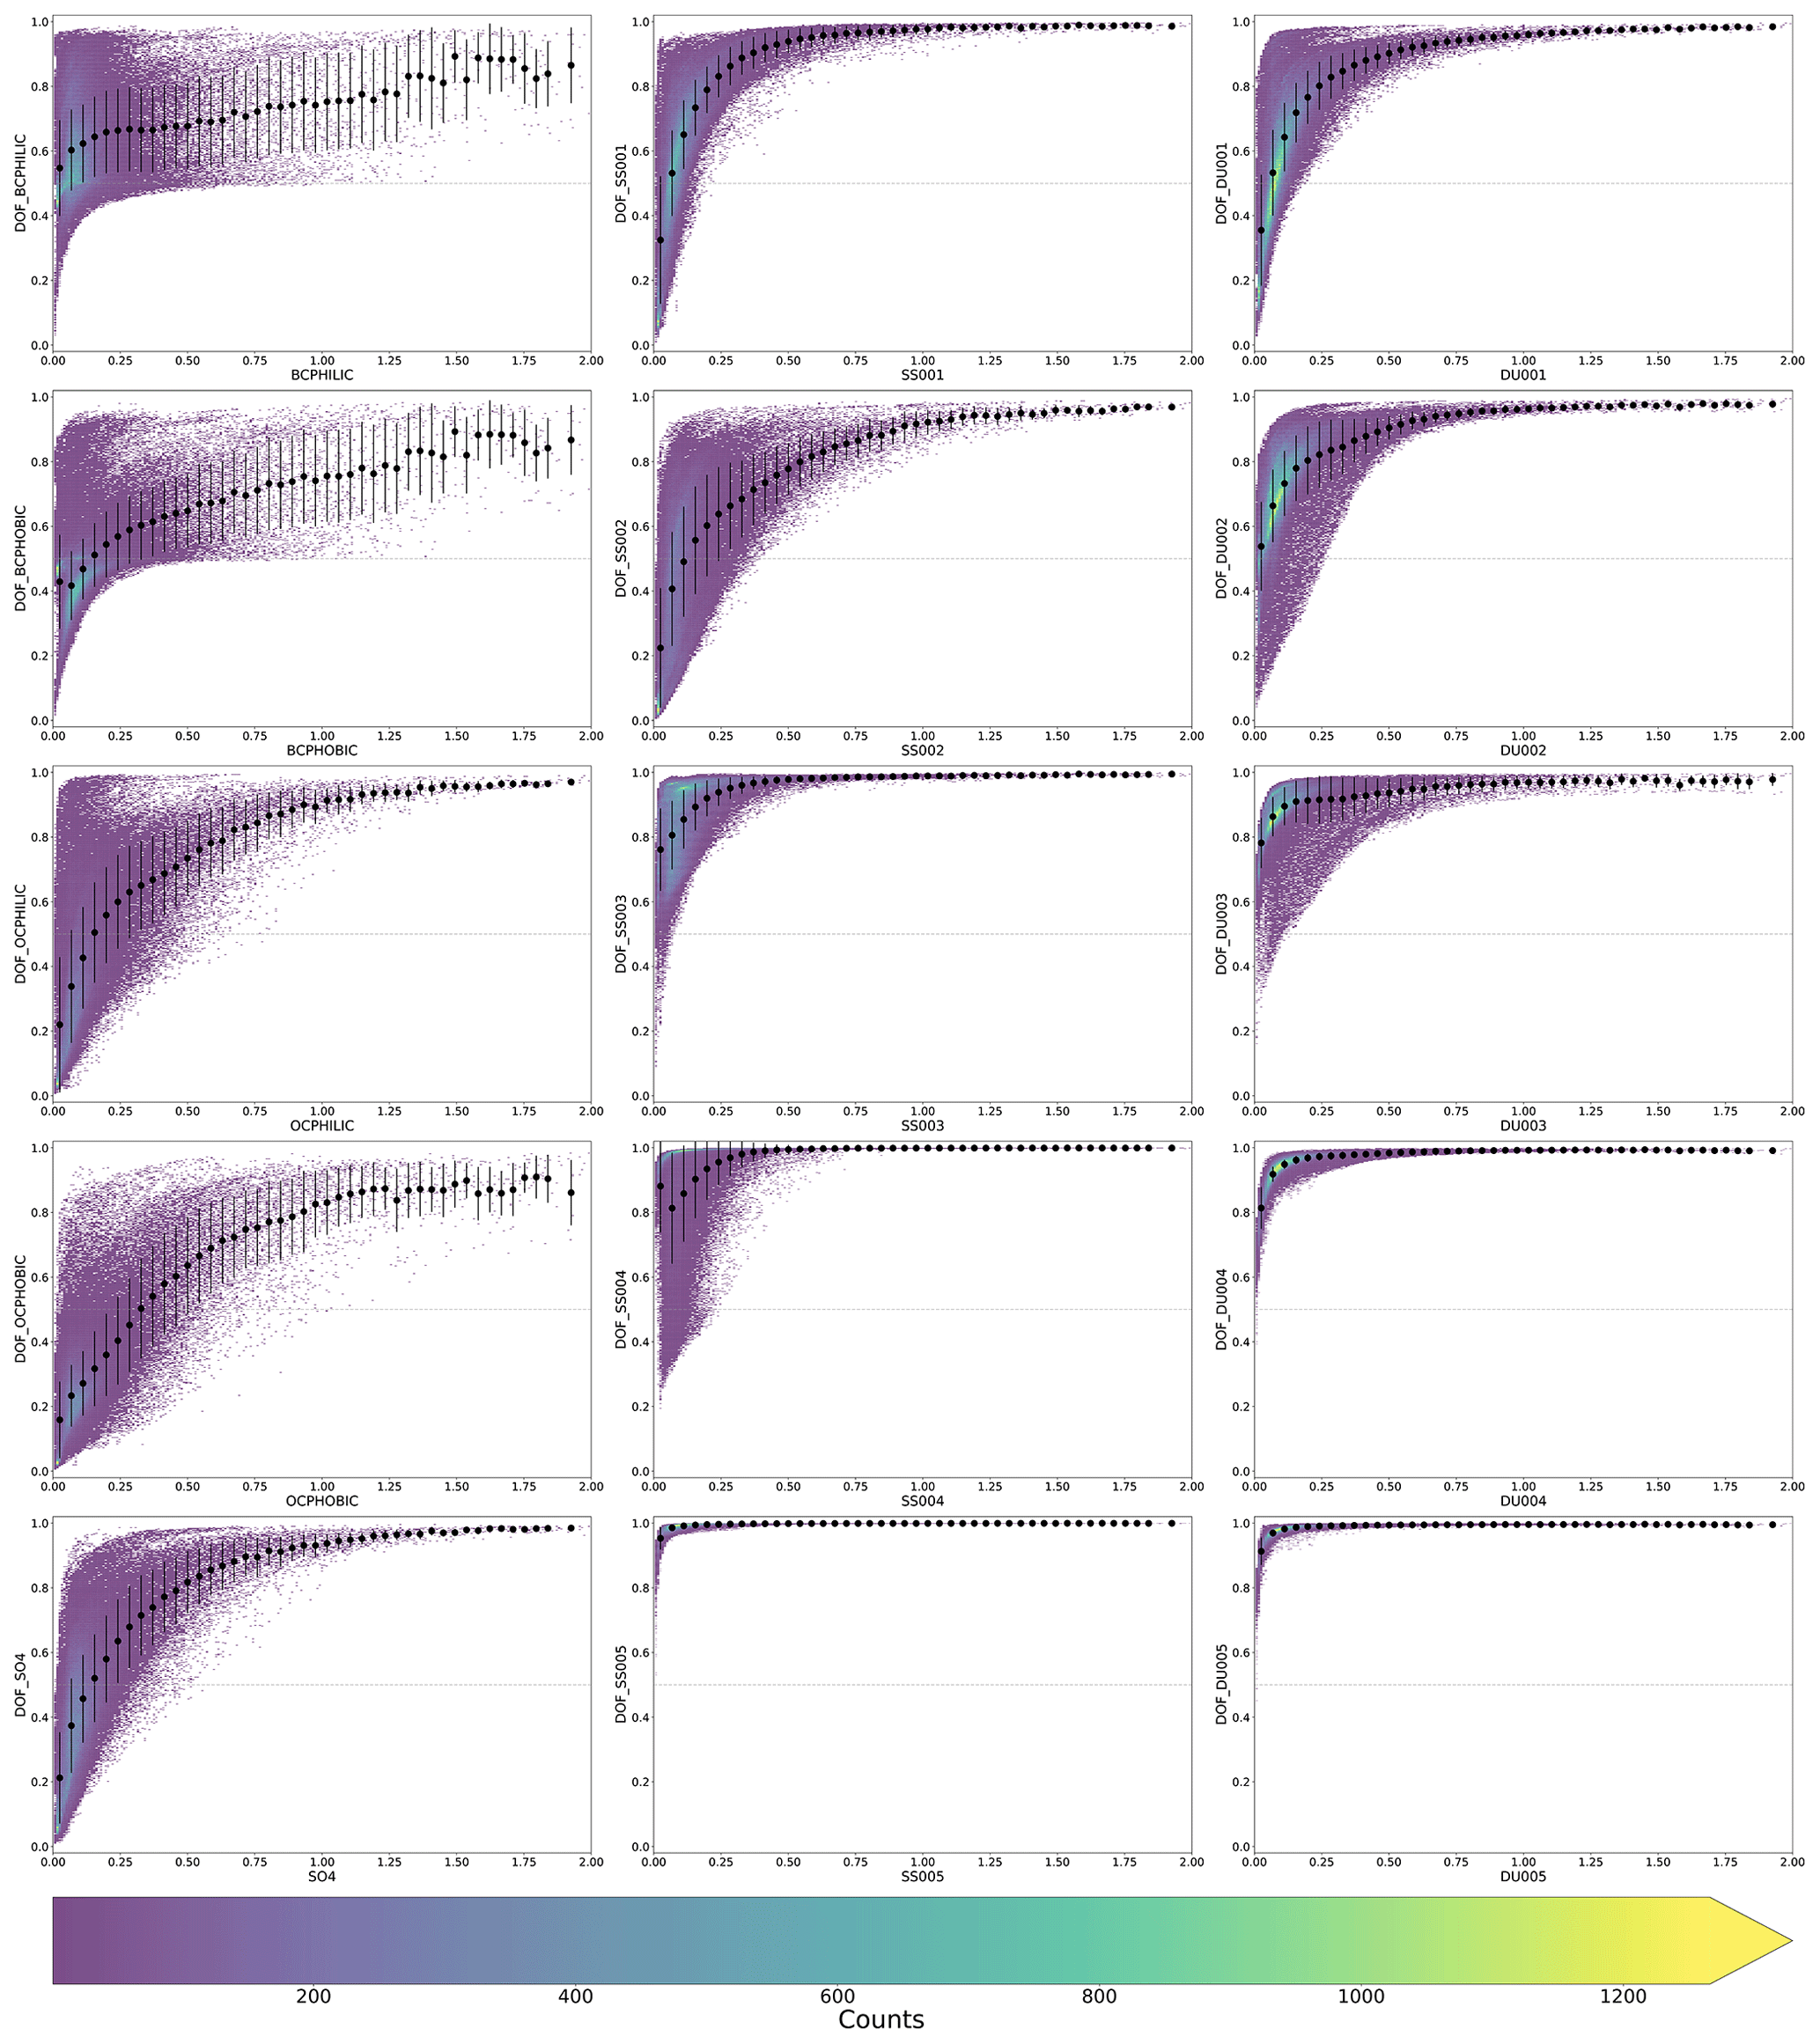
Figure A1Two-dimensional histograms showing the DOFs separately for the 15 different aerosol components depending on their scaling factor. In addition, the binned data are plotted in black (dots for the mean value per bin and error bar showing the standard deviation).
The MERRA-2 datasets used can be accessed at https://doi.org/10.5067/HNGA0EWW0R09 (Global Modeling And Assimilation Office and Pawson, 2015a) and https://doi.org/10.5067/LTVB4GPCOTK2 (Global Modeling And Assimilation Office and Pawson, 2015b), and the GOME-2 surface LER database can be accessed in Tilstra et al. (2017, 2021).
US carried out the simulations and the analysis of the data and prepared the paper with valuable input from TP, MV and HB. US and TP developed the retrieval setup with the satellite combination. HB introduced the idea of an information content analysis. MV developed the idea of using MERRA-2 data to obtain realistic aerosol compositions in the simulations and helped US to integrate them. US developed the code for the study with support from MV. All authors conceived the research and significantly contributed to the scientific discussions.
The contact author has declared that none of the authors has any competing interests.
Publisher’s note: Copernicus Publications remains neutral with regard to jurisdictional claims made in the text, published maps, institutional affiliations, or any other geographical representation in this paper. While Copernicus Publications makes every effort to include appropriate place names, the final responsibility lies with the authors.
The authors gratefully acknowledge the computational and data resources provided through the joint high-performance data analytics (HPDA) project terrabyte of the German Aerospace Center (DLR) and the Leibniz Supercomputing Centre (LRZ). We acknowledge the free use of the GOME-2 surface LER database provided through the AC SAF of EUMETSAT. The GOME-2 surface LER database was created by the Royal Netherlands Meteorological Institute (KNMI). We acknowledge the free use of monthly climatological emissivity spectral data with spatial grids of 0.25° latitude and longitude based on IASI data of MetOp-A from 1 June 2007 to 31 December 2016, MetOp-B from 1 August 2013 to 31 December 2023 and MetOp-C from 1 July 2019 to 31 December 2023, provided by Daniel K. Zhou of NASA's Langley Research Center.
The article processing charges for this open-access publication were covered by the German Aerospace Center (DLR).
This paper was edited by Vassilis Amiridis and reviewed by three anonymous referees.
Anderson, K. S., Hansen, C. W., Holmgren, W. F., Jensen, A. R., Mikofski, M. A., and Driesse, A.: pvlib python: 2023 project update, Journal of Open Source Software, 8, 5994, https://doi.org/10.21105/joss.05994, 2023. a
Andersson, A.: A Model for the Spectral Dependence of Aerosol Sunlight Absorption, ACS Earth and Space Chemistry, 1, 533–539, https://doi.org/10.1021/acsearthspacechem.7b00066, 2017. a
Arias, P., Bellouin, N., Coppola, E., Jones, R., Krinner, G., Marotzke, J., Naik, V., Palmer, M., Plattner, G.-K., Rogelj, J., Rojas, M., Sillmann, J., Storelvmo, T., Thorne, P., Trewin, B., Rao, K. A., Adhikary, B., Allan, R., Armour, K., Bala, G., Barimalala, R., Berger, S., Canadell, J., Cassou, C., Cherchi, A., Collins, W., Collins, W., Connors, S., Corti, S., Cruz, F., Dentener, F., Dereczynski, C., Luca, A. D., Niang, A. D., Doblas-Reyes, F., Dosio, A., Douville, H., Engelbrecht, F., Eyring, V., Fischer, E., Forster, P., Fox-Kemper, B., Fuglestvedt, J., Fyfe, J., Gillett, N., Goldfarb, L., Gorodetskaya, I., Gutierrez, J., Hamdi, R., Hawkins, E., Hewitt, H., Hope, P., Islam, A., Jones, C., Kaufman, D., Kopp, R., Kosaka, Y., Kossin, J., Krakovska, S., Lee, J.-Y., Li, J., Mauritsen, T., Maycock, T., Meinshausen, M., Min, S.-K., Monteiro, P., Ngo-Duc, T., Otto, F., Pinto, I., Pirani, A., Raghavan, K., Ranasinghe, R., Ruane, A., Ruiz, L., Sallée, J.-B., Samset, B., Sathyendranath, S., Seneviratne, S., Sörensson, A., Szopa, S., Takayabu, I., Tréguier, A.-M., van den Hurk, B., Vautard, R., von Schuckmann, K., Zaehle, S., Zhang, X., and Zickfeld, K.: Technical Summary, Cambridge University Press, 35–144, https://doi.org/10.1017/9781009157896.002, 2021. a, b
Barton, I. J., Zavody, A. M., O'Brien, D. M., Cutten, D. R., Saunders, R. W., and Llewellyn-Jones, D. T.: Theoretical algorithms for satellite-derived sea surface temperatures, J. Geophys. Res.-Atmos., 94, 3365–3375, https://doi.org/10.1029/jd094id03p03365, 1989. a
Bevan, S. L., North, P. R., Los, S. O., and Grey, W. M.: A global dataset of atmospheric aerosol optical depth and surface reflectance from AATSR, Remote Sens. Environ., 116, 199–210, https://doi.org/10.1016/j.rse.2011.05.024, 2012. a
Blumstein, D., Chalon, G., Carlier, T., Buil, C., Hebert, P., Maciaszek, T., Ponce, G., Phulpin, T., Tournier, B., Simeoni, D., Astruc, P., Clauss, A., Kayal, G., and Jegou, R.: IASI instrument: technical overview and measured performances, Proc. SPIE 5543, Infrared Spaceborne Remote Sensing XII, Optical Science and Technology, SPIE 49th Annual Meeting, 2004, Denver, Colorado, United States, https://doi.org/10.1117/12.560907, 2004. a, b
Boucher, O., Randall, D., Artaxo, P., Bretherton, C., Feingold, G., Forster, P., Kerminen, V.-M., Kondo, Y., Liao, H., Lohmann, U., Rasch, P., Satheesh, S., Sherwood, S., Stevens, B., and Zhang, X.: Clouds and Aerosols, Cambridge University Press, https://doi.org/10.1017/CBO9781107415324.016, 2013. a
Burrows, S. M., McCluskey, C. S., Cornwell, G., Steinke, I., Zhang, K., Zhao, B., Zawadowicz, M., Raman, A., Kulkarni, G., China, S., Zelenyuk, A., and DeMott, P. J.: Ice-Nucleating Particles That Impact Clouds and Climate: Observational and Modeling Research Needs, Rev. Geophys., 60, e2021RG000745, https://doi.org/10.1029/2021rg000745, 2022. a
Callewaert, S., Vandenbussche, S., Kumps, N., Kylling, A., Shang, X., Komppula, M., Goloub, P., and De Mazière, M.: The Mineral Aerosol Profiling from Infrared Radiances (MAPIR) algorithm: version 4.1 description and evaluation, Atmos. Meas. Tech., 12, 3673–3698, https://doi.org/10.5194/amt-12-3673-2019, 2019. a
Callies, J., Corpaccioli, E., Eisinger, M., Hahne, A., and Lefebvre, A.: GOME-2-Metop's second-generation sensor for operational ozone monitoring, ESA Bull., 102, 28–36, 2000. a
Capelle, V., Chédin, A., Siméon, M., Tsamalis, C., Pierangelo, C., Pondrom, M., Crevoisier, C., Crepeau, L., and Scott, N. A.: Evaluation of IASI-derived dust aerosol characteristics over the tropical belt, Atmos. Chem. Phys., 14, 9343–9362, https://doi.org/10.5194/acp-14-9343-2014, 2014. a
Charlson, R. J., Schwartz, S. E., Hales, J. M., Cess, R. D., Coakley, J. A., Hansen, J. E., and Hofmann, D. J.: Climate Forcing by Anthropogenic Aerosols, Science, 255, 423–430, https://doi.org/10.1126/science.255.5043.423, 1992. a
Clarisse, L., Clerbaux, C., Franco, B., Hadji‐Lazaro, J., Whitburn, S., Kopp, A. K., Hurtmans, D., and Coheur, P.: A Decadal Data Set of Global Atmospheric Dust Retrieved From IASI Satellite Measurements, J. Geophys. Res.-Atmos., 124, 1618–1647, https://doi.org/10.1029/2018jd029701, 2019. a
Clerbaux, C., Boynard, A., Clarisse, L., George, M., Hadji-Lazaro, J., Herbin, H., Hurtmans, D., Pommier, M., Razavi, A., Turquety, S., Wespes, C., and Coheur, P.-F.: Monitoring of atmospheric composition using the thermal infrared IASI/MetOp sounder, Atmos. Chem. Phys., 9, 6041–6054, https://doi.org/10.5194/acp-9-6041-2009, 2009. a, b
Coppo, P., Ricciarelli, B., Brandani, F., Delderfield, J., Ferlet, M., Mutlow, C., Munro, G., Nightingale, T., Smith, D., Bianchi, S., Nicol, P., Kirschstein, S., Hennig, T., Engel, W., Frerick, J., and Nieke, J.: SLSTR: a high accuracy dual scan temperature radiometer for sea and land surface monitoring from space, J. Mod. Optic., 57, 1815–1830, https://doi.org/10.1080/09500340.2010.503010, 2010. a, b, c
Drummond, A. and Thekaekara, M.: The Extraterrestrial Solar Spectrum, Institute of Environmental Sciences, ISBN 9780915414437, 1973. a
Dubovik, O., Fuertes, D., Litvinov, P., Lopatin, A., Lapyonok, T., Doubovik, I., Xu, F., Ducos, F., Chen, C., Torres, B., Derimian, Y., Li, L., Herreras-Giralda, M., Herrera, M., Karol, Y., Matar, C., Schuster, G. L., Espinosa, R., Puthukkudy, A., Li, Z., Fischer, J., Preusker, R., Cuesta, J., Kreuter, A., Cede, A., Aspetsberger, M., Marth, D., Bindreiter, L., Hangler, A., Lanzinger, V., Holter, C., and Federspiel, C.: A Comprehensive Description of Multi-Term LSM for Applying Multiple a Priori Constraints in Problems of Atmospheric Remote Sensing: GRASP Algorithm, Concept, and Applications, Frontiers in Remote Sensing, 2, https://doi.org/10.3389/frsen.2021.706851, 2021a. a
Dubovik, O., Schuster, G. L., Xu, F., Hu, Y., Bösch, H., Landgraf, J., and Li, Z.: Grand Challenges in Satellite Remote Sensing, Frontiers in Remote Sensing, 2, https://doi.org/10.3389/frsen.2021.619818, 2021b. a
EUMETSAT: GOME-2 Products Guide; Ref.: EUM/OPS-EPS/MAN/05/0005, Tech. rep., https://www-cdn.eumetsat.int/files/2020-04/pdf_man_050005_gome2-pg.pdf (last access: 5 September 2024), 2005. a
EUMETSAT: Validation Report – IASI-A Level 1c FCDR release 1, techreport, EUMETSAT, doc.-No.: EUM/RSP/REP/18/1024768; Issue: v3A e-signed, https://user.eumetsat.int/s3/eup-strapi-media/Product_User_Guide_IASI_Level_1c_FCDR_release_2_v1_A_d32efe2626.pdf (last access: 24 April 2025), 2019. a
EUMETSAT: GOME-2 Metop-A and -B FDR Product Validation Report Reprocessing R3, techreport, EUMETSAT, doc.-No.: EUM/OPS/DOC/21/1237264; Issue: v4 e-signed, https://user.eumetsat.int/s3/eup-strapi-media/GOME_2_Metop_A_and_B_FDR_Product_Validation_Report_Reprocessing_R3_8a6a49db6c.pdf (last access: 24 April 2025), 2022. a
EUMETSAT AC SAF: GOME-2 Instrument, https://acsaf.org/gome-2.php, last access: 8 July 2024. a
European Space Agency: SentiWiki – Sentinel-3 – SLSTR Products, https://sentiwiki.copernicus.eu/web/slstr-products (last access: 8 July 2024), 2024. a, b, c
Forster, P., Storelvmo, T., Armour, K., Collins, W., Dufresne, J.-L., Frame, D., Lunt, D., Mauritsen, T., Palmer, M., Watanabe, M., Wild, M., and Zhang, H.: The Earth's Energy Budget, Climate Feedbacks and Climate Sensitivity, Cambridge University Press, 923–1054, ISBN 9781009157896, https://doi.org/10.1017/9781009157896.002, 2021. a, b
Gliß, J., Mortier, A., Schulz, M., Andrews, E., Balkanski, Y., Bauer, S. E., Benedictow, A. M. K., Bian, H., Checa-Garcia, R., Chin, M., Ginoux, P., Griesfeller, J. J., Heckel, A., Kipling, Z., Kirkevåg, A., Kokkola, H., Laj, P., Le Sager, P., Lund, M. T., Lund Myhre, C., Matsui, H., Myhre, G., Neubauer, D., van Noije, T., North, P., Olivié, D. J. L., Rémy, S., Sogacheva, L., Takemura, T., Tsigaridis, K., and Tsyro, S. G.: AeroCom phase III multi-model evaluation of the aerosol life cycle and optical properties using ground- and space-based remote sensing as well as surface in situ observations, Atmos. Chem. Phys., 21, 87–128, https://doi.org/10.5194/acp-21-87-2021, 2021. a
Global Modeling And Assimilation Office and Pawson, S.: MERRA-2 inst3_2d_gas_Nx: 2d, 3-Hourly, Instantaneous, Single-Level, Assimilation, Aerosol Optical Depth Analysis V5.12.4, Greenbelt, MD, USA, Goddard Earth Sciences Data and Information Services Center (GES DISC) [data set], https://doi.org/10.5067/HNGA0EWW0R09, 2015a. a, b, c
Global Modeling And Assimilation Office and Pawson, S.: MERRA-2 inst3_3d_aer_Nv: 3d, 3-Hourly, Instantaneous, Model-Level, Assimilation, Aerosol Mixing Ratio V5.12.4, Greenbelt, MD, USA, Goddard Earth Sciences Data and Information Services Center (GES DISC) [data set],https://doi.org/10.5067/LTVB4GPCOTK2, 2015b. a, b, c
Grzegorski, M., Poli, G., Cacciari, A., Jafariserajehlou, S., Holdak, A., Lang, R., Vazquez-Navarro, M., Munro, R., and Fougnie, B.: Multi-Sensor Retrieval of Aerosol Optical Properties for Near-Real-Time Applications Using the Metop Series of Satellites: Concept, Detailed Description, and First Validation, Remote Sens., 14, 85, https://doi.org/10.3390/rs14010085, 2021. a, b
Hasekamp, O. P. and Landgraf, J.: Retrieval of aerosol properties over the ocean from multispectral single-viewing-angle measurements of intensity and polarization: Retrieval approach, information content, and sensitivity study, J. Geophys. Res.-Atmos., 110, https://doi.org/10.1029/2005JD006212, 2005. a, b
Hasekamp, O. P., Landgraf, J., and van Oss, R.: Aerosol retrieval studies for GOME-2, Ozone saf visiting scientist report, https://www-cdn.eumetsat.int/files/2020-04/pdf_saf_vsr_02.pdf (last access: 24 April 2025), 2004. a
Hébert, P., Blumstein, D., Buil, C., Carlier, T., Chalon, G., Astruc, P., Clauss, A., Siméoni, D., and Tournier, B.: IASI instrument: technical description and measured performances, in: International Conference on Space Optics – ICSO 2004, edited by: Costeraste, J. and Armandillo, E., International Society for Optics and Photonics, SPIE, Toulouse, France, 10568, 1056806, https://doi.org/10.1117/12.2308007, 2017. a
Holmlund, K., Bojkov, B., Klaes, D., and Schlussel, P.: The joint polar system: Towards the second generation eumetsat polar system, 2017 IEEE International Geoscience and Remote Sensing Symposium (IGARSS), Fort Worth, TX, USA, 2017, 2779–2782, https://doi.org/10.1109/IGARSS.2017.8127574, 2017. a
Holzer-Popp, T. and Schroedter, M.: Retrieval of aerosol properties over land and ocean by exploiting the synergy of GOME and ATSR-2 data, in: IEEE 1999 International Geoscience and Remote Sensing Symposium, Hamburg, Germany, IGARSS'99 (Cat. No.99CH36293), 1, 359–361, https://doi.org/10.1109/IGARSS.1999.773497, 1999. a
Holzer-Popp, T., Schroedter-Homscheidt, M., Breitkreuz, H., Martynenko, D., and Klüser, L.: Improvements of synergetic aerosol retrieval for ENVISAT, Atmos. Chem. Phys., 8, 7651–7672, https://doi.org/10.5194/acp-8-7651-2008, 2008. a, b, c
Holzer-Popp, T., de Leeuw, G., Griesfeller, J., Martynenko, D., Klüser, L., Bevan, S., Davies, W., Ducos, F., Deuzé, J. L., Graigner, R. G., Heckel, A., von Hoyningen-Hüne, W., Kolmonen, P., Litvinov, P., North, P., Poulsen, C. A., Ramon, D., Siddans, R., Sogacheva, L., Tanre, D., Thomas, G. E., Vountas, M., Descloitres, J., Griesfeller, J., Kinne, S., Schulz, M., and Pinnock, S.: Aerosol retrieval experiments in the ESA Aerosol_cci project, Atmos. Meas. Tech., 6, 1919–1957, https://doi.org/10.5194/amt-6-1919-2013, 2013. a
Hou, W., Wang, J., Xu, X., and Reid, J. S.: An algorithm for hyperspectral remote sensing of aerosols: 2. Information content analysis for aerosol parameters and principal components of surface spectra, J. Quant. Spectrosc. Ra., 192, 14–29, https://doi.org/10.1016/j.jqsrt.2017.01.041, 2017. a
Hou, W., Li, Z., Wang, J., Xu, X., Goloub, P., and Qie, L.: Improving Remote Sensing of Aerosol Microphysical Properties by Near-Infrared Polarimetric Measurements Over Vegetated Land: Information Content Analysis, J. Geophys. Res.-Atmos., 123, 2215–2243, https://doi.org/10.1002/2017JD027388, 2018. a
Inamdar, A. K., Shi, L., Lee, H.-T., Jackson, D. L., and Matthews, J. L.: Extending the HIRS Data Record with IASI Measurements, Remote Sens., 15, https://doi.org/10.3390/rs15030717, 2023. a
Kacenelenbogen, M. S. F., Tan, Q., Burton, S. P., Hasekamp, O. P., Froyd, K. D., Shinozuka, Y., Beyersdorf, A. J., Ziemba, L., Thornhill, K. L., Dibb, J. E., Shingler, T., Sorooshian, A., Espinosa, R. W., Martins, V., Jimenez, J. L., Campuzano-Jost, P., Schwarz, J. P., Johnson, M. S., Redemann, J., and Schuster, G. L.: Identifying chemical aerosol signatures using optical suborbital observations: how much can optical properties tell us about aerosol composition?, Atmos. Chem. Phys., 22, 3713–3742, https://doi.org/10.5194/acp-22-3713-2022, 2022. a
Kaufman, Y. J., Tanré, D., and Boucher, O.: A satellite view of aerosols in the climate system, Nature, 419, 215–223, https://doi.org/10.1038/nature01091, 2002. a, b, c, d
Kinne, S., Schulz, M., Textor, C., Guibert, S., Balkanski, Y., Bauer, S. E., Berntsen, T., Berglen, T. F., Boucher, O., Chin, M., Collins, W., Dentener, F., Diehl, T., Easter, R., Feichter, J., Fillmore, D., Ghan, S., Ginoux, P., Gong, S., Grini, A., Hendricks, J., Herzog, M., Horowitz, L., Isaksen, I., Iversen, T., Kirkevåg, A., Kloster, S., Koch, D., Kristjansson, J. E., Krol, M., Lauer, A., Lamarque, J. F., Lesins, G., Liu, X., Lohmann, U., Montanaro, V., Myhre, G., Penner, J., Pitari, G., Reddy, S., Seland, O., Stier, P., Takemura, T., and Tie, X.: An AeroCom initial assessment – optical properties in aerosol component modules of global models, Atmos. Chem. Phys., 6, 1815–1834, https://doi.org/10.5194/acp-6-1815-2006, 2006. a
Klüser, L., Kleiber, P., Holzer-Popp, T., and Grassian, V.: Desert dust observation from space – Application of measured mineral component infrared extinction spectra, Atmos. Environ., 54, 419–427, https://doi.org/10.1016/j.atmosenv.2012.02.011, 2012. a
Klüser, L., Banks, J., Martynenko, D., Bergemann, C., Brindley, H., and Holzer-Popp, T.: Information content of space-borne hyperspectral infrared observations with respect to mineral dust properties, Remote Sens. Environ., 156, 294–309, https://doi.org/10.1016/j.rse.2014.09.036, 2015. a
Kok, J. F., Storelvmo, T., Karydis, V. A., Adebiyi, A. A., Mahowald, N. M., Evan, A. T., He, C., and Leung, D. M.: Mineral dust aerosol impacts on global climate and climate change, Nat. Rev. Earth Environ., 4, 71–86, https://doi.org/10.1038/s43017-022-00379-5, 2023. a, b
Köpke, P.: Satellitenmeteorologie, Ulmer, Stuttgart, ISBN 978-3-8252-3525-3, 2012. a
Li, J., Carlson, B. E., Yung, Y. L., Lv, D., Hansen, J., Penner, J. E., Liao, H., Ramaswamy, V., Kahn, R. A., Zhang, P., Dubovik, O., Ding, A., Lacis, A. A., Zhang, L., and Dong, Y.: Scattering and absorbing aerosols in the climate system, Nat. Revi. Earth Environ., 3, 363–379, https://doi.org/10.1038/s43017-022-00296-7, 2022. a, b, c
Li, L., Dubovik, O., Derimian, Y., Schuster, G. L., Lapyonok, T., Litvinov, P., Ducos, F., Fuertes, D., Chen, C., Li, Z., Lopatin, A., Torres, B., and Che, H.: Retrieval of aerosol components directly from satellite and ground-based measurements, Atmos. Chem. Phys., 19, 13409–13443, https://doi.org/10.5194/acp-19-13409-2019, 2019. a
Li, L., Che, H., Derimian, Y., Dubovik, O., Schuster, G. L., Chen, C., Li, Q., Wang, Y., Guo, B., and Zhang, X.: Retrievals of fine mode light-absorbing carbonaceous aerosols from POLDER/PARASOL observations over East and South Asia, Remote Sens. Environ., 247, 111913, https://doi.org/10.1016/j.rse.2020.111913, 2020. a
Loyola, D., Erbertseder, T., Balis, D., Lambert, J.-C., Spurr, R., Van Roozendael, M., Valks, P., Zimmer, W., Meyer-Arnek, J., and Lerot, C.: Operational Monitoring of the Antarctic Ozone Hole: Transition from GOME and SCIAMACHY to GOME-2, Springer Netherlands, ISBN 9789048124695, 213–236, https://doi.org/10.1007/978-90-481-2469-5_16, 2009. a
Maahn, M., Turner, D. D., Löhnert, U., Posselt, D. J., Ebell, K., Mace, G. G., and Comstock, J. M.: Optimal Estimation Retrievals and Their Uncertainties: What Every Atmospheric Scientist Should Know, B. Am. Meteor. Soc., 101, E1512–E1523, https://doi.org/10.1175/BAMS-D-19-0027.1, 2020. a, b
Martynenko, D., Holzer-Popp, T., Elbern, H., and Schroedter-Homscheidt, M.: Understanding the aerosol information content in multi-spectral reflectance measurements using a synergetic retrieval algorithm, Atmos. Meas. Tech., 3, 1589–1598, https://doi.org/10.5194/amt-3-1589-2010, 2010. a, b
Matsui, H., Hamilton, D. S., and Mahowald, N. M.: Black carbon radiative effects highly sensitive to emitted particle size when resolving mixing-state diversity, Nat. Commun., 9, 446, https://doi.org/10.1038/s41467-018-05635-1, 2018. a
Mei, L., Rozanov, V., Rozanov, A., and Burrows, J. P.: SCIATRAN software package (V4.6): update and further development of aerosol, clouds, surface reflectance databases and models, Geosci. Model Dev., 16, 1511–1536, https://doi.org/10.5194/gmd-16-1511-2023, 2023. a, b
Munro, R., Eisinger, M., Anderson, C., Callies, J., Corpaccioli, E., Lang, R., Lefebvre, A., and Livschitz, Y.: GOME-2 on MetOp, Proceedings of The 2006 EUMETSAT Meteorological Satellite Conference, Helsinki, Finland, 1216, 48, https://www-cdn.eumetsat.int/files/2020-04/pdf_conf_p48_s4_01_munro_v.pdf, (last access: 24 April 2025), 2006. a
Munro, R., Lang, R., Klaes, D., Poli, G., Retscher, C., Lindstrot, R., Huckle, R., Lacan, A., Grzegorski, M., Holdak, A., Kokhanovsky, A., Livschitz, J., and Eisinger, M.: The GOME-2 instrument on the Metop series of satellites: instrument design, calibration, and level 1 data processing – an overview, Atmos. Meas. Tech., 9, 1279–1301, https://doi.org/10.5194/amt-9-1279-2016, 2016. a
Myhre, G., Aas, W., Cherian, R., Collins, W., Faluvegi, G., Flanner, M., Forster, P., Hodnebrog, Ø., Klimont, Z., Lund, M. T., Mülmenstädt, J., Lund Myhre, C., Olivié, D., Prather, M., Quaas, J., Samset, B. H., Schnell, J. L., Schulz, M., Shindell, D., Skeie, R. B., Takemura, T., and Tsyro, S.: Multi-model simulations of aerosol and ozone radiative forcing due to anthropogenic emission changes during the period 1990–2015, Atmos. Chem. Phys., 17, 2709–2720, https://doi.org/10.5194/acp-17-2709-2017, 2017. a
NREL: Solar Spectra – The Thekaekara Spectrum, https://www.nrel.gov/grid/solar-resource/spectra.html, last access: 8 July 2024. a
Popp, T.: Correcting atmospheric masking to retrieve the spectral albedo of land surfaces from satellite measurements, Int. J. Remote Sens., 16, 3483–3508, https://doi.org/10.1080/01431169508954642, 1995. a
Randles, C. A., da Silva, A. M., Buchard, V., Colarco, P. R., Darmenov, A., Govindaraju, R., Smirnov, A., Holben, B., Ferrare, R., Hair, J., Shinozuka, Y., and Flynn, C. J.: The MERRA-2 Aerosol Reanalysis, 1980 Onward. Part I: System Description and Data Assimilation Evaluation, J. Climate, 30, 6823–6850, https://doi.org/10.1175/JCLI-D-16-0609.1, 2017. a, b, c, d
Rodgers, C. D.: Information content and optimization of high-spectral-resolution measurements, Proc. SPIE 2830, Optical Spectroscopic Techniques and Instrumentation for Atmospheric and Space Research II, https://doi.org/10.1117/12.256110, 1996. a
Rodgers, C. D.: Inverse Methods for atmospheric sounding – Theory and Practice, Vol. 2 of Series on atmospheric, oceanic and planetary physics, World Scientific, ISBN 981-02-2740-X, 2000. a, b, c
Rozanov, A.: User's Guide for the Software Package SCIATRAN (Radiative Transfer Model and Retrieval Algorithms), Institute of Remote Sensing University of Bremen, Germany, https://www.iup.uni-bremen.de/sciatran/free_downloads/users_guide_sciatran.pdf (last access: 24 April 2025), 2022. a
Rozanov, V., Rozanov, A., Kokhanovsky, A., and Burrows, J.: Radiative transfer through terrestrial atmosphere and ocean: Software package SCIATRAN, J. Quant. Spectrosc. Ra., 133, 13–71, https://doi.org/10.1016/j.jqsrt.2013.07.004, 2014. a, b
Samset, B. H., Stjern, C. W., Andrews, E., Kahn, R. A., Myhre, G., Schulz, M., and Schuster, G. L.: Aerosol Absorption: Progress Towards Global and Regional Constraints, Current Climate Change Reports, 4, 65–83, https://doi.org/10.1007/s40641-018-0091-4, 2018. a
Sayer, A. M., Thomas, G. E., and Grainger, R. G.: A sea surface reflectance model for (A)ATSR, and application to aerosol retrievals, Atmos. Meas. Tech., 3, 813–838, https://doi.org/10.5194/amt-3-813-2010, 2010. a
Seinfeld, J. H., Bretherton, C., Carslaw, K. S., Coe, H., DeMott, P. J., Dunlea, E. J., Feingold, G., Ghan, S., Guenther, A. B., Kahn, R., Kraucunas, I., Kreidenweis, S. M., Molina, M. J., Nenes, A., Penner, J. E., Prather, K. A., Ramanathan, V., Ramaswamy, V., Rasch, P. J., Ravishankara, A. R., Rosenfeld, D., Stephens, G., and Wood, R.: Improving our fundamental understanding of the role of aerosol−cloud interactions in the climate system, P. Natl. Acad. Sci. USA, 113, 5781–5790, https://doi.org/10.1073/pnas.1514043113, 2016. a
Sherwood, S. C., Bony, S., Boucher, O., Bretherton, C., Forster, P. M., Gregory, J. M., and Stevens, B.: Adjustments in the Forcing-Feedback Framework for Understanding Climate Change, B. Am. Meteor. Soc., 96, 217–228, https://doi.org/10.1175/bams-d-13-00167.1, 2015. a
Simeoni, D., Astruc, P., Miras, D., Alis, C., Andreis, O., Scheidel, D., Degrelle, C., Nicol, P., Bailly, B., Guiard, P., Clauss, A., Blumstein, D., Maciaszek, T., Chalon, G., Carlier, T., and Kayal, G.: Design and development of IASI instrument, in: Infrared Spaceborne Remote Sensing XII, edited by: Strojnik, M., International Society for Optics and Photonics, SPIE, 5543, 208–219, https://doi.org/10.1117/12.561090, 2004. a
Sogacheva, L., Kolmonen, P., Virtanen, T. H., Rodriguez, E., Saponaro, G., and de Leeuw, G.: Post-processing to remove residual clouds from aerosol optical depth retrieved using the Advanced Along Track Scanning Radiometer, Atmos. Meas. Tech., 10, 491–505, https://doi.org/10.5194/amt-10-491-2017, 2017. a
Storelvmo, T.: Aerosol Effects on Climate via Mixed-Phase and Ice Clouds, Annu. Rev. Earth Planet. Sc., 45, 199–222, https://doi.org/10.1146/annurev-earth-060115-012240, 2017. a
Tilstra, L. G., Tuinder, O. N. E., Wang, P., and Stammes, P.: Surface reflectivity climatologies from UV to NIR determined from Earth observations by GOME-2 and SCIAMACHY, J. Geophys. Res.-Atmos., 122, 4084–4111, https://doi.org/10.1002/2016jd025940, 2017. a, b
Tilstra, L. G., Tuinder, O. N. E., Wang, P., and Stammes, P.: Directionally dependent Lambertian-equivalent reflectivity (DLER) of the Earth's surface measured by the GOME-2 satellite instruments, Atmos. Meas. Tech., 14, 4219–4238, https://doi.org/10.5194/amt-14-4219-2021, 2021. a, b
Twomey, S.: Pollution and the planetary albedo, Atmos. Environ., 8, 1251–1256, https://doi.org/10.1016/0004-6981(74)90004-3, 1974. a
Twomey, S.: The Influence of Pollution on the Shortwave Albedo of Clouds, J. Atmos. Sci., 34, 1149–1152, https://doi.org/10.1175/1520-0469(1977)034<1149:TIOPOT>2.0.CO;2, 1977. a
Vandenbussche, S.: Algorithm Theoretical Basis Document Mineral Aerosol Profiling from Infrared Radiances (MAPIR) Version 4.1b, Tech. rep., Copernicus Climate Change Service, https://wdc.dlr.de/C3S_312b_Lot2/Documentation/AER/C3S2_312a_Lot2_ATBD_AER_E_latest.pdf (last access: 24 April 2025), 2021. a, b
Vandenbussche, S., Kochenova, S., Vandaele, A. C., Kumps, N., and De Mazière, M.: Retrieval of desert dust aerosol vertical profiles from IASI measurements in the TIR atmospheric window, Atmos. Meas. Tech., 6, 2577–2591, https://doi.org/10.5194/amt-6-2577-2013, 2013. a
Wiacek, A., Peter, T., and Lohmann, U.: The potential influence of Asian and African mineral dust on ice, mixed-phase and liquid water clouds, Atmos. Chem. Phys., 10, 8649–8667, https://doi.org/10.5194/acp-10-8649-2010, 2010. a
World Meteorological Organization (WMO): Sentinel-3C, https://space.oscar.wmo.int/satellites/view/sentinel_3c, last access: 21 January 2025a. a
World Meteorological Organization (WMO): Sentinel-3D, https://space.oscar.wmo.int/satellites/view/sentinel_3d, last access: 21 January 2025b. a
Yin, Y., Wurzler, S., Levin, Z., and Reisin, T. G.: Interactions of mineral dust particles and clouds: Effects on precipitation and cloud optical properties, J. Geophys. Res.-Atmos., 107, AAC 19-1–AAC 19-14 https://doi.org/10.1029/2001JD001544, 2002. a
Zhang, X., Li, L., Chen, C., Chen, X., Dubovik, O., Derimian, Y., Gui, K., Zheng, Y., Zhao, H., Zhang, L., Guo, B., Wang, Y., Holben, B., Che, H., and Zhang, X.: Validation of the aerosol optical property products derived by the GRASP/Component approach from multi-angular polarimetric observations, Atmos. Res., 263, 105802, https://doi.org/10.1016/j.atmosres.2021.105802, 2021. a
Zhou, D. K., Larar, A. M., Liu, X., Smith, W. L., Strow, L. L., Yang, P., Schlussel, P., and Calbet, X.: Global Land Surface Emissivity Retrieved From Satellite Ultraspectral IR Measurements, IEEE T. Geosci. Remote, 49, 1277–1290, https://doi.org/10.1109/TGRS.2010.2051036, 2011. a
Zhou, D. K., Larar, A. M., and Liu, X.: MetOp-A/IASI Observed Continental Thermal IR Emissivity Variations, IEEE J. Sel. Top. Appl., 6, 1156–1162, https://doi.org/10.1109/JSTARS.2013.2238892, 2013. a
Zhou, D. K., Larar, A. M., and Liu, X.: On the relationship between land surface infrared emissivity and soil moisture, J. Appl. Remote Sens., 12, 1, https://doi.org/10.1117/1.JRS.12.016030, 2018. a
Zhou, D. K., Larar, A. M., and Liu, X.: Surface Skin Temperature and Its Trend Observations From IASI on Board MetOp Satellites, IEEE J. Sel. Top. Appl. Earth, 14, 1665–1675, https://doi.org/10.1109/JSTARS.2020.3046421, 2021. a
Zhou, Y., Brunner, D., Spurr, R. J. D., Boersma, K. F., Sneep, M., Popp, C., and Buchmann, B.: Accounting for surface reflectance anisotropy in satellite retrievals of tropospheric NO2, Atmos. Meas. Tech., 3, 1185–1203, https://doi.org/10.5194/amt-3-1185-2010, 2010. a
- Abstract
- Introduction
- Theory of information content and optimal estimation
- Simulation of satellite measurements
- Method for quantitative analysis of the information content
- Results and analysis
- Discussion
- Conclusions
- Appendix A: DOF aerosol components
- Data availability
- Author contributions
- Competing interests
- Disclaimer
- Acknowledgements
- Financial support
- Review statement
- References