the Creative Commons Attribution 4.0 License.
the Creative Commons Attribution 4.0 License.
 | 08 May 2025
Atmospheric stability from numerical weather prediction models and microwave radiometer observations for onshore and offshore wind energy applications
Domenico Cimini
Rémi Gandoin
Stephanie Fiedler
Claudia Acquistapace
Andrea Balotti
Sabrina Gentile
Edoardo Geraldi
Christine Knist
Pauline Martinet
Saverio T. Nilo
Giandomenico Pace
Bernhard Pospichal
Filomena Romano
Atmospheric stability controls the evolution of wind turbine wakes and thus the yield and performance of wind parks. For estimations of wind park power output and for improving analyses of wind park wakes, crucial parameters were found to be profiles of atmospheric temperature and stability metrics. Atmospheric temperature profiles are available from numerical weather prediction (NWP) models or are measured in situ by balloon-borne sensors but can also be estimated from the ground using radiometric observations. This paper reviews the stability metrics useful for monitoring wind park performances and provides a quantitative assessment of the value of NWP model data for estimating these metrics. This paper also extends previous work, quantifying the performances of microwave radiometer (MWR) observations to estimate stability metrics from surface-based observations in three climatological conditions (marine, continental, and polar) and with different instrument types, situated either on land or in the ocean. Two NWP systems (DOWA and NEWA) have been evaluated against temperature profiles measured by offshore met masts in the 30–100 m layer from the surface. The systematic differences are ∼ 0.3–0.5 K, with no clear dependence on the stability class. Conversely, both models show larger random differences in stable compared to unstable conditions. Root-mean-square (rms) differences were within 1 K for DOWA (Dutch Offshore Wind Atlas), while they exceeded 2 K for NEWA (New European Wind Atlas) in very stable conditions. For temperature gradients in the 50–100 m vertical layer, the mean absolute error (MAE) was ∼ 3.4–4.2 K km−1, with 5.8–8.4 K km−1 rms and 0.7–0.8 correlation. From the six datasets of MWR and radiosonde observations considered here, temperature profiles mostly agree within ∼ 0.5 K near the surface, increasing to ∼ 1.5 K at 2 km. Substantial differences are found between MWR performances in retrieving temperature and potential temperature gradients (50–300 m) onshore and offshore. Onshore, potential temperature gradients agree with 2.1–3.4 K km−1 MAE and 0.7–0.9 correlation. Offshore, both MAE (0.9–1.9 K km−1) and correlation (0.3–0.4) are relatively lower, although performances tend to improve using elevation scanning retrievals. Considering all the datasets, the reported MAE values range from 0.9–3.4 K km−1 while rms values range from 1.2–5.1 K km−1. Thus, the uncertainty of MWR for temperature and potential temperature gradients in the 50–300 m vertical layer is ∼ 0.5–4.3 K km−1. The relatively lower performances offshore may be attributed to the training of the inversion method, which may under-represent the peculiar offshore conditions, and the ship movements, which can impact low-elevation observations. These considerations suggest that appropriate dedicated training and elevation scanning with ship movement compensation may be required for the MWR to better catch potential temperature gradients typical of offshore conditions.
- Article
(4591 KB) - Full-text XML
-
Supplement
(22860 KB) - BibTeX
- EndNote


Stability is a characteristic of how a system reacts to small disturbances. If the disturbance is damped, the system is considered to be stable. If the disturbance causes an amplifying response, the system is unstable (Stull, 2017). Atmospheric stability is a measure of the atmospheric state which determines whether air will tend to rise or sink (Spiridonov and Ćurić, 2021). In simple words, a layer is considered stable when vertical motion is suppressed, and it is considered unstable (or convective) when vertical motion is enhanced (Stull, 2012). Stability conditions are often mainly driven by the balance between momentum and heat fluxes close to the surface and can be described by similarity laws (Gryning et al., 2007). However, there are conditions under which the characterization of stability requires detailed information of the atmospheric boundary layer (ABL) across height, for instance when warm air is advected aloft over a colder surface. In fact, the buoyancy (B), which is the acceleration of an air parcel after a certain displacement over height (Δz), is proportional to the atmospheric potential temperature (θ) and its vertical gradient , as
where g is the gravitational acceleration and θ is defined through air temperature (T) and pressure (P) as (Stull, 2012)
with P0 as reference pressure (e.g., 1000 hPa) and as the ratio between the gas constant and the specific heat capacity at a constant pressure for air. If the parcel is moved up (Δz>0) and , the buoyancy tends to lift the parcel further (B>0, instability); conversely, if the buoyancy moves the parcel back towards its original location (B<0, stability). Atmospheric stability is relevant for meteorological processes and applications, including air quality and renewable energy yield. In particular, atmospheric stability is relevant for the prediction of vertical wind shear (larger during stable conditions) and turbulence (larger during unstable conditions). Wind turbine rotors span a relatively large range of elevations (between approximately 23 to 250 m above surface level (a.s.l.) for a modern turbine), so the thermodynamic conditions in the lowest 300 m are the most relevant for this application. In particular, atmospheric stability has a major impact on the characteristics of wind turbine wakes and thus on the yield and performance of offshore wind parks (Hansen et al., 2012). However, simple approaches for defining stability, e.g., using surface layer stability metrics such as the Obukhov length (Obukhov, 1971; Foken, 2006) or the temperature difference between the sea surface and the atmosphere at one particular altitude, are not always suitable for describing stability conditions and wake development. For the estimation of wind park power output and for improving analyses of offshore wind park wakes, atmospheric temperature profiles and stability metrics were found to be crucial parameters. In fact, improved characterization of wind farm output can be produced if the boundary layer stability is considered, indicating the need for temperature measurements at separate heights (Vanderwende and Lundquist, 2012). Different power curves shall be calculated for different stability conditions, leading to more accurate and reliable performances of energy production calculations (St. Martin et al., 2016). For example, for a wind energy farm in a coastal region, Pérez et al. (2023) reported that unstable atmospheric conditions deliver up to 8 % more power than stable conditions, while neutral conditions deliver up to 9 % more energy than stable conditions. As a small percent difference leads to a large deviation in cost for both operators and manufacturers, calculating different power curves for different atmospheric conditions lowers the financial risks for both operators and manufacturers (St. Martin et al., 2016). In particular, temperature inversions are important, which may occur above, below, and within the wind turbine rotor area. These conditions would affect the wake development in different ways, e.g., (i) decoupling the wake from the surface or (ii) preventing the wake vertical spreading for inversions below/above the rotor area, respectively (Platis et al., 2020).
Atmospheric temperature profiles can be measured in situ by sensors located on instrumented towers, drones, and balloons. Instrumented towers have the advantage of providing temperature profiles nearly continuously in time. However, the costs for their installation and maintenance are quite demanding and particularly impractical on offshore platforms, resulting in limited deployment (up to ∼ 100 m height, to our knowledge). Drones also have limited range in altitude, with about 120 m in US and Europe, unless a special waiver by corresponding aviation safety agencies exists (Pinto et al., 2021; Hervo et al., 2023), and in addition their use requires attended service. Conversely, sondes attached to balloons, referred to as radiosondes, can nowadays be launched by automatic stations (Madonna et al., 2020) and usually reach elevations well above the ABL (25 km altitude or more). Each radiosonde measures one instantaneous and vertically high-resolution profile of atmospheric temperature, humidity, wind speed, and direction. However, the cost of a radiosonde launch is such that they are typically launched once or twice a day, except at major atmospheric observatories run by meteorological services that have up to four radiosondes per day or during field campaigns with a radiosondes program to meet research needs.
Remote-sensing technology has the potential to overcome some of the limits of in situ measurements (Cimini et al., 2020; Kotthaus et al., 2023). Ground-based measurements of atmospheric temperature and humidity profiles are possible using microwave radiometers (MWRs, Cimini et al., 2006), infrared spectrometers (IRSs, Feltz et al., 2003), and radio-acoustic sounding systems (RASSs, Bianco et al., 2017). These remote-sensing systems provide unattended operations and high-temporal-resolution (order of minutes) measurements that are used for a range of applications, including operational meteorology (Cimini et al., 2015; Shrestha et al., 2021), atmospheric study processes (Martinet et al., 2017; Martinet et al., 2020; Wagner et al., 2022), and weather forecast (Caumont et al., 2016; Lin et al., 2023; Cao et al., 2023). Conversely, atmospheric thermodynamic profilers have not been exploited extensively for wind energy applications, despite the general recognition of the importance of temperature profiles and atmospheric stability regimes for the characterization of wind energy production (Vanderwende and Lundquist, 2012; St. Martin et al., 2016; Pérez et al., 2023). Ongoing efforts in this direction include the series of onshore and offshore field campaigns performed within the Wind Forecast Improvement Projects (WFIPs, Wilczak et al., 2015, 2019; Shaw et al., 2019). Although the uncertainty requirements for atmospheric stability measurements to serve wind energy applications have not been assessed yet, it is useful to assess the accuracy currently achievable by remote-sensing thermodynamic profilers. To this end, Bianco et al. (2017) assessed the accuracy of MWR and RASS in light of onshore wind energy applications. This study proved that these remote-sensing instruments can provide accurate information on atmospheric stability conditions in the ABL, with 0.87–0.95 correlation between temperature lapse rate in the 50–300 m range as measured by a MWR and tower sensors (note that here and throughout this paper correlation is evaluated with Pearson's linear correlation coefficient, not to be confused with the determination coefficient R2 used elsewhere, e.g., by Bianco et al., 2017). Combining this with the need for temperature gradients for onshore and offshore wind energy (e.g., Platis et al., 2020; Pérez et al., 2023), it seems natural to extend the investigation of MWR performances to other environmental conditions.
Building on these premises, the Carbon Trust Offshore Wind Accelerator (OWA) funded the Radiometry and Atmospheric Profiling (RAP) scoping study. RAP aimed at assessing existing MWR technology and its performances for atmospheric profiling and stability measurements. This paper presents the main outcomes of the RAP project. Section 2 presents a review of capabilities from numerical weather prediction (NWP) modeling systems (hereafter NWP models), which represent the default option in the absence of measurement data. Section 3 briefly introduces MWR technology currently available and the datasets exploited for this analysis. Section 4 presents the validation of temperature gradients measured by MWR units with respect to reference radiosonde data. Section 5 presents a summary, conclusions, and plans for dedicated onshore and offshore field campaigns.
As part of the RAP project, the validity of NWP models for assessing atmospheric stability for the purposes of offshore wind engineering was investigated. The following model datasets were used: (i) ERA5 from the ECMWF (Hersbach et al., 2020) obtained via Hersbach et al. (2023), (ii) the New European Wind Atlas (NEWA; Lundtang Petersen et al., 2014; NEWA, 2021), and (iii) the Dutch Offshore Wind Atlas (DOWA; Wijnant et al., 2019; DOWA, 2021). NEWA and DOWA have been produced using two different mesoscale NWP models, and both use ERA5 as input. Measurement data came from the FINO1, FINO2, and FINO3 met masts, via the German Federal Maritime and Hydrographic Agency (https://www.bsh.de/EN/, last access: 2 May 2025), and from the IJmuiden met mast as well as floating lidar measurements in the southern North Sea, via the Netherlands Enterprise Agency (https://english.rvo.nl/, last access: 2 May 2025).
2.1 Surface stability metrics
For characterizing atmospheric stability in the surface layer, pre-existing validation studies have been used (i.e., Peña et al., 2008; Peña and Hahmann, 2012; Sathe et al., 2011). In order to validate the wind speed profile analytical models proposed originally by Gryning et al. (2007), the focus was set on the Obukhov length (L):
where u∗0 and are, respectively, the friction velocity and kinematic heat flux at the surface; κ is the von Karman constant (≈0.4); T is the temperature; and is the buoyancy parameter. The NEWA Obukhov length time series is readily available, while for ERA5 it was derived from the single levels datasets using two methods: firstly using the turbulent fluxes and secondly computing the bulk Richardson number (Rib) from sea surface temperature, air temperature, and wind speed at 2 and 10 m a.s.l., respectively, and relating Rib to the dimensionless stability parameter (where z is the height above ground level), i.e.,
for unstable and stable conditions, respectively (Peña et al., 2008). The values of C constants are adopted from Grachev and Fairall (1997): and C3≈5. Similarly, the Obukhov length was derived from measurements, i.e., the HKZA floating lidar dataset (de Montera et al., 2022) using the same method (via the bulk Richardson number) mentioned above for ERA5: the 10 m a.s.l. wind speed was derived from the 4 m a.s.l. sonic anemometer and the three smallest lidar elevations at 20, 30, and 50 m a.s.l. The results from the models and measurements are compared in Fig. 1. Overall, the best match between model data and measurements is observed for ERA5 datasets computed using the fluxes for unstable conditions (i.e., ). For stable conditions (), the best match is observed when using the bulk-Richardson-number-derived ERA5 time series. These results confirm that when the main drivers of atmospheric stability (i.e., air and surface temperature difference, wind speed) are correctly characterized by the bulk formulations used in NWP models, the modeled Obukhov length time series compare well – in an average sense – to those derived from measurements. This implies that such results are hardly generalizable; that is, the user of model datasets should check, across the region of interest, the validity of these key variables. This can for instance be done using buoy measurements, where available.
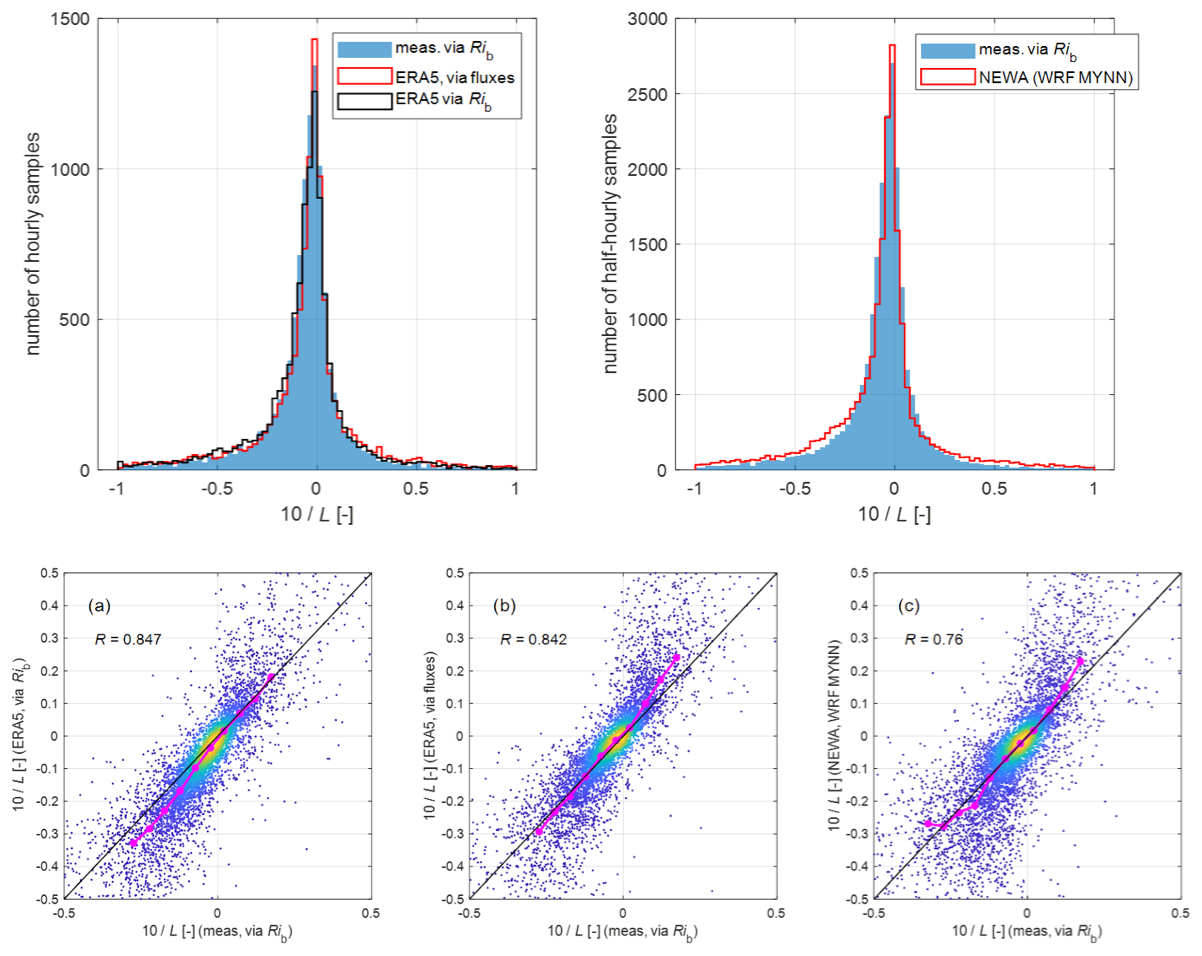
Figure 1Comparison of measurements (Rib-based) and NWP model data of the dimensionless stability parameter (where z=10 m a.s.l. and L is the Obukhov length) at the at the HKZA floating lidar location. Top: histograms of . The same measurements are sampled hourly to compare with ERA5 (left) and half-hourly to compare with NEWA (right) data. Bottom: scatter plot of hourly averaged measurements vs. ERA5 (a and b for Rib- and fluxes-based, respectively) and NEWA (c) model data for 10 m a.s.l. wind speeds larger than 10 m s−1. R indicates the correlation coefficients between the model and measurements time series, while the magenta line shows binned mean values.
Practitioners are primarily interested in how these modeled Obukhov length time series can improve wind-related analyses. Two examples are provided in Figs. 2 and 3; they both use ERA5-derived Obukhov length time series derived from fluxes. The first example focuses on turbulence intensities (TIs), i.e., the ratio of the root mean square of the eddy velocity to the mean wind speed, and mean horizontal wind speed (WS). Figure 2 shows how measured TI and WS spectra vary with the atmospheric stability class indicated by the modeled Obukhov length: as classically reported in the literature, turbulence intensities are smaller in stable () compared to unstable () conditions. In addition, the WS spectra progressively increase as conditions shift from stable to neutral to unstable. The second example shows how the set of analytical expressions proposed by Gryning et al. (2007) and the method outlined in Peña et al. (2008) compare with simpler, surface layer expressions, such as the Monin–Obukhov similarity theory (MOST). Note that the expressions from Gryning et al. (2007) basically form an extension of the MOST above the surface layer (SL). Figure 3 confirms that MOST predicts well the wind speed profile in neutral and unstable conditions, while it significantly overpredicts the measurements above 30 m in very stable conditions. This is due to the influence of other scaling parameters such as the boundary layer height, parameterized from friction velocity and latitude as proposed in Gryning et al. (2007), which is not accounted for in surface layer scaling. Figure 3 also corroborates the findings from Peña et al. (2008), showing that accounting for the effect of the boundary layer height in stable conditions is essential to better capture the wind speed above 30 m with respect to MOST, correcting the overprediction up to the boundary layer height. This improvement is due to better modeling of characteristic length scales of the turbulent eddies for the ABL layers located above the surface layer, especially in stable conditions when the surface layer is very shallow (i.e., less than 100 m in depth).
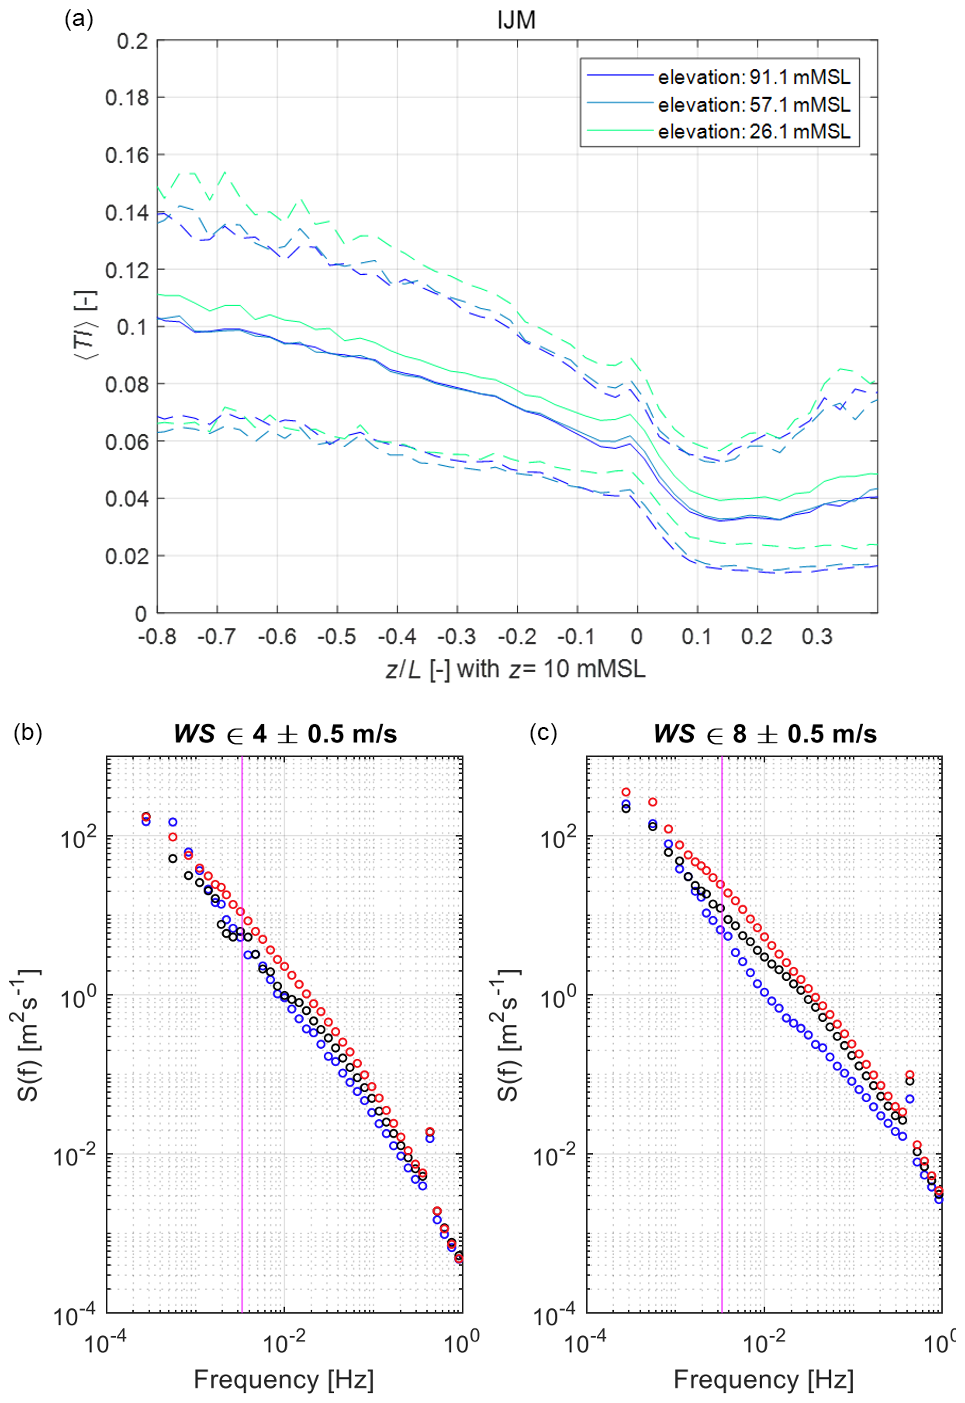
Figure 2(a) Dependence of the turbulence intensity (TI) on the atmospheric stability for the IJmuiden met mast dataset. Here, the stability is expressed on the x axis using the Monin–Obukhov length L and the ratio with z=10 m a.s.l. Different line colors indicate TI measured at different measurement heights. The full lines are mean values; the dashed lines are 10 % and 90 % quantiles. (b, c) Mean hourly power spectra measured at the top of the IJmuiden met mast (91.1 m a.s.l.) for various stability classes (blue: stable; red: unstable; black: neutral) and two wind speed bins (4 ± 0.5 and 8 ± 0.5 m s−1, on the left and right, respectively). The vertical magenta lines indicate 3.3 mHz frequency, corresponding to a 5 min interval (1/300 s).
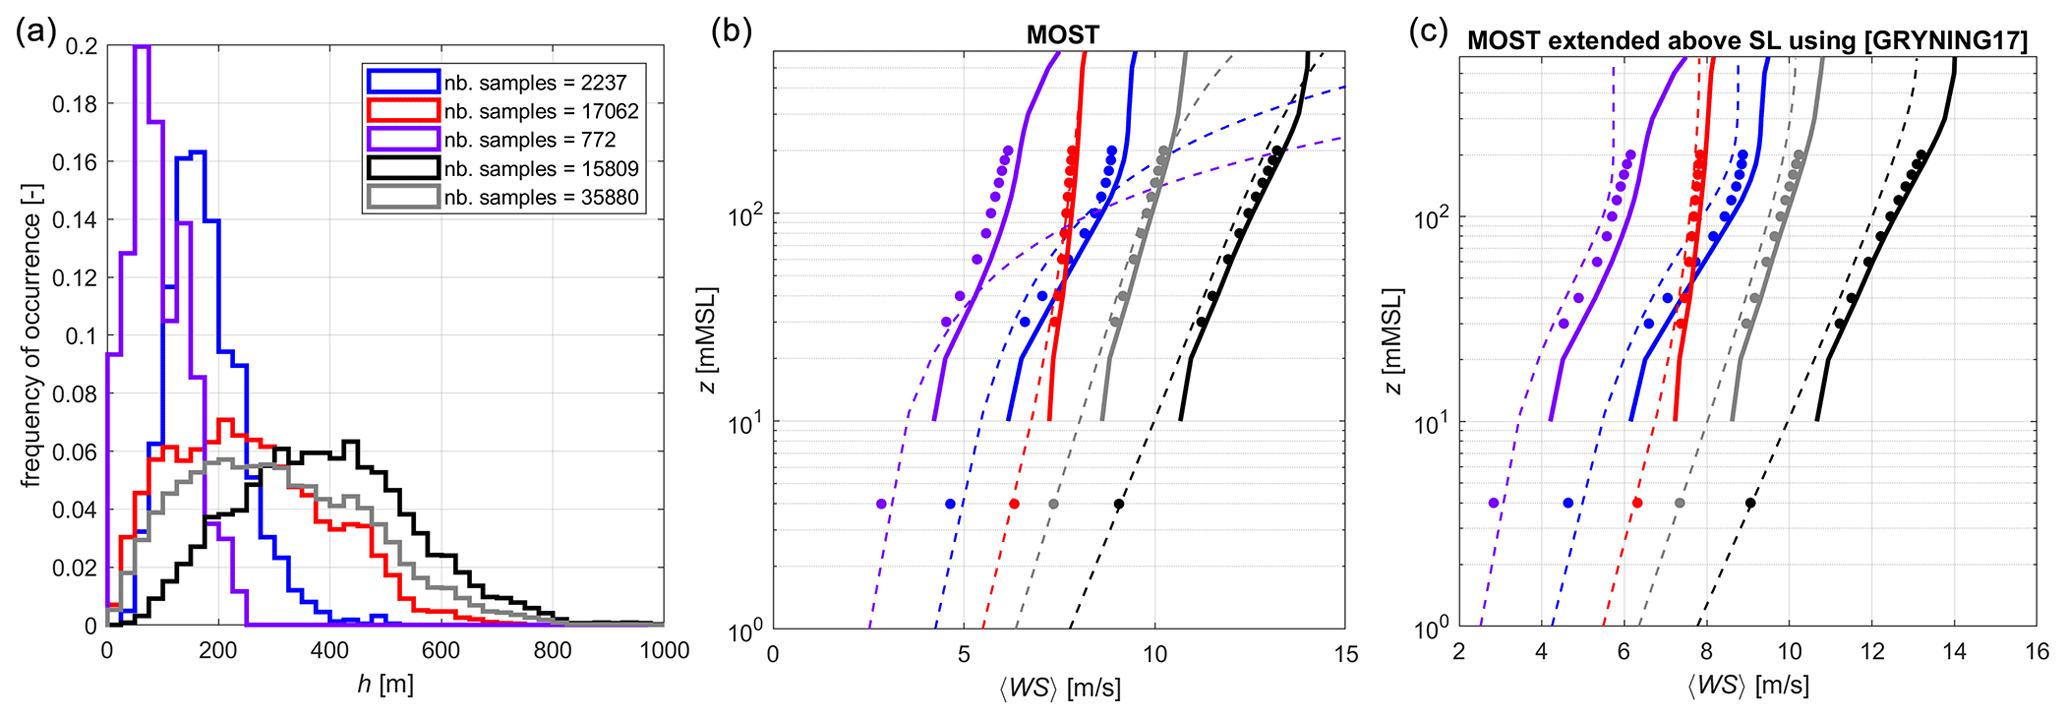
Figure 3(a) Histograms of the boundary layer height (h) as defined in Gryning et al. (2007). Different colors correspond to different stability classes: purple is very stable, blue is stable, red is unstable, black is near-neutral and neutral, and gray shows all data. (b) Profiles of wind speed; dots are measurements from the HKZA floating lidar, full lines are from the DOWA dataset, while the dashed lines are from the MOST. (c) Same as in the center but for the MOST SL-extended model from Gryning et al. (2007).
It is concluded that for offshore areas during cases when the main drivers of atmospheric stability are correctly characterized by NWP models, these results can provide wind energy practitioners with valid (in an average sense) Obukhov length time series which can be used for a range of analyses, including estimates of turbulence and wind shear. Conversely, care needs to be taken in regions where such main drivers (air and sea surface temperature difference, for instance) may be incorrectly represented in NWP datasets; a validation of these quantities is always recommended (e.g., Sect. 4.2.2 of Borvarán et al., 2021). However, in specific cases, the simulated profiles need to be carefully assessed with observations, since the wind speed profiles and hence the vertical shear and associated turbulence characterization may not be sufficiently accurate. This is a long-standing limitation especially for stably stratified boundary layers (Sandu et al., 2013).
2.2 Temperature profiles across the ABL
The validity of NWP model data to characterize the air temperature profile in different stability conditions was assessed using air temperature measurements from tower sensors located approximately from 30 to 100 m a.s.l. Note that the considered tower measurements are not assimilated into NWP models and thus provide independent data with respect to NWP models. Only DOWA and NEWA data were available at the same elevation range as the measurements, while the ERA5 provides only few samples at these elevations. NEWA air temperature data are provided at 2, 50, 75, and 100 m, while DOWA data are provided at 10, 20, 40, 60, 80, and 100 m. Model data have been interpolated at the measurement elevations. Tower measurements and model data have been divided in five classes of stability conditions: very unstable (), unstable (), neutral (), stable (), and very stable (). Figure 4 shows mean temperature profiles from measurements and model data and their mean and rms differences in those five classes. DOWA and NEWA models give similar results, providing temperature profiles close to measurements on average for all stability conditions. Mean differences range from ∼ 0.3 to 0.5 K, with no clear pattern with respect to stability class. Conversely, both DOWA and NEWA models show increased rms in stable conditions with respect to unstable conditions, with minimum rms in neutral conditions. DOWA seems to perform better (rms within 1 K throughout the 30–100 m range) than NEWA, especially in very stable conditions (rms up to 2.2 K). To measure the NWP overall performances in modeling atmospheric stability, one may look at the performances in predicting the vertical gradient of temperature . In fact, recalling Eq. (1), stability directly depends upon the vertical gradient of potential temperature , which is well correlated with . This is shown in Fig. 5, reporting the scatter of between 50 and 100 m a.s.l. as modeled by the DOWA and NEWA datasets and measured by the tower sensors at the FINO1 and FINO3 platforms. Data points are quite scattered, with model data covering a range (∼ 100 K km−1) lower than measurements (∼ 200 K km−1). Note that both models seem unable to capture temperature differences larger than approximately −20 K km−1 (corresponding to −0.5 °C between the model output at 100 and 50 m levels). This may be due to the treatment of surface stability in these models, though we have not been able to identify the root cause. However, such instances occur for very unstable conditions with very small wind speeds (less than 4 m s−1), i.e., not significant for the applications discussed in the paper (e.g., wind turbines have cut-in wind speeds around 4 m s−1). As for the temperature profiles, the DOWA dataset performs better than the NEWA dataset in terms of mean absolute error (MAE; 3.4 to 4.0 K km−1 for DOWA and 3.5 to 4.2 K km−1 for NEWA), rms (5.8 to 7.3 K km−1 for DOWA and 6.4 to 8.4 K km−1 for NEWA), and correlation (0.77 to 0.80 for DOWA and 0.70 to 0.71 for NEWA).
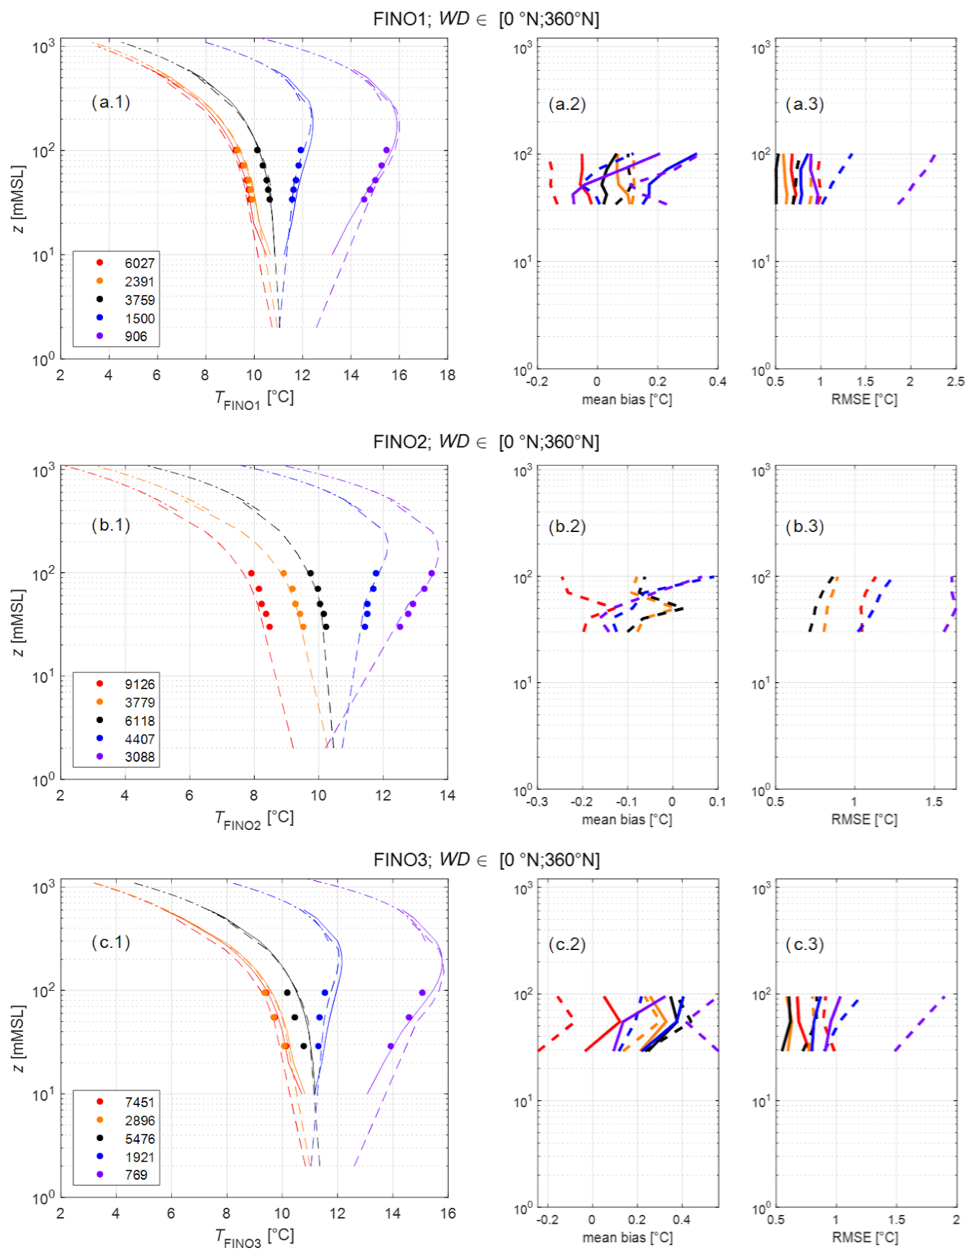
Figure 4Column 1: temperature profiles from measurements (dots) and model data (full lines: DOWA; dashed lines: NEWA; dash-dotted lines: ERA5) at three measurement locations: FINO1 (a), FINO2 (b), and FINO3 (c). Column 2: mean model minus measurement temperature differences. Column 3: temperature rms differences. Colors indicate stability class: very unstable (red), near-neutral and unstable (orange), neutral (black), near-neutral and stable (blue), and very stable (purple). DOWA data are not shown in the middle panels (b) as DOWA's domain does not cover the FINO2 area.
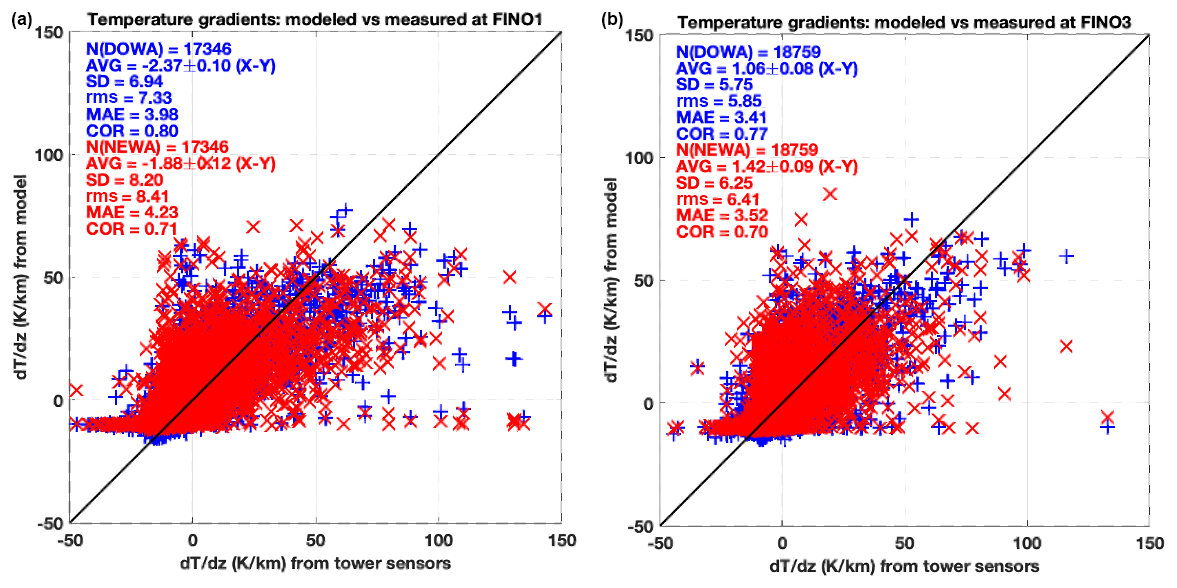
Figure 5Scatter plots of atmospheric temperature lapse rate (∼ 50–100 m) from tower measurements at FINO1 (a) and FINO3 (b) and model data (DOWA: blue crosses; NEWA: red X symbols). N indicates the sample size, AVG the average difference (± 95 % confidence interval), SD the standard deviation, rms the root mean square, MAE the mean absolute error, and COR the correlation coefficient R. Units for AVG, SD, rms, and MAE are in K km−1.
2.3 Conditions for difficult stability characterization
The results from Sect. 2.1 and 2.2 show that surface stability metrics can suffice for a number of analyses where the model results are validated in an average sense (mean wind speed or turbulence intensity, for instance). Other purposes require investigating short-lasted events, characterized by different stability conditions at the surface compared with higher elevations. This is for instance the case for the interpretation of wind maps from synthetic aperture radar (SAR) observations or in situ profile measurements from uncrewed aircraft systems (UAS) as in the WInd PArk Far Fields (WIPAFF) project, where both of these measurement types were used (Platis et al., 2020). An illustrative example is provided in Fig. 6, where SAR-derived 10 m a.s.l. wind speeds are plotted over an area covering the Belgian offshore wind farm cluster. Figure 6 also shows the SAR-derived wind speeds across the cluster, as well as mean wind speed profiles measured at the BWFZ01 location together with model data (which do not include the wind farms), and the vertical temperature profiles from ERA5 and DOWA NWP models. The situation seems to correspond, according to the DOWA and ERA5 data, to neutral conditions at the surface, with a stable inversion cap at ∼ 150 m a.s.l. The SAR-derived winds show that the wakes from the Belgian cluster extend over a long distance (tens of kilometers), and the reason is likely the very steep gradient in potential temperature (27 K km−1 between 120 and 150 m a.s.l.), capping the lowest (neutral in this case) layer of the atmosphere. This is at least what the DOWA model indicates, as there are no air temperature measurements which can confirm this. In any case, the observed, and modeled surface stability metrics indicate unstable to neutral conditions at the surface; this would be an incorrect way to characterize the wind flow controlling the wind farm wake, which is very likely located in a stable layer.
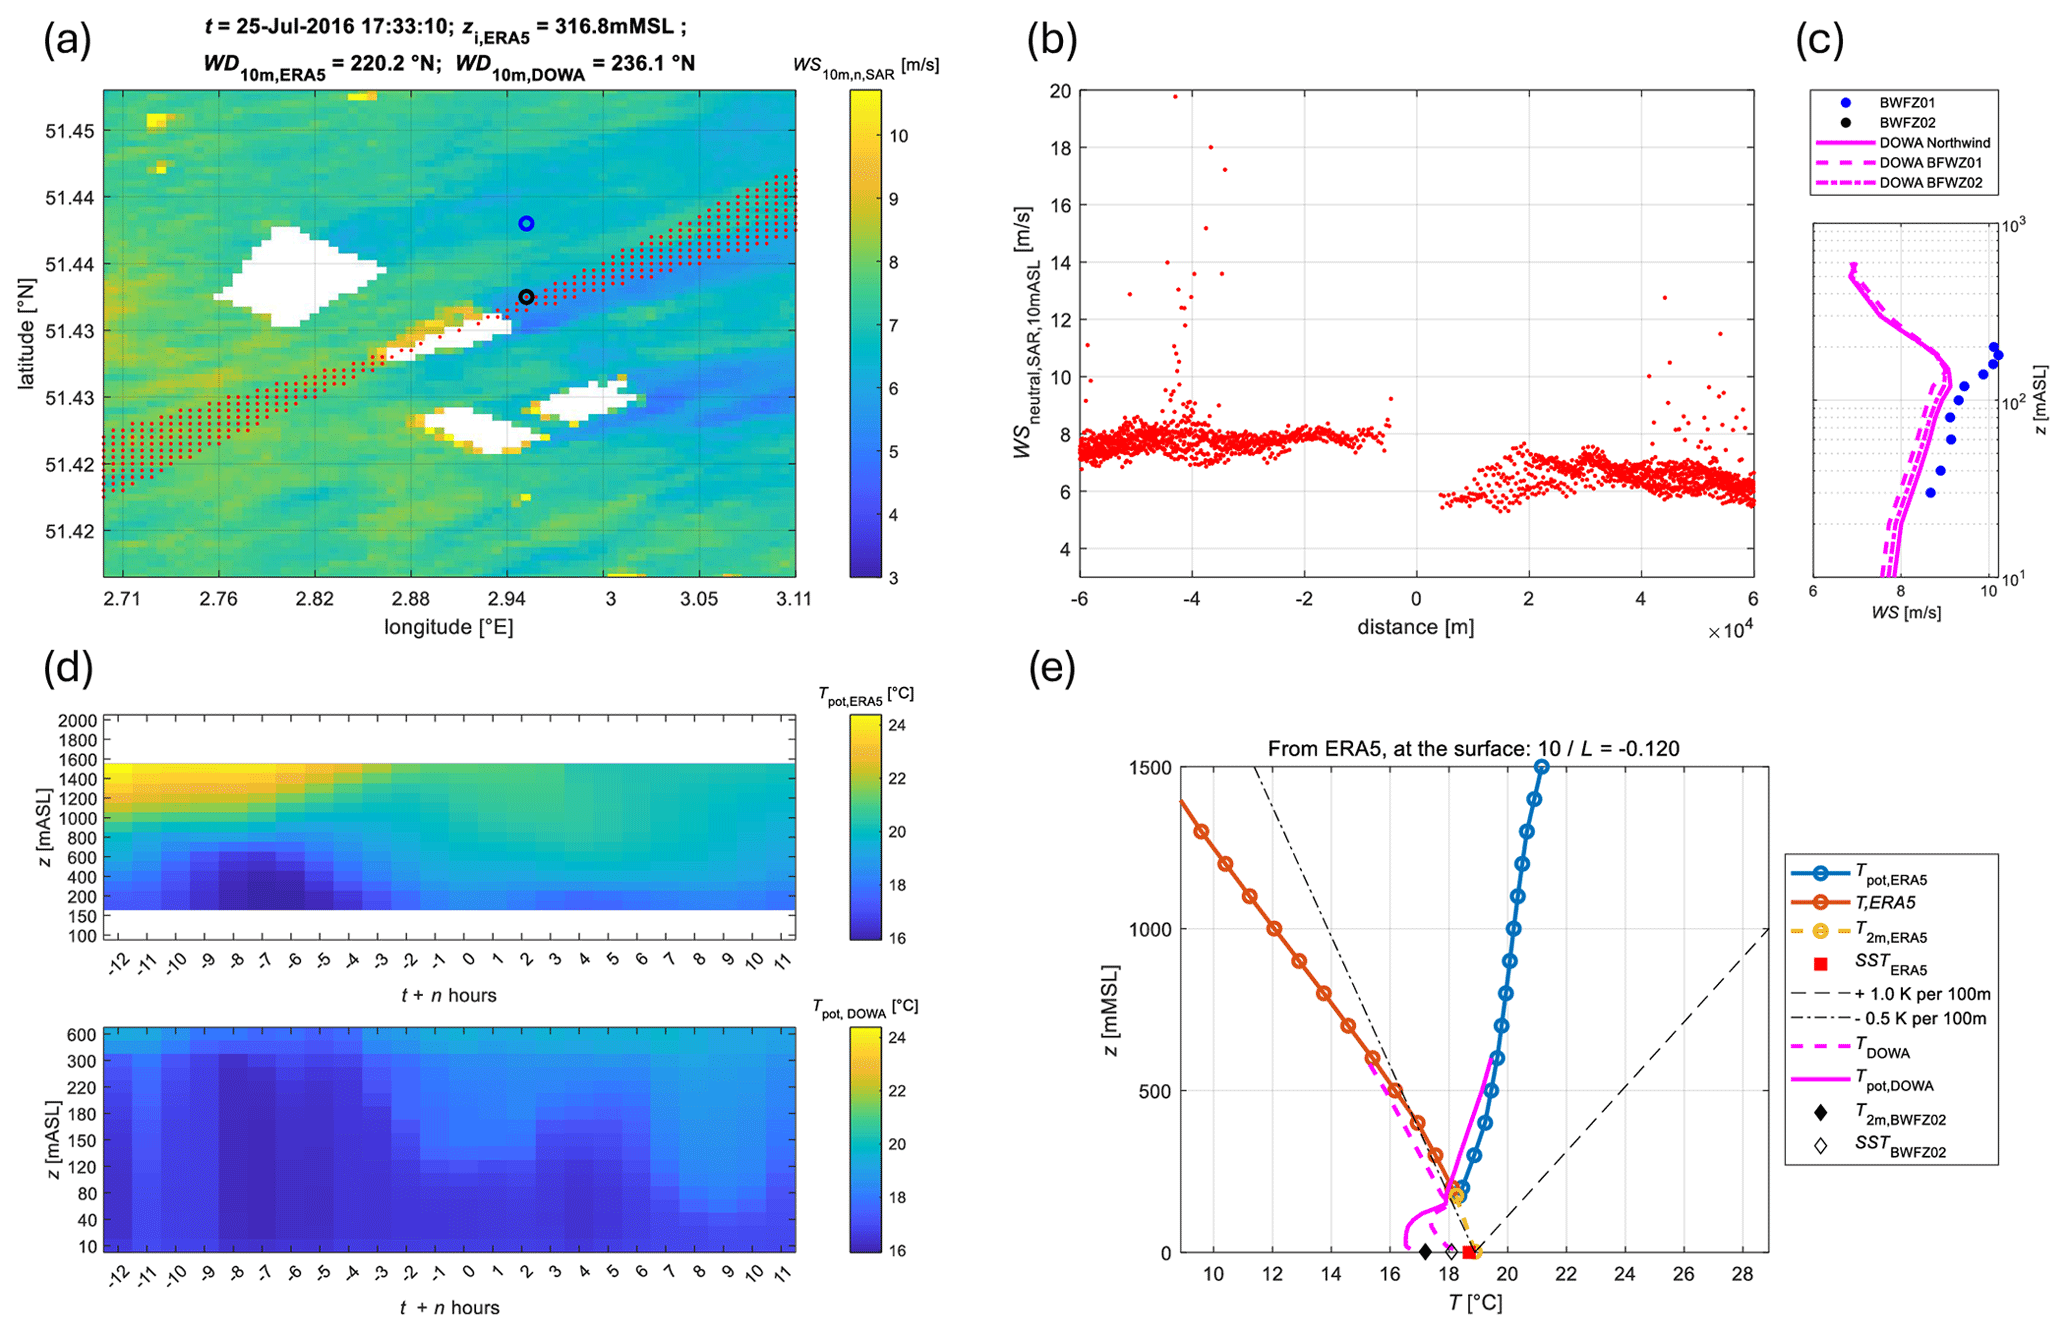
Figure 6Example of a long wake episode across an offshore wind cluster in the Belgian North Sea on 25 July 2016. (a) SAR-derived 10 m a.s.l. wind speeds mapped over an area covering the Belgian offshore wind farm cluster (white areas indicate lease areas; red dots indicate the location of wind speeds reported in panel (b); blue circles indicate the location of two floating lidars, BWF01 and BWF02). (b) SAR-derived wind speeds crossing the offshore cluster (from −60 to 60 km distance, where 0 indicates the center of the cluster). (c) Wind speed profiles from floating lidar measurements and DOWA model at the two downwind sites shown in panel (a). (d) Vertical temperature profiles from NWP models from 10 to 600 m (DOWA) and 160 to 1600 m (ERA5) in the 12 h before and after the SAR image. (e) Temperature and potential temperature profiles from NWP models ERA5 and DOWA at the time of the SAR image. The red square indicates the sea surface temperature (SST) from ERA5, while the diamonds indicate SST (empty) and 2 m temperature (filled) from measurements at BWFZ02. Dashed and dot-dashed gray lines indicate +1 and −0.5 K per 100 m gradients. The estimated Obukhov length at the surface is reported, indicating unstable to neutral conditions ().
To further investigate the uncertainty associated with the NWP models for such transient flow events, air temperature data from the NEWA dataset have been compared with measurements from the WIPAFF project (Bärfuss et al., 2019). For each of the WIPAFF flights, the NEWA air temperature data have been spatially and temporally interpolated at the UAS locations (downsampled from the original dataset). Figures such as Fig. 7 have been produced for each WIPAFF flight and are provided in the Supplement. The plots indicate the need for temperature measurements above 100 m a.s.l., as they suggest that such measurements could help understand whether such important phenomena for wind farm wake modeling as temperature inversions are well captured by mesoscale models when they occur above 100 m a.s.l., where measurements are often not available. Such a need may be satisfied by nearly continuous observations from a microwave radiometer profiler. The ability to profile atmospheric temperature continuously within the first 2 km and to provide potential temperature gradients in the vertical range of wind turbine rotors is assessed in the next section.
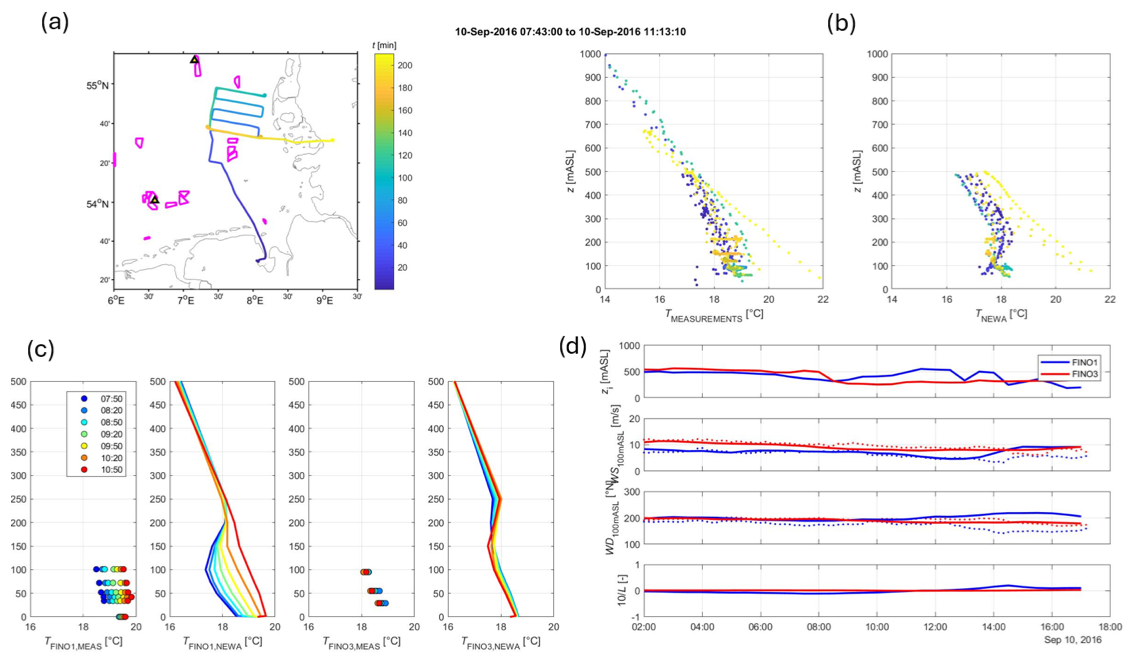
Figure 7Comparison of temperature from in situ measurements and NEWA model data over the German Bight from the WIPAFF campaign on 10 September 2016. (a) Flight path with the location of existing wind farms (indicated by magenta shapes) and the two met masts at FINO1 and FINO3 locations (black triangles in the southern and northern part of the map, respectively). Line color indicates time from flight start. (b) Comparison of temperature profiles from in situ measurements (flights) and NEWA model datasets (color-coded according to the corresponding flight time in panel a). (c) Comparison between temperature profiles from in-site measurements (met masts) and NEWA model data during the flight time period (color-coded according to the corresponding flight time in panel a). (d) Time series of ABL height, wind speed, and direction at 100 m, and Obukhov length at the surface provided by NEWA during the flight time period (blue line: FINO1; red line: FINO3). Wind speed and direction measured at 100 m from met masts are also shown (dotted lines).
3.1 Microwave radiometer technology
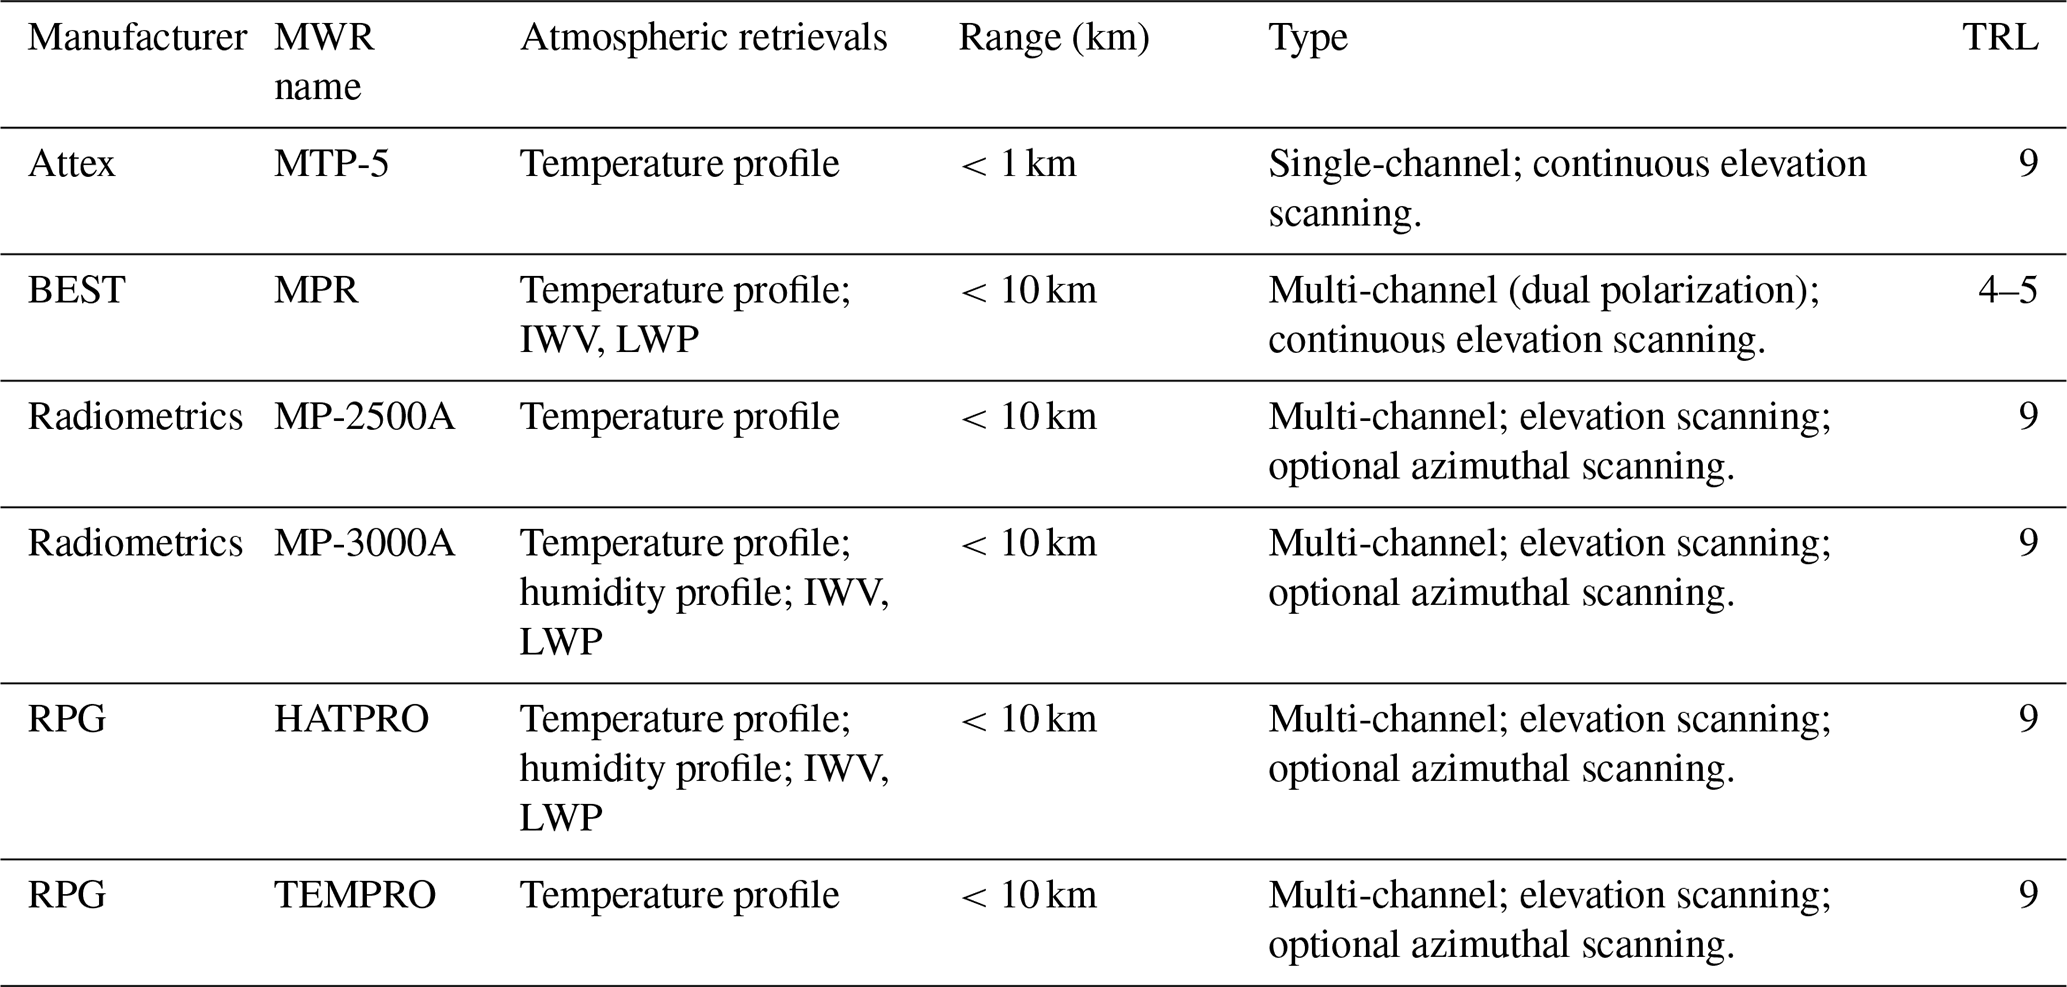
Microwave radiometry is a passive technique that has been used for several decades to observe atmospheric thermodynamic profiles. Ground-based microwave radiometers (MWRs) are instruments measuring the downwelling natural thermal emission from the Earth's atmosphere, conveniently expressed in terms of brightness temperature (TB), which is inverted into atmospheric thermodynamic products using statistical regression, neural networks, or optimal estimation (Cimini et al., 2006). The ability to retrieve atmospheric variables depends upon the number and spectral allocation of the frequency channels at which the MWR measures TB. The ability to retrieve atmospheric temperature profiles is related to thermal emission from oxygen, a well-stratified gas whose concentration is nearly constant in space, time, and height. Thus, radiation emitted by oxygen depends primarily on temperature, and TB measurements at channel frequencies exhibiting strong oxygen emission are highly correlated with atmospheric temperature. This is the case for the strong oxygen absorption complex at 50–70 GHz, which is well established and widely used for probing atmospheric temperature from the ground as well as from space. At channels in the center of the absorption band (∼ 60 GHz), the atmosphere is highly opaque and the observed TB carries information on the temperature near the instrument. Conversely, at channels away from the center (e.g., 50–55 GHz), the atmosphere is less opaque and the signal systematically stems from atmospheric layers further from the instrument. Thus, vertical temperature profiles of the lower atmosphere are estimated from observations corresponding to different atmospheric absorption. The required information content can be obtained by multi-channel observations in the 50–60 GHz range but also by single-channel observations at several elevation angles. Similarly, observations at 22–32 GHz provide information on atmospheric humidity and column integrated water vapor (IWV) and liquid water path (LWP) simultaneously. Thus, ground-based MWR units operating in both the 22–32 and 50–60 GHz bands are sometimes called MWR profilers (MWRPs) and are commonly used to estimate atmospheric temperature and humidity profiles (Rüfenacht et al., 2021; Shrestha et al., 2021). A handful of MWR profiling types are currently available as off-the-shelf commercial products. Also a few research prototypes have been developed or are currently under development. For the scope of RAP, i.e., atmospheric profiling related to stability, only the temperature profilers and the MWRP are of interest. In our survey, we found only five commercially available MWR products corresponding to these characteristics. These are listed in Table 1, together with their main characteristics. In addition, a prototype for marine deployment on a floating buoy or offshore platform is considered, though it is not commercially available yet.
Table 1Main features of MWR types identified for potential interest for the atmospheric profiling related to stability (listed in alphabetical order of manufacturer). An estimate of the technology readiness level (TRL) is also shown. TRL 4–5 indicates technology validated in the laboratory and relevant environment; TRL 9 indicates the actual system proven in the operational environment.
For temperature profiles, most of the information and the resolution reside in the first 2 km. Different methods are used to quantify the vertical resolution of radiometric profiling. Using the inter-level covariance, Cimini et al. (2006) reported that the vertical resolution of retrieved temperature profiles in the 0–3 km vertical range decreases linearly with height z as approximately ∼ 0.44⋅z. Measurements at different elevation angles enhance the vertical resolution of ABL temperature profile retrievals. Thus, elevation-angle scanning capability is often available in MWRP units.
MWR units operate in all weather conditions. However, retrieved products may be unrealistic in the event of water accumulation over the radome, which produces additional microwave radiation not related to the atmospheric state. A number of solutions for detecting and mitigating dew and precipitation effects are used in current MWR instruments, including rain sensor, hydrophobic coating, tangent blower, heaters, shutter, and side views. These mitigation solutions effectively avoid water accumulation on the radome or mitigate its effect on the retrieved products in most of the cases. However, chances are that mitigation solutions fail during intense rainfall or snowfall. Proper maintenance (cleaning and replacing) of the radome helps in reducing cases of precipitation mitigation failures. This requires regular services and replacement (e.g., every few months, depending upon environment conditions). Offshore conditions (high likelihood of sea sprays) may require more frequent intervention.
A thorough assessment of MWR ability to provide atmospheric stability is given in Bianco et al. (2017), specifically addressing wind energy applications. They report the outcome of a remote-sensing system evaluation study, called XPIA (eXperimental Planetary boundary layer Instrumentation Assessment), held in spring 2015 at NOAA's Boulder Atmospheric Observatory (BAO; Wolfe and Lataitis, 2018). BAO is equipped with a 300 m tower mounting temperature and relative humidity sensors at six levels (50, 100, 150, 200, 250, and 300 m). In addition, some 60 radiosondes were launched during the XPIA 2-month period. Two MWRs of the same type (Radiometrics MP3000-A; see Table 1) were deployed. To assess the MWR's ability to estimate atmospheric stability, they compared MWR with tower measurements, analyzing the vertical gradient of temperature T and potential temperature () for 50–300 m. For T gradient (), they reported mean absolute error (MAE) within 2.1 K km−1 and bias within 0.1 K km−1, with 0.95 correlation. For potential temperature gradient (), they reported MAE within 2.2 K km−1 and bias within 0.1 K km−1, with 0.95 correlation. They also investigated gradients for thinner atmospheric layers (i.e., 50–150, 50–200, 50–250 m), reporting performances slightly degraded with respect to the 50–300 m layer. They also investigated the temperature profiling performances during rainy and non-rainy periods, reporting no significant difference. They concluded that MWR can be useful for understanding conditions leading to strong vertical wind shear or turbulence, which can affect the loads on rotors. The next section extends the results of Bianco et al. (2017) to other measurement conditions, including onshore and offshore.
3.2 Datasets
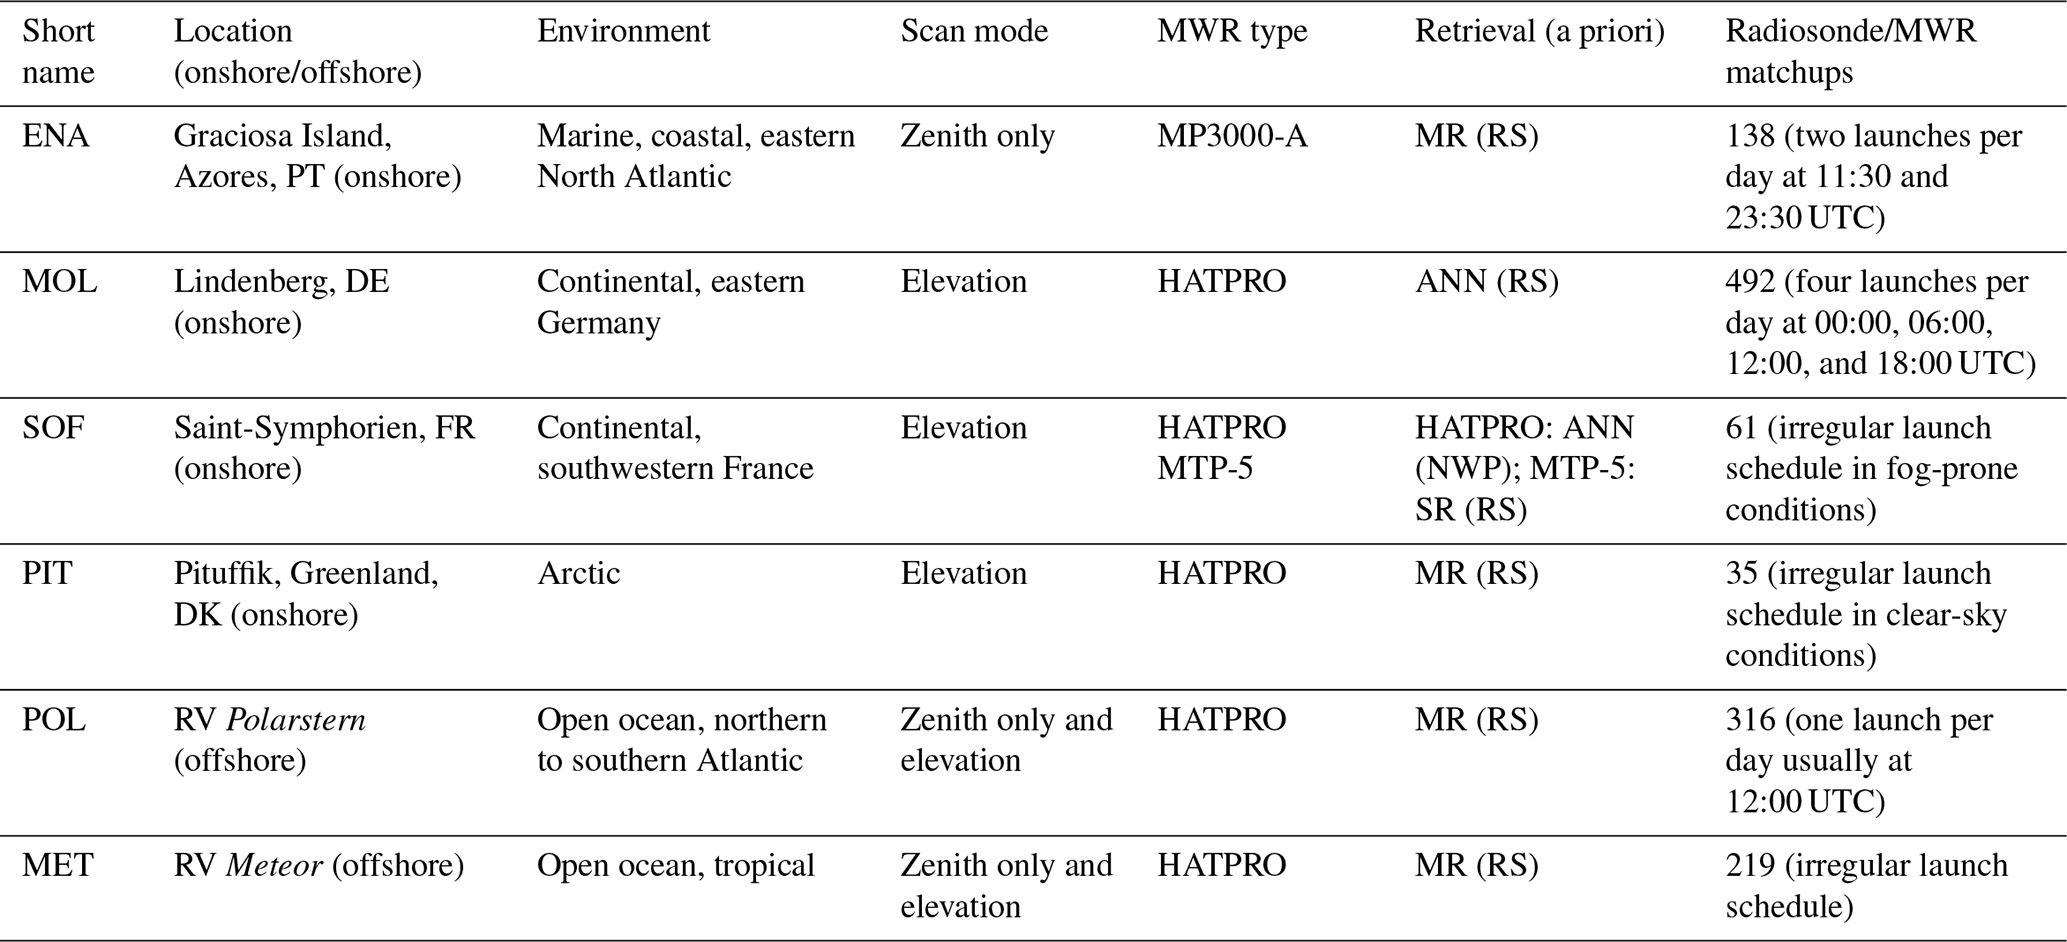
The results of Bianco et al. (2017) are obtained in a continental high-elevation site (Eire, Colorado, USA, ∼ 1500 m altitude), using one of the MWR types in Table 1. This section aims to extend the analysis of Bianco et al. (2017) to other environmental conditions and to the most common commercially available MWR system types in Table 1. Thus, we identified datasets that would fit the purpose of validating MWR retrievals in different environments, possibly for both onshore and offshore deployments. Several research and operational networks operate onshore MWRs continuously and provide open access to their data, e.g., the US Atmospheric Radiation Measurement (ARM, https://www.arm.gov, last access: 2 May 2025) program (Cadeddu et al., 2013), the European E-PROFILE program (Rüfenacht et al., 2021), and the New York State Mesonet (Shrestha et al., 2021). However, none of these MWR sites are equipped with a 300 m tower as in BAO. Thus, the validation of MWR retrievals is here performed against in situ measurements performed by balloon-borne radiosonde temperature sensors. Radiosondes are launched routinely at a limited number of MWR sites and usually extend well above the altitude range relevant to wind energy applications. Thus, we selected four datasets of colocated MWR and radiosonde observations taken at four onshore sites including marine, continental, and Arctic environments: Graciosa Island (Azores archipelago, Portugal), Saint-Symphorien (France), Lindenberg (Germany), and Pituffik (Greenland). Conversely, offshore MWR deployments are rare, despite their potential for wind energy industry. To our knowledge, the only MWR deployment on a fixed offshore platform was in the framework of the Offshore Boundary-Layer EXperiment at FINO1 (OBLEX-F1, https://oblo.w.uib.no/activities/the-oblex-f1-measurment-campaign/, last access: 2 May 2025), which took place from May 2015 to September 2016 at the German wind energy research platform FINO1, in close vicinity to the offshore wind park Alpha Ventus in the North Sea. The main purpose of the campaign was to improve understanding of the marine boundary layer in the vicinity of an offshore wind farm with respect to wind speed profiles, atmospheric stability regimes, and single turbine and wind farm wake propagation effects, under real offshore conditions. To complement the resident instrumentation at FINO1, several instruments were installed for the campaign, including sonic anemometers, scanning wind lidars, and a MWR. The MWR (RPG HATPRO; see Table 1) was deployed on the upper deck, at the base of the 100 m meteorological instrumented tower. However, this dataset is not open access, and the closest radiosondes are launched more than 50 km away from the coastal site on the island of Norderney (Germany). Conversely, colocated offshore MWR and radiosonde observations are available from ship-based deployments, such as those performed in the framework of oceanic field experiments (e.g., Bony et al., 2017). Thus, we selected two datasets of colocated MWR and radiosonde observations taken from two research vessels (RV): the RV Polarstern, going through the Equator from northern Europe to southern Africa or America in the framework of the OCEANET program (Griesche et al., 2020), and the RV Meteor, deployed offshore Barbados in between the Caribbean Sea and the Atlantic Ocean (Schnitt et al., 2024) in the framework of the EUREC4A (Elucidating the Role of Clouds–Circulation Coupling in Climate, Bony et al., 2017) project. Other ship-based MWR deployments exist (e.g., Cimini et al., 2003; Yan et al., 2022) or are currently being collected on a barge within the 3rd Wind Forecast Improvement Project (WFIP3, https://psl.noaa.gov/renewable_energy/wfip3/, last access: 2 May 2025), but the datasets were not accessible to us at the time of this analysis. More details about the considered datasets are given below, while Table 2 summarizes the main information. Note that adequate calibration procedures and retrieval techniques are crucial for accurate MWR profile retrieval. This analysis relies on the calibration procedures, retrieval techniques, and quality controls applied by the data provider. The latter are either trustable national weather services (e.g., Météo-France), scientific programs (ARM), or research campaigns. Note that the considered datasets include observations from three MWR types, covering all the MWR manufacturers identified in Table 1.
Table 2Main information on the datasets considered in this study. Retrieval techniques are artificial neural network (ANN), multivariate regression (MR), and statistical regularization (SR). A priori information is from radiosonde (RS) or NWP profiles. More details are given within the main text and the quoted references.
ENA. The Eastern North Atlantic (ENA) atmospheric observatory is located on Graciosa Island, part of the Azores archipelago in the northeastern Atlantic Ocean west of Portugal. ENA is the newest atmospheric observatory established by the US ARM program. The ENA observatory is a few hundred meters away from the coastline, is at 30 m altitude above mean sea level, and it is exposed to quasi-open-ocean conditions throughout the year. The ENA observatory also belongs to the Global Climate Observing System (GCOS) Reference Upper-Air Network (GRUAN), a network of several atmospheric observatories around the world providing reference-quality data for climate benchmarking (Bodeker et al., 2015). At ENA, ARM continuously operates a MWR (Radiometrics MP-3000 A; see Table 1) and launches two daily radiosondes at 11:30 and 23:30 UTC (Cadeddu et al., 2014; Keeler and Kyrouac, 2013). The retrieval technique is multivariate linear regression based on zenith-only observations, with seasonal coefficients trained from radiosonde climatology. Temperature channels of ARM MWR, such as in ENA, are calibrated every 3–4 months using a cryogenic target cooled with liquid nitrogen (LN2). More details are given in Cadeddu et al. (2013). The dataset used here extends from 31 December 2018 to 15 March 2019, for a total of 138 matchups between MWR and radiosonde observations.
MOL. The Meteorological Observatory Lindenberg – Richard Aßmann Observatory (MOL-RAO) is operated by the German Meteorological Service (Deutscher Wetterdienst, DWD). The MOL-RAO is located in the federal state of Brandenburg in the northeastern part of Germany, about 50 km southeast of Berlin, 98 m above mean sea level. The MOL-RAO runs a comprehensive measurement program including all relevant surface remote-sensing and in situ methods for studying solar and terrestrial radiation, as well as the interaction processes between the Earth's surface and the atmosphere, and to produce the “Lindenberg column”, a reference dataset for characterizing the vertical structure of the atmosphere from the ground up to the stratosphere (e.g., Neisser et al., 2002). The site contributes to all relevant national and international observational programs and initiatives such as the Aerosol, Clouds and Trace Gases Research Infrastructure (ACTRIS, Laj et al., 2024), Cloudnet (Illingworth et al., 2007) and the Baseline Surface Radiation Network (BSRN). MOL-RAO also hosts the lead center of GRUAN, launching four radiosondes daily. The Lindenberg site provides a database of long-term MWR observations of about 20 years (Güldner and Spänkuch, 2001; Vural et al., 2023) and operates currently two MWRs (Radiometrics MP-3000A and RPG HATPRO G5; see Table 1). For the MWR considered hereafter (HATPRO), the retrieval technique is an artificial neural network (ANN) based on elevation scan observations, with seasonal coefficients trained from radiosonde climatology. The dataset used here extends from 1 September to 31 December 2020, for a total of 492 matchups between HATPRO MWR and radiosonde observations. The MWR is calibrated with LN2 every 6 months, and specifically absolute LN2 calibration was performed at the beginning of the considered period (1 September 2020).
SOF. The SOuth west FOGs 3D experiment for processes study (SOFOG3D) is an international field campaign directed by Météo-France to advance our understanding of fog processes at the smallest scale to improve fog forecasts by numerical weather prediction. SOFOG3D lasted from October 2019 to April 2020, during which an unprecedented set of remote-sensing and in situ instruments was deployed during the whole winter period. A unique network of eight MWR was operated in a 300-by-300 km domain in the southwest of France (Martinet et al., 2020; Martinet et al., 2022) for a better understanding of the spatiotemporal variability of fog at regional scales and to conduct first data assimilation trials (Thomas et al., 2024). Two MWRs were operated side by side at the supersite, one HATPRO and one MTP-5 (see Table 1). The MTP-5 single-channel radiometer has its own continuous self-calibration procedure ensuring measurement stability. For HATPRO, a LN2 calibration was performed on-site at the beginning of the campaign. The retrieval technique for HATPRO is ANN trained with a 3-year database of 1 h profiles from the NWP system AROME. The elevation scan mode is used to retrieve temperature profiles up to 2 km altitude. For MTP-5, the retrieval technique is a statistical regularization method based on continuous elevation scan observations with auto-correlation matrices obtained from global radiosondes. More details are given in Martinet et al. (2022). The dataset used here extends from 10 November 2019 to 12 March 2020, for a total of 61 matchups between two MWR units and radiosonde observations.
PIT. The Thule High Arctic Atmospheric Observatory (THAAO; https://www.thuleatmos-it.it/index.php, last access: 2 May 2025) is located within the US Pituffik Space Base (formerly known as Thule Air Base) along the northwestern coast of Greenland (76.5° N, 68.8° W). THAAO is on South Mountain, 220 m above sea level, and about 3 and 11 km from the sea and from the Greenland ice sheet, respectively. THAAO is an international facility overseen by the National Science Foundation, which took over management in 2017 after the Danish Meteorological Institute (DMI) discontinued their science activities at Pituffik. Research institutions from Italy (ENEA, INGV, Sapienza University of Rome, University of Florence) and the US (NCAR, AFRL) contribute to THAAO scientific activities (Pace et al., 2017; Pace et al., 2024), including observations from a 14-channel MWR (RPG HATPRO; see Table 1). The retrieval technique is multivariate linear regression based on elevation scan observations, with monthly coefficients trained from radiosonde climatology. The dataset used here was acquired in the frame of the SVAAP project (Study of the water VApour in the polar AtmosPhere; Meloni et al., 2017) and extends from 12 July 2016 to 21 February 2017, for a total of 35 matchups between MWR and radiosonde observations. For the period of the field experiment, the MWR was calibrated using LN2 every ∼ 4 months: at the beginning (July 2016) and then again in November 2016 and February 2017. Weekly inspection was performed remotely through a webcam.
POL. The ice breaker RV Polarstern is operated by the Alfred Wegener Institute for Polar and Marine Research (AWI) and typically operates in the Arctic and Antarctic seas (Griesche et al., 2020; Engelmann et al., 2021; Walbröl et al., 2022; and references therein). Atmospheric measurements are conducted en route to collect datasets for investigating the energy budget between the ocean and atmosphere and providing ground-truth information for climate models. Continuous observations of aerosol, cloud, temperature and humidity profiles, liquid water path, solar and thermal radiation, and sensible and latent heat are performed during some cruises. The remote-sensing instruments are hosted in a sea container deployed at the upper deck, starboard of Polarstern at about 22 m above sea level, called the OCEANET platform. OCEANET houses an extensive suite of ground-based remote-sensing instruments, including a multiwavelength Raman polarization lidar and one 14-channel MWR (RPG HATPRO; see Table 1). Polarstern also hosts a SCalable Automatic Weather Station (SCAWS), belonging to DWD, which includes a radiosonde-launching system. One radiosonde per day is launched routinely from the deck of the RV Polarstern, between 11:00–12:00 UTC, but additional launches are occasionally performed earlier or later in the day (e.g., ∼ 09:00 or 22:00 UTC). The considered cruises swept the Atlantic Ocean from north to south and back. The MWR was calibrated at the beginning of each cruise. The instrument was checked every day, and if necessary, the radome was cleaned from sea spray. The retrieval technique is multivariate quadratic regression with coefficients trained from radiosonde climatology. The dataset used here were collected during sixteen 2-month cruise missions, extending from 20 April 2007 to 9 December 2016, for a total of 316 matchups between MWR and radiosonde observations. Retrievals based on elevation scan are available only for the two cruises in 2016.
MET. The RV Meteor participated in the EUREC4A project (Bony et al., 2017; Stevens et al., 2021), a 5-week campaign in the tropical Atlantic windward and in the close vicinity of Barbados, which included ship-based MWR (Schnitt et al., 2024) and radiosonde (Stephan et al., 2021) observations. During EUREC4A (January to February 2020), MWR measurements aboard the RV Meteor were performed by a HATPRO G5 operated by the Leipzig Institute for Meteorology, so-called LIMHAT. The LIMHAT MWR was placed on the navigation deck of the ship at 15.8 m above sea level, operated at a temporal resolution of 1 s in zenith mode, with elevation scans performed every full hour. Radiosondes were also launched from the same deck. Before 9 February, radiosondes were launched from the port side of the ship, and after that date they were launched from the stern of the ship due to the failure of the sonde container (Stephan et al., 2021). A multivariate linear regression was used to retrieve temperature profiles (Schnitt et al., 2024; Walbröl et al., 2022), trained with a large dataset of daily radiosoundings launched from 1990 until 2018 from Grantley Adams International Airport in Barbados (station ID 78954 TBPB). The dataset used here extends from 16 January to 1 March 2020, including 219 radiosondes, providing a total of 145 (68) matchups between radiosonde observations and MWR zenith (elevation scan) retrievals. A MWR absolute calibration with LN2 was performed right before the campaign (15 January 2020).
3.3 Methodology
Following Bianco et al. (2017), the MWR ability to provide atmospheric stability is assessed through the analysis of vertical gradients of atmospheric temperature () and potential temperature () in the 50–300 m vertical range. Here, the potential temperature profile is calculated using Eq. (2) with P0=1000 mbar and . The profiles of T (in K) and P (in mbar) are given by the temperature profile retrieved from the MWR and the pressure profile estimated via the atmospheric thickness equation (with the temperature retrievals and the surface pressure measured by the sensor embedded within the MWR as inputs). For all the datasets we consider radiosondes as reference measurements for atmospheric temperature and potential temperature. Potential temperature from radiosondes is computed as above but using temperature and pressure measurements from the radiosonde sensors. Temporal colocation between MWR measurements and radiosonde data is achieved by averaging the MWR measurements within 30 min after the radiosonde launch. The scanning mode does not influence the averaging since zenith-only and elevation scan retrievals (where both available) are treated separately. For spatial colocation, radiosonde data are interpolated on the vertical grid defined for MWR profile retrievals. Note that we do not apply smoothing of radiosonde data, such as averaging kernels, to reduce the vertical resolution to that of MWR retrievals (e.g., Löhnert and Maier, 2012). In fact, this analysis aims to quantify the performances of MWR retrievals to catch the vertical gradient between two fixed heights for the interest of wind energy applications, with no additional processing of the MWR output. Examples of simultaneous MWR and radiosonde profiles for temperature and potential temperature are shown in Fig. 8 for two of the considered datasets (ENA and SOF), including the three most common commercially available MWR types. Figure 8 indicates that MWR can generally reproduce the structure of both temperature and potential temperature profiles, although at a lower vertical resolution. Looking at the potential temperature profiles, the two selected cases correspond to classic unstable and neutral/stable atmospheric conditions (Stull, 2012). For each of the available datasets, we produce couplets of T and θ profiles from MWR and radiosonde, from which statistical agreement is computed in terms of vertical profiles of bias, standard deviation (SD), and rms difference. For each couplet, vertical gradients between 50–300 m are computed ( and ) from both MWR and radiosonde profiles. Figure 9 shows a 2.5-month time series of at the ENA site as computed from MWR and radiosondes. The statistical agreement is then computed in terms of mean average (AVG), SD, rms, and mean absolute error (MAE). The typical uncertainty of radiosonde temperature measurements below 5 km is ∼ 0.2–0.5 K (Dirksen et al., 2014). Thus, assuming uncorrelated uncertainty at different layers, the uncertainty of temperature gradients from radiosonde is estimated as ∼ 1.1–2.8 K km−1. However, the representativeness uncertainty, resulting from the representation of an air volume with radiosonde point measurements, probably dominates and is more difficult to estimate generically, as it depends on site climatology and meteorological conditions.
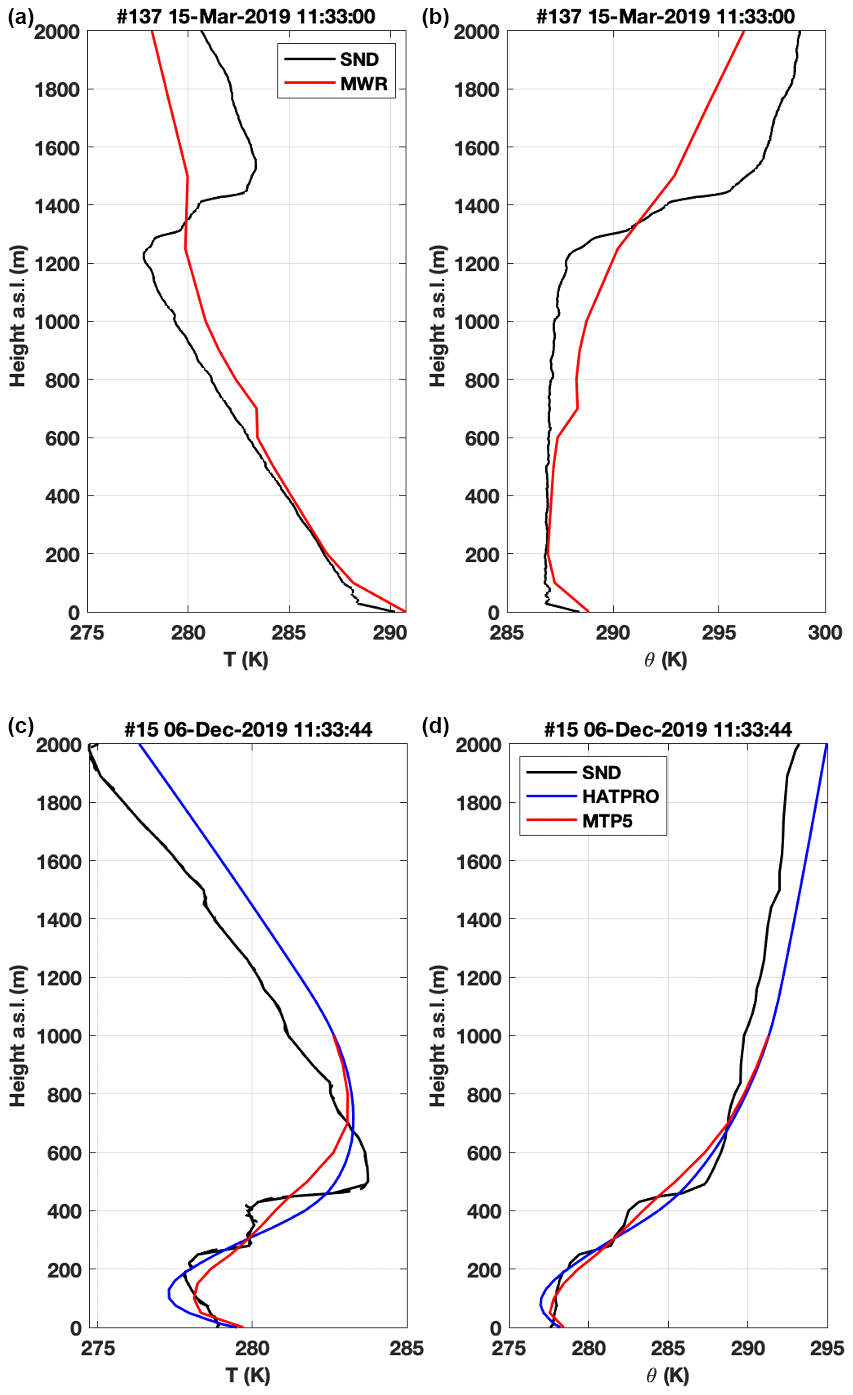
Figure 8Simultaneous temperature (a, c) and potential temperature (b, d) profiles from radiosonde (black) and three MWR types. Top: MP3000-A (red) at the ENA site (unstable conditions). Bottom: HATPRO (blue) and MTP-5 (red) at the SOFOG3D supersite (neutral to stable conditions). Note that MTP-5 retrievals are limited to 1 km height.
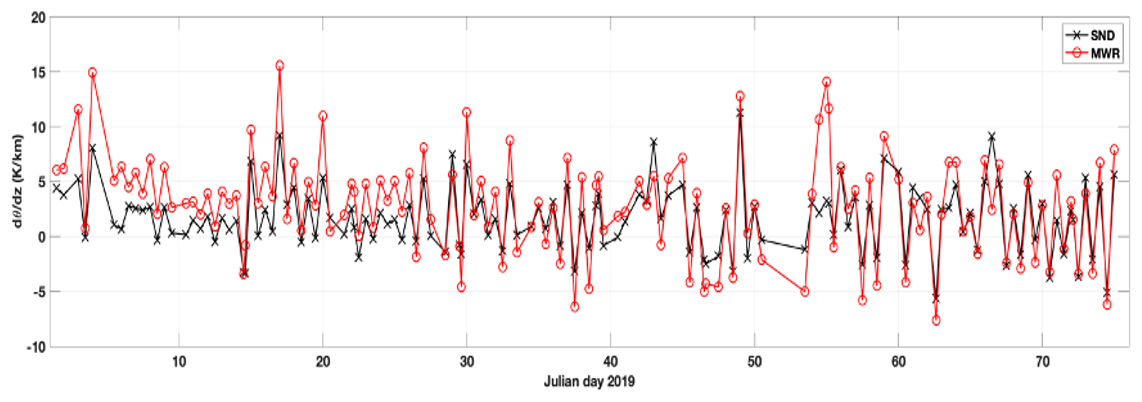
Figure 9The 2.5-month time series of potential temperature lapse rate () between 0 and 300 m a.s.l. derived from MWR temperature retrievals (red line) and from radiosonde observations (black line). The horizontal line at 0 K km−1 indicates the interface between detected atmospheric stable () and unstable () conditions. Dataset from Graciosa Island from 1 January to 15 March 2019.
This section presents quantitative results of the statistical analysis on the ability of MWR to provide atmospheric temperature and potential temperature profiles and vertical gradients, which are related to the atmospheric stability. The results are discussed below separately for each dataset.
ENA. The first considered dataset was collected at the ENA observatory, located a few hundred meters away from the northern coastline of Graciosa Island in the eastern North Atlantic, conveniently exposed to Atlantic Ocean conditions throughout the year. The considered dataset of MWR profiler and radiosonde observations spans about 3 months (from 1 January to 15 March 2019). The MWR is a Radiometrics MP3000-A (see Table 1). Two radiosondes per day are launched from ENA at ∼ 11:30 and 23:30 UTC, providing 138 matchups between MWR retrievals and radiosonde profiles in the considered period. From the set of 138 matchups, statistics for temperature and potential temperature profile accuracy are calculated. Accordingly, for the ENA dataset Fig. 10 reports the vertical profiles of bias, SD, and rms difference between temperature and potential temperature profiles measured by radiosondes and estimated by MWR. The scores for temperature profile retrievals are in line with those available from the open literature (Cimini et al., 2006; Löhnert and Maier, 2012; Bianco et al., 2017). The scores for potential temperature profiles are very similar to those for temperature profiles, though not exactly the same due to the influence of pressure profiles (measured by radiosondes while estimated from surface pressure and retrieved temperature by MWR). Figure 11 reports the scatter plot of temperature gradient () and potential temperature gradient () in the vertical range (50–300 m). It shows that MWR estimates of either or are correlated with radiosonde measurements throughout the spanned range, with larger scatter towards higher values. The range of goes from negative to positive values (from −5 to +15 K km−1), i.e., from atmospheric unstable through neutral to stable conditions. The statistical results are computed from the two samples of and couplets in terms of AVG, SD, rms, and MAE. A summary from all the considered datasets is reported in Table 3. For convenience, Table 3 also reports the statistical results from Bianco et al. (2017), as obtained from the XPIA dataset from Colorado (USA). For the ENA datasets, these can be summarized as follows: for both temperature gradient () and potential temperature gradient (), the MAE is within 2.4 K km−1 and bias within −1.2 K km−1, with 0.72 correlation. These performances are somewhat worse than those reported by Bianco et al. (2017) for XPIA, i.e., MAE within 2.2 K km−1 and bias within −0.1 K km−1, with 0.95 correlation. Note that the same MWR type operates at the two sites (MP-3000A), but the notable difference may be related to the status of the instrument calibration and/or the appropriate fitting of the retrieval coefficients to the different climatology conditions (ENA: winter marine environment; XPIA: spring mountain environment).
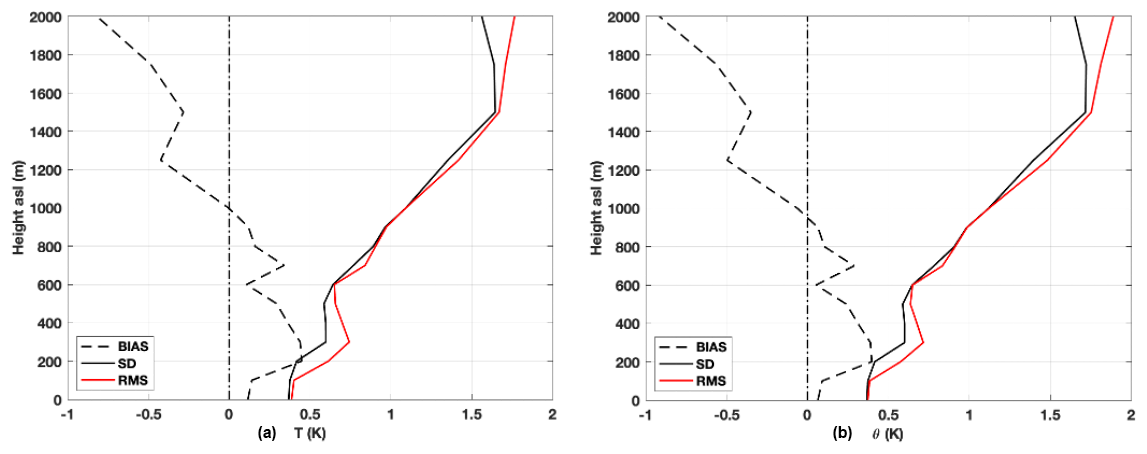
Figure 10(a) Bias, standard deviation (SD), and root-mean-square (rms) differences of the MWR-minus-radiosonde temperature residuals from the 138 matchups collected at the ENA observatory on Graciosa Island (eastern North Atlantic) from 1 January to 15 March 2019. (b) Same but for potential temperature profiles.
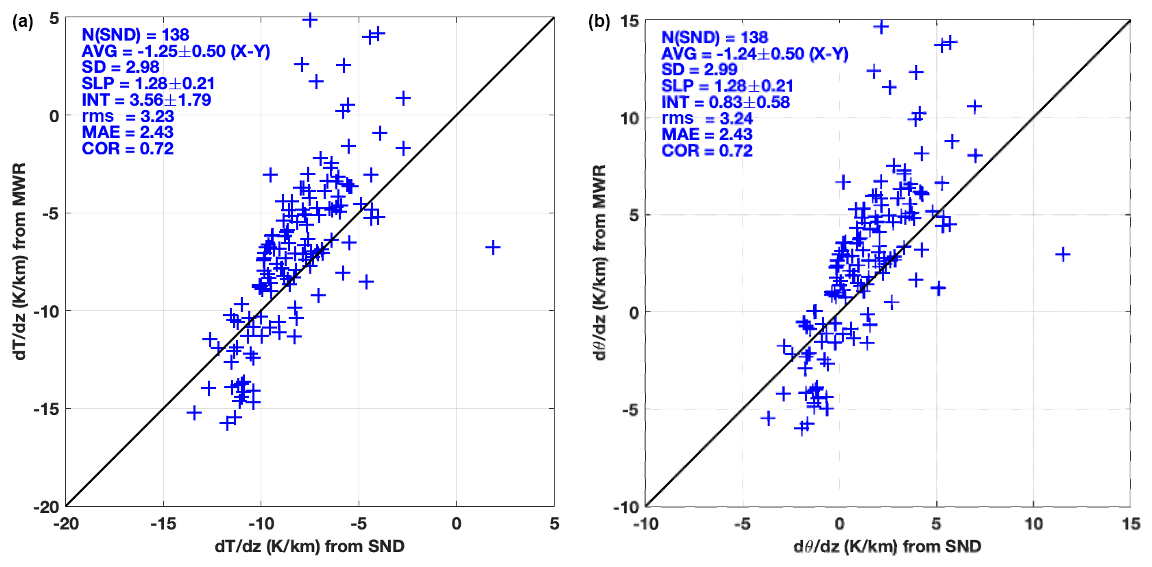
Figure 11Comparison of atmospheric lapse rate (50–300 m) for temperature (a) and potential temperature (b) for MWR retrievals vs. radiosonde measurements collected at the ENA observatory on Graciosa Island from 1 January to 15 March 2019. N indicates the sample size, AVG the average difference (± 95 % confidence interval), SD the standard deviation, SLP and INT the slope and intercept of a linear fit (± 95 % confidence interval), rms the root mean square, MAE the mean absolute error, and COR the correlation coefficient R. Units for AVG, SD, rms, and MAE are in K km−1. The horizontal and vertical lines at K km−1 indicate the interface between detected atmospheric stable and unstable conditions.
MOL. This dataset was collected at the MOL in northeastern Germany, about 98 m above mean sea level, characterized by typical mid-latitude continental climatology conditions. The considered dataset of MWR profiler and radiosonde observations spans about 4 months (from 1 September to 31 December 2020). The MWR is an RPG HATPRO G5 (see Table 1). Four radiosondes per day are launched at ∼ 05:30, 11:30, 17:30, and 23:30 UTC, providing 492 matchups between MWR retrievals and radiosonde profiles. From the set of 492 matchups, statistics for temperature profile accuracy are calculated and reported in Fig. 12a, similarly to Fig. 10. Also for this dataset, the scores for temperature profile retrievals are in line with those available from the open literature, though the SD/rms increases more rapidly in the 200–1400 m vertical range. The statistics for the potential temperature profiles are almost identical to those for temperature and thus are not shown for this or for the remaining datasets. Scatter plots of from MWR and radiosondes are reported in Fig. 13a. As for ENA, the MOL dataset corresponds to different climatology (autumn continental environment) with respect to that of XPIA. Note that the range of potential temperature gradients is larger in MOL than ENA datasets, due to the combination of a larger sample, different environment and season, and finally better coverage of the diurnal cycle (four vs. two daily radiosondes). The behavior of both and is similar for the ENA and MOL sites, though showing higher correlation at MOL (0.91) than at ENA (0.72) as summarized in Table 3.
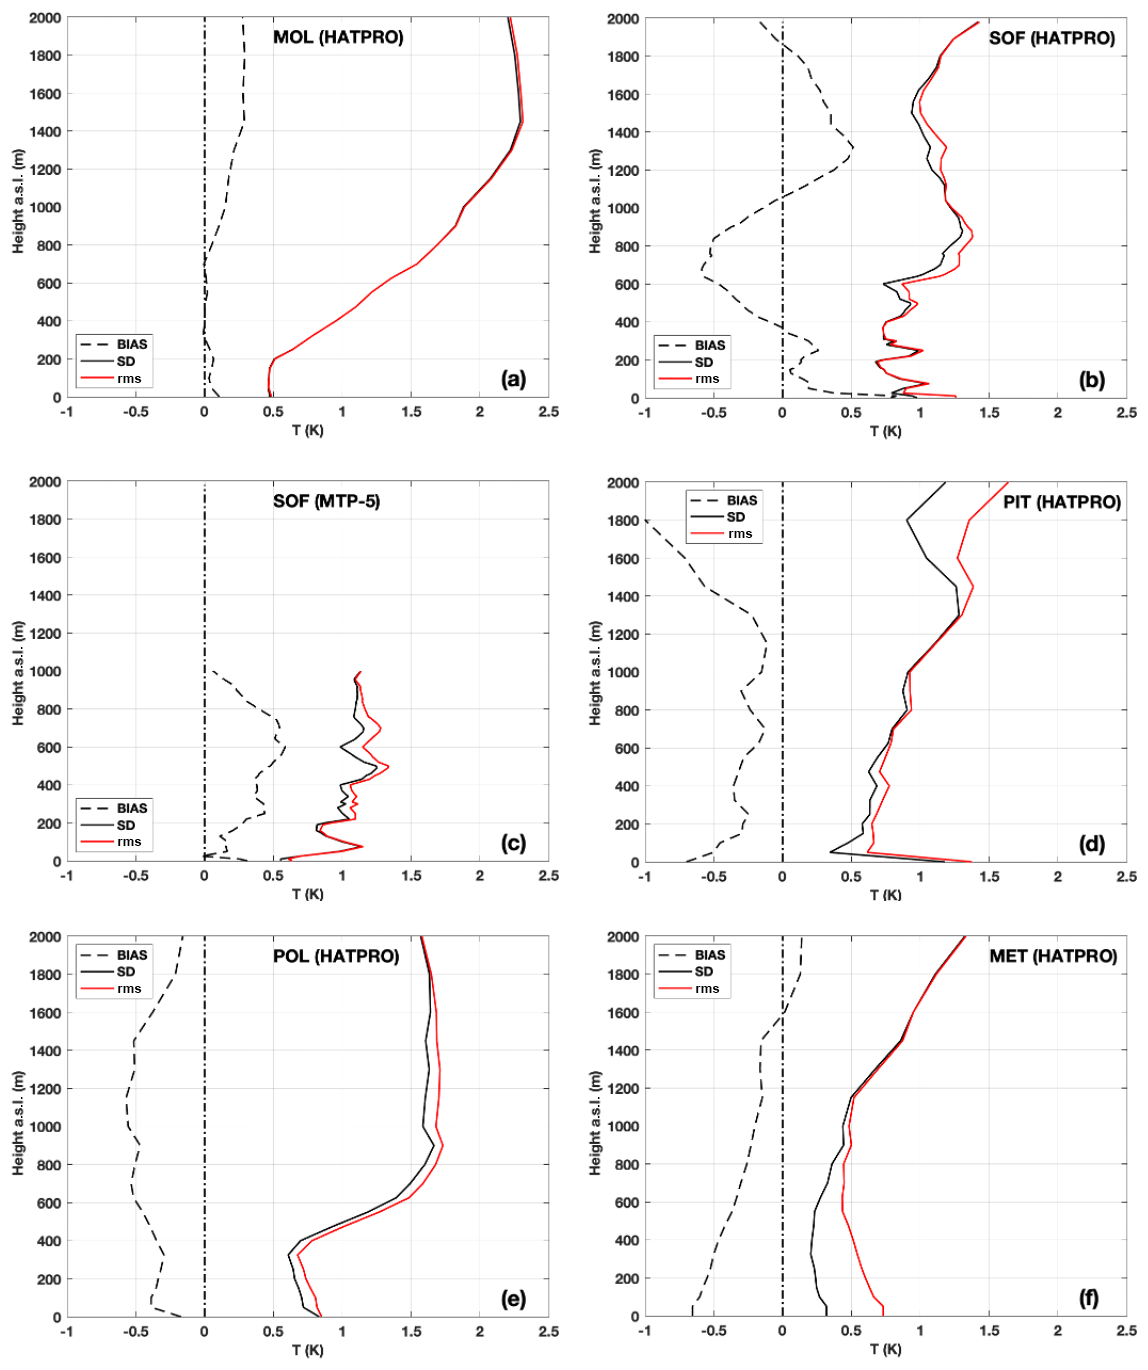
Figure 12Profiling performances for temperature profiles as in Fig. 8 but obtained from the other considered datasets. (a) 492 matchups collected at MOL (Lindenberg, Germany) from 1 September to 31 December 2020. (b) 61 matchups during the SOFOG3D campaign (Saint-Symphorien, France, October 2019 to April 2020) for the HATPRO MWR. (c) 61 matchups during the SOFOG3D campaign but for the MTP-5 MWR (limited to 1 km altitude above ground). (d) 35 matchups during the SVAAP project (12 July 2016 to 21 February 2017) collected at Pituffik (Greenland). (e) 298 matchups from 16 RV Polarstern cruises from 2007 to 2016. (f) 145 matchups from the RV Meteor during the EUREC4A campaign (from 16 January to 1 March 2020, zenith mode only).
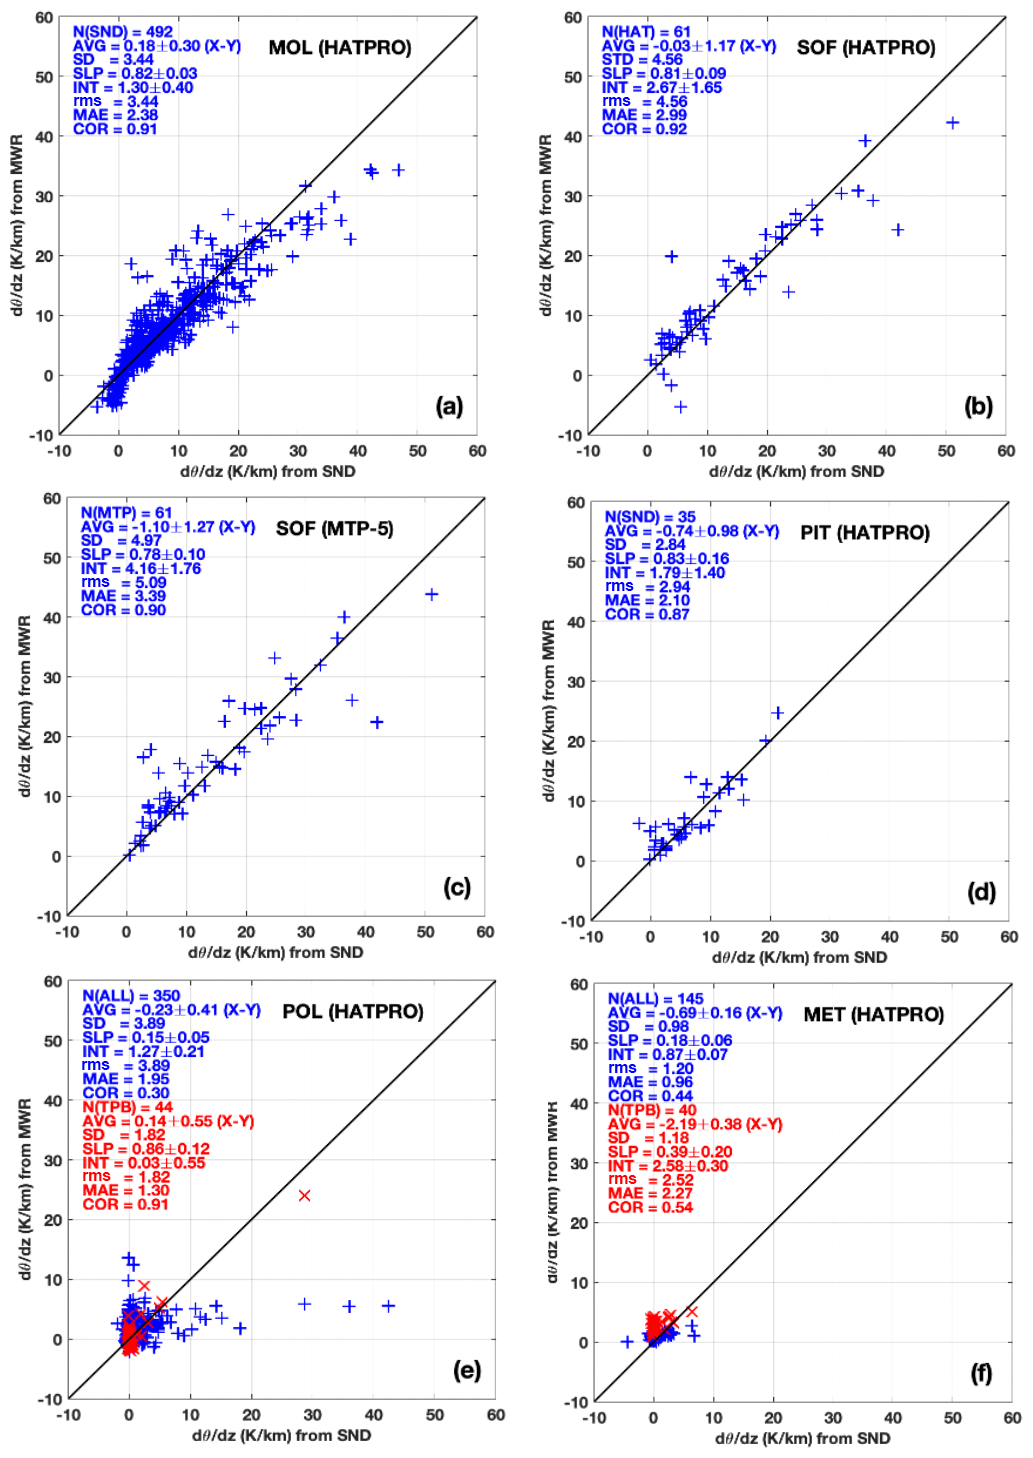
Figure 13Comparison of atmospheric potential temperature lapse rate as in Fig. 9 but for MWR retrievals vs. radiosonde measurements collected at other sites. (a) MOL (Lindenberg, Germany). (b) SOFOG3D campaign (Saint-Symphorien, France); HATPRO data. (c) SOFOG3D campaign (Saint-Symphorien, France); MTP-5 data. (d) SVAAP project (Pituffik, Greenland). (e) RV Polarstern cruises (North and South Atlantic); blue crosses indicate all retrieval at zenith, red X symbols indicate elevation scan retrievals (2016 only). (f) RV Meteor during the EUREC4A campaign (Barbados); blue crosses indicate retrievals at zenith, red X symbols indicate elevation scan retrievals. Text within each panel as in Fig. 11. Units for AVG, SD, rms, and MAE are in K km−1.
SOF. The same analysis is performed on the dataset collected during the Météo-France SOFOG3D international field campaign in the southwest of France. Two MWRs were operated side by side at the supersite in Saint-Symphorien, one HATPRO and one MTP-5 (see Table 1). A total of 61 radiosondes were launched, mostly during stable conditions prone to fog formation during the period from 10 November 2019 to 10 March 2020. Statistical comparisons of the 61 radiosonde profiles with nearly simultaneous MWR retrievals from both HATPRO and MTP-5 are reported in Fig. 12b–c. Note that retrievals from MTP-5 are limited to 1 km altitude, while retrievals from HATPRO are provided up to 10 km (although the sensitivity drops to negligible values above 2–3 km). For the vertical range covered by both radiometers (<1 km), their performances are quite similar (in terms of bias, SD, and rms), with slightly better performances close to the surface for MTP-5. Statistics for temperature and potential temperature gradients in the 50–300 m vertical range during the SOFOG3D experiment are shown in Fig. 13b. As for the temperature profiles, the performances of the two radiometers are also quite similar for the gradients. HATPRO shows slightly higher scores (e.g., ∼ 2 % increase in correlation) than MTP-5, despite the slightly better profiling performances of MTP-5 near the surface.
PIT. This dataset was collected at THAAO within the US Pituffik Space Base along the northwestern coast of Greenland, at 220 m above sea level, characterized by typical Arctic climatology conditions. The MWR is an RPG HATPRO G2 (see Table 1). During the SVAAP project (12 July 2016 to 21 February 2017), radiosondes were launched sporadically during clear-sky conditions, with a total of 35 matchups between MWR retrievals and radiosonde observations. Statistics for temperature and profile accuracy are calculated and reported in Fig. 12d. Also in this case, the scores for temperature profile retrievals are in line with those available from the open literature, though slightly larger than expected near the surface. Figure 13d reports the scatter plot of potential temperature gradient (). This dataset corresponds to yet another climatology (polar environment) with respect to the previous ones. The statistical scores for both and are similar to the previous sites – higher than ENA but slightly lower than MOL/SOF in terms of correlation (∼ 0.87).
POL. This dataset consists of MWR and radiosonde data from 16 RV Polarstern cruises (from 2007 to 2016) from the northern to southern Atlantic, across the Equator. One radiosonde per day was launched routinely between 11:00–12:00 UTC, but other launches were performed occasionally. A total of 466 radiosonde launches have been collected during the 16 cruises, leading to 365 matchups with MWR data, of which 350 survived a quality control screening. This dedicated quality control was deemed necessary to purge unrealistic retrievals found in the first 2-week period (20 April to 3 May) of the 2007 cruise, characterized by a suspicious large nose at 1 km height, the cause of which remains unidentified. From the set of 350 matchups, statistics for temperature profile accuracy are calculated and reported in Fig. 12e. The statistics for temperature profile retrievals are larger than those available from the open literature, especially below 500 m. While the systematic component (bias) stays within 0.5 K, the random component (SD) presents a peak near the surface, leading to ∼ 0.8 K rms. This feature naturally affects the comparison of temperature and potential temperature gradients. Figure 13e reports the scatter plot of measured by the MWR and the radiosondes, clearly showing low correlation (∼ 0.3). It appears that, except for a few cases, the radiosondes measure nearly neutral stability (i.e., 0 K km−1) while the MWR reports the whole range from slightly unstable ( K km−1) to very stable conditions ( K km−1). In addition, for the few cases in which radiosondes measure very stable conditions ( K km−1), the MWR retrievals seem to saturate at ∼ 5 K km−1. One possible cause may be the zenith-only observation mode adopted during these RV Polarstern cruises. In fact, although elevation scanning observations are proved to increase the accuracy of MWR temperature retrievals (Cimini et al., 2006), especially below 1 km, the zenith-only mode was chosen aboard the RV Polarstern to avoid mispointing problems caused by the ship pitch and roll movements. This cause can be investigated by analyzing further the dataset of RV Polarstern data collected during the two cruises in 2016, when elevation scanning observations were also available. The analysis of this additional dataset, corresponding to MWR retrievals from elevation scanning observations during the two cruises of 2016, is also reported in Fig. 13e. Although the scatter of potential temperature gradients seems similar, the statistical scores of elevation scanning retrievals improve substantially with respect to zenith only, in terms of rms (from 3.78 to 1.84 K km−1), MAE (from 1.97 to 1.30 K km−1), and correlation (from 0.31 to 0.90), though the latter is mostly driven by only one point (at 27 K km−1). Although limited, this dataset seems to confirm that elevation scanning is indeed desirable for offshore MWR deployment. Another possible cause of the rather poor performances may be related to the dataset used to train the inversion method (multiple regression). As detailed in Doktorowski (2017), the training is based on a homogenized dataset of 2621 radiosondes launched from cargo vessels in all climatic zones between 60° N and 60° S, which may be too broad to represent the peculiar environmental conditions encountered by the Polarstern during the 16 cruises from 2007 to 2016. In particular, the training set may under-represent the deep neutral conditions which seem to characterize most of the radiosonde profiles during the RV Polarstern cruises.
MET. Another ship-based dataset of colocated MWR and radiosonde observations is available from the RV Meteor during the EUREC4A project. A total of 219 radiosondes were launched from the RV Meteor between 16 January and 1 March 2020, corresponding to typical tropical conditions. The LIMHAT level 3 version 2.0 dataset is used here (Schnitt et al., 2023). From this dataset, 145 matchups between radiosonde observations and MWR zenith temperature profile retrievals are available, for which the statistical agreement is calculated and reported in Fig. 12f. SD for temperature profile retrievals is in line with the expectations from the open literature, while the bias presents a ∼ 0.7 K peak near the surface, dominating the rms in the lower 500 m. The scatter plot of potential temperature gradients is reported in Fig. 13f for both the zenith-mode (145 matchups) and elevation-mode (40 matchups) retrievals. Similarly to POL, radiosonde data indicate dominant nearly neutral conditions ( 0 K km−1), while MWR data mostly indicate slightly stable conditions ( 0–4 K km−1). For the few cases where radiosondes indicate either unstable ( −4 K km−1) or stable conditions ( 7 K km−1), the zenith-mode data remain with 0–3 K km−1, resulting in low correlation overall (0.44). Correlation is slightly larger for elevation-mode retrievals (0.54), but MAE is also larger (2.27 K km−1) due to a ∼ 3-times-larger AVG. Note that, while theory and previous field campaigns have shown that elevation scans should improve the retrieved temperature profiles in the lowest kilometer (Cimini et al., 2006), this is the opposite for the EUREC4A LIMHAT dataset. In fact, as reported by Schnitt et al. (2023), bias and rms for the elevation-mode retrievals increase substantially with respect to zenith mode (by a factor of 2 near the surface; see their Fig. 9). The authors attribute this to the training set (radiosondes launched from Grantley Adams International Airport), which may be impacted by an island effect, leading to warmer temperatures near the surface compared to the zenith column over the ocean. Another potential reason is the ship pitch and roll movements, since the LIMHAT was not stabilized, which may especially affect observations at low-elevation angles.
Table 3Summary of the statistics for temperature and potential temperature gradients from MWR validated against radiosonde measurements (50–300 m a.s.l.). Note that for XPIA the correlation coefficient is derived from the coefficient of determination (R2) given in Bianco et al. (2017). POL (ZNT-ALL) indicates zenith-only MWR retrievals from all 16 Polarstern cruises (2007–2016), while POL (ELV-2016) indicates elevation scan MWR retrievals from two Polarstern cruises in 2016.
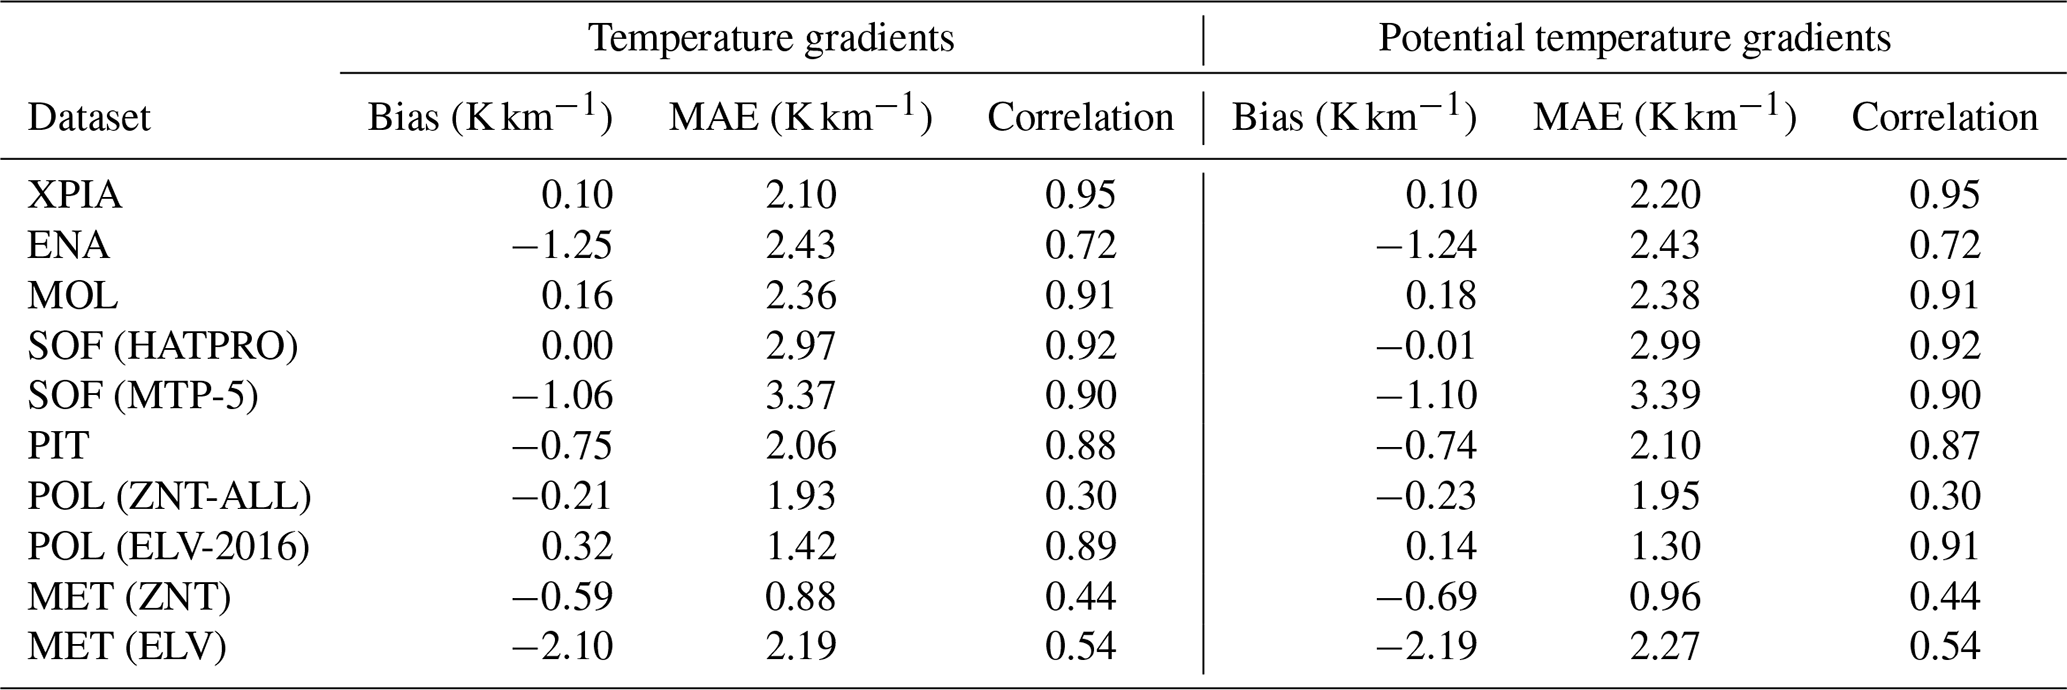
Finally, the scores for temperature and potential temperature gradients from all the datasets, including the reference from Bianco et al. (2017), are reported in Table 3. Note that the range of temperature gradients is quite different in the seven datasets (∼ 30 K km−1 for XPIA, ∼ 20 K km−1 for ENA, ∼ 50 K km−1 for MOL and SOF, ∼ 25 K km−1 for PIT, ∼ 40 K km−1 for POL, and ∼ 14 K km−1 for MET), which affects the values of rms, MAE, and correlation. The statistics from MOL and SOF (continental mid-latitude sites, winter to spring) are similar and just slightly lower than those reported for XPIA (mountain site, spring). For the onshore datasets (top six rows in Table 3), potential temperature gradients agree with those from radiosondes, with correlation ranging from 0.72 to 0.95 and MAE from 2.10 to 3.39 K km−1. The lowest correlation (0.72) corresponds to ENA (winter marine environment), which is the only dataset obtained with zenith-only observations, while for all the others the correlation is higher than 0.88. This gives some confidence that MWR performances are site independent, provided that the radiometer and inversion method are properly calibrated and trained, respectively. Conversely, the shipborne datasets (bottom four rows in Table 3) provide substantially lower correlation considering zenith retrievals (0.30 to 0.44). Elevation scanning seems beneficial, increasing correlation (from 0.3 to 0.9 for POL and 0.4 to 0.5 for MET), though for POL it is mostly driven by one matchup only, and for MET it comes at the expense of ∼ 2-times-larger MAE. Note that the MWR retrieval algorithm for the POL and MET datasets is the same (linear regression), though trained with independent datasets (POL: 2621 shipborne radiosondes; MET: 10871 radiosondes launched from an island-based airport). This suggests that appropriate dedicated training and elevation scanning with ship movement compensation may be required for the MWR to catch potential temperature gradients typical of offshore conditions.
Atmospheric stability is relevant for wind energy applications, as it influences the propagation of wind turbine wakes. Wind turbine rotors operate in the lowest 300 m, and atmospheric stability below and above that height may influence their operations through vertical wind shear and turbulence. Considering different power curves for different stability conditions leads to more accurate and reliable performances of energy production, which lowers the financial risks for both operators and manufacturers. Thus, the ability to model and measure atmospheric stability was reviewed using available datasets of reanalysis and mesoscale NWP model output, tower measurements, and ground-based remote-sensing observations.
Surface stability metrics from model datasets, including NWP (NEWA and DOWA) and global reanalysis (ERA5), have been assessed against measurements from met masts and floating lidar, focusing on the Obukhov length. The results confirm that when the main drivers of atmospheric stability are correctly characterized by the bulk formulations used in NWP models, the modeled Obukhov length time series compare to those derived from measurements. Overall, the best match between model data and measurements is observed for ERA5 datasets, in particular computed from the fluxes for unstable conditions and using the bulk Richardson number for stable conditions. Two examples are reported to illustrate how the modeled Obukhov length time series can improve wind-related analyses. The first demonstrates how the atmospheric stability class indicated by the modeled Obukhov length correlates to turbulence intensity and wind speed spectra, both progressively increasing as conditions shift from stable to neutral to unstable. The second example shows that surface layer expressions, such as Monin–Obukhov similarity theory, reasonably predict the wind speed profile in neutral and unstable conditions, while they significantly overpredict wind speed measurements in stable conditions, requiring additional information on upper-air effects (e.g., the boundary layer height) to better capture the wind speed above 30 m. The ability of NWP models to characterize air temperature profiles in different stability conditions was assessed in the 30–100 m vertical range against tower measurements (at FINO1/FINO2 platforms). Both DOWA and NEWA are quite accurate on average, with mean differences of ∼ 0.3–0.5 K with respect to measurements, with no clear pattern with respect to the stability class. Conversely, both DOWA and NEWA models show increased rms in stable conditions with respect to unstable conditions, with a minimum rms in neutral conditions. DOWA performs better than NEWA, the former showing rms within 1 K regardless of stability conditions and the latter showing rms up to 2.2 K, especially in very stable conditions. Also for temperature gradients in the 50–100 m layer, DOWA performs better than NEWA, as measured by MAE (3.4–4.0 K km−1 for DOWA and 3.5–4.2 K km−1 for NEWA), rms (5.8–7.3 K km−1 for DOWA and 6.4–8.4 K km−1 for NEWA), and correlation (0.77–0.80 for DOWA and 0.70–0.71 for NEWA).
Thus, it is concluded that reanalysis and NWP models do provide wind energy practitioners with useful information on atmospheric stability (e.g., Obukhov length) for many situations; i.e., the mean can be used for a range of analyses, including estimates of turbulence and wind shear. However, in specific cases (e.g., elevated temperature inversion) and especially during near-surface stable stratification, the simulated profiles may not be sufficiently accurate. Typical conditions for difficult stability characterization have been illustrated using datasets of surface wind from SAR observations and in situ temperature/wind profiles from UAS measurements. Cases with long wind farm wakes, as they typically occur in a stably stratified ABL, have been identified when observations and models at the surface indicate unstable and neutral conditions, suggesting the need for continuous measurements above the height of the typical met mast (∼ 100 m).
This need can be satisfied by nearly continuous observations from ground-based remote-sensing atmospheric profilers, and this study addresses the following specific question: how good are atmospheric stability retrievals from microwave radiometer measurements for wind energy applications in different climates? Here, the ability of commercially available MWR to profile atmospheric temperature within the first 2 km and to provide potential temperature gradients in the vertical range of wind turbine rotors has been assessed against in situ radiosonde measurements. Several sources of MWR data have been identified and analyzed, giving preference to datasets in different environments and climatological conditions and datasets with observations from all identified MWR manufacturers. This analysis extends the results in Bianco et al. (2017), obtained for the MP3000A deployed in a continental high-elevation site (∼ 1500 m, Colorado, USA), to other MWR types and environmental conditions. In total, six datasets are considered here, of which four are for onshore and two for offshore environments. The four onshore include marine (northeastern Atlantic), continental (northeastern Germany; southwestern France), and Arctic (Greenland) environments. The two offshore datasets are collected from two research vessels: the Polarstern, cruising the Atlantic from northern Europe to southern Africa/America, and the Meteor, deployed off the coast of Barbados in the Caribbean Sea. The considered datasets include observations from all the identified commercial MWR types (i.e., HATPRO, MP3000A, MTP-5). From the analysis of the six datasets considered in this study, we conclude the following.
The statistics for temperature profile retrievals are mostly in line with those available from the open literature, i.e., bias within ±0.5 K and rms ∼ 0.5 K near the surface increasing to ∼ 1.5 K at 2 km, although with some exceptions (e.g., higher bias and rms near the surface for HATPRO in SOF and PIT). Statistics from NWP models in the 30–100 m altitude range show similar biases but a larger rms (increasing to more than 0.5 K from unstable to stable conditions, especially for NEWA).
For the onshore datasets, potential temperature gradients agree with those from radiosondes, with correlation ranging from 0.7 to 0.9 and MAE from 2.1 to 3.4 K km−1. This mostly confirms the results of a previous study (Bianco et al., 2017), limited to one onshore dataset and one MWR type. Similar performances from sites in different environments and with different climatology give some confidence that MWR performances can be considered site independent, provided that the radiometer and inversion method are properly calibrated and trained, respectively.
For the offshore datasets, considering zenith retrievals, the MAE is relatively small (0.9 to 1.9 K km−1), while the correlation is substantially lower (0.3 to 0.4). The low performances are partially due to the relatively narrow range of potential temperature gradients from radiosondes, indicating prevailing neutral conditions. This poses a question about the datasets used to train the inversion algorithm, as global or onshore datasets may under-represent the prevailing neutral conditions shown by the offshore datasets available here.
Elevation scanning seems beneficial for both onshore and offshore deployments. Zenith-only retrievals at ENA resulted in lower correlation (0.72) than all other onshore retrievals (0.88–0.92) based on scanning observations. From the offshore datasets, elevation scanning increased correlation from 0.3 to 0.9 (POL) and from 0.4 to 0.5 (MET). For POL, elevation scanning also decreases MAE, while for MET MAE increases by a factor ∼ 2, due to a 3-times-larger AVG. This may also be related to the training dataset, which could be affected by an island effect, but also to the ship movement (pitch and roll), which may have some impact on low-elevation observations.
Considering the six datasets, the MAE between MWR and radiosonde temperature (and potential temperature) gradients in the 50–300 m vertical range goes from 0.9 to 3.4 K km−1, while the rms difference ranges from 1.2 to 5.1 K km−1. The latter includes the uncertainty of the radiosonde temperature sensor (1.1–2.8 K km−1). Considering this, the uncertainty of MWR for temperature and potential temperature gradients in the 50–300 m vertical range is estimated between ∼ 0.5–4.3 K km−1. The considered datasets indicate that MWR in general can detect potential temperature gradients from −5 to +50 K km−1 at least.
This study indicated the lack of systematic offshore MWR measurements. Systematic offshore MWR measurements are needed to enlarge the range of meteorological conditions and to characterize the performances under different stability stratifications. The conclusions above indicate that appropriate dedicated training and elevation scanning (with movement compensation if ship-based) may be required for the MWR to catch potential temperature gradients typical of offshore conditions. Wind energy practitioners may be interested in learning what instrument is best when and where. To address this properly, we would need to have the different MWR types running at the same time in different environments with the same retrieval method. To our knowledge, no such a dataset is currently available, nor do plans to implement such an intercomparison exist. However, other onshore and offshore MWR observation datasets may be exploited to extend this analysis, characterizing performances in other conditions and testing optimization strategies, e.g., in the context of the MiRadOr (microwave radiometers for assessing offshore wind resources) project, currently under evaluation. Also, instrument synergy may be exploited to increase vertical resolution of temperature profiles and thus improve retrieval performances of temperature gradients, as shown onshore for combined passive (MWR and IRS) and active (RASS) sensors (Turner and Löhnert, 2021; Bianco et al., 2024), although it is not practical to deploy all these instruments offshore. From the above perspectives, one of the most valuable datasets up to date is the one produced recently by the 3rd Wind Forecast Improvement Project (https://psl.noaa.gov/renewable_energy/wfip3/, last access: 2 May 2025), including MWR, IRS, and several active instruments deployed over a barge off the coast of southern New England.
Microwave radiometer and radiosonde data collected at the ARM ENA site and by the RV Meteor are freely available for public access (ENA: https://doi.org/10.5439/1025254, Cadeddu et al., 2014; https://doi.org/10.5439/1021460, Keeler and Kyrouac, 2013; MET: https://doi.org/10.25326/454, Schnitt et al., 2023; https://doi.org/10.25326/137, Stephan, 2020). Other datasets and the code developed to process all the datasets are available from the authors upon request.
The supplement related to this article is available online at https://doi.org/10.5194/amt-18-2041-2025-supplement.
Conceptualization and funding acquisition: DC, RG, and SF acquired the funding and designed and lead the research. Data curation: CA, AB, CK, PM, GP, and BP provided experimental data and performed data curation. Visualization: DC, RG, and AB created the figures. Supervision and validation: SG, EG, STN, and FR oversaw the research activity planning and execution, including mentorship external to the core team. Writing: DC, RG, and SF prepared the original draft of the manuscript, which was reviewed and edited by all co-authors.
At least one of the (co-)authors is a member of the editorial board of Atmospheric Measurement Techniques. The peer-review process was guided by an independent editor, and the authors also have no other competing interests to declare.
Publisher’s note: Copernicus Publications remains neutral with regard to jurisdictional claims made in the text, published maps, institutional affiliations, or any other geographical representation in this paper. While Copernicus Publications makes every effort to include appropriate place names, the final responsibility lies with the authors.
This article is part of the special issue “Profiling the atmospheric boundary layer at a European scale (AMT/GMD inter-journal SI)”. It is not associated with a conference.
The research was stimulated by COST Action CA18235 PROBE (https://probe-cost.eu/, last access: 2 May 2025), supported by COST (European Cooperation in Science and Technology, https://www.cost.eu, last access: 2 May 2025). Data at ENA were obtained from the Atmospheric Radiation Measurement (ARM) user facility, a United States Department of Energy (DOE) Office of Science user facility managed by the Biological and Environmental Research Program. The SOFOG3D field campaign was supported by Météo-France and ANR through grant AAPG 2018-CE01-0004. The MWR network deployment during SOFOG3D was carried out thanks to support by IfU GmbH, the University of Cologne, the Met Office, Laboratoire d'Aérologie, MeteoSwiss, ONERA, and Radiometer Physics GmbH. Data are managed by the French national center for Atmospheric data and services AERIS. The Study of the water VApour in the polar AtmosPhere (SVAAP) field campaign was supported by the Italian Antarctic research program (PNRA). The OCEANET-Atmosphere team of TROPOS around Ronny Engelmann and Dietrich Althausen is acknowledged for the acquisition and provision of HATPRO data aboard the RV Polarstern. EUREC4A is funded with support of the European Research Council (ERC), the Max Planck Society (MPG), the German Research Foundation (DFG), the German Meteorological Weather Service (DWD) and the German Aerospace Center (DLR).
This research was funded by the Carbon Trust as part of the Offshore Wind Accelerator (OWA) Radiometry and Atmospheric Profiling (RAP) project (grant no. 6200556). OWA partner companies are (in alphabetical order) EnBW, Equinor, Orsted, RWE, ScottishPower Renewables, Shell, SSE Renewables, TotalEnergies, and Vattenfall. The work of Claudia Acquistapace was funded by the EXPATS research project (project no. 4823IDEAP5) as part of the framework of the IDEA-S4S network in close collaboration with the Deutscher Wetterdienst (DWD), funded by the Federal Ministry for Digital and Transport (BMDV).
This paper was edited by Anca Nemuc and reviewed by two anonymous referees.
Bärfuss, K., Hankers, R., Bitter, M., Feuerle, T., Schulz, H., Rausch, T., Platis, A., Bange, J., and Lampert, A.: In-situ airborne measurements of atmospheric and sea surface parameters related to offshore wind parks in the German Bight, PANGAEA [data set], https://doi.org/10.1594/PANGAEA.902845, 2019.
Bianco, L., Friedrich, K., Wilczak, J. M., Hazen, D., Wolfe, D., Delgado, R., Oncley, S. P., and Lundquist, J. K.: Assessing the accuracy of microwave radiometers and radio acoustic sounding systems for wind energy applications, Atmos. Meas. Tech., 10, 1707–1721, https://doi.org/10.5194/amt-10-1707-2017, 2017.
Bianco, L., Adler, B., Bariteau, L., Djalalova, I. V., Myers, T., Pezoa, S., Turner, D. D., and Wilczak, J. M.: Sensitivity of thermodynamic profiles retrieved from ground-based microwave and infrared observations to additional input data from active remote sensing instruments and numerical weather prediction models, Atmos. Meas. Tech., 17, 3933–3948, https://doi.org/10.5194/amt-17-3933-2024, 2024.
Bodeker, G. E., Bojinski, S., Cimini, D., Dirksen, R. J., Haeffelin, M., Hannigan, J. W., Hurst, D., Madonna, F., Maturilli, M., Mikalsen, A. C., Philipona, R., Reale, T., Seidel, D. J., Tan, D. G. H., Thorne, P. W., Vömel, H., and Wang, J.: Reference upper-air observations for climate: From concept to reality, B. Am. Meteorol. Soc., 97, 123–135, https://doi.org/10.1175/BAMS-D-14-00072.1, 2015.
Bony, S., Stevens, B., Ament, F., Bigorre, S., Chazette, P., Crewell, S., Delanoë, J., Emanuel, K., Farrell, D., Flamant, C., Gross, S., Hirsch, L., Karstensen, J., Mayer, B., Nuijens, L., Ruppert, J. H., Sandu, I., Siebesma, P., Speich, S., Szczap, F., Totems, J., Vogel, R., Wendisch, M., and Wirth, M.: EUREC4A: A Field Campaign to Elucidate the Couplings Between Clouds, Convection and Circulation, Surv. Geophys., 38, 1529–1568, https://doi.org/10.1007/s10712-017-9428-0, 2017.
Borvarán, D., Peña A., and Gandoin R.: Characterization of offshore vertical wind shear conditions in Southern New England, Wind Energy, 24, 465–480, https://doi.org/10.1002/we.2583, 2021.
Cadeddu, M., Gibler, G., and Tuftedal, M.: Microwave Radiometer Profiler (MWRP), 2019-01-01 to 2019-03-15, Eastern North Atlantic (ENA), Graciosa Island, Azores, Portugal (C1), ARM Data Center [data set], http://dx.doi.org/10.5439/1025254, 2014 (updated hourly).
Cadeddu, M. P., Liljegren, J. C., and Turner, D. D.: The Atmospheric radiation measurement (ARM) program network of microwave radiometers: instrumentation, data, and retrievals, Atmos. Meas. Tech., 6, 2359–2372, https://doi.org/10.5194/amt-6-2359-2013, 2013.
Cao, Y., Shi, B., Zhao, X., Yang, T., and Min, J.: Direct Assimilation of Ground-Based Microwave Radiometer Clear-Sky Radiance Data and Its Impact on the Forecast of Heavy Rainfall, Remote Sens., 15, 4314, https://doi.org/10.3390/rs15174314, 2023.
Caumont, O., Cimini, D., Löhnert, U., Alados-Arboledas, L., Bleisch, R., Buffa, F., Ferrario, M. E., Haefele, A., Huet T., Madonna F., and Pace G.: Assimilation of humidity and temperature observations retrieved from ground-based microwave radiometers into a convective-scale model, Q. J. Roy. Meteor. Soc., 142, 2692–2704, https://doi.org/10.1002/qj.2860, 2016.
Cimini, D., Shaw J. A., Han Y., Westwater E. R., Irisov V., Leuski V., and Churnside J. H.: Air temperature profile and air-sea temperature difference measurements by infrared and microwave scanning radiometers, Radio Sci., 38, 8045, https://doi.org/10.1029/2002RS002632, 2003.
Cimini, D., Hewison, T. J., Martin, L., Güldner, J., Gaffard, C., and Marzano, F. S.: Temperature and humidity profile retrievals from ground-based microwave radiometers during TUC, Meteorol. Z., 15, 45–56, https://doi.org/10.1127/0941-2948/2006/0099, 2006.
Cimini, D., Nelson, M., Güldner, J., and Ware, R.: Forecast indices from a ground-based microwave radiometer for operational meteorology, Atmos. Meas. Tech., 8, 315–333, https://doi.org/10.5194/amt-8-315-2015, 2015.
Cimini, D., Haeffelin, M., Kotthaus, S., Löhnert, U., Martinet, P., O'Connor, E., Walden, C., Collaud Coen, M., and Preissler, J.: Towards the profiling of the atmospheric boundary layer at European scale–introducing the COST Action PROBE, Bull. Atmos. Sci. Technol. 1, 23–42, https://doi.org/10.1007/s42865-020-00003-8, 2020.
de Montera, L., Berger, H., Husson, R., Appelghem, P., Guerlou, L., and Fragoso, M.: High-resolution offshore wind resource assessment at turbine hub height with Sentinel-1 synthetic aperture radar (SAR) data and machine learning, Wind Energ. Sci., 7, 1441–1453, https://doi.org/10.5194/wes-7-1441-2022, 2022.
Dirksen, R. J., Sommer, M., Immler, F. J., Hurst, D. F., Kivi, R., and Vömel, H.: Reference quality upper-air measurements: GRUAN data processing for the Vaisala RS92 radiosonde, Atmos. Meas. Tech., 7, 4463–4490, https://doi.org/10.5194/amt-7-4463-2014, 2014.
Doktorowski, T.: Improvement of retrieval algorithms for determining temperature profiles over the Atlantic, Master Thesis, Leipzig Institute for Meteorology University of Leipzig, https://doi.org/10.5281/zenodo.15336695, February 2017.
Dutch Offshore Wind Atlas (DOWA): https://www.dutchoffshorewindatlas.nl/ (last access: 7 March 2021), 2021.
Engelmann, R., Ansmann, A., Ohneiser, K., Griesche, H., Radenz, M., Hofer, J., Althausen, D., Dahlke, S., Maturilli, M., Veselovskii, I., Jimenez, C., Wiesen, R., Baars, H., Bühl, J., Gebauer, H., Haarig, M., Seifert, P., Wandinger, U., and Macke, A.: Wildfire smoke, Arctic haze, and aerosol effects on mixed-phase and cirrus clouds over the North Pole region during MOSAiC: an introduction, Atmos. Chem. Phys., 21, 13397–13423, https://doi.org/10.5194/acp-21-13397-2021, 2021.
Feltz, W. F., Smith, W. L., Howell, H. B., Knuteson, R. O., Woolf, H., and Revercomb, H. E.: Near-Continuous Profiling of Temperature, Moisture, and Atmospheric Stability Using the Atmospheric Emitted Radiance Interferometer (AERI), J. Appl. Meteorol., 42, 584–597, https://doi.org/10.1175/1520-0450(2003)042<0584:NPOTMA>2.0.CO;2, 2003.
Foken, T.: 50 Years of the Monin–Obukhov Similarity Theory, Bound.-Lay. Meteorol., 119, 431–447, https://doi.org/10.1007/s10546-006-9048-6, 2006.
Grachev, A. A. and Fairall, C. W.: Dependence of the Monin–Obukhov Stability Parameter on the Bulk Richardson Number over the Ocean, J. Appl. Meteorol., 36, 406–414, https://doi.org/10.1175/1520-0450(1997)036<0406:DOTMOS>2.0.CO;2, 1997.
Griesche, H. J., Seifert, P., Ansmann, A., Baars, H., Barrientos Velasco, C., Bühl, J., Engelmann, R., Radenz, M., Zhenping, Y., and Macke, A.: Application of the shipborne remote sensing supersite OCEANET for profiling of Arctic aerosols and clouds during Polarstern cruise PS106, Atmos. Meas. Tech., 13, 5335–5358, https://doi.org/10.5194/amt-13-5335-2020, 2020.
Gryning, S. E., Batchvarova, E., Brümmer, B., Jørgensen, H., and Larsen, S.: On the extension of the wind profile over homogeneous terrain beyond the surface boundary layer, Bound.-Lay. Meteorol., 124, 251–268, https://doi.org/10.1007/s10546-007-9166-9, 2007.
Güldner, J. and Spänkuch, D.: Remote Sensing of the Thermodynamic State of the Atmospheric Boundary Layer by Ground-Based Microwave Radiometry, J. Atmos. Ocean. Tech., 18, 925–933, https://doi.org/10.1175/1520-0426(2001)018<0925:RSOTTS>2.0.CO;2, 2001.
Hansen, K. S., Barthelmie, R. J., Jensen, L. E., and Sommer, A.: The impact of turbulence intensity and atmospheric stability on power deficits due to wind turbine wakes at Horns Rev wind farm, Wind Energy, 15, 183–196, https://doi.org/10.1002/we.512, 2012.
Hersbach, H., Bell, B., Berrisford, P., Hirahara, S., Horányi, A., Muñoz-Sabater, J., Nicolas, J., Peubey, C., Radu, R., Schepers, D., Simmons, A., Soci, C., Abdalla, S., Abellan, X., Balsamo, G., Bechtold, P., Biavati, G., Bidlot, J., Bonavita, M., De Chiara, G., Dahlgren, P., Dee, D., Diamantakis, M., Dragani, R., Flemming, J., Forbes, R., Fuentes, M., Geer, A., Haimberger, L., Healy, S., Hogan, R. J., Hólm, E., Janisková, M., Keeley, S., Laloyaux, P., Lopez, P., Lupu, C., Radnoti, G., de Rosnay, P., Rozum, I., Vamborg, F., Villaume, S., and Thépaut, J.-N.: The ERA5 global reanalysis, Q. J. Roy. Meteor. Soc., 146, 1999–2049, https://doi.org/10.1002/qj.3803, 2020.
Hersbach, H., Bell, B., Berrisford, P., Biavati, G., Horányi, A., Muñoz Sabater, J., Nicolas, J., Peubey, C., Radu, R., Rozum, I., Schepers, D., Simmons, A., Soci, C., Dee, D., and Thépaut, J.-N.: ERA5 hourly data on single levels from 1940 to present. Copernicus Climate Change Service (C3S) Climate Data Store (CDS), https://doi.org/10.24381/cds.adbb2d47, 2023.
Hervo, M., Romanens, G., Martucci, G., Weusthoff, T., and Haefele, A.: Evaluation of an Automatic Meteorological Drone Based on a 6-Month Measurement Campaign, Atmosphere, 14, 1382, https://doi.org/10.3390/atmos14091382, 2023.
Illingworth, A. J., Hogan, R. J., O'Connor, E. J., Bouniol, D., Brooks, M. E., Delanoé, J., Donovan, D. P., Eastment, J. D., Gaussiat, N., Goddard, J. W. F., Haeffelin, M., Klein Baltink, H., Krasnov, O. A., Pelon, J., Piriou, J.-M., Protat, A., Russchenberg, H. W. J., Seifert, A., Tompkins, A. M., van Zadelhoff, G.-J., Vinit, F., Willén, U., Wilson, D. R., and Wrench, C. L.: Continuous evaluations of cloud profiles in seven operational models using ground-based observations, B. Am. Meteorol. Soc., 88, 883–898, https://doi.org/10.1175/BAMS-88-6-883, 2007.
Keeler, E. and Kyrouac, J.: Balloon-Borne Sounding System (SONDEWNPN), 2018-12-31 to 2019-03-16, Eastern North Atlantic (ENA) Graciosa Island, Azores, Portugal (C1), ARM Data Center [data set], https://doi.org/10.5439/1021460, 2013 (updated hourly).
Kotthaus, S., Bravo-Aranda, J. A., Collaud Coen, M., Guerrero-Rascado, J. L., Costa, M. J., Cimini, D., O'Connor, E. J., Hervo, M., Alados-Arboledas, L., Jiménez-Portaz, M., Mona, L., Ruffieux, D., Illingworth, A., and Haeffelin, M.: Atmospheric boundary layer height from ground-based remote sensing: a review of capabilities and limitations, Atmos. Meas. Tech., 16, 433–479, https://doi.org/10.5194/amt-16-433-2023, 2023.
Laj, P., Myhre, C. L., Riffault, V., Amiridis, V., Fuchs, H., Eleftheriadis, K., Petäjä, T., Salameh, T., Kivekäs, N., Juurola, E., Saponaro, G., Philippin, S., Cornacchia, C., Alados Arboledas, L., Baars, H., Claude, A., De Mazière, M., Dils, B., Dufresne, M., Evangeliou, N., Favez, O., Fiebig, M., Haeffelin, M., Herrmann, H., Höhler, K., Illmann, N., Kreuter, A., Ludewig, E., Marinou, E., Möhler, O., Mona, L., Murberg, L. E., Nicolae, D., Novelli, A., O’Connor, E., Ohneiser, K., Petracca Altieri, R. M., Picquet-Varrault, B., van Pinxteren, D., Pospichal, B., Putaud, J.-P., Reimann, S., Siomos, N., Stachlewska, I., Tillmann, R., Voudouri, K. A., Wandinger, U., Wiedensohler, A., Apituley, A., Comerón, A., Gysel-Beer, M., Mihalopoulos, N., Nikolova, N., Pietruczuk, A., Sauvage, S., Sciare, J., Skov, H., Svendby, T., Swietlicki, E., Tonev, D., Vaughan, G., Zdimal, V., Baltensperger, U., Doussin, J.-F., Kulmala, M., Pappalardo, G., Sorvari Sundet, S., and Vana, M.: Aerosol, Clouds and Trace Gases Research Infrastructure (ACTRIS): The European Research Infrastructure Supporting Atmospheric Science, B. Am. Meteorol. Soc., 105, E1098–E1136, https://doi.org/10.1175/BAMS-D-23-0064.1, 2024..
Lin, H., Sun, J., Weckwerth, T. M., Joseph, E., and Kay, J., Assimilation of New York State Mesonet Surface and Profiler Data for the 21 June 2021 Convective Event, Mon. Weather Rev., 151, 485–507, https://doi.org/10.1175/MWR-D-22-0136.1, 2023.
Löhnert, U. and Maier, O.: Operational profiling of temperature using ground-based microwave radiometry at Payerne: prospects and challenges, Atmos. Meas. Tech., 5, 1121–1134, https://doi.org/10.5194/amt-5-1121-2012, 2012.
Lundtang Petersen, E., Troen, I., Ejsing Jørgensen, H., and Mann, J.: The new European wind atlas, Energy Bulletin, 17, 34–39, https://findit.dtu.dk/en/catalog/545a3b7565e560f358000074 (last access: 2 May 2025), 2014.
Madonna, F., Kivi, R., Dupont, J.-C., Ingleby, B., Fujiwara, M., Romanens, G., Hernandez, M., Calbet, X., Rosoldi, M., Giunta, A., Karppinen, T., Iwabuchi, M., Hoshino, S., von Rohden, C., and Thorne, P. W.: Use of automatic radiosonde launchers to measure temperature and humidity profiles from the GRUAN perspective, Atmos. Meas. Tech., 13, 3621–3649, https://doi.org/10.5194/amt-13-3621-2020, 2020.
Martinet, P., Cimini, D., De Angelis, F., Canut, G., Unger, V., Guillot, R., Tzanos, D., and Paci, A.: Combining ground-based microwave radiometer and the AROME convective scale model through 1DVAR retrievals in complex terrain: an Alpine valley case study, Atmos. Meas. Tech., 10, 3385–3402, https://doi.org/10.5194/amt-10-3385-2017, 2017.
Martinet, P., Cimini, D., Burnet, F., Ménétrier, B., Michel, Y., and Unger, V.: Improvement of numerical weather prediction model analysis during fog conditions through the assimilation of ground-based microwave radiometer observations: a 1D-Var study, Atmos. Meas. Tech., 13, 6593–6611, https://doi.org/10.5194/amt-13-6593-2020, 2020.
Martinet, P., Unger, V., Burnet, F., Georgis, J.-F., Hervo, M., Huet, T., Löhnert, U., Miller, E., Orlandi, E., Price, J., Schröder M., and Thomas G.: A dataset of temperature, humidity, and liquid water path retrievals from a network of ground-based microwave radiometers dedicated to fog investigation, Bulletin of Atmospheric Science and Technology, 3, 6, https://doi.org/10.1007/s42865-022-00049-w, 2022.
Meloni, D., Di Iorio, T., di Sarra, A. Iaccarino, A., Pace, G., Mevi, G., Muscari, G., Cacciani, M., and Gröbner, J.: The July 2016 Study of the water VApour in the polar AtmosPhere (SVAAP) campaign at Thule, Greenland: surface radiation budget and role of clouds, EGU General Assembly, Vienna, Austria, 23–28 April 2017, EGU2017-8921-1, https://meetingorganizer.copernicus.org/EGU2017/EGU2017-8921-1.pdf (last access: 2 May 2025), 2017.
Neisser, J., Adam, W., Beyrich, F., Leiterer, U., and Steinhagen, H.: Atmospheric boundary layer monitoring at the Meteorological Observatory Lindenberg as a part of the “Lindenberg Column”: Facilities and selected results, Meteorol. Z., 11, 241–253, https://doi.org/10.1127/0941-2948/2002/0011-0241, 2002.
New European Wind Atlas (NEWA): http://www.neweuropeanwindatlas.eu/ (last access: 7 March 2021), 2021.
Obukhov, A. M.: Turbulence in an atmosphere with a non-uniform temperature, Bound.-Lay. Meteorol., 2, 7–29, https://doi.org/10.1007/BF00718085, 1971.
Pace, G., Di Iorio, T., di Sarra, A., Iaccarino, A., Meloni, D., Mevi, G., Muscari, G., and Cacciani M.: Microwave measurements of temperature profiles, integrated water vapour, and liquid water path at Thule Air Base, Greenland, EGU General Assembly, Vienna, Austria, 23–28 April 2017, EGU2017-10226, https://meetingorganizer.copernicus.org/EGU2017/EGU2017-10226-1.pdf (last access: 2 May 2025), 2017.
Pace, G., di Sarra, A., Cali Quaglia, F., Ciardini, V., Di Iorio, T., Iaccarino, A., Meloni, D., Muscari, G., and Scarchilli, C.: Verification of parameterizations for clear sky downwelling longwave irradiance in the Arctic, Atmos. Meas. Tech., 17, 1617–1632, https://doi.org/10.5194/amt-17-1617-2024, 2024.
Peña, A. and Hahmann, A. N.: Atmospheric stability and turbulence fluxes at Horns Rev – an intercomparison of sonic, bulk and WRF model data, Wind Energy, 15, 717–731, https://doi.org/10.1002/we.500, 2012.
Peña, A., Gryning, S. E., and Hasager, C. B.: Measurements and Modelling of the Wind Speed Profile in the Marine Atmospheric Boundary Layer, Bound.-Lay. Meteorol., 129, 479–495, https://doi.org/10.1007/s10546-008-9323-9, 2008.
Pérez, C., Rivero, M., Escalante, M., Ramirez, V., and Guilbert, D.: Influence of Atmospheric Stability on Wind Turbine Energy Production: A Case Study of the Coastal Region of Yucatan, Energies, 16, 4134, https://doi.org/10.3390/en16104134, 2023.
Platis, A., Bange J., Barfuss, K., Canadillas, B., Hundhausen, M., Djath, B., Lampert, A., Schulz-Stellenfleth, J., Siedersleben, S., Neumann, T., and Emeis, S., Long-range modifications of the wind field by offshore wind parks – results of the project WIPAFF, Meteorol. Z., 29, 355–376, https://doi.org/10.1127/metz/2020/1023, 2020.
Pinto, J. O., O’Sullivan, D., Taylor, S., Elston, J., Baker, C. B., Hotz, D., Marshall, C., Jacob, J., Barfuss, K., Piguet, B., Roberts, G., Omanovic, N., Fengler, M., Jensen, A. A., Steiner, M., and Houston, A. L.: The Status and Future of Small Uncrewed Aircraft Systems (UAS) in Operational Meteorology, B. Am. Meteorol. Soc., 102, E2121–E2136, https://doi.org/10.1175/BAMS-D-20-0138.1, 2021.
Rüfenacht, R., Haefele, A., Pospichal, B., Cimini, D., Bircher-Adrot, S., Turp, M., and Sugier, J,: EUMETNET opens to microwave radiometers for operational thermodynamical profiling in Europe, Bull. Atmos. Sci. Technol. 2, 4, https://doi.org/10.1007/s42865-021-00033-w, 2021.
Sandu, I., Beljaars, A., Bechtold, P., Mauritsen, T., and Balsamo, G.: Why is it so difficult to represent stably stratified conditions in numerical weather prediction (NWP) models?, J. Adv. Model. Earth Sy., 5, 117–133, https://doi.org/10.1002/jame.20013, 2013.
Sathe, A., Gryning, S.-E., and Peña, A.: Comparison of the atmospheric stability and wind profiles at two wind farm sites over a long marine fetch in the North Sea, Wind Energy, 14, 767–780, https://doi.org/10.1002/we.456, 2011.
Schnitt, S., Foth, A., Kalesse-Los, H., Mech, M., and Acquistapace, C.: Ground- and ship-based microwave radiometer measurements during EUREC4A, Aeris [data set], https://doi.org/10.25326/454, 2023.
Schnitt, S., Foth, A., Kalesse-Los, H., Mech, M., Acquistapace, C., Jansen, F., Löhnert, U., Pospichal, B., Röttenbacher, J., Crewell, S., and Stevens, B.: Ground- and ship-based microwave radiometer measurements during EUREC4A, Earth Syst. Sci. Data, 16, 681–700, https://doi.org/10.5194/essd-16-681-2024, 2024.
Shaw, W. J., Berg, L. K., Cline, J., Draxl, C., Djalalova, I., Grimit, E. P., Lundquist, J. K., Marquis, M., McCaa, J., Olson, J. B., Sivaraman, C., Sharp, J., and Wilczak, J. M.: The Second Wind Forecast Improvement Project (WFIP2): General overview, B. Am. Meteorol. Soc., 100, 1687–1699, https://doi.org/10.1175/BAMS-D-18-0036.1, 2019.
Shrestha, B., Brotzge, J. A., Wang, J., Bain, N., Thorncroft, C. D., Joseph, E., Freedman, J., and Perez, S.: Overview and Applications of the New York State Mesonet Profiler Network, J. Appl. Meteor. Clim., 60, 1591–1611, https://doi.org/10.1175/JAMC-D-21-0104.1, 2021.
Spiridonov, V. and Ćurić, M.: Atmospheric Stability, in: Fundamentals of Meteorology, Springer, Cham, ISBN 978-3-030-52655-9, https://doi.org/10.1007/978-3-030-52655-9_9, 2021.
Stephan, C.: Radiosonde measurements from the EUREC4A field campaign (v3.0.0), Aeris [data set], https://doi.org/10.25326/137, 2020.
Stephan, C. C., Schnitt, S., Schulz, H., Bellenger, H., de Szoeke, S. P., Acquistapace, C., Baier, K., Dauhut, T., Laxenaire, R., Morfa-Avalos, Y., Person, R., Quiñones Meléndez, E., Bagheri, G., Böck, T., Daley, A., Güttler, J., Helfer, K. C., Los, S. A., Neuberger, A., Röttenbacher, J., Raeke, A., Ringel, M., Ritschel, M., Sadoulet, P., Schirmacher, I., Stolla, M. K., Wright, E., Charpentier, B., Doerenbecher, A., Wilson, R., Jansen, F., Kinne, S., Reverdin, G., Speich, S., Bony, S., and Stevens, B.: Ship- and island-based atmospheric soundings from the 2020 EUREC4A field campaign, Earth Syst. Sci. Data, 13, 491–514, https://doi.org/10.5194/essd-13-491-2021, 2021.
Stevens, B., Bony, S., Farrell, D., Ament, F., Blyth, A., Fairall, C., Karstensen, J., Quinn, P. K., Speich, S., Acquistapace, C., Aemisegger, F., Albright, A. L., Bellenger, H., Bodenschatz, E., Caesar, K.-A., Chewitt-Lucas, R., de Boer, G., Delanoë, J., Denby, L., Ewald, F., Fildier, B., Forde, M., George, G., Gross, S., Hagen, M., Hausold, A., Heywood, K. J., Hirsch, L., Jacob, M., Jansen, F., Kinne, S., Klocke, D., Kölling, T., Konow, H., Lothon, M., Mohr, W., Naumann, A. K., Nuijens, L., Olivier, L., Pincus, R., Pöhlker, M., Reverdin, G., Roberts, G., Schnitt, S., Schulz, H., Siebesma, A. P., Stephan, C. C., Sullivan, P., Touzé-Peiffer, L., Vial, J., Vogel, R., Zuidema, P., Alexander, N., Alves, L., Arixi, S., Asmath, H., Bagheri, G., Baier, K., Bailey, A., Baranowski, D., Baron, A., Barrau, S., Barrett, P. A., Batier, F., Behrendt, A., Bendinger, A., Beucher, F., Bigorre, S., Blades, E., Blossey, P., Bock, O., Böing, S., Bosser, P., Bourras, D., Bouruet-Aubertot, P., Bower, K., Branellec, P., Branger, H., Brennek, M., Brewer, A., Brilouet , P.-E., Brügmann, B., Buehler, S. A., Burke, E., Burton, R., Calmer, R., Canonici, J.-C., Carton, X., Cato Jr., G., Charles, J. A., Chazette, P., Chen, Y., Chilinski, M. T., Choularton, T., Chuang, P., Clarke, S., Coe, H., Cornet, C., Coutris, P., Couvreux, F., Crewell, S., Cronin, T., Cui, Z., Cuypers, Y., Daley, A., Damerell, G. M., Dauhut, T., Deneke, H., Desbios, J.-P., Dörner, S., Donner, S., Douet, V., Drushka, K., Dütsch, M., Ehrlich, A., Emanuel, K., Emmanouilidis, A., Etienne, J.-C., Etienne-Leblanc, S., Faure, G., Feingold, G., Ferrero, L., Fix, A., Flamant, C., Flatau, P. J., Foltz, G. R., Forster, L., Furtuna, I., Gadian, A., Galewsky, J., Gallagher, M., Gallimore, P., Gaston, C., Gentemann, C., Geyskens, N., Giez, A., Gollop, J., Gouirand, I., Gourbeyre, C., de Graaf, D., de Groot, G. E., Grosz, R., Güttler, J., Gutleben, M., Hall, K., Harris, G., Helfer, K. C., Henze, D., Herbert, C., Holanda, B., Ibanez-Landeta, A., Intrieri, J., Iyer, S., Julien, F., Kalesse, H., Kazil, J., Kellman, A., Kidane, A. T., Kirchner, U., Klingebiel, M., Körner, M., Kremper, L. A., Kretzschmar, J., Krüger, O., Kumala, W., Kurz, A., L'Hégaret, P., Labaste, M., Lachlan-Cope, T., Laing, A., Landschützer, P., Lang, T., Lange, D., Lange, I., Laplace, C., Lavik, G., Laxenaire, R., Le Bihan, C., Leandro, M., Lefevre, N., Lena, M., Lenschow, D., Li, Q., Lloyd, G., Los, S., Losi, N., Lovell, O., Luneau, C., Makuch, P., Malinowski, S., Manta, G., Marinou, E., Marsden, N., Masson, S., Maury, N., Mayer, B., Mayers-Als, M., Mazel, C., McGeary, W., McWilliams, J. C., Mech, M., Mehlmann, M., Meroni, A. N., Mieslinger, T., Minikin, A., Minnett, P., Möller, G., Morfa Avalos, Y., Muller, C., Musat, I., Napoli, A., Neuberger, A., Noisel, C., Noone, D., Nordsiek, F., Nowak, J. L., Oswald, L., Parker, D. J., Peck, C., Person, R., Philippi, M., Plueddemann, A., Pöhlker, C., Pörtge, V., Pöschl, U., Pologne, L., Posyniak, M., Prange, M., Quiñones Meléndez, E., Radtke, J., Ramage, K., Reimann, J., Renault, L., Reus, K., Reyes, A., Ribbe, J., Ringel, M., Ritschel, M., Rocha, C. B., Rochetin, N., Röttenbacher, J., Rollo, C., Royer, H., Sadoulet, P., Saffin, L., Sandiford, S., Sandu, I., Schäfer, M., Schemann, V., Schirmacher, I., Schlenczek, O., Schmidt, J., Schröder, M., Schwarzenboeck, A., Sealy, A., Senff, C. J., Serikov, I., Shohan, S., Siddle, E., Smirnov, A., Späth, F., Spooner, B., Stolla, M. K., Szkółka, W., de Szoeke, S. P., Tarot, S., Tetoni, E., Thompson, E., Thomson, J., Tomassini, L., Totems, J., Ubele, A. A., Villiger, L., von Arx, J., Wagner, T., Walther, A., Webber, B., Wendisch, M., Whitehall, S., Wiltshire, A., Wing, A. A., Wirth, M., Wiskandt, J., Wolf, K., Worbes, L., Wright, E., Wulfmeyer, V., Young, S., Zhang, C., Zhang, D., Ziemen, F., Zinner, T., and Zöger, M.: EUREC4A, Earth Syst. Sci. Data, 13, 4067–4119, https://doi.org/10.5194/essd-13-4067-2021, 2021.
St. Martin, C. M., Lundquist, J. K., Clifton, A., Poulos, G. S., and Schreck, S. J.: Wind turbine power production and annual energy production depend on atmospheric stability and turbulence, Wind Energ. Sci., 1, 221–236, https://doi.org/10.5194/wes-1-221-2016, 2016.
Stull, R. B.: An introduction to boundary layer meteorology, Springer Science & Business Media, 13, ISBN 978-90-277-2768-8, https://doi.org/10.1007/978-94-009-3027-8, 2012.
Stull, R. B.: Practical Meteorology: An Algebra-based Survey of Atmospheric Science, version 1.02b, Univ. of British Columbia. 940 pages, ISBN 978-0-88865-283-6, https://www.eoas.ubc.ca/books/Practical_Meteorology/ (last access: 16 December 2021), 2017.
Thomas, G., Martinet, P., Brousseau, P., Chambon, P., Georgis, J-F., Hervo, M., Huet, T., Löhnert, U., Orlandi, E., and Unger, V.: Assimilation of ground-based microwave radiometer temperature observations into a convective-scale NWP model for fog forecast improvement, Q. J. Roy. Meteor. Soc., 151, e4893, https://doi.org/10.1002/qj.4893, 2024.
Turner, D. D. and Löhnert, U.: Ground-based temperature and humidity profiling: combining active and passive remote sensors, Atmos. Meas. Tech., 14, 3033–3048, https://doi.org/10.5194/amt-14-3033-2021, 2021.
Vanderwende, B. and Lundquist, J. K.: The modification of wind turbine performance by statistically distinct atmospheric regimes, Environ. Res. Lett., 7, 1–7, https://doi.org/10.1088/1748-9326/7/3/034035, 2012.
Vural, J., Merker, C., Löffler, M., Leuenberger, D., Schraff, C., Stiller, O., Schomburg, A., Knist, C., Haefele, A., and Hervo, M.: Improving the representation of the atmospheric boundary layer by direct assimilation of ground-based microwave radiometer observations, Q. J. Roy. Meteor. Soc., 150, 1012–1028, https://doi.org/10.1002/qj.4634, 2023.
Yan, H., Zhao, Y., and Chen S., An Improved 1D-VAR Retrieval Algorithm of Temperature Profiles from an Ocean-Based Microwave Radiometer, Journal of Marine Science and Engineering, 10, 641, https://doi.org/10.3390/jmse10050641, 2022.
Wagner, T. J., Czarnetzki, A. C., Christiansen, M., Pierce, R. B., Stanier, C. O., Dickens, A. F., and Eloranta, E. W.: Observations of the Development and Vertical Structure of the Lake-Breeze Circulation during the 2017 Lake Michigan Ozone Study, J. Atmos. Sci., 79, 1005–1020, https://doi.org/10.1175/JAS-D-20-0297.1, 2022.
Wijnant, I. L., van Ulft, B., van Stratum, B. J. H., Barkmeijer, J., Onvlee, J., de Valk, S., Knoop, S., Kok, S., Marseille, G. J., Klein Baltink, H., and Stepek, A.: The Dutch offshore wind atlas (DOWA): description of the dataset, KNMI Technical report TR-380, https://www.dutchoffshorewindatlas.nl/publications (last access: 23 August 2024), 2019.
Wilczak, J. M., Wilczak, J., Finley, C., Freedman, J., Cline, J., Bianco, L., Olson, J., Djalalova, I., Sheridan, L., Ahlstrom, M., Manobianco, J., Zack, J., Carley, J. R., Benjamin, S., Coulter, R., Berg, L. K., Mirocha, J., Clawson, K., Natenberg, E., and Marquis, M.: The Wind Forecast Improvement Project (WFIP): A public–private partnership addressing wind energy forecast needs, B. Am. Meteorol. Soc., 96, 1699–1718, https://doi.org/10.1175/BAMS-D-14-00107.1, 2015.
Wilczak, J. M., Stoelinga, M., Berg, L. K., Sharp, J., Draxl, C., McCaffrey, K., Banta, R. M., Bianco, L., Djalalova, I., Lundquist, J. K., Muradyan, P., Choukulkar, A., Leo, L., Bonin, T., Pichugina, Y., Eckman, R., Long, C. N., Lantz, K., Worsnop, R. P., Bickford, J., Bodini, N., Chand, D., Clifton, A., Cline, J., Cook, D. R., Fernando, H. J. S., Friedrich, K., Krishnamurthy, R., Marquis, M., McCaa, J., Olson, J. B., Otarola-Bustos, S., Scott, G., Shaw, W. J., Wharton, S., and White, A. B.: The Second Wind Forecast Improvement Project (WFIP2): Observational Field Campaign, B. Am. Meteorol. Soc., 100, 1701–1723, https://doi.org/10.1175/BAMS-D-18-0035.1, 2019.
Wolfe, D. E. and Lataitis, R. J.: Boulder Atmospheric Observatory: 1977–2016: The End of an Era and Lessons Learned, B. Am. Meteorol. Soc., 99, 1345–1358, https://doi.org/10.1175/BAMS-D-17-0054.1, 2018.
Walbröl, A., Crewell, S., Engelmann, R., Orlandi, E., Griesche, H., Radenz, M., Hofer, J., Althausen, D., Maturilli, M., and Ebell, K.: Atmospheric temperature, water vapour and liquid water path from two microwave radiometers during MOSAiC, Sci. Data, 9, 534, https://doi.org/10.1038/s41597-022-01504-1, 2022.
- Abstract
- Introduction
- Validity assessment of NWP datasets
- Datasets and methodology
- Validation
- Summary, conclusions, and outlook
- Code and data availability
- Author contributions
- Competing interests
- Disclaimer
- Special issue statement
- Acknowledgements
- Financial support
- Review statement
- References
- Supplement