the Creative Commons Attribution 4.0 License.
the Creative Commons Attribution 4.0 License.
 | 18 Jun 2025
A view on recent ice-nucleating particle intercomparison studies: why the uncertainty of the activation temperature matters
Heinz G. Bingemer
Ice-nucleating particles (INPs) play a crucial role in cloud formation, influencing cloud phase, lifetime, and the onset of precipitation. Consequently, microphysical processes involving INPs strongly affect the radiative properties of clouds. However, when multiple INP counters are operated simultaneously, notoriously high deviations between instruments in the range of 1 order of magnitude are commonly observed. These differences occur in ambient atmospheric measurements as well as in laboratory studies. A potential reason for these discrepancies that deserves more consideration may be related to uncertainties and errors in the temperature measurement. As the activation of INPs is a strong function of the nucleation conditions, relatively small inaccuracies in the temperature measurement may lead to significant over- or underestimations of the INP concentration. In this study, we have explored this effect as a potential reason for the differences observed among INP counters by analyzing 10 INP intercomparison studies that were published within the last 10 years with a novel quantitative estimate of the temperature uncertainty effect on heterogeneous ice nucleation. The stated temperature uncertainty of instruments used in these experiments ranged from ±0.1 to ±1.5 °C, and was most commonly specified as ±0.5 °C. Potential deviations resulting from typical temperature errors were compared with the reported level of agreement for intercompared methods. As a measure of the potential INP error due to nucleation temperature error, we defined the temperature error factor (TEF) as the quotient of the ice nucleation activity at the actual nucleation temperature divided by the ice nucleation activity at a potentially erroneously measured temperature. Respective TEFs were calculated for five distinct activation spectra based on four INP parameterizations and one compilation of atmospheric INP data. TEFs were between 1.1 and 3.2 for temperature errors of ±0.5 °C, and between less than 2 and larger than 10 for temperature errors of ±1.5 °C. TEFs calculated from parameterizations of aerosols that are highly ice nucleation active were significantly larger than those derived from atmospheric data; although the effect was found to be still as large as a factor of 10 for certain temperature ranges in atmospheric activation spectra at a temperature error of ±2 °C. When comparing two INP instruments, measurement biases may be of opposite direction, thus resulting in expected differences of up to the product of both TEFs. We found that opposite biases of +0.5 and −0.5 °C can therefore typically explain differences of a factor of 2, while opposite biases of +1 and −1 °C can theoretically explain differences of factors up to 5 or even 10, which is of the order of discrepancies typically reported in the literature on INP intercomparisons. These results highlight the need to carefully assess and report on uncertainties of the ice nucleation activation temperature.
- Article
(1532 KB) - Full-text XML
-
Supplement
(808 KB) - BibTeX
- EndNote


Ice-nucleating particles (INPs) have a significant effect on cloud microphysical processes, the formation of precipitation, cloud lifetime, and the radiative properties of clouds (e.g., Mülmenstädt et al., 2015; Lohmann et al., 2016; Kanji et al., 2017). In the mixed-phase cloud (MPC) regime the existence of INPs shifts the relative phase composition from liquid water to ice, as supercooled droplets evaporate and activated ice crystals grow at their expense according to the Wegener–Bergeron–Findeisen process (Wegener, 1911; Bergeron, 1928; Findeisen, 1938). As a consequence, the lifetime of ice-containing MPCs is reduced compared with warm clouds, as ice particles precipitate earlier due to the growth by subsequent condensation and riming (e.g., Pruppacher and Klett, 2010). Both the phase and lifetime of a cloud, in turn, influence the radiative properties of MPCs by decreasing the cooling effect when sufficient INPs are present (DeMott et al., 2010; Murray, 2017). In the cirrus regime, cloud icing is either initiated by heterogeneous or homogeneous ice nucleation depending on the availability of INPs and ambient conditions of temperature (T) and ice supersaturation (Sice). Heterogeneously formed cirrus clouds typically contain larger, but fewer, ice crystals than homogeneously formed cirrus clouds. Because cirrus clouds have a net warming effect, less dense cirrus clouds, which were formed by INP activation, are considered to have a weaker warming effect (DeMott et al., 2010; Murray, 2017). However, the relative importance of INPs for cirrus formation is still largely unknown (Kanji et al., 2017; Krämer et al., 2020), as there are currently very few studies that attempted to measure the atmospheric concentration of INPs below the homogeneous freezing limit (e.g., DeMott et al., 2003; Richardson et al., 2007; Wolf et al., 2020; Bogert, 2024).
INPs are operationally defined as particles that initiate heterogeneous ice nucleation, once characteristic conditions of supercooling and supersaturation are reached. Consequently, the measurement of INPs depend critically on these instrumental nucleation conditions, as well as on the detection and evolution of growing ice particles. These and other major measurement challenges, combined with the rare nature and high variability of INPs, adds complexity. As a result, the typical uncertainty of INP measurements is unfortunately still substantial compared with many other fields within atmospheric sciences. It is not uncommon to find discrepancies of up to 1 order of magnitude or higher, when several different instruments, in parallel, observe the atmospheric INP concentration of ambient air or determine the ice nucleation activity of a known substance in the laboratory. This still holds true, even when the same aerosol material is prepared and generated in the same laboratory. Recently, there have been a number of extensive endeavors to specifically intercompare INP instrumentation in the laboratory (e.g., DeMott et al., 2018) and in the field (e.g., DeMott et al., 2025; Lacher et al., 2024), resulting in mixed levels of agreement (see Sect. 2).
When evaluating the degree of consistency in instrument intercomparisons, the community mostly ascribes a reasonable or good agreement if INP concentration measurements fall within a factor of 10, or if the temperature spectra of two or more measurements generally follow a similar trend. However, what is often missing in these assessments is an evaluation of the implications of observed differences between instruments for modeling, specifically regarding how accurate and consistent measurements need to be in order to meaningfully improve the representation of cloud microphysical processes, precipitation, and radiative interactions in models (DeMott et al., 2025).
There are various reasons that might explain the differences in the INP concentration observed during an intercomparison, which may highly depend on the specific circumstances of the measurements. However, the disagreement between instruments usually arises from differences in aerosol sampling, from a mismatch in sampling time, and most seriously from incomplete overlap or inaccuracies in the instrumental activation conditions. For example, DeMott et al. (2018) point to temperature uncertainty being a key factor influencing the observed differences in INP concentration during the large-scale laboratory intercomparison of FIN-02 (Fifth International Workshop on Ice Nucleation – Phase 2). However, the quantitative effect of temperature uncertainty has not been fully considered in intercomparison studies thus far and deserves a more thorough investigation.
The number of activated INPs is known to be very sensitive to the activation conditions, i.e., the temperature for immersion freezing, and additionally the ice supersaturation, when measurements are performed below water saturation. This fact is, of course, well-established and is implemented in parameterizations of specific aerosol species (e.g., Atkinson et al., 2013; Hiranuma et al., 2015; Wex et al., 2015; Ullrich et al., 2017; Hiranuma et al., 2019) and natural atmospheric aerosol (e.g., Fletcher, 1962; DeMott et al., 2010, 2015). Compilations of INP observations as presented for example in Kanji et al. (2017) or Petters and Wright (2015) also feature this finding prominently, showing a distinct exponential increase in the INP concentration with decreasing nucleation temperature. For every 5 °C cooling, an increase in the INP concentration by factors between 2 and up to ∼ 50 can be observed in the atmosphere. Specific ice-active aerosols may even cause an increase of the INP activity of the order of a factor of up to 10 to 100 000 for biological material like Snomax or by a factor of a couple of hundreds for the most active mineral particle (i.e., K-feldspar) per 5 °C cooling. Consequently, comparably small changes in the activation temperature can lead to significant changes in the number of activated INPs. Although not the focus of this paper, similar conclusions can be drawn for the ice supersaturation. Therefore, if a bias δT or δSice exists between the true nucleation conditions Tn and Sice,n and the erroneously measured instrumental conditions Tm and Sice,m, respectively, the INP concentration may be substantially over- or underestimated. The relation between the actual nucleation conditions, the assumed nucleation conditions (which are either directly measured or calculated in some way), and the error in the nucleation conditions can be formulated as
The uncertainty in the activation conditions of INP instruments is sometimes only stated briefly in the methods sections of respective publications, or in the supplements, or in rarer cases not at all. Furthermore, a majority of figures showing results from INP measurements only entail error bars of the ordinate, representing the uncertainty of INP concentration (nINP), frozen fraction (FF), activated fraction (AF), or active site density by surface (ns) or mass (nm). The uncertainty in activation temperature and ice supersaturation is often not considered in the estimate of the INP uncertainty. However, errors in the activation conditions likely outweigh other factors contributing to the INP concentration uncertainty in many cases, as we will discuss in the following sections. The alternative would be to clearly indicate the activation uncertainties as separate temperature (or ice supersaturation) error bars corresponding to the abscissa. However, these are often missing in figures, usually in favor of clarity, or possibly sometimes because they might have been inadvertently misjudged as not as important.
In this study, we will focus on the magnitude, nature, and a potential cause of observed discrepancies between INP instruments running in parallel by quantitatively investigating the role of inherent instrument uncertainties in the activation temperature. First, we will review the literature of INP intercomparison measurements and compile the temperature uncertainties stated therein. Then we will estimate the effect of this temperature inaccuracy on the INP activity in relation to the differences actually observed in the intercomparisons.
We considered studies for our investigation that met all the following criteria:
- 1.
The study was published since 2015.
- 2.
The study presents either measurements of atmospheric INPs or an investigation of the ice nucleation activity of specific aerosol species in a laboratory setting.
- 3.
At least four individual instruments were used to determine the INP properties simultaneously, regardless of whether an intercomparison of instruments was set out as a prime objective of the study or not.
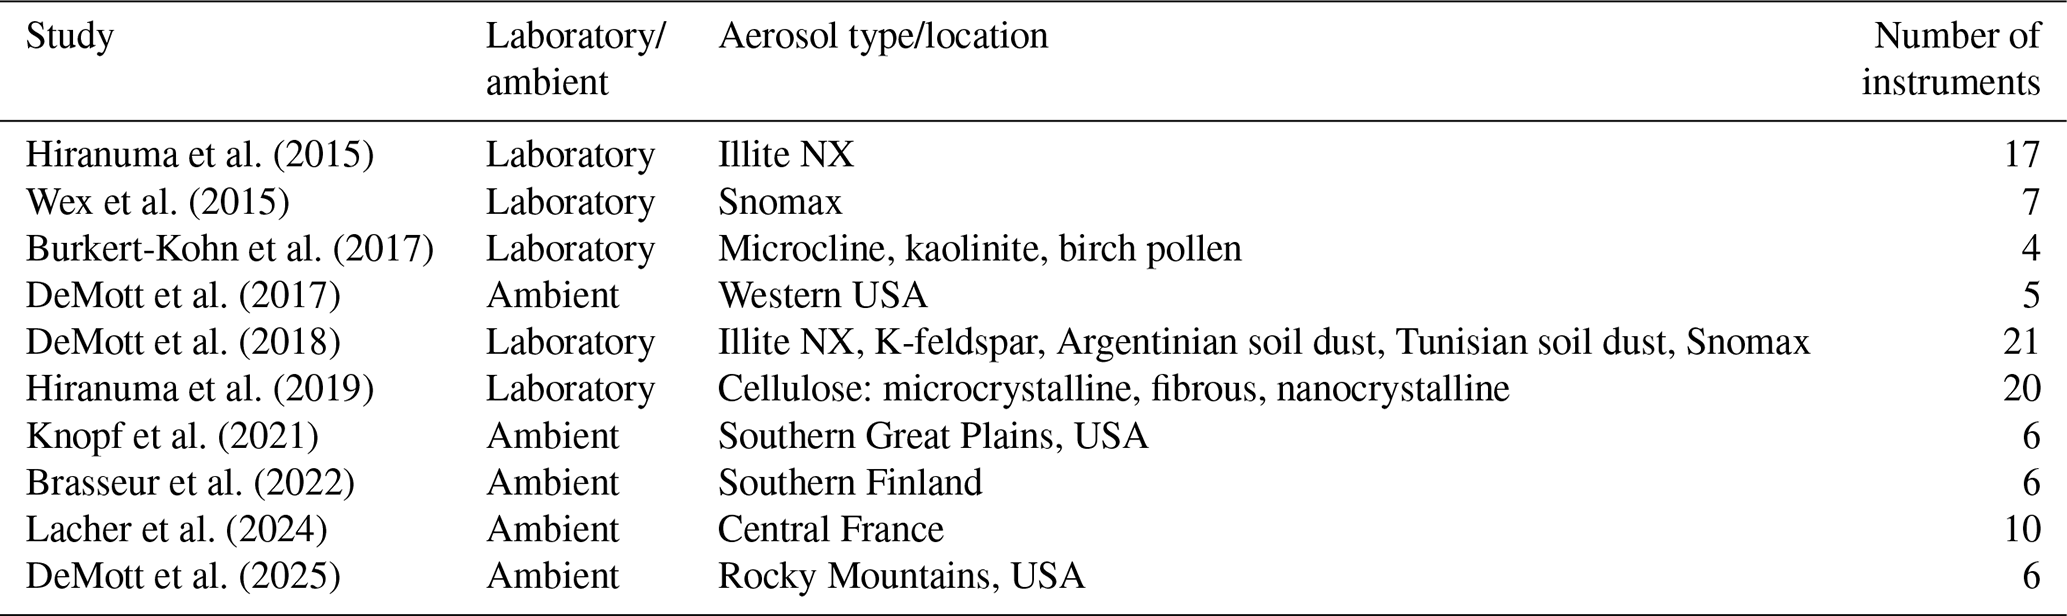
We identified 10 studies that met these criteria (Table 1). Since the literature research was conducted through a comprehensive review of available sources rather than by systematic use of specific search terms, it is possible, although rather unlikely, that we inadvertently missed studies that would have otherwise met the criteria. Table S1 in the Supplement lists the identified studies, the INP instruments used and their stated uncertainties in nucleation temperature (ΔT). If uncertainties were not reported in the original study or its associated supplement, distinctly referenced instrument papers were browsed for this information, assuming that the uncertainty assessment did not change. If the uncertainty of a method was also not reported in the method's referenced technical description, other sources, such as intercomparison studies, in which the method was used, were consulted. If no uncertainty was reported in the original study and there were deviating temperature uncertainty assessments from different referenced studies, the latest data were taken into account. When in doubt, the highest uncertainty reported was listed. Assessments of principally identical commercially available instruments (e.g., SPIN, SPectrometer for Ice Nuclei) of different institutes were assumed to be valid for other versions. Note, that the uncertainties stated in the studies at the time of publication may or may not reflect the current uncertainty of a specific instrument. If a specific instrument partook in multiple intercomparison studies, all entries are listed.
Table 1Identified INP intercomparison studies from 2015 to 2025.
From the 10 identified studies, a total of 104 temperature uncertainties are documented for 43 individual instruments. Although for the clear majority of cases temperature uncertainty was indicated, in more than one fifth of the cases (22/104) no estimate was given in the original study or its supplement. Some uncertainty estimates were not stated in absolutely unambiguous terms, but needed some interpretation (e.g., see footnotes of Table S1). Furthermore, six studies did not have any figures showing the temperature error, while the other four studies had only a minor subset of figures showing the temperature error.
While we naturally have confidence that groups carefully assess their respective temperature uncertainty to the best of their ability, most times uncertainty statements lacked a thorough description. More crucially, some estimates seemed to only account for sensor accuracy, while other factors relating to the total uncertainty were possibly not or not fully considered. Sometimes additional sources of temperature uncertainties were mentioned in writing, but no corresponding value was attributed.
For online processing chambers (e.g., continuous freezing diffusion chambers (CFDCs), the Portable Ice Nucleation Experiment (PINE)) experimental uncertainties in the activation conditions may generally be related to accuracy, drift, precision, and placement of the temperature (and humidity) sensor, and to the spatial and temporal variation of temperature (and humidity) within the chamber and during an experiment. For CFDCs, the spatial variation of the wall temperatures in relation to the resulting temperature profile in the laminar flow region seems to be the main factor of uncertainty, as stated by Castarède et al. (2023). For example, in the new Portable Ice Nucleation Chamber 2 (PINCii) 58 type-K thermocouples measuring at 1 Hz were specifically implemented to better resolve the spatial inhomogeneity of the temperature (Castarède et al., 2023). Despite their rigorous monitoring efforts, combined with a high number of coolant injection points in order to minimize temperature inhomogeneity, they concluded that improvements are still necessary. Garimella et al. (2017) highlighted that for CFDCs the fraction of particles in the laminar flow is often lower than theorized, and thus particles may be exposed to varying temperatures and humidities, which may be in strong contrast to the predicted activation conditions. DeMott et al. (2015, 2017, 2018) also raised this issue and surmised that the introduction of the air flow into the CFDC due to the specific instrument design could result in particles outside the laminar flow region, where temperature and humidity vary. Garimella et al. (2017) estimated that this may lead to systematic underestimation of the INP concentration by factors between 1.5 and 9.5, because in reality not all particles are activated to droplets, in contrast to what the assumed activation conditions would suggest.
For the cloud expansion-type chamber PINE, the inhomogeneous temperature distribution during an expansion is identified as the main contributor to the temperature uncertainty (Möhler et al., 2021). In an example experiment presented by Möhler et al. (2021) (their Fig. 6) three gas temperature sensors record a difference of about 2 °C from the warmer top to the colder bottom of the chamber during the start of an expansion. As the experiment progresses the deviation in temperature in the chamber further increases to up to 4 °C at the end of the expansion. Usually the coldest sensor at the bottom is assumed to be representative of the activation temperature and is therefore used when results are presented (e.g., Möhler et al., 2021; Knopf et al., 2021); this is a reasonable, but ultimately unverified assumption. When the cirrus regime is investigated in PINE-like instruments (e.g., PINEair, under construction for aircraft use) a step-wise rapid expansion is initiated by use of a buffer volume, followed by a continuous expansion (Bogert, 2024). It is observed that under these experimental settings the measured temperature significantly deviates from the calculated near-adiabatic temperature profile, as the sensors do not react fast enough to the adiabatic expansion and thus cannot be used to characterize the activation conditions (Bogert, 2024). Because the question of heterogeneous vs. homogenous freezing is of central importance in the cirrus regime, knowing the actual nucleation temperature and, as a result, the ice supersaturation is key to distinguish the freezing mechanism. In this regard, temperature uncertainties will significantly affect the uncertainty of the ice supersaturation in this low temperature regime.
Please note that the uncertainty of Sice was not examined in detail in this study, because most results from the identified studies investigated immersion freezing, where the relative humidity should be firmly above water saturation (with the exception of CFDCs not reaching an equivalent humidity needed to immerse all particles in some cases). However, when ice nucleation below the water saturated regime is investigated by deposition nucleation in the MPC or cirrus regime, the uncertainty of Sice may play a significant role in the overall instrument uncertainty. When reported, the range of stated uncertainties of Sice was between 1 % and 5 % relative humidity in the identified studies.
Droplet freezing cold stage (DFCS) instruments have ultimately the same general causes of temperature uncertainties as online processing chambers. The error in nucleation temperature depends on how accurate and how representative the measured temperature is. As surface temperature measurements (e.g., by infrared radiation) are typically more uncertain than spot measurements, mostly one or multiple point measurements are performed using various kinds of temperature sensor on the surface of or within the cold stage apparatus. Therefore, it is not straightforward to estimate the freezing temperature of an individual droplet, as the temperature measured may or may not be representative of the exact location on the cold stage where the freezing event occurred. The temperature homogeneity of a cold stage may also depend on the cooling rate, which may vary from some tenths of degrees Celsius per minute to 10 °C min−1. Heat exchange and latent heat released by freezing droplets may also affect the temperature measurement and the freezing behavior of other droplets. Additionally, the time resolution of the algorithm that identifies the freezing events from images or video should be considered for the temperature uncertainty. In the identified studies this time resolution was mentioned in some cases, but it was not included in the uncertainty estimates in Table S1, as it was not explicitly stated by any of the researchers. For example, DeMott et al. (2017) stated that NIPR-CRAFT (National Institute of Polar Research Cryogenic Refrigerator Applied to Freezing Test) analyzed video images at 0.5 °C intervals to determine the number of frozen droplets, while the indicated temperature uncertainty was only ±0.2 °C.
Figure 1a and b present the temperature uncertainties for individual instruments for each unique temperature assessment as a bar and box plot, respectively. If the uncertainty statement for a specific instrument changed over time, multiple bars or circle symbols are depicted in Fig. 1a and b, respectively. Similarly, multiple bars (or circle symbols) are shown for each physical copy of the same instrument, if they are affiliated with different institutes. The reported uncertainties for offline processing instruments (purple colors) tends to be lower (usually between ±0.2 and ±0.5 °C) than those from the more complex online processing instruments (blue colors), for which stated temperature uncertainties were typically between ±0.5 and ±1.5 °C. The median temperature uncertainty reported was ±0.5 °C.
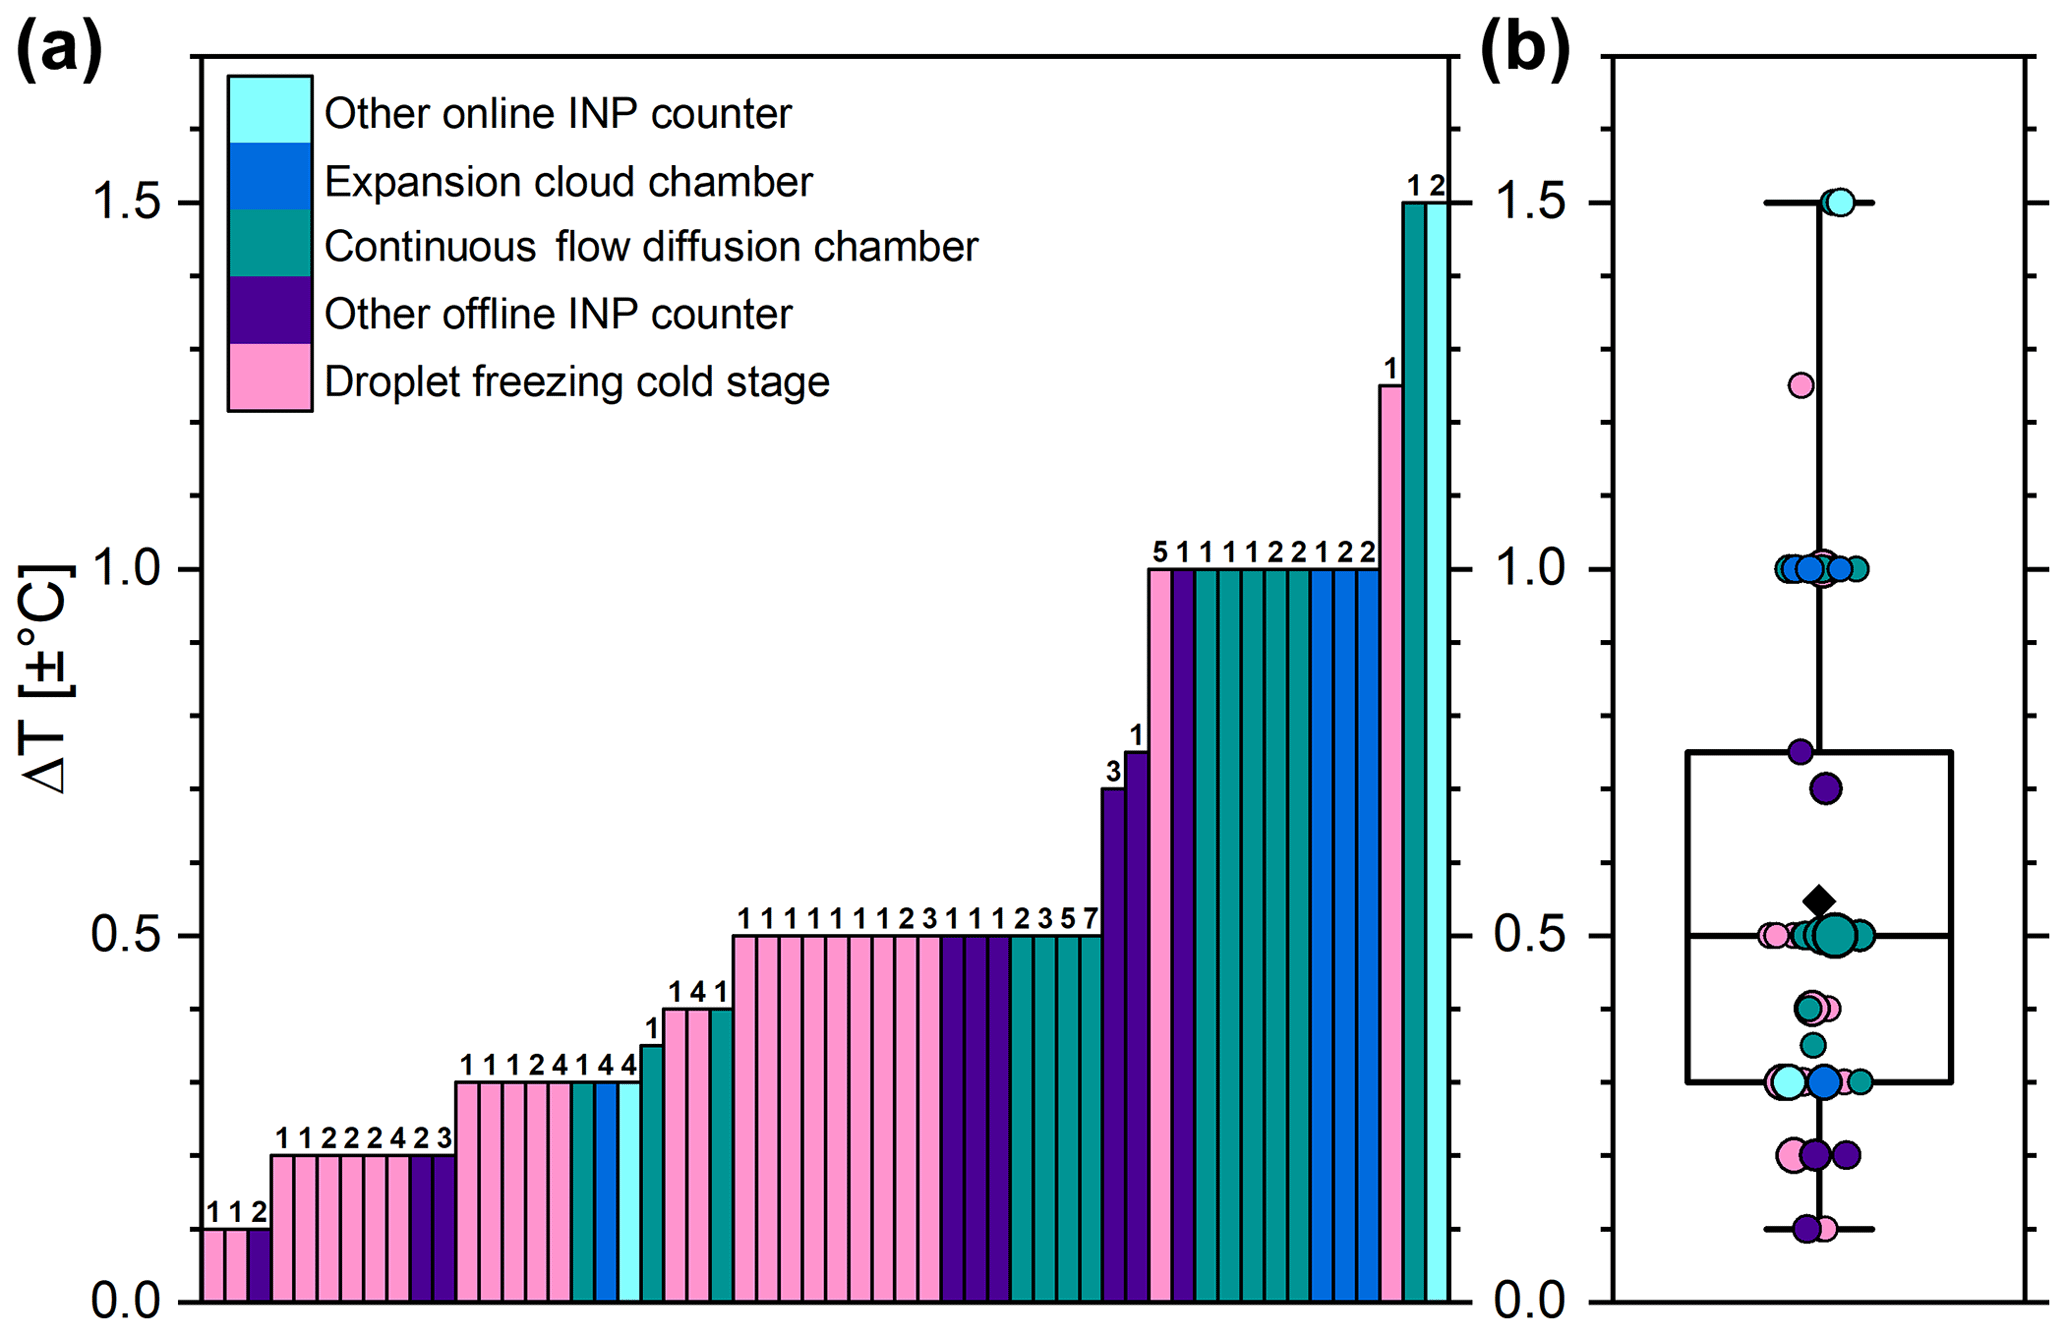
Figure 1Individual temperature uncertainty statements of instruments participating in the intercomparison studies as identified in Table 1, represented as (a) bars and (b) circle symbols. Numbers and circle symbol sizes indicate how often an uncertainty assessment of an individual instrument was reported. The box plot indicates the range, 25th percentile, median, 75th percentile, and (b) average (black diamond) of the stated temperature uncertainties.
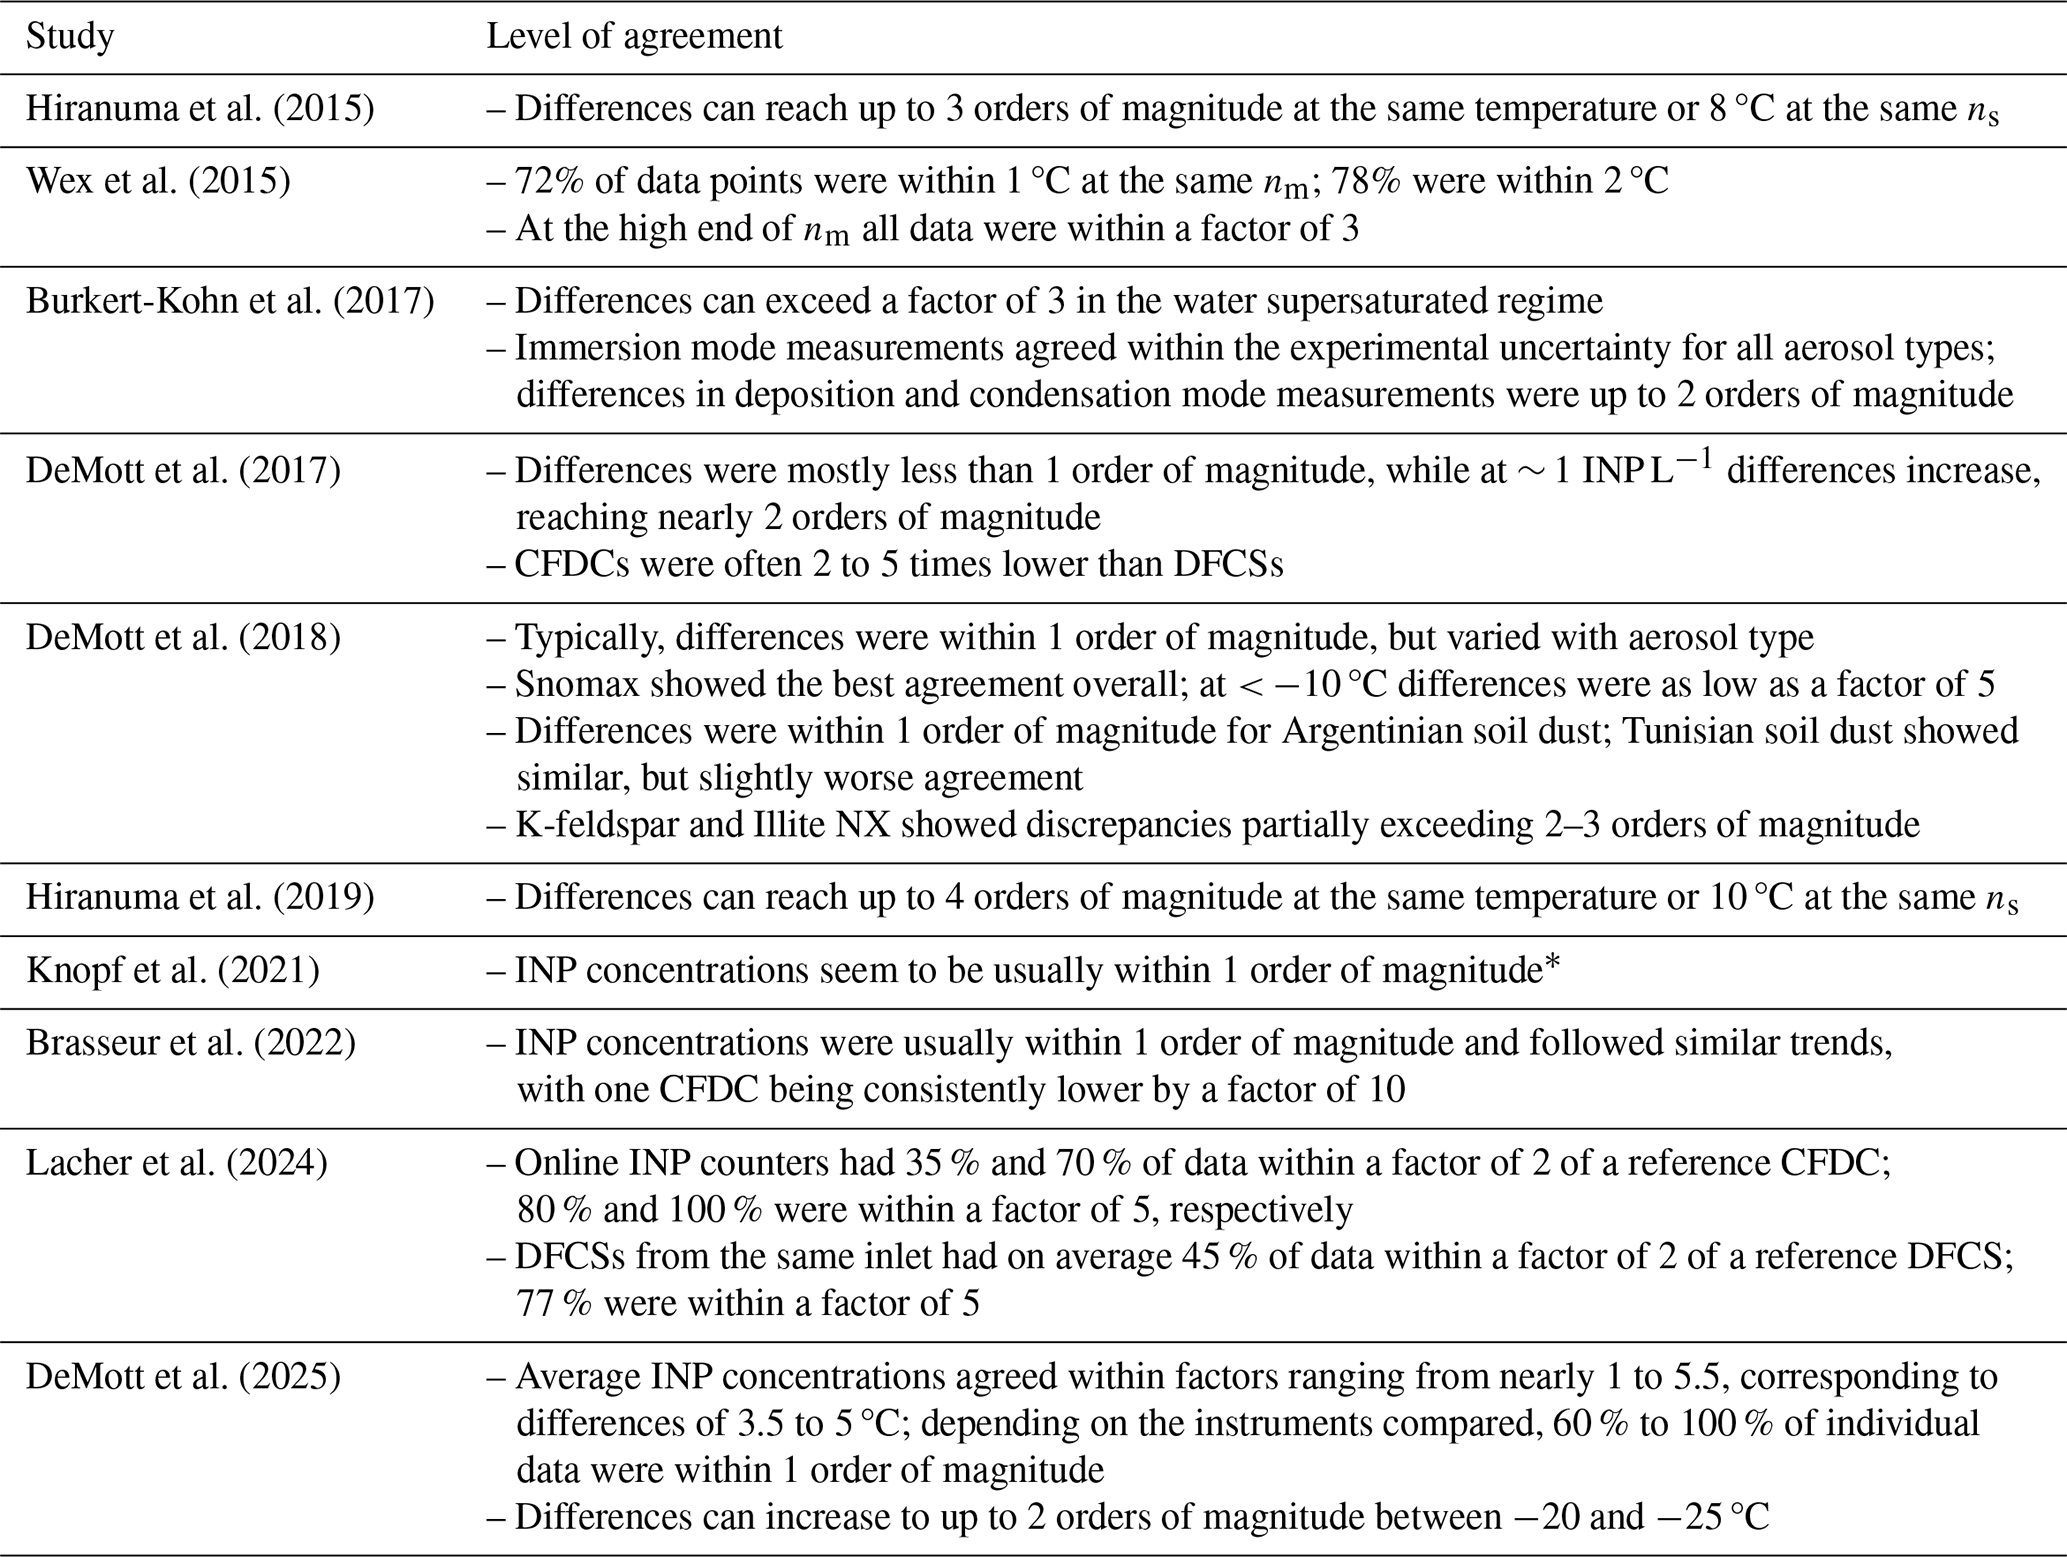
Table 2 summarizes the general quantitative assessment of the level of agreement between INP measurements of different instruments in the studies considered. We will outline the main findings in the following paragraph, while the reader is referred to Table 2 for the detailed statements. Most of the intercomparison results indicate that INP measurements of different instruments usually agree within 1 order of magnitude. Comparisons of atmospheric INP measurements are generally not better or worse than laboratory intercomparisons. DeMott et al. (2025) also come to this conclusion, when comparing the results of the FIN-03 field study with the FIN-02 laboratory intercomparison (DeMott et al., 2018). They conclude that ambient INP concentrations can be measured with a similar accuracy to laboratory experiments, despite the variability in aerosol composition, concentration, and size distribution. The atmospheric intercomparison that likely yielded the closest agreement of INP concentrations was described by Lacher et al. (2024), where 10 INP instruments showed differences usually within a factor of 5. For some 10 % of the time, the agreement was even as good as within a factor of 2, depending on the combination of instruments considered. Judging from the literature available, this seems to be the best that is achievable with the current instrumentation and measurement uncertainties. The agreement of laboratory intercomparison varied markedly with the specific material investigated, ranging from differences that were in parts within the measurement uncertainties (Wex et al., 2015; Burkert-Kohn et al., 2017) to discrepancies exceeding more than 3 or 4 orders of magnitude (Hiranuma et al., 2015, 2019). Additionally, the diversity in aerosol preparation, generation, and sampling, and the specific measurement procedure had a large influence in some studies (Hiranuma et al., 2015, 2019). Encouragingly, overall there seems to be a trend toward a higher level of agreement in the more recent intercomparison studies compared with those from a decade ago.
Table 2Level of agreement among INP methods during the intercomparison studies.
* The intercomparison of different INP instruments was not discussed in Knopf et al. (2021), because the focus was to check for closure between aerosol measurements and ice formation. This assessment is based on the example data of the afternoon of 15 October 2019 presented in their Figs. 4b and ES2.
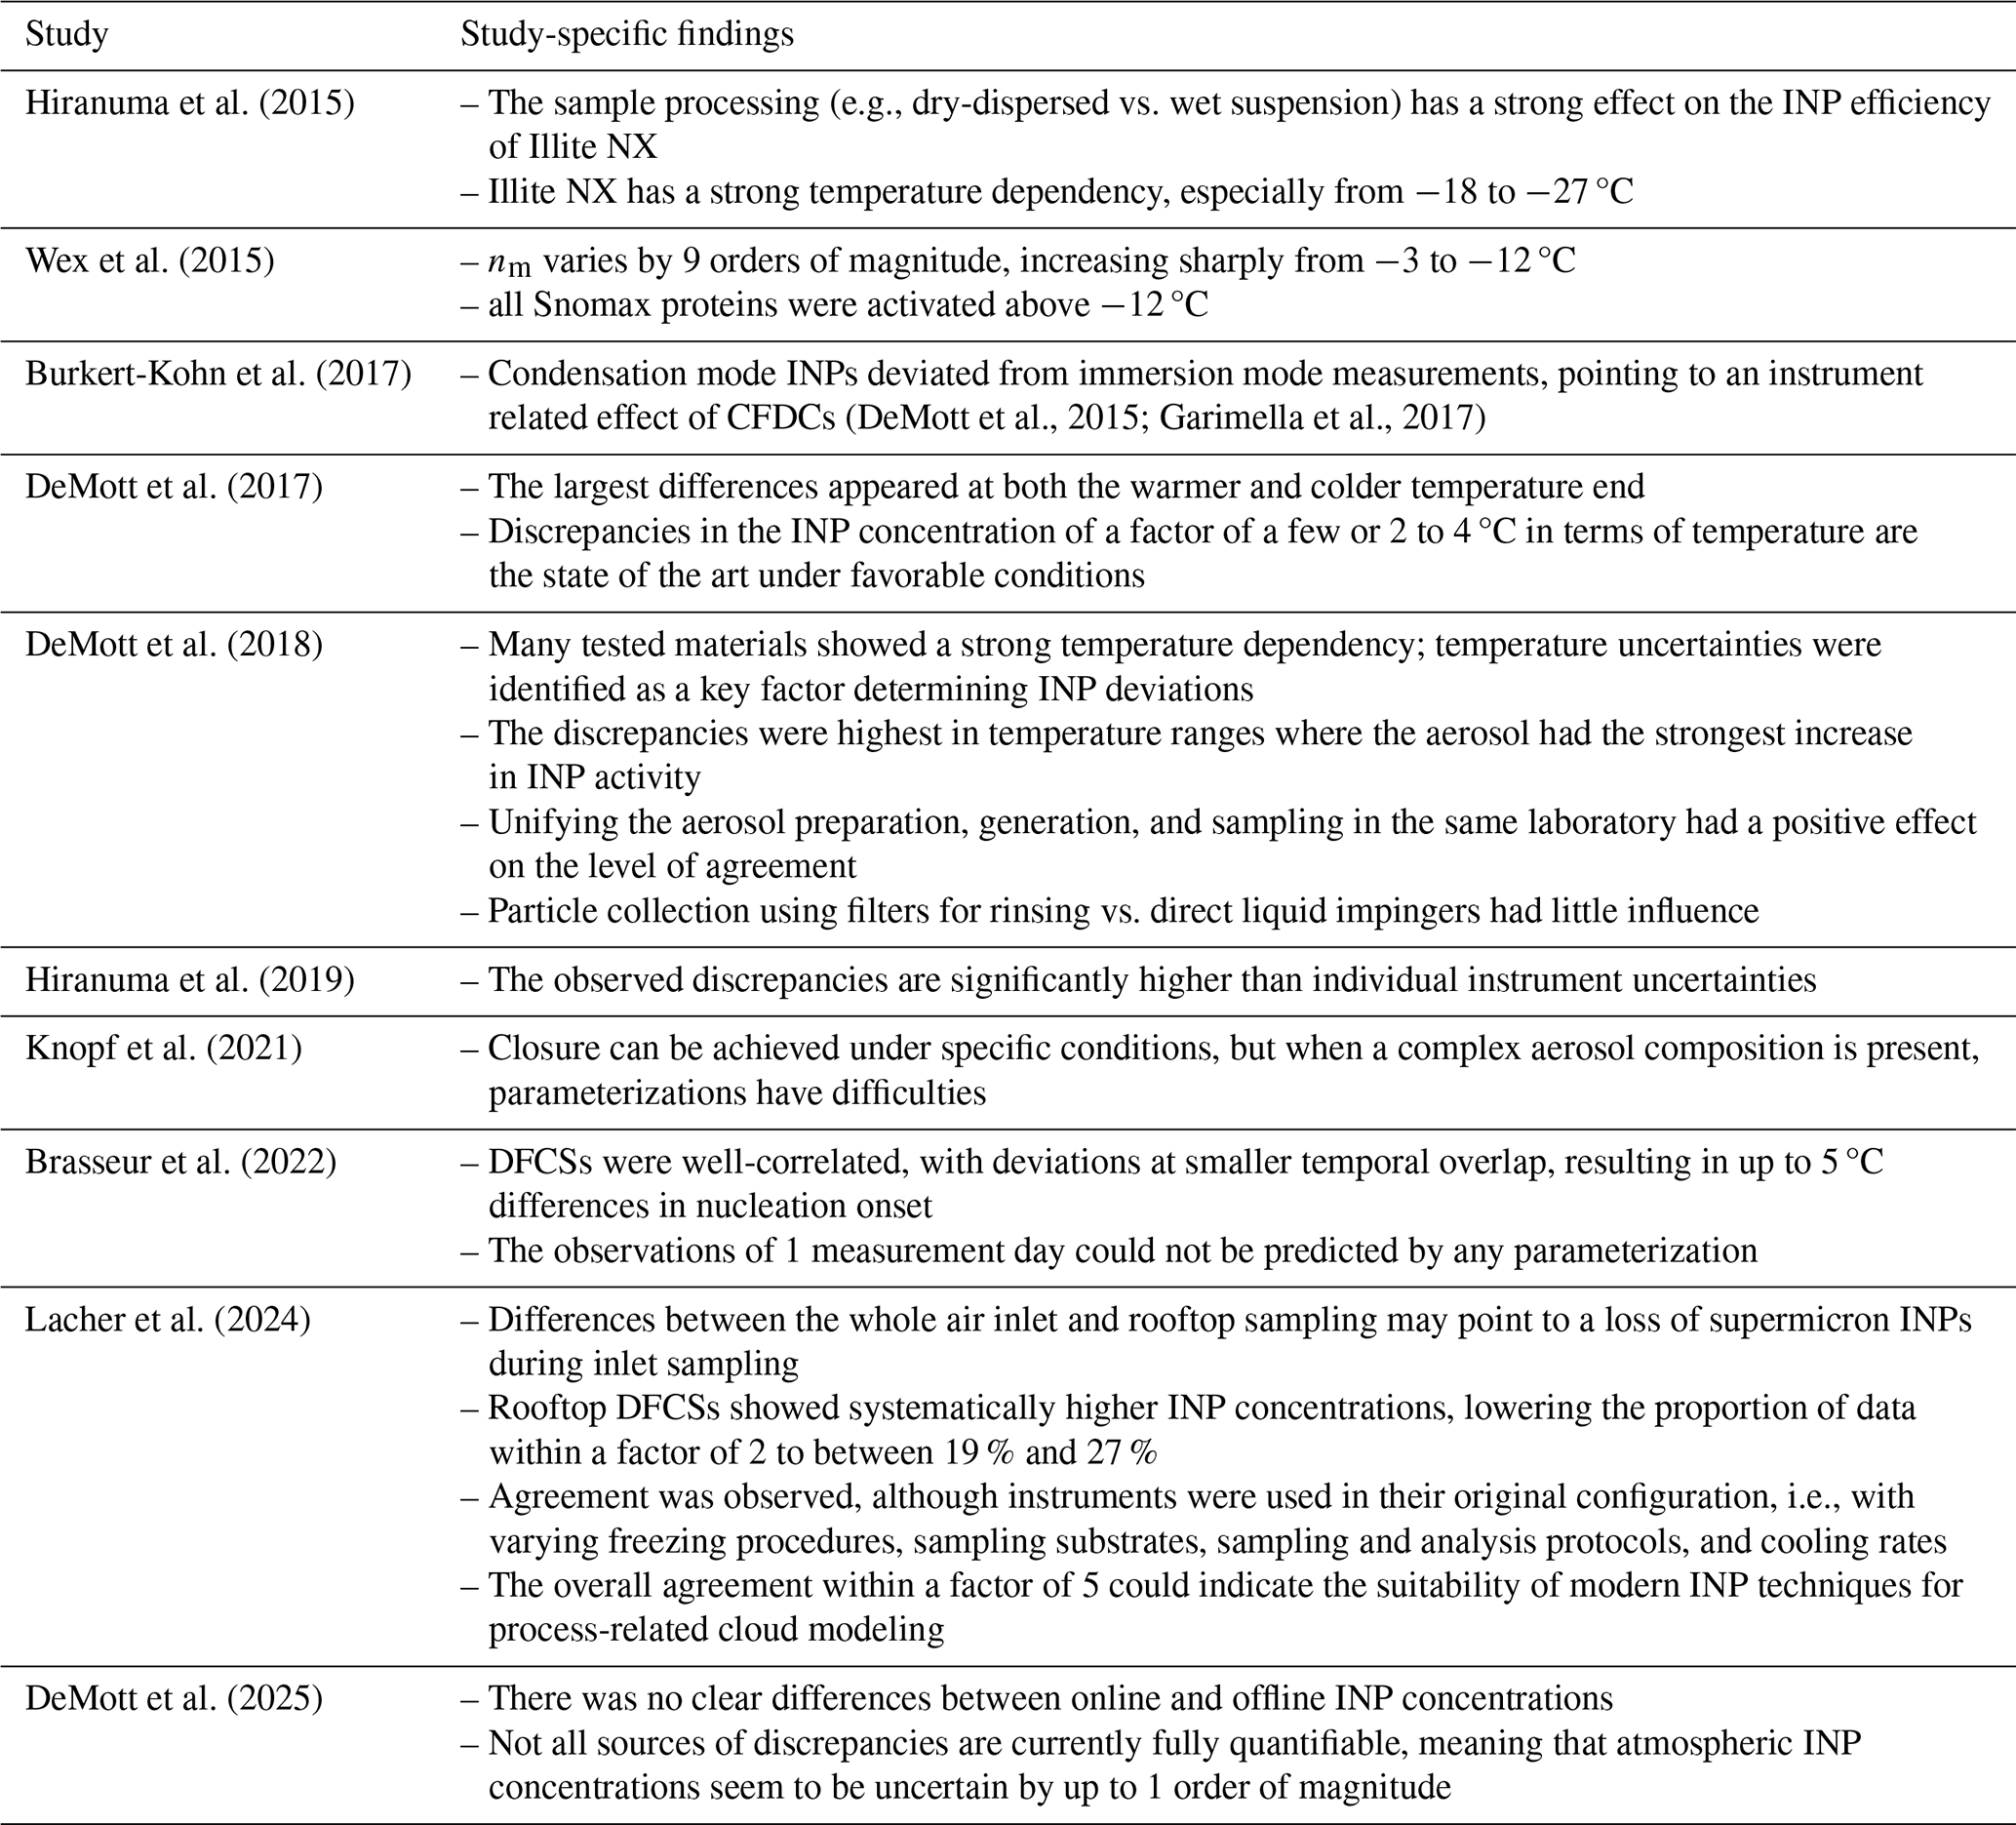
Table A1 expands upon the pure assessment of the intercomparison of Table 2 by listing various study-specific findings regarding temperature regions, where the differences were most pronounced (i.e., usually the warm and cold ends of the data), identified instrumental or sampling-related reasons for discrepancies, or the unique ice-nucleating characteristics of the investigated aerosol, which may influence the overall level of agreement. As we will explore in more detail in Sect. 3, the specific slope of the temperature dependency was identified as one main cause for observed differences in some studies.
We refrain here from quantitatively comparing the effect of the uncertainty of the nucleation conditions with the stated uncertainties in the INP concentration for individual instruments, because the latter are usually not expressed simply as percentage or concentration range, but depend on measurement specifics. Thus, this would go beyond the scope of this study. However, the differences observed among INP measurements often exceed the reported uncertainties or error bars of the instruments considerably. As shown, these discrepancies can be of the order of 1 magnitude or more, while the INP concentration uncertainty of individual instruments, often related to freezing statistics or the counting process of ice particles, is usually only of the order of several tens of percent.
To estimate how errors in nucleation temperature propagate to uncertainty of INP measurements, we will, in the following, define a temperature error factor (TEF, see Eq. 7), and derive TEFs for five empirical data functions that relate INP activity to nucleation temperature. These functions include a compilation of atmospheric measurements by Petters and Wright (2015, referred to hereafter as PW15), as well as four INP parameterizations (see Fig. B1). The parameterizations were either derived from continental measurements of the atmospheric INP concentration (DeMott et al., 2010, hereafter D10), or from laboratory and field measurements of mineral dust (DeMott et al., 2015, hereafter D15), or from the ice-nucleating activity of known ice-active biological material (Snomax, Wex et al., 2015, hereafter W15) and mineral components (K-Feldspar, Atkinson et al., 2013, hereafter A13). For D10,
where a = 0.0000594, b = 3.33, c = 0.0264, d = 0.0033, TK is the temperature in Kelvin, na > 0.5 is the aerosol number concentration of particles with a diameter larger than 0.5 µm [scm−3], and nINP is the resulting INP concentration per standard liter. For D15,
where α = 0, β = 1.25, γ = 0.46, δ = −11.6 and it is suggested that the calibration factor, cf, be set to 3 for atmospheric applications in order to emulate the influence of measuring the maximum immersion freezing concentration versus CFDC measurements at Swater = 105 % (cf = 1). For W15,
where TC is the temperature in °C and nm is the active site density by mass [mg−1]. For A13,
where ns is the active site density per unit surface [cm−2].
In the case of PW15, we used the average of the base 10 logarithm of the upper and lower end of the data envelope in order to investigate a temperature spectrum that is representative for the compilation of precipitation samples (red line in Fig. B1c, compare Petters and Wright, 2015).
In the following analysis we present the TEF of nINP, nm, or ns at the actual nucleation temperature Tn relative to the potentially falsely assumed temperature Tm due to the inaccuracy of the temperature measurement, as a function of Tm (Fig. 2 and Table 3):
where the index i stands for INP, s, or m, defining the INP concentration, active site density by surface, or mass to be compared according to Eqs. (3) to (6) or the red line in Fig. B1c, and the index j stands for D10, D15, W15, A13, or PW15.
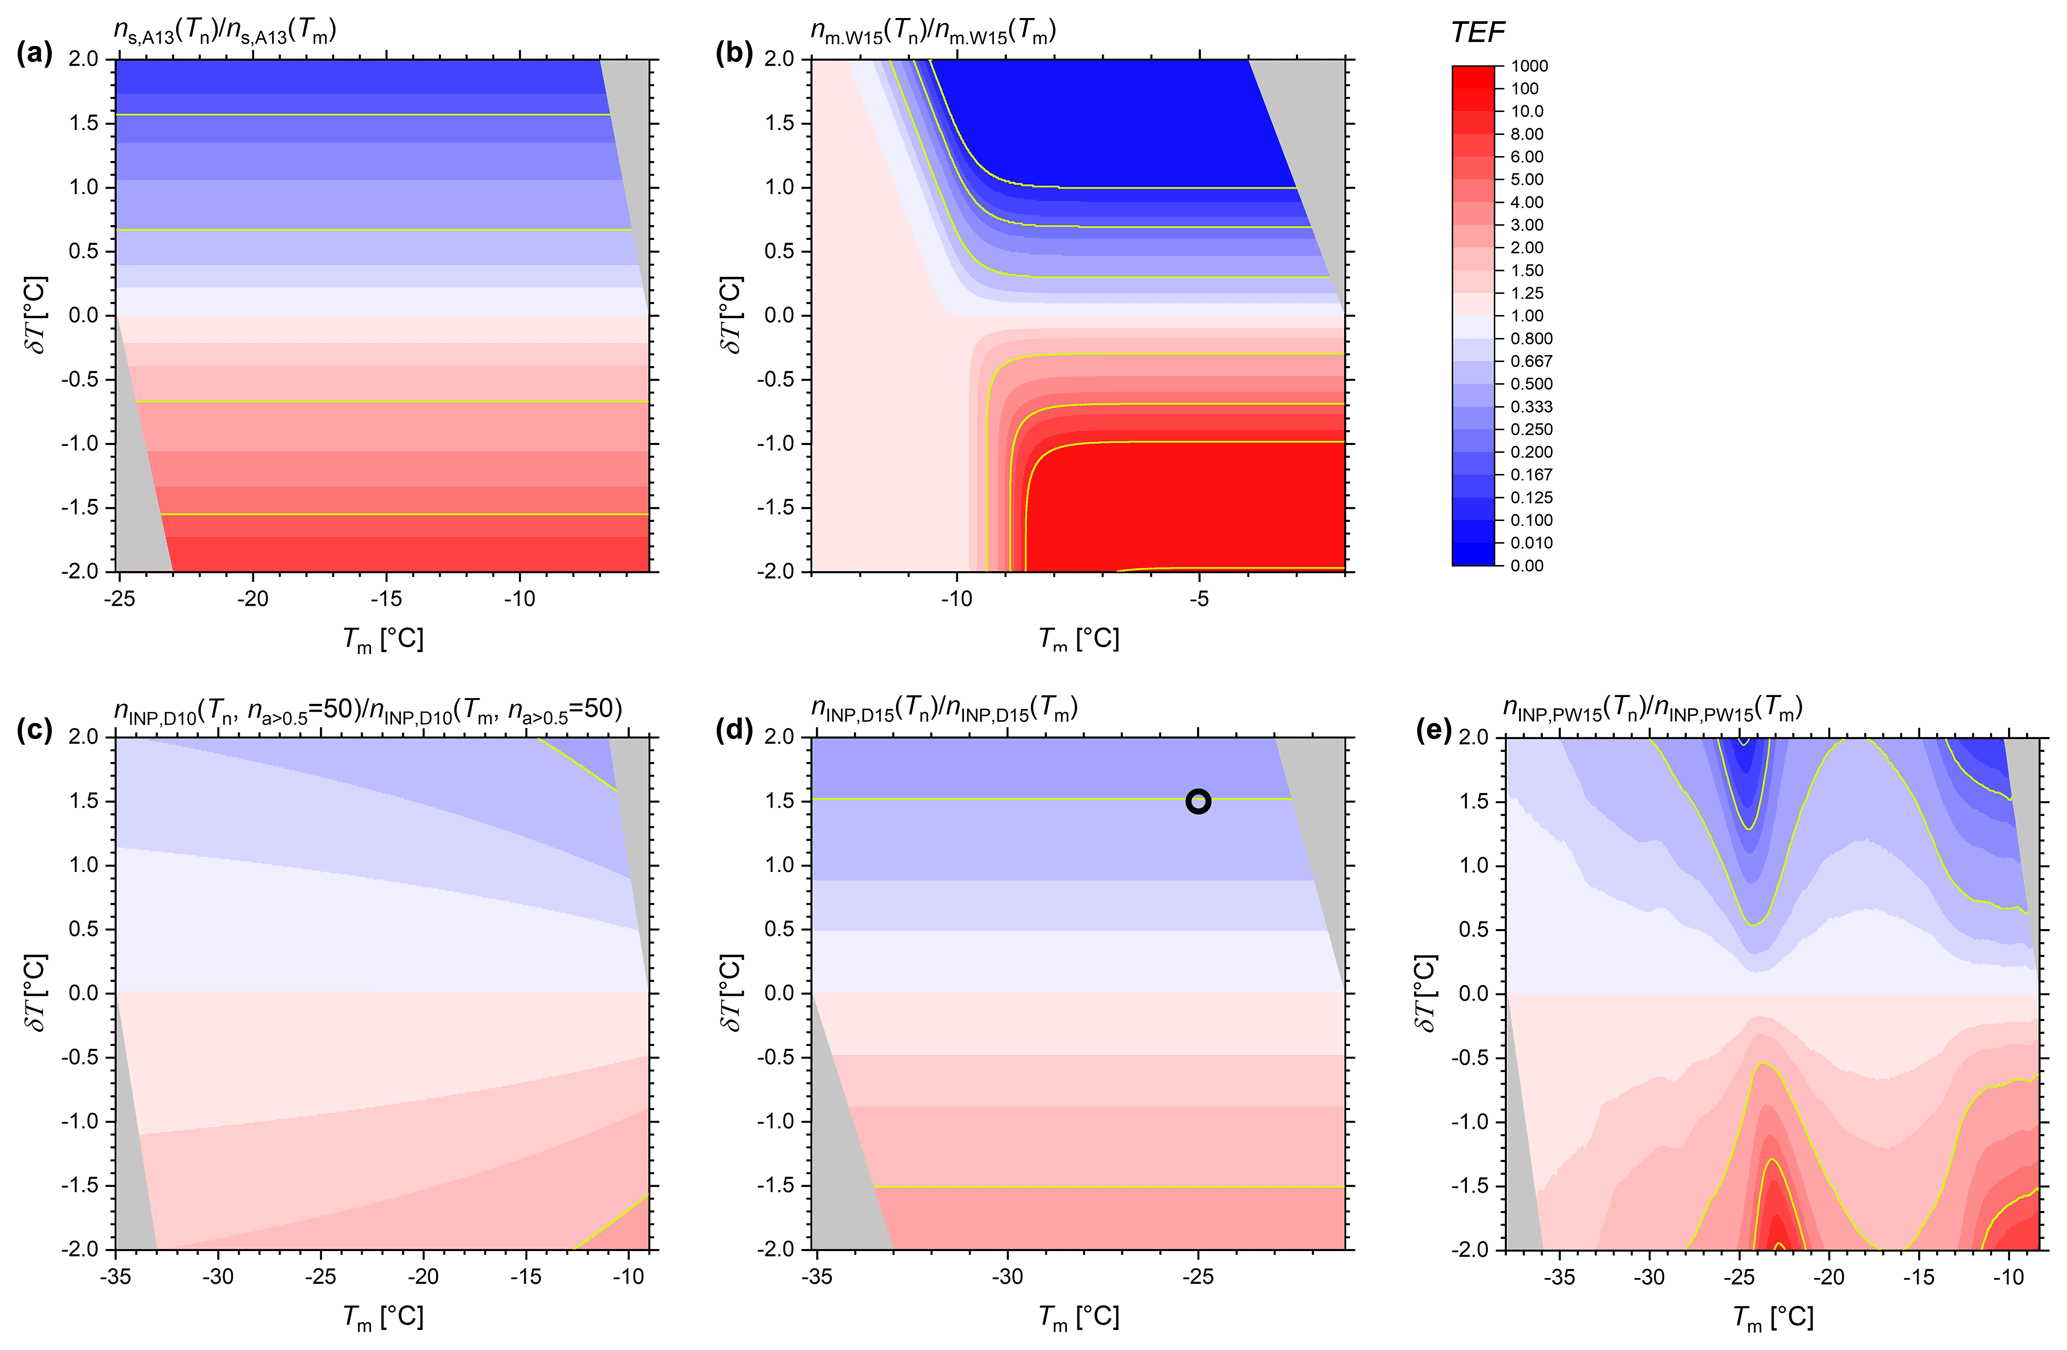
Figure 2Temperature error factors of (a) A13, (b) W15, (c) D10, (d) D15, and (e) PW15 as functions of assumed measurement temperature Tm and temperature error δT. When visible, yellow isolines show the constant TEFs of 2, 5, 10, and 100 (and their inverse). For D10 na > 0.5 is set to 50 cm−3. Gray triangle overlays confine the valid temperature range of the original data function. The circle symbol in panel (d) refers to the scenario described in the text.
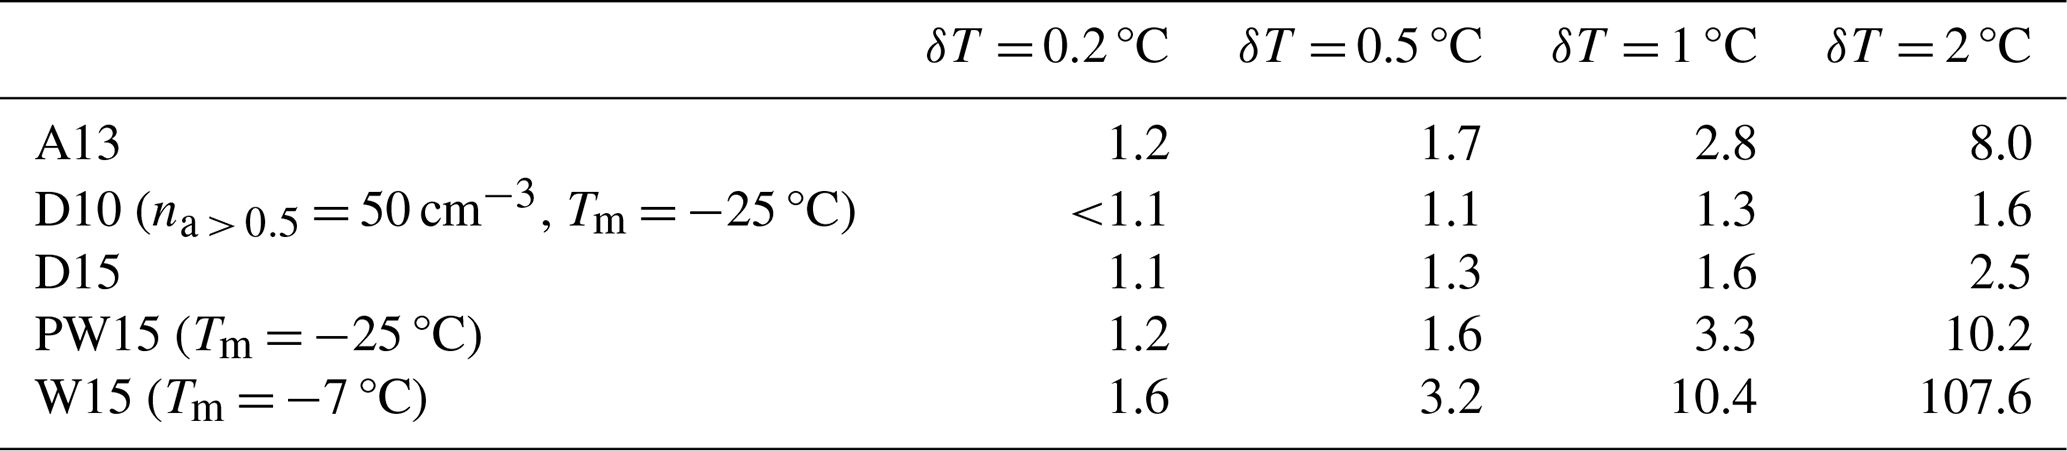
Table 3Maximum relative temperature error factor resulting from four example temperature errors δT at example measurement temperatures Tm. Note that the TEF in A13 and D15 is independent of Tm. Similarly, the TEF in D15 is also independent of na > 0.5.
When δT is greater than 0, TEF is less than 1, as indicated by the blue colors in Fig. 2. This means the ice-nucleating ability is underestimated, because the actual nucleation temperature was warmer than the inaccurately measured temperature. To illustrate this, let's consider a hypothetical scenario following Fig. 2d (black circle symbol), where TEF is equal to 0.5 (upper gray line) at a δT of approximately +1.5 °C. Given this δT, a hypothetical instrument mistakenly assumed to measure at −25 °C would actually report nINP of the true temperature of −23.5 °C. At the incorrect temperature reading, the instrument registers a nINP of 25 L−1. However, if the temperature had been accurately measured at −25 °C, the concentration should have been 50 L−1 (at na > 0.5 = 10 cm−3). When δT is less than 0, TEF is, correspondingly, greater than 1 (red colors in Fig. 2), and the ice nucleation ability is overestimated. For simplicity, in the following paragraphs we discuss only TEFs > 1, while the (near-) symmetrical results are similar or the same for the inverse of that factor (TEFs < 1, i.e., when δT has the same absolute value, but a different sign).
For the laboratory-based parameterizations A13 and W15 of the highly ice-active materials K-feldspar and Snomax, respectively, a very strong temperature dependency can be observed. In the case of A13, this translates to TEFs exceeding a value of 2 at a temperature error of ±0.7 °C, and 5 at a temperature error of ±1.5 °C, independent from the assumed measurement temperature Tm (Fig. 2a). For Snomax, nm reaches a maximum plateau at approximately −10 °C (Fig. B1b), therefore the TEF is equal to 1, when Tm − δT is equal to this temperature or lower. However, in the temperature range from −2 to −10 °C the relative TEF increases strongly within the δT window. A factor of 2 is seen at ±0.3 °C, at ±0.7 °C the TEF exceeds 5, at ±1 °C the TEF results in an over- or underestimation of 1 order of magnitude, and at ±2 °C the error can even reach up to a factor of 100 (Fig. 2b).
Atmospheric INP temperature spectra are in general never as steep as those derived from A13 or W15. Accordingly, we find that for D10 the TEF is, for most of the temperature spectrum, below a factor of 2 even at a δT of ±2 °C (Fig. 2c). Figure B2 shows the sensitivity of the TEF of D10 to varying na > 0.5, which is generally low. D15, which is representative of a more dust-rich environment, still only exceeds a TEF of 2 when δT is larger than ±1.5 °C (Fig. 2d). However, atmospheric INP temperature spectra may not always increase strictly uniformly with decreasing temperature, as can be seen for PW15 (red line in Fig. B1c), because the atmospheric aerosol is a mixture of different species that are ice-active at different temperatures. In our analysis, the average of the precipitation samples of PW15 exhibits a strong increase in INP activity with temperature at the warm end of the spectrum of around −10 °C (likely biological INPs), as well as between −20 and −25 °C (likely mineral INPs). Therefore, the measurement of atmospheric samples may be more susceptible to errors in the temperature measurement in these temperature ranges. For example, at Tm = −23 °C a TEF of 2 is observed at ±0.6 °C, the factor increases to 5 at ±1.3 °C, and it is larger than 10 at ±2 °C (Fig. 2e). DeMott et al. (2025) pointed out that the INP variations between instruments measuring at Storm Peak, CO, USA, significantly increased for the −20 to −25 °C range to nearly 2 orders of magnitude, further demonstrating the point. A similar result was also observed by Lacher et al. (2024) for the intercomparison at Puy de Dôme, France.
If temperature errors are kept at or below ±0.5 °C, the resulting error in the INP activity is acceptable, increasing only up to a TEF of 1.7, when W15 is excluded (Table 3). If temperature errors, however, exceed ±1 °C, the reported INP activity can be considerably biased. At ±1 °C, errors translate to inaccurate INP estimates by a factor of 1.3 to 3.3 for atmospheric spectra. At ±2 °C the error may result in over- or underestimation of up to or more than 1 order of magnitude depending on the activation spectrum of the analyzed sample.
It is important to note that the results presented so far considered only the divergence between one instrument's measurement and the “true” value according to the assumed data function. However, when two or more INP instruments are compared, each instrument may diverge from the “true” INP concentration due to individual temperature errors. For example, if one instrument assigns a +0.5 °C high bias in nucleation temperature and another instrument assigns a −0.5 °C low bias, the total combined error of one instrument against the other is the product of both TEFs. Therefore, a factor of 2 difference may appear between two instruments, when the TEFs are each equal to 1.41, which is well within the range of calculated TEFs for ±0.5 °C. A factor of 5 difference between two instruments could be expected at TEFs of 2.24, which is well within the range of calculated errors for ±1 °C. Even a factor of 10 difference between two instruments (i.e., the square of a TEF of 3.16) could be explained by erroneous temperature measurements of about ±1 °C, depending on the aerosol activation spectrum.
Therefore, in order to keep divergences among different instruments low, efforts should be made to limit errors in the measurement, calculation, or assessment of the nucleation temperature to significantly below 1 °C, and best below 0.5 °C.
The role of uncertainties and inaccuracies of the activation temperature of experimental ice nucleation studies should be explored further in a quantitative manner, when results are interpreted or INP concentrations from multiple instruments are compared. This is evident in the lack of temperature error bars in many figures of published INP literature. Similarly, in 21 % of all cases no temperature uncertainty was reported in the primary literature of the INP intercomparison studies that were analyzed here. Overall, temperature uncertainty assessments of researchers varied from ±0.1 to ±1.5 °C, with a median of ±0.5 °C.
In principle, the assumed nucleation temperature can diverge from the actual nucleation temperature due to inaccurate or imprecise measurements, measurements that are not representative for the region of ice formation due to spatial or temporal inhomogeneities in the instrument, insufficient spatial coverage or non-optimal placement of sensors, sensor drift, or uncertainties and other unknown effects contributing to errors when calculating the nucleation conditions in some way. Beyond the uncertainties of the temperature measurement, there are several other, potentially large, uncertainties in ice nucleation measurements. For example, for offline INP sampling these can be related to the background freezing of pure water, and the handling and storage of samples in general, which naturally need to be considered as well (e.g., Polen et al., 2018; Beall et al., 2020). Furthermore, it should be mentioned that the time dependency of nucleation events is often disregarded in DFCS measurements.
In studies that intercompared at least four INP counters, we found differences between instruments to be most often in the range of 1 order of magnitude. On the extreme, in some studies, differences in the range of 3 or 4 orders of magnitude were experienced, likely due to specific aerosol properties and the way the aerosol was generated and processed (Hiranuma et al., 2015, 2019). Sometimes variations were as low as a factor of 2 to 5, while only rarely, and usually only under controlled laboratory conditions, agreement between subsets of instruments was within the actual experimental uncertainty (in terms of INP concentration error). Considering these findings, the disconnect between stated INP concentration uncertainties, which are often in the range of some 10 %, and the observed differences in instrument intercomparisons is glaring.
As the results presented here indicate, potential errors in temperature measurements may contribute significantly to the observed deviations. It is difficult to assess, how much of the differences in the identified intercomparisons are exactly related to this effect. It very much depends on the steepness of the activation temperature spectrum of the specific material investigated or the aerosol composition of the atmospheric sample, as well as the actual error in the temperature measurement of participating instruments.
For typically reported temperature uncertainties, the herein analyzed temperature error effect can be as small as a factor of 2 or less for continental atmospheric samples that do not show the strong signature of mineral dust or biological particles (i.e., those that behave like D10). Still, there may be temperature ranges in atmospheric samples that show a distinct temperature dependency, thus TEFs of 5 or greater can be possible due to misjudged nucleation temperatures. The expected errors are by far the greatest in laboratory intercomparisons with highly ice-active materials.
The strong temperature dependence of specific ice-nucleating materials, combined with measurement errors of nucleation temperature, was in fact considered as a partial reason for the large discrepancies observed among individual instruments in some intercomparison studies. For example, it is explicitly stated that the propagating temperature uncertainty dominates the variation of the resulting INP concentration uncertainty for the Colorado State University (CSU) CFDC, which was estimated to be ±60 % for any temperature (Hiranuma et al., 2015). While ±60 % is a reasonable assumption for not particularly active atmospheric samples, we have demonstrated here that errors can be significantly larger. Hiranuma et al. (2015) concluded that biased overall accuracy and precision of instruments can be related to factors shifting the activation temperature, when discussing potential reasons for observed diversity in the intercomparison of Illite NX. Furthermore, DeMott et al. (2018) consistently noted that discrepancies in the INP concentration between different instruments increased in regions where the investigated aerosol material showed a stronger temperature dependency, and attributed uncertainties in temperature measurements as a key reason for this finding. DeMott et al. (2017) suggested that a temperature offset by at least 1 °C for one DFCS related to errors in the droplet temperature measurement may explain why this method generally showed overall higher INP concentrations. Following this example, researchers should always pay close attention to systematic differences between instruments, which can indicate methodical biases in the activation condition measurements. If unequivocally identified, such systematic biases may be corrected post-measurement, and should be separated from unsystematic variations between instruments. However, even when a general systematic bias between instruments is identified, there can still be measurement periods where the systematic bias disappears or even reverts (e.g., DeMott et al., 2025).
While these examples demonstrate that the community is aware of the temperature error effect, none of these researchers actually tried to quantitatively estimate the contribution of the temperature measurement error to the observed variations. Riechers et al. (2013), as a notable exception, are the only group to our knowledge to include calculations of the effect of temperature uncertainty in a similarly systematic fashion, however focusing on homogeneous ice nucleation at the temperature range of 236–238 K. Mirroring our results, Riechers et al. (2013) conclude that temperature accuracy is the most important factor by far for total uncertainty of the homogeneous nucleation rate, when performing an extensive error propagation including temperature accuracy, and other uncertainties related to frozen fraction increment, time interval, and radius.
In our calculations, herein, we found that, at a temperature error of ±0.5 °C (median of reported uncertainties), TEFs range from 1.1 to 1.6 for atmospheric samples, and from 1.7 to 3.2 for highly active INP species. For the highest reported temperature uncertainties of ±1.5 °C, TEFs can still be below a factor of 2, but may also increase to more than 10, depending on the INP activation spectrum. When considering the differences of two INP counters, each instrument can exhibit deviations from the real INP concentration due to individual temperature errors. If these instruments have opposite biases in their temperature errors, with one measuring “too warm” and the other “too cold”, temperature error factors need to be multiplied. If four or more instruments are intercompared, as was the case in the investigated studies, it seems rather likely that at least two have such opposite biases. In such a case, differences by a factor of 2 between two intercompared instruments are generally possible for temperature errors in the range of ±0.5 °C. If one instrument with a temperature bias of +1 °C is compared with another instrument with a bias of −1 °C, differences of factors up to 5 or even 10 are conceivable. Consequently, the sensitivity to activation temperature can by itself explain a good part, or in certain cases potentially all, of the observed differences in intercomparison studies. If the assessments of temperature uncertainties are too optimistic or other unknown factors contribute to a higher temperature error, these effects likely increase. Additionally, specific data protocols in intercomparison studies which bin data in 1 °C intervals may affect the overall level of agreement between instruments by essentially adding an artificial temperature uncertainty of up to ±0.5 °C to parts of the data sets.
Considering these findings, one might ask whether the current level of agreement between different INP instruments measuring the same aerosol is already as good as can be expected given the existing instrumental uncertainties, or how much more consistency can be achieved if temperature uncertainties can be further reduced. Furthermore, on a more fundamental level, how much of the observed variation of the atmospheric INP concentration is real, and how much of it is attributable to uncertainties in the activation conditions of instruments?
One hint to answering parts of these question may come from intercomparison measurements of Snomax at temperatures below about −10 °C (Wex et al., 2015; DeMott et al., 2018). At this temperature range the activated fraction was found to not further increase anymore, thus temperature uncertainty should play only a minor role. Although it was observed in both studies that the level of agreement was significantly improved by virtually eliminating temperature uncertainty as a factor, differences of up to a factor of 3 (Wex et al., 2015) and 5 (DeMott et al., 2018) were still found, pointing to other substantial unidentified factors contributing to the total uncertainty. To a similar effect, when deviations between instruments were expressed as a temperature difference (e.g., 3.5 to 5 °C in DeMott et al., 2025), these can in fact be larger than could be explained by a reasonable assumption of typical temperature errors, even when the opposite direction of temperature bias is considered.
Still, our calculations have shown that limiting measurement errors of the ice nucleation activation temperature is essential for reliable INP concentration measurements, especially when multiple INP counters are compared. We therefore highly recommend diligent and conservative characterization of temperature (and ice supersaturation) uncertainties in INP instrumentation.
Table A1 compiles selected additional quantitative and qualitative statements from the reviewed intercomparison studies, supplementing Table 2 and complementing the discussion in Sect. 2.
Table A1List of findings of the identified intercomparison studies related to the regions of highest differences, stated potential reasons for the differences, and other study-specific results.
The following figures provide further details for the analysis presented in Sect. 3.
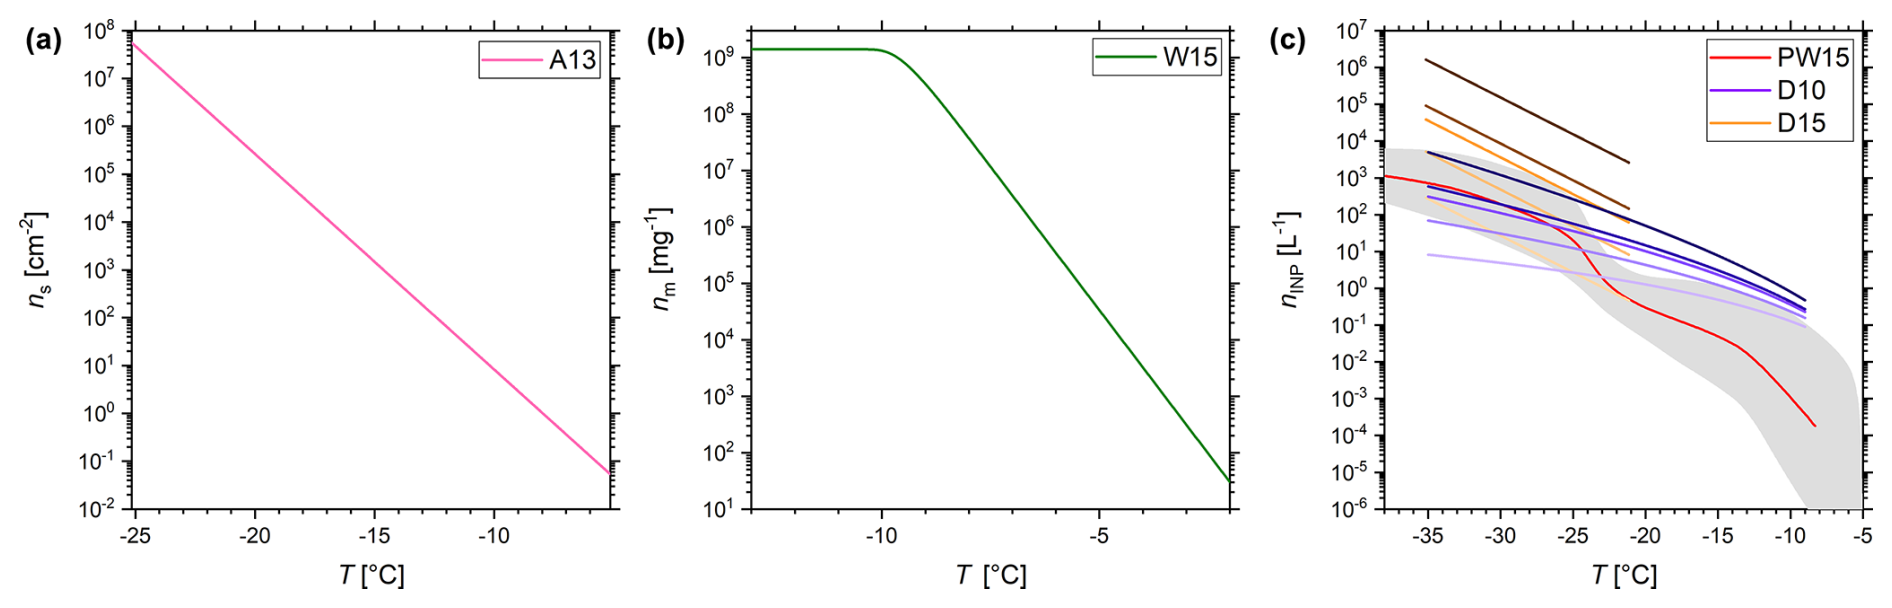
Figure B1(a) Temperature spectrum of the active site density by surface ns of K-feldspar for A13. (b) Temperature spectrum of the active site density by mass nm of Snomax for W15. (c) Temperature spectra of the INP concentration nINP for PW15, D10, and D15. The red line of PW15 is used in the analysis of Sect. 3 as an average of the gray envelope. Note that the INP concentration per volume of water of the precipitation samples is converted to air volume as described in Petters and Wright (2015). The color scaling from light to dark for D10 and D15 represents na > 0.5 values of 1, 10, 50, 100, and 1000 cm−3, respectively.
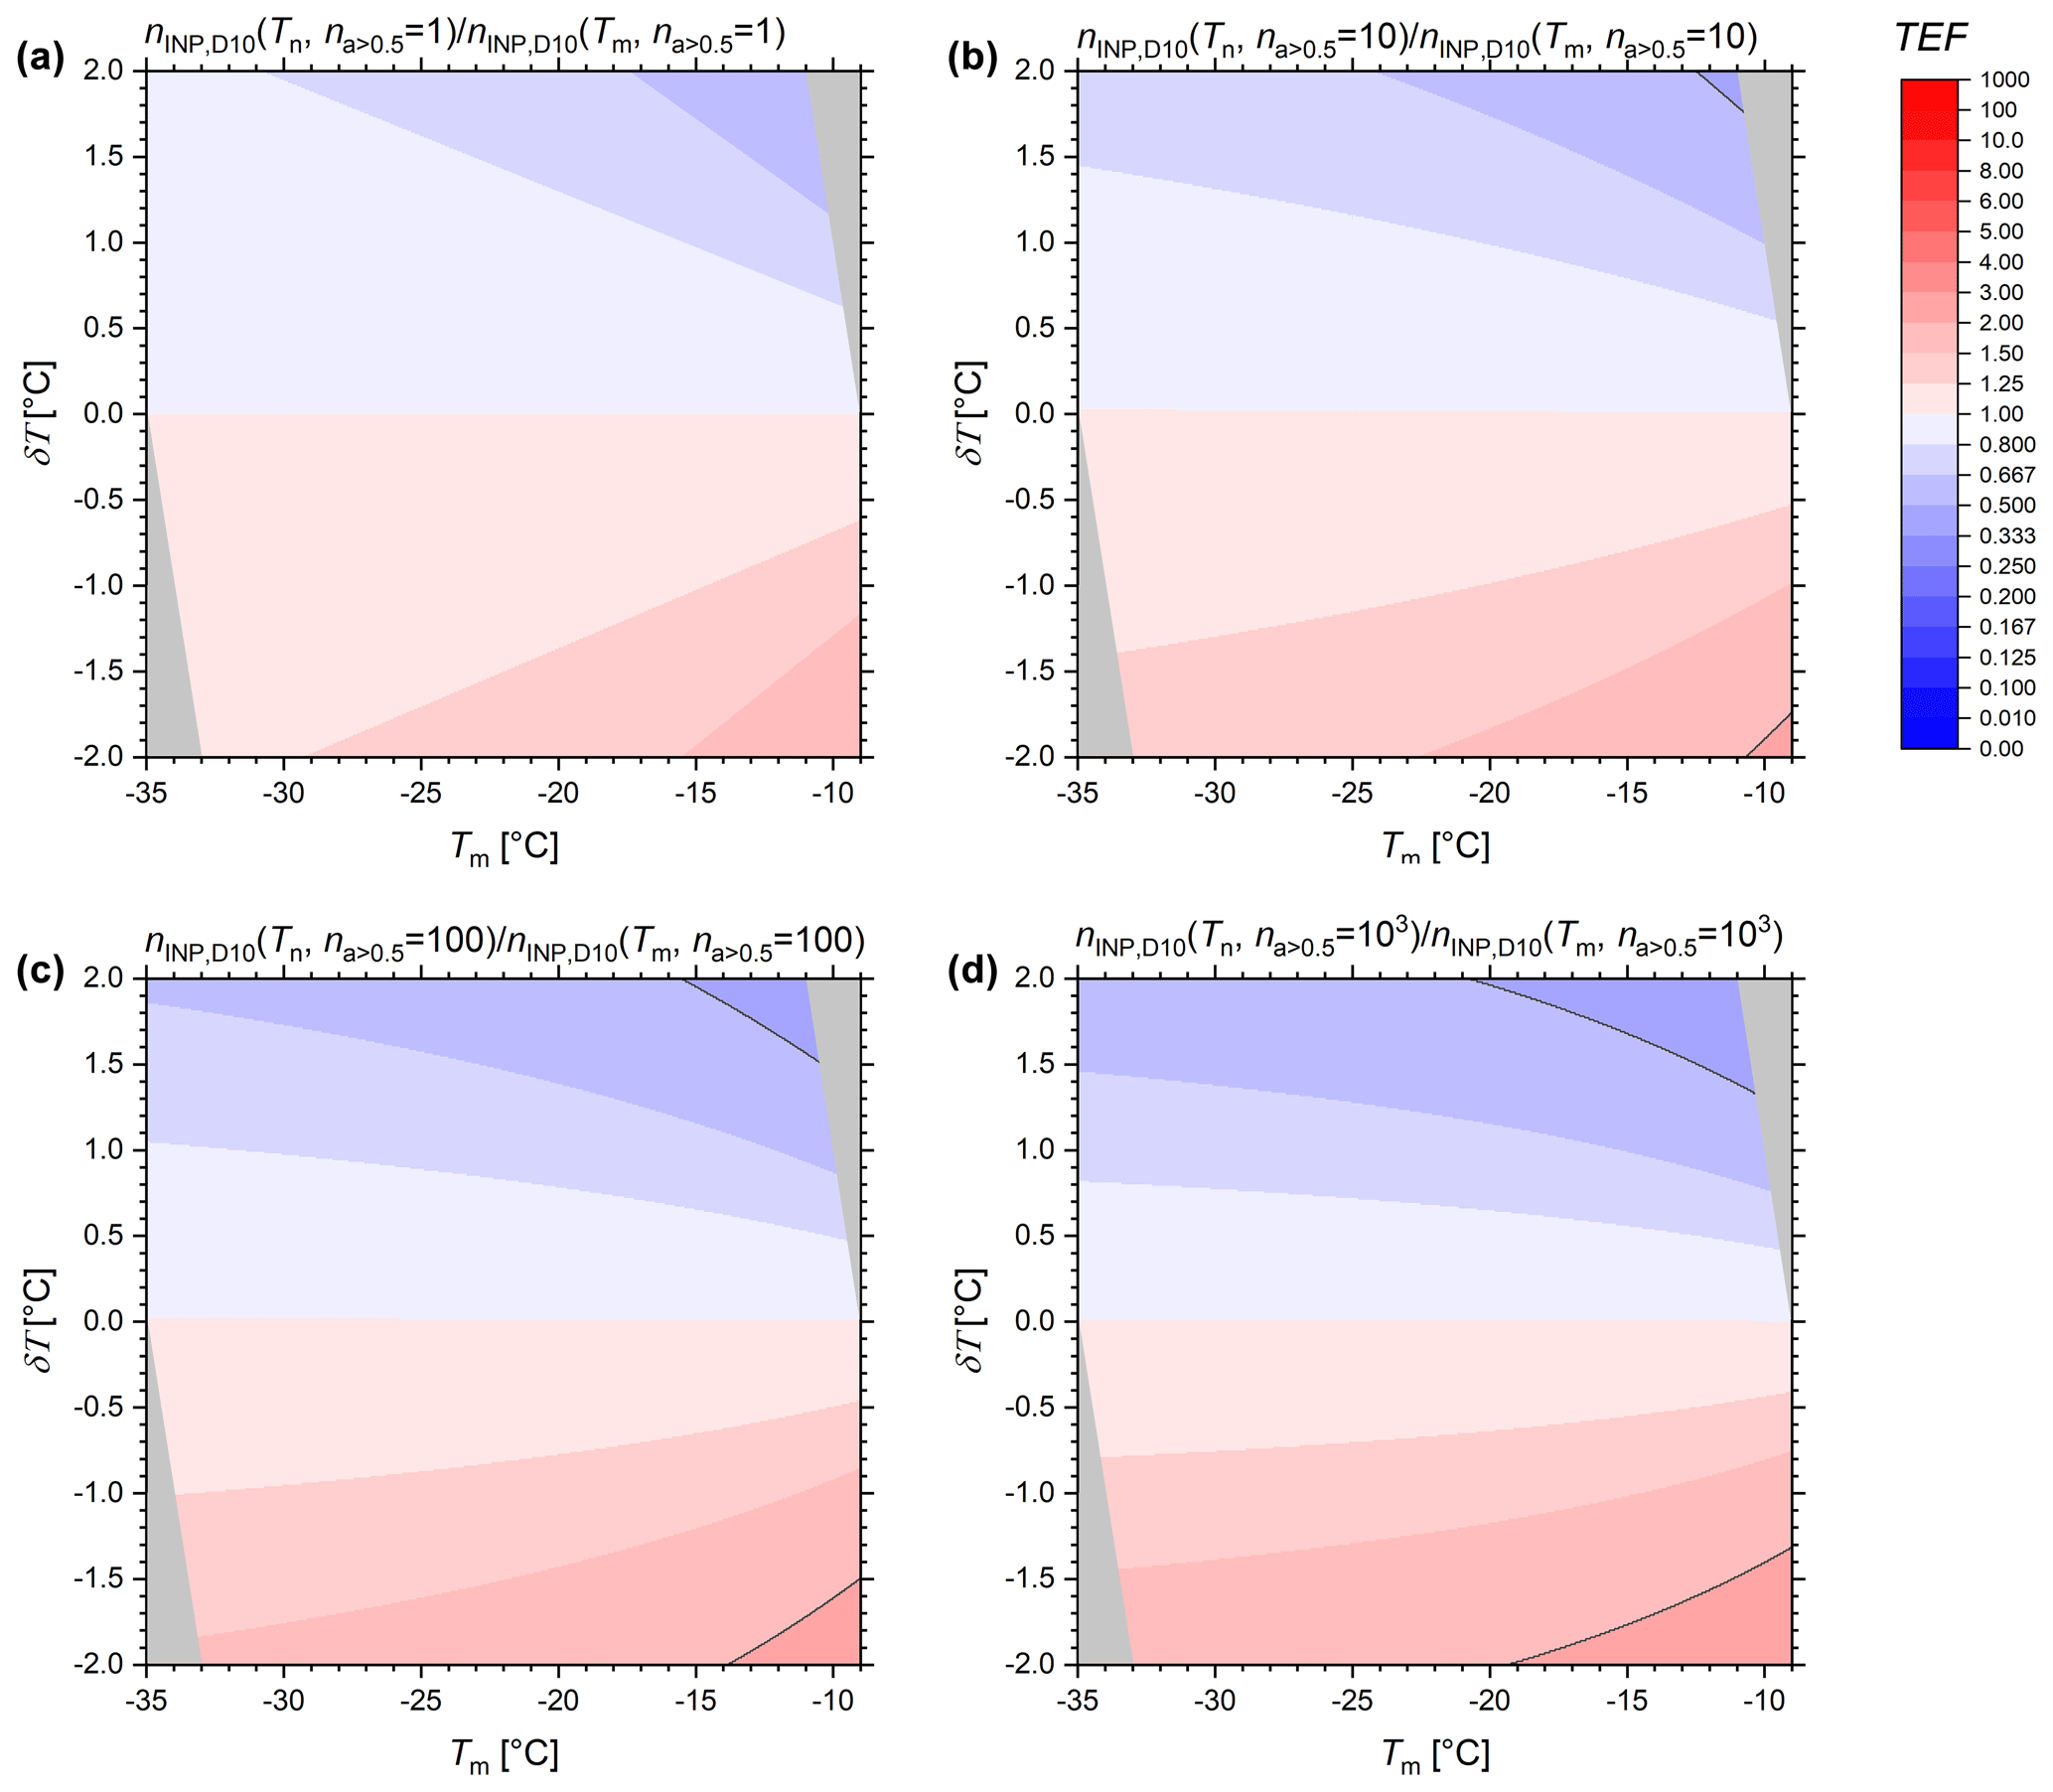
Figure B2Temperature error factors of D10 as functions of assumed measurement temperature Tm and temperature error δT. Panels (a) to (d) show the sensitivity to na > 0.5 by setting na > 0.5 to 1, 10, 100, and 1000 cm−3. When visible, gray isolines show the constant temperature error factors of 2 (and its inverse). Gray triangle overlays confine the valid range of the original data function.
The data to create the figures are uploaded to the Goethe University Data Repository (GUDe, https://doi.org/10.25716/gude.1j28-hp2d, Schrod, 2024). GUDe is operated by the University Library and the University Data Center of the Goethe University and follows the FAIR principles.
The supplement related to this article is available online at https://doi.org/10.5194/amt-18-2591-2025-supplement.
JS conceptualized the manuscript, reviewed the literature, analyzed the data, prepared the figures, and wrote the manuscript draft. JS and HGB revised and edited the manuscript.
The contact author has declared that neither of the authors has any competing interests.
Publisher’s note: Copernicus Publications remains neutral with regard to jurisdictional claims made in the text, published maps, institutional affiliations, or any other geographical representation in this paper. While Copernicus Publications makes every effort to include appropriate place names, the final responsibility lies with the authors.
The authors gratefully acknowledge the financial support of the Goethe University Frankfurt and Deutsche Forschungsgemeinschaft (DFG, German Research Foundation). We thank Joachim Curtius for proofreading a previous version of the manuscript. We are grateful to Paul DeMott for his valuable input discussing the content of this paper.
This research has been supported by the Deutsche Forschungsgemeinschaft (DFG, German Research Foundation) (SPP 1294 HALO – Project-ID 442666697 (PINEair) and TRR 301 – Project-ID 428312742).
This open-access publication was funded by Goethe University Frankfurt.
This paper was edited by Mingjin Tang and reviewed by three anonymous referees.
Atkinson, J., Murray, B., Woodhouse, M., Whale, T. F., Baustian, K. J., Carslaw, K. S., Dobbie, S., O'Sullivan, D., and Malkin, T. L.: The importance of feldspar for ice nucleation by mineral dust in mixed-phase clouds, Nature, 498, 355–358, https://doi.org/10.1038/nature12278, 2013.
Beall, C. M., Lucero, D., Hill, T. C., DeMott, P. J., Stokes, M. D., and Prather, K. A.: Best practices for precipitation sample storage for offline studies of ice nucleation in marine and coastal environments, Atmos. Meas. Tech., 13, 6473–6486, https://doi.org/10.5194/amt-13-6473-2020, 2020.
Bergeron, T.: Über die dreidimensional verknüpfende Wetteranalyse, Geofysiske Publikasjoner, 5, 111 pp., 1928.
Bogert, P.: Ice-nucleating particles in the free troposphere: long-term observation and first measurements at cirrus formation temperatures using the novel Portable Ice Nucleation Experiment PINEair, PhD thesis, Institute of Meteorology and Climate Research – Atmospheric Aerosol Research, Karlsruhe Institute of Technology, Germany, 170 pp., 2024.
Brasseur, Z., Castarède, D., Thomson, E. S., Adams, M. P., Drossaart van Dusseldorp, S., Heikkilä, P., Korhonen, K., Lampilahti, J., Paramonov, M., Schneider, J., Vogel, F., Wu, Y., Abbatt, J. P. D., Atanasova, N. S., Bamford, D. H., Bertozzi, B., Boyer, M., Brus, D., Daily, M. I., Fösig, R., Gute, E., Harrison, A. D., Hietala, P., Höhler, K., Kanji, Z. A., Keskinen, J., Lacher, L., Lampimäki, M., Levula, J., Manninen, A., Nadolny, J., Peltola, M., Porter, G. C. E., Poutanen, P., Proske, U., Schorr, T., Silas Umo, N., Stenszky, J., Virtanen, A., Moisseev, D., Kulmala, M., Murray, B. J., Petäjä, T., Möhler, O., and Duplissy, J.: Measurement report: Introduction to the HyICE-2018 campaign for measurements of ice-nucleating particles and instrument inter-comparison in the Hyytiälä boreal forest, Atmos. Chem. Phys., 22, 5117–5145, https://doi.org/10.5194/acp-22-5117-2022, 2022.
Burkert-Kohn, M., Wex, H., Welti, A., Hartmann, S., Grawe, S., Hellner, L., Herenz, P., Atkinson, J. D., Stratmann, F., and Kanji, Z. A.: Leipzig Ice Nucleation chamber Comparison (LINC): intercomparison of four online ice nucleation counters, Atmos. Chem. Phys., 17, 11683–11705, https://doi.org/10.5194/acp-17-11683-2017, 2017.
Castarède, D., Brasseur, Z., Wu, Y., Kanji, Z. A., Hartmann, M., Ahonen, L., Bilde, M., Kulmala, M., Petäjä, T., Pettersson, J. B. C., Sierau, B., Stetzer, O., Stratmann, F., Svenningsson, B., Swietlicki, E., Thu Nguyen, Q., Duplissy, J., and Thomson, E. S.: Development and characterization of the Portable Ice Nucleation Chamber 2 (PINCii), Atmos. Meas. Tech., 16, 3881–3899, https://doi.org/10.5194/amt-16-3881-2023, 2023.
DeMott, P., Cziczo, D., Prenni, A., Murphy, D., Kreidenweis, S., Thomson, D., Borys, R., and Rogers, D.: Measurements of the concentration and composition of nuclei for cirrus formation, P. Natl. Acad. Sci. USA, 100, 14655–14660, https://doi.org/10.1073/pnas.2532677100, 2003.
DeMott, P. J., Prenni, A. J., Liu, X., Kreidenweis, S. M., Petters, M. D., Twohy, C. H., Richardson, M. S., Eidhammer, T., and Rogers, D. C.: Predicting global atmospheric ice nuclei distributions and their impacts on climate, P. Natl. Acad. Sci. USA, 107, 11217–11222, https://doi.org/10.1073/pnas.0910818107, 2010.
DeMott, P. J., Prenni, A. J., McMeeking, G. R., Sullivan, R. C., Petters, M. D., Tobo, Y., Niemand, M., Möhler, O., Snider, J. R., Wang, Z., and Kreidenweis, S. M.: Integrating laboratory and field data to quantify the immersion freezing ice nucleation activity of mineral dust particles, Atmos. Chem. Phys., 15, 393–409, https://doi.org/10.5194/acp-15-393-2015, 2015.
DeMott, P. J., Hill, T. C. J., Petters, M. D., Bertram, A. K., Tobo, Y., Mason, R. H., Suski, K. J., McCluskey, C. S., Levin, E. J. T., Schill, G. P., Boose, Y., Rauker, A. M., Miller, A. J., Zaragoza, J., Rocci, K., Rothfuss, N. E., Taylor, H. P., Hader, J. D., Chou, C., Huffman, J. A., Pöschl, U., Prenni, A. J., and Kreidenweis, S. M.: Comparative measurements of ambient atmospheric concentrations of ice nucleating particles using multiple immersion freezing methods and a continuous flow diffusion chamber, Atmos. Chem. Phys., 17, 11227–11245, https://doi.org/10.5194/acp-17-11227-2017, 2017.
DeMott, P. J., Möhler, O., Cziczo, D. J., Hiranuma, N., Petters, M. D., Petters, S. S., Belosi, F., Bingemer, H. G., Brooks, S. D., Budke, C., Burkert-Kohn, M., Collier, K. N., Danielczok, A., Eppers, O., Felgitsch, L., Garimella, S., Grothe, H., Herenz, P., Hill, T. C. J., Höhler, K., Kanji, Z. A., Kiselev, A., Koop, T., Kristensen, T. B., Krüger, K., Kulkarni, G., Levin, E. J. T., Murray, B. J., Nicosia, A., O'Sullivan, D., Peckhaus, A., Polen, M. J., Price, H. C., Reicher, N., Rothenberg, D. A., Rudich, Y., Santachiara, G., Schiebel, T., Schrod, J., Seifried, T. M., Stratmann, F., Sullivan, R. C., Suski, K. J., Szakáll, M., Taylor, H. P., Ullrich, R., Vergara-Temprado, J., Wagner, R., Whale, T. F., Weber, D., Welti, A., Wilson, T. W., Wolf, M. J., and Zenker, J.: The Fifth International Workshop on Ice Nucleation phase 2 (FIN-02): laboratory intercomparison of ice nucleation measurements, Atmos. Meas. Tech., 11, 6231–6257, https://doi.org/10.5194/amt-11-6231-2018, 2018.
DeMott, P. J., Mirrielees, J. A., Petters, S. S., Cziczo, D. J., Petters, M. D., Bingemer, H. G., Hill, T. C. J., Froyd, K., Garimella, S., Hallar, A. G., Levin, E. J. T., McCubbin, I. B., Perring, A. E., Rapp, C. N., Schiebel, T., Schrod, J., Suski, K. J., Weber, D., Wolf, M. J., Zawadowicz, M., Zenker, J., Möhler, O., and Brooks, S. D.: Field intercomparison of ice nucleation measurements: the Fifth International Workshop on Ice Nucleation Phase 3 (FIN-03), Atmos. Meas. Tech., 18, 639–672, https://doi.org/10.5194/amt-18-639-2025, 2025.
Findeisen, W.: Kolloid-meteorologische Vorgänge bei Niederschlagsbildung, Meteorol. Z., 55, 121–133, 1938.
Fletcher, N. H.: The physics of rainclouds, Cambridge University Press, Cambridge, United Kingdom, ISBN: 9780521050135, 1962.
Garimella, S., Rothenberg, D. A., Wolf, M. J., David, R. O., Kanji, Z. A., Wang, C., Rösch, M., and Cziczo, D. J.: Uncertainty in counting ice nucleating particles with continuous flow diffusion chambers, Atmos. Chem. Phys., 17, 10855–10864, https://doi.org/10.5194/acp-17-10855-2017, 2017.
Hiranuma, N., Augustin-Bauditz, S., Bingemer, H., Budke, C., Curtius, J., Danielczok, A., Diehl, K., Dreischmeier, K., Ebert, M., Frank, F., Hoffmann, N., Kandler, K., Kiselev, A., Koop, T., Leisner, T., Möhler, O., Nillius, B., Peckhaus, A., Rose, D., Weinbruch, S., Wex, H., Boose, Y., DeMott, P. J., Hader, J. D., Hill, T. C. J., Kanji, Z. A., Kulkarni, G., Levin, E. J. T., McCluskey, C. S., Murakami, M., Murray, B. J., Niedermeier, D., Petters, M. D., O'Sullivan, D., Saito, A., Schill, G. P., Tajiri, T., Tolbert, M. A., Welti, A., Whale, T. F., Wright, T. P., and Yamashita, K.: A comprehensive laboratory study on the immersion freezing behavior of illite NX particles: a comparison of 17 ice nucleation measurement techniques, Atmos. Chem. Phys., 15, 2489–2518, https://doi.org/10.5194/acp-15-2489-2015, 2015.
Hiranuma, N., Adachi, K., Bell, D. M., Belosi, F., Beydoun, H., Bhaduri, B., Bingemer, H., Budke, C., Clemen, H.-C., Conen, F., Cory, K. M., Curtius, J., DeMott, P. J., Eppers, O., Grawe, S., Hartmann, S., Hoffmann, N., Höhler, K., Jantsch, E., Kiselev, A., Koop, T., Kulkarni, G., Mayer, A., Murakami, M., Murray, B. J., Nicosia, A., Petters, M. D., Piazza, M., Polen, M., Reicher, N., Rudich, Y., Saito, A., Santachiara, G., Schiebel, T., Schill, G. P., Schneider, J., Segev, L., Stopelli, E., Sullivan, R. C., Suski, K., Szakáll, M., Tajiri, T., Taylor, H., Tobo, Y., Ullrich, R., Weber, D., Wex, H., Whale, T. F., Whiteside, C. L., Yamashita, K., Zelenyuk, A., and Möhler, O.: A comprehensive characterization of ice nucleation by three different types of cellulose particles immersed in water, Atmos. Chem. Phys., 19, 4823–4849, https://doi.org/10.5194/acp-19-4823-2019, 2019.
Kanji, Z. A., Ladino, L. A., Wex, H., Boose, Y., Burkert-Kohn, M., Cziczo, D. J., and Krämer, M.: Overview of Ice Nucleating Particles, Meteor. Mon., 58, 1.1–1.33, https://doi.org/10.1175/AMSMONOGRAPHS-D-16-0006.1, 2017.
Knopf, D. A., Barry, K. R., Brubaker, T. A., Jahl, L. G.,Jankowski, K. A., Li, J., Lu, Y., Monroe, L. W., Moore, K. A., Rivera-Adorno, F. A., Sauceda, K. A., Shi, Y., Tomlin, J. M., Vepuri, H. S. K., Wang, P., Lata, N. N., Levin, E. J. T., Creamean, J. M., Hill, T. C. J., China, S., Alpert, P. A., Moffet, R. C., Hiranuma, N., Sullivan, R. C., Fridlind, A. M., West, M., Riemer, N., Laskin, A., DeMott, P. J., and Liu, X.: Aerosol–Ice Formation Closure: A Southern Great Plains Field Campaign, B. Am. Meterol. Soc., 102, E1952–E1971, https://doi.org/10.1175/BAMS-D-20-0151.1, 2021.
Krämer, M., Rolf, C., Spelten, N., Afchine, A., Fahey, D., Jensen, E., Khaykin, S., Kuhn, T., Lawson, P., Lykov, A., Pan, L. L., Riese, M., Rollins, A., Stroh, F., Thornberry, T., Wolf, V., Woods, S., Spichtinger, P., Quaas, J., and Sourdeval, O.: A microphysics guide to cirrus – Part 2: Climatologies of clouds and humidity from observations, Atmos. Chem. Phys., 20, 12569–12608, https://doi.org/10.5194/acp-20-12569-2020, 2020.
Lacher, L., Adams, M. P., Barry, K., Bertozzi, B., Bingemer, H., Boffo, C., Bras, Y., Büttner, N., Castarede, D., Cziczo, D. J., DeMott, P. J., Fösig, R., Goodell, M., Höhler, K., Hill, T. C. J., Jentzsch, C., Ladino, L. A., Levin, E. J. T., Mertes, S., Möhler, O., Moore, K. A., Murray, B. J., Nadolny, J., Pfeuffer, T., Picard, D., Ramírez-Romero, C., Ribeiro, M., Richter, S., Schrod, J., Sellegri, K., Stratmann, F., Swanson, B. E., Thomson, E. S., Wex, H., Wolf, M. J., and Freney, E.: The Puy de Dôme ICe Nucleation Intercomparison Campaign (PICNIC): comparison between online and offline methods in ambient air, Atmos. Chem. Phys., 24, 2651–2678, https://doi.org/10.5194/acp-24-2651-2024, 2024.
Lohmann, U., Lüönd, F., and Mahrt, F.: An Introduction to Clouds: From the Microscale to Climate, Cambridge University Press, Cambridge, United Kingdom, 381 pp., https://doi.org/10.1017/CBO9781139087513, ISBN 9781139087513, 2016.
Möhler, O., Adams, M., Lacher, L., Vogel, F., Nadolny, J., Ullrich, R., Boffo, C., Pfeuffer, T., Hobl, A., Weiß, M., Vepuri, H. S. K., Hiranuma, N., and Murray, B. J.: The Portable Ice Nucleation Experiment (PINE): a new online instrument for laboratory studies and automated long-term field observations of ice-nucleating particles, Atmos. Meas. Tech., 14, 1143–1166, https://doi.org/10.5194/amt-14-1143-2021, 2021.
Murray, B.: Cracking the problem of ice nucleation, Science, 355, 346–347, https://doi.org/10.1126/science.aam5320, 2017.
Mülmenstädt, J., Sourdeval, O., Delanoë, J., and Quaas, J.: Frequency of occurrence of rain from liquid-, mixed-, and ice-phase clouds derived from A-Train satellite retrievals, Geophys. Res. Lett., 42, 6502–6509, https://doi.org/10.1002/2015GL064604, 2015.
Petters, M. D. and Wright, T. P.: Revisiting ice nucleation from precipitation samples, Geophys. Res. Lett., 42, 8758–8766, https://doi.org/10.1002/2015GL065733, 2015.
Polen, M., Brubaker, T., Somers, J., and Sullivan, R. C.: Cleaning up our water: reducing interferences from nonhomogeneous freezing of “pure” water in droplet freezing assays of ice-nucleating particles, Atmos. Meas. Tech., 11, 5315–5334, https://doi.org/10.5194/amt-11-5315-2018, 2018.
Pruppacher, H. R. and Klett, J. D.: Microphysics of Clouds and Precipitation, Springer, Dordrecht, The Netherlands, 954 pp., https://doi.org/10.1007/978-0-306-48100-0, ISBN 978-0-7923-4211-3, 2010.
Richardson, M. S., DeMott, P. J., Kreidenweis, S. M., Cziczo, D. J., Dunlea, E. J., Jimenez, J. L., Thomson, D. S., Ashbaugh, L. L., Borys, R. D., Westphal, D. L., Casuccio, G. S., and Lersch, T. L.: Measurements of heterogeneous ice nuclei in the western united states in springtime and their relation to aerosol characteristics, J. Geophys. Res.-Atmos., 112, D02209, https://doi.org/10.1029/2006JD007500, 2007.
Riechers, B., Wittbracht, F., Hütten, A., and Koop, T.: The homogeneous ice nucleation rate of water droplets produced in a microfluidic device and the role of temperature uncertainty, Phys. Chem. Chem. Phys., 15, 5873–5887, https://doi.org/10.1039/C3CP42437E, 2013.
Schrod, J.: Data for the figures of the manuscript: A view on recent ice-nucleating particle intercomparison studies: Why the uncertainty of the activation conditions matters, Goethe University Data Repository (GUDe) [data set], https://doi.org/10.25716/gude.1j28-hp2d, 2024.
Ullrich, R., Hoose, C., Möhler, O., Niemand, M., Wagner, R., Höhler, K., Hiranuma, N., Saathoff, H., and Leisner, T.: A New Ice Nucleation Active Site Parameterization for Desert Dust and Soot, J. Atmos. Sci., 74, 699–717, https://doi.org/10.1175/JAS-D-16-0074.1, 2017.
Wegener, A.: Thermodynamik der Atmosphäre, J. A. Barth, Leipzig, Germany, 331 pp., 1911.
Wex, H., Augustin-Bauditz, S., Boose, Y., Budke, C., Curtius, J., Diehl, K., Dreyer, A., Frank, F., Hartmann, S., Hiranuma, N., Jantsch, E., Kanji, Z. A., Kiselev, A., Koop, T., Möhler, O., Niedermeier, D., Nillius, B., Rösch, M., Rose, D., Schmidt, C., Steinke, I., and Stratmann, F.: Intercomparing different devices for the investigation of ice nucleating particles using Snomax® as test substance, Atmos. Chem. Phys., 15, 1463–1485, https://doi.org/10.5194/acp-15-1463-2015, 2015.
Wolf, M., Zhang, Y., Zawadowicz, M., Goodell, M., Froyd, K., Freney, E., Sellegri, K., Rosch, M., Cui, T., Winter, M., Lacher, L., Axisa, D., DeMott, P., Levin, E., Gute, E., Abbatt, J., Koss, A., Kroll, J., Surratt, J., and Cziczo, D.: A biogenic secondary organic aerosol source of cirrus ice nucleating particles, Nat. Commun., 11, 4834, https://doi.org/10.1038/s41467-020-18424-6, 2020.
- Abstract
- Introduction
- Reviewing recent INP instrument intercomparison measurements
- Estimating the effect of the temperature uncertainties
- Conclusions
- Appendix A
- Appendix B
- Data availability
- Author contributions
- Competing interests
- Disclaimer
- Acknowledgements
- Financial support
- Review statement
- References
- Supplement