the Creative Commons Attribution 4.0 License.
the Creative Commons Attribution 4.0 License.
Calibration of optical particle spectrometers using mounted fibres
Jessica Girdwood
Harry Ballington
Chris Stopford
Rob Lewis
Evelyn Hesse
Calibrations of optical particle spectrometers (OPSs) are non-trivial and conventionally involve aerosolisation techniques, which are challenging for larger particles. In this paper, we present a new technique for OPS calibration that involves mounting a static fibre within the instrument sample area, measuring the scattering cross section (SCS), and then comparing the SCS with a calculated value. In addition, we present a case for the use of generalised Lorenz–Mie theory (GLMT) simulations to account for deviations in both minor- and major-axis beam intensity, which has a significant effect on particles that are large compared with the beam waist, in addition to reducing the need for a “top-hat” spatial intensity profile. The described technique is OPS independent and could be applied to a field calibration tool that could be used to verify the calibration of instruments before they are deployed. In addition to this, the proposed calibration technique would be suited for applications involving the mass production of low-cost OPSs.
- Article
(4004 KB) - Full-text XML
- BibTeX
- EndNote
Aerosol particle and cloud droplet measurements are essential for characterising air pollution and atmospheric and climate processes. Aerosol particles and droplets can be described using multiple different properties – including size, shape, and composition – which may be useful in different scenarios. These measurements are important for the characterisation of aerosol–cloud interactions (Redemann et al., 2021), cloud evolution and precipitation dynamics (Pinsky and Khain, 2003), and aerosol–radiation interactions (Haywood et al., 2021) – all of which modulate aerosol radiative forcing, which causes large uncertainties in climate model predictions (Masson-Delmotte et al., 2021).
Aerosol and droplet physical properties are often estimated or derived from electrical, gravimetric, aerodynamic, and optical parameters, which can be directly measured using a variety of techniques. The optical properties of an aerosol particle or droplet are often used to calculate the size of aerosol particles and droplets, and they can also be employed to extract some shape information (Cotton et al., 2010; Vochezer et al., 2016). Instruments that measure the optical properties of a particle are useful in situations in which large networks of devices are desired, because miniaturised devices are available at low cost from manufacturers such as Alphasense (Alphasense, 2024) and Senserion (Sensirion AG, 2024). These devices are known as in situ optical particle spectrometers (OPSs) or optical particle counters (OPCs).
OPSs utilise the optical elastic scattering properties of an aerosol particle to derive its physical parameters. Normally this (parameter) is diameter; however, the small ice detector (SID; Cotton et al., 2010) and particle phase discriminator (PPD; Vochezer et al., 2016) instruments utilise spatially resolved elastic scattering to determine the particle phase and morphology – which is most commonly applied to the ice crystal habit.
A generalised OPS will directly measure the scattering cross section (SCS; Pinnick and Auvermann, 1979). In order to compute the particle radius from the SCS, an inverse problem must be solved whereby a simulation of the SCS versus some physical dimension – unique to a specific material – is used to generate a lookup table or instrument response curve. This response curve has an inherent dependency on the material optical properties, namely the real and imaginary refractive index, physical homogeneity and morphology, and isotropicity. Commonly, Lorenz–Mie theory is used to generate this response curve, which adds the assumption that the aerosol consists of spherical particles.
The OPS will normally achieve an SCS measurement by illuminating the particle with a light source – commonly a laser diode – and integrating the scattered light over the area of some photodetector (normally a photomultiplier tube or photodiode). The exact angles chosen is a design compromise between increasing the scattered-light intensity, reducing dependency on the refractive index, and creating a more monotonic lookup table. For example, the forward scattering spectrometer probe (FSSP; Dye and Baumgardner, 1984; Baumgardner et al., 1985; Baumgardner and Spowart, 1990) uses forward scattering, which leads to a large scattered-light intensity on the detector (and therefore high signal-to-noise ratio) and a low dependency on the refractive index. However, the Universal Cloud and Aerosol Sounding System (UCASS; Smith et al., 2019) uses a detector centred on 60°, resulting in a highly monotonic lookup table for Lorenz–Mie computations.
A modern OPS is calibrated by creating a linear calibration function to map the photoelectric current produced by the photodetector to the SCS, as demonstrated in Rosenberg et al. (2012). This calibration function has two coefficients. The zeroth-order coefficient (y intercept) is primarily determined by the amount of stray light on the photodetector resulting from light from the laser scattering off internal instrument surfaces, as no surface is perfectly absorbing nor is any laser perfectly aligned. The first-order coefficient (gradient) depends on the transimpedance amplifier (TIA) current gain, the quantum efficiency of the photodetector, and the tolerances in analogue-signal-processing electronics.
This calibration function is determined experimentally. Conventionally, this experiment consists of generating size-monodisperse aerosol and transporting the aerosol through the sample area (Pinnick and Auvermann, 1979; Kim and Boatman, 1990; Rosenberg et al., 2012); well-characterised multi-modal particle sources have also been used (Binnig et al., 2007; Heim et al., 2008). However, these techniques are reliant on the generation and transportation of aerosol, which renders the calibration sensitive to both particle loss mechanisms and perturbations in particle size due to the generation apparatus. Particle losses become particularly significant when generating aerosol particles with high inertia, due to gravitational settling and deposition in transport tubing. This is a problem because larger sizes are important for constraining the first-order calibration coefficient. In addition, calibrations that use manufactured monodisperse silica, glass, or latex spheres – for example, Rosenberg et al. (2012) – are dependent on the engineering tolerances of said monodisperse particles, which leads to a tolerance-stacking effect, whereby the error in the particle size estimate is the product of instrument tolerances and particle calibration standard tolerances.
The conventional calibrations use homogeneous spheres to generate scattered light, as the scattering can be solved analytically. However, there is no additional reason why spheres need to be used to create a specific SCS in the beam; as long as the SCS is known exactly, any object can be used. One object via which the SCS can be determined analytically is an infinitely long fibre. If such a fibre were to be long enough to completely traverse the laser beam, it could be considered as such (infinitely long). In this paper, we experiment with the use of statically mounted fibres for the generation of an SCS in the calibration of OPSs. The UCASS was chosen as the tested OPS, as it is a research instrument that is produced in moderately sized batches, meaning that many versions of the same instrument can be compared against each other. It is the intention of the authors that the presented technique is OPS independent. A number of UCASS OPSs were calibrated using both the fibre method and a conventional method involving aerosol microspheres. It is the intention that this technique can be used to supplement conventional aerosol calibrations when larger particles are considered. In addition, a static-fibre tool could be used as a portable field calibration method, as it would not require a clean environment or a bulky aerosolisation apparatus.
2.1 Fibre SCS calculation
Generally, a scattering cross section can be defined from its relation to the scattered electromagnetic energy (in units of watts) and input irradiance (in units of watts per square metre) as follows:
where σ is the SCS (in units of square metres), W is the electromagnetic energy that crosses the surface of an imaginary cylinder in the far field (labelled A in Fig. 1), and Ii is the incident irradiance. The variable definitions are consistent with Fig. 1.
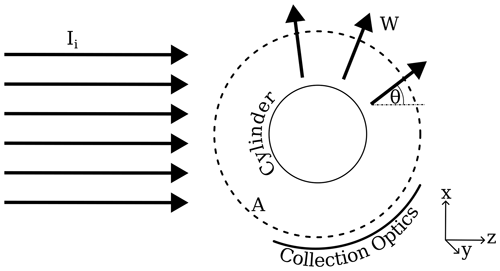
Figure 1An illustration of the variable definitions used for the scattering calculations. Ii is the incident irradiance, W is the scattered-light power that crosses the far-field area A, and θ is the zenith angle.
The SCS of an arbitrary particle, taken from Bohren and Huffman (1998), is given by
where σ is the SCS, θ is the zenith angle, ϕ is the azimuth angle, k is the wave number, and X is the vector scattering amplitude. X is related to phase function (p11) by
The phase function is the distributed scattered electromagnetic radiation intensity, which is normalised such that its integral is unity. The SCS of a long fibre that intersects an OPS laser beam can be treated as an infinitely long cylinder with normally incident irradiance. As the SCS of an infinitely long cylinder would be infinite, the SCS per-unit length can be calculated (Bohren and Huffman, 1998). Thus Eq. (1) becomes
where is the SCS per-unit length (in units of square metres per metre), l is the length of the fibre (in units of metres), y is the distance in the direction of the axis of the cylinder (as shown in Fig. 1), and the rest of the variable definitions are consistent with Fig. 1 and Eq. (1).
In the case of an OPS, the length of the fibre is actually the width of the laser beam in the y direction. This means that the assumption of negligible diffraction over the flat edges of the fibre is valid, as these edges are not within the laser beam in this scenario. However, because laser beams in OPSs are often focused at the sample area, the intensity distribution of the laser beam in the y direction is a Gaussian distribution. Therefore, it is more convenient to express Eq. (4) as follows:
where β(y) is the energy distribution of the laser beam as a function of distance along the y axis, normalised such that its integral is equal to the width of a beam with a “top-hat” energy distribution and the same average energy density and total energy as the real beam. The double integral in Eq. (2) is then more convenient to express in cylindrical coordinates; thus, the SCS of a fibre that extends over the full width of the OPS laser is given by
As, in this instance, is not a function of y because the fibre is uniform along its axis, the outer integral in Eq. (6) can be solved. For practical applications, the SCS integral needs to be modified to include a weighting function that accounts for the instrument optics, similar to that used in Pinnick and Auvermann (1979) and Rosenberg et al. (2012). This has a value of either 0 or 1 and is a function of both θ and ϕ. However – in order to dismiss the outer integral in Eq. (6) – it is more convenient to express the weighting function as representing the proportion of ϕ angles collected as a function of θ only. Equation (6) therefore becomes
where ω(θ) is the weighting function representing the instrument optics and ds is the width of the theoretical top-hat beam. The actual value of ds can be incorporated into the final calibration coefficient. If the proportion of light measured is independent of change in the y direction, which was determined experimentally to be true for all of the optical systems discussed in this paper, the value of ω(θ) for an OPS with n number of collecting optical surfaces can be generally expressed as follows:
where Θ1 and Θ2 are the beginning and terminating angles of collecting optic number i respectively, and H is the Heaviside function of θ. For the UCASS, the assumptions made for Eq. (8) are valid; however, this would need to be carefully considered if one were to apply this equation to cloud probes with large optical path lengths. In that instance, the weighting function of θ should be re-derived, as it would have values other than 0 and 1. can be computed by common Mie scattering codes, such as the code of Schäfer (2011) used for the cylinder SCS computation in this paper.
2.2 Sphere SCS calculation
In this work, the SCS calculation for a sphere needs to be conducted for two reasons: (1) to compute the SCS from the traditional aerosol calibration and (2) to calculate the final data product (i.e. the cloud droplet or aerosol particle diameter from the SCS measured by the instrument). In previous studies, the variation in beam power along its minor axis – the y direction – has been neglected. However, for a sufficiently large particle, this assumption is invalid. The definition of sufficiently large here will depend on the width of the laser beam, and establishing this point is the topic of this section.
As, in this instance, the differential SCS in Eq. (5) is a function of y, the outer integral in Eq. (6) cannot be solved as easily. In addition, the SCS integral is now more convenient to express in spherical coordinates; therefore, the detecting optics weighting function is applied to Eq. (2). In order to solve the differential SCS as a function of θ and ϕ, while accounting for the non-uniform intensity profile of the laser beam in the y direction, generalised Lorenz–Mie theory (GLMT) can be employed. GLMT works by altering the Mie coefficients of the electromagnetic waves in order to render them representative of a Gaussian beam. As this method implicitly accounts for β(y), the SCS equation is then
Note that, in this instance, the weighting function is both a function of θ and ϕ due to the azimuthally non-constant scattering amplitude. Thus, can be obtained from the GLMT simulations. A generalised, OPS-independent weighting function is derived in vector form here as follows:
where R is a vector in the direction of a scattered light ray with zenith and azimuth angles of θ and ϕ; C is a vector in the direction of the geometric centre of the surface of the collecting optic; , , and are unit vectors in the x, y, and z directions, as labelled in Fig. 1; αl is the half angle of the collecting optic; and Θl and Φl are the zenith and azimuth angles of the centre of the collecting optic. If there are multiple collecting optics or – as there often are for beam dumps – holes in any collecting optics, ω can be computed for each component – where holes in optical surfaces are treated as components – and then added or subtracted as necessary.
The GLMT simulations, which were used in this paper, are described in Jia et al. (2017), and the beam shape coefficient calculation used was the localised approximation method described in Wang and Shen (2018). The difference that GLMT versus conventional Lorenz–Mie theory (LMT) scattering simulations made to the finished SCS lookup table is shown in Fig. 2. The discrepancy between the two calculation methods is more noticeable when the beam width is small compared with the size of the particle. This would lead to the under-sizing of larger particles, as the same detector photocurrent would be interpreted as scattered by a smaller particle for LMT compared with GLMT.
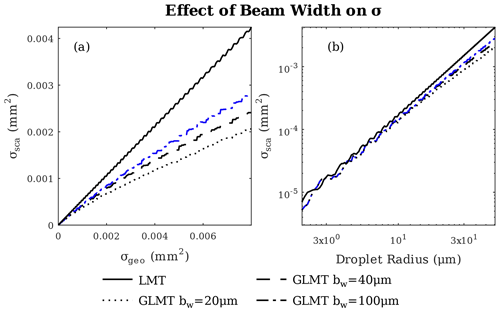
Figure 2Plots of the GLMT simulation results compared with conventional LMT. Panel (a) shows the scattering cross section versus the geometric cross section for LMT and three different beam widths; panel (b) shows the same but on a log–log axis and with the geometric cross section abstracted by droplet radius – a more conventional plot for OPS users. The refractive index used was that of water (1.33+0j).
The following subsections describe the methodology by which the calibration data were obtained using both the static fibres and a conventional monodisperse aerosol (see Sect. 3.1 and 3.2 respectively). While the instruments being calibrated were all UCASS units, there were two separate TIA gains and, therefore, two separate size ranges: approximately 0.4–18 µm for high gain (HG) and 3–40 µm for low gain (LG). As discussed further in Sect. 3.1, the selection of fibres with low SCS values was non-trivial, and three data points for each instrument were required. Therefore, the fibre calibrations for the HG UCASS units were conducted using two fibre SCS data points and one aerosol SCS data point.
3.1 Fibre calibration
An OPS, be it naturally aspirated or aspirated via a pump or fan, requires the movement of a transport fluid – usually air – through a sample area in a laser beam, in order to measure the optical properties of the particles contained within said transport fluid. Implicitly, this means that any given particle trajectory will generate a temporal response, the amplitude of which is proportional to the SCS of the particle at any given point as it traverses the laser beam. While some OPSs record the whole temporal response of a particle for analysis and debugging purposes, whereas others will simply record the peak height of the particle, which is proportional to the SCS when it is in the centre of the beam, an OPS will always require this temporal response on the photodetector in order for the firmware to appropriately register a particle and record its optical parameters.
While considering a statically mounted fibre, there are a number of methods to potentially accomplish a temporal response similar to a real particle. The methods considered in this paper are as follows: (i) devising an apparatus to vibrate the fibre through the sample area of the beam, (ii) directly measuring the output of the TIAs that are used to amplify the photocurrent from the detector into a voltage proportional to the SCS, and (iii) devising an apparatus to flash the laser in a way that mimics the intensity profile of a particle's temporal response.
Method (i) is the most complex and would require significant development. A similar technique was developed for use with optical array probes in Connolly et al. (2007) and O'Shea et al. (2021); in their work, ice crystal analogues were moved through the sample volume on a glass slide. This would likely not work for OPS-type probes, as the microscope slide would have a significant effect on the scattered light and the van der Waals force would not be sufficient to properly attach the sampled medium to the slide. Moreover, this technique would be less suited for use in a field calibration tool, as it would likely require instruments to be rigidly mounted to an optical bench.
Method (ii) is the simplest approach, as it would not require any additional apparatus aside from a multimeter to measure the TIA output. However, this method would require a minor modification to potentially expensive equipment – that is, flying leads attached to the TIA output pins – and a replication in the various computations conducted in both the instrument analogue electronics and firmware in order to calculate a scaled instrument response from a voltage, which is often impossible due to insufficient information being available from the manufacturer. In addition, the TIAs in some instruments may not be accessible.
Method (iii) can be accomplished via two means: (1) using a rotating disc with a mask in the laser path to flash the laser at particular intervals or (2) electrically manipulating the laser driver circuit in order to turn the laser on and off at a specific frequency. The latter has the benefit of not involving the use of mechanical components beyond the introduction of the fibre to the laser beam, in addition to the potential to add a laser-flashing mode to the instrument firmware for calibration purposes. Unlike method (ii), this method has the additional benefit of utilising the same computation and pulse filtering steps that are built into the instrument, meaning that if a calibration pulse is measured in the instrument software, it would be counted as a valid particle. In this instance, method (iii) via the means of electrical manipulation of the laser driver circuit was chosen, as any method requiring mechanical masking of the laser would not be possible due to the limited space available in the UCASS beam optics assembly. However, this would be an interesting method to test with different instruments.
In order to flash the laser with a Gaussian pulse, the laser driver had to be modified to minimise the input capacitance. This was because the maximum pulse width of the temporal response accepted by the UCASS is 50 µs, which was filtered out by the standard circuit. Hereafter, the modified circuit will be referred to as the laser pulse driver (LPD). The major requirement for the LPD was to be able to flash the laser with a pulse width that would both be accepted by the instrument firmware and have a peak pulse irradiance equal to the static irradiance of the continuous-wave beam. In order to accomplish this, all of the filtering capacitors were removed from the LPD, and a low-side switch was added to the circuit via the addition of an enhancement-mode N-channel metal–oxide–semiconductor field-effect transistor (MOSFET), the gate of which was driven, in this instance, by a signal generator that was set to produce a Gaussian pulse. A future development of this design could negate the use of an LPD entirely by utilising a version of the instrument firmware that could drive the laser with a pulse, in addition to a different choice of filtering capacitors in the laser driver circuit, which were originally oversized because the laser only needed to achieve continuous-wave operation. The LPD was used in this case because we possess the knowledge to modify the chosen instruments; however, we would recommend that instrument manufacturers build this capability into their instruments if they wish to calibrate them this way. For a field calibration system, a mechanism by which the laser is flashed using mechanical means would be far more attainable.
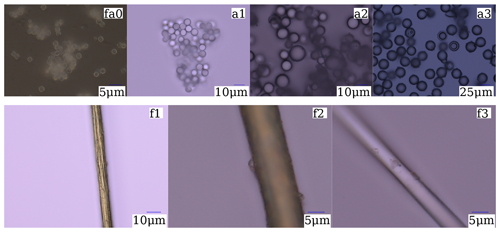
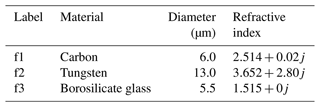
The differential SCS of the statically mounted fibre depends on both its radius and refractive index. For this prototype study, it was determined that three fibre SCS data points would be sufficient, as the relationship between the analogue-to-digital (ADC) converter peak height and the scattering cross section is linear and can, therefore, be modelled with a two-coefficient polynomial. However, for future studies, more data points surrounding the Mie oscillations in the particle diameter lookup table should be obtained, while surmounting practical limitations surrounding the manufacture of the fibres themselves. The three fibres were chosen to have a similar SCS to that of their aerosol particle counterpoints, which will be discussed further in Sect. 3.2. One drawback to this calibration method was the difficulty of obtaining a fibre with an SCS small enough to acquire a calibration data point in the lower end of the OPS size range. This is because the fibre spanned the entire width of the laser beam minor axis, thereby resulting in a larger exposed area when compared with a sphere of similar diameter. In order to surmount this issue, fibres constructed from materials with large imaginary refractive index components were chosen; these materials were tungsten and extruded carbon. A summary of the chosen fibres in ascending order of SCS magnitude is provided in Table 1, and microscope images of said fibres are presented in Fig. 3. Future expansions of this research would benefit from advanced ultrafine-fibre manufacturing techniques.
Table 1A summary of the fibres used as calibration data points. The given refractive index is calculated using the wavelength of the UCASS laser, which is 658 nm.
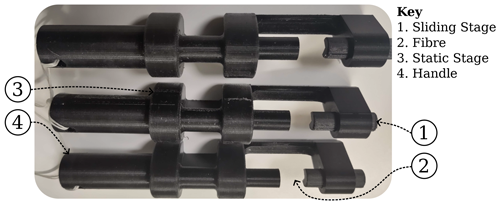
In order to mount the fibres in the sample volume of the UCASS, custom mounts were designed (see Fig. 4). The mounts were constructed from 3D-printed acrylonitrile butadiene styrene (ABS), and they had two components. Each end of the fibres was positioned in a groove in each of the components, which were fitted together in such a way as to be able to stretch the fibre tight once it was in position. A locking screw was added to secure the two parts of the fibre holder at a fixed distance apart, which was wide enough not to cause interference in the path of scattered or direct light. In order to position the fibres in the mounts, a microscope was used with a micromanipulator. Once the fibres were in the mounts, hot glue was used to secure both ends in place. The fibre could then be pulled tight in the holder to ensure it intersected the sample volume without flexing. Hot glue was chosen as the adhesive for two main reasons: the fibres were not under particularly strong force, and the adhesive could easily be removed without damaging the fibre holder should the fibre snap during its mounting process. As a short test of the validity of this method, the fibre was moved around in the UCASS sample area while the LPD was turned on. This was to ensure that the response of the instrument did not change much depending on the fibre position. If the response of the UCASS instruments varied too much, this was considered to be a flaw in the instrument optical alignment – which could cause an anisotropic distribution of light on the photodetector – or a highly variable laser energy density distribution across the sample volume. This was not the case for any of the UCASS units that were used for the experiments presented in this paper.
3.2 Aerosol calibration
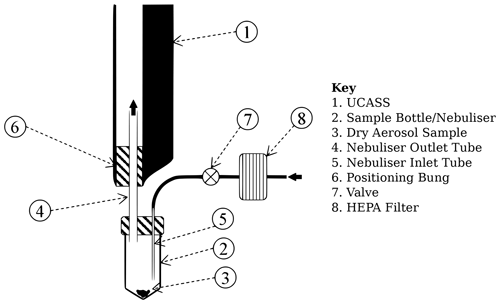
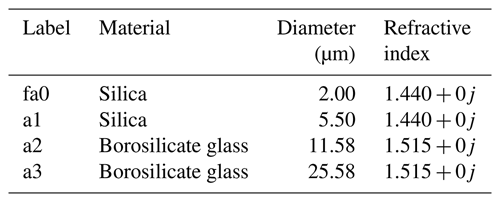
The aerosol calibration method was similar to that described in Rosenberg et al. (2012) and Smith et al. (2019). Small numbers of dry monodisperse glass beads and silica microspheres were placed in a nebuliser that was flushed with clean air from a compressor through the instrument. As the UCASS is an open-path instrument, the airflow velocity at the outlet of the nebuliser needed to be measured in order to ensure that the aerosol particle beam traversal times were within the range of acceptable values defined in the instrument firmware. A summary of the calibration aerosol particles used is presented in Table 2, and microscope images of said aerosol particles are shown in Fig. 3.
Table 2A summary of the aerosol particles used as calibration data points. The given refractive index is again calculated using the wavelength of the UCASS laser, which is 658 nm.
A diagram of the apparatus can be found in Fig. 5. The air from the compressor was filtered with a high-efficiency particulate-air (HEPA) filter to minimise contamination from external sources. The air behind the system valve was pressurised to 2 atm to ensure that enough turbulence was generated in the bottle in order to break up the particles and minimise the presence of doublets and triplets; residual doublets and triplets were present as obvious secondary and tertiary peaks and, hence, filtered out in post-processing. The exact pressure needed to accomplish this was found via an iterative process, as identification of doublets and triplets in the data was trivial. The nebuliser consisted of a sample bottle with an inlet for clean air and an outlet for sample-laden air. Samples were inserted into the nebuliser by means of a sterile scalpel blade, which was disposed of between calibrations. The calibration for one size of aerosol was conducted for all instruments, after which the apparatus was cleaned thoroughly. Clean air was then run through the apparatus with a high-gain UCASS measuring the output, in order to ensure that it was clean.
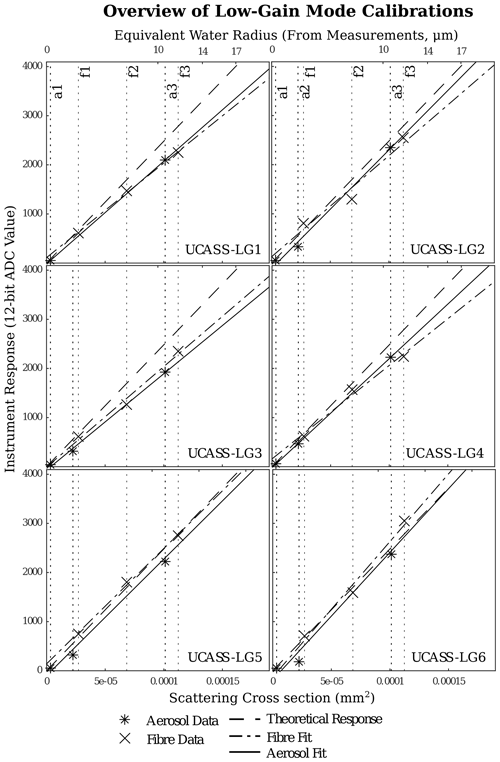
The per-unit results for the fibre and aerosol calibrations for both the high-gain and low-gain UCASS units are shown in Figs. 6 and 7 respectively. These plots show the SCSs of the calibration data (and the corresponding approximate water droplet radius on the top axis) against the instrument response of each UCASS unit to the said datum. The data used are labelled with their corresponding table entry in either Table 2 or Table 1 at the top of each figure. As previously stated, each fit was conducted using three data points. In Fig. 6, the datum labelled fa0 is the one that has been shared between the two calibrations. The serial number of each UCASS unit is annotated in the corresponding plot panel. The theoretical response – which is computed from idealised values for TIA current gain, alignment, and laser power – of each UCASS unit is denoted using a dotted line. This is mostly shown for reference, as the deviation of any one calibration from this line would be indicative of the performance of an individual unit, as opposed to being indicative of a calibration-related issue.
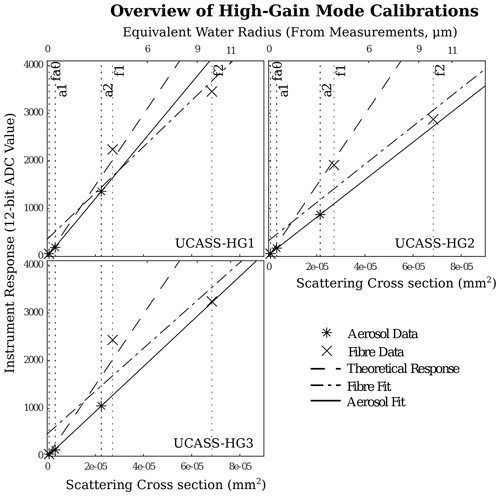
Figure 6Overview of the calibrations for the high-gain UCASS units. The instrument response is on the y axis; the scattering cross section is on the bottom x axis. The top x axis on all of the plots is a log axis and shows to the approximate radius of a water droplet with a scattering cross section corresponding to the lower x axis. The vertical dotted lines highlight the calibration particles used, and the label corresponds to the table entry in Tables 1 and 2.
It is obvious at this stage that the low-gain UCASS calibration was far more successful than that of the high-gain UCASS. Calibration datum f1 produces a consistently larger-than-expected instrument response for all of the high-gain units. This is likely not an issue with the computation of the f1 datum SCS, as the effect is not present for the low-gain units, for which the same calculation parameters were used. As the main difference between the two gain modes is the inclusion of the fa0 datum, which is at the lowest extremity of the size range, it is probable that the error results from a discrepancy in the measured offset – coefficient c0 – between the two calibrations. The calibration computations utilising the fibre data were consistently larger than that which utilised the aerosol data; the correlation of fibre c0 to aerosol c0 resulted in a regression gradient of 2.7, with a correlation coefficient of 0.6, which is shown in Fig. 8a. Throughout Fig. 8, the “x” markers show a value from a low-gain UCASS, whereas the “o” markers show a value from a high-gain UCASS.
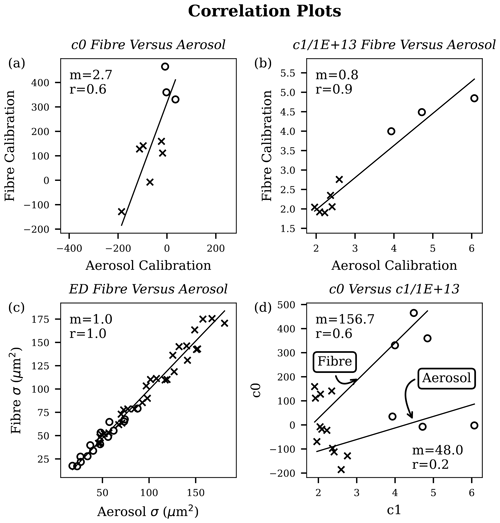
Figure 8Correlation plots for all of the calibrations. Panel (a) shows the zeroth-order coefficient measured for the fibre and aerosol calibrations; panel (b) shows the same but with the first-order coefficient; panel (c) shows the difference in effective diameter computed from a simulated Gaussian distribution with unity standard deviation, with varying initial effective diameter; and panel (d) shows the zeroth-order coefficient correlated with the first-order coefficient for both calibrations.
Deviations in the offset coefficient result from constant artefacts that affect all particle sizes equally. Mostly, this is due to either a non-zero static stray light resulting from ineffective termination of the laser in the beam dump or diffracted light from the 2 mm aperture in the beam-forming optics. Differences in the offset coefficient can also result from the tolerance in TIA internal voltage offset. Because the estimation of the offset coefficient for the aerosol calibration is often negative, which is impossible, part of this issue is likely due to an error in the calculation of the SCS projected by the spherical particles. The stray-light value could also have been higher for fibres due to the fibre mount reflecting stray laser light onto the collecting optics and the detector. Figure 8d shows the correlation of the instrument photocurrent gain – coefficient c1 – with the offset coefficient c0. This plot should reveal how much of the offset coefficient resulted from stray light, as the photocurrent gain will affect stray light and light scattered from a particle in the same way. The gradient of the regression line for the fibre calibration was around twice that of the aerosol calibration, thus indicating more stray light present in the fibre calibration. However, the correlation coefficient was small in both cases, which indicated another influencing factor on the stray-light discrepancy.
It was considered that this additional factor resulted from the use of GLMT simulations, as some errors in the computation of the theoretical SCS of a calibration particle would influence the calibration curve. However, as is demonstrated in Fig. 2, the difference between GLMT and LMT was mostly only significant for particles with larger diameters when compared with the beam width, and the beam width of the UCASS is 40 µm. Instead, the negative results for the offset coefficient likely resulted from a misrepresentation of either the modal size or refractive index of one of the monodisperse samples used. As Figs. 6 and 7 show a systematic overestimation of the SCS of calibration particle a2, it is likely that this particular particle standard was the cause. This highlights one of the difficulties of calibrating with monodisperse aerosol, as the calculations are highly sensitive to deviations in the modal diameter and refractive index of the particle standards used, and manufacturing techniques for said samples are subject to error, which results in a tolerance-stacking effect. Figure 3 shows the calibration standards that were used in these experiments. The deviation in size between different particles is particularly apparent for the a2 standard, which was unexpected in a monodisperse sample. It is difficult to determine the mode of this distribution from a microscope image, but the broadness of the sizes that were revealed offer once possible explanation as to why this particular standard was overestimated in diameter.
Despite this, the correlation of the photocurrent gain coefficient – c1 – computed from the fibre and aerosol data was reasonable (0.9) and had a gradient of 0.8. This correlation is shown in Fig. 8b. This indicated that, on average, the aerosol data yielded slightly higher photocurrent gain coefficients than the fibre calibration. This discrepancy could be due to an incorrect measurement of the monodisperse particle modal diameter at the factory or an incorrect measurement of the fibre diameter under the microscope. The fact that the c1 correlation was reasonable but c0 was not indicated that the error in the offset was systematic across all of the particle standards. This, again, did not indicate that the error was due to a discrepancy between LMT and GLMT simulations, as larger sizes would be affected more strongly, causing a discrepancy in both coefficients. The systematic error could be the result of the manufacturing of the calibration standards; however, more information would be needed to validate this claim, and part of this offset can be explained by the aforementioned stray light reflected off the fibre holder. As the agreement between the two calibrations depended on many factors that were unlikely to ever be perfect, it is important to know the sensitivity of the final data to these errors.
In order to demonstrate the sensitivity of the predicted effective diameter of a distribution of particles to the two coefficients, a number of normal distributions of particles were simulated, and the two calibrations were then compared with one another. The normal distributions had unity standard deviation; the initial mean was varied between 12-bit ADC values of 500 and 3500, with five data points in total, which were then binned into 16 bins (the number of bins that the UCASS is capable of reporting). The aerosol and fibre calibration data were then used to compute the “measured” size from the simulated ADC histograms. The effective diameter – that is, the ratio of the third to the second statistical moments, as defined in Korolev et al. (1999) – of the size distributions was chosen as an appropriate dependent variable to compare, as this is a commonly used parameter. Because diameter is not computed from the SCS in this instance, the parameter used is actually the effective SCS. The results from this experiment are presented in Fig. 8d, where it can be seen that the gradient of the best-fit line is 1.0 and the correlation coefficient is 1.0. This result demonstrates that the measured effective SCS was not particularly sensitive to discrepancies in the two coefficients at this magnitude.
A calibration methodology for OPSs was devised that utilises statically mounted fibres as the scattering media. An equation for the SCS of a statically mounted fibre was derived from Bohren and Huffman (1998), along with an instrument-independent weighting function (Eq. 8). Calibration data were obtained from nine UCASS instruments (Smith et al., 2019), using both static fibres and a conventional monodisperse aerosol technique. For the fibre calibration, the fibres were positioned on custom-designed mounts, and the laser beam of the UCASS was pulsed so as to mimic the temporal response of a particle trajectory. For the aerosol calibration, GLMT simulations were used in place of conventional LMT to account for the shape of the laser beam minor axis at the sample volume. As the relationship between the instrument response and scattering cross section – that is, the response of a TIA-detector circuit to a given light input – is linear, the calibration can be conducted in this domain, and only two regression coefficients are needed. The calibration data using both methods were compared and analysed, and the principle artefacts that affected said data were discussed. One technique that was adopted to aid the intercomparison was the use of simulated data; using this method, a particle size distribution was created in the ADC response domain, and this distribution was then converted to an SCS using the two calibrations. The principle conclusions of this work can be summarised as follows:
-
The use of LMT caused an underestimation in the particle SCS when the particle had a large diameter compared with the beam waist. GLMT simulations were proposed as a solution to rectify this; however, more research needs to be done on how different OPSs are affected.
-
The effective SCS responses of the two calibrations to simulated data were in notable agreement, with a linear regression gradient of 1.0 and a correlation coefficient of 1.0. This was sufficiently close to conclude that the small artefacts that were encountered had little influence on the final result.
-
Reflections of stray light off the fibre holder caused a slight increase in the zeroth calibration coefficient. This was found to be one of the most significant design factors relating to the fibre mounting system.
-
Discrepancies in the zeroth calibration coefficient may have also been caused by a misrepresentation of the size or of the aerosol particles themselves, as was revealed by microscopy.
-
The low-gain UCASS calibrations agreed far better than the high-gain UCASS units, owing to the inclusion of a shared datum between the two calculations.
-
Selection of the fibres was important, and it was non-trivial to find a fibre small enough to cover the smallest extreme of the SCS domain, a stark contrast to conventional calibrations.
Future development work will be conducted by the authors with respect to utilising the fibre calibration technique as a tool for calibrating instruments in the field. This is of particular interest to researchers who work on uncrewed aerial vehicles (UAVs) and conventional aircraft, as knowledge of how the calibration of an OPS has drifted between flights can be used to apply corrections to data during analysis. For this application in particular, the laser-flashing method is ideal because the apparatus would be simple. However, the addition of an LPD to an instrument is non-trivial and may be undesirable for expensive instrumentation on conventional aircraft. For this reason, flashing the laser by means of periodically blocking it mechanically should also be investigated. In addition, this technique could be applied to mass-produced, low-cost OPSs, as it would be more simple to deploy this device in a factory environment than a conventional aerosol technique. In particular, this technique would be directly applicable to the Alphasense OPC-N3 (Alphasense, 2024), as it uses the same optical layout as the UCASS (Kaye and Hirst, 2015). In tandem, future work will be conducted into manufacturing techniques for small fibres, as the fibre selection and characterisation is important. In particular, glass fibre stretching and tungsten fibre etching are promising processes for the manufacture of fibre standards.
The data and code assets are available from https://github.com/wolkchen-cirrus/FibCalRepo (last access: 16 October 2024) and https://doi.org/10.5281/zenodo.13939060 (Girdwood, 2024).
Software was developed by JG and HB, writing was conducted by JG, resources and supervision were provided by CS and EH, conceptualisation was performed by JG, investigation was performed by JG and RL, and methodology was developed by JG and RL.
The contact author has declared that none of the authors has any competing interests.
Publisher's note: Copernicus Publications remains neutral with regard to jurisdictional claims made in the text, published maps, institutional affiliations, or any other geographical representation in this paper. While Copernicus Publications makes every effort to include appropriate place names, the final responsibility lies with the authors.
This paper was edited by Wiebke Frey and reviewed by two anonymous referees.
Alphasense: Particulate Matter Sensors, PM Sensor, Alphasense, https://www.alphasense.com/Products/View%20by%20Target%20Gas/Particulates%20Optical%20Particle%20Counters, last access: 13 October 2024. a, b
Baumgardner, D. and Spowart, M.: Evaluation of the Forward Scattering Spectrometer Probe. Part III: Time Response and Laser Inhomogeneity Limitations, J. Atmos. Ocean. Tech., 7, 666–672, https://doi.org/10.1175/1520-0426(1990)007<0666:EOTFSS>2.0.CO;2, 1990. a
Baumgardner, D., Strapp, W., and Dye, J. E.: Evaluation of the Forward Scattering Spectrometer Probe. Part II: Corrections for Coincidence and Dead-Time Losses, J. Atmos. Ocean. Tech., 2, 626–632, https://doi.org/10.1175/1520-0426(1985)002<0626:EOTFSS>2.0.CO;2, 1985. a
Binnig, J., Meyer, J., and Kasper, G.: Calibration of an optical particle counter to provide PM2.5 mass for well-defined particle materials, J. Aerosol Sci., 38, 325–332, https://doi.org/10.1016/j.jaerosci.2006.12.001, 2007. a
Bohren, C. and Huffman, D.: Absorption and Scattering by an Arbitrary Particle, in: Absorption and Scattering of Light by Small Particles, John Wiley & Sons, Ltd, ISBN 978-3-527-61815-6, 57–81, https://doi.org/10.1002/9783527618156.ch3, 1998. a, b, c
Connolly, P. J., Flynn, M. J., Ulanowski, Z., Choularton, T. W., Gallagher, M. W., and Bower, K. N.: Calibration of the Cloud Particle Imager Probes Using Calibration Beads and Ice Crystal Analogs: The Depth of Field, J. Atmos. Ocean. Tech., 24, 1860–1879, https://doi.org/10.1175/JTECH2096.1, 2007. a
Cotton, R., Osborne, S., Ulanowski, Z., Hirst, E., Kaye, P. H., and Greenaway, R. S.: The Ability of the Small Ice Detector (SID-2) to Characterize Cloud Particle and Aerosol Morphologies Obtained during Flights of the FAAM BAe-146 Research Aircraft, J. Atmos. Ocean. Tech., 27, 290–303, https://doi.org/10.1175/2009JTECHA1282.1, 2010. a, b
Dye, J. E. and Baumgardner, D.: Evaluation of the Forward Scattering Spectrometer Probe. Part I: Electronic and Optical Studies, J. Atmos. Ocean. Tech., 1, 329–344, https://doi.org/10.1175/1520-0426(1984)001<0329:EOTFSS>2.0.CO;2, 1984. a
Girdwood, J.: Optical Measurement of Airborne Particles on Unmanned Aircraft, PhD thesis, University of Hertfordshire, Hatfield, https://doi.org/10.18745/th.27277, 2023. a
Girdwood, J.: wolkchen-cirrus/FibCalRepo: Calibration of Optical Particle Spectrometers Using Mounted Fibres, Zenodo [data set and code], https://doi.org/10.5281/zenodo.13939060, 2024. a
Haywood, J. M., Abel, S. J., Barrett, P. A., Bellouin, N., Blyth, A., Bower, K. N., Brooks, M., Carslaw, K., Che, H., Coe, H., Cotterell, M. I., Crawford, I., Cui, Z., Davies, N., Dingley, B., Field, P., Formenti, P., Gordon, H., de Graaf, M., Herbert, R., Johnson, B., Jones, A. C., Langridge, J. M., Malavelle, F., Partridge, D. G., Peers, F., Redemann, J., Stier, P., Szpek, K., Taylor, J. W., Watson-Parris, D., Wood, R., Wu, H., and Zuidema, P.: The CLoud–Aerosol–Radiation Interaction and Forcing: Year 2017 (CLARIFY-2017) measurement campaign, Atmos. Chem. Phys., 21, 1049–1084, https://doi.org/10.5194/acp-21-1049-2021, 2021. a
Heim, M., Mullins, B. J., Umhauer, H., and Kasper, G.: Performance evaluation of three optical particle counters with an efficient “multimodal” calibration method, J. Aerosol Sci., 39, 1019–1031, https://doi.org/10.1016/j.jaerosci.2008.07.006, 2008. a
Jia, X., Shen, J., and Yu, H.: Calculation of generalized Lorenz-Mie theory based on the localized beam models, J. Quant. Spectrosc. Ra., 195, 44–54, https://doi.org/10.1016/j.jqsrt.2016.10.021, 2017. a
Kaye, P. H. and Hirst, E.: Second generation low-cost particle counter, Alphasense Ltd, https://patents.google.com/patent/US9116121B2/en (last access: 13 October 2024), 2015. a
Kim, Y. J. and Boatman, J. F.: Size Calibration Corrections for the Active Scattering Aerosol Spectrometer Probe (ASASP-100X), Aerosol Sci. Tech., 12, 665–672, https://doi.org/10.1080/02786829008959381, 1990. a
Korolev, A. V., Isaac, G. A., Strapp, J. W., and Nevzorov, A. N.: In situ measurements of effective diameter and effective droplet number concentration, J. Geophys. Res.-Atmos., 104, 3993–4003, https://doi.org/10.1029/1998JD200071, 1999. a
Masson-Delmotte, V., Zhai, P., Pirani, A., Connors, S. L., Péan, C., Berger, S., Caud, N., Goldfarb, L., Gomis, M. I., Chen, Y., Huang, M., Leitzell, K., Lonnoy, E., Matthews, J. R., Maycock, T. K., Waterfield, T., Yelekçi, O., Yu, R., and Zhou, B.: IPCC, 2021: Climate Change 2021: The Physical Science Basis. Contribution of Working Group I to the Sixth Assessment Report of the Intergovernmental Panel on Climate Change, Cambridge University Press, Cambridge, United Kingdom and New York, NY, USA, https://doi.org/10.1017/9781009157896, 2021. a
O'Shea, S., Crosier, J., Dorsey, J., Gallagher, L., Schledewitz, W., Bower, K., Schlenczek, O., Borrmann, S., Cotton, R., Westbrook, C., and Ulanowski, Z.: Characterising optical array particle imaging probes: implications for small-ice-crystal observations, Atmos. Meas. Tech., 14, 1917–1939, https://doi.org/10.5194/amt-14-1917-2021, 2021. a
Pinnick, R. G. and Auvermann, H. J.: Response characteristics of knollenberg light-scattering aerosol counters, J. Aerosol Sci., 10, 55–74, https://doi.org/10.1016/0021-8502(79)90136-8, 1979. a, b, c
Pinsky, M. and Khain, A.: Fine Structure of Cloud Droplet Concentration as Seen from the Fast-FSSP Measurements. Part II: Results of In Situ Observations, J. Appl. Meteorol., 42, 65–73, https://doi.org/10.1175/1520-0450(2003)042<0065:FSOCDC>2.0.CO;2, 2003. a
Redemann, J., Wood, R., Zuidema, P., Doherty, S. J., Luna, B., LeBlanc, S. E., Diamond, M. S., Shinozuka, Y., Chang, I. Y., Ueyama, R., Pfister, L., Ryoo, J.-M., Dobracki, A. N., da Silva, A. M., Longo, K. M., Kacenelenbogen, M. S., Flynn, C. J., Pistone, K., Knox, N. M., Piketh, S. J., Haywood, J. M., Formenti, P., Mallet, M., Stier, P., Ackerman, A. S., Bauer, S. E., Fridlind, A. M., Carmichael, G. R., Saide, P. E., Ferrada, G. A., Howell, S. G., Freitag, S., Cairns, B., Holben, B. N., Knobelspiesse, K. D., Tanelli, S., L'Ecuyer, T. S., Dzambo, A. M., Sy, O. O., McFarquhar, G. M., Poellot, M. R., Gupta, S., O'Brien, J. R., Nenes, A., Kacarab, M., Wong, J. P. S., Small-Griswold, J. D., Thornhill, K. L., Noone, D., Podolske, J. R., Schmidt, K. S., Pilewskie, P., Chen, H., Cochrane, S. P., Sedlacek, A. J., Lang, T. J., Stith, E., Segal-Rozenhaimer, M., Ferrare, R. A., Burton, S. P., Hostetler, C. A., Diner, D. J., Seidel, F. C., Platnick, S. E., Myers, J. S., Meyer, K. G., Spangenberg, D. A., Maring, H., and Gao, L.: An overview of the ORACLES (ObseRvations of Aerosols above CLouds and their intEractionS) project: aerosol–cloud–radiation interactions in the southeast Atlantic basin, Atmos. Chem. Phys., 21, 1507–1563, https://doi.org/10.5194/acp-21-1507-2021, 2021. a
Rosenberg, P. D., Dean, A. R., Williams, P. I., Dorsey, J. R., Minikin, A., Pickering, M. A., and Petzold, A.: Particle sizing calibration with refractive index correction for light scattering optical particle counters and impacts upon PCASP and CDP data collected during the Fennec campaign, Atmos. Meas. Tech., 5, 1147–1163, https://doi.org/10.5194/amt-5-1147-2012, 2012. a, b, c, d, e
Schäfer, J.-P.: Implementierung und Anwendung analytischer und numerischer Verfahren zur Lösung der Maxwellgleichungen für die Untersuchung der Lichtausbreitung in biologischem Gewebe, Dissertation, Universität Ulm, https://doi.org/10.18725/OPARU-1914, 2011. a
Sensirion AG: SPS30-PM2.5 Sensor for HVAC and air quality applications SPS30, Sensirion AG, https://sensirion.com/products/catalog/SPS30, last access: 13 October 2024. a
Smith, H. R., Ulanowski, Z., Kaye, P. H., Hirst, E., Stanley, W., Kaye, R., Wieser, A., Stopford, C., Kezoudi, M., Girdwood, J., Greenaway, R., and Mackenzie, R.: The Universal Cloud and Aerosol Sounding System (UCASS): a low-cost miniature optical particle counter for use in dropsonde or balloon-borne sounding systems, Atmos. Meas. Tech., 12, 6579–6599, https://doi.org/10.5194/amt-12-6579-2019, 2019. a, b, c
Vochezer, P., Järvinen, E., Wagner, R., Kupiszewski, P., Leisner, T., and Schnaiter, M.: In situ characterization of mixed phase clouds using the Small Ice Detector and the Particle Phase Discriminator, Atmos. Meas. Tech., 9, 159–177, https://doi.org/10.5194/amt-9-159-2016, 2016. a, b
Wang, W. and Shen, J.: Beam shape coefficients calculation for an elliptical Gaussian beam with 1-dimensional quadrature and localized approximation methods, J. Quant. Spectrosc. Ra., 212, 139–148, https://doi.org/10.1016/j.jqsrt.2018.03.026, 2018. a


