the Creative Commons Attribution 4.0 License.
the Creative Commons Attribution 4.0 License.
 | 11 Jul 2025
Characterization of filter photometer artifacts in soot and dust measurements – laboratory and ambient experiments using a traceably calibrated aerosol absorption reference
Luka Drinovec
Lucas Alados-Arboledas
Gloria Titos
Elena Bazo
Andrea Casans
Diego Patrón
Xavier Querol
Adolfo Gonzalez-Romero
Carlos Perez García-Pando
Griša Močnik
A novel reference absorption instrument based on photothermal interferometry – the dual-wavelength photothermal aerosol absorption monitor PTAAM-2λ – and scattering measurements are used to characterize filter photometer artifacts in measurements of absorption coefficients of soot- and dust-dominated aerosol samples within laboratory and ambient campaigns. We provide, for different aerosol types, reference values of the multiple-scattering parameter, quantifying the artifact introduced by the interaction between the light, the particles, and the filter.
The Aethalometer AE33 and the Continuous Light Absorption Photometer (CLAP) were characterized during a laboratory campaign where different soot and mineral dust samples were measured. Furthermore, ambient measurements during a campaign in Granada, Spain, were used to characterize the AE33 and MAAP (Multiangle Absorption Photometer), a pseudo-reference absorption instrument.
The laboratory campaign showed significant wavelength dependence of the calibration parameter, the multiple-scattering parameter C. The C of the AE33 at 450 and 808 nm was 4.08 and 3.95 and 6.25 and 5.27 for propane soot and diesel soot, respectively. For the CLAP, the C was 5.10 and 4.26 and 6.79 and 5.80 for propane and diesel soot, respectively. For the different mineral dust samples analyzed in the laboratory, the C at 450 nm ranged between 2.74 and 3.03 for the AE33 and between 2.50 and 2.80 for the CLAP. The ambient measurements at Granada showed an overall C of 4.72 at 450 nm and of 3.90 at 808 nm for the AE33. The results for both the AE33 and the CLAP show a dependence with the particle size, with fine particles having the highest C values and with the C being reduced and leveling off for larger particles. Both the laboratory and the ambient measurements of the AE33 showed overlapping results.
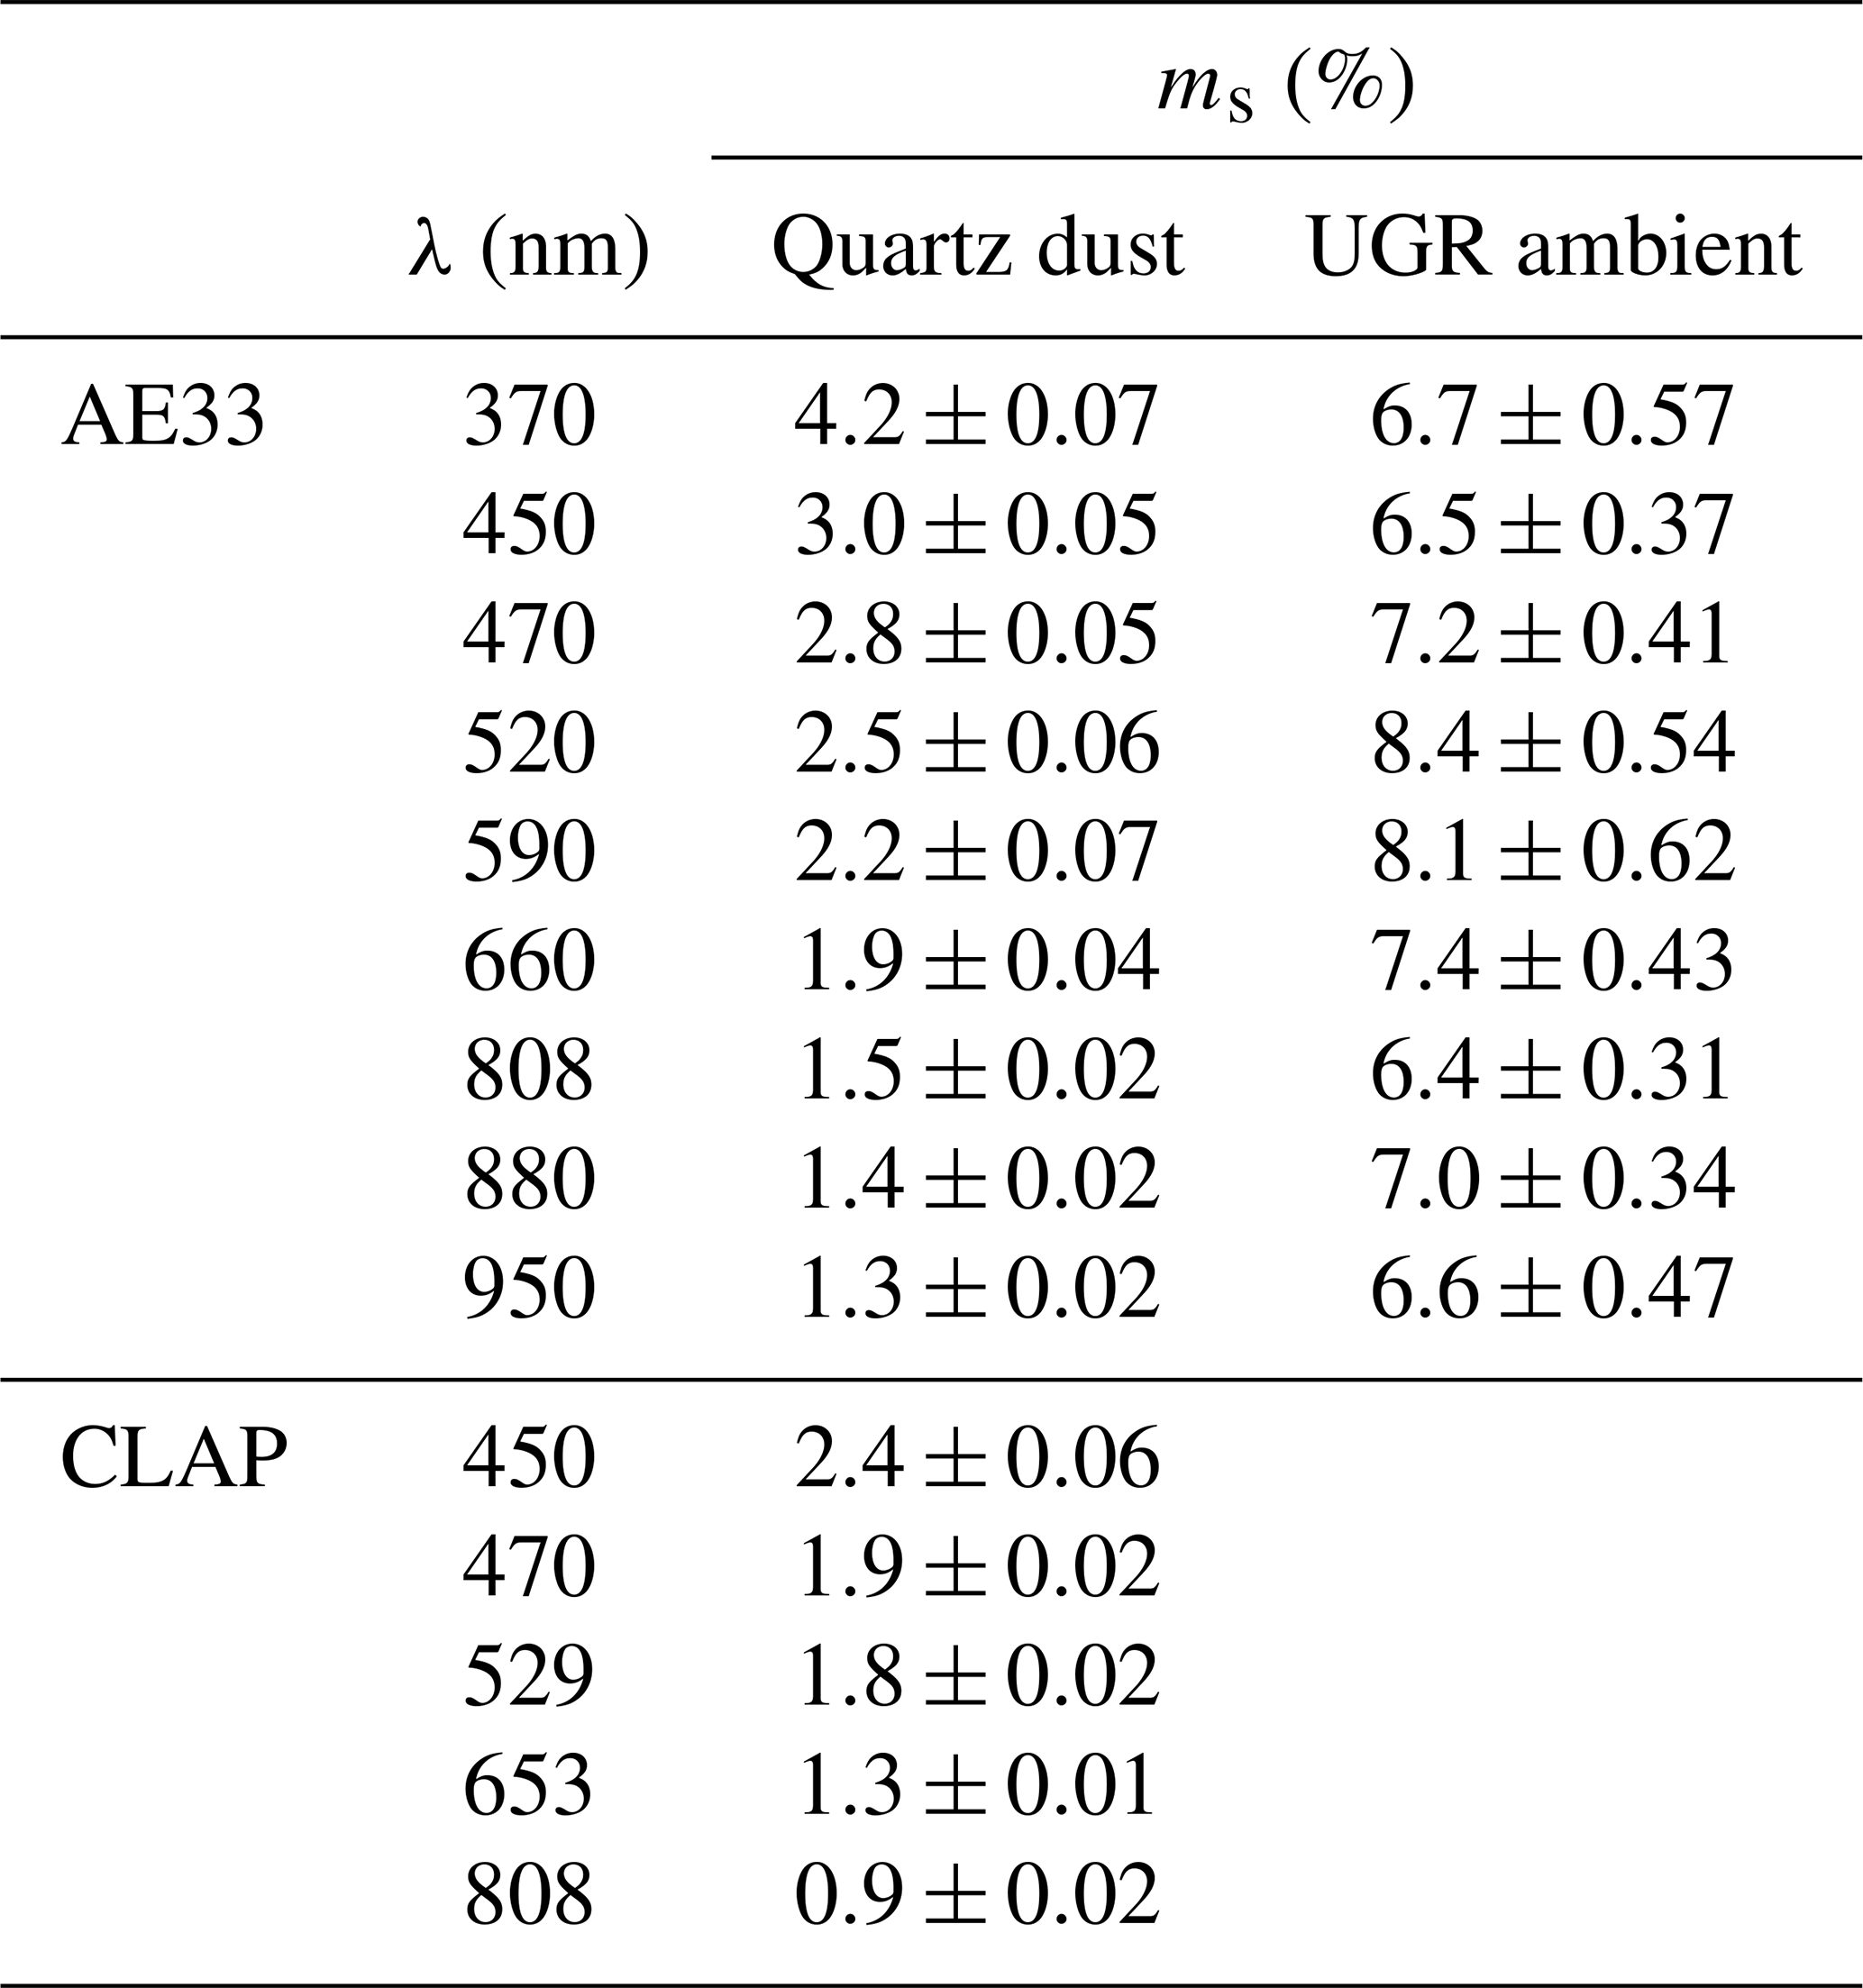
The cross-sensitivity to scattering was smaller for the CLAP than for the AE33. The values of the cross-sensitivity parameter ms at 450 and 808 nm were 3.0 % and 1.5 % for the AE33 and 2.4 % and 0.9 % for the CLAP.
The intercomparison of the MAAP with the PTAAM-2λ during the ambient campaign in Granada showed that the MAAP overestimates the absorption coefficients for 47 % at 637 nm and features a cross-sensitivity to scattering of 2.4 %.
- Article
(1984 KB) - Full-text XML
-
Supplement
(7865 KB) - BibTeX
- EndNote


Light-absorbing aerosols (LAAs) are a major cause of atmospheric warming due to their direct effect on Earth's radiative budget and their semi-direct radiative effects in the Earth's atmosphere (Szopa et al., 2021). However, the short lifetime of aerosols and the aging processes that they undergo in the atmosphere, along with their heterogeneous emissions, introduce a challenge for accurately determining their optical properties, spatial distribution, and climate effects (Bond et al., 2013; Zanatta et al., 2016; Saleh et al., 2018; Samset et al., 2018). Indeed, the effect of aerosols is one of the largest uncertainties in climate models (Szopa et al., 2021).
Of all LAAs, black carbon (BC) is the most important aerosol warming agent due to its large mass absorption cross-section (Myhre et al., 2013; Szopa et al., 2021). The influence of absorbing organic LAAs on the climate, either primary (emitted into the atmosphere) or secondary (produced in the atmosphere by physical and chemical processes), is also a large unknown (e.g., Laskin et al., 2015; Rovira et al., 2025). Moreover, mineral dust contributes most to aerosol mass in the atmosphere and absorbs sunlight, featuring fairly large uncertainties in terms of its climate effects (e.g., Kok et al., 2017, 2021a, b). The highest uncertainties are associated with the variable distribution of particle size in the atmosphere and the mineralogical composition, both of which are important parameters in the influence of dust on the net radiative forcing (Di Biagio et al., 2020; Adebiyi and Kok, 2020; Huang et al., 2020; Kok et al., 2021a; Li et al., 2021). Mineral dust absorption is mainly driven by the composition of iron oxides (Sokolik and Toon, 1999; Lafon et al., 2006; Balkanski et al., 2007; Caponi et al., 2017; Di Biagio et al., 2019).
The most widely used instrumentation to determine aerosol absorption coefficients, especially in ambient measurements, are filter absorption photometers (Moosmüller et al., 2009): Aethalometer instruments (Hansen et al., 1984; Drinovec et al., 2015), the Particle Soot Absorption Photometer (PSAP; Bond et al., 1999), the Continuous Light Absorption Photometer (CLAP; Ogren et al., 2017), and the Multiangle Absorption Photometer (MAAP; Petzold and Schönlinner, 2004). Their working principle (with some design variations) is based on the continuous accumulation of the aerosol sample on the filter, through which the attenuation of light in comparison with a blank filter is measured to derive absorption coefficients and the equivalent black carbon concentrations (eBC; Petzold et al., 2013). Filter photometers feature three main artifacts that influence and hinder the correct determination of the absorption coefficients. The first is the filter-loading effect, which can be corrected using assumptions (Bond et al., 1999; Weingartner et al., 2003; Collaud Coen et al., 2010) or measurements (Drinovec et al., 2015, 2017). The second is the amplification of the absorption of light in the particles resulting from the scattering of light by the filter tape fibers, which is corrected by introducing a multiplicative multiple-scattering parameter C, describing the enhancement of absorption by the scattering of light in the filter matrix (Arnott et al., 2005; Ogren et al., 2017; Drinovec et al., 2015). The third effect is the scattering of light by the particles embedded in the filter, reducing the transmission of light through the sample-laden filter due to scattering which is misinterpreted as absorption (Yus-Díez et al., 2021; Drinovec et al., 2022). The three artifacts are treated as separate, even though they are somewhat co-dependent, as shown in the light transport models (Müller et al., 2014).
The filter-loading effect results in the loss of sensitivity in the instrument due to the increase in the sample load in the filter (Bond et al., 1999; Weingartner et al., 2003). Multiple algorithms for the compensation of the filter-loading effect have been developed for different filter photometer models (Bond et al., 1999; Virkkula et al., 2007; Weingartner et al., 2003; Drinovec et al., 2015; Ogren et al., 2017). The newest Aethalometer models (AE33 and latest versions) feature a correction with an integrated compensation algorithm using online measurements of the filter-loading effect (Drinovec et al., 2015). In addition, the physical properties of the sampled particles influence the multiple scattering of the collected particles within the filter (Weingartner et al., 2003; Lack et al., 2008; Virkkula et al., 2015; Drinovec et al., 2015; Yus-Díez et al., 2021) since particles with a higher single-scattering albedo produce an enhancement of the multiple scattering of light, increasing the apparent attenuation (Yus-Díez et al., 2021), and smaller particles have the ability to be deposited deeper inside the filter matrix, also enhancing the apparent attenuation measured by the filter photometers (Drinovec et al., 2022).
Filter photometers were designed for black carbon measurements (Gundel et al., 1984); however, the measurement was interpreted concurrently as a value of the absorption coefficient (Hansen et al., 1982, 1984). Eventually, filter photometers were also used to obtain the absorption coefficients for dust measurements (Fialho et al., 2005, 2006; Di Biagio et al., 2017). The sensitivity of filter photometers depends on the depth at which particles are trapped in the filter matrix, which differs across filter photometer models and the aerosol particle size. This is taken into account by the MAAP using a simple radiative transfer model that takes into account the backscattering of light at two angles (Petzold and Schönlinner, 2004) or as observed in other filter photometers as the dependence of the multiple-scattering parameter C on the single-scattering albedo and the size of the particles (Yus-Díez et al., 2021; Drinovec et al., 2022). Therefore, in order to use the filter photometers, the measurement needs to be characterized with a representative sample, and its artifacts need to be quantified, which requires a better characterization for soot-like particles, mineral dust samples, and ambient measurements where these two types of aerosol species appear simultaneously.
Ultimately, reference absorption measurements are required to measure the absorption coefficient and to correct for the filter photometer artifacts. This is especially important since the new European Air Quality Directive (PE-CONS 88/24) requires the measurement of BC concentrations by optical absorption methods (European Commission, 2024). An often-used method to obtain the absorption coefficient, especially for laboratory experiments, is the extinction-minus-scattering method, which is usually performed by Cavity Phase Shift Extinction analyzers (CAPS; Massoli et al., 2010; Modini et al., 2021). Extinction-minus-scattering-obtained absorption coefficients are fairly robust and mainly feature low uncertainties; however, for high single-scattering albedo values, which are frequent in ambient measurements (Laj et al., 2020) and where the extinction is dominated by scattering, this methodology introduces very high uncertainties (Moosmüller et al., 2009; Singh et al., 2014), especially when combined with imperfect nephelometer truncation error correction of the total scattering coefficient (Modini et al., 2021).
There are two main methods that provide direct measurements of the absorption coefficient and avoid artifacts introduced by filter photometers: photoacoustic spectrometry (PAS Arnott et al., 2003) and photothermal interferometry (PTI; Moosmüller and Arnott, 1996; Visser et al., 2020; Drinovec et al., 2022). Both are based on the heating of the aerosol sample by focusing light from an intensive source on it as it is drawn through a measurement chamber. The methods differ in terms of the probe method: PAS uses an acoustic resonator and a microphone for detection, whereas PTI uses an interferometer and photodiodes. PAS can exhibit biases when the aerosol sample contains semi-volatile organic coatings or water since the detected acoustic signal can be reduced by the latent heat of the material during evaporation of these substances upon heating (Arnott et al., 2003; Moosmüller et al., 2009). PTI and PAS have been found to agree when measuring soot particles coated with specific secondary organic matter (Kalbermatter et al., 2022). A novel traceably calibrated PTI instrument, the PTAAM-2λ (Haze Instruments, Slovenia), has been shown to provide accurate and precise aerosol absorption measurements for different aerosol particle compositions (Drinovec et al., 2022).
Filter photometers therefore require the use of a co-located reference absorption measurement for their calibration. Some studies have used either the extinction-minus-scattering method (Bond et al., 1999; Di Biagio et al., 2017) or another filter photometer, such as the tricolor absorption photometer (TAP), as in Laing et al. (2020), or more sophisticated filter photometers that measure the backscattering of light from the filter, such as the MAAP (Di Biagio et al., 2017; Yus-Díez et al., 2021) or the off-line polar photometer of the University of Milano (PP_UniMI; Bernardoni et al., 2021; Ferrero et al., 2021). Indeed, the MAAP is used as the reference instrument in the Aerosol, Clouds and Trace Gases Research InfraStructure (ACTRIS; ECAC-CAIS, 2022) guidelines to harmonize absorption coefficients from a dual-spot multi-wavelength Aethalometer, the AE33 (Drinovec et al., 2015), across the ACTRIS network. However sophisticated these methods are, none truly measure the absorption coefficient, and all add an additional layer of uncertainty. Recently, Drinovec et al. (2022) used a traceably calibrated instrument based on PTI, the PTAAM-2λ, to calibrate the AE33 and the CLAP and to quantify their cross-sensitivity to scattering artifacts for aerosol mixtures of fine soot and ammonium sulfate.
We use absorption coefficients, measured by the novel PTAAM-2λ, and the scattering coefficients, measured by the integrating nephelometer Aurora 4000, to fully quantify the artifacts of widely deployed filter photometers: the AE33, the CLAP, and the pseudo-reference MAAP. For this purpose, we have performed chamber experiments with a wide variety of aerosol types during a laboratory campaign, as well as ambient measurements in a polluted urban background atmosphere in Granada (Spain).
This study showcases the analysis based on two distinct set-ups: a laboratory and an ambient campaign. Both campaigns had similar instrumental lay-outs, with the determination of particle absorption using filter photometers and a reference absorption measurement by the photothermal interferometer. Additional measurements of scattering and particle size distribution were performed during both campaigns. The experimental set-up for both campaigns can be found in Fig. 1. To allow for a comparison between the instruments, all measurements are reported in the same conditions of standard temperature and pressure (T = 273.15 K and P = 1013.25).
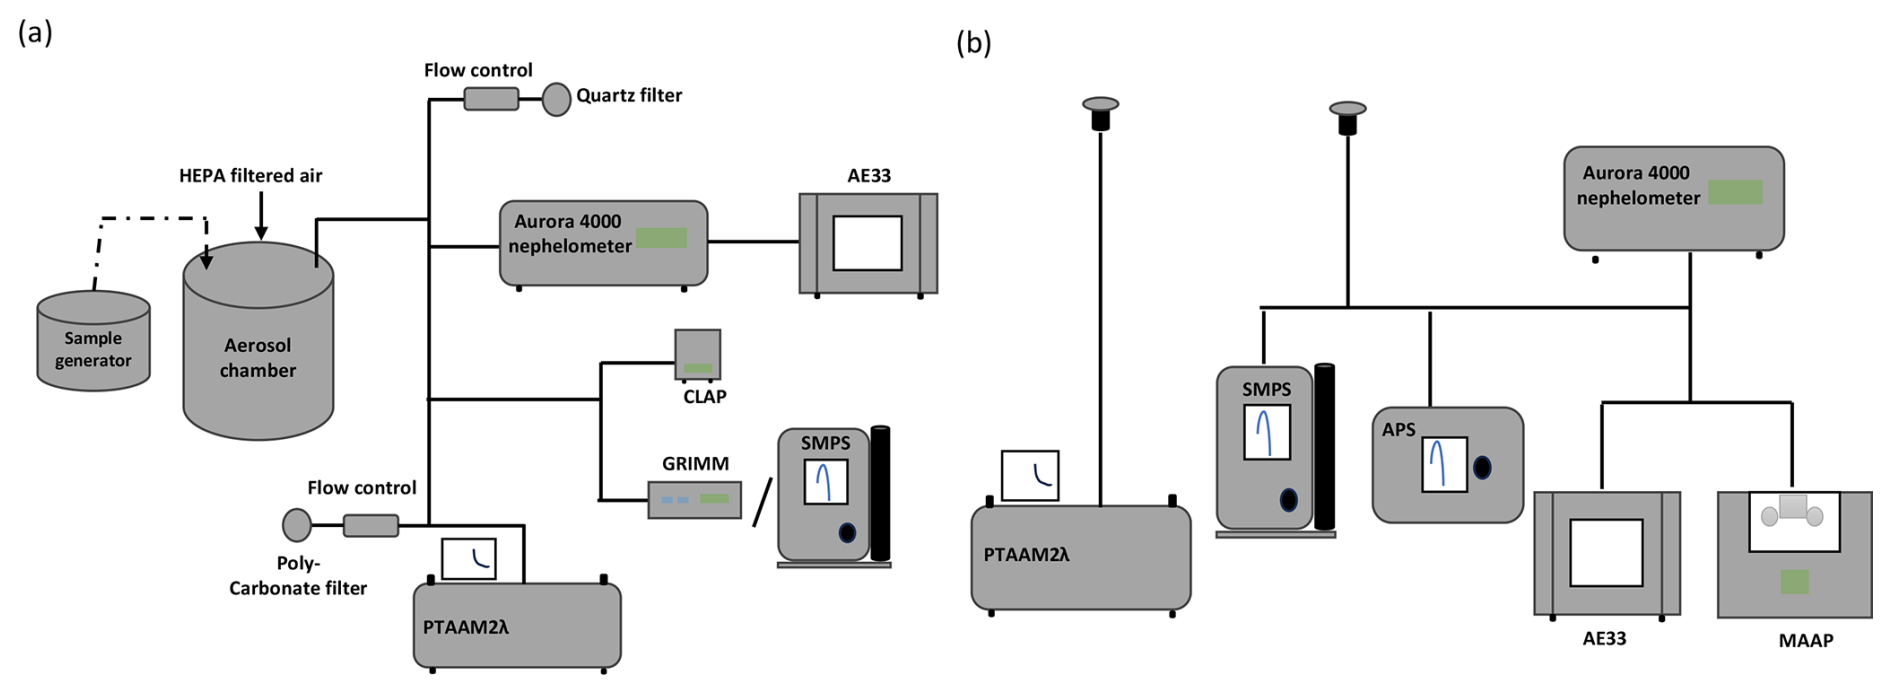
Figure 1(a) Laboratory set-up for measuring mineral dust airborne- and combustion-generated samples and (b) set-up at the UGR site for measuring ambient aerosol. The attenuation coefficients were measured by the AE33 (lab and ambient) and the CLAP (lab); reference absorption was measured with the PTAAM2λ. Scattering coefficients were obtained by the Aurora 4000 nephelometer for both campaigns. Particle size distribution was obtained with either an OPS (GRIMM 11-D) for dust particles or an SMPS for soot-like particles during the laboratory campaign and with an SMPS and an APS during the ambient campaign. Offline quartz fiber and polycarbonate filters were sampled with different flows.
2.1 Laboratory aerosol measurement
2.1.1 Samples: mineral dust, quartz, soot
Different samples of dust aerosolized particles were measured in this study (see Table 1). Mineral dust, which is the most abundant aerosol compound in the atmosphere by mass, with a poorly constrained influence on the climate, features a small net cooling effect (Kok et al., 2023). BC particles, which are aggregate structures of graphene layers originating from the incomplete combustion of fossil fuel (Bond and Bergstrom, 2006), feature very high mass absorption cross-section values and, as such, are the most important aerosol climate forcer (Bond et al., 2013; Szopa et al., 2021). Samples with high black carbon (BC) content, specifically Euro-3 engine diesel soot and propane soot (Drinovec et al., 2022), were sampled. In addition, pure quartz dust (Sigma-Aldrich 342890-100G) was used as a pure scattering-dust reference sample. Figure S1 in the Supplement shows the CLAP filter spots as a visual reference for the different samples.
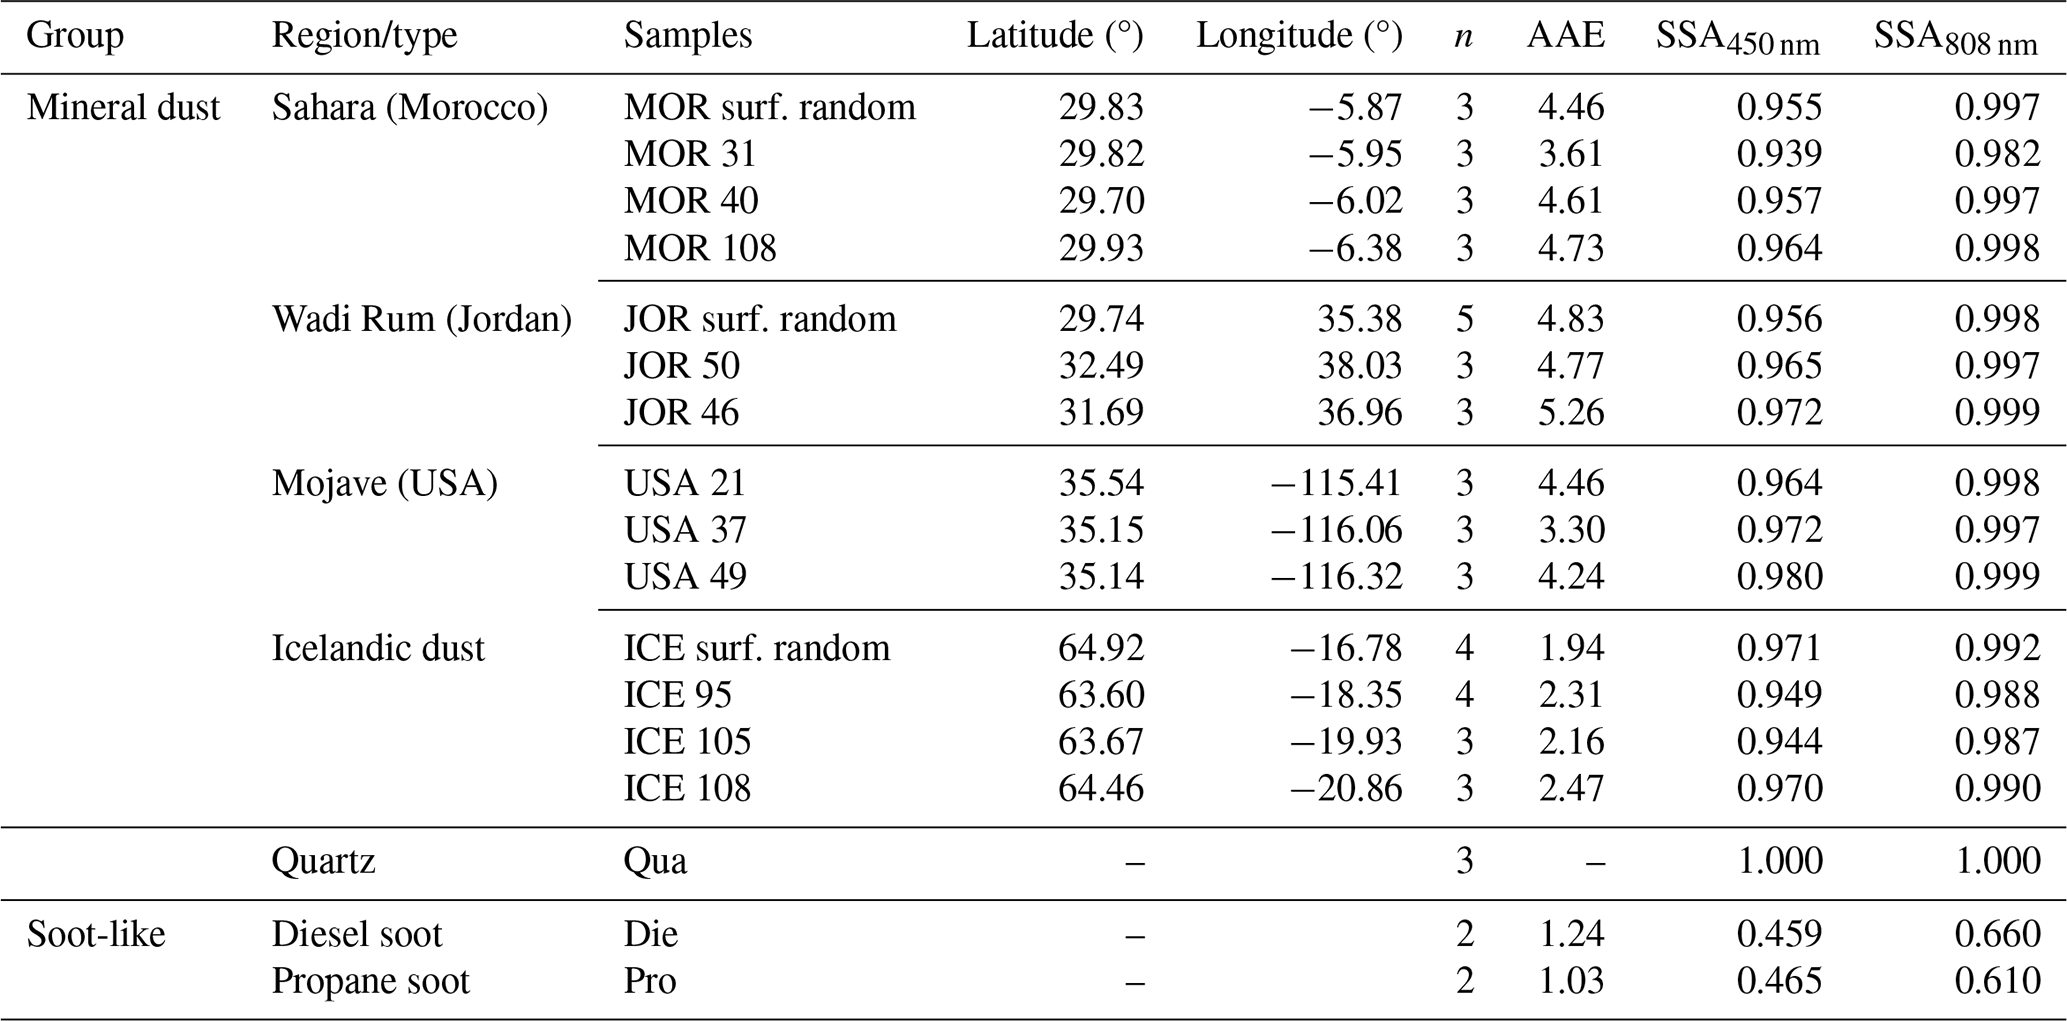
Table 1Sample classification and number of measurements per sample type. The absorption Ångström exponent (AAE) was derived from the PTAAM-2λ using 450 and 808 nm measurements, and the single-scattering albedo (SSA) at 450 and 808 nm is a combination of the PTAAM-2λ and the nephelometer. Sediment mineral dust sample-specific characteristics can be found in González-Romero et al. (2023, 2024a, b), while other samples are either commercially available or specifically generated for this study. The SSA and the AAE are characteristic of the generated aerosol mineral dust samples, produced from the sediment samples.
Bulk mineral sediment samples were collected from different emission areas across middle- and high-latitude deserts, which are sources of major dust emissions (Sahara, Middle East, Mojave, and Iceland). These samples were collected within the framework of the project FRontiers in dust minerAloGical coMposition and its Effects upoN climaTe (FRAGMENT; https://cordis.europa.eu/project/rcn/214076/factsheet/en, last access: 9 July 2025). Mineral dust properties, such as size-segregated composition and similar, can be found in González-Flórez et al. (2023), Panta et al. (2023), and González-Romero et al. (2023, 2024a, b). In this study, since the samples are collected with a relatively small spatial variability within a well-defined area of the broader dust emission area, we present the results for the overall emission area and not specifically for each of the individual samples.
Aerosol mineral dust samples were produced in the lab in a vortex generator similar to the device described in Moosmüller et al. (2012). Filtered compressed air was directed tangentially to produce a vortex. To remove the large particles, the sample was collected from the center of the container. Mineral dust generated by several short bursts of compressed air was directed into a 120 L plastic barrel, which was then connected to the instruments and sampled until concentrations dropped to negligible levels. For each sample, between two and four experiments were performed, with increasing concentrations.
2.1.2 Instrument set-up
Online reference absorption measurements were performed with a dual-wavelength photothermal aerosol absorption monitor, the PTAAM-2λ (Drinovec et al., 2022; Haze Instruments, Slovenia). The PTAAM-2λ is based on a folded Mach–Zehnder interferometer which measures the difference in the optical path between the sample and reference interferometer arms. The resulting phase difference is directly proportional to the absorption coefficient of the aerosol sample. For this study, a newer version of the instrument was used, with pump lasers operating at 450 and 808 nm instead of 532 and 1064 nm, as used in Drinovec et al. (2022). The calibration procedure was identical to the one described in Drinovec et al. (2022): the 450 nm channel was calibrated with 1 ppm NO2, and, for the 808 nm channel, the calibration was transferred from 450 nm using polydisperse nigrosin particles and an absorption ratio of = 0.335, calculated with a Mie model. For the PTAAM-2λ, the sources of uncertainty at 450 nm are as follows: NO2 amount fraction, NO2 absorption cross-section at 450 nm, scattering and absorbing gases, and stability of the instrument, resulting in the final absorption coefficient uncertainty of 4.2 % at 450 nm. At the longer wavelength, there are the additional uncertainties in the Mie calculation due to the complex nigrosin refractive index and size distribution, resulting in an absorption coefficient uncertainty of 6.2 % at 808 nm. The uncertainty of the Ångström exponent is 10.4 % as it is independent of the NO2 amount fraction and the NO2 absorption cross-section at 450 nm. More details and references can be found in Table S1 in the Supplement.
Measurements of attenuation were performed with two filter photometers, the Aethalometer AE33 (Magee Scientific, USA; Aerosol, Slovenia) and the Continuous Light Absorption Photometer (CLAP; Haze Instruments, Slovenia). The AE33 measures attenuation at seven wavelengths (370, 470, 520, 590, 660, 880, and 950 nm) and compensates for the filter-loading effect through an in-built algorithm (Drinovec et al., 2015). The CLAP measures the attenuation at 470, 529, and 653 nm, compensating for the filter loading using an algorithm scheme like that of Ogren et al. (2017). Both instruments use a glass fiber filter, specifically the M8060 filter tape in the AE33 and the Azumi 371M filter in the CLAP. The CLAP filter was changed for every set of experiments for each sample. For comparison with the PTAAM-2λ, the AE33 data were interpolated from 370 and 470 nm to 450 nm and from 660 and 880 nm to 808 nm using the absorption Ångström exponent. The CLAP data were extrapolated to 808 nm using the absorption Ångström exponent from CLAP measurements.
Aerosol particle size distribution measurements were performed using an optical particle spectrometer (GRIMM 11-D) for mineral dust samples, which measures the number of particles in 31 bins for bins with an optical diameter size ranging from 0.253 to 35.15 µm. The particle size distribution for soot-like particles (diesel and propane) was measured with a scanning-mobility parameter sizer (TSI model 393L75), which measures the number of particles in 64 bins for particle mobility diameters ranging from 15.12 to 982.17 nm. Given the differences in the size range and type of diameter reported by each instrument, comparison for particle size dependence is performed in a qualitative manner. Scattering measurements were obtained with an Aurora 4000 polar-integrating nephelometer (Ecotech, Australia) measuring at 450, 525, and 635 nm. The instrument was set to measure total and backscattering coefficients, and angular truncation errors were corrected by applying Teri et al. (2022) correction schemes using the scattering Ångström exponent for the size distribution and the refractive indexes used by Anderson and Ogren (1998) and Müller et al. (2011b).
The single-scattering albedo values were derived by using the total scattering coefficients from the Aurora 4000 integrating nephelometer in combination with the PTAAM-2λ absorption coefficient, with the nephelometer data being extrapolated to 808 nm using the measured scattering Ångström exponent.
2.2 Ambient measurements
The ambient campaign was performed between 16 June and 24 August 2023 at at the University of Granada (UGR) urban background station (37.18° N, 3.58° W; 680 m a.s.l.), which is part of the AGORA Observatory. It is located in the city of Granada in southern Spain. The main local source of aerosol particles is road traffic (Titos et al., 2014, 2017), with a sporadic presence of biomass burning aerosol, especially in autumn and winter seasons (Titos et al., 2017; Casquero-Vera et al., 2021). Air mass stagnation episodes are relatively frequent and favor the accumulation of pollution near the surface (Lyamani et al., 2012; Patrón et al., 2017). The city is located 200 km away from the African continent and is frequently influenced by long-range transport of Saharan dust (Lyamani et al., 2010; Valenzuela et al., 2012a, b).
Particle number size distributions at UGR were measured with a scanning-mobility particle sizer (SMPS, TSI mod. 3082) and an aerodynamic particle spectrometer (APS, TSI mod. 3321). The APS aerodynamic diameters, in the range of ∼ 0.5 to 20 µm, were converted to mobility diameter following the procedure described by Khlystov and Pandis (2004). The aerosol particle density and shape factors used are based on those used for this station in previous studies (see Hess et al., 1998; Wagner et al., 2009; Sorribas et al., 2015). Total and backscattering measurements were performed with the same Aurora 4000 nephelometer as during the laboratory measurements, to which the Teri et al. (2022) angular truncation correction was applied. The nephelometer was set up to measure at seven different angles (0, 15, 30, 45, 60, 75, and 90°), of which only the total scattering coefficient is used in this study.
Online measurements of attenuation coefficients were performed with an AE33. As for the laboratory measurements, the filter tape used was the M8060, and the filter-loading effect was compensated for with the AE33 internal algorithm. Furthermore, absorption coefficients at 637 nm were obtained with the Multiangle Absorption Photometer (MAAP; Petzold and Schönlinner, 2004), and the Müller et al. (2011a) scheme was applied to correct for the difference between the reported (670 nm) and the true (637 nm) instrument wavelength.
Reference absorption measurements were performed with a PTAAM-2λ using the same configuration as the one used in the laboratory campaign. For this campaign, the instrument uncertainty is the same, specifically 4 % in the blue channel (450 nm) and 6 % in the infrared channel (808 nm).
As in the laboratory campaign, the AE33 measurements were interpolated and/or extrapolated to the PTAAM-2λ wavelengths. Conversely, the PTAAM-2λ absorption was interpolated, using the AAE, to the MAAP wavelength.
2.3 Filter photometer artifacts
Using a constant multiple-scattering parameter to compensate for the artifacts of the filter photometer measurements under scenarios with a high single-scattering albedo, samples have been shown to introduce a large overestimation of the absorption coefficients measured with Aethalometer instruments (Yus-Díez et al., 2021). To compensate for this cross-sensitivity to scattering of the filter photometers, we have applied the approach proposed by Yus-Díez et al. (2021) for the AE33, CLAP, and MAAP, with a more detailed description being provided below. Indeed, the compensation scheme of Yus-Díez et al. (2021) was an adaptation of the AE33 based on the Ogren et al. (2017) scheme for the CLAP, first developed by Bond et al. (1999).
Following these schemes, the filter-photometer-measured attenuation coefficient is compensated for by the scattering of light by particles in the filter matrix to derive the corrected attenuation coefficient:
where batn is the attenuation coefficient measured by the instrument, ms is the scattering artifact describing the cross-sensitivity to the scattering of the measurement, and bsp is the scattering coefficient of the sampled aerosol.
The absorption coefficient derived from these attenuation measurements is compensated for by the multiple scattering of light in the filter matrix loaded with the sample using a single multiplicative multiple-scattering parameter C:
There are two main methods to obtain the scattering artifact ms: (i) as the slope between the reported absorption by the filter photometers versus the measured scattering artifact for a non-absorbing material, such as quartz (e.g., Drinovec et al., 2022), or (ii) by combining Eqs. (1) and (2) with the definition of the single-scattering albedo – SSA = – and fitting the resulting equation, as shown in Eq. (9). Yus-Díez et al. (2021).
Unlike in previous studies (e.g., Bernardoni et al., 2021; Yus-Díez et al., 2021), here, we use as a reference an instrument that does not suffer from the size and scattering artifacts – the PTAAM-2λ (Drinovec et al., 2022). As a consequence, we were able to determine the correction parameters without any additional artifacts from the reference absorption measurements. The pseudo-reference measurements used by Bernardoni et al. (2021) and Yus-Díez et al. (2021) were collected with different filter photometers including polarimetric measurements with PP_UniMI. With PP_UniMI and MAAP feature inversion algorithms that take into account the backscattering of light from the sample-laden filter to retrieve the absorption measurements, they are still subject to the main filter photometer artifacts. Here, we use as a reference an instrument that does not suffer from the size and scattering artifacts – the PTAAM-2λ (Drinovec et al., 2022). As a consequence, we were able to determine the filter photometer correction parameters without introducing additional artifacts from the (pseudo-) reference measurements.
Here, we present the analysis of filter photometer (AE33, CLAP, and MAAP) artifacts from both laboratory and ambient campaigns using the traceably calibrated PTAAM-2λ as the aerosol absorption reference instrument.
As mentioned in Sect. 2.1, the measurement of mineral dust samples during the laboratory experiment was performed as a two-stage process: first, the chamber was filled with the airborne-generated mineral dust sample, and then it was slowly emptied. Figure 2a shows the decay of the AE33 and CLAP attenuation coefficients and the PTAAM-2λ absorption coefficients as the chamber gets emptied. Due to the large initial concentrations, we maintain high values of the absorption and attenuation coefficients throughout the experiment – this is especially relevant for the 808 nm wavelength since, at this wavelength, dust absorption is very low (Di Biagio et al., 2019). Nonetheless, the scatter of the data becomes quite large for absorption coefficients below 10 Mm−1. Furthermore, Fig. 2b shows the typical temporal variability of the attenuation (AE33) and absorption (PTAAM-2λ) coefficients during 2 typical days of the ambient campaign in Granada during a Saharan dust event over the region. It features high AAE values (above 2), with prominent contributions from local sources at the urban site. This is shown by the increase in the absorption (and the decrease in AAE) during peak local emission hours (06:00 and 20:00 UTC) and the otherwise low absorption values (5 and 1.5 Mm−1 at 450 and 808 nm) at midday due to the dilution within the atmospheric boundary layer.
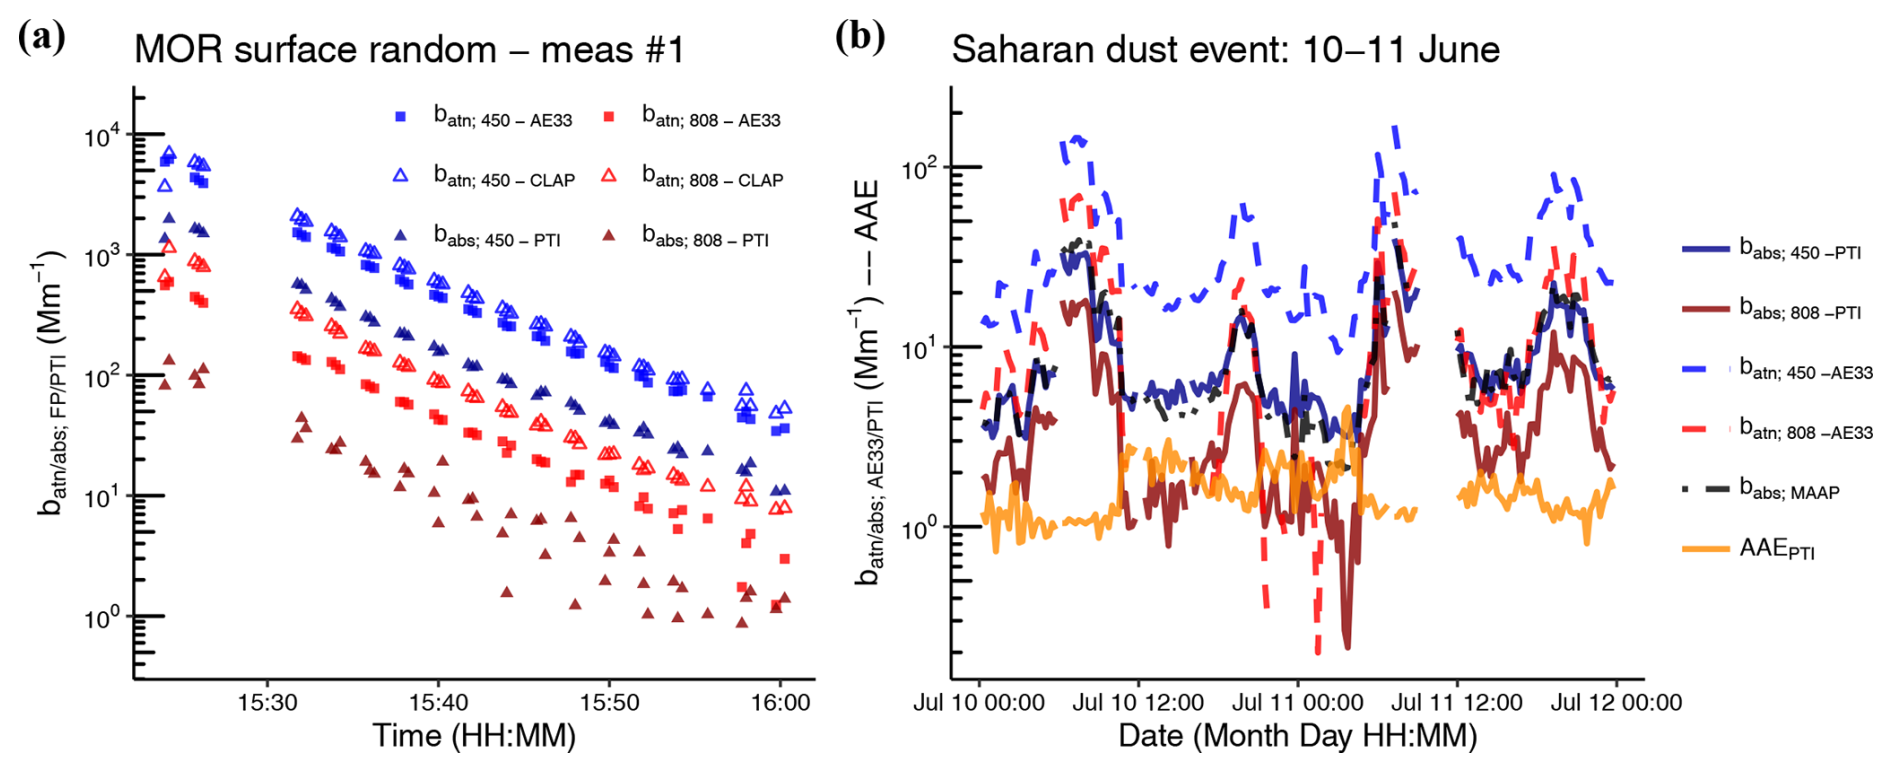
Figure 2(a) Example of the typical time evolution for a resuspended mineral dust sample during the measurement of the Saharan desert sample (“Morocco surface random”; see Table 1 and González-Romero et al. (2023) for further details), the attenuation coefficient (batn) of the AE33 and CLAP, and the PTAAM-2λ absorption coefficient. (b) The temporal evolution of the absorption from the PTI, the absorption Ångström exponent, and the multiple-scattering parameter for 2 Saharan dust event days during the campaign in Granada (time in UTC). Note the logarithmic scale on the y axis.
3.1 Filter photometer cross-sensitivity to scattering
During the laboratory experiments, we analyzed soot-like and dust samples. The soot-like particles feature single-scattering albedo values below the threshold above which the scattering parameter becomes important; therefore, no correction for the cross-sensitivity to scattering is necessary, and so this is not performed herein (Yus-Díez et al., 2021). We analyzed the filter photometer scattering cross-sensitivity artifact by measuring quartz as a reference sample for purely scattering mineral dust. Therefore, any measured attenuation by the filter photometer is the result of the scattering artifact, which, in Fig. 3a, is obtained as the slope of the attenuation vs. the scattering. The scattering artifact ms at 450 and 808 nm was 3.0 % and 1.5 % for the AE33 and 2.4 % and 0.9 % for the CLAP (see Fig. 3a). Both the resuspended quartz and real-world mineral dust samples had similar particle size distributions (Fig. S2), and so we have assumed that the magnitude of the multiple-scattering artifact is the same for all samples. The scattering-artifact values found herein for the AE33 were half the value and were consistent with the decreasing trend found in Drinovec et al. (2022), where ms was around 6 % of particles with a volume size mode of 122 nm, and within the range found in Drinovec et al. (2015) for the old filter type used in the AE33 (Pallflex “Fiberfilm” T60A20), specifically 1.2 %–3.4 %. The average CLAP scattering artifacts at 450 nm (2.4 %) and at 808 nm (0.9 %) were close to the wavelength-independent value of 1.64 % determined by Ogren et al. (2017). The values are summarized in Table 2.
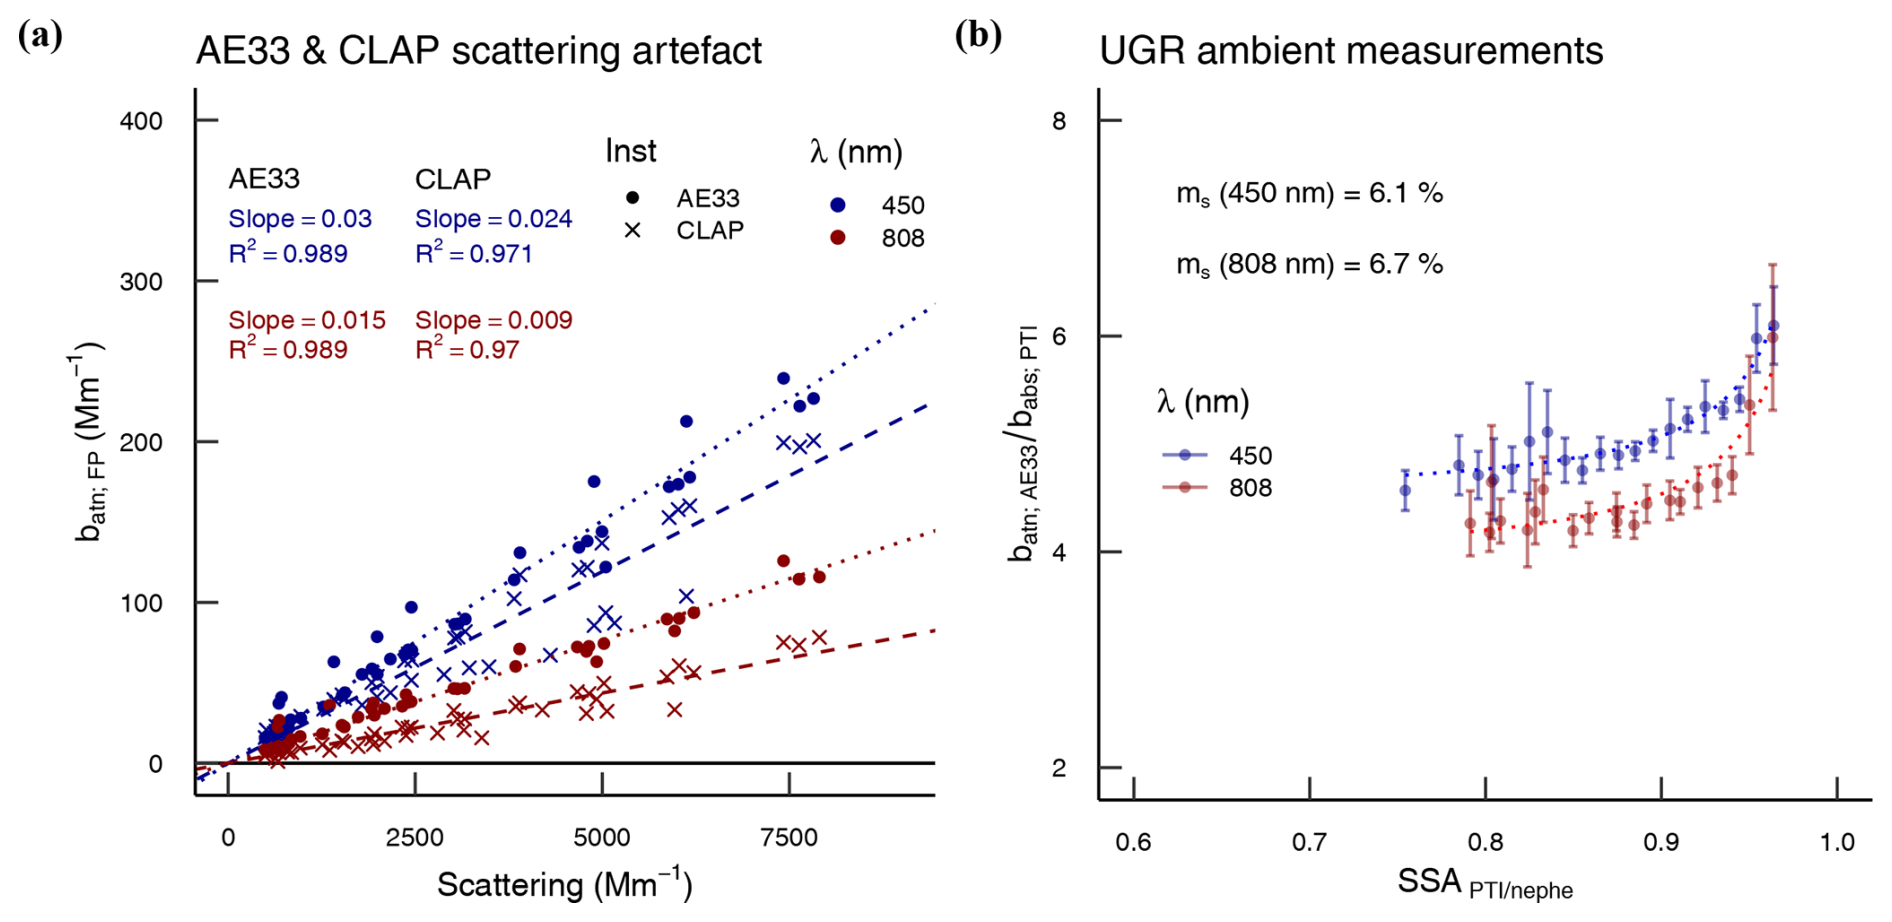
Figure 3The filter photometer scattering artifact. (a) The dependence of attenuation on the scattering coefficient in the AE33 and CLAP during the laboratory campaign using resuspended non-absorbing quartz samples. (b) During the summer 2023 AGORA campaign in Granada, the fit of the ratio of the AE33 attenuation coefficient to the PTAAM-2λ absorption coefficient vs. the single-scattering albedo (SSA) at 450 and 808 nm – parameters from the fit of Eq. (3), as in Yus-Díez et al. (2021). The error bars in the right panel showcase the upper and lower 95 % confidence intervals.
Table 2Scattering artifact ms for both the Aethalometer AE33 (laboratory and ambient campaign) and the CLAP (only laboratory campaign) obtained as the dependence of attenuation on the scattering coefficient in the AE33 and CLAP during the laboratory campaign using resuspended non-absorbing quartz samples and during the summer 2023 AGORA campaign in Granada as the fit of the ratio of the AE33 attenuation coefficient to the PTAAM-2λ absorption coefficient vs. SSA at 450 and 808 nm – parameters from fit as in Yus-Díez et al. (2021). Figures with the fits for the AE33 and CLAP wavelengths can be found in Figs. S4–S5. The uncertainty reflects the 95 % confidence interval of the applied fits.
The ambient campaign showed a highly heterogeneous aerosol composition with a multi-mode particle size distribution (Fig. S2), thus preventing the scattering artifact from being assumed to be the same as for the laboratory quartz samples. Consequently, to correct for the cross-sensitivity to scattering the AE33 data, we have followed the approach proposed by Yus-Díez et al. (2021), where the scattering artifact is obtained from the fit of the ratio of attenuation, as measured by the AE33, to the reference absorption coefficient, as measured by the PTAAM-2λ, as a function of single-scattering albedo. Unlike for dust sample measurements, the presence of BC results in significant absorption in the infrared, resulting in a good fit not only at 450 nm but also at 808 nm. Figure 3b shows that the scattering artifact, obtained from the fit of the curve following Eq. (3), as in Yus-Díez et al. (2021), is 6.1 % for 450 nm and 6.7 % for 808 nm. These values were higher than those found in this study for the dust laboratory experiments; however, they were similar to the ones found in Drinovec et al. (2022) for the 120 nm particles investigated therein. Compared with literature values, we have found considerably higher scattering-artifact values for the AE33 than at other measurement sites. Indeed, Yus-Díez et al. (2021) showed scattering artifacts of 1.6 %–4.9 %. We attribute this difference to the use of a direct reference instrument (the PTAAM-2λ) with no artifacts instead of the MAAP, as done in Yus-Díez et al. (2021) (see Fig. S3 and Sect. 3.3 below). Another reason for the smaller discrepancies could be the different aerosol compositions and particle sizes among different sites.
Although we have shown that the scattering artifact was higher during the ambient campaign than for the dust samples during the laboratory campaign, Fig. 4 shows that the relative contribution introduced by the scattering artifact to the total attenuation measured by filter photometers is higher for the pure dust samples in laboratory experiments, where SSA is higher (see Table 1). Furthermore, Fig. 4 shows that the relative contribution of the scattering artifact for pure dust samples increased with the wavelength to values over 40 % in the red wavelength (see Fig. S7). The increase with the wavelength is associated with the very low absorption by dust particles in the red and infrared wavelengths compared to scattering (Caponi et al., 2017). Figure S6a shows that the relative contribution of scattering to attenuation remained constant throughout the experiment. The higher increase in the relative contribution of scattering to attenuation at 808 nm, although not as apparent, was also a feature in Granada under low-concentration scenarios (see Fig. S6b). However, during the ambient campaign, soot-like particles, which were the main absorbing particles, have a higher mass absorption cross-section (MAC); hence, this effect was only observed for very low concentrations, when the absorption coefficient was below 1 Mm−1 (see Fig. S6b), which is more frequent for the 808 nm wavelength.
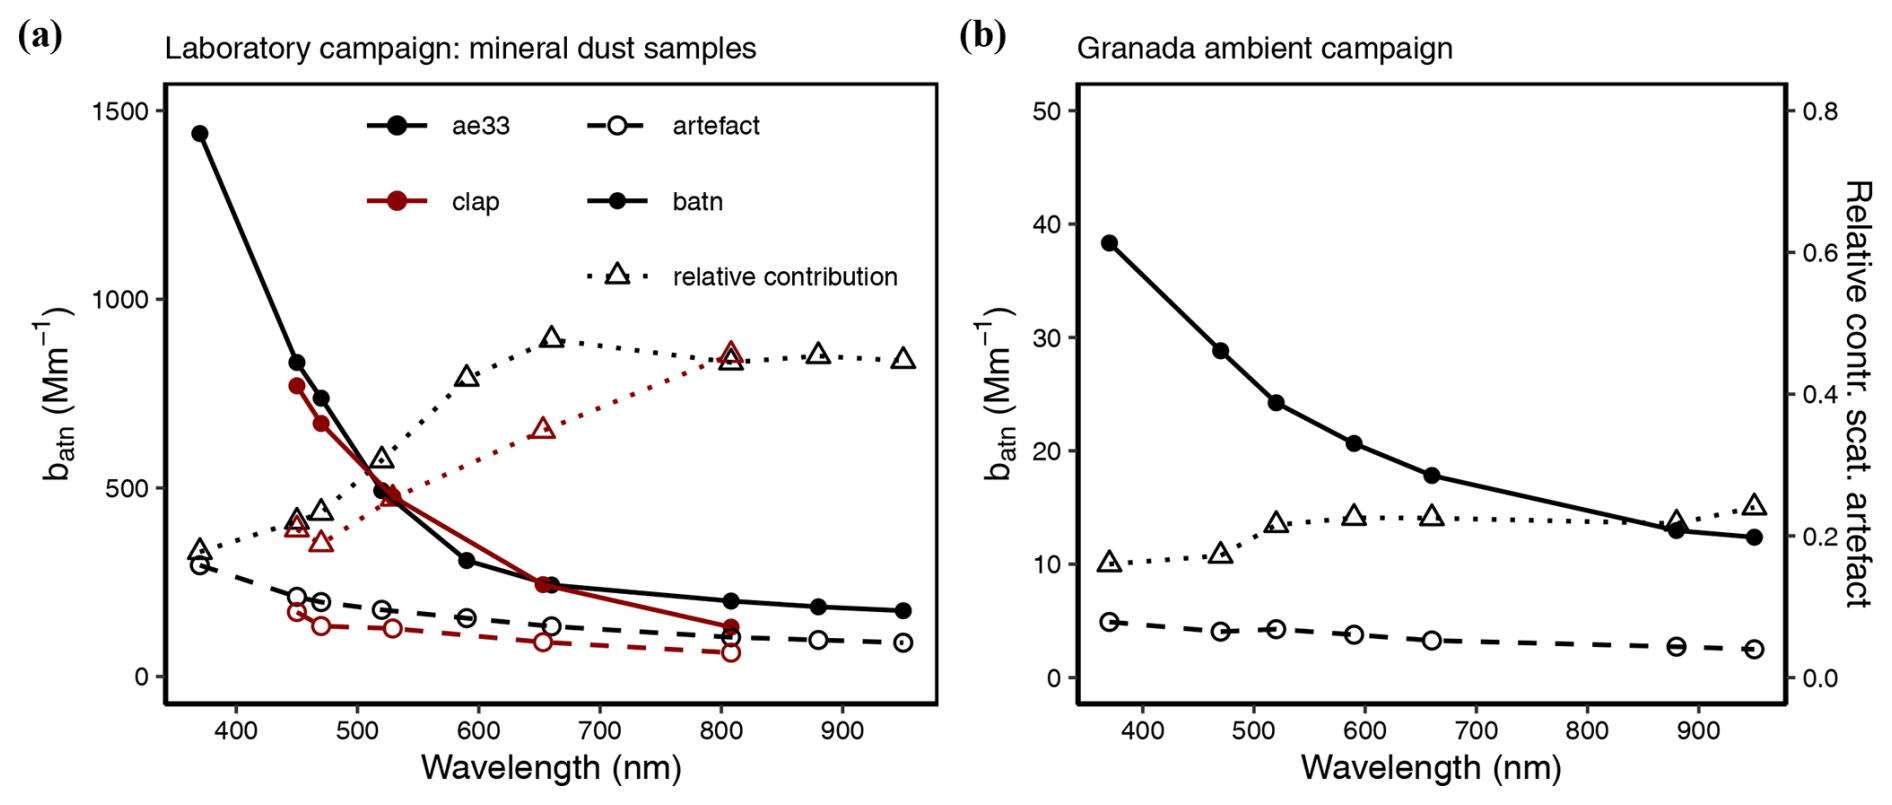
Figure 4Dependence on the wavelength of the attenuation coefficient, the scattering artifact, and the relative contribution of the scattering artifact to the total attenuation measured by the AE33 and the CLAP (interpolated and/or extrapolated to 450 and 808 nm) for (a) the laboratory campaign and (b) the ambient campaign in Granada.
3.2 Multiple-scattering parameter for filter photometers
Table 3 shows the multiple-scattering parameter C after correcting the attenuation coefficients for the cross-sensitivity to scattering for each of the sample types. The values have been obtained for each of the sample groups as the slope of the orthogonal fit of the attenuation coefficients corrected for the cross-sensitivity to scattering batn−cor (see Eq. 1) vs. the reference absorption coefficients from the PTAAM-2λ (see Figs. S8–S24). It should be noted that, due to the effect of interpolation and extrapolation from and to the filter photometer or PTAAM-2λ wavelengths, the C values reported for the filter photometer wavelengths vs. the PTAAM-2λ could vary. This effect is expected to be the highest for dust since the AAE between 370 and 660 nm for dust is higher than that between 660 and 950 nm. During the UGR ambient measurements, the uncertainty of the regression due to interpolation of the absorption coefficient to 637 nm using AAE derived from the measurements at the two PTAAM wavelengths (450 and 808 nm) instead of at the seven AE33 wavelengths (307–950 nm) was 4 %. The uncertainty of the fit is shown by the R2 and 95 % confidence interval range for each sample in Tables S2 and S3. This confidence interval is obtained by introducing the measurement error into the Deming regression fit by error propagation of the standard deviation and the instrument uncertainty.
Table 3Multiple-scattering parameter C for both the Aethalometer AE33 (laboratory and ambient campaign) and the CLAP (laboratory campaign), obtained as the orthogonal fit of their attenuation coefficients corrected for cross-sensitivity to scattering vs. the PTAAM-2λ absorption coefficients (Figs. S8–S24). Values have been reported for the reporting wavelengths of each filter photometer (by interpolation and extrapolation) and the wavelengths of the PTAAM-2λ at which they were measured (marked in bold). The lower and upper 95 % confidence intervals of C and the R2 of the attenuation and absorption measurements used in the fit are shown in Tables S2 and S3. Given the high uncertainty of the measurements above 800 nm, we have marked them in italic in this table. In this table, the italics denote the higher uncertainty of those highlighted values. The bold refers to the columns, 450 and 808 nm wavelengths from the reference instruments.
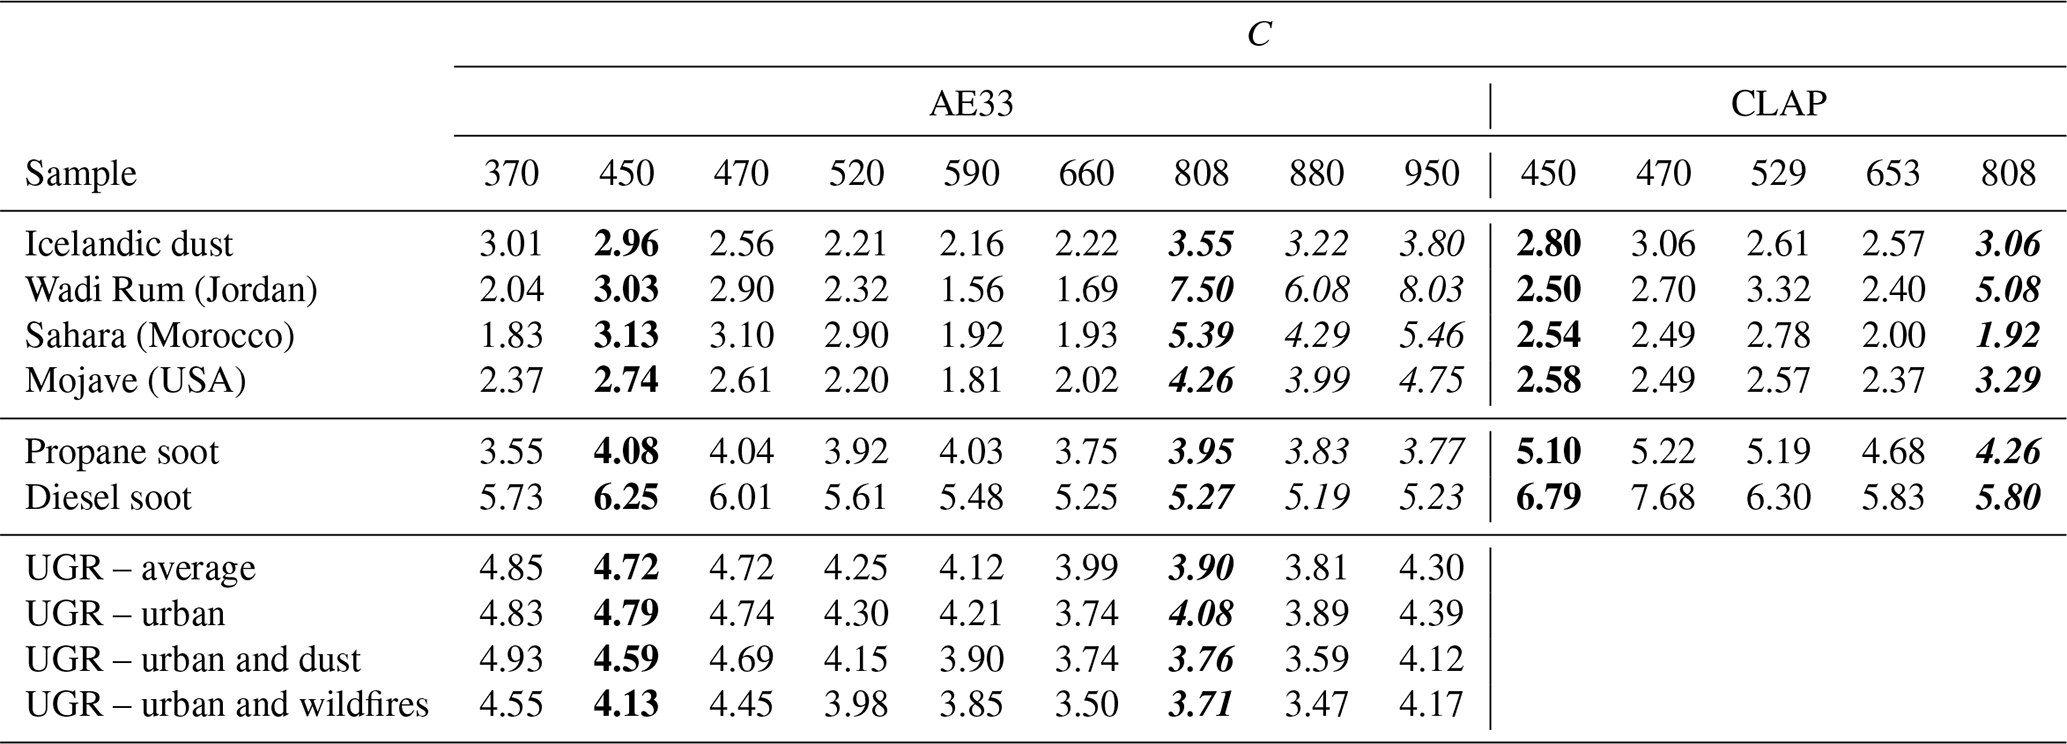
The C of the dust samples at 450 nm was between 2.50 and 2.80 for the CLAP and between 2.74 and 3.13 for the AE33. The C for the AE33 is smaller than those provided by Di Biagio et al. (2017) for dust samples for the Aethalometer AE31. Table 3 shows that, for all of the mid-latitude deserts, C decreases slightly between 370 and 660 nm, with an increase in the C value and its variability above 808 nm. Iceland dust, however, does not follow this pattern, and the C for 808, 880, and 950 nm, although slightly higher, had a lower variability (see Tables S2 and S3). This behavior is linked with the high contribution of the scattering artifact to the total absorption for all of the dust samples, which is lower for Icelandic dust (Fig. S7), which could be linked to its higher absorption at these wavelengths (Baldo et al., 2023).
Indeed, Tables S2 and S3 showcase how the high variability of the C values obtained for these higher wavelengths (808, 880, and 950 nm) cannot be relied upon for the dust samples since the high contribution of the scattering artifact to the total AE33 signal and the low correlation are related to the limitations of the compensation model (Eqs. 1 and 2). Here, we link this with a probable a non-linearity in the cross-sensitivity to scattering due to second-order effects associated with the particle properties and the instrument design, visible only for the lower absorption values and when the relative scattering contribution to the measured attenuation is the highest.
Di Biagio et al. (2017) performed a similar study, albeit for the Aethalometer AE31 (Magee Scientific, USA), which has been shown to have C values lower than those of the AE33 (Drinovec et al., 2015; Savadkoohi et al., 2023), where they (Di Biagio et al., 2017) measured reference dust absorption using the extinction-minus-scattering method using a CAPS PMex and a nephelometer (model 3563, TSI Inc.) at 450 nm and the extrapolated MAAP absorption coefficients at 660 nm. The multiple-scattering parameters for dust obtained by Di Biagio et al. (2017) ranged between 3.64 and 5.12 for 450 nm and between 3.56 and 4.04 for 660 nm. Values of this parameter for dust at 450 nm in our study are much smaller: 2.74 to 3.13 at 450 nm and 1.69 to 2.22 at 660 nm. They also exhibit lower variability, which is a combination of the lower variability of the particle size distribution in this study for dust; the lower uncertainty due to the cross-sensitivity to scattering due to different filter tape material (AE31 uses reinforced quartz tape); and the lower noise of the reference absorption instrument since, for the 450 nm wavelength, the extinction-minus-scattering method can introduce high systematic uncertainties in the case of high SSA (Modini et al., 2021).
Two types of soot were analyzed: propane (mean volume particle diameter Dp of 341 nm) and diesel soot (Dp of 177 nm), for which C for the AE33 at 450 and 808 nm was 4.08 and 3.95 and 6.25 and 5.27, respectively (see Table 3). The CLAP featured C values at 450 and 808 nm of 5.10 and 4.26 for propane soot and 6.79 and 5.80 for diesel soot. These C values are consistent with the values found in Drinovec et al. (2022) for similar diesel and propane soot samples: between 5.3 and 3.2 at 532 nm and between 4.2 and 2.6 at 1064 m for 100 and 500 nm volume size modes, respectively. There are some differences due to the difference in terms of the measuring wavelength and the different flows used in the compared studies for the AE33. Weingartner et al. (2003) studied the C values for the Aethalometer AE30 (a prototype of the AE31), and comparison is limited to some extent; they found, for diesel soot, C values around 2.14 at 450 and 660 nm. These values need to be interpreted with caution. The Aethalometer model AE31 uses quartz filter tape, which features significantly higher C values when compared to different AE33 filter tapes, as shown in the original AE33 publication (Drinovec et al., 2015). Furthermore, Yus-Díez et al. (2021) showed the important influence of the filter type in AE33 on the C parameter. The C value of 1.44 recalculated for the CLAP from parameters in Ogren et al. (2017) based on the experiments of Bond et al. (1999) on aerosol mixtures of pure nigrosin with pure ammonium sulfate using a reference extinction-minus-scattering measurement is clearly lower than the nigrosin and/or any soot mixture measured in this study and in Drinovec et al. (2022). Unlike for mineral dust samples, the goodness of the fit (Tables S2 and S3) was very good for both soot samples for the AE33 and the CLAP throughout the different wavelengths (R2 > 0.95). Furthermore, Table S4 summarizes the C and ms parameters following the nomenclature of Ogren et al. (2017) and Bond et al. (1999), i.e., K1 and K2 parameters.
During the ambient measurements at UGR, we found AE33 C values at 450 and 808 nm of 4.72 and 3.90 (see Table 3). These C values for UGR are similar to the laboratory measurements for the propane soot sample and higher than those found by Drinovec et al. (2022) during a winter ambient campaign in Ljubljana; these values were 3.28 and 2.57 at 532 and 1064 nm. Furthermore, the obtained C at UGR (see Table 3) did not vary with the type of event affecting the site – urban background pollution, fresh urban pollution, a dust event, or globally transported wildfire smoke – as shown by the overlapping of values in most of the cases in Table S2. Dust events were determined using the Collaud Coen et al. (2010) methodology, with dust forecasts and particulate matter concentration levels being measured on site. Wildfire events were identified through the CAMS global forecast tool. As shown in Table S2, the C for all of the wavelengths showed an overall good agreement for all of the wavelengths and conditions. Figure S2 shows that the volume particle size distribution during the urban background and the dust events (there were no APS measurements during the wildfire event) did not change significantly between the periods for the fine fraction below 400 nm, as previously shown in the measured urban background station (Casquero-Vera et al., 2020). However, the coarse fraction increases significantly during the dust events, associated with the advection of coarse particles from the Saharan dust outbreaks (Casquero-Vera et al., 2020). It is the combination of the absorbing soot-like particles (in the fine mode) and the coarser dust particles present during the campaign that influenced the C, but the small changes in their relative contribution (see Fig. S2b) did not have an effect on the resulting C values.
The C parameter found in the literature for ambient AE33 measurements compared to an offline polar filter photometer (Yus-Díez et al., 2021; Bernardoni et al., 2021; Ferrero et al., 2021) showed values ranging between 2.2 and 3.6 at 520 and 660 nm; these values were lower than those found in this study during the ambient campaign. The ACTRIS guidelines recommend a wavelength-independent C parameter for AE33 ambient measurements using the M8060 filter of 2.44 and using the MAAP (an online polar filter photometer) as the pseudo-reference. Indeed, when using the MAAP as a pseudo-reference instrument, following the approach of Yus-Díez et al. (2021), we obtained a C parameter at 637 nm of 2.62 via the fit of Eq. (1) and of 2.68 through an orthogonal fit, with the 95 % confidence interval ranging between 2.55 and 2.81 (see Fig. S3). Here, as in Bernardoni et al. (2021) and Drinovec et al. (2022), the shorter wavelengths also showed higher C values. The systematic differences between direct measurements with the PTAAM-2λ and the MAAP are discussed below in Sect. 3.3.
Dependence on the particle size
The most remarkable features of Table 3 are the higher C values found for soot-like particles in comparison with dust particles. As shown in Drinovec et al. (2022), this is related with the size of the particles, with smaller particles showing higher C values. Figure 5 shows the variation with the size of the C values for the different sample types and the UGR campaign. It should be noted that the particle size of the dust samples was measured with an optical particle counter (OPC), which measures the optical diameter, whereas, for diesel and propane soot, particle size was measured with an SMPS, which measures the mobility diameter. The conversion of the optical diameter into the mobility diameter would require assumptions regarding the complex refractive index; density; and, most importantly, shape of mineral dust, as shown in Huang et al. (2020), which falls beyond the scope of this study. During the UGR summer campaign, particle size was obtained as the combination of the SMPS and the APS size distributions, reported in terms of mobility diameter. Therefore, any comparison on the behavior with the particle size between dust and non-dust samples in Fig. 5 should be performed while keeping in mind the differences among these different diameters. Huang et al. (2020) showed that, for different assumptions regarding the complex refractive index and particle shape, optical diameters are, on average, 56 % lower than geometric diameters, which, in turn, are 45 % lower than aerodynamic diameters. Following the same assumptions regarding particle density and sphericity used to convert the APS aerodynamic into mobility diameters at the UGR site will result in an overall shift of ∼ 1.7 in the diameters, thus resulting in a higher effective diameter, i.e., a positive shift of the corresponding data points in Fig. 5 on the x axis.
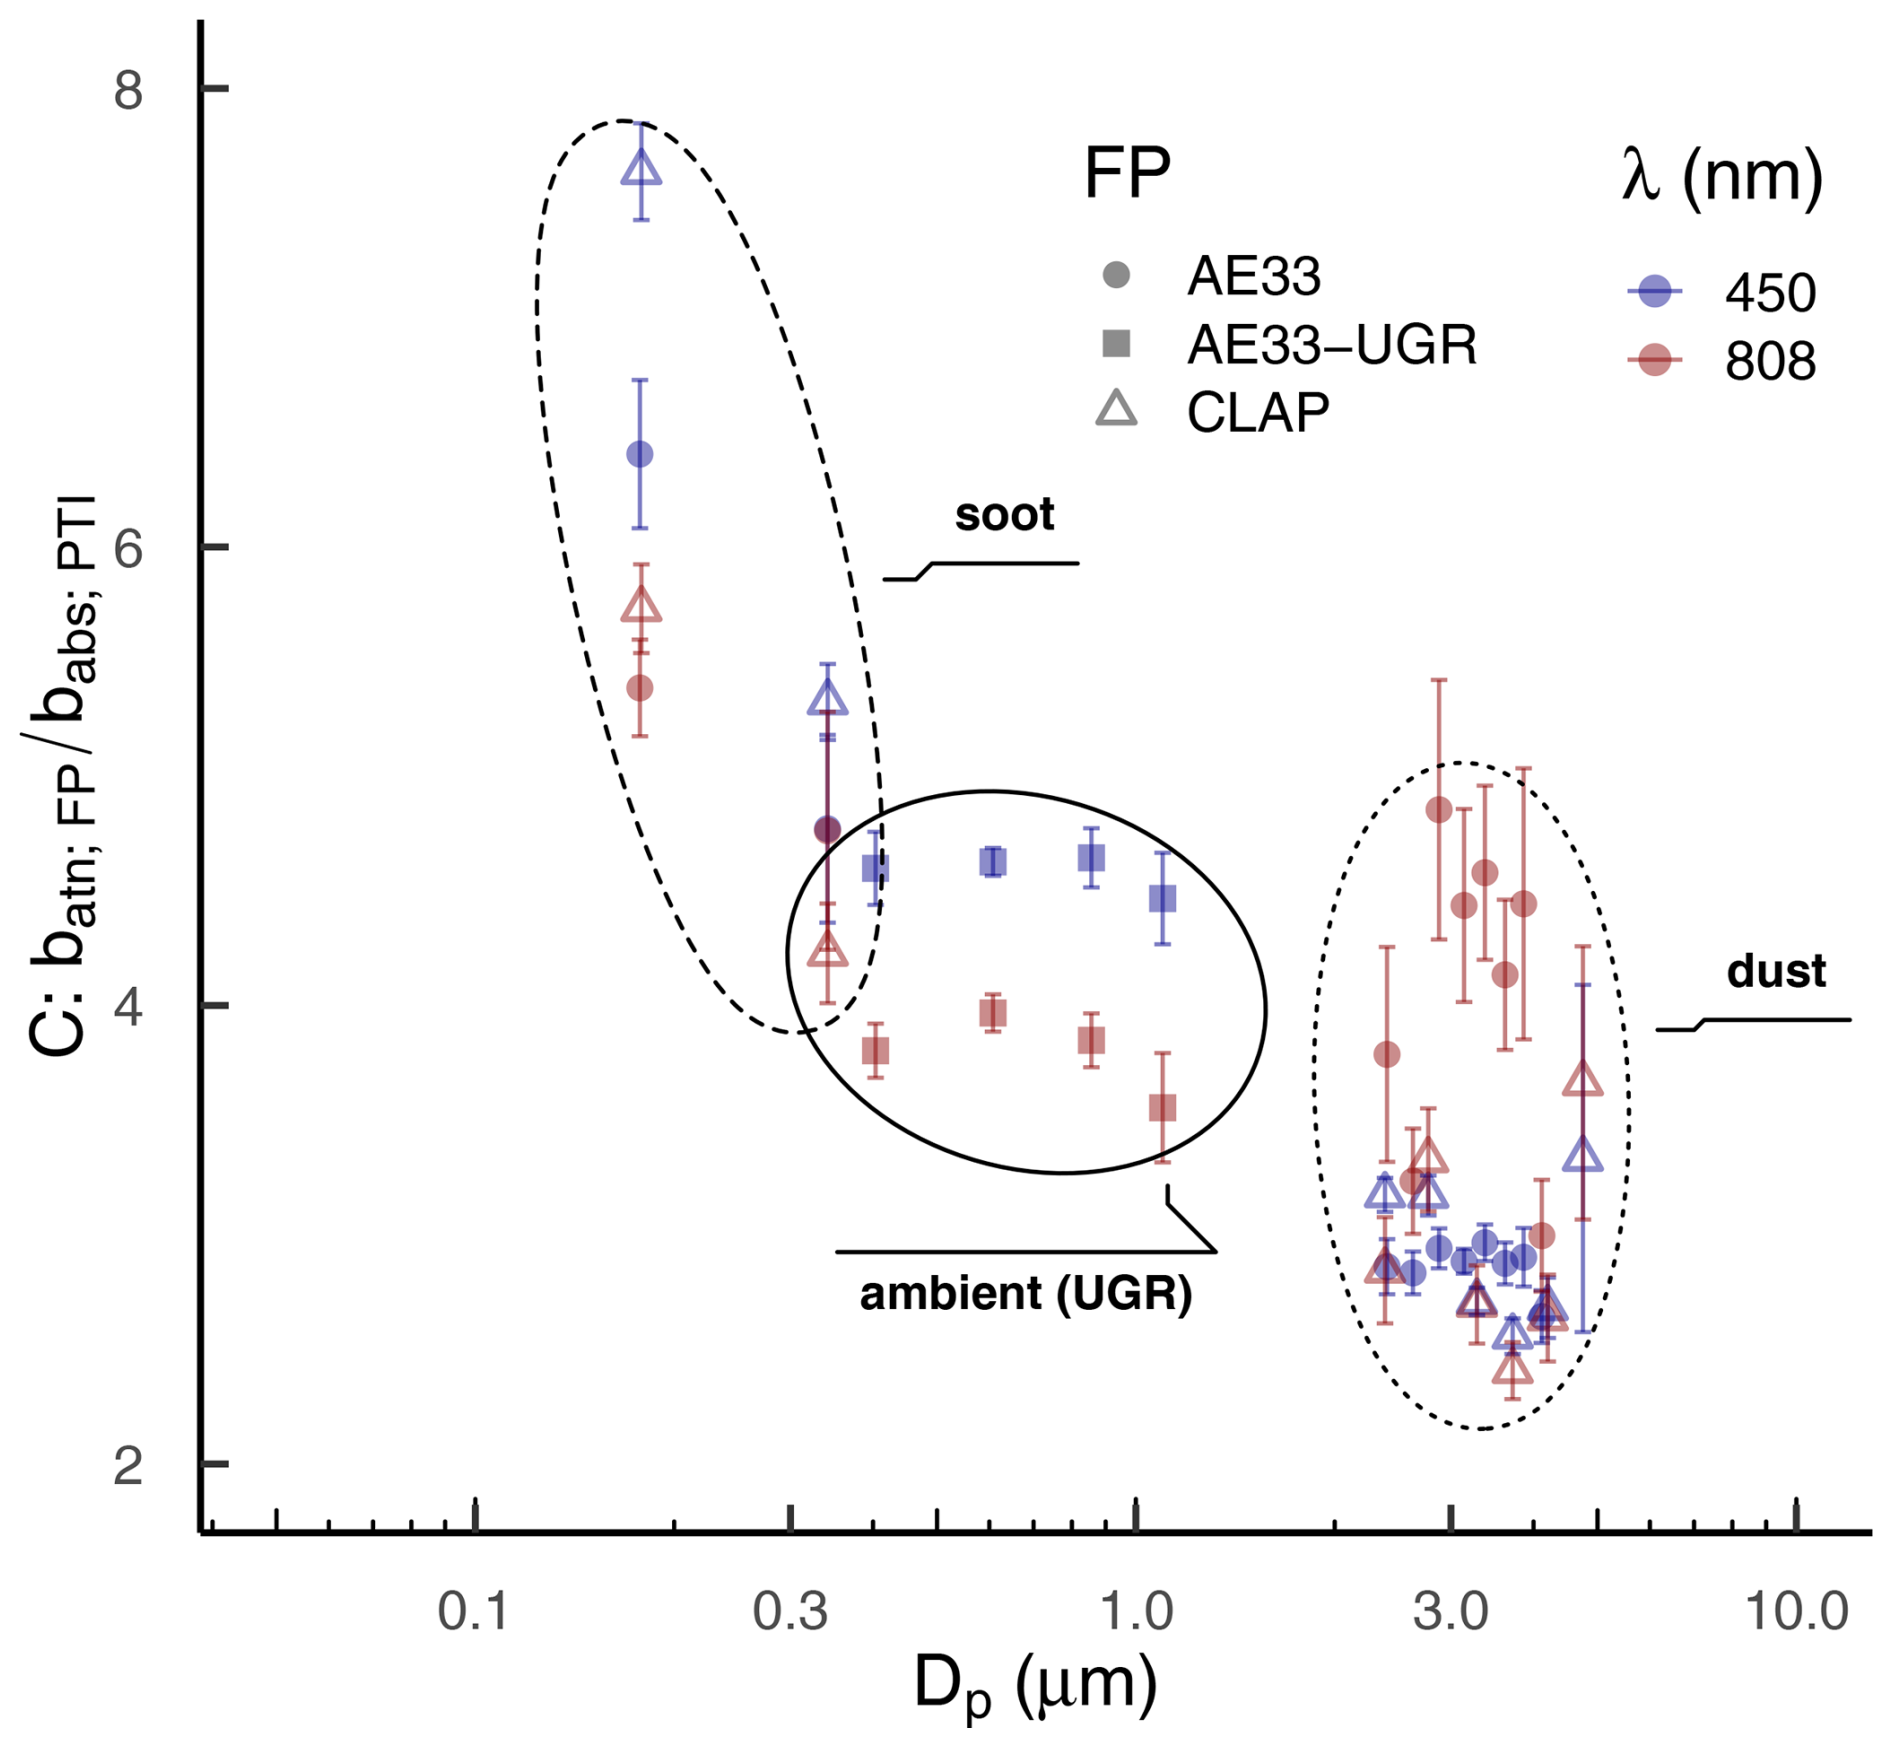
Figure 5Dependence of the filter photometer multiple-scattering parameter C, for the AE33 and CLAP, on the volume particle diameter (Dp). It should be noted that the particle size for the measurements obtained for soot and ambient measurements corresponds to the mobility diameter, whereas, for mineral dust, the diameter is reported to correspond to optical diameter. C is obtained as the ratio of the filter photometer attenuation coefficient, corrected for the scattering artifact, to the PTAAM-2λ absorption coefficient at 450 and 808 nm. The AE33 and CLAP employed the laboratory measurements, whereas AE33-UGR refers to the ambient measurements performed in Granada, Spain. The error bars in the right panel showcase the upper and lower 95 % confidence interval.
Figure 5 shows that both the AE33 and CLAP feature C values that, while higher, exhibit the same trend as those found in Drinovec et al. (2022), where it was shown that, in the sub-micrometer particle mobility diameter region, the CLAP measurements had a higher C than the AE33 for the smaller particles and vice versa for the coarser particles. Here, we see that there is a considerable decrease in C at 450 and 808 nm within the fine mode for soot: from 6.41 and 5.39 at 178 nm volume size mode (Dp) to 4.77 and 4.76 at 341 nm for the AE33 and from 7.64 and 5.73 to 5.32 and 4.23 for the CLAP. At Granada, the C for the AE33 ranged between 4.64 and 4.47 to 3.97 and 3.55 at 450 and 808 nm, very similarly to the coarser diesel soot particles measured in the laboratory. As the particles become coarse (> 1 µm), there is a significant decrease and consequent leveling-off in the parameter C, with values around 2.6–3.0 for both the AE33 and CLAP at 450 nm.
It should be noted that, at 808 nm, the C shows a high variability, as also shown in Table 3 for wavelengths over 660 nm. As can be observed in Fig. S25, the higher variability in C for dust particles is mainly driven by the variability between the different samples and the higher relative contribution of the scattering by particles to the attenuation measured by the filter photometer. Figure 5 shows that the CLAP features a higher dependency of C on the particle size, with higher values at smaller diameters (below 500 nm) and similar values for the broader region of larger diameters. It should be noted that the ambient Granada aerosol sample is an external mixture of a multi-mode aerosol particle size distribution (see Fig. S2) of fine soot-like particles, coarse dust particles, and other fine and coarse particles. Therefore, Dp is only a proxy of the size of the total mixture that averages the effect of the absorbing fine soot-like particles with higher C values and the coarser dust particles with lower C values.
In brief, this section showcases the variation in the multiple-scattering parameter for different aerosol types: mineral dust, soot-like particles, and ambient urban aerosol. We have found that the key parameter is the source-dependent particle size, with smaller particles showcasing much higher values of the multiple-scattering parameter C. Therefore, the comparison of our results with the literature showcases the impact of the variability introduced by different sources (and, therefore, sizes). When comparing these values with the previously published ones, it is important to take into account the use of different filter materials in different (or the same) filter photometer models. In this regard, this study provides a focused and in-detail analysis of the behavior of the C parameter for different aerosol types with different particle size ranges in two of the most-used filter photometers – the Aethalometer AE33 and the CLAP.
3.3 MAAP artifacts
The MAAP is considered in many studies to be a pseudo-reference instrument that has been used to characterize AE31 and AE33 artifacts (e.g., Di Biagio et al., 2017; Yus-Díez et al., 2021; ECAC-CAIS, 2022). It measures the backscattering of light from the sample-laden filter at two angles that are used to parameterize the angular distribution of light and to correct for the (multiple) scattering of the light by particles within the filter through an internal algorithm (Petzold and Schönlinner, 2004). However, as shown by Valentini et al. (2020), the MAAP design limitations (only two angles measuring backscattered radiation) hinder its ability to fully represent the angular distribution of light scattered by the sample-laden filter. Valentini et al. (2020) show that the MAAP-derived absorption coefficient differs by 14 % from the one provided by the higher-angular-resolution PP_UniMI (Vecchi et al., 2014).
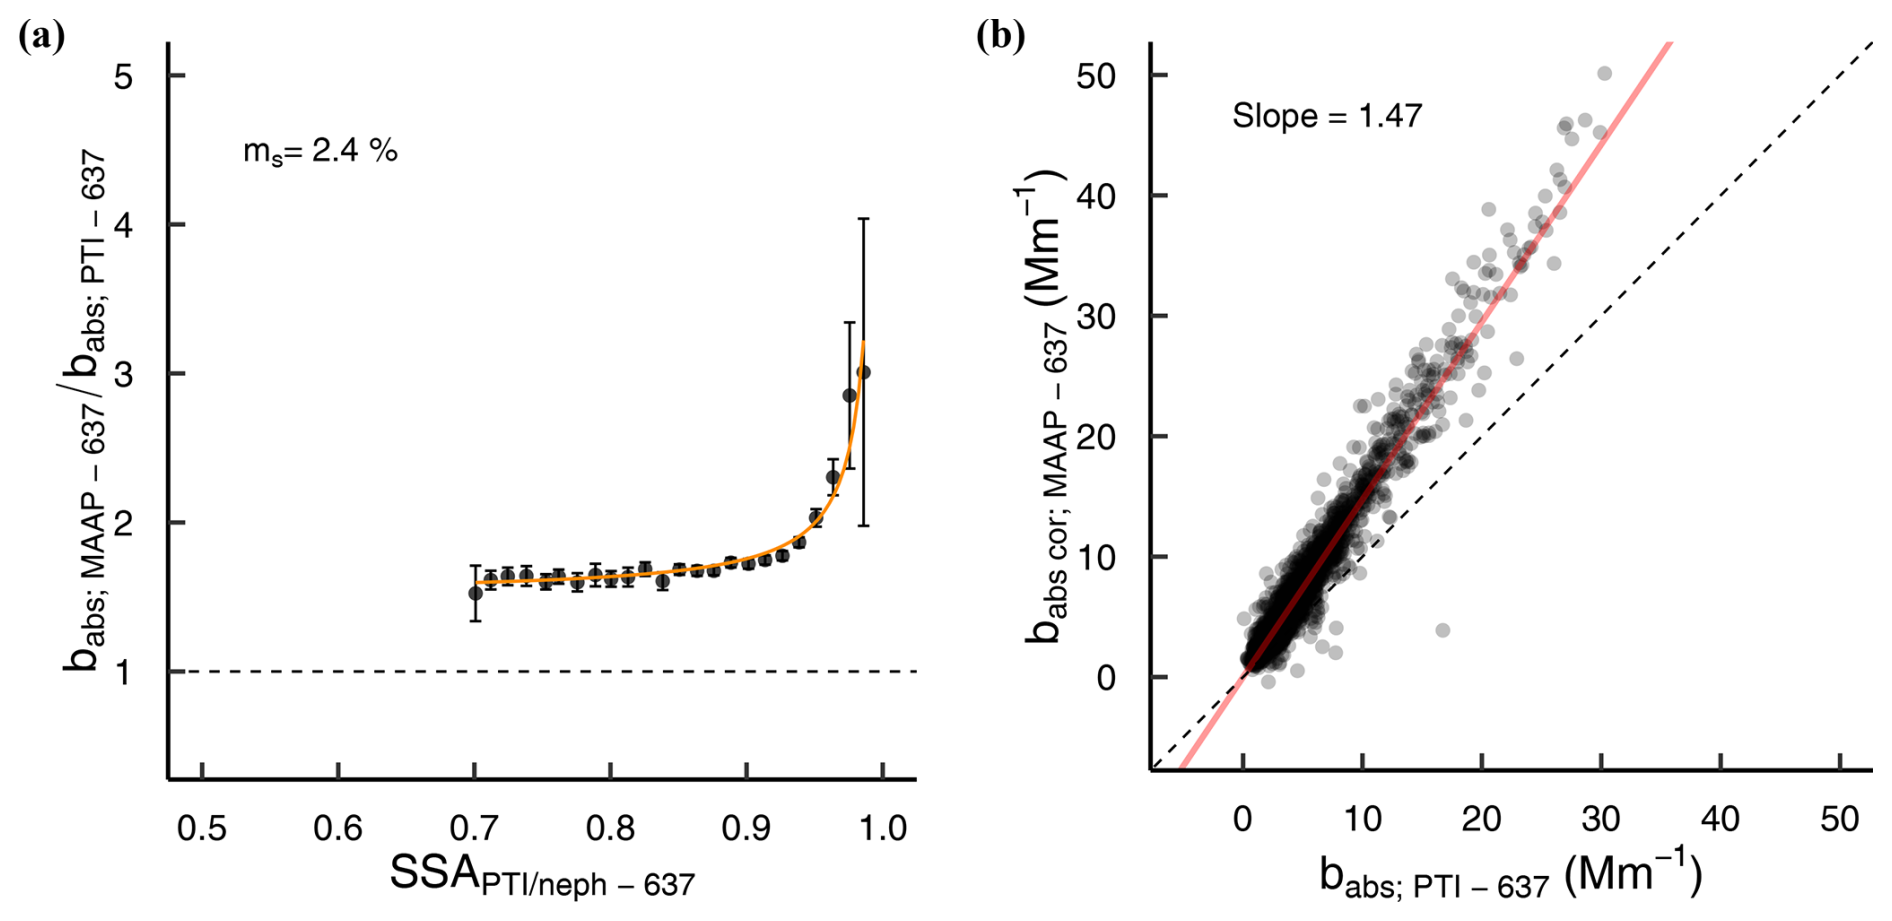
Figure 6(a) Evaluation of the cross-sensitivity to scattering for the MAAP through the ratio of the MAAP to the PTAAM-2λ absorption dependence on SSA and (b) relationship between the MAAP absorption corrected for the scattering artifact vs. the PTAAM-2λ absorption. The error bars represent the upper and lower 95 % interval confidence intervals of the measurements within the bins.
Figure 6 shows the ratio of the MAAP-derived absorption coefficient to the absorption coefficient measured by the PTAAM-2λ, changing with the ambient SSA, all at 637 nm. It shows overestimation by the MAAP relative to the traceably calibrated PTAAM-2λ: a clear deviation of the absorption coefficient ratio from 1 at low SSA, as well as a large increase for the MAAP absorption coefficient relative to the PTAAM-2λ at SSA values above 0.95. The result of the fit showcases an artifact – cross-sensitivity to scattering by the MAAP of ms of 2.4 %. Although it is 2.5 times lower than what has been found for the same period for the AE33 (Fig. 3b and Table 2), it is still remarkable since, for the highest SSA measured, the MAAP absorption was more than double the one measured with the PTAAM-2λ. After correcting the MAAP absorption for its cross-sensitivity to scattering following Eq. (1) – but for babs (MAAP) instead of batn – Fig. 6b shows a 47 % overestimation of the MAAP absorption values in comparison with the PTAAM-2λ reference measurements. We quantified the uncertainty associated with the interpolation of the PTAAM absorption coefficients to the MAAP wavelength at 637 nm. We compare the two-wavelength PTAAM interpolation with the use of the seven-wavelength fit from the calibrated AE33 (see Sect. 3.2) – the difference in the MAAP absorption overestimation would increase by 4 % using this alternative.
Similarly to the AE33 and the CLAP, a dependence on the particle size in the ratio between the MAAP-derived absorption coefficient and the reference one was observed. However, the particle diameter did not present such a wide size range as during the laboratory experiments; hence, conclusions are limited (Fig. S26). In this regard, Fig. S5 from Romshoo et al. (2022) showed that the MAAP and AE33 (harmonized to the MAAP) absorption in relation to extinction-minus-scattering measurements as a reference also had a ratio between 1 and 1.5 for aerosols with a volume mean diameter below 100 nm and that this converged towards 1 with increasing particle size, especially for particles with a volume mean diameter above 100 nm. Similarly to our study, Romshoo et al. (2022) show that the decrease in the ratio with size is more pronounced for the AE33 than for the MAAP.
The presented cross-sensitivity to scattering artifacts and the multiple-scattering parameter values for the MAAP and AE33 have large implications for the reporting of absorption coefficients in ambient measurement networks. For example, the MAAP deployed at Granada was part of the study of Savadkoohi et al. (2023) as an effort to harmonize equivalent black carbon (eBC) AE33 measurements across Europe following the ACTRIS guidelines (Müller and Fiebig, 2021). These guidelines used the MAAP as a pseudo-reference instrument and measured the deviation between the AE33 and MAAP eBC under different scenarios. This deviation was parameterized with the ACTRIS harmonization factor (H* = 1.76; ECAC-CAIS, 2022), a multiplicative parameter to compensate for the AE33 measurements across different measurement sites across the ACTRIS network. This H* factor is computed as follows: H* = eBC, where eBCAE33 and σAE33 are the AE33-reported black carbon concentration and the default AE33 MAC, respectively, interpolated to the MAAP wavelength, and babs,MAAP is the absorption coefficient provided by the MAAP.
Following the methodological approach proposed by the ACTRIS guidelines (ECAC-CAIS, 2022), we have obtained a Granada-specific H* = 1.89 (Fig. S27) and a 95 % confidence interval ranging between 1.86 and 1.92, which is about 7 % higher than the ACTRIS value. This difference can be explained by the different aerosol sample measured, as well as by the instrument inter-variability. Therefore, to properly correct the AE33 measurements using the MAAP as a pseudo-reference instrument, the additional deviation factor of 1.47 between the MAAP and the PTAAM-2λ has to be introduced into the harmonization factor to account for the artifacts of both instruments, increasing the H* to 1.76⋅1.47 ≃ 2.6. The variability in this additional factor needs to be investigated as we have shown that it is dependent on the correction for SSA effects.
This overestimation by the MAAP, then propagated to the AE33 measurements (see Fig. S3), results in a significant overestimation of the eBC, the mass absorption cross-section (MAC), and the absorption enhancement (Eabs) values reported for measurements that used either instrument (e.g., Zanatta et al., 2016; Yus-Díez et al., 2022; Savadkoohi et al., 2023). Indeed, the MAC reported in Zanatta et al. (2016) for the MAAP was higher (1.47 on average) than that obtained with the PSAP-ITM; however, the site backgrounds were not strictly comparable.
An overestimation of the MAAP measurements when compared with the PTAAM-2λ absorption of 1.41 was also found during the laboratory experiments performed within the framework of the stanBC project (European Partnership on Metrology; https://stanbc.com, last access: 9 July 2025), which aimed to provide a methodology to standardize the measurements of the aerosol absorption coefficient, BC, and eBC from filter photometer measurements; the paper for this study is in preparation. In addition to laboratory experiments, further ambient campaigns where the PTAAM-2λ is deployed should be performed to provide further details on the effects that influence the sensitivity and performance of filter photometers in general and of the MAAP as a pseudo-reference in particular.
This study quantifies the effect of two main aerosol properties affecting the filter photometer multiple-scattering parameter and its cross-sensitivity to scattering: the particle single-scattering albedo and their size distribution. Furthermore, it highlights the differences in terms of the measurements of the different aerosol types and the differences featured in the measurements by different filter photometers, the AE33, the CLAP, and the MAAP, and it compares the results with the published values.
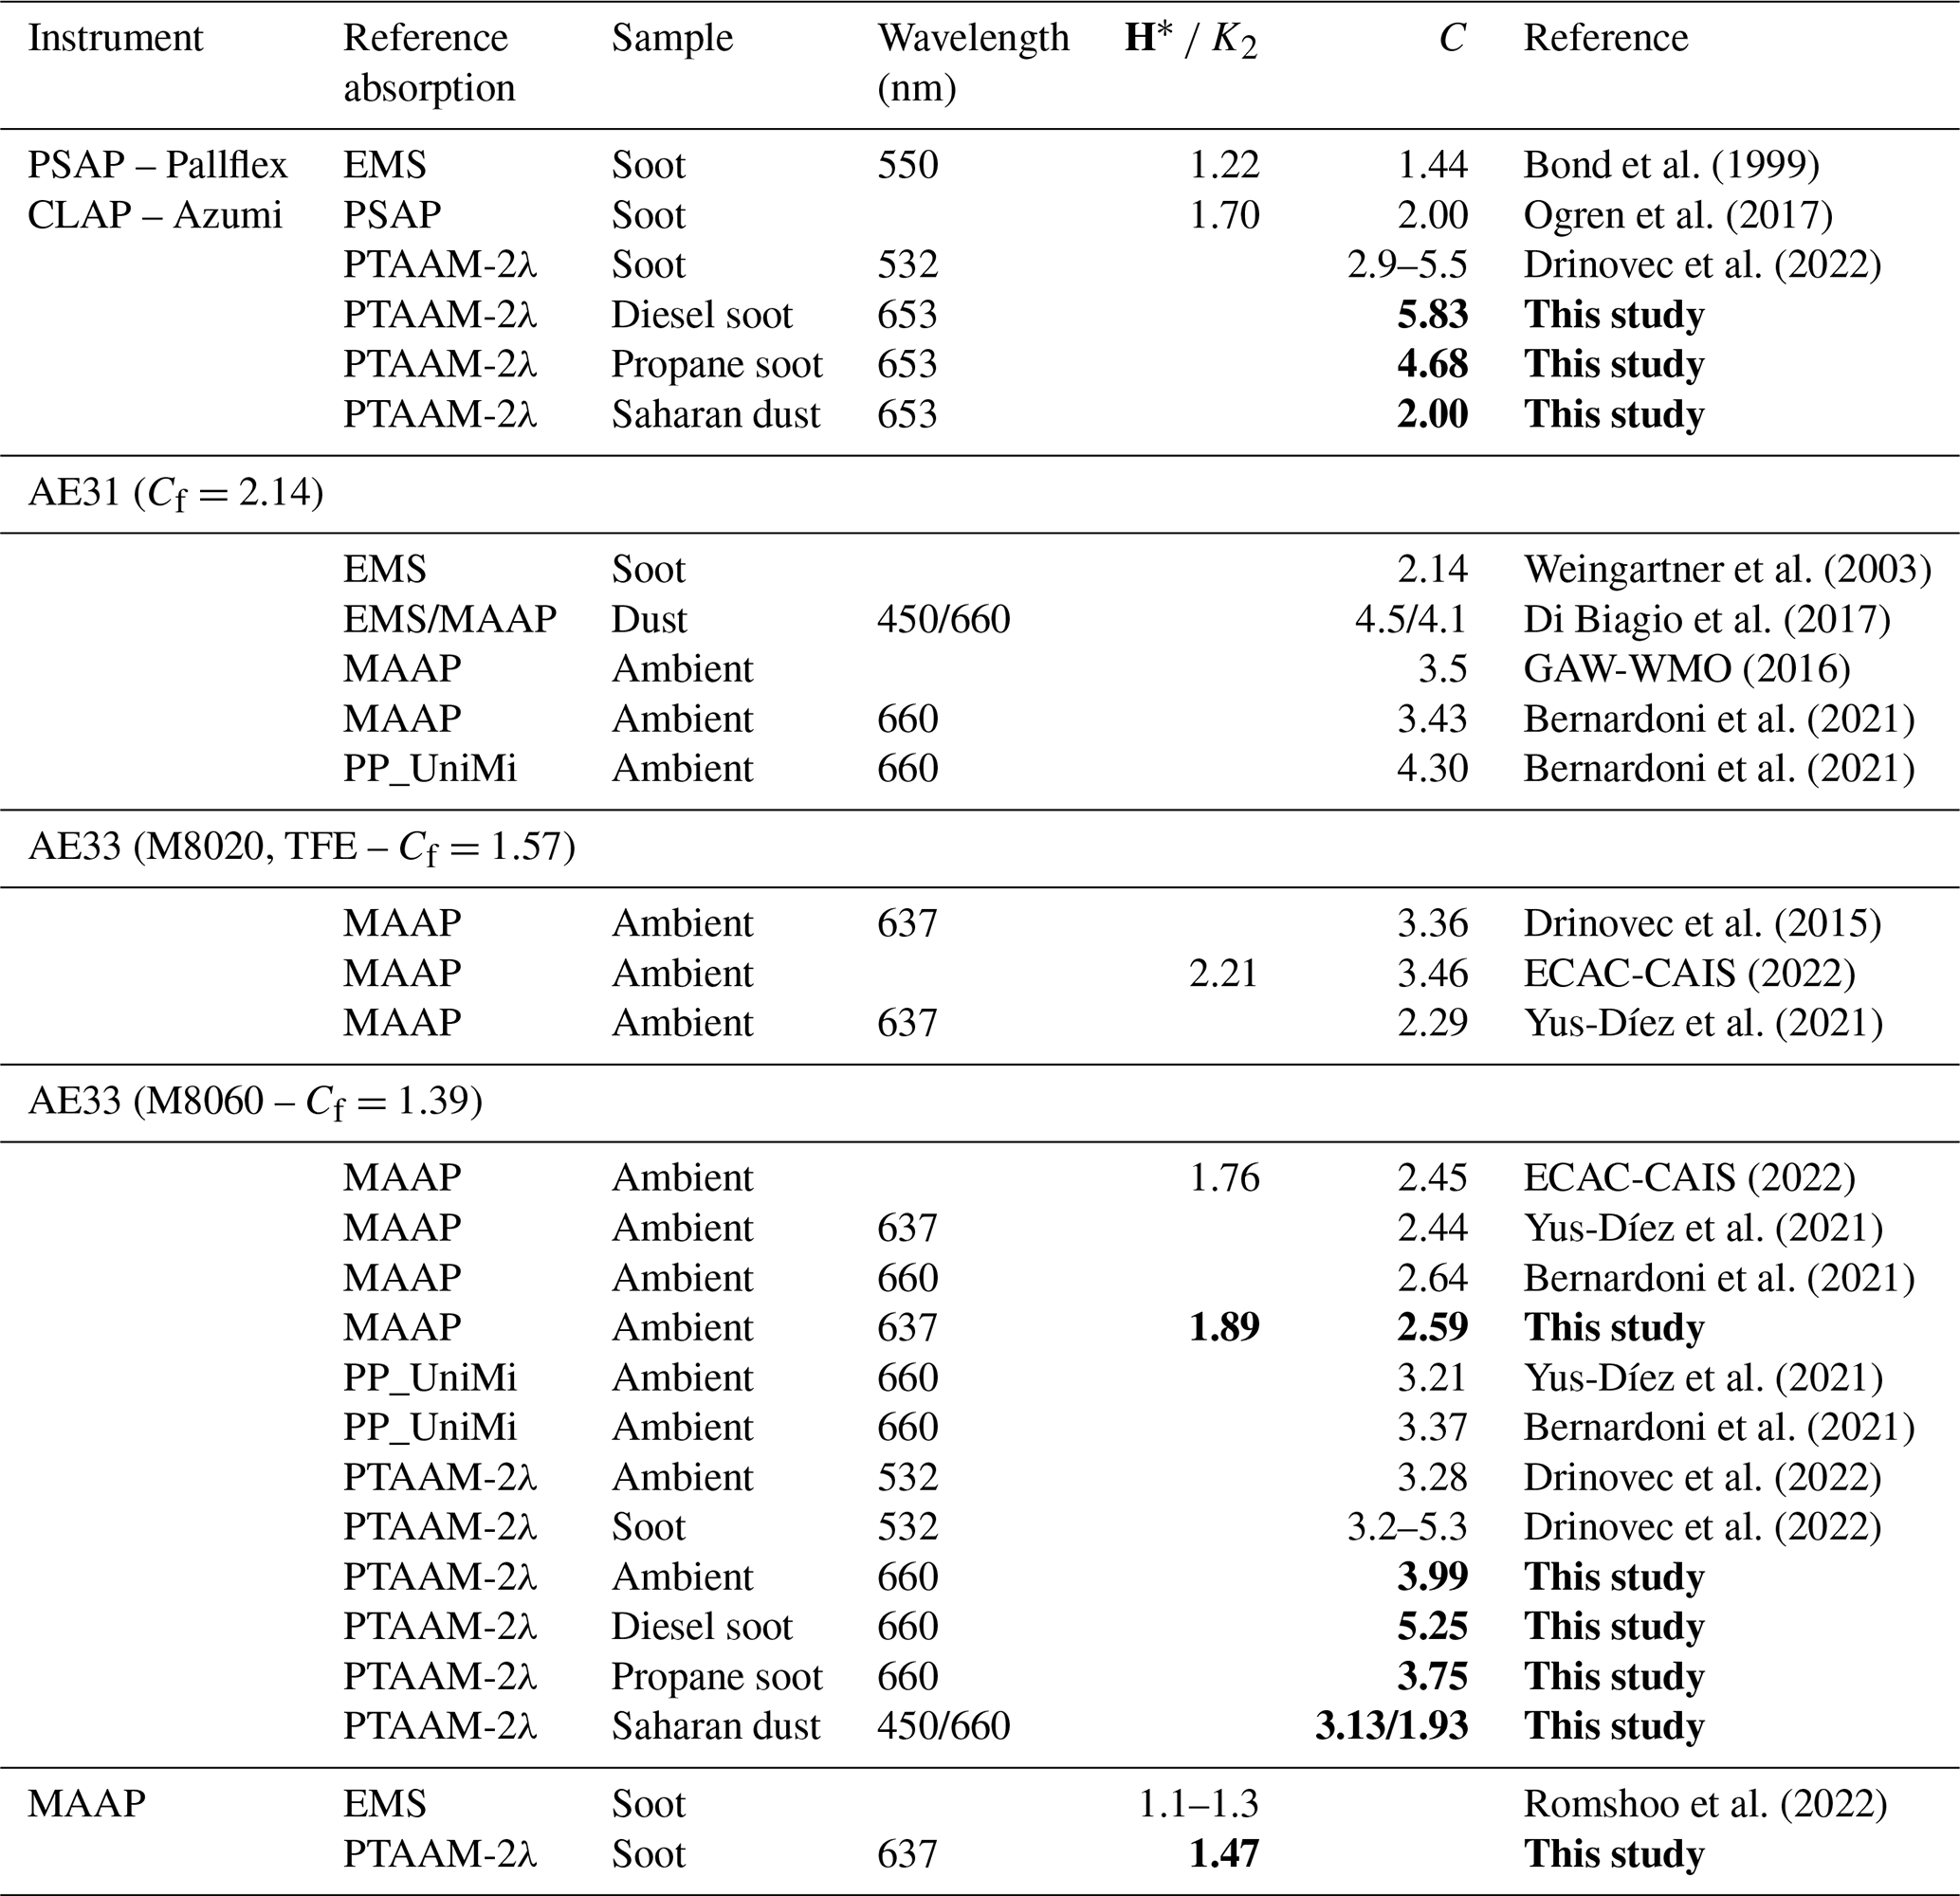
Table 4 features the multiple-scattering parameters for the different filter photometers used and referenced in this study for comparable wavelengths when possible. We have also included the methodology or instrument used for the reference absorption measurement, which is highly influential, as shown in Sect. 3.3. We separated the values by instrument model and filter type, and, moreover, if the study provided a differently parameterized compensation factor, either H* for the AE33 Aethalometer harmonization factor ECAC-CAIS (2022) or K1 for the PSAP and/or the CLAP, we converted this value into a C value following Eq. (2). The relationship between the ACTRIS harmonization factor H* and C is such that C = . Similarly, K2 = 0.85C.
Bond et al. (1999)Ogren et al. (2017)Drinovec et al. (2022)Weingartner et al. (2003)Di Biagio et al. (2017)GAW-WMO (2016)Bernardoni et al. (2021)Bernardoni et al. (2021)Drinovec et al. (2015)ECAC-CAIS (2022)Yus-Díez et al. (2021)ECAC-CAIS (2022)Yus-Díez et al. (2021)Bernardoni et al. (2021)Yus-Díez et al. (2021)Bernardoni et al. (2021)Drinovec et al. (2022)Drinovec et al. (2022)Romshoo et al. (2022)Table 4Multiple-scattering parameter values from this work and the literature for different instruments, filter types, and samples. The filter tape multiple-scattering parameter provided by the manufacturer is referred to as Cf, and H* is the ACTRIS harmonization factor C = . K2 is the CLAP or PSAP factor, as in Ogren et al. (2017), based on the correction scheme of Bond et al. (1999) for the PSAP and calculated as K2 = 0.85 C. For a better comparison, all of the multiple-scattering parameters are converted to C, which is the ratio between the attenuation coefficient measured by the filter photometers and the absorption coefficient by the reference instrument. The MAAP harmonization factor H* (in bold) is derived from the comparison of the MAAP absorption and the reference absorption measurements.
As discussed in the previous sections, the CLAP C value found in this study for soot, although slightly higher, agrees well with the values found by Drinovec et al. (2022), which are much higher than those used by Ogren et al. (2017) and determined by Bond et al. (1999) for the Particle Soot Absorption Photometer (PSAP, upon which the CLAP design is based). The results for the Aethalometer AE31 show a high degree of variation in C with the method used for the reference absorption and the sample type (Weingartner et al., 2003; GAW-WMO, 2016; Di Biagio et al., 2017; Bernardoni et al., 2021). Similarly, the AE33 shows highly heterogeneous C values for the same sample types and reference absorption methods. Indeed, for ambient measurements, a C of 2.45–2.64 is found when using the MAAP as a reference (this study included), and a C value of 3.21–3.37 is found when using the more accurate PP_UniMi. However, these C values are lower than those found by using a true absorption reference, the PTAAM-2λ, which shows C values in the infrared of 3.99. As shown in Sect. 3.3, this difference is the result of the artifact introduced by the use of a filter photometer, the MAAP, as a reference instrument for absorption. When comparing the results from this study with those of Drinovec et al. (2022) for soot particles, we obtain a good agreement in terms of both the average values and the dependency of C on SSA and the particle size diameter.
There is a notable lack of published references for the same type of filter photometers using different filter tapes and mineral dust samples. The study performed by Di Biagio et al. (2017) is similar but uses a different model, the AE31. They present a high variability in terms of C values, depending on the method used for the reference absorption and sample type. Our results for Saharan dust at 450 nm, ∼ 3.1, show lower values compared to those found by Di Biagio et al. (2017) at 450 nm, ∼ 4.5, where they used the extinction-minus-scattering method as the reference absorption. However, rescaling the AE31 values using concurrent AE31 and AE33 measurements from Drinovec et al. (2015) using the 1.47 factor, we obtain values which agree much better, noting that the rescaling value is most certainly sample dependent.
We have characterized the multiple-scattering artifacts of the most widely used filter photometers during a laboratory campaign and an ambient campaign where the traceably calibrated reference instrument for absorption, the dual-wavelength photothermal interferometer PTAAM-2λ, was deployed. The investigated filter photometers were the Aethalometer AE33 and the Continuous Light Absorption Photometer (CLAP) during the laboratory campaign and the AE33 and the Multiangle Absorption Photometer (MAAP) during the ambient campaign. Mineral dust and soot-like samples were analyzed during the laboratory campaign, whereas the ambient campaign was performed during summer at an urban station in Granada (UGR), with varying composition in terms of urban and regional aerosols, rich in soot and dust.
We have determined the cross-sensitivity to scattering due to coarse dust samples using a non-absorbing quartz sample. The parameter ms is lower for the CLAP than for the AE33, which is linked with the instrument design, with values of 3.0 % and 1.5 % at 450 and 808 nm for the AE33 and 2.4 % and 0.9 % at 450 and 808 nm for the CLAP. Furthermore, we have derived the cross-sensitivity to scattering at the urban background station, where the AE33 values are 6.1 % and 6.7 % at 450 and 808 nm but with larger values around 8 % in the mid-visible range. The larger scattering artifact found at the UGR is associated with the presence of finer particles, which result in a higher cross-sensitivity to scattering.
The sample variability in this study has enabled the study of the dependence of the multiple-scattering parameter C across a wide range of particle sizes. We have found that the multiple-scattering parameter C for both the CLAP and AE33 decreases sharply with size within the fine fraction and levels off for coarse particles. As a result, the finer samples feature C values at 450 nm and 808 nm for the AE33 (the CLAP) that range between 4.08 and 3.95 (5.10 and 4.26) for propane soot and 6.25 and 5.27 (6.79 and 5.80) for diesel soot. For the mineral dust samples, the C ranged between 2.74 and 3.13 for the AE33 and between 2.50 and 2.80 for the CLAP at 450 nm. At UGR, the aerosol particle composition is a mixture of local and regional contributions and dust, which results in a particle size in between the soot and the mineral dust lab samples, with a value of 4.72 and 3.95 at 450 and 808 nm.
Overall, the multiple-scattering parameters C found in this study for both the AE33 and the CLAP were higher than those presented in previous studies, where filter photometers such as the MAAP or similar are used as a reference. Here, thanks to the co-located MAAP and PTAAM-2λ measurements during the ambient campaign in Granada, we have shown that the MAAP absorption coefficients overestimate the absorption by 47 %. Moreover, despite the MAAP's more complex design and absorption retrieval scheme, we have found a cross-sensitivity to scattering of 2.4 %.
This study provides a comprehensive analysis on the multiple-scattering compensation parameter C for the widely used AE33 and CLAP filter photometers, as well as a first characterization of the pseudo-reference MAAP. It provides the platform for accurately compensating for the filter-photometer-derived aerosol absorption coefficients and highlights the importance of correcting for scattering artifacts and the need for knowledge of the particle sizes. Finally, it showcases the need for reference absorption measurements and the re-evaluation of previous reports on absorption coefficients and mass absorption cross-sections based on the MAAP.
| Abbreviation | Description |
| AAE | Absorption Ångström exponent |
| AE33 | Multi-wavelength Aethalometer model AE33 |
| AE31 | Multi-wavelength Aethalometer model AE31 |
| APS | Aerodynamic particle spectrometer |
| C | Multiple-scattering parameter |
| CLAP | Continuous Light Absorption Photometer |
| λ | Wavelength (nm) |
| MAAP | Multiangle Absorption Photometer |
| ms | Cross-sensitivity to scattering artifact parameter |
| OPC | Optical particle counter |
| PTAAM-2λ | Dual-wavelength photothermal aerosol absorption monitor |
| PTI | Photothermal interferometry |
| SSA | Single-scattering albedo |
| SMPS | Scanning-mobility parameter sizer |
| UGR | University of Granada |
The code and data used for this paper can be accessed upon request to the corresponding author.
The supplement related to this article is available online at https://doi.org/10.5194/amt-18-3073-2025-supplement.
LD, GM, GT, LAA, and JYD conceived and designed the study. LD performed the laboratory campaign measurements. AGR, JYD, XQ, and CPGP were involved in the field campaigns that collected the bulk mineral dust samples. GT, LAA, EB, DP, AC, LD, GM, and JYD were involved in the installation, operation, maintenance, and calibration of the instruments before, during, and/or after the campaigns. JYD processed the data, and LD, GM, and JYD prepared the paper. All of the co-authors contributed to the scientific discussion and to the preparation and review of the paper.
LD and GM are employed by Haze Instruments d.o.o., the manufacturer of the PTAAM-2λ. The contact author has declared that none of the authors has any other competing interests.
Publisher’s note: Copernicus Publications remains neutral with regard to jurisdictional claims made in the text, published maps, institutional affiliations, or any other geographical representation in this paper. While Copernicus Publications makes every effort to include appropriate place names, the final responsibility lies with the authors.
This publication is supported by the European Union's Horizon Europe Research and Innovation program under the Marie Skłodowska-Curie Postdoctoral Fellowship program “SMASH”, co-funded under grant agreement no. 101081355. The SMASH project is co-funded by the Republic of Slovenia and the European Union through the European Regional Development Fund. We acknowledge co-funding by Slovenian Research and Innovation Agency program nos. P1-0385 (“Remote sensing of atmospheric properties”), I-0033 (“Infrastructural program of the University of Nova Gorica”), V1-2373, L1-4386, and L2-4485 and by the EURAMET/Horizon Europe stanBC project (grant no. 22NRM02) and the ESA “Support to the Aeolus Validation and Calibration through Airborne Aerosol In-situ Observations in the Tropics” project (grant no. 000131931/20/NL/FF/an). The dust samples were obtained through a field campaign funded by the European Research Council under the Horizon 2020 Research and Innovation program, through the ERC Consolidator Grant FRAGMENT (grant agreement no. 773051), and the AXA Research Fund, through the AXA Chair on Sand and Dust Storms at BSC. Ambient measurements at the UGR urban station were supported by the European Union's Horizon 2020 Research and Innovation program through ACTRIS.IMP (grant agreement no. 871115) and ATMO-ACCESS (grant agreement no. 101008004). Elena Bazo is funded by grant no. MICIU/AEI/10.13039/501100011033, the ESF, and FPI fellowship no. PRE2022-101272.
This research has been supported by the European Union's Horizon Europe Research and Innovation program under the Marie Skłodowska-Curie Actions (grant no. 101081355), the European Association of National Metrology Institutes (stanBCm (grant no. 22NRM02)), the European Space Agency (grant no. 000131931/20/NL/FF/an), the European Research Council, the H2020 European Research Council (grant no. 773051), the AXA Research Fund (AXA Chair on Sand and Dust Storms), the European Union's Horizon 2020 (ACTRIS IMP (grant no. 871115) and ATMO-ACCESS (grant no. 101008004)), the Ministerio de Ciencia e Innovación (ELPIS (grant no. PID2020-12001-5RB-I00); EQC2019 006423-P; NUCLEUS (grant no. PID2021-128757OB-I00); grant nos. MICIU/AEI/10.13039/501100011033, PRE2022-101272, and MICIU/AEI/10.13039/501100011), the European Regional Development Fund, the European Observation Network for Territorial Development and Cohesion (grant no. RED2022-134824-E), and the Universidad de Granada (Excellence Research Unit Earth Science and Singular Laboratory AGORA (grant no. LS2022-1)).
This paper was edited by Vassilis Amiridis and reviewed by two anonymous referees.
Adebiyi, A. A. and Kok, J. F.: Climate models miss most of the coarse dust in the atmosphere, Science Advances, 6, 1–10, https://doi.org/10.1126/sciadv.aaz9507, 2020. a
Anderson, T. L. and Ogren, J. A.: Determining Aerosol Radiative Properties Using the TSI 3563 Integrating Nephelometer, Aerosol Sci. Tech., 29, 57–69, https://doi.org/10.1080/02786829808965551, 1998. a
Arnott, W. P., Moosmüller, H., Sheridan, P. J., Ogren, J. A., Raspet, R., Slaton, W. V., Hand, J. L., Kreidenweis, S. M., and Collett Jr., J. L.: Photoacoustic and filter-based ambient aerosol light absorption measurements: Instrument comparisons and the role of relative humidity, J. Geophys. Res.-Atmos., 108, AAC 15-1–AAC 15-11, https://doi.org/10.1029/2002JD002165, 2003. a, b
Arnott, W. P., Hamasha, K., Moosmüller, H., Sheridan, P. J., and Ogren, J. A.: Towards aerosol light-absorption measurements with a 7-wavelength aethalometer: Evaluation with a photoacoustic instrument and 3-wavelength nephelometer, Aerosol Sci. Tech., 39, 17–29, https://doi.org/10.1080/027868290901972, 2005. a
Baldo, C., Formenti, P., Di Biagio, C., Lu, G., Song, C., Cazaunau, M., Pangui, E., Doussin, J.-F., Dagsson-Waldhauserova, P., Arnalds, O., Beddows, D., MacKenzie, A. R., and Shi, Z.: Complex refractive index and single scattering albedo of Icelandic dust in the shortwave part of the spectrum, Atmos. Chem. Phys., 23, 7975–8000, https://doi.org/10.5194/acp-23-7975-2023, 2023. a
Balkanski, Y., Schulz, M., Claquin, T., and Guibert, S.: Reevaluation of Mineral aerosol radiative forcings suggests a better agreement with satellite and AERONET data, Atmos. Chem. Phys., 7, 81–95, https://doi.org/10.5194/acp-7-81-2007, 2007. a
Bernardoni, V., Ferrero, L., Bolzacchini, E., Forello, A. C., Gregorič, A., Massabò, D., Močnik, G., Prati, P., Rigler, M., Santagostini, L., Soldan, F., Valentini, S., Valli, G., and Vecchi, R.: Determination of Aethalometer multiple-scattering enhancement parameters and impact on source apportionment during the winter 2017/18 EMEP/ACTRIS/COLOSSAL campaign in Milan, Atmos. Meas. Tech., 14, 2919–2940, https://doi.org/10.5194/amt-14-2919-2021, 2021. a, b, c, d, e, f, g, h, i, j
Bond, T., Doherty, S., Fahey, D., Forster, P., Berntsen, T., DeAngelo, B., Flanner, M., Ghan, S., Kärcher, B., Koch, D., Kinne, S., Kondo, Y., Quinn, P., Sarofi, M., Schultz, M., Venkataraman, C., Zhang, H., Zhang, S., Bellouin, N., Guittikunda, S., Hopke, P., Jacobson, M., Kaiser, J., Klimont, Z., Lohmann, U., Schwarz, J., Shindell, D., Storelvmo, T., Warren, S., and Zender, C. S.: Bounding the role of black carbon in the climate system: A scientific assessment, J. Geophys. Res.-Atmos., 118, 5380–5552, 2013. a, b
Bond, T. C. and Bergstrom, R. W.: Light absorption by carbonaceous particles: An investigative review, Aerosol Sci. Tech., 40, 27–67, https://doi.org/10.1080/02786820500421521, 2006. a
Bond, T. C., Anderson, T. L., and Campbell, D.: Calibration and Intercomparison of Filter-Based Measurements of Visible Light Absorption by Aerosols, Aerosol Sci. Tech., 30, 582–600, https://doi.org/10.1080/027868299304435, 1999. a, b, c, d, e, f, g, h, i, j, k
Caponi, L., Formenti, P., Massabó, D., Di Biagio, C., Cazaunau, M., Pangui, E., Chevaillier, S., Landrot, G., Andreae, M. O., Kandler, K., Piketh, S., Saeed, T., Seibert, D., Williams, E., Balkanski, Y., Prati, P., and Doussin, J.-F.: Spectral- and size-resolved mass absorption efficiency of mineral dust aerosols in the shortwave spectrum: a simulation chamber study, Atmos. Chem. Phys., 17, 7175–7191, https://doi.org/10.5194/acp-17-7175-2017, 2017. a, b
Casquero-Vera, J., Lyamani, H., Titos, G., Minguillón, M., Dada, L., Alastuey, A., Querol, X., Petäjä, T., Olmo, F., and Alados-Arboledas, L.: Quantifying traffic, biomass burning and secondary source contributions to atmospheric particle number concentrations at urban and suburban sites, Sci. Total Environ., 768, 145282, https://doi.org/10.1016/j.scitotenv.2021.145282, 2021. a
Casquero-Vera, J. A., Lyamani, H., Dada, L., Hakala, S., Paasonen, P., Román, R., Fraile, R., Petäjä, T., Olmo-Reyes, F. J., and Alados-Arboledas, L.: New particle formation at urban and high-altitude remote sites in the south-eastern Iberian Peninsula, Atmos. Chem. Phys., 20, 14253–14271, https://doi.org/10.5194/acp-20-14253-2020, 2020. a, b
Collaud Coen, M., Weingartner, E., Apituley, A., Ceburnis, D., Fierz-Schmidhauser, R., Flentje, H., Henzing, J. S., Jennings, S. G., Moerman, M., Petzold, A., Schmid, O., and Baltensperger, U.: Minimizing light absorption measurement artifacts of the Aethalometer: evaluation of five correction algorithms, Atmos. Meas. Tech., 3, 457–474, https://doi.org/10.5194/amt-3-457-2010, 2010. a, b
Di Biagio, C., Formenti, P., Cazaunau, M., Pangui, E., Marchand, N., and Doussin, J.: Corrigendum to “Aethalometer multiple scattering correction Cref for mineral dust aerosols” published in Atmos. Meas. Tech., 10, 2923–2939, 2017, Atmos. Meas. Tech., 10, 2923–2939, https://doi.org/10.5194/amt-10-2923-2017-corrigendum, 2017. a, b, c, d, e, f, g, h, i, j, k, l
Di Biagio, C., Formenti, P., Balkanski, Y., Caponi, L., Cazaunau, M., Pangui, E., Journet, E., Nowak, S., Andreae, M. O., Kandler, K., Saeed, T., Piketh, S., Seibert, D., Williams, E., and Doussin, J.-F.: Complex refractive indices and single-scattering albedo of global dust aerosols in the shortwave spectrum and relationship to size and iron content, Atmos. Chem. Phys., 19, 15503–15531, https://doi.org/10.5194/acp-19-15503-2019, 2019. a, b
Di Biagio, C., Balkanski, Y., Albani, S., Boucher, O., and Formenti, P.: Direct Radiative Effect by Mineral Dust Aerosols Constrained by New Microphysical and Spectral Optical Data, Geophys. Res. Lett., 47, e2019GL086186, https://doi.org/10.1029/2019GL086186, 2020. a
Drinovec, L., Močnik, G., Zotter, P., Prévôt, A. S. H., Ruckstuhl, C., Coz, E., Rupakheti, M., Sciare, J., Müller, T., Wiedensohler, A., and Hansen, A. D. A.: The ”dual-spot” Aethalometer: an improved measurement of aerosol black carbon with real-time loading compensation, Atmos. Meas. Tech., 8, 1965–1979, https://doi.org/10.5194/amt-8-1965-2015, 2015. a, b, c, d, e, f, g, h, i, j, k, l, m
Drinovec, L., Gregorič, A., Zotter, P., Wolf, R., Bruns, E. A., Prévôt, A. S. H., Petit, J.-E., Favez, O., Sciare, J., Arnold, I. J., Chakrabarty, R. K., Moosmüller, H., Filep, A., and Močnik, G.: The filter-loading effect by ambient aerosols in filter absorption photometers depends on the coating of the sampled particles, Atmos. Meas. Tech., 10, 1043–1059, https://doi.org/10.5194/amt-10-1043-2017, 2017. a
Drinovec, L., Jagodič, U., Pirker, L., Škarabot, M., Kurtjak, M., Vidović, K., Ferrero, L., Visser, B., Röhrbein, J., Weingartner, E., Kalbermatter, D. M., Vasilatou, K., Bühlmann, T., Pascale, C., Müller, T., Wiedensohler, A., and Močnik, G.: A dual-wavelength photothermal aerosol absorption monitor: design, calibration and performance, Atmos. Meas. Tech., 15, 3805–3825, https://doi.org/10.5194/amt-15-3805-2022, 2022. a, b, c, d, e, f, g, h, i, j, k, l, m, n, o, p, q, r, s, t, u, v, w, x, y, z
ECAC-CAIS: Preliminary ACTRIS recommendations for aerosol in-situ sampling, measurements, and analyses, pp. 1–13, https://www.actris-ecac.eu/measurement-guidelines.html (last access: 9 July 2025), 2022. a, b, c, d, e, f, g
European Commission, S.: DIRECTIVE OF THE EUROPEAN PARLIAMENT AND OF THE COUNCIL on ambient air quality and cleaner air for Europe, https://data.consilium.europa.eu/doc/document/PE-88-2024-INIT/en/pdf (last access: 9 July 2025), 2024. a
Ferrero, L., Bernardoni, V., Santagostini, L., Cogliati, S., Soldan, F., Valentini, S., Massabò, D., Močnik, G., Gregorič, A., Rigler, M., Prati, P., Bigogno, A., Losi, N., Valli, G., Vecchi, R., and Bolzacchini, E.: Consistent determination of the heating rate of light-absorbing aerosol using wavelength- and time-dependent Aethalometer multiple-scattering correction, Sci. Total Environ., 791, 148277, https://doi.org/10.1016/j.scitotenv.2021.148277, 2021. a, b
Fialho, P., Hansen, A., and Honrath, R.: Absorption coefficients by aerosols in remote areas: a new approach to decouple dust and black carbon absorption coefficients using seven-wavelength Aethalometer data, J. Aerosol Sci., 36, 267–282, 2005. a
Fialho, P., Freitas, M. d. C., Barata, F., Vieira, B., Hansen, A., and Honrath, R.: The Aethalometer calibration and determination of iron concentration in dust aerosols, J. Aerosol Sci., 37, 1497–1506, 2006. a
GAW-WMO: WMO/GAW Aerosol Measurement Procedures, Guidelines and Recommendations, WMO No. 1177; GAW Report No. 227, ISBN 9789263111777, https://library.wmo.int/viewer/55277?medianame=wmo_1177_en (last access: 9 July 2025), 2016. a, b
González-Flórez, C., Klose, M., Alastuey, A., Dupont, S., Escribano, J., Etyemezian, V., Gonzalez-Romero, A., Huang, Y., Kandler, K., Nikolich, G., Panta, A., Querol, X., Reche, C., Yus-Díez, J., and Pérez García-Pando, C.: Insights into the size-resolved dust emission from field measurements in the Moroccan Sahara, Atmos. Chem. Phys., 23, 7177–7212, https://doi.org/10.5194/acp-23-7177-2023, 2023. a
González-Romero, A., González-Flórez, C., Panta, A., Yus-Díez, J., Reche, C., Córdoba, P., Moreno, N., Alastuey, A., Kandler, K., Klose, M., Baldo, C., Clark, R. N., Shi, Z., Querol, X., and Pérez García-Pando, C.: Variability in sediment particle size, mineralogy, and Fe mode of occurrence across dust-source inland drainage basins: the case of the lower Drâa Valley, Morocco, Atmos. Chem. Phys., 23, 15815–15834, https://doi.org/10.5194/acp-23-15815-2023, 2023. a, b, c
González-Romero, A., González-Flórez, C., Panta, A., Yus-Díez, J., Córdoba, P., Alastuey, A., Moreno, N., Hernández-Chiriboga, M., Kandler, K., Klose, M., Clark, R. N., Ehlmann, B. L., Greenberger, R. N., Keebler, A. M., Brodrick, P., Green, R., Ginoux, P., Querol, X., and Pérez García-Pando, C.: Characterization of the particle size distribution, mineralogy, and Fe mode of occurrence of dust-emitting sediments from the Mojave Desert, California, USA, Atmos. Chem. Phys., 24, 9155–9176, https://doi.org/10.5194/acp-24-9155-2024, 2024a. a, b
González-Romero, A., González-Flórez, C., Panta, A., Yus-Díez, J., Córdoba, P., Alastuey, A., Moreno, N., Kandler, K., Klose, M., Clark, R. N., Ehlmann, B. L., Greenberger, R. N., Keebler, A. M., Brodrick, P., Green, R. O., Querol, X., and Pérez García-Pando, C.: Probing Iceland's dust-emitting sediments: particle size distribution, mineralogy, cohesion, Fe mode of occurrence, and reflectance spectra signatures, Atmos. Chem. Phys., 24, 6883–6910, https://doi.org/10.5194/acp-24-6883-2024, 2024b. a, b
Gundel, L., Dod, R., Rosen, H., and Novakov, T.: The relationship between optical attenuation and black carbon concentration for ambient and source particles, Sci. Total Environ., 36, 197–202, 1984. a
Hansen, A., Rosen, H., and Novakov, T.: Real-time measurement of the absorption coefficient of aerosol particles, Appl. Optics, 21, 3060–3062, 1982. a
Hansen, A., Rosen, H., and Novakov, T.: The aethaloemter – An instrument for the real-time measurement of optical absorption by particles, Sci. Total Environ., 36, 191–196, 1984. a, b
Hess, M., Koepke, P., and Schult, I.: Optical properties of aerosols and clouds: The software package OPAC, B. Am. Meteorol. Soc., 79, 831–844, 1998. a
Huang, Y., Kok, J. F., Kandler, K., Lindqvist, H., Nousiainen, T., Sakai, T., Adebiyi, A., and Jokinen, O.: Climate Models and Remote Sensing Retrievals Neglect Substantial Desert Dust Asphericity, Geophys. Res. Lett., 47, e2019GL086592, https://doi.org/10.1029/2019GL086592, 2020. a, b, c
Kalbermatter, D. M., Močnik, G., Drinovec, L., Visser, B., Röhrbein, J., Oscity, M., Weingartner, E., Hyvärinen, A.-P., and Vasilatou, K.: Comparing black-carbon- and aerosol-absorption-measuring instruments – a new system using lab-generated soot coated with controlled amounts of secondary organic matter, Atmos. Meas. Tech., 15, 561–572, https://doi.org/10.5194/amt-15-561-2022, 2022. a
Khlystov, A., S. C. and Pandis, S. N.: An Algorithm for Combining Electrical Mobility and Aerodynamic Size Distributions Data when Measuring Ambient Aerosol Special Issue of Aerosol Science and Technology on Findings from the Fine Particulate Matter Supersites Program, Aerosol Sci. Tech., 38, 229–238, https://doi.org/10.1080/02786820390229543, 2004. a
Kok, J. F., Ridley, D. A., Zhou, Q., Miller, R. L., Zhao, C., Heald, C. L., Ward, D. S., Albani, S., and Haustein, K.: Smaller desert dust cooling effect estimated from analysis of dust size and abundance, Nat. Geosci., 10, 274–278, https://doi.org/10.1038/ngeo2912, 2017. a
Kok, J. F., Adebiyi, A. A., Albani, S., Balkanski, Y., Checa-Garcia, R., Chin, M., Colarco, P. R., Hamilton, D. S., Huang, Y., Ito, A., Klose, M., Leung, D. M., Li, L., Mahowald, N. M., Miller, R. L., Obiso, V., Pérez García-Pando, C., Rocha-Lima, A., Wan, J. S., and Whicker, C. A.: Improved representation of the global dust cycle using observational constraints on dust properties and abundance, Atmos. Chem. Phys., 21, 8127–8167, https://doi.org/10.5194/acp-21-8127-2021, 2021a. a, b
Kok, J. F., Adebiyi, A. A., Albani, S., Balkanski, Y., Checa-Garcia, R., Chin, M., Colarco, P. R., Hamilton, D. S., Huang, Y., Ito, A., Klose, M., Li, L., Mahowald, N. M., Miller, R. L., Obiso, V., Pérez García-Pando, C., Rocha-Lima, A., and Wan, J. S.: Contribution of the world's main dust source regions to the global cycle of desert dust, Atmos. Chem. Phys., 21, 8169–8193, https://doi.org/10.5194/acp-21-8169-2021, 2021b. a
Kok, J. F., Storelvmo, T., Karydis, V. A., Adebiyi, A. A., Mahowald, N. M., Evan, A. T., He, C., and Leung, D. M.: Mineral dust aerosol impacts on global climate and climate change, Nature Reviews Earth & Environment, 4, 71–86, 2023. a
Lack, D. A., Cappa, C. D., Covert, D. S., Baynard, T., Massoli, P., Sierau, B., Bates, T. S., Quinn, P. K., Lovejoy, E. R., and Ravishankara, A. R.: Bias in filter-based aerosol light absorption measurements due to organic aerosol loading: Evidence from ambient measurements, Aerosol Sci. Tech., 42, 1033–1041, https://doi.org/10.1080/02786820802389277, 2008. a
Lafon, S., Sokolik, I. N., Rajot, J. L., Caquincau, S., and Gaudichet, A.: Characterization of iron oxides in mineral dust aerosols: Implications for light absorption, J. Geophys. Res.-Atmos., 111, 1–19, https://doi.org/10.1029/2005JD007016, 2006. a
Laing, J. R., Jaffe, D. A., and Sedlacek, A. J.: Comparison of filter-based absorption measurements of biomass burning aerosol and background aerosol at the mt. Bachelor observatory, Aerosol Air Qual. Res., 20, 663–678, https://doi.org/10.4209/aaqr.2019.06.0298, 2020. a
Laj, P., Bigi, A., Rose, C., Andrews, E., Lund Myhre, C., Collaud Coen, M., Lin, Y., Wiedensohler, A., Schulz, M., Ogren, J. A., Fiebig, M., Gliß, J., Mortier, A., Pandolfi, M., Petäja, T., Kim, S.-W., Aas, W., Putaud, J.-P., Mayol-Bracero, O., Keywood, M., Labrador, L., Aalto, P., Ahlberg, E., Alados Arboledas, L., Alastuey, A., Andrade, M., Artíñano, B., Ausmeel, S., Arsov, T., Asmi, E., Backman, J., Baltensperger, U., Bastian, S., Bath, O., Beukes, J. P., Brem, B. T., Bukowiecki, N., Conil, S., Couret, C., Day, D., Dayantolis, W., Degorska, A., Eleftheriadis, K., Fetfatzis, P., Favez, O., Flentje, H., Gini, M. I., Gregorič, A., Gysel-Beer, M., Hallar, A. G., Hand, J., Hoffer, A., Hueglin, C., Hooda, R. K., Hyvärinen, A., Kalapov, I., Kalivitis, N., Kasper-Giebl, A., Kim, J. E., Kouvarakis, G., Kranjc, I., Krejci, R., Kulmala, M., Labuschagne, C., Lee, H.-J., Lihavainen, H., Lin, N.-H., Löschau, G., Luoma, K., Marinoni, A., Martins Dos Santos, S., Meinhardt, F., Merkel, M., Metzger, J.-M., Mihalopoulos, N., Nguyen, N. A., Ondracek, J., Pérez, N., Perrone, M. R., Petit, J.-E., Picard, D., Pichon, J.-M., Pont, V., Prats, N., Prenni, A., Reisen, F., Romano, S., Sellegri, K., Sharma, S., Schauer, G., Sheridan, P., Sherman, J. P., Schütze, M., Schwerin, A., Sohmer, R., Sorribas, M., Steinbacher, M., Sun, J., Titos, G., Toczko, B., Tuch, T., Tulet, P., Tunved, P., Vakkari, V., Velarde, F., Velasquez, P., Villani, P., Vratolis, S., Wang, S.-H., Weinhold, K., Weller, R., Yela, M., Yus-Diez, J., Zdimal, V., Zieger, P., and Zikova, N.: A global analysis of climate-relevant aerosol properties retrieved from the network of Global Atmosphere Watch (GAW) near-surface observatories, Atmos. Meas. Tech., 13, 4353–4392, https://doi.org/10.5194/amt-13-4353-2020, 2020. a
Laskin, A., Laskin, J., and Nizkorodov, S. A.: Chemistry of Atmospheric Brown Carbon, Chem. Rev., 115, 4335–4382, https://doi.org/10.1021/cr5006167, 2015. a
Li, L., Mahowald, N. M., Miller, R. L., Pérez García-Pando, C., Klose, M., Hamilton, D. S., Gonçalves Ageitos, M., Ginoux, P., Balkanski, Y., Green, R. O., Kalashnikova, O., Kok, J. F., Obiso, V., Paynter, D., and Thompson, D. R.: Quantifying the range of the dust direct radiative effect due to source mineralogy uncertainty, Atmos. Chem. Phys., 21, 3973–4005, https://doi.org/10.5194/acp-21-3973-2021, 2021. a
Lyamani, H., Olmo, F. J., and Alados-Arboledas, L.: Physical and optical properties of aerosols over an urban location in Spain: seasonal and diurnal variability, Atmos. Chem. Phys., 10, 239–254, https://doi.org/10.5194/acp-10-239-2010, 2010. a
Lyamani, H., Fernández-Gálvez, J., Pérez-Ramírez, D., Valenzuela, A., Antón, M., Alados, I., Titos, G., Olmo, F., and Alados-Arboledas, L.: Aerosol properties over two urban sites in South Spain during an extended stagnation episode in winter season, Atmos. Environ., 62, 424–432, https://doi.org/10.1016/j.atmosenv.2012.08.050, 2012. a
Massoli, P., Kebabian, P. L., Onasch, T. B., Hills, F. B., and Freedman, A.: Aerosol light extinction measurements by cavity attenuated phase shift (CAPS) spectroscopy: Laboratory validation and field deployment of a compact aerosol particle extinction monitor, Aerosol Sci. Tech., 44, 428–435, 2010. a
Modini, R. L., Corbin, J. C., Brem, B. T., Irwin, M., Bertò, M., Pileci, R. E., Fetfatzis, P., Eleftheriadis, K., Henzing, B., Moerman, M. M., Liu, F., Müller, T., and Gysel-Beer, M.: Detailed characterization of the CAPS single-scattering albedo monitor (CAPS PMssa) as a field-deployable instrument for measuring aerosol light absorption with the extinction-minus-scattering method, Atmos. Meas. Tech., 14, 819–851, https://doi.org/10.5194/amt-14-819-2021, 2021. a, b, c
Moosmüller, H. and Arnott, W. P.: Folded Jamin interferometer: a stable instrument for refractive-index measurements, Opt. Lett., 21, 438–440, https://doi.org/10.1364/OL.21.000438, 1996. a
Moosmüller, H., Chakrabarty, R. K., and Arnott, W. P.: Aerosol light absorption and its measurement: A review, J. Quant. Spectrosc. Ra., 110, 844–878, https://doi.org/10.1016/j.jqsrt.2009.02.035, 2009. a, b, c
Moosmüller, H., Engelbrecht, J. P., Skiba, M., Frey, G., Chakrabarty, R. K., and Arnott, W. P.: Single scattering albedo of fine mineral dust aerosols controlled by iron concentration, J. Geophys. Res.-Atmos., 117, D11210, https://doi.org/10.1029/2011JD016909, 2012. a
Müller, T., Henzing, J. S., de Leeuw, G., Wiedensohler, A., Alastuey, A., Angelov, H., Bizjak, M., Collaud Coen, M., Engström, J. E., Gruening, C., Hillamo, R., Hoffer, A., Imre, K., Ivanow, P., Jennings, G., Sun, J. Y., Kalivitis, N., Karlsson, H., Komppula, M., Laj, P., Li, S.-M., Lunder, C., Marinoni, A., Martins dos Santos, S., Moerman, M., Nowak, A., Ogren, J. A., Petzold, A., Pichon, J. M., Rodriquez, S., Sharma, S., Sheridan, P. J., Teinilä, K., Tuch, T., Viana, M., Virkkula, A., Weingartner, E., Wilhelm, R., and Wang, Y. Q.: Characterization and intercomparison of aerosol absorption photometers: result of two intercomparison workshops, Atmos. Meas. Tech., 4, 245–268, https://doi.org/10.5194/amt-4-245-2011, 2011a. a
Müller, T., Laborde, M., Kassell, G., and Wiedensohler, A.: Design and performance of a three-wavelength LED-based total scatter and backscatter integrating nephelometer, Atmos. Meas. Tech., 4, 1291–1303, https://doi.org/10.5194/amt-4-1291-2011, 2011b. a
Müller, T., Virkkula, A., and Ogren, J. A.: Constrained two-stream algorithm for calculating aerosol light absorption coefficient from the Particle Soot Absorption Photometer, Atmos. Meas. Tech., 7, 4049–4070, https://doi.org/10.5194/amt-7-4049-2014, 2014. a
Myhre, G., Shindell, D., Breéon, F.-M., Collins, W., Fuglestvedt, J., Huang, J., Koch, D., Lamarque, J.-F., Lee, D., Mendoza, B., Nakajima, T., Robock, A., Stephens, G., Takemura, T., and Zhang, H.: Anthropogenic and Natural Radiative Forcing, Cambridge University Press, Cambridge, United Kingdom and New York, NY, USA, Chap. 8, 659–740, https://doi.org/10.1017/CBO9781107415324.018, ISBN 978-1-107-66182-0, 2013. a
Müller, T. and Fiebig, M.: ACTRIS In Situ Aerosol: Guidelines for Manual QC of AE33 absorption photometer data, ACTRIS Measurement Guidelines, https://www.actris-ecac.eu/particle-light-absorption.html (last access: 9 July 2025), 2021. a
Ogren, J. A., Wendell, J., Andrews, E., and Sheridan, P. J.: Continuous light absorption photometer for long-term studies, Atmos. Meas. Tech., 10, 4805–4818, https://doi.org/10.5194/amt-10-4805-2017, 2017. a, b, c, d, e, f, g, h, i, j, k
Panta, A., Kandler, K., Alastuey, A., González-Flórez, C., González-Romero, A., Klose, M., Querol, X., Reche, C., Yus-Díez, J., and Pérez García-Pando, C.: Insights into the single-particle composition, size, mixing state, and aspect ratio of freshly emitted mineral dust from field measurements in the Moroccan Sahara using electron microscopy, Atmos. Chem. Phys., 23, 3861–3885, https://doi.org/10.5194/acp-23-3861-2023, 2023. a
Patrón, D., Lyamani, H., Titos, G., Casquero-Vera, J., Cardell, C., Močnik, G., Alados-Arboledas, L., and Olmo, F.: Monumental heritage exposure to urban black carbon pollution, Atmos. Environ., 170, 22–32, https://doi.org/10.1016/j.atmosenv.2017.09.030, 2017. a
Petzold, A. and Schönlinner, M.: Multi-angle absorption photometry – a new method for the measurement of aerosol light absorption and atmospheric black carbon, J. Aerosol Sci., 35, 421–441, 2004. a, b, c, d
Petzold, A., Ogren, J. A., Fiebig, M., Laj, P., Li, S.-M., Baltensperger, U., Holzer-Popp, T., Kinne, S., Pappalardo, G., Sugimoto, N., Wehrli, C., Wiedensohler, A., and Zhang, X.-Y.: Recommendations for reporting “black carbon” measurements, Atmos. Chem. Phys., 13, 8365–8379, https://doi.org/10.5194/acp-13-8365-2013, 2013. a
Romshoo, B., Pöhlker, M., Wiedensohler, A., Pfeifer, S., Saturno, J., Nowak, A., Ciupek, K., Quincey, P., Vasilatou, K., Ess, M. N., Gini, M., Eleftheriadis, K., Robins, C., Gaie-Levrel, F., and Müller, T.: Importance of size representation and morphology in modelling optical properties of black carbon: comparison between laboratory measurements and model simulations, Atmos. Meas. Tech., 15, 6965–6989, https://doi.org/10.5194/amt-15-6965-2022, 2022. a, b, c
Rovira, J., Savadkoohi, M., Chen, G. I., Močnik, G., Aas, W., Alados-Arboledas, L., Artiñano, B., Aurela, M., Backman, J., Banerji, S., Beddow, D., Brem, B., Chazeau, B., Coen, M. C., Colombi, C., Conil, S., Costabile, F., Coz, E., de Brito, J. F., Eleftheriadis, K., Favez, O., Flentje, H., Freney, E., Gregorič, A., Gysel-Beer, M., Harrison, R., Hueglin, C., Hyvärinen, A., Ivančič, M., Kalogridis, A.-C., Keernik, H., Konstantinos, G., Laj, P., Liakakou, E., Lin, C., Listrani, S., Luoma, K., Maasikmets, M., Manninen, H. E., Marchand, N., dos Santos, S. M., Mbengue, S., Mihalopoulos, N., Nicolae, D., Niemi, J. V., Norman, M., Ovadnevaite, J., Petit, J.-E., Platt, S., Prévôt, A. S., Pujadas, M., Putaud, J.-P., Riffault, V., Rigler, M., Rinaldi, M., Schwarz, J., Silvergren, S., Teinemaa, E., Teinilä, K., Timonen, H., Titos, G., Tobler, A., Vasilescu, J., Vratolis, S., Yttri, K. E., Yubero, E., Zíková, N., Alastuey, A., Petäjä, T., Querol, X., Yus-Díez, J., and Pandolfi, M.: A European aerosol phenomenology – 9: Light absorption properties of carbonaceous aerosol particles across surface Europe, Environ. Int., 195, 109185, https://doi.org/10.1016/j.envint.2024.109185, 2025. a
Saleh, R., Cheng, Z., and Atwi, K.: The Brown-Black Continuum of Light-Absorbing Combustion Aerosols, Environ. Sci. Tech. Let., 5, 508–513, https://doi.org/10.1021/acs.estlett.8b00305, 2018. a
Samset, B. H., Sand, M., Smith, C. J., Bauer, S. E., Forster, P. M., Fuglestvedt, J. S., Osprey, S., and Schleussner, C. F.: Climate Impacts From a Removal of Anthropogenic Aerosol Emissions, Geophys. Res. Lett., 45, 1020–1029, https://doi.org/10.1002/2017GL076079, 2018. a
Savadkoohi, M., Pandolfi, M., Reche, C., Niemi, J. V., Mooibroek, D., Titos, G., Green, D. C., Tremper, A. H., Hueglin, C., Liakakou, E., Mihalopoulos, N., Stavroulas, I., Artiñano, B., Coz, E., Alados-Arboledas, L., Beddows, D., Riffault, V., De Brito, J. F., Bastian, S., Baudic, A., Colombi, C., Costabile, F., Chazeau, B., Marchand, N., Gómez-Amo, J. L., Estellés, V., Matos, V., van der Gaag, E., Gille, G., Luoma, K., Manninen, H. E., Norman, M., Silvergren, S., Petit, J.-E., Putaud, J.-P., Rattigan, O. V., Timonen, H., Tuch, T., Merkel, M., Weinhold, K., Vratolis, S., Vasilescu, J., Favez, O., Harrison, R. M., Laj, P., Wiedensohler, A., Hopke, P. K., Petäjä, T., Alastuey, A., and Querol, X.: The variability of mass concentrations and source apportionment analysis of equivalent black carbon across urban Europe, Environ. Int., 178, 108081, https://doi.org/10.1016/j.envint.2023.108081, 2023. a, b, c
Singh, S., Fiddler, M. N., Smith, D., and Bililign, S.: Error analysis and uncertainty in the determination of aerosol optical properties using cavity ring-down spectroscopy, integrating nephelometry, and the extinction-minus-scattering method, Aerosol Sci. Tech., 48, 1345–1359, https://doi.org/10.1080/02786826.2014.984062, 2014. a
Sokolik, I. N. and Toon, O. B.: Incorporation of mineralogical composition into models of the radiative properties of mineral aerosol from UV to IR wavelengths, J. Geophys. Res.-Atmos., 104, 9423–9444, https://doi.org/10.1029/1998JD200048, 1999. a
Sorribas, M., Olmo, F. J., Quirantes, A., Lyamani, H., Gil-Ojeda, M., Alados-Arboledas, L., and Horvath, H.: Role of spheroidal particles in closure studies for aerosol microphysical–optical properties, Q. J. Roy. Meteor. Soc., 141, 2700–2707, https://doi.org/10.1002/qj.2557, 2015. a
Szopa, S., Naik, V., Adhikary, B., Artaxoand, P., Berntsen, T., Collins, W., Fuzzi, S., Gallardo, L., Kiendler-Scharr, A., Klimont, Z., Liao, H., Unger, N., and Zanis, P.: Short-Lived Climate Forcers, Cambridge University Press, Cambridge, United Kingdom and New York, NY, USA, Chap. 6, 817–922, https://doi.org/10.1017/9781009157896.008, 2021. a, b, c, d
Teri, M., Müller, T., Gasteiger, J., Valentini, S., Horvath, H., Vecchi, R., Bauer, P., Walser, A., and Weinzierl, B.: Impact of particle size, refractive index, and shape on the determination of the particle scattering coefficient – an optical closure study evaluating different nephelometer angular truncation and illumination corrections, Atmos. Meas. Tech., 15, 3161–3187, https://doi.org/10.5194/amt-15-3161-2022, 2022. a, b
Titos, G., Lyamani, H., Pandolfi, M., Alastuey, A., and Alados-Arboledas, L.: Identification of fine (PM1) and coarse (PM10−1) sources of particulate matter in an urban environment, Atmos. Environ., 89, 593–602, https://doi.org/10.1016/j.atmosenv.2014.03.001, 2014. a
Titos, G., Del Águila, A., Cazorla, A., Lyamani, H., Casquero-Vera, J., Colombi, C., Cuccia, E., Gianelle, V., Močnik, G., Alastuey, A., Olmo, F., and Alados-Arboledas, L.: Spatial and temporal variability of carbonaceous aerosols: assessing the impact of biomass burning in the urban environment, Sci. Total Environ., 578, 613–625, 2017. a, b
Valentini, S., Barnaba, F., Bernardoni, V., Calzolai, G., Costabile, F., Di Liberto, L., Forello, A. C., Gobbi, G. P., Gualtieri, M., Lucarelli, F., Nava, S., Petralia, E., Valli, G., Wiedensohler, A., and Vecchi, R.: Classifying aerosol particles through the combination of optical and physical-chemical properties: Results from a wintertime campaign in Rome (Italy), Atmos. Res., 235, 104799, https://doi.org/10.1016/j.atmosres.2019.104799, 2020. a, b
Valenzuela, A., Olmo, F. J., Lyamani, H., Antón, M., Quirantes, A., and Alados-Arboledas, L.: Aerosol radiative forcing during African desert dust events (2005–2010) over Southeastern Spain, Atmos. Chem. Phys., 12, 10331–10351, https://doi.org/10.5194/acp-12-10331-2012, 2012a. a
Valenzuela, A., Olmo, F. J., Lyamani, H., Antón, M., Quirantes, A., and Alados-Arboledas, L.: Classification of aerosol radiative properties during African desert dust intrusions over southeastern Spain by sector origins and cluster analysis, J. Geophys. Res.-Atmos., 117, D06214, https://doi.org/10.1029/2011JD016885, 2012b. a
Vecchi, R., Bernardoni, V., Paganelli, C., and Valli, G.: A filter-based light-absorption measurement with polar photometer: Effects of sampling artefacts from organic carbon, J. Aerosol Sci., 70, 15–25, 2014. a
Virkkula, A., Mäkelä, T., Hillamo, R., Yli-Tuomi, T., Hirsikko, A., Hämeri, K., and Koponen, I. K.: A simple procedure for correcting loading effects of aethalometer data, J. Air Waste Manage., 57, 1214–1222, https://doi.org/10.3155/1047-3289.57.10.1214, 2007. a
Virkkula, A., Chi, X., Ding, A., Shen, Y., Nie, W., Qi, X., Zheng, L., Huang, X., Xie, Y., Wang, J., Petäjä, T., and Kulmala, M.: On the interpretation of the loading correction of the aethalometer, Atmos. Meas. Tech., 8, 4415–4427, https://doi.org/10.5194/amt-8-4415-2015, 2015. a
Visser, B., Röhrbein, J., Steigmeier, P., Drinovec, L., Močnik, G., and Weingartner, E.: A single-beam photothermal interferometer for in situ measurements of aerosol light absorption, Atmos. Meas. Tech., 13, 7097–7111, https://doi.org/10.5194/amt-13-7097-2020, 2020. a
Wagner, F., Bortoli, D., Pereira, S., Costa, M.J., Silva, A.M., Weinzierl, B., Esselborn, M., Petzold, A., Rasp, K., Heinold, B., and Tegen, I.: Properties of dust aerosol particles transported to Portugal from the Sahara desert, Tellus B, 61, 297–306, https://doi.org/10.1111/j.1600-0889.2008.00393.x, 2009. a
Weingartner, E., Saathoff, H., Schnaiter, M., Streit, N., Bitnar, B., and Baltensperger, U.: Absorption of light by soot particles: Determination of the absorption coefficient by means of aethalometers, J. Aerosol Sci., 34, 1445–1463, https://doi.org/10.1016/S0021-8502(03)00359-8, 2003. a, b, c, d, e, f, g
Yus-Díez, J., Bernardoni, V., Močnik, G., Alastuey, A., Ciniglia, D., Ivančič, M., Querol, X., Perez, N., Reche, C., Rigler, M., Vecchi, R., Valentini, S., and Pandolfi, M.: Determination of the multiple-scattering correction factor and its cross-sensitivity to scattering and wavelength dependence for different AE33 Aethalometer filter tapes: a multi-instrumental approach, Atmos. Meas. Tech., 14, 6335–6355, https://doi.org/10.5194/amt-14-6335-2021, 2021. a, b, c, d, e, f, g, h, i, j, k, l, m, n, o, p, q, r, s, t, u, v, w, x, y
Yus-Díez, J., Via, M., Alastuey, A., Karanasiou, A., Minguillón, M. C., Perez, N., Querol, X., Reche, C., Ivančič, M., Rigler, M., and Pandolfi, M.: Absorption enhancement of black carbon particles in a Mediterranean city and countryside: effect of particulate matter chemistry, ageing and trend analysis, Atmos. Chem. Phys., 22, 8439–8456, https://doi.org/10.5194/acp-22-8439-2022, 2022. a
Zanatta, M., Gysel, M., Bukowiecki, N., Müller, T., Weingartner, E., Areskoug, H., Fiebig, M., Yttri, K. E., Mihalopoulos, N., Kouvarakis, G., Beddows, D., Harrison, R., Cavalli, F., Putaud, J., Spindler, G., Widensohler, A., Alastuey, A., Pandolfi, M., Sellegri, K., Swietlicki, E., Jaffrezo, J., Baltensperger, U., and Laj, P.: A European aerosol phenomenology-5: Climatology of black carbon optical properties at 9 regional background sites across Europe, Atmos. Environ., 145, 346–364, 2016. a, b, c
- Abstract
- Introduction
- Methodology
- Results
- Comparison of multiple-scattering parameter values and harmonization using reference absorption measurement
- Conclusions
- Appendix A: Summary of the different abbreviations used throughout the paper
- Code and data availability
- Author contributions
- Competing interests
- Disclaimer
- Acknowledgements
- Financial support
- Review statement
- References
- Supplement