the Creative Commons Attribution 4.0 License.
the Creative Commons Attribution 4.0 License.
 | 21 Jul 2025
Riming-dependent snowfall rate and ice water content retrievals for W-band cloud radar
Alessandro Battaglia
Anton Kötsche
Maximilian Maahn
Accurate measurements of snowfall in mid-latitudes and high latitudes are particularly important because snow provides a vital freshwater source and impacts glacier mass balances as well as surface albedo. However, ice water content (IWC) and snowfall rates (SRs) are hard to measure due to their high spatial variability and the remoteness of polar regions. In this study, we present novel ice water content–equivalent radar reflectivity (IWC–Ze) and snowfall rate–equivalent radar reflectivity (SR–Ze) relations for 40° slanted and vertically pointing W-band radar. The relations are derived from joint in situ snowfall and remote sensing (W-band radar and radiometer) data from the SAIL site (Colorado, USA) and validated for sites in Hyytiälä (Finland), Ny-Ålesund (Svalbard), and Eriswil (Switzerland). In addition, gauge measurements from SAIL and Hyytiälä are used as an independent reference for validation. We show the dependence of IWC–Ze and SR–Ze on riming, which we utilize to reduce the spread in the IWC–Ze and SR–Ze spaces. Normalized root mean square errors (NRMSEs) are below 25 % for IWC>0.1 g m−3. For SR, the NRMSE is below 70 % over the whole SR range. We also present relations using liquid water path as a proxy for the occurrence of riming, which can be applied to both ground-based and space-borne radar–radiometer instruments. The latter is demonstrated using the example of the proposed ESA Earth Explorer 11 candidate mission WIVERN. With this approach, NRMSEs are below 75 % for IWC>0.1 g m−3 and below 80 % for SR>0.2 mm h−1.
- Article
(7996 KB) - Full-text XML
- BibTeX
- EndNote


At mid-latitudes and high latitudes, most precipitation stems from ice clouds (Mülmenstädt et al., 2015). Solid precipitation in the form of snow plays an important role in the Earth's hydrological cycle and energy budget, affecting surface albedo, glacier mass balance, freshwater storage, and cloud lifetime. However, ice water content (IWC) and snowfall rates (SRs) are difficult to measure in part due to their high spatial variability. At high latitudes, ground-based precipitation observations are sparse and complicated by harsh environmental conditions (e.g. Førland et al., 2011).
Precipitation gauges are commonly used to measure liquid-equivalent SR amounts. While gauges provide direct measurements of snowfall accumulation, which is used to compute SR, they are prone to large uncertainties (e.g. Saltikoff et al., 2015). Particle size and velocity size distribution data from snowfall cameras can also be used to estimate SR, given the observational volume is large enough. The advantage of this approach over gauge measurements is that IWC and SR can jointly be derived with a high temporal resolution. However, the particle mass distribution cannot be measured directly with optical instruments; thus mass–size relations need to be assumed from the literature (e.g. Heymsfield et al., 2016) or retrieved (e.g. von Lerber et al., 2017). SR derived from radar can provide more information on the spatial distribution as compared to the point-measurement of a gauge or snowfall camera. In addition, radar observations are vertically resolved and can be used to derive vertical profiles of IWC. W-band radars, which operate at about 94 GHz, are commonly used due to their high sensitivity to cloud particles. Space-borne W-band radar can provide global observations of IWC and SR as demonstrated by the CloudSat Cloud Profiling Radar (Tanelli et al., 2008), that has provided the first global climatology of SR (Hiley et al., 2011; Milani et al., 2018) and, combined with the CALIPSO lidar, of IWC (e.g. Delanoë and Hogan, 2010). However, current satellite-derived snowfall products suffer from poor sampling (Scarsi et al., 2024a) and a “blind zone” close to ground, thus missing shallow precipitation (Maahn et al., 2014; Schirmacher et al., 2023). Further, the information content of satellite observations is typically not sufficient to constrain the highly variable microphysical properties of snow and ice particles unambiguously (Wood and L'Ecuyer, 2021).
SR and IWC cannot be measured directly by radar but have to be inferred from radar reflectivity. Power law relations between ze in linear units, defined as , and IWC or ze and SR in the form of and are commonly used for IWC and SR estimation (e.g. Fuller et al., 2023, provide and overview of SR–Ze relations for W-band radar). These relations show differences of about 1 order of magnitude in estimates of IWC and SR. The large spread stems from the large variability among ice and snow particle size distributions (PSDs), density, shape, orientation, crystal habit, etc. Relations can have significant uncertainties for individual cases but are successfully applied to space-borne radar datasets because the random errors cancel out partly in seasonal timescales, assuming they are trained on a large enough dataset to capture the full snowfall climatology (Kulie and Bennartz, 2009).
To reduce the variability in Ze–IWC and Ze–SR space, additional variables are commonly included in retrievals like air temperature T for both ground-based and space-borne radar (e.g., Wood and L'Ecuyer, 2021) or polarimetric variables such as KDP or ZDR for ground-based radar (Bukovčić et al., 2020, for S-band radar). Recent studies have demonstrated the potential of including brightness temperature TB and/or nadir Doppler observations (like available for the EarthCARE radar, Illingworth et al., 2015; Kollias et al., 2023) to constrain SR estimates from space (Battaglia and Panegrossi, 2020; Mroz et al., 2023). TB and/or Doppler can give insight into the location and amount of supercooled liquid water layers, which can lead to higher ice particle densities due to supercooled droplets freezing onto ice particles upon contact, which is commonly referred to as riming. Riming drives Ze variability (Maherndl et al., 2024b), and Fuller et al. (2023) show that most SR–Ze values from the literature lead to strong biases when applied to rimed snow particles. Fuller et al. (2023) argue new research is needed to refine the SR–Ze relationship for rimed snow particles.
WIVERN (WInd VElocity Radar Nephoscope, Illingworth et al., 2018; Battaglia et al., 2022), one of the two remaining ESA Earth Explorer 11 candidate missions, is planned to be equipped with a conical scanning 94 GHz radar and a passive 94 GHz radiometer. While the main objective of the mission is to measure global in-cloud winds (e.g., inside tropical cyclones, Tridon et al., 2023), WIVERN reflectivity data can also be used to derive IWC and SR. Compared to CloudSat (Tanelli et al., 2008) and EarthCARE (Illingworth et al., 2015), WIVERN's 800 km swath provides better coverage (70 times better than CloudSat), significantly reducing the uncertainty of polar snowfall estimates (Scarsi et al., 2024b). In addition, WIVERN's 42° angle of incidence results in a smaller radar blind zone near the surface (especially over the ocean) (Coppola et al., 2025).
In this study, we present Ze–IWC and Ze–SR relations for both 40° slanted and vertically pointing W-band radar. The relations were derived from joint radar and in situ snowfall observations during winter 2022/23 in Gothic (Colorado, USA) and validated for additional mid- and high-latitude sites in Hyytiälä (Finland), Ny-Ålesund (Svalbard Norway), and Eriswil (Switzerland). We investigate the dependence of Ze–IWC and Ze–SR on snow particle riming based on joint in situ and radar data. Further, we include liquid water path (LWP) as an additional parameter in the relations as a proxy for the occurrence of riming (Moisseev et al., 2017). This approach allows us to reduce uncertainty in the Ze–IWC and Ze–SR spaces when in situ data are not available. The novel relations can therefore be applied to both ground-based and space-borne radar (and radiometer). The latter is demonstrated with synthetic WIVERN observations accounting for the space-borne geometry and estimated uncertainties.
The paper is structured as follows. We first give an overview of all ground-based measurement sites and instruments we use to derive our reference data in Sect. 2. In Sect. 3, we (1) explain the riming retrieval we use, (2) demonstrate a novel approach allowing us to correct Ze for the 40° viewing angle, (3) describe the reference IWC and SR data, and (4) show our methods to fit Ze–IWC and Ze–SR relations. Results of the fits are presented in Sect. 4.1, and their performance is evaluated in Sect. 4.2. Section 5 draws a conclusion.
We use data from the U.S. Department of Energy Atmospheric Radiation Measurement (ARM) user facility's Surface Atmosphere Integrated Field Laboratory (SAIL, Feldman et al., 2023; Kötsche et al., 2025) site in Gothic, Colorado (USA), to develop Ze–SR and Ze–IWC relations for (slanted) W-band radar. The performance of the new relations is tested using data from three additional mid- and high-latitude sites at Hyytiälä (Finland), Ny-Ålesund (Svalbard Norway), and Eriswil (Switzerland). In the following, we describe the measurement sites and the main instrumentation used in this study.
2.1 Field experiment at the SAIL site
In winter 2022/23, the Leipzig University 94 GHz radar (LIMRAD94) and a Video In Situ Snowfall Sensor (VISSS, Maahn et al., 2024) were deployed at the SAIL site in Gothic, Colorado, USA (38.95621° N, 106.98796° W; 2885 m above mean sea level (a.m.s.l.), Feldman et al., 2023). LIMRAD94 is a polarimetric simultaneous transmission simultaneous reception (STSR) Doppler cloud radar manufactured by Radiometer Physics GmbH (RPG, instrument type RPG-FMCW-94-DP, Küchler et al., 2017). The radar scanning strategy included slanted observations at a constant angle of 40° during December 2022 and January 2023 and range height indicator (RHI) scans in February 2023 (Kalesse-Los et al., 2023). LIMRAD94 (at 2905 ) was operated at a range resolution of about 12 m for ranges below 2000 m, which corresponds to a vertical resolution of 7.7 m below 1288 m at the 40° observation angle. The VISSS (at 2885 ) was deployed below the line of sight of the radar, at a horizontal distance of about 500 m. The VISSS consists of two cameras with telecentric lenses, mounted perpendicular to each other. The setup allows for accurate characterization of snow particle shape and size. At the SAIL site, the first-generation VISSS, here denoted VISSS1, was deployed. VISSS1 has a pixel resolution of 58.832 µm px−1, a frame rate of 140 Hz, and an observation volume of . VISSS data products relevant to this study include time-averaged particle size distributions (PSDs) and sedimentation velocity distributions.
We use additional data acquired by ARM of near-surface air temperature T, SR from a Pluvio weighing precipitation gauge, and liquid water path (LWP). For the latter, we use the ARM 3-channel microwave radiometer LWP, which is derived from a site-specific statistical retrieval from microwave radiometer brightness temperature measurements. LWP, T, and Pluvio SR data are obtained from the ARM data portal (https://adc.arm.gov/discovery/, last access: 18 November 2024).
2.2 Additional mid- and high-latitude sites for validation
For validation and evaluation we use joint vertically pointing 94 GHz radar and VISSS observations obtained at the Hyytiälä Forestry Field Station of the University of Helsinki, Finland (HYY), in 2021/21 and 2023/24, at Eriswil, Switzerland, during the PolarCAP (Polarimetric Radar Signatures of Ice Formation Pathways from Controlled Aerosol Perturbations) campaign 2023/24, and at the French German atmospheric observatory AWIPEV (named after the Alfred Wegener Institute for Polar and Marine Research and the French Polar Institute Paul Emile Victor, Ebell et al., 2020) in Ny-Ålesund (NYA), Svalbard, from 2021 onward (Fig. 1). The selected time periods used in this study are the result of several criteria: availability of joint in situ and radar data, snowfall at the ground, and temperatures below −1 °C to remove melting snowflakes, which are not represented in our scattering simulations.
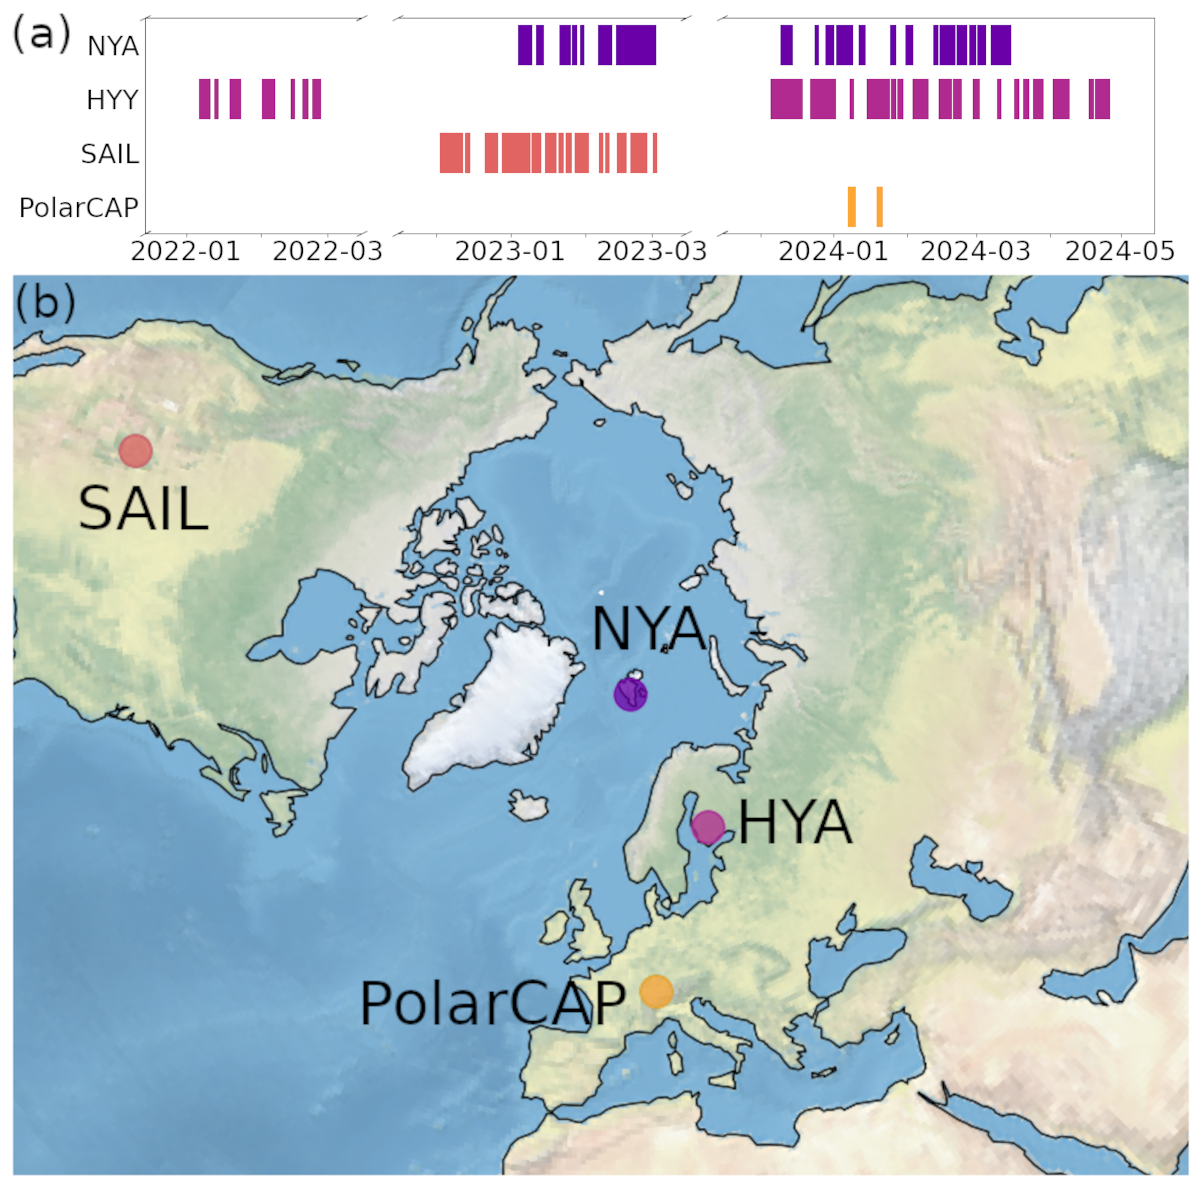
Figure 1(a) Temporal coverage and (b) locations of evaluation datasets: Ny-Ålesund site (NYA) in Svalbard; Hyytiälä site (HYY) in Finland; SAIL site in Crested Butte, Colorado, USA; PolarCAP campaign in Eriswil, Switzerland. For SAIL, polarimetric W-band measurements at 40° elevation were obtained.
2.2.1 Measurement site Hyytiälä
In Hyytiälä, Finland, the University of Helsinki operates a Forestry Field Station (61.84398° N, 24.28758° E; 150 ). The station is equipped with a vertically pointing, 94 GHz cloud radar by RPG (instrument type RPG-FMCW-94-DP). The radar has a range resolution of about 25.5 m in the height range near ground that we use. VISSS1 was deployed in the field close to the radar during winter 2021/22. Since November 2023, the third-generation VISSS (VISSS3) is set up there, which has a pixel resolution of 46.0 µm px−1, a frame rate of 220 Hz, and an observation volume of . Near-surface air temperature T from the site's weather station and the LWP product from a HATPRO microwave radiometer (Rose et al., 2005) are used as auxiliary data. Equivalent liquid SR data from a Pluvio gauge are used for validation. Radar, LWP, Pluvio SR, and T data are accessed via the Cloudnet data portal (Moisseev and Petäjä, 2024).
2.2.2 Measurement site Ny-Ålesund
The joint French–German Arctic research station AWIPEV is located in Ny-Ålesund, Svalbard (78.92308° N, 11.92108° E; 11 ). On the roof of the AWIPEV observatory a 94 GHz radar is operated by the University of Cologne (JOYRAD-94). JOYRAD-94 is a non-scanning, Doppler cloud radar manufactured by RPG (instrument type RPG-FMCW-94-SP). JOYRAD-94 has a range resolution of about 3.2 m in the height range we are interested in. Since December 2021, the second-generation VISSS (VISSS2) has been located on the measurement field close to the observatory. VISSS2 has a pixel resolution of 43.266 µm px−1, a frame rate of 250 Hz, and an observation volume of . Additionally, we use near-surface air temperature T from the site and the LWP product from a HATPRO. JOYRAD-94, LWP, and T data are accessed via Cloudnet (Ebell and Ritter, 2024).
2.2.3 Field experiment at Eriswil, Switzerland
Similar to SAIL, LIMARD94 and VISSS1 were deployed jointly in Eriswil, Switzerland (47.07056° N, 7.87278° E; 921 ) during the PolarCAP (Polarimetric Radar Signatures of Ice Formation Pathways from Controlled Aerosol Perturbations) field experiment in winter 2023/24. The field experiment was conducted under the umbrella of the ERC research project CLOUDLAB (Henneberger et al., 2023) by ETH Zurich. LIMRAD94 was operated with a range resolution of about 12 m below 2000 m. Auxiliary T and LWP data (derived from a HATRPO) are available from the mobile exploratory platform LACROS of the Leibniz Institute for Tropospheric Research (TROPOS) and accessed via Cloudnet (Seifert, 2024). Only a small subset of the campaign data can be used for this study due to warm near-surface temperatures at Eriswil during PolarCAP.
Figure 2 summarizes the overall logic of the paper and gives an overview of the methods described in the following sections. We use ground-based in situ and radar data to derive reference IWC and SR (Sect. 3.2). A riming retrieval is used to get more accurate estimations of snow particle masses (Sect. 3.1). In addition, auxiliary data are used for the retrieval development and validation. Two variants of IWC and SR relations (Sect. 3.4) are derived based on SAIL data and validated with HYY, NYA, and PolarCAP data: (1) depending on radar reflectivity Ze, air temperature T, and normalized rime mass M and (2) depending on radar reflectivity Ze, air temperature T, and LWP. We show the applicability of (1) to ground-based data and of (2) to both ground-based and space-borne data.
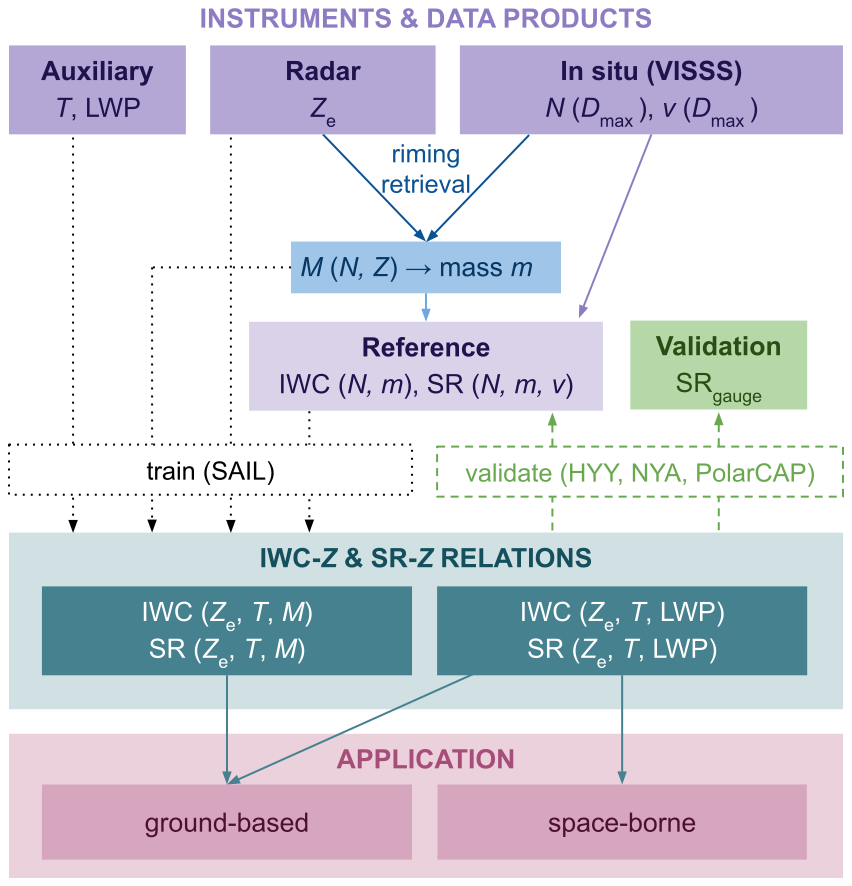
Figure 2Overall logic of the paper. The purple section gives an overview of the used instruments and data products, where Ze is the W-band radar reflectivity, Dmax the maximum dimension of snow and ice particles, N the number concentration, v the fall velocity, M the normalized rime mass, m the particle mass, T the air temperature, LWP the liquid water path, SR the snowfall rate, and IWC the ice water content. The data products from the SAIL site are used to train the IWC and SR relations shown in the mint section. Data from the HYY, NYA, and PolarCAP sites are used for validation (green). The relations depending on M can be applied to ground-based data; the relations depending on LWP can be applied to both ground-based and space-borne data (pink section).
3.1 Normalized rime mass retrieval
We take advantage of the joint radar and in situ observations to quantify ice and snow particle riming. To describe riming, we use the normalized rime mass M introduced by Seifert et al. (2019). M is defined as the particle's rime mass mrime divided by the mass of a size-equivalent spherical graupel particle mg, where we assume a rime density of :
where
Dmax is the maximum dimension defined as the diameter of the smallest circle encompassing the ice particle (in m).
M is a quantitative measure of how heavily rimed an ice particle is with M=0 meaning completely unrimed and M→1 meaning spherical graupel. M is not necessarily dependent on particle size. However, assuming a fixed amount of liquid water available for riming, larger particles will have lower M than smaller particles after riming (Maherndl et al., 2023).
We use the combined method from Maherndl et al. (2024a) to retrieve M, which was originally developed for airborne data. Here, we adopted the method for application to ground-based data. In the following, we give a brief description of the retrieval and our adaptions for ground-based data. For more details, we refer the reader to Maherndl et al. (2024a).
The combined method derives a time series of M from collocated PSD and radar reflectivity Ze measurements. Here, we assume PSDs derived from VISSS observations at the ground are representative of particles in the minimum radar measurement volume above ground. For SAIL, we use the radar range gate in an altitude of about 355 m, which is located closest to VISSS due to the radar elevation angle. We derive the standard deviation of Ze between 410 and 355 m (corresponding to five range gates) and remove all time stamps with standard deviation larger than 2 dB. This is done to remove times with strong vertical gradients of Ze close to ground, where the assumption that the PSD does not change from the radar range gate to the ground does not hold. Further, we filter for 5 dBZ to remove very light snowfall cases. For HYY, NYA, and PolarCAP, we select the closest range gate to the ground, i.e., the range gate above the minimum measurement range (corresponding to altitudes of about 100–150 m), and derive standard deviations of Ze over all range gates below 200 m. We also filter for standard deviations smaller than 2 dB and . PSDs and Ze are averaged for 100 s to account for the different observational volume (at least to a certain extent). We tested different time offsets of up to 5 min between radar and VISSS to account for the typical sedimentation time of snow particles to the ground. However, we found that the M results did not change within the retrieval uncertainties and therefore chose to use no time offset. 100 s averaging windows correspond to a spatial distance of about 1 km assuming a horizontal wind speed of 10 ms−1.
The retrieval uses optimal estimation (Rodgers, 2000) with the pyOptimalEstimation Python library (Maahn et al., 2020) to derive M by forward-simulating Ze based on the observed in situ PSD and comparing to the matched, observed Ze. As forward operator, the Passive and Active Microwave radiative TRAnsfer tool (PAMTRA; Mech et al., 2020) is used, which includes empirical relationships from Maherndl et al. (2023) for estimating particle scattering properties based on the Self-Similar Rayleigh–Gans Approximation (SSRGA; Hogan and Westbrook, 2014; Hogan et al., 2017) as a function of M. Maherndl et al. (2023) assumed horizontally aligned ice particles viewed by vertically pointing radar. We therefore recalculated the SSRGA coefficients for a viewing angle of 40° to be applicable for the slanted SAIL data and present the results in Appendix A. Particle mass m(Dmax) is approximated by a power law relation with prefactor am and exponent bm:
We use the riming-dependent mass–size parameters am and bm (i.e., the “mean” parameters from Maherndl et al., 2023) that were estimated for different degrees of riming, i.e., M values. In Maherndl et al. (2023), discrete mass–size parameters are given, which we interpolate for continuous M. Because currently no particle classification product is available for all sites and mass–size parameter variability is rather dominated by riming than by particle shape (Maherndl et al., 2023; Mason et al., 2018b), we assume a mixture of particle shapes (columns, dendrites, needles, plates, rosettes) and use the “mean” mass–size parameters, which are closest to the parameters for aggregates of plates. Maherndl et al. (2024a) investigated the dependence of the retrieved M on the particle shape assumption and showed that assuming plates or dendrites result in the same M within the retrieval uncertainty estimates. M results assuming columns are slightly lower than assuming dendrites. Our results could therefore have a slight positive bias during snowfall events with column-like shapes.
The M retrieval results are used for multiple purposes in this study. First, we use M to estimate particle masses by choosing the appropriate parameters from Maherndl et al. (2023) for each time step (Sect. 3.2). Second, we use M to select time periods with predominately unrimed particles to derive a relation between Ze(IWC) for vertically pointing radar and Ze(IWC) for a viewing angle of 40° (Sect. 3.3). Third, we investigate the dependence of Ze–IWC and Ze–SR relation on M (Sect. 4.1.1).
3.2 Reference IWC and SR data
To derive IWC from in situ PSD observations, size-resolved ice particle mass must be assumed. For our IWC reference dataset, IWC is calculated by summing the product of ice particle mass m(Dmax) and VISSS-observed N(Dmax) for the lower to upper size ranges of the VISSS, Dlower to Dupper:
where ΔDmax is the size bin width. N(Dmax) is taken from the “level2match” VISSS data, where particles observed with both VISSS cameras are matched and binned particle properties are available as a function of time either from one of the cameras or using the minimum, average, or maximum from both cameras. We use the maximum Dmax observed from both cameras for each matched particle to approximate the true Dmax. m(Dmax) is approximated by a power law relation with M-dependent mass–size parameters as described in Sect. 3.1.
SR is calculated by summing the product of ice particle mass m(Dmax), VISSS-observed N(Dmax), and VISSS-observed particle sedimentation speed v(Dmax) for the lower to upper size ranges of the VISSS, Dlower to Dupper:
Because sedimentation velocity can only be determined for a subset of observed particles, which are detected multiple times (see Maahn et al., 2024), NaN values must be interpolated. To avoid unrealistic behavior at the edges of the size spectrum, NaN values of v are filled with v from the closest available size bin. Removing cases with NaN values would greatly reduce the number of data points.
It must be noted that our reference IWC and SR data are not fully independent of Ze because we derive the particle mass from the retrieved normalized rime mass M. This is a necessary limitation because IWC and SR cannot be inferred from the available in situ measurements alone. For SR, we evaluate our approach with completely independent SR gauge measurements.
3.3 Viewing angle correction
Falling ice and snow particles typically orient themselves horizontally in the atmosphere (List and Schemenauer, 1971; Zikmunda and Vali, 1972; Wang, 2021; Stout et al., 2024); thus their radar reflectivity depends on the viewing angle. Because only vertically pointing radar observations are available for the validation sites, a Ze correction must be applied to compare to the 40° observation angle at SAIL. To derive the correction term, HYY, NYA, PolarCAP, and SAIL data are filtered for M<0.01 to get all time intervals with (predominately) unrimed particles. Because for PolarCAP only 155 data points remain, PolarCAP data are excluded in the further steps. Then, median Ze for IWC in 30 logarithmic bins between 10−5 and 10−2 kg m−3 is derived for HYY, NYA, and SAIL. Logarithmic bins were chosen because the reference IWC data follow approximately a normal distribution in logarithmic space; the number of bins was selected such that there is a sufficient amount of data points per bin.
The results show (Fig. 3) that medians for HYY and NYA are nearly identical, and therefore a joint median is derived. The reduction of median Ze using slanted observations at SAIL instead of vertically pointing observations at HYY and NYA is nearly constant with IWC and results in 2.29±0.39 dB (mean ± standard deviation). Thus, the offset can be subtracted from the vertically pointing Ze data to correct for the 40° observation angle. To test whether radar calibration or climatological differences causes the derived offset instead of the viewing angle, we performed a similar analysis comparing 90° SAIL observations for the time when they where available together with the 40° data in February 2023. The threshold for unrimed particles had to be increased to M<0.02, to have a sufficient number of data per IWC bin for the analysis (M<0.02: on average over 30 per bin and 700 data points in total; M<0.01: only 200 data points in total). We found a similar offset of 2.25±0.80 dB, albeit with a higher standard deviation, likely due to the smaller number of observations. This indicates the offset is indeed caused by viewing angle. Distributions of 40° and (corrected) 90° Ze during scans in February 2023 are shown in Appendix B. The offset likely depends on properties such as the PSD in addition to particle orientation. We tested the dependence on particle riming by performing a similar analysis for specific M ranges. We found the same offset within the respective standard deviation ranges, albeit with larger standard deviations for larger M values, likely due to the smaller number of data. We hypothesize that for single events the offset might differ but averages to the derived value over longer time spans for the analyzed sites.
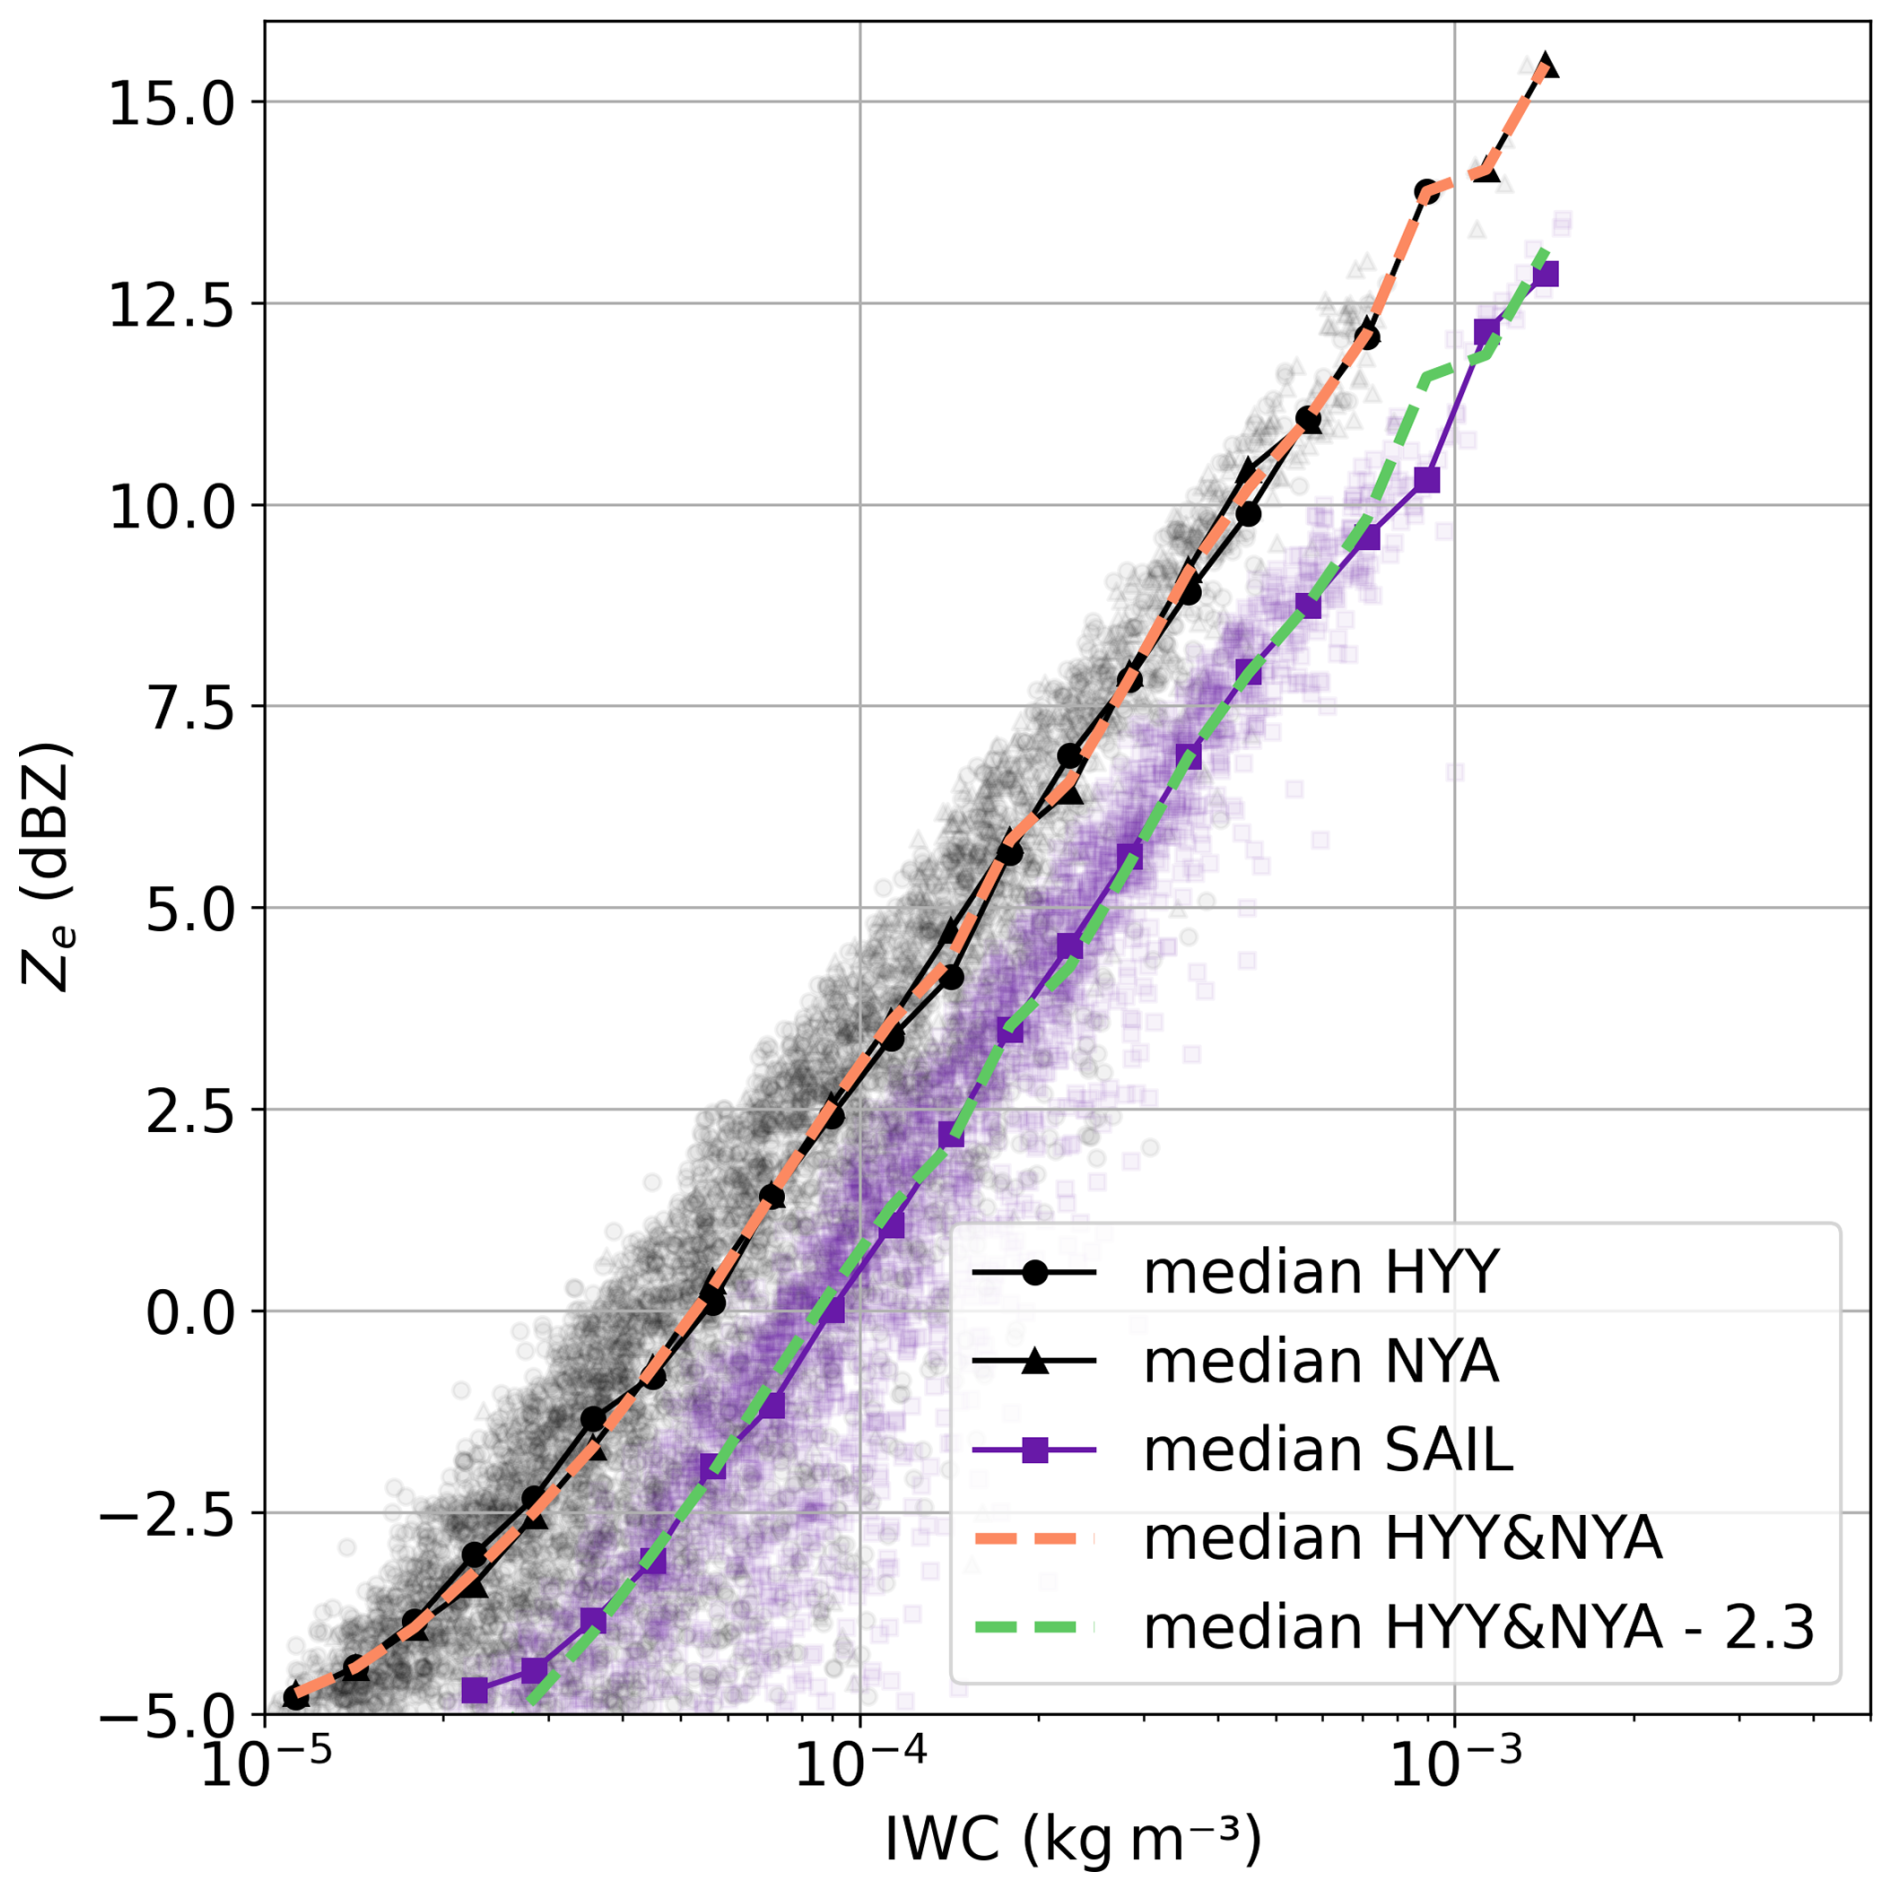
Figure 3W-band Ze as a function of IWC derived for unrimed particles for vertically pointing radar at Hyytiälä (HYY), Finland, and Ny-Ålesund (NYA), Svalbard (grey points), and for 40° observations from the SAIL site in Gothic, Colorado, USA (violet points). Data suggest an offset correction of 2.29±0.39 dB. See text for further explanations.
3.4 Deriving IWC–Ze and SR–Ze relations
The reference IWC in kg m−3 and SR in liquid water equivalent mm h−1 (Sect. 3.2) are related to the (40° slanted) radar reflectivity factor close to ground ze in linear units mm6 m−3, near-surface air temperature T in °C, and normalized rime mass M for M>0:
and
where pi denotes the respective fit coefficients. ze in linear units is converted to Ze in logarithmic units with . A multi-linear regression is performed to derive the coefficients pi, which are presented in Sect. 4.1.1.
However, M is typically not available for sites without in situ PSD data. Therefore, we also relate the reference IWC in kg m−3 and SR in liquid water equivalent mm h−1 to ze in mm6 m−3, T in °C, and the vertical LWP in kg m−2, which should indicate periods where riming is likely (Moisseev et al., 2017):
and
where qi denotes the respective fit coefficients. Again, a multi-linear regression is performed to derive the coefficients pi, which are presented in Sect. 4.1.2.
We chose the functional forms of Eqs. (6)–(9) because power law relations are commonly used for IWC–Ze and SR–Ze (Fuller et al., 2023). T in degree Celsius must be input linearly due to negative values. The logarithms of M and LWP are used because the logarithm of both variables often follows a Gaussian shape.
In this section, we first present our novel IWC–Ze and SR–Ze relations (Sect. 4.1). We show results for the respective fit coefficients using Ze, T, and M (Sect. 4.1.1), and Ze, T, and LWP (Sect. 4.1.2). The latter can be applied when there is no in situ snowfall data but a radiometer LWP product available, as is common for Cloudnet sites or certain space-borne instruments such as WIVERN. All relations are then evaluated against the reference IWC and SR dataset (described in Sect. 3.2), and their application to space-borne radar is tested using WIVERN as an example in Sect. 4.2. In addition, we compare the performance of the IWC–Ze relations to literature relations and evaluate results for the SR–Ze relations with gauge data.
4.1 Empirical relations to derive IWC and SR
In general, the fit functions presented in the following should be applied to attenuation-corrected 40° slanted Ze. By applying the correction term from Sect. 3.3, vertically pointing Ze can also be used. Here, we only use Ze data from ground-based radar close to ground (to be able to compare to in situ snowfall observations at ground). Attenuation due to atmospheric gases and hydrometers from the ground to the near-surface radar volume can be neglected; thus we did not perform attenuation corrections of Ze.
4.1.1 Dependence on Ze, T, and M
Table 1 presents the fit coefficient results for Eqs. (6) and (7). The resulting IWC–Ze and SR–Ze relations are shown together with the reference IWC and SR data in Fig. 4 for varying M from unrimed (M<0.01) to spherical graupel (M=1.0). The reference dataset contains only few data points with M close to 1.0, due to the rare occurrence of particle populations consisting only of dense, spherical graupel. IWC and SR for unrimed particles are generally higher at constant W-band Ze than for rimed particles and decrease with increasing amounts of riming. The spread in IWC–Ze or SR–Ze space due to riming is stronger for IWC than SR. This is likely due to increased fall velocities of rimed particles, which result in higher SR, counteracting the IWC–Ze spread.
Table 1IWC in kg m−3 and SR in mm h−1 fit coefficients using ze in mm6 m−3, T in °C, and M.
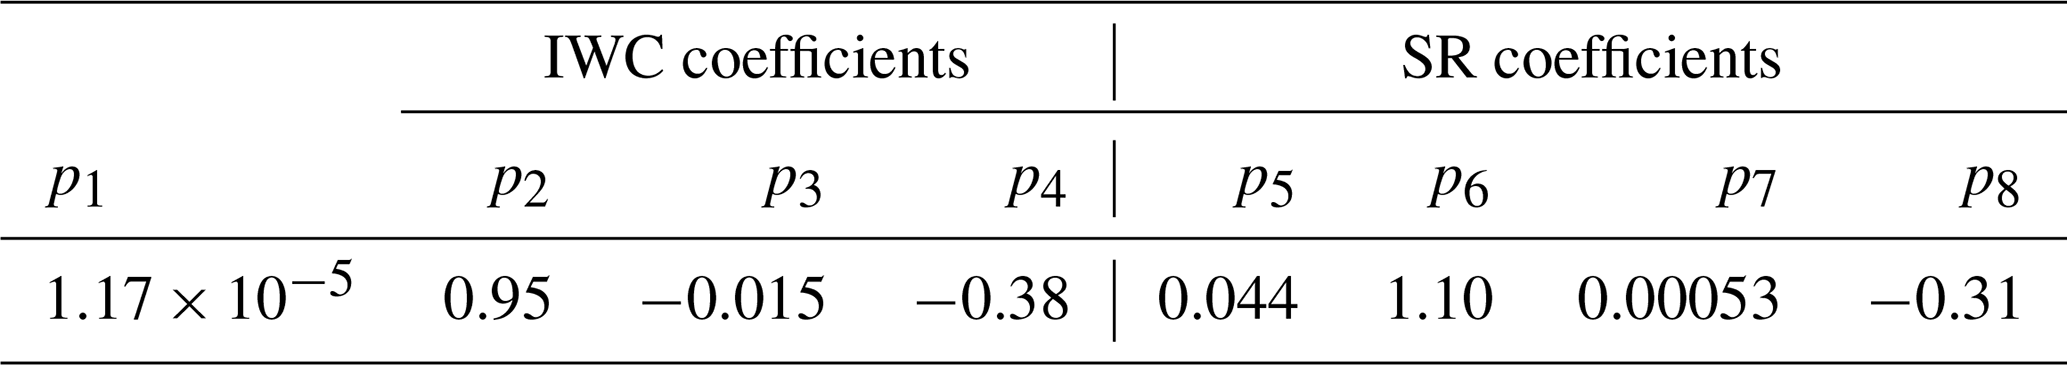
p1 is given in kg m−3 and p5 in mm h−1.
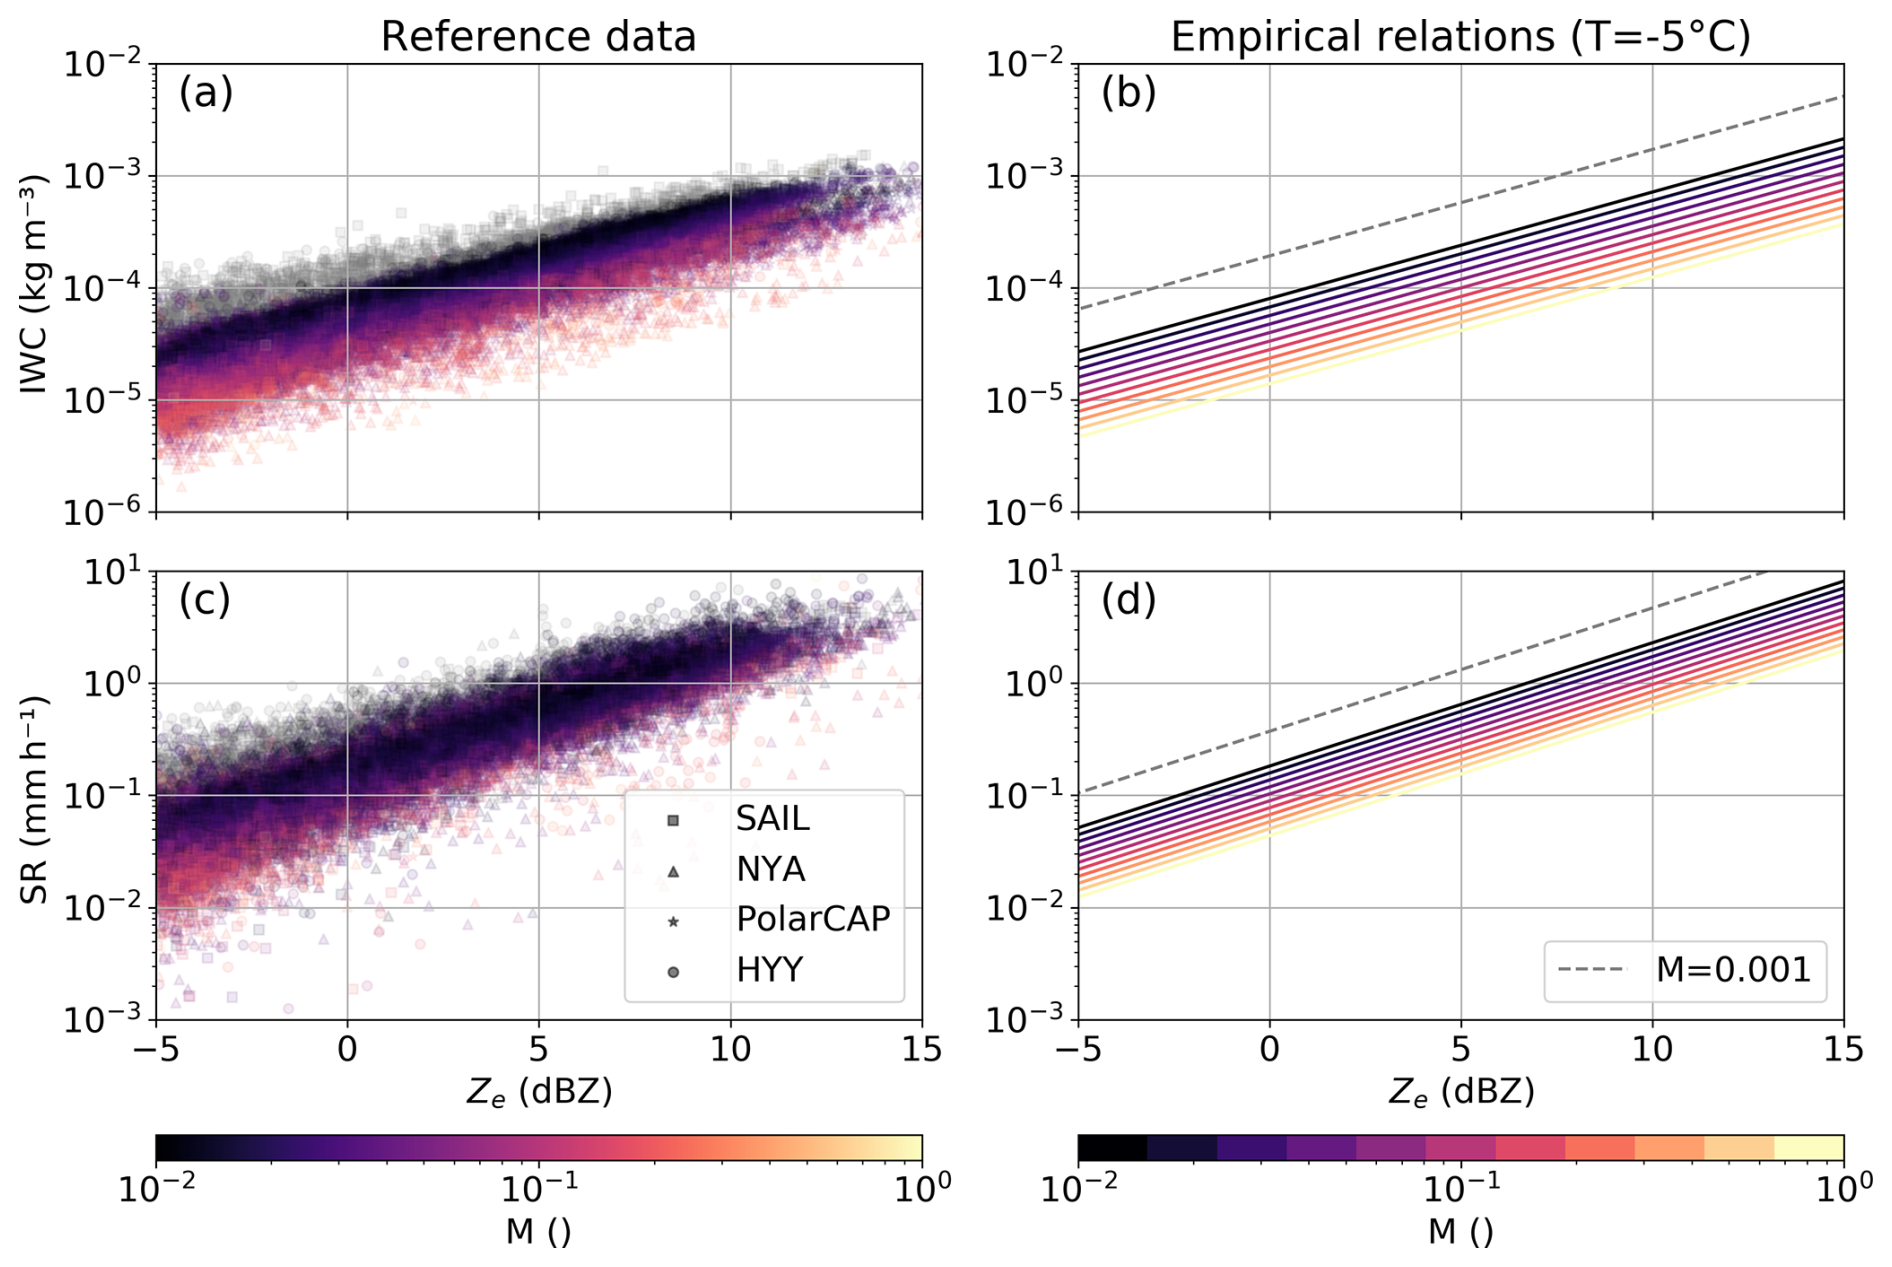
Figure 4Reference data for (a) IWC–Ze and (b) SR–Ze for the different sites denoted with different symbols. M is color-coded. Data points with M<0.01 are considered (predominately) unrimed and shown in gray. (c) IWC–Ze and (d) SR–Ze empirical functions for and M ranging from 0.01 (nearly unrimed) to 1.0 (spherical graupel). The respective function for M=0.001, which corresponds to the lowest 1 % of M retrieval results, is shown as a gray dashed line in (c) and (d).
As discussed in Sect. 3.2, our reference IWC and SR are not fully independent of Ze due to the dependence on M. If Ze would have a positive bias, then M would have a positive bias as well, resulting in a positive bias of IWC or SR. The slope of the fits in Fig. 4b and d would therefore likely not be affected by a bias in Ze. PSD shape also affects the pattern in Fig. 4a and c. Assuming a fixed PSD, the spread in IWC–Ze space due to riming is a direct result of the underlying riming-dependent parameterization (Maherndl et al., 2023). However, variability in (observed) PSDs results in variability in the pattern.
4.1.2 As functions of Ze, T, and LWP
Table 2 presents the fit coefficient results for Eqs. (8) and (9). Figure 5 shows the resulting IWC–Ze and SR–Ze relations for varying LWP and T conditions. Literature IWC–Ze and SR–Ze relations for W-band from Hogan et al. (2006), Protat et al. (2016), Matrosov (2007), Liu (2008), and Kulie and Bennartz (2009) are included for comparison. Here, we applied our viewing angle correction to compute Ze for 40° observations. At constant (W-band) Ze, IWC and SR increase with decreasing temperature. This is similar to Hogan et al. (2006) and Protat et al. (2016) for Z<20 dBZ. Because we lack data points with Z>20 dBZ, we cannot confirm the inverse temperature behavior for such large Ze values. Our SR–Ze relations follow Matrosov (2007) more closely than the others shown here.
Table 2IWC in kg m−3 and SR in mm h−1 fit coefficients using ze in mm6 m−3, T in °C, and LWP in kg m−2.
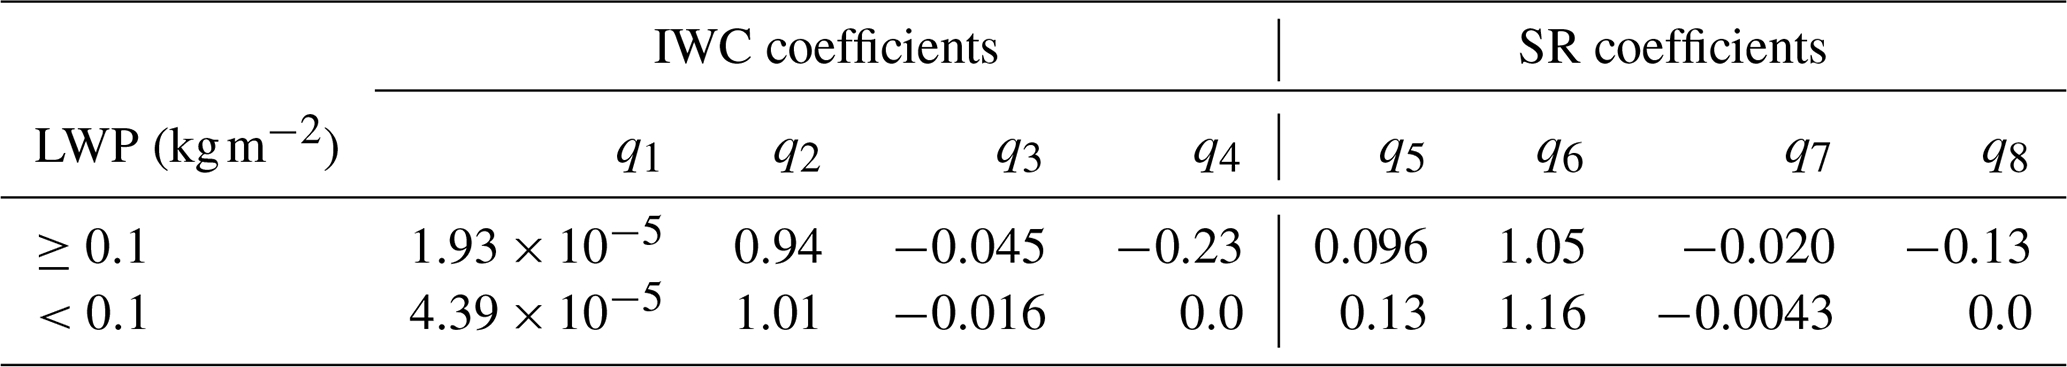
q1 is given in kg m−3 and q5 in mm h−1.
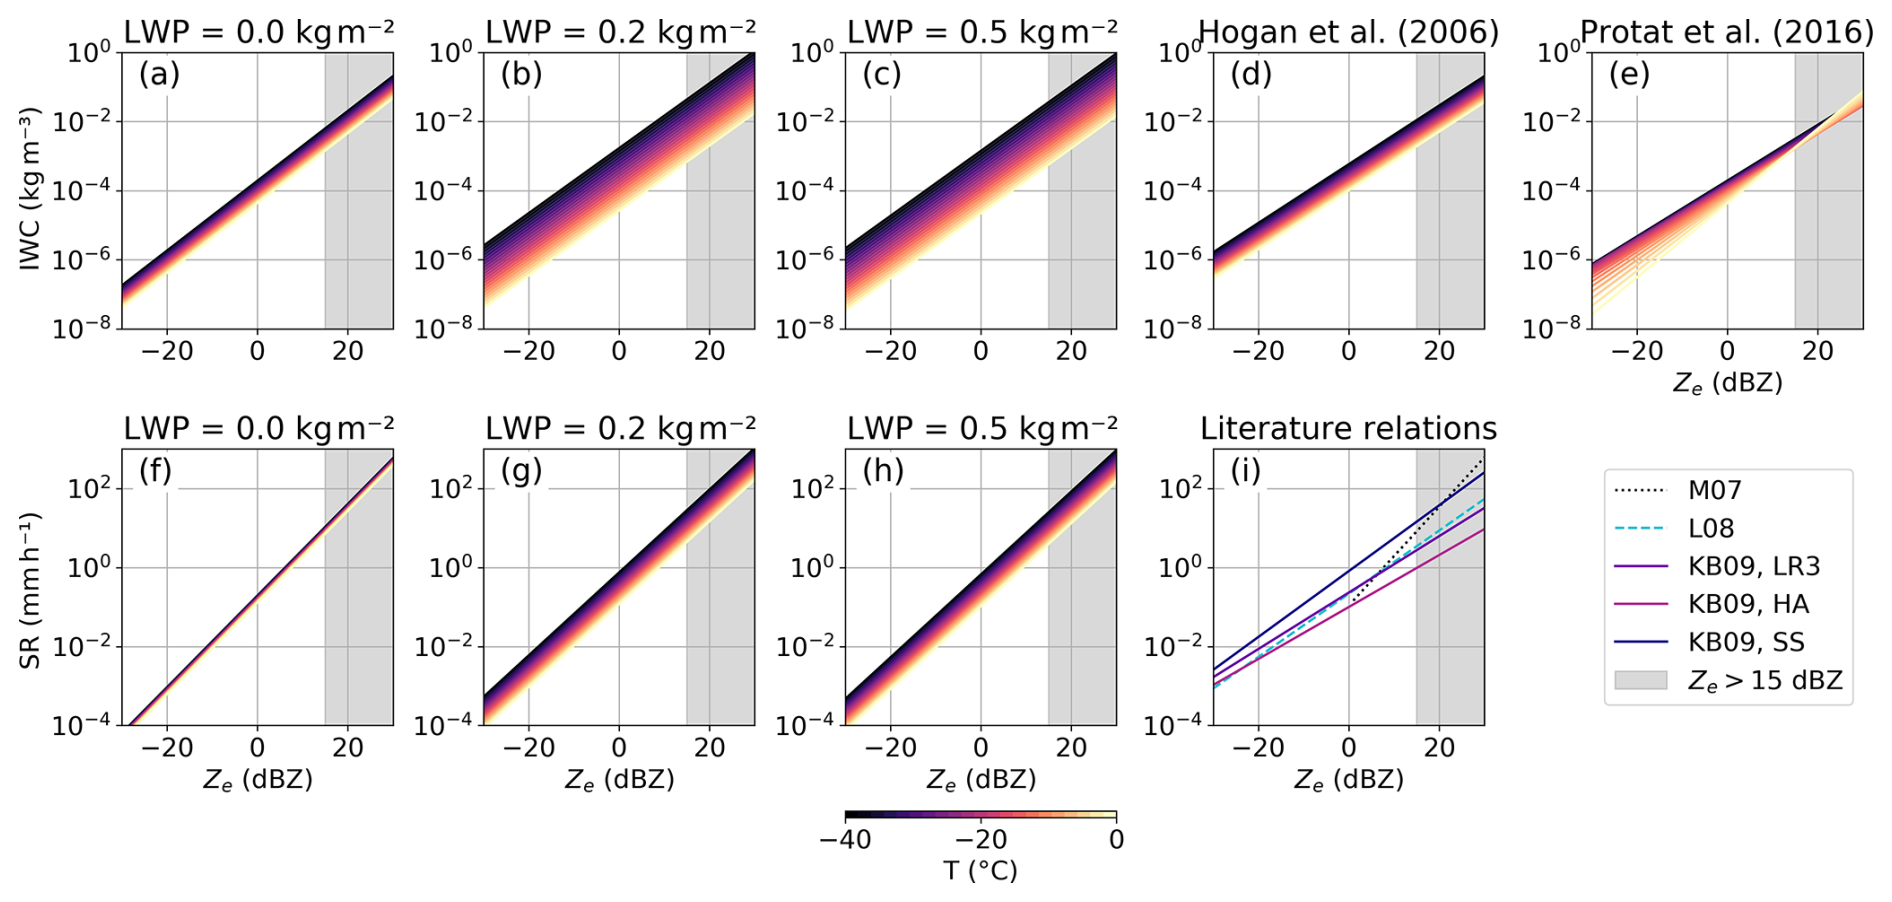
Figure 5IWC–Ze (a–e) and SR–Ze (f–i) empirical functions for (a, f) LWP , (b, g) 0.2 kg m−2, and (c, h) 0.5 kg m−2 and T ranging from −40 °C to 0 °C. Empirical IWC–Ze functions from Hogan et al. (2006) and Protat et al. (2016) are shown in (d) and (e), respectively. SR–Ze values from Matrosov (2007) (M07), Liu (2008) (L08), and Kulie and Bennartz (2009) (KB09, LR3; KB09, HA; KB09, SS) are shown in (i). Due to data availability, Ze>15 dBZ is shaded in black.
Different threshold values for LWP to set q4 and q8 to zero – thereby excluding LWP from the IWC and SR relations – were tested, and 0.1 kg m−2 offered the best trade-off between improvement in Pearson correlation (R2) and RMSE, while assuring a sufficient number of data with LWP above the threshold (about 26 % of SAIL data).
4.2 Validation and uncertainty estimates
The empirical relations presented in Sect. 3.4 are validated based on data from SAIL data and additional mid- and high-latitude ground-based sites in Hyytiälä, Ny-Ålesund, and Eriswil (Sect. 2) and compared to literature IWC–Ze relations from Hogan et al. (2006) and Protat et al. (2016). We first demonstrate the application to ground-based radar using the original vertical resolution of the respective instrument (Sect. 4.2.1). Second, we investigate the application to space-borne radar using the example of the planned WIVERN mission (Sect. 4.2.2). We compare IWC and SR derived with our empirical relations using reflectivity Ze from the lowest range bin to the reference IWC and SR derived from in situ data (Sect. 3.2). IWC and SR derived with Eqs. (6)–(9) relations are denoted IWCregression and SRregression, respectively. Reference IWC and SR based on in situ data and retrieved normalized rime mass M (Eqs. 4 and 5) are denoted IWCreference and SRreference, respectively. We further derive the normalized root mean square error (NRMSE) as a function of IWC and SR, respectively, and compare SR results to gauge measurements at SAIL and Hyytiälä (Sect. 4.2.3).
4.2.1 Application to ground-based radar
Figure 6 shows a 2D density plot of IWCregression vs. IWCreference for SAIL data and all additional sites for the empirical functions using M as well as using LWP. Including M gives a high Pearson correlation coefficient for SAIL data and all other sites of about R2=0.96. Without knowledge of M – i.e., when there are no in situ measurements at a given site – LWP can act as a proxy of riming, reducing uncertainties compared to using only Ze and T. Figure 6c shows that the relation from Hogan et al. (2006) overestimates IWC for our data. This is likely in part due to Hogan et al. (2006) using mass–size parameters for unrimed particles in their calculations of reference IWC. Differences in particle habit assumptions and PSD observations might also play a role. As shown in Fig. 4, unrimed particles have higher IWC at the same Ze as rimed particles. Therefore, applying an IWC relation derived for unrimed particles to data including riming leads to an overestimation of IWC. Protat et al. (2016) perform better (Fig. 6d) but also show a slight overestimation compared to our relations, especially for small IWC. Our relations have higher R2, lower RMSE, and ME closer to zero than the literature relations. R2, RMSE, and ME were derived over the whole IWC range to compare the different relations rather than give uncertainty estimates of IWC, as discussed later in Sect. 4.2.3.
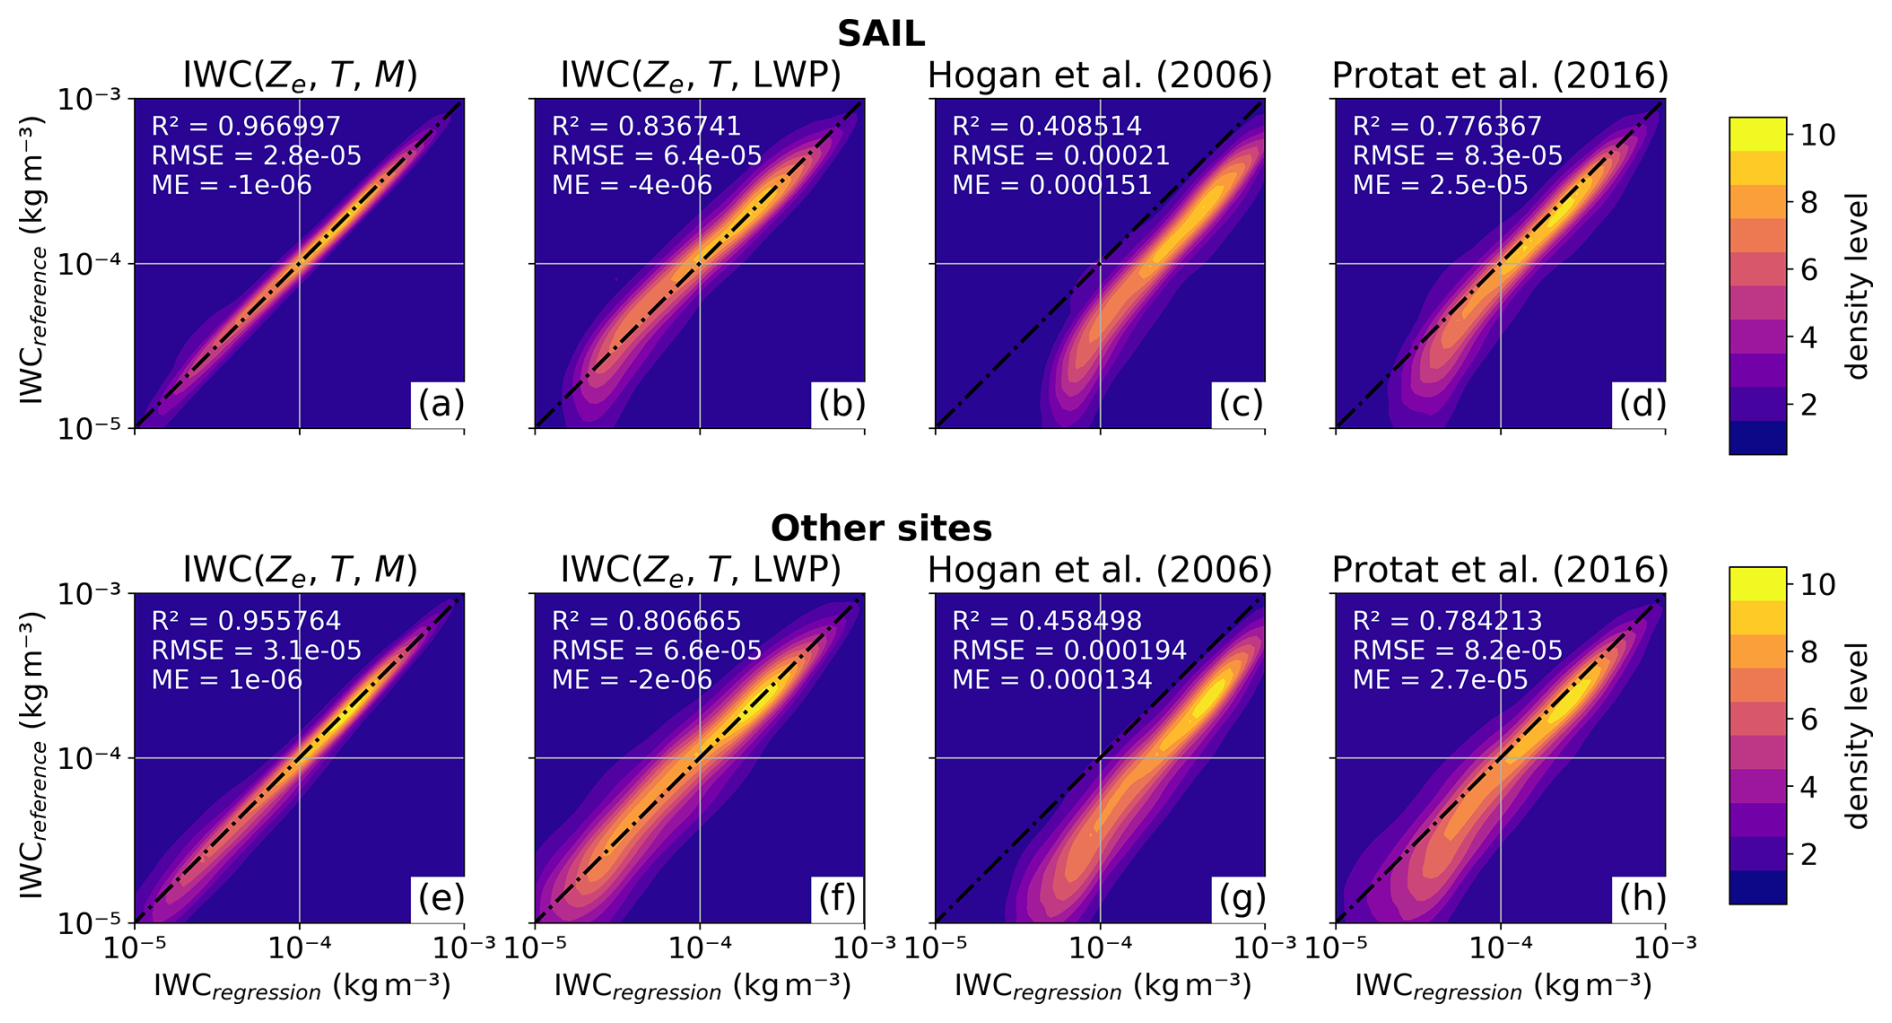
Figure 62D density plot of IWC in kg m−3 derived with empirical functions from (a, e) equivalent radar reflectivity Ze, air temperature T, and normalized rime mass M, and (b, f) from Ze, T, and liquid water path LWP (IWCregression) vs. in situ measurements (IWCreference), which have been used to derive the empirical functions for the SAIL site (a–d) and all other sites (e–h). Panels (c) and (g) and panels (d) and (h) show the performance of literature relations from Hogan et al. (2006) and Protat et al. (2016), respectively, where the Ze was corrected for the viewing angle. Pearson correlation coefficient R2, root mean square error (RMSE), and mean error (ME) derived for the linear IWC data are displayed in the left corner of each subpanel. The 1:1 line is shown as a black, dot-dash line. Data point density is plotted in 10 levels from lowest (blue) to highest (yellow).
Similarly, Fig. 7 shows the performance of our SR–Ze relations compared to the reference SR. Again, the relation including M outperforms the one with LWP, but the difference is less drastic. This is likely due to high fall velocities at large M counteracting the effect of riming on IWC at constant Ze. While the IWC relations developed for SAIL perform similarly well for the other sites, the SR relations performs noticeable worse indicating site-specific effects (e.g., orographically induced turbulence might affect snowfall at the SAIL site). However, the largest density of data falls along the 1:1 line and slightly negative ME close to 0 indicate only a small negative bias.
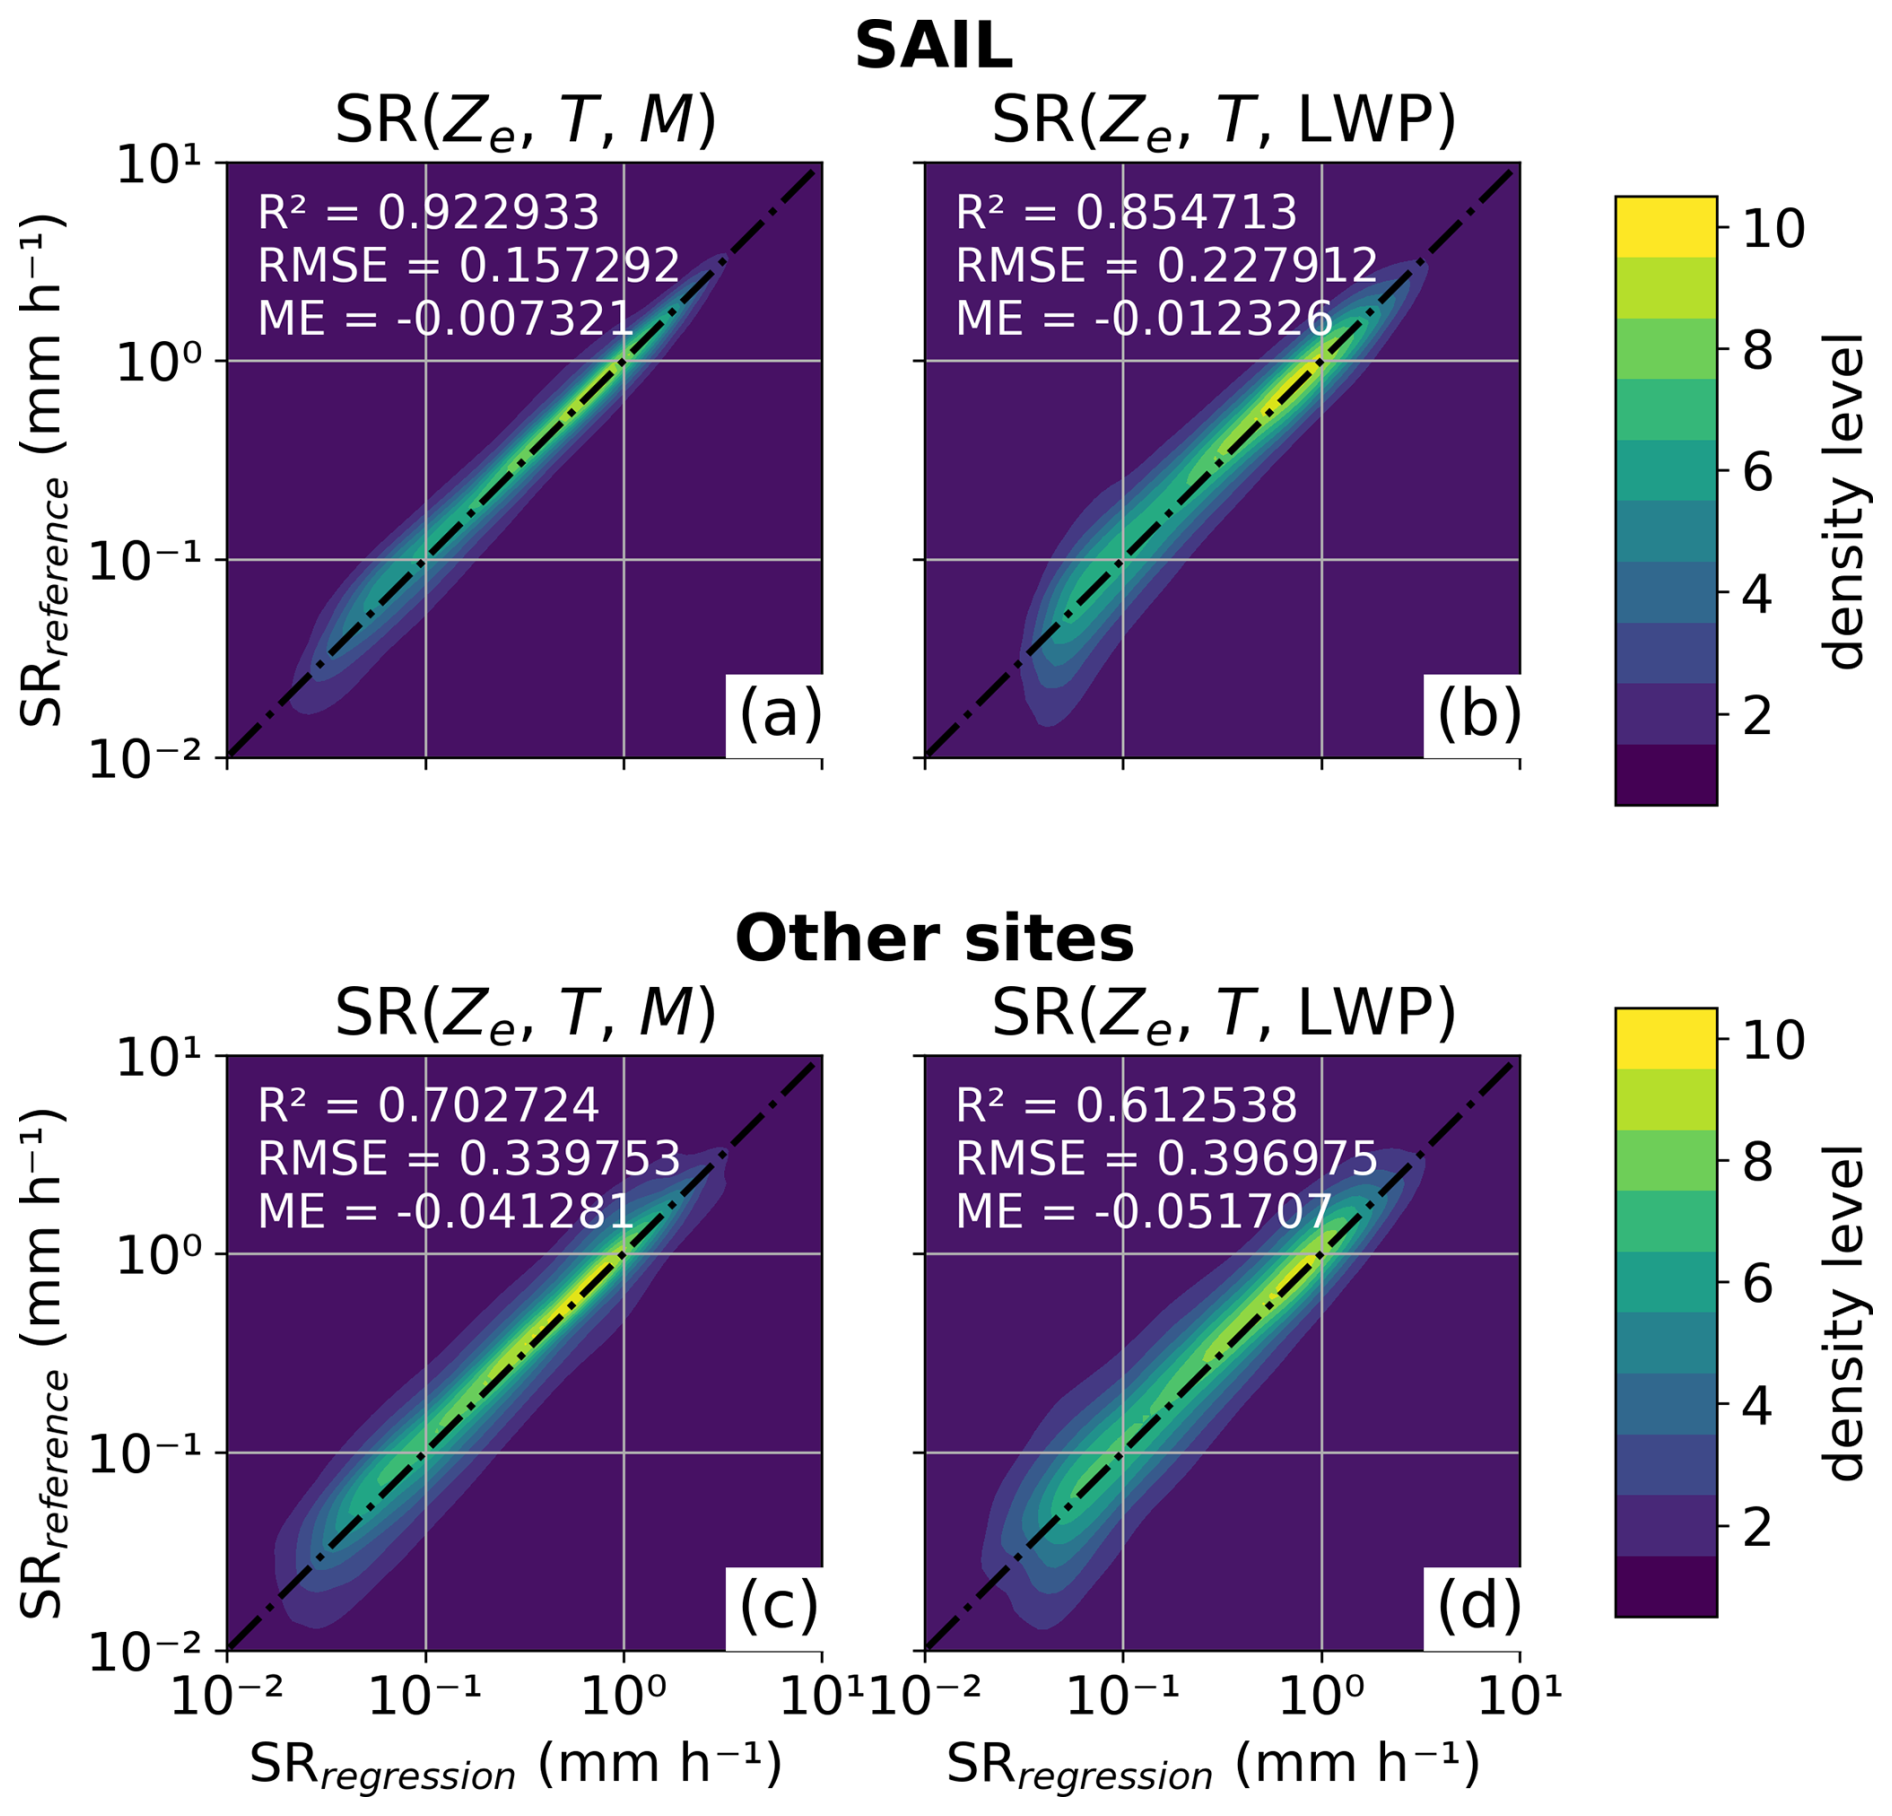
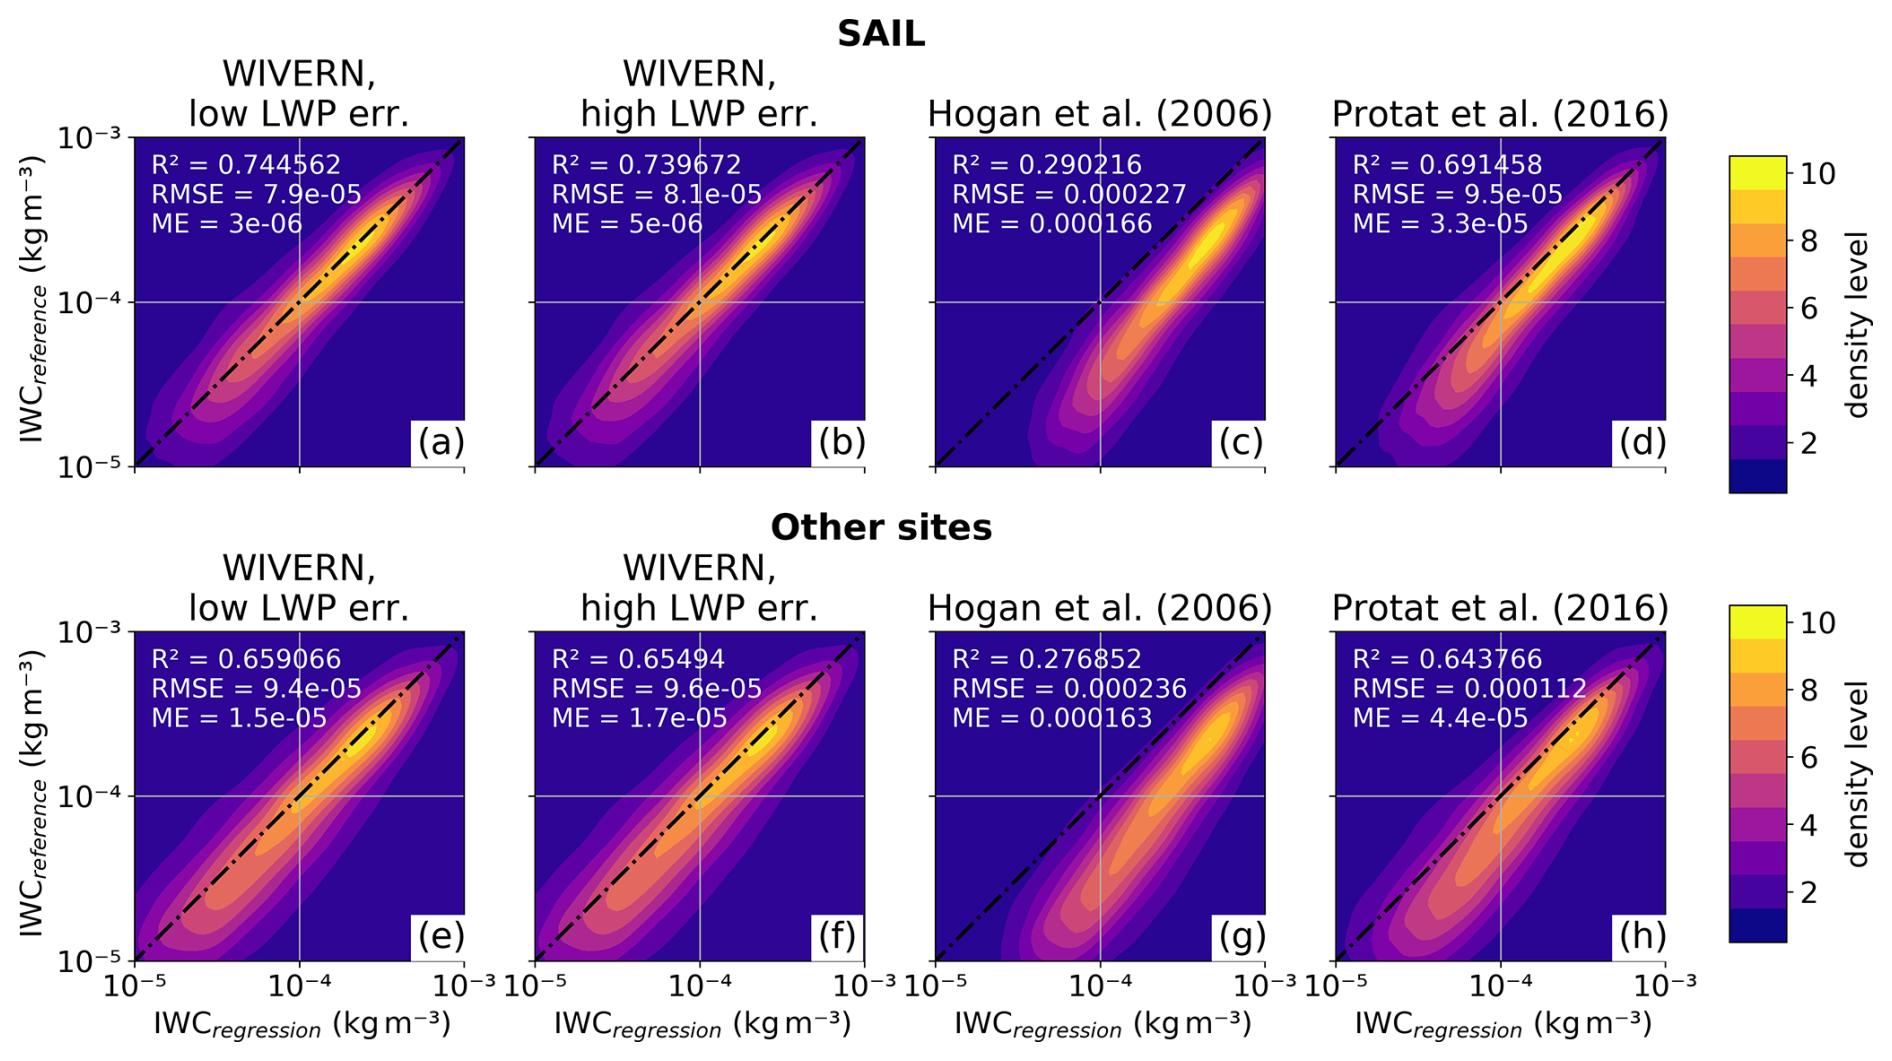
Figure 8As in Fig. 6 but for approximated WIVERN observations (i.e., WIVERN geometry and uncertainty estimations). Panels (a) and (e) and panels (b) and (f) show results for assuming a LWP uncertainty of 30 g m−2 (low) and 60 g m−2 (high), respectively.
4.2.2 Application to space-borne radar
We use the measurement geometry of the planned WIVERN (Illingworth et al., 2018; Battaglia et al., 2022) instrument as an example to demonstrate the application of our empirical relations to space-borne radar. WIVERN will be equipped with 94 GHz radar and a passive 94 GHz radiometer observing profiles of Ze and brightness temperature TB at an incidence angle of close to 40°. A LWP retrieval using the TB data in a similar approach to Ruiz-Donoso et al. (2020) and Billault-Roux and Berne (2021) is planned. To approximate (attenuation-corrected) WIVERN Ze observations, the high-resolution, ground-based data from SAIL and the additional sites are down-sampled to WIVERN geometry, i.e., a vertical resolution of about 580 m and a horizontal resolution of 1 km. We consider only the lowest grid point of the regridded Ze (meaning the lowest about 580 m), which we use to compare to our reference IWC and SR. In addition, uncertainty estimates are applied to the regridded data to approximate WIVERN measurements. Uncertainties are applied in form of Gaussian noise, and afterwards our relations are applied to the regridded and noisy data. Ze uncertainties are derived based on simulations (Battaglia et al., 2024); for T an uncertainty of 2 K and for LWP an uncertainty of 30 g m−2 are assumed. 30 g m−2 was chosen based on the maximum uncertainty of the retrievals from Ruiz-Donoso et al. (2020) and Billault-Roux and Berne (2021) (in mid-latitudes and high latitudes). We also test assuming a higher LWP uncertainty of 60 g m−2. We do not show the performance of Eqs. (6) and (7) because, currently, methods to derive M without in situ data do not exist. Methods based on Doppler velocity (Mosimann, 1995; Kneifel and Moisseev, 2020; Mason et al., 2018a) are not applicable in complex terrain due to orography-induced vertical air motions. The method by Vogl et al. (2022) would need to be calibrated for M first.
For space-borne application, the spread in IWC–Ze space is larger than for ground-based data as is expected. However, the Pearson correlation coefficient is still reasonably high with R2=0.66, even when we apply our empirical relations to all other sites. Doubling the LWP error from 30 to 60 g m−2 has barely any impact because other error sources (e.g., from averaging to the WIVERN resolution) dominate the resulting variability. The relations from Hogan et al. (2006) and Protat et al. (2016) again result in an overestimation of IWC, with the latter performing better applied to our data.
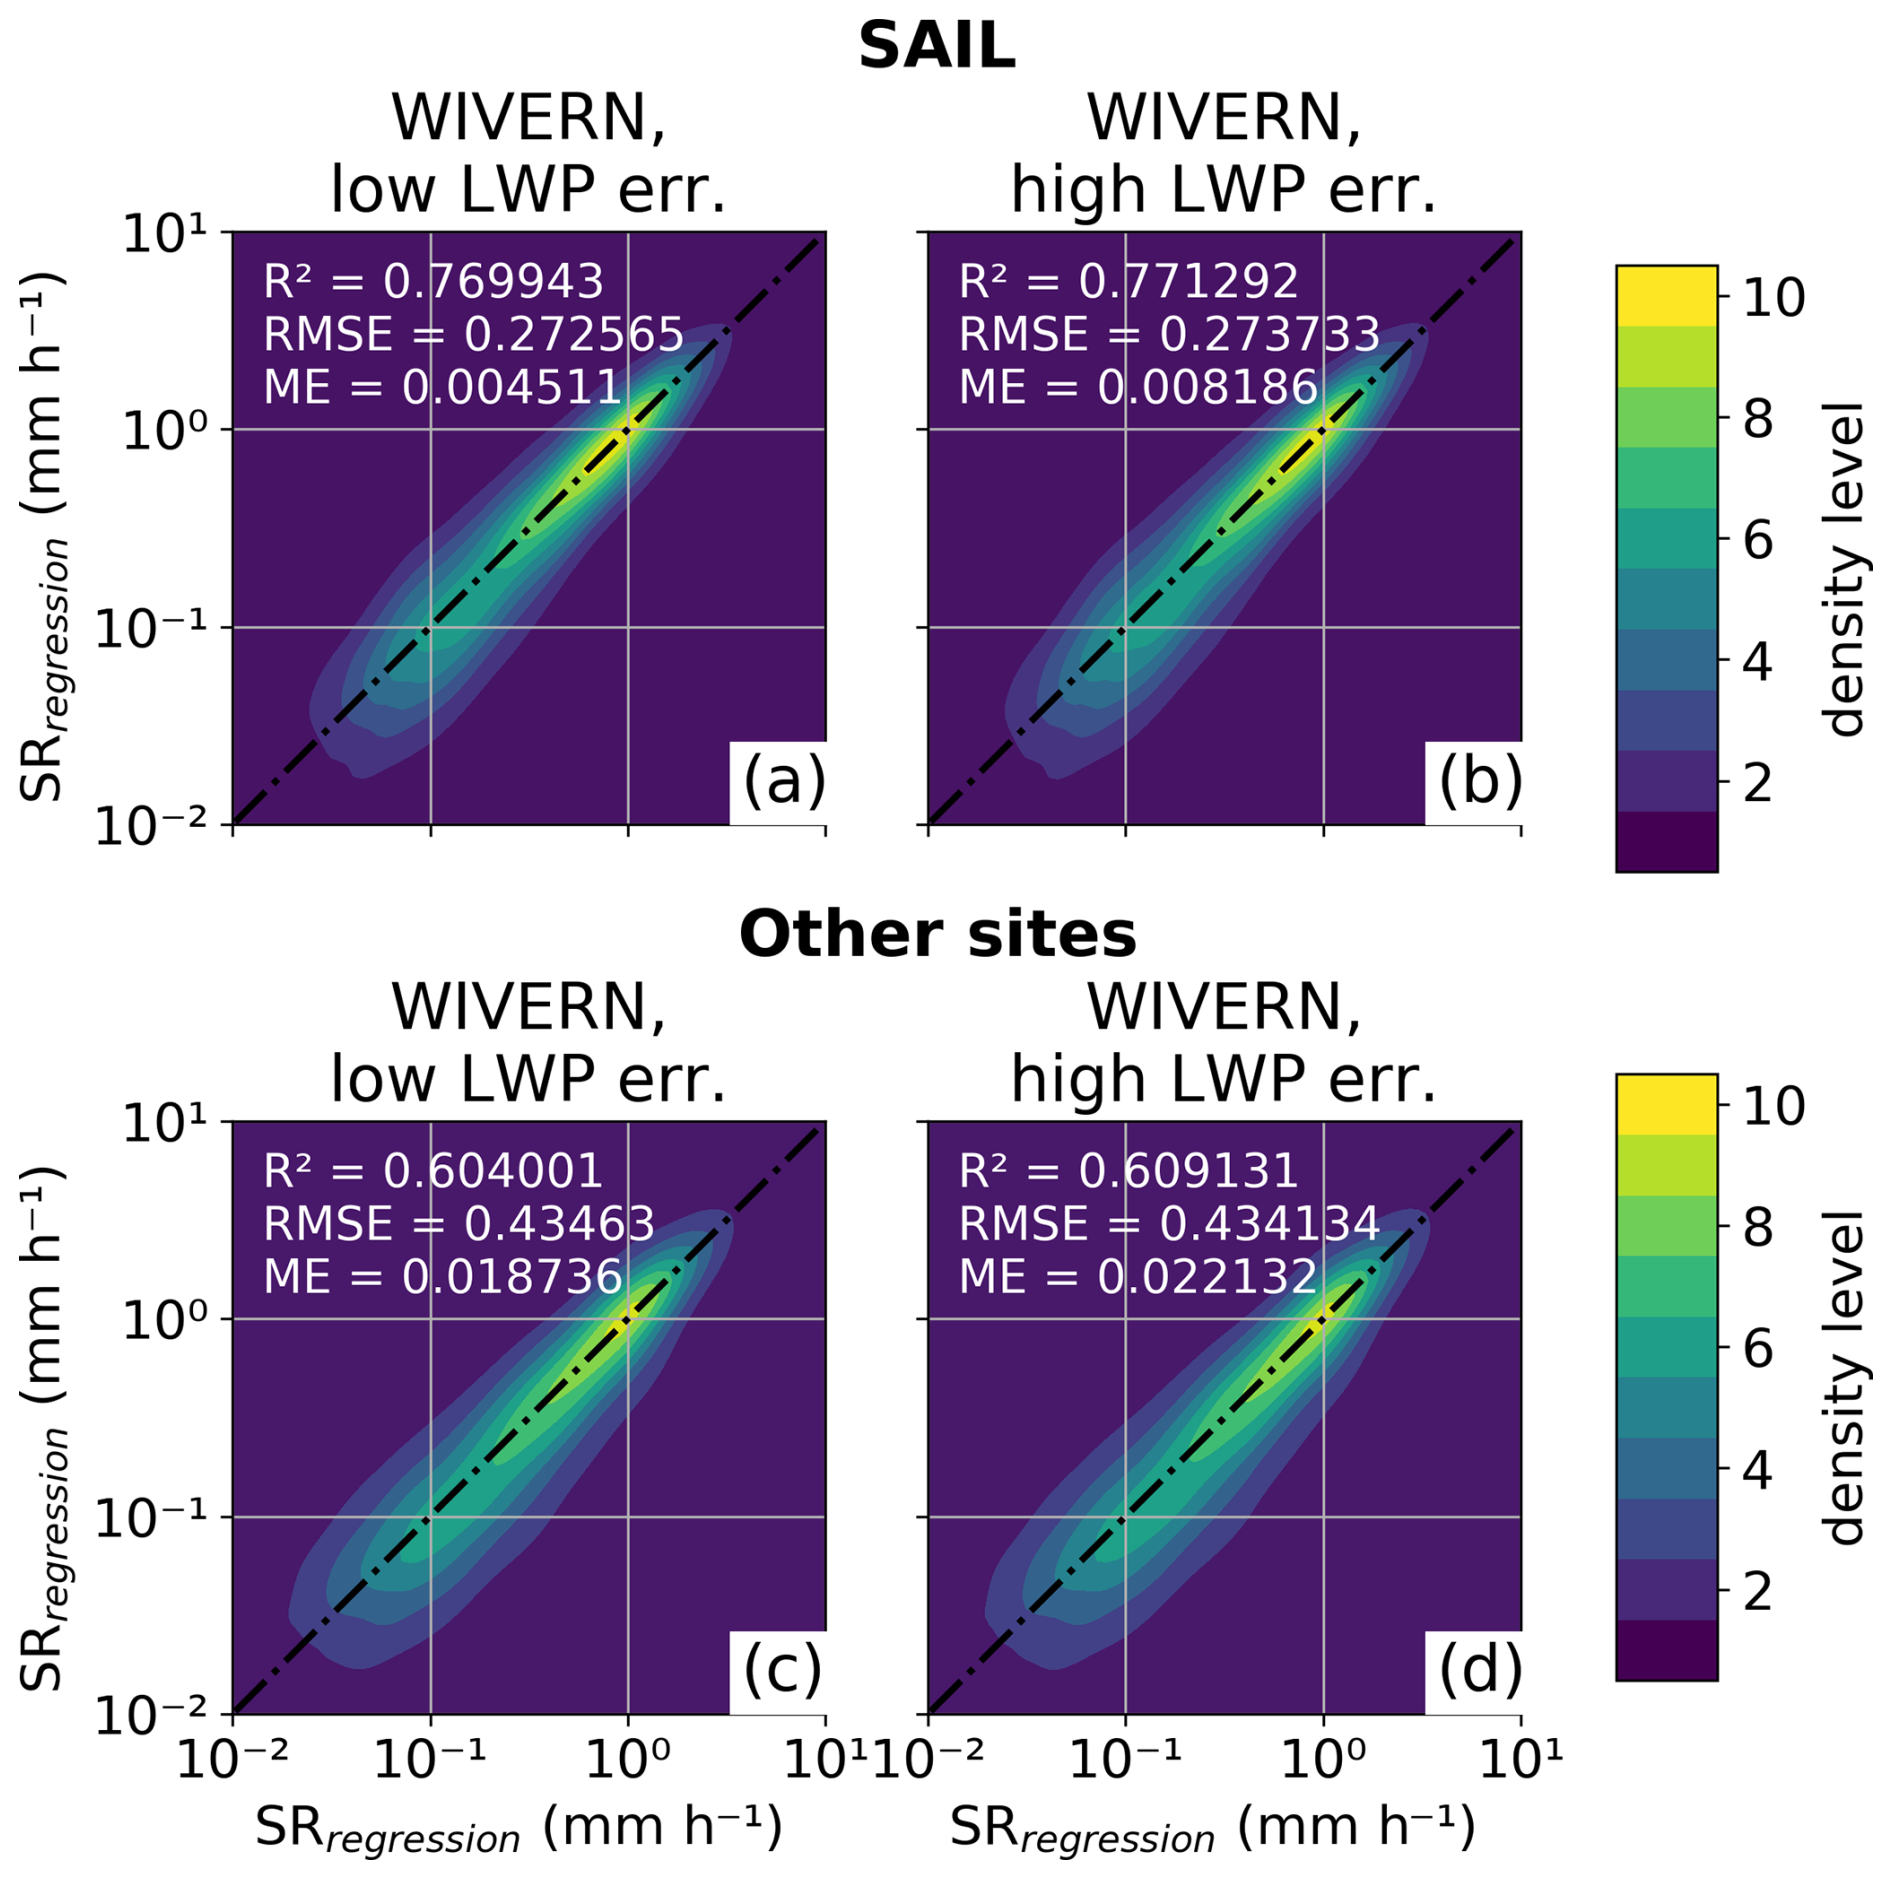
Unsurprisingly, a larger spread for space-borne than ground-based is also present for our SR–Ze relations. While the application to SAIL data results in higher R2, lower RMSE, and lower ME than to the other sites, the largest density of data is close to the 1:1 line, and the increased spread predominately occurs for small SR. Positive ME show a slight positive bias; however the bias is small.
4.2.3 Error estimation and comparison to gauge measurements
In the previous section, we used RMSE derived over the whole IWC and SR ranges, respectively, to compare the performance of different relations. However, RMSE typically increases with increasing IWC and SR; thus deriving it over the whole IWC and SR ranges does not quantify their respective uncertainties well. The normalized RMSE as a function of IWC and SR, respectively, is a better tool to quantify uncertainties of our relations (Fig. 10). Here, we calculate RMSE of IWC (SR) for 20 logarithmic bins between 0.01 and 1 g m−3 (0.1 and 10 mm h−1), excluding bins with fewer than 150 data points. We define NRMSE as RMSE divided by the center of each bin. As expected, NRMSE are generally lower when applying our relations to ground-based data than to space-borne data and decrease with increasing IWC and SR, respectively. Using M in the IWC function, NRMSE is below 75 % over the whole IWC range and below 25 % for IWC >0.1 g m−3, outperforming the 40 %–70 % NRMSE range reported in Protat et al. (2016) for IWC >0.05 g m−3. Using LWP, low IWC values close to 0.01 g m−3 have NRMSE of over 150 %. NRMSE decreases with increasing IWC getting below 50 % for IWC >0.2 g m−3. For SR, NRMSEs for both M- and LWP-dependent relations are in a similar range. For SR >0.2 mm h−1, the M relation results in NRMSE below 60 % and the LWP relation below 70 % and 80 % for ground-based and space-borne application, respectively. While SR NRMSE generally decreases for both relations, there is more variability than for IWC. This is likely for multiple reasons. First, high SR events are rare, and therefore the number of data points for the highest SR bins is lower than for the highest IWC bins. Second, the variability of fall velocities of particles during events with large SR might be larger. The resulting uncertainty of particle fall velocities is likely not covered by our relations. Figure 4 also shows that at low Ze, meaning generally lower SR, there is a clear spread dependent on particle riming, with larger values of M resulting in lower SR. However, at large Ze (about >5 dBZ) and therefore generally larger SR, this spread is less visible with lower SR occurring also when particles are close to unrimed. In addition, we tested the performance for a bias in Ze. If Ze were biased by +1 dB e.g., due to an imperfect calibration, NRMSEs would be increased by 13 and 16 percentage points on average for IWC >0.1 g m−3 and SR >1.0 mm h−1, respectively. A bias of −1 dB is negligible.
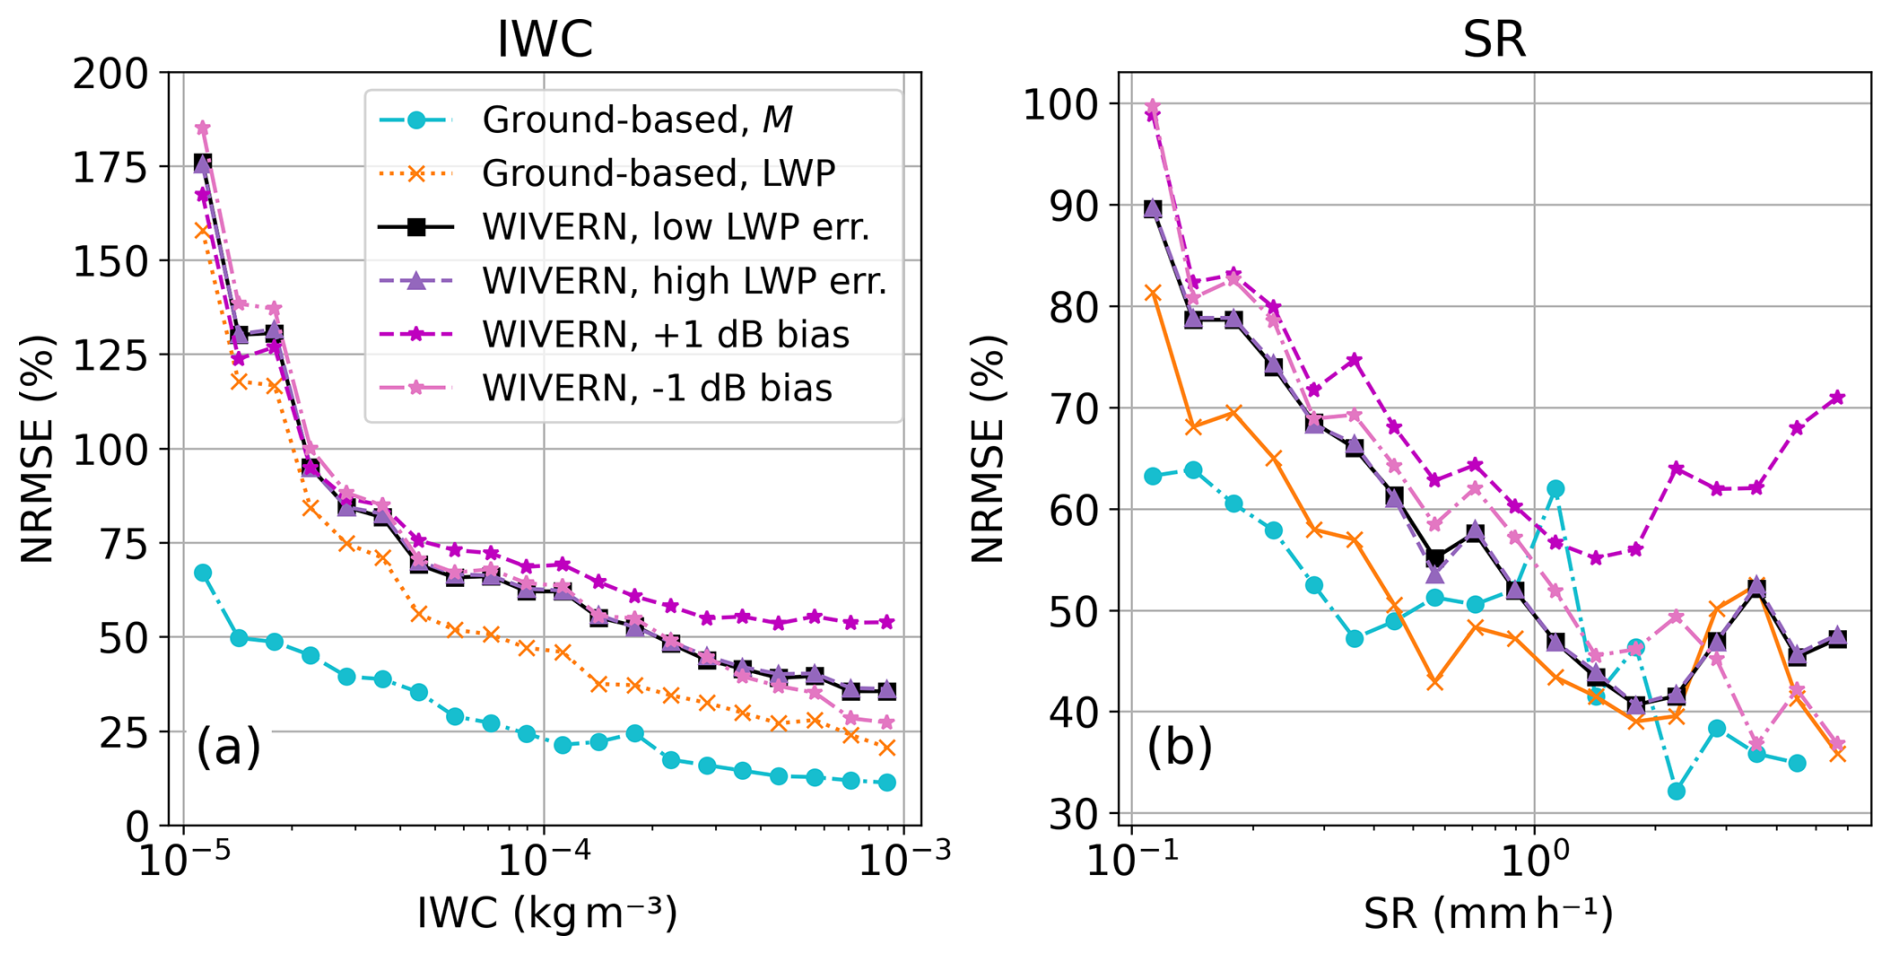
Figure 10Normalized root mean square error (NRMSE) in percentage as a function of ground-based and space-borne (WIVERN) estimates of (a) IWC and (b) SR, respectively. NRMSEs for positive and negative bias in Ze of 1 dB are shown in magenta and pink, respectively. Note the different y axis scales.
SRregression is also validated against gauge measurements SRgauge, which act as a completely independent reference. The validation is performed for SAIL data (Fig. 11) and a subset of HYY data (December 2023–February 2024, Fig. 12), due to limited data availability. Gauge snowfall measurements can be subject to various sources of errors, and gauge-derived SR can vary significantly between identical instruments (e.g. Yang and Simonenko, 2014) even though the one in HYY is operated as a Double Fence Intercomparison Reference (DFIR, Rasmussen et al., 2012), and the one at SAIL was located in a Low Porosity Double Fence (LPDF, Kochendorfer et al., 2023). A 1:1 fit is therefore not expected. However, hourly accumulated SRregression values show no systematic biases compared to SRgauge.
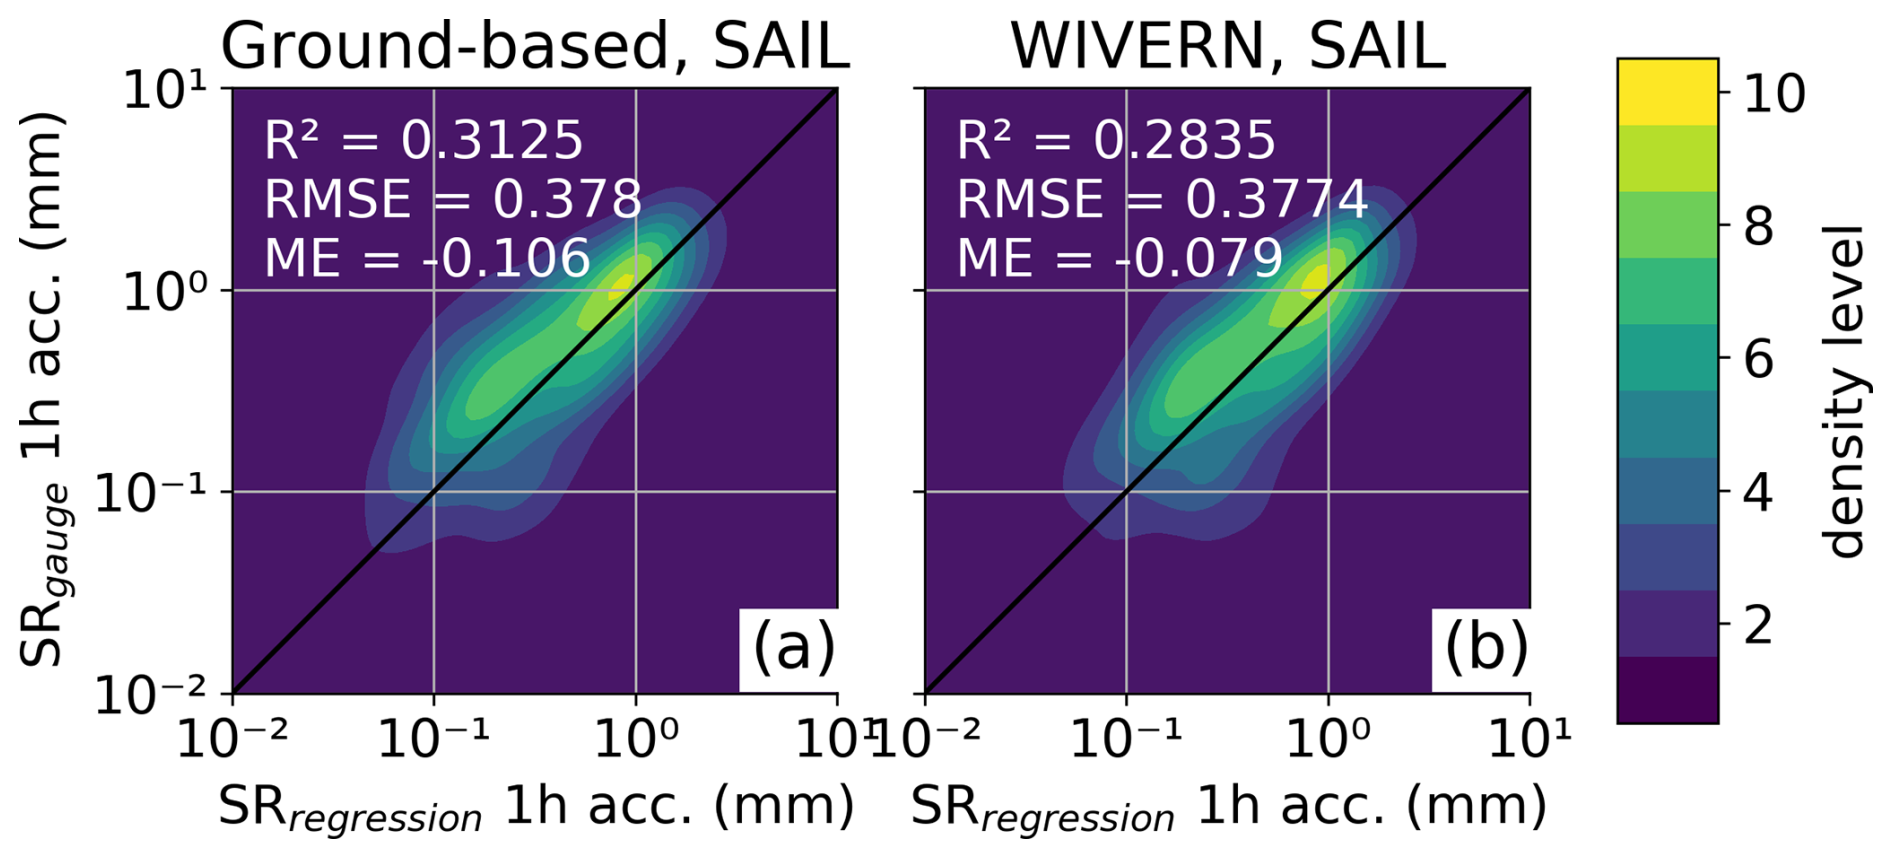
Figure 112D density plot of hourly accumulated SR (in mm) (liquid water equivalent) derived with empirical function from equivalent radar reflectivity Ze, air temperature T, and liquid water path LWP (SRregression) applied to (a) ground-based radar and (b) the approximated WIVERN measurements vs. gauge measurements (SRgauge) for the SAIL site. Data point density is plotted in 10 levels from lowest (blue) to highest (yellow).
In this study, we present novel ice water content – equivalent radar reflectivity (IWC–Ze) and snowfall rate – equivalent radar reflectivity (SR–Ze) relations for 40° slanted and vertically pointing W-band radar. We investigate the dependence of IWC–Ze and SR–Ze on riming, which we quantify with the normalized rime mass M (Seifert et al., 2019; Maherndl et al., 2024a), and use M in our relations to reduce the spread in the IWC–Ze and SR–Ze spaces. In addition, we present relations using liquid water path (LWP) instead of M, which can act as a proxy for the occurrence of riming. LWP is typically easier to measure than M so that the relations with LWP can be applied to ground-based or space-borne radar–radiometer instruments. The applicability of the method to observations of the proposed Earth Explorer 11 candidate mission WIVERN (Illingworth et al., 2018; Battaglia et al., 2022) is investigated.
We used joint in situ snowfall (VISSS) and remote sensing (W-band radar and radiometer) data from ground-based sites in mid-latitudes and high latitudes to build a dataset of reference IWC and SR. Reference IWC and SR from the SAIL site (Colorado, USA) are used to derive the IWC–Ze and SR–Ze relations, while reference IWC and SR from additional sites in Hyytiälä (Finland), Ny-Ålesund (Svalbard), and Eriswil (Switzerland) are used for validation. In addition, gauge measurements from SAIL and Hyytiälä are used as an independent reference for validation.
Our main findings are summarized in the following:
-
We found that slanted W-band Ze observations at 40° are 2.29±0.39 dB (mean ± standard deviation) lower than vertically pointing Ze for constant IWC (Fig. 3). This offset is nearly constant over the full IWC range and likely due to snow particles being aligned predominately horizontally. As a result, this offset can be applied to correct 40° Ze to 90° Ze and vice versa.
-
For a given Ze, ice particle populations have a lower IWC the more heavily rimed they are due to the enhanced scattering of rimed particles (Fig. 4). This also holds for SR. However, at larger Ze (about >5 dBZ), the dependence on riming is less pronounced, and lower SRs also occur for unrimed particles at constant Ze. This is likely due to rimed particles typically having larger fall speeds, thus increased SR, and to more variability in particle fall speed during high SR events in general.
-
We demonstrated the application of our IWC–Ze and SR–Ze relations to ground-based sites (Figs. 6 and 7). When estimates of M are available, IWC and SR can be derived accurately with Eqs. (6) and (7) (R2=0.96 and R2=0.70 for IWC and SR, respectively). Normalized root mean square errors (NRMSEs) are below 50 % and 25 % for IWC >0.01 g m−3 and IWC >0.1 g m−3, respectively. For SR, the NRMSE is below 70 % over the SR range. At sites without in situ data, which are currently needed to derive M, LWP can act as a proxy for the occurrence of riming (Eqs. 8 and 9), resulting in R2=0.81 and R2=0.60 for IWC and SR, respectively. NRMSEs are below 150 % and 75 % for IWC >0.01 g m−3 and IWC >0.1 g m−3, respectively, and below 70 % for SR >0.2 mm h−1.
-
We also showed the application of the LWP-dependent formulas to space-borne instruments using the example of the planned WIVERN mission (Figs. 8 and 9). We approximated future WIVERN measurement by averaging the ground-based data to the coarser WIVERN resolution and applying error estimates consistent to the expected performance of WIVERN. NRMSEs of the IWC and SR estimates are less than 10 percentage points higher than for ground-based applications even when assuming a high estimate for the LWP error (Fig. 10).
-
Comparing our SR estimates to gauge data for SAIL and Hyytiälä shows no stark bias towards over- or underestimation (Figs. 11 and 12). This strengthens the validity of our relations for different sites.
It must be noted that there are several assumptions that go into deriving the reference IWC and SR data. IWC and SR are based on VISSS observations and assumptions about the mass–size relation of snow particles. The assumed mass–size parameters were selected for M derived for each time step assuming a mixture of particle shapes. The M retrieval assumes that VISSS observations at the ground are representative of the matched radar volume close to ground. The retrieval method uses forward simulations with PAMTRA and scattering and physical properties of rimed ice particles are based on simulated rimed aggregates. It is assumed that the simulated rimed aggregates are representative of snow and ice particles in nature. Further observational studies focusing on particle mass and scattering behavior are needed to investigate these assumptions. Uncertainties due to the mass–size assumptions could be reduced if size-resolved particle mass observations were available in the future. This way, completely independent reference IWC and SR could be derived with which the study should be repeated.
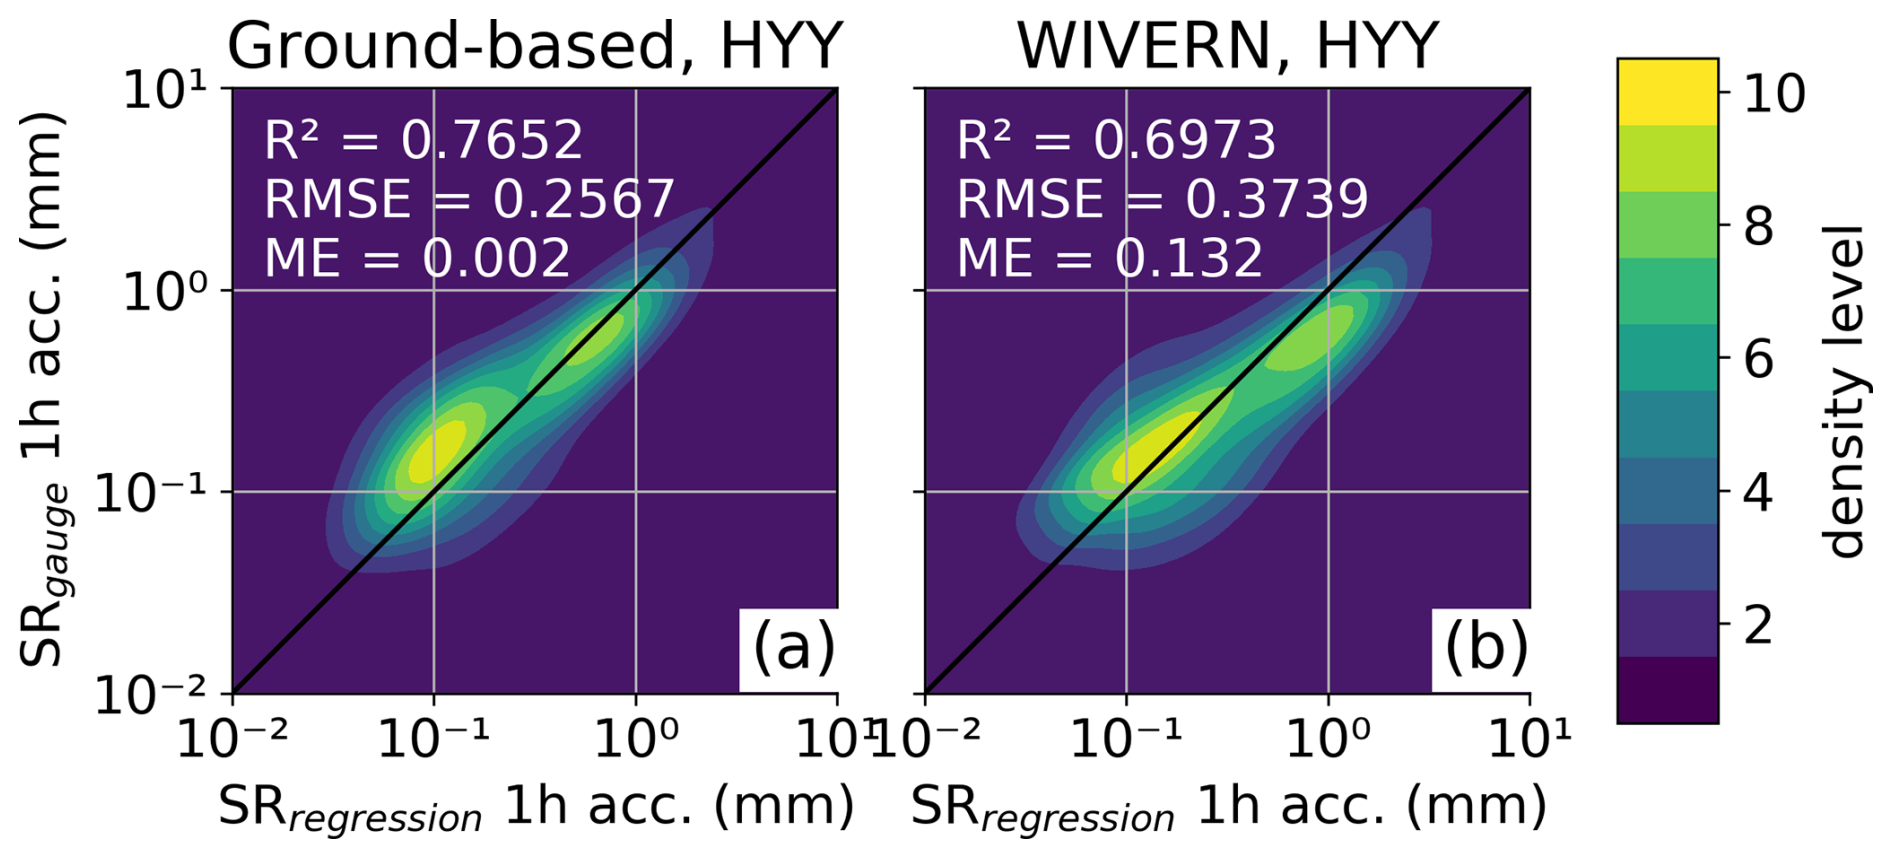
Figure 12As in Fig. 11 but for Hyytiälä, Finland, for the time period of December 2023 to February 2024.
Our empirical functions were derived and validated based on few sites in mid-latitudes and high latitudes in the Northern Hemisphere. More sites with combined in situ and W-band radar measurements would be necessary to investigate if the empirical relations can be applied globally.
In conclusion, the proposed IWC and SR relations provide a novel way to reduce uncertainties of IWC and SR estimates for W-band radar by accounting for particle riming. Advantages to current literature relations are the flexibility in terms of viewing angle (40° slanted and 90° vertical) and the inclusion of LWP, allowing the application to ground-based and space-borne radar–radiometer combinations like EarthCARE or the proposed WIVERN mission. The Doppler capabilities of EarthCARE might even allow us to quantify riming from the hydrometeor fall velocities via the approach from Mosimann (1995) or via optimal estimation techniques (Mroz et al., 2023; Mason et al., 2023). Then, the IWC and SR relations including M can be used, which have lower uncertainties than the ones based on LWP.
We performed the same analysis as in Maherndl et al. (2023) to parameterize the Self-Similar Rayleigh–Gans Approximation (SSRGA; Hogan and Westbrook, 2014; Hogan et al., 2017) parameters αe, κ, γ, β, and ζ1 but for 50° tilted instead of horizontally aligned particles to account the 40° observations during SAIL in our scattering calculations. For further detail in regards to SSRGA and the riming-dependent parameterization, we refer to Maherndl et al. (2023).
Equation (A1) gives the form of the function to derive each SSRGA parameter.
where pi denotes the fit coefficients.
We obtain the following parameterizations of the SSRGA parameter depending on M for 40° slanted radar:
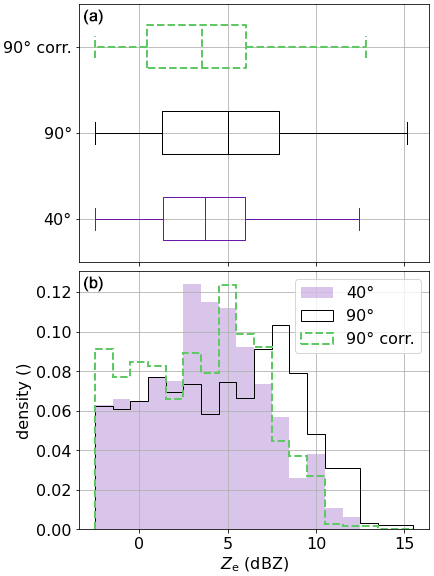
Figure B1 shows distributions of Ze close to ground during scans in February for 40° slanted and vertical observations. The correction derived in Sect. 3.3 shifts the 90° distribution closer to the 40° distribution, especially for the higher reflectivity right edge. Median and quantile values of the 40° and the corrected 90° data show close agreement strengthening the validity of our correction.
SAIL data were obtained from the Atmospheric Radiation Measurement (ARM) user facility, a U.S. Department of Energy (DOE) Office of Science user facility managed by the Biological and Environmental Research Program: LIMRAD94 (https://doi.org/10.5439/2229846, Kalesse-Los et al., 2025), VISSS (https://doi.org/10.5439/2278627, Maahn et al., 2025), the meteorological in situ data of AMF2 (https://doi.org/10.5439/1786358, Kyrouac et al., 2025), and the microwave radiometer retrieval products (https://doi.org/10.5439/1027369, Zhang, 2025). Cloudnet data from Hyytiälä, Ny-Alesund, and the PolarCAP campaign are available for download from https://doi.org/10.60656/a7b4af702fc04dd6 (Moisseev and Petäjä, 2024), https://doi.org/10.60656/c86dcce9d89b4532 (Ebell and Ritter, 2024), and https://doi.org/10.60656/1395b12207d14848 (Seifert, 2024). VISSS1 and VISSS2 data from Hyytiälä and Ny-Alesund are published on PANGAEA (HYY: https://doi.org/10.1594/PANGAEA.959046, Maahn and Maherndl, 2023b; NYA: https://doi.org/10.1594/PANGAEA.958537, Maahn and Maherndl, 2023a and https://doi.org/10.1594/PANGAEA.965766, Maahn and Maherndl, 2024). VISSS3 data from Hyytiälä and VISSS1 data from PolarCAP are available upon request.
NM developed the described methods, analyzed and plotted the data, and wrote the manuscript. AK collected and processed the LIMRAD94 data from SAIL and PolarCAP. MM and AB acquired funding and guided the research project. All authors reviewed and edited the manuscript.
At least one of the (co-)authors is a member of the editorial board of Atmospheric Measurement Techniques. The peer-review process was guided by an independent editor, and the authors also have no other competing interests to declare.
Publisher's note: Copernicus Publications remains neutral with regard to jurisdictional claims made in the text, published maps, institutional affiliations, or any other geographical representation in this paper. While Copernicus Publications makes every effort to include appropriate place names, the final responsibility lies with the authors.
This work was supported by the European Space Agency under the activity WInd VElocity Radar Nephoscope (WIVERN) Phase A Science and Requirements Consolidation Study (ESA Contract Number 4000144120/24/NL/IB/ab) and by three projects funded by the Deutsche Forschungsgemeinschaft (DFG, German Research Foundation): 408008112 (“Characterization of orography-influenced riming and secondary ice production and their effects on precipitation rates using radar polarimetry and Doppler spectra” (CORSIPP) within the Priority Program SPP 2115 “Polarimetric Radar Observations meet Atmospheric Modelling (PROM) – Fusion of Radar Polarimetry and Numerical Atmospheric Modelling Towards an Improved Understanding of Cloud and Precipitation Processes”), 268020496 (TRR 172 “Arctic Amplification: Climate Relevant Atmospheric and Surface Processes, and Feedback Mechanisms” (AC)3), and 516261703 (“Evaluating Microphysical Pathways Of midlatitude Snow formation (EMPOS)”). We acknowledge ACTRIS and Finnish Meteorological Institute for providing the dataset, which is available for download from https://cloudnet.fmi.fi (last access: 28 November 2024). This research was supported by the Atmospheric Radiation Measurement (ARM) user facility, a U.S. Department of Energy (DOE) Office of Science user facility managed by the Biological and Environmental Research Program. We thank Mario Montopoli from CNR Rome for his constructive feedback, which helped to improve this study.
This research has been supported by the European Space Agency (grant no. 4000144120/24/NL/IB/ab) and the Deutsche Forschungsgemeinschaft (grant nos. 408008112, 268020496, and 516261703).
This paper was edited by Leonie von Terzi and reviewed by two anonymous referees.
Battaglia, A. and Panegrossi, G.: What can we learn from the CloudSat radiometric mode observations of snowfall over the ice-free ocean?, Remote Sens.-Basel, 12, 3285, https://doi.org/10.3390/rs12203285, 2020. a
Battaglia, A., Martire, P., Caubet, E., Phalippou, L., Stesina, F., Kollias, P., and Illingworth, A.: Observation error analysis for the WInd VElocity Radar Nephoscope W-band Doppler conically scanning spaceborne radar via end-to-end simulations, Atmos. Meas. Tech., 15, 3011–3030, https://doi.org/10.5194/amt-15-3011-2022, 2022. a, b, c
Battaglia, A., Rizik, A., Tridon, F., and Isakeneta, I.: I and Qs simulation and processing envisaged for space-borne polarisation Diversity Doppler Radars, IEEE T. Geosci. Remote, 63, 1–14 pp., https://doi.org/10.1109/TGRS.2025.3529672, 2024. a
Billault-Roux, A.-C. and Berne, A.: Integrated water vapor and liquid water path retrieval using a single-channel radiometer, Atmos. Meas. Tech., 14, 2749–2769, https://doi.org/10.5194/amt-14-2749-2021, 2021. a, b
Bukovčić, P., Ryzhkov, A., and Zrnić, D.: Polarimetric relations for snow estimation—radar verification, J. Appl. Meteorol. Clim., 59, 991–1009, https://doi.org/10.1175/JAMC-D-19-0140.1, 2020. a
Coppola, M., Battaglia, A., Tridon, F., and Kollias, P.: Improved hydrometeor detection near the Earth's surface by a conically scanning spaceborne W-band radar, EGUsphere [preprint], https://doi.org/10.5194/egusphere-2025-416, 2025. a
Delanoë, J. and Hogan, R. J.: Combined CloudSat-CALIPSO-MODIS retrievals of the properties of ice clouds, J. Geophys. Res.-Atmos., 115, D00H29, https://doi.org/10.1029/2009JD012346, 2010. a
Ebell, K. and Ritter, C.: Custom collection of microwave radiometer, and radar data from Ny-Ålesund between 1 Jan 2023 and 31 Mar 2024, ACTRIS Cloud remote sensing data centre unit (CLU) [data set], https://doi.org/10.60656/c86dcce9d89b4532, 2024. a, b
Ebell, K., Nomokonova, T., Maturilli, M., and Ritter, C.: Radiative effect of clouds at Ny-Ålesund, Svalbard, as inferred from ground-based remote sensing observations, J. Appl. Meteorol. Clim., 59, 3–22, https://doi.org/10.1175/JAMC-D-19-0080.1, 2020. a
Feldman, D. R., Aiken, A. C., Boos, W. R., Carroll, R. W. H., Chandrasekar, V., Collis, S., Creamean, J. M., de Boer, G., Deems, J., DeMott, P. J., Fan, J., Flores, A. N., Gochis, D., Grover, M., Hill, T. C. J., Hodshire, A., Hulm, E., Hume, C. C., Jackson, R., Junyent, F., Kennedy, A., Kumjian, M., Levin, E. J. T., Lundquist, J. D., O'Brien, J., Raleigh, M. S., Reithel, J., Rhoades, A., Rittger, K., Rudisill, W., Sherman, Z., Siirila-Woodburn, E., Skiles, S. M., Smith, J. N., Sullivan, R. C., Theisen, A., Tuftedal, M., Varble, A. C., Wiedlea, A., Wielandt, S., Williams, K., and Xu, Z.: The surface atmosphere integrated field laboratory (SAIL) campaign, B. Am. Meteorol. Soc., 104, E2192–E2222, https://doi.org/10.1175/BAMS-D-22-0049.1, 2023. a, b
Førland, E. J., Benestad, R., Hanssen-Bauer, I., Haugen, J. E., and Skaugen, T. E.: Temperature and precipitation development at Svalbard 1900–2100, Adv. Meteorol., 2011, 893790, https://doi.org/10.1155/2011/893790, 2011. a
Fuller, S., Marlow, S. A., Haimov, S., Burkhart, M., Shaffer, K., Morgan, A., and Snider, J. R.: W-band S–Z relationships for rimed snow particles: observational evidence from combined airborne and ground-based observations, Atmos. Meas. Tech., 16, 6123–6142, https://doi.org/10.5194/amt-16-6123-2023, 2023. a, b, c, d
Henneberger, J., Ramelli, F., Spirig, R., Omanovic, N., Miller, A. J., Fuchs, C., Zhang, H., Bühl, J., Hervo, M., Kanji, Z. A., Ohneiser, K., Radenz, M., Rösch, M., Seifert, P., and Lohmann, U.: Seeding of supercooled low stratus clouds with a UAV to study microphysical ice processes: an introduction to the CLOUDLAB project, B. Am. Meteorol. Soc., 104, E1962–E1979, https://doi.org/10.1175/BAMS-D-22-0178.1, 2023. a
Heymsfield, A. J., Matrosov, S. Y., and Wood, N. B.: Toward improving ice water content and snow-rate retrievals from radars. Part I: X and W bands, emphasizing CloudSat, J. Appl. Meteorol. Clim., 55, 2063–2090, https://doi.org/10.1175/JAMC-D-15-0290.1, 2016. a
Hiley, M. J., Kulie, M. S., and Bennartz, R.: Uncertainty analysis for CloudSat snowfall retrievals, J. Appl. Meteorol. Clim., 50, 399–418, https://doi.org/10.1175/2010JAMC2505.1, 2011. a
Hogan, R. J. and Westbrook, C. D.: Equation for the microwave backscatter cross section of aggregate snowflakes using the self-similar Rayleigh–Gans approximation, J. Atmos. Sci., 71, 3292–3301, https://doi.org/10.1175/JAS-D-13-0347.1, 2014. a, b
Hogan, R. J., Mittermaier, M. P., and Illingworth, A. J.: The retrieval of ice water content from radar reflectivity factor and temperature and its use in evaluating a mesoscale model, J. Appl. Meteorol. Clim., 45, 301–317, https://doi.org/10.1175/JAM2340.1, 2006. a, b, c, d, e, f, g, h
Hogan, R. J., Honeyager, R., Tyynelä, J., and Kneifel, S.: Calculating the millimetre-wave scattering phase function of snowflakes using the self-similar Rayleigh–Gans approximation, Q. J. Roy. Meteor. Soc., 143, 834–844, https://doi.org/10.1002/qj.2968, 2017. a, b
Illingworth, A. J., Barker, H. W., Beljaars, A., Ceccaldi, M., Chepfer, H., Clerbaux, N., Cole, J., Delanoë, J., Domenech, C., Donovan, D. P., Fukuda, S., Hirakata, M., Hogan, R. J., Huenerbein, A., Kollias, P., Kubota, T., Nakajima, T., Nakajima, T. Y., Nishizawa, T., Ohno, Y., Okamoto, H., Oki, R., Sato, K., Satoh, M., Shephard, M. W., Velázquez-Blázquez, A., Wandinger, U., Wehr, T., and van Zadelhoff, G.-J.: The EarthCARE satellite: the next step forward in global measurements of clouds, aerosols, precipitation, and radiation, B. Am. Meteorol. Soc., 96, 1311–1332, https://doi.org/10.1175/BAMS-D-12-00227.1, 2015. a, b
Illingworth, A. J., Battaglia, A., Bradford, J., Forsythe, M., Joe, P., Kollias, P., Lean, K., Lori, M., Mahfouf, J.-F., Melo, S., Midthassel, R., Munro, Y., Nicol, J., Potthast, R., Rennie, M., Stein, T. H. M., Tanelli, S., Tridon, F., Walden, C. J., and Wolde, M.: WIVERN: a new satellite concept to provide global in-cloud winds, precipitation, and cloud properties, B. Am. Meteorol. Soc., 99, 1669–1687, https://doi.org/10.1175/BAMS-D-16-0047.1, 2018. a, b, c
Kalesse-Los, H., Maahn, M., Ettrichrätz, V., and Kötsche, A.: Characterization of Orography-Influenced Riming and Secondary Ice Production and Their Effects on Precipitation Rates Using Radar Polarimetry and Doppler Spectra (CORSIPP-SAIL), Tech. Rep. DOE/SC-ARM-23-046, Oak Ridge National Laboratory (ORNL), Oak Ridge, TN (US), Atmospheric Radiation Measurement (ARM) Data Center; Pacific Northwest National Laboratory (PNNL), Richland, WA (US), https://doi.org/10.2172/2242406, 2023. a
Kalesse-Los, H., Maahn, M., Kötsche, A., Ettrichrätz, V., and Steinke, I.: Leipzig university W-band cloud radar, gothic (colorado), SAIL campaign second winter (15.11.2022–05.06.2023), ARM [data set], https://doi.org/10.5439/2229846, 2025. a
Kneifel, S. and Moisseev, D.: Long-term statistics of riming in nonconvective clouds derived from ground-based Doppler cloud radar observations, J. Atmos. Sci., 77, 3495–3508, https://doi.org/10.1175/JAS-D-20-0007.1, 2020. a
Kochendorfer, J., Meyers, T. P., Hall, M. E., Landolt, S. D., Lentz, J., and Diamond, H. J.: A new reference-quality precipitation gauge wind shield, Atmos. Meas. Tech., 16, 5647–5657, https://doi.org/10.5194/amt-16-5647-2023, 2023. a
Kollias, P., Puidgomènech Treserras, B., Battaglia, A., Borque, P. C., and Tatarevic, A.: Processing reflectivity and Doppler velocity from EarthCARE's cloud-profiling radar: the C-FMR, C-CD and C-APC products, Atmos. Meas. Tech., 16, 1901–1914, https://doi.org/10.5194/amt-16-1901-2023, 2023. a
Küchler, N., Kneifel, S., Löhnert, U., Kollias, P., Czekala, H., and Rose, T.: A W-band radar–radiometer system for accurate and continuous monitoring of clouds and precipitation, J. Atmos. Ocean. Tech., 34, 2375–2392, https://doi.org/10.1175/JTECH-D-17-0019.1, 2017. a
Kulie, M. S. and Bennartz, R.: Utilizing spaceborne radars to retrieve dry snowfall, J. Appl. Meteorol. Clim., 48, 2564–2580, https://doi.org/10.1175/2009JAMC2193.1, 2009. a, b, c
Kötsche, A., Myagkov, A., von Terzi, L., Maahn, M., Ettrichrätz, V., Vogl, T., Ryzhkov, A., Bukovcic, P., Ori, D., and Kalesse-Los, H.: Investigating KDP signatures inside and below the dendritic growth layer with W-band Doppler Radar and in situ snowfall camera, EGUsphere [preprint], https://doi.org/10.5194/egusphere-2025-734, 2025. a
Kyrouac, J., Shi, Y., and Tuftedal, M.: “Surface Meteorological Instrumentation (MET)”, Atmospheric Radiation Measurement (ARM) user facility, ARM [data set], https://doi.org/10.5439/1786358, 2025. a
List, R. and Schemenauer, R. S.: Free-fall behavior of planar snow crystals, conical graupel and small hail, J. Atmos. Sci., 28, 110–115, https://doi.org/10.1175/1520-0469(1971)028<0110:FFBOPS>2.0.CO;2, 1971. a
Liu, G.: Deriving snow cloud characteristics from CloudSat observations, J. Geophys. Res.-Atmos., 113, D00A09, https://doi.org/10.1029/2007JD009766, 2008. a, b
Maahn, M. and Maherndl, N.: Video In Situ Snowfall Sensor (VISSS) data for Ny-Ålesund (2021–2022) [dataset publication series], PANGAEA [data set], https://doi.org/10.1594/PANGAEA.958537, 2023a. a
Maahn, M. and Moisseev, D.: Video In Situ Snowfall Sensor (VISSS) data for Hyytiälä (2021–2022) [dataset publication series], PANGAEA [data set], https://doi.org/10.1594/PANGAEA.959046, 2023. a
Maahn, M. and Maherndl, N.: Video In Situ Snowfall Sensor (VISSS) data for Ny-Ålesund (July 2022–December 2023) [dataset publication series], PANGAEA [data set], https://doi.org/10.1594/PANGAEA.965766, 2024. a
Maahn, M., Burgard, C., Crewell, S., Gorodetskaya, I. V., Kneifel, S., Lhermitte, S., Van Tricht, K., and van Lipzig, N. P. M.: How does the spaceborne radar blind zone affect derived surface snowfall statistics in polar regions?, J. Geophys. Res.-Atmos., 119, 13604–13620, https://doi.org/10.1002/2014JD022079, 2014. a
Maahn, M., Turner, D. D., Löhnert, U., Posselt, D. J., Ebell, K., Mace, G. G., and Comstock, J. M.: Optimal estimation retrievals and their uncertainties: what every atmospheric scientist should know, B. Am. Meteorol. Soc., 101, E1512–E1523, https://doi.org/10.1175/BAMS-D-19-0027.1, 2020. a
Maahn, M., Moisseev, D., Steinke, I., Maherndl, N., and Shupe, M. D.: Introducing the Video In Situ Snowfall Sensor (VISSS), Atmos. Meas. Tech., 17, 899–919, https://doi.org/10.5194/amt-17-899-2024, 2024. a, b
Maahn, M., Ettrichraetz, V., and Steinke, I.: VISSS raw data from SAIL at gothic from November 2022 to june 2023, ARM [data set], https://doi.org/10.5439/2278627, 2025. a
Maherndl, N., Maahn, M., Tridon, F., Leinonen, J., Ori, D., and Kneifel, S.: A riming-dependent parameterization of scattering by snowflakes using the self-similar Rayleigh–Gans approximation, Q. J. Roy. Meteor. Soc., 149, 3562–3581, https://doi.org/10.1002/qj.4573, 2023. a, b, c, d, e, f, g, h, i, j
Maherndl, N., Moser, M., Lucke, J., Mech, M., Risse, N., Schirmacher, I., and Maahn, M.: Quantifying riming from airborne data during the HALO-(AC)3 campaign, Atmos. Meas. Tech., 17, 1475–1495, https://doi.org/10.5194/amt-17-1475-2024, 2024a. a, b, c, d
Maherndl, N., Moser, M., Schirmacher, I., Bansemer, A., Lucke, J., Voigt, C., and Maahn, M.: How does riming influence the observed spatial variability of ice water in mixed-phase clouds?, Atmos. Chem. Phys., 24, 13935–13960, https://doi.org/10.5194/acp-24-13935-2024, 2024b. a
Mason, S. L., Chiu, C. J., Hogan, R. J., Moisseev, D., and Kneifel, S.: Retrievals of riming and snow density from vertically pointing Doppler Radars, J. Geophys. Res.,Atm., 123, 13807–13834, https://doi.org/10.1029/2018JD028603, 2018a. a
Mason, S. L., Chiu, C. J., Hogan, R. J., Moisseev, D., and Kneifel, S.: Retrievals of riming and snow density from vertically pointing Doppler radars, J. Geophys. Res.-Atmos., 123, 13807–13834, https://doi.org/10.1029/2018JD028603, 2018b. a
Mason, S. L., Hogan, R. J., Bozzo, A., and Pounder, N. L.: A unified synergistic retrieval of clouds, aerosols, and precipitation from EarthCARE: the ACM-CAP product, Atmos. Meas. Tech., 16, 3459–3486, https://doi.org/10.5194/amt-16-3459-2023, 2023. a
Matrosov, S. Y.: Modeling backscatter properties of snowfall at millimeter wavelengths, J. Atmos. Sci., 64, 1727–1736, https://doi.org/10.1175/JAS3904.1, 2007. a, b, c
Mech, M., Maahn, M., Kneifel, S., Ori, D., Orlandi, E., Kollias, P., Schemann, V., and Crewell, S.: PAMTRA 1.0: the Passive and Active Microwave radiative TRAnsfer tool for simulating radiometer and radar measurements of the cloudy atmosphere, Geosci. Model Dev., 13, 4229–4251, https://doi.org/10.5194/gmd-13-4229-2020, 2020. a
Milani, L., Kulie, M. S., Casella, D., Dietrich, S., L'Ecuyer, T. S., Panegrossi, G., Porcù, F., Sanò, P., and Wood, N. B.: CloudSat snowfall estimates over Antarctica and the Southern Ocean: an assessment of independent retrieval methodologies and multi-year snowfall analysis, Atmos. Res., 213, 121–135, https://doi.org/10.1016/j.atmosres.2018.05.015, 2018. a
Moisseev, D. and Petäjä, T.: Custom collection of microwave radiometer, radar, and weather station data from Hyytiälä between 1 Jan 2022 and 30 Apr 2024, ACTRIS Cloud remote sensing data centre unit (CLU) [data set], https://doi.org/10.60656/a7b4af702fc04dd6, 2024. a, b
Moisseev, D., von Lerber, A., and Tiira, J.: Quantifying the effect of riming on snowfall using ground-based observations, J. Geophys. Res.-Atmos., 122, 4019–4037, https://doi.org/10.1002/2016JD026272, 2017. a, b
Mosimann, L.: An improved method for determining the degree of snow crystal riming by vertical Doppler radar, Atmos. Res., 37, 305–323, https://doi.org/10.1016/0169-8095(94)00050-N, 1995. a, b
Mroz, K., Treserras, B. P., Battaglia, A., Kollias, P., Tatarevic, A., and Tridon, F.: Cloud and precipitation microphysical retrievals from the EarthCARE Cloud Profiling Radar: the C-CLD product, Atmos. Meas. Tech., 16, 2865–2888, https://doi.org/10.5194/amt-16-2865-2023, 2023. a, b
Mülmenstädt, J., Sourdeval, O., Delanoë, J., and Quaas, J.: Frequency of occurrence of rain from liquid-, mixed-, and ice-phase clouds derived from a-train satellite retrievals, Geophys. Res. Lett., 42, 6502–6509, https://doi.org/10.1002/2015GL064604, 2015. a
Protat, A., Delanoë, J., Strapp, J. W., Fontaine, E., Leroy, D., Schwarzenboeck, A., Lilie, L., Davison, C., Dezitter, F., Grandin, A., and Weber, M.: The measured relationship between ice water content and cloud radar reflectivity in tropical convective clouds, J. Appl. Meteorol. Clim., 55, 1707–1729, https://doi.org/10.1175/JAMC-D-15-0248.1, 2016. a, b, c, d, e, f, g, h
Rasmussen, R., Baker, B., Kochendorfer, J., Meyers, T., Landolt, S., Fischer, A. P., Black, J., Thériault, J. M., Kucera, P., Gochis, D., Smith, C., Nitu, R., Hall, M., Ikeda, K., and Gutmann, E.: How well are we measuring snow: the NOAA/FAA/NCAR winter precipitation test bed, B. Am. Meteorol. Soc., 93, 811–829, https://doi.org/10.1175/BAMS-D-11-00052.1, 2012. a
Rodgers, C. D.: Inverse Methods for Atmospheric Sounding: Theory and Practice, World Scientific, https://doi.org/10.1142/3171, 2000. a
Rose, T., Crewell, S., Löhnert, U., and Simmer, C.: A network suitable microwave radiometer for operational monitoring of the cloudy atmosphere, Atmos. Res., 75, 183–200, https://doi.org/10.1016/j.atmosres.2004.12.005, 2005. a
Ruiz-Donoso, E., Ehrlich, A., Schäfer, M., Jäkel, E., Schemann, V., Crewell, S., Mech, M., Kulla, B. S., Kliesch, L.-L., Neuber, R., and Wendisch, M.: Small-scale structure of thermodynamic phase in Arctic mixed-phase clouds observed by airborne remote sensing during a cold air outbreak and a warm air advection event, Atmos. Chem. Phys., 20, 5487–5511, https://doi.org/10.5194/acp-20-5487-2020, 2020. a, b
Saltikoff, E., Lopez, P., Taskinen, A., and Pulkkinen, S.: Comparison of quantitative snowfall estimates from weather radar, rain gauges and a numerical weather prediction model, Boreal Environ. Res., 20, 667–678, 2015. a
Scarsi, F. E., Battaglia, A., Maahn, M., and Lhermitte, S.: How to reduce sampling errors in spaceborne cloud radar-based snowfall estimates, EGUsphere [preprint], https://doi.org/10.5194/egusphere-2024-1917, 2024a. a
Scarsi, F. E., Battaglia, A., Tridon, F., Martire, P., Dhillon, R., and Illingworth, A.: Mispointing characterization and Doppler velocity correction for the conically scanning WIVERN Doppler radar, Atmos. Meas. Tech., 17, 499–514, https://doi.org/10.5194/amt-17-499-2024, 2024b. a
Schirmacher, I., Kollias, P., Lamer, K., Mech, M., Pfitzenmaier, L., Wendisch, M., and Crewell, S.: Assessing Arctic low-level clouds and precipitation from above – a radar perspective, Atmos. Meas. Tech., 16, 4081–4100, https://doi.org/10.5194/amt-16-4081-2023, 2023. a
Seifert, A., Leinonen, J., Siewert, C., and Kneifel, S.: The geometry of rimed aggregate snowflakes: a modeling study, J. Adv. Model. Earth Sy., 11, 712–731, https://doi.org/10.1029/2018MS001519, 2019. a, b
Seifert, P.: Custom collection of microwave radiometer data from Eriswil between 1 and 31 Jan 2024, ACTRIS Cloud remote sensing data centre unit (CLU) [data set], https://doi.org/10.60656/1395b12207d14848, 2024. a, b
Stout, J. R., Westbrook, C. D., Stein, T. H. M., and McCorquodale, M. W.: Stable and unstable fall motions of plate-like ice crystal analogues, Atmos. Chem. Phys., 24, 11133–11155, https://doi.org/10.5194/acp-24-11133-2024, 2024. a
Tanelli, S., Durden, S. L., Im, E., Pak, K. S., Reinke, D. G., Partain, P., Haynes, J. M., and Marchand, R. T.: CloudSat's cloud profiling radar after two years in orbit: performance, calibration, and processing, IEEE T. Geosci. Remote, 46, 3560–3573, https://doi.org/10.1109/TGRS.2008.2002030, 2008. a, b
Tridon, F., Battaglia, A., Rizik, A., Scarsi, F. E., and Illingworth, A.: Filling the gap of wind observations inside tropical cyclones, Earth and Space Science, 10, e2023EA003099, https://doi.org/10.1029/2023EA003099, 2023. a
Vogl, T., Maahn, M., Kneifel, S., Schimmel, W., Moisseev, D., and Kalesse-Los, H.: Using artificial neural networks to predict riming from Doppler cloud radar observations, Atmos. Meas. Tech., 15, 365–381, https://doi.org/10.5194/amt-15-365-2022, 2022. a
von Lerber, A., Moisseev, D., Bliven, L. F., Petersen, W., Harri, A.-M., and Chandrasekar, V.: Microphysical properties of snow and their link to Ze–S relations during BAECC 2014, J. Appl. Meteorol. Clim., 56, 1561–1582, https://doi.org/10.1175/JAMC-D-16-0379.1, 2017. a
Wang, P. K.: Observational studies of ice hydrometeors and their fall behavior, in: Motions of Ice Hydrometeors in the Atmosphere: Numerical Studies and Implications, edited by: Wang, P. K., Springer, Singapore, https://doi.org/10.1007/978-981-33-4431-0_2, 15–22, 2021. a
Wood, N. B. and L'Ecuyer, T. S.: What millimeter-wavelength radar reflectivity reveals about snowfall: an information-centric analysis, Atmos. Meas. Tech., 14, 869–888, https://doi.org/10.5194/amt-14-869-2021, 2021. a, b
Yang, D. and Simonenko, A.: Comparison of winter precipitation measurements by six Tretyakov gauges at the Valdai experimental site, Atmos. Ocean, 52, 39–53, https://doi.org/10.1080/07055900.2013.865156, 2014. a
Zhang, D.: MWR Retrievals (MWRRET1LILJCLOU) Atmospheric Radiation Measurement (ARM) User Facility, ARM [data set], https://doi.org/10.5439/1027369, 2025. a
Zikmunda, J. and Vali, G.: Fall patterns and fall velocities of rimed ice crystals, J. Atmos. Sci., 29, 1334–1347, https://doi.org/10.1175/1520-0469(1972)029<1334:FPAFVO>2.0.CO;2, 1972. a
- Abstract
- Introduction
- Measurement sites and instruments
- Methods
- Results and discussion
- Conclusions
- Appendix A: Riming-dependent SSRGA coefficients for 40° slanted radar
- Appendix B: Slanted vs. vertical Z during SAIL
- Data availability
- Author contributions
- Competing interests
- Disclaimer
- Acknowledgements
- Financial support
- Review statement
- References