the Creative Commons Attribution 4.0 License.
the Creative Commons Attribution 4.0 License.
 | 24 Jul 2025
Assessment of laboratory O4 (O2–O2 collision-induced) absorption cross-sections at 360 nm using atmospheric long-path DOAS observations
Udo Frieß
Jan-Marcus Nasse
Ulrich Platt
Thomas Wagner
Absorption of light in the atmosphere by collision-induced absorption (CIA) by two oxygen molecules O2–O2, in the following referred to as O4, can be used to derive properties of aerosols and clouds from remote sensing observations. In recent years, inconsistencies between the measured atmospheric O4 absorption and radiative transfer simulations were found for Multi-AXis Differential Optical Absorption Spectroscopy (MAX-DOAS) measurements. In the presented study, over two years of observations from a long-path (LP-) DOAS instrument deployed at the German research station Neumayer, Antarctica, are analysed. While MAX-DOAS instruments measure spectra of scattered sunlight at different elevation angles, LP-DOAS utilises an artificial light source and the atmospheric absorptions are measured along a fixed (and well-defined) light path close to the surface. Further, the pristine measurement location allows one to investigate the relation between measured and modelled O4 absorption over a large range of temperatures (−45 to +5 °C). Overall good agreement is found between the retrieved O4 absorption cross-sections covering the absorption band at 360 nm and laboratory measurements. While the best agreement is obtained for the Finkenzeller and Volkamer (2022) cross-sections, deviations at cold ambient temperatures (below ca. −25 °C) are observed for the Thalman and Volkamer (2013) cross-sections. Other O4 absorption bands could not be investigated because these are not (fully) within the spectral range of the measured spectra. This study strongly supports the accuracy of commonly used O4 absorption cross-sections in DOAS analyses, while more work is needed to understand the earlier reported inconsistencies in MAX-DOAS observations.
- Article
(7416 KB) - Full-text XML
- BibTeX
- EndNote


Absorption of light in the atmosphere by the oxygen collision complex O2–O2 (in the following referred to as O4) in the UV-visible spectral range is commonly used in remote sensing applications to derive properties of aerosols and clouds. The collision of two oxygen molecules gives rise to the formation of several absorption bands through so-called collision-induced absorption (CIA). CIA describes the absorption in systems of interacting atoms or molecules where the absorption exceeds the simple sum of the absorption by the isolated atoms or molecules; see Frommhold (2006) and Finkenzeller and Volkamer (2022, and references therein). Since CIA does not involve a bound state, the term O4 might be misleading. However, this term is rooted in the MAX-DOAS community for which reason the notation O4 is used in the following to denote O2–O2 CIA. The absorption by O4 occurs proportionally to the square of the O2 concentration. Deviations from the O4 absorption against those for clear sky conditions thus indicate changes in atmospheric radiative transfer which allows the retrieval of properties of cloud and/or aerosol particles from such observations. This technique can be applied to remote sensing measurements of scattered sunlight performed by ground-based instruments, airborne platforms and satellites, e.g. Hönninger et al. (2004), Wagner et al. (2004, 2010), Wittrock et al. (2004), Frieß et al. (2006, 2016), Irie et al. (2008), and Prados-Roman et al. (2011).
Over a decade ago, Wagner et al. (2009) first reported inconsistencies between the measured atmospheric O4 absorption from Multi-AXis Differential Optical Absorption Spectroscopy (MAX-DOAS) observations and radiative transfer simulations. MAX-DOAS instruments measure scattered sunlight under various, mostly slant, elevation angles (Hönninger et al., 2004). To achieve agreement with the forward model simulations, Wagner et al. (2009) suggested applying a scaling factor (SF), where SF <1 , to the measured O4 slant column densities (SCDs). Similar findings were then reported by, e.g. Clémer et al. (2010), Vlemmix et al. (2015), Frieß et al. (2016) and Wagner et al. (2021), who all found best agreement for SFs between 0.75 and 0.9, while other studies (including direct sun measurements and aircraft measurements) did not see the necessity for an SF (e.g. Spinei et al., 2015; Ortega et al., 2016).
A more detailed overview and discussion can be found in Wagner et al. (2019). Since there is still no consensus in the community on whether or not an SF is appropriate, this ambiguity leads to substantial uncertainties in the aerosol results derived from MAX-DOAS measurements.
In this study, long-term long-path (LP-) DOAS observations are used to examine the O4 absorption at 360 nm. The spectra measured in the UV spectral range cover the wavelengths from approximately 327 to 395 nm; however, a shorter fit window from 352 to 387 nm was chosen here. Details on the data analysis are given in the next section.
The absorption band at 577 nm is not fully covered, leading to a less stable retrieval and thus was excluded from a more detailed investigation. The different analyses include the commonly used absorption cross-sections of Thalman and Volkamer (2013) as well as Finkenzeller and Volkamer (2022) at different temperatures. Figure 1 shows the respective cross-sections at 293 K and the wavelength range covered by the data.
While both Thalman and Volkamer (2013) and Finkenzeller and Volkamer (2022) use a similar experimental set-up of a cavity enhanced DOAS instrument, there are some improvements implemented for the more recent study optimising the optical components and thus the stability of the measurements. Moreover, pure oxygen was used instead of air mixtures to enhance the signal-to-noise considerably and allow the characterisation of weak absorption features. Both studies report that the peak cross-section increases and the band width decreases at colder temperatures. However, Finkenzeller and Volkamer (2022) observe an increase of the integral cross-section with temperature which was not seen by Thalman and Volkamer (2013). This deviating observation is probably due to the assumption that the absorption cross-section is zero in the minima between neighbouring absorption bands to approximate the baseline of the absorption cross-section in Thalman and Volkamer (2013) which is not applied in Finkenzeller and Volkamer (2022). It should be noted that the Thalman and Volkamer (2013) absorption cross-sections are recommended in the current HITRAN database (Karman et al., 2019; Gordon et al., 2022).
At first, differences between MAX-DOAS and LP-DOAS measurements are introduced to answer the question why LP-DOAS observations are well suited to further investigate the reported inconsistencies from MAX-DOAS studies. After the following description of the measurement set-up and analysis, the main part focuses on the comparison between measured and calculated O4 absorptions. Finally, the findings of this study are summarised and put into the context of previous and future work.
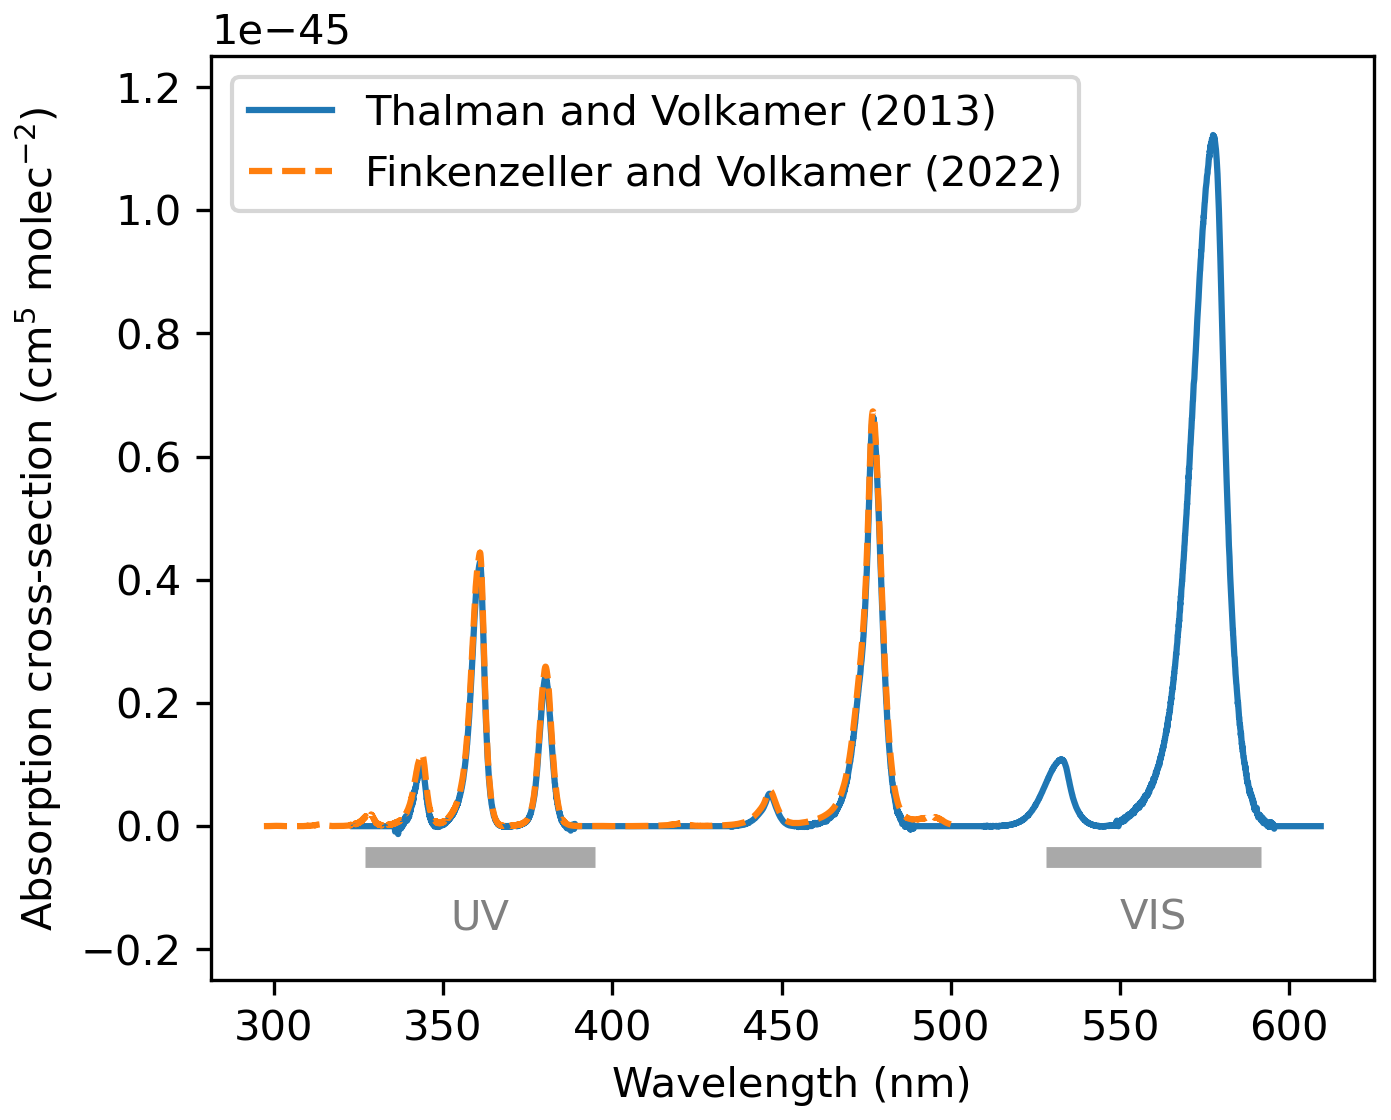
Figure 1O4 absorption cross-sections investigated in this study. The grey bars indicate the wavelength range measured by the LP-DOAS instrument. It should be noted that the absorption band at 477 nm is not covered and the absorption band at 577 nm is only partly covered by the measurements. The figure depicts the absorption cross-sections at 293 K.
2.1 Suitability for accurate atmospheric O4 absorption measurements
LP-DOAS belongs to the active DOAS applications (Perner et al., 1976; Perner and Platt, 1980; Platt and Perner, 1983) and is a well-established remote sensing technique. In contrast to passive systems which measure scattered sunlight, such as MAX-DOAS instruments, LP-DOAS instruments use artificial light sources, for example a xenon arc lamp or in more recent applications a laser driven light source. Thereby, continuous observations of trace gases are possible independent of natural light sources, i.e. also during night-time and in the deep UV. The most prominent advantage for the presented study is the well-defined light path of a LP-DOAS set-up. Along this light path, a mean trace gas concentration is determined. In MAX-DOAS analyses, the conversion from SCDs to concentrations always requires further processing steps including radiative transfer simulations and thus possibly leads to a higher uncertainty of the results. Especially at short wavelength, direct sun measurements, despite the well-defined light path (at high elevation angles), experience further difficulties such as small absorptions or substantial contributions of scattered sun light (at low elevation angles). Another benefit of LP-DOAS measurements is that the ambient temperature and pressure can be assumed constant along the given light path of a couple of kilometres at ground level, while this is not the case in MAX-DOAS retrievals or direct sun measurements, from which the atmospheric column density is derived considering vertical profiles of temperature and pressure. Nonetheless, the basis of the DOAS principle is applicable to both active and passive DOAS systems.
2.2 Instrument and measurement site
The LP-DOAS instrument used in this study was purpose-built for operation under polar conditions. Its observations complement the long-term measurements at the German research station Neumayer III, Antarctica, from January 2016 to August 2018. A detailed description of the instrument and its set-up can be found in Nasse (2019) and Nasse et al. (2019).
The LP-DOAS instrument couples light from a laser driven light source (EQ-99X) into a telescope located at the trace gas observatory of the Neumayer III station (Fig. 2) which creates a light beam that is transmitted through the atmosphere across a distance of 1.55 km to the closer reflector (Met retro), or to another retro-reflector at 2.95 km (Atka retro). Depending on the prevailing weather conditions, the amount of reflected light varies, and the light path can be chosen depending on the atmospheric conditions to optimise the amount of received light and the covered light path length. After reflection at one of the retro-reflector arrays, the light is received again by the same telescope, doubling the length of the light path. Spectra are then captured by an Acton 300i spectrometer using a holographic grating (1200 grooves per millimetre) with attached Andor DU440 BU charge-coupled device (CCD). This set-up allows for a spectral resolution of ca. 0.54 nm covering a spectral window of approximately 65 nm. The measured spectra have a temporal resolution of approximately 2 to 30 min and are analysed without filtering for specific measurement conditions based on the DOAS principle. Details of the analysis are given in the next section.
The measurement site exhibits an extraordinarily large temperature range exceeding −35 and +0 °C as can be seen in Fig. 3. Apart from seasonal variations, these temperatures are driven by the advection of air masses of different origin, depending on synoptic conditions. The annual cycle of surface pressure indicates the influence of large scale atmospheric patterns around the Antarctic continent (König-Langlo et al., 1998).
Given its remote location, the aerosol optical depth is often below 0.1 NASA-GSFC (see, e.g. respective site on the AERONET webpage, 2024) making the station an ideal location for this study. In particular, the majority of the measurements exhibit an only slightly attenuated signal after passing the atmospheric light path twice. This allows for long light paths and the concomitant strong O4 absorption offers a good signal-to-noise ratio.
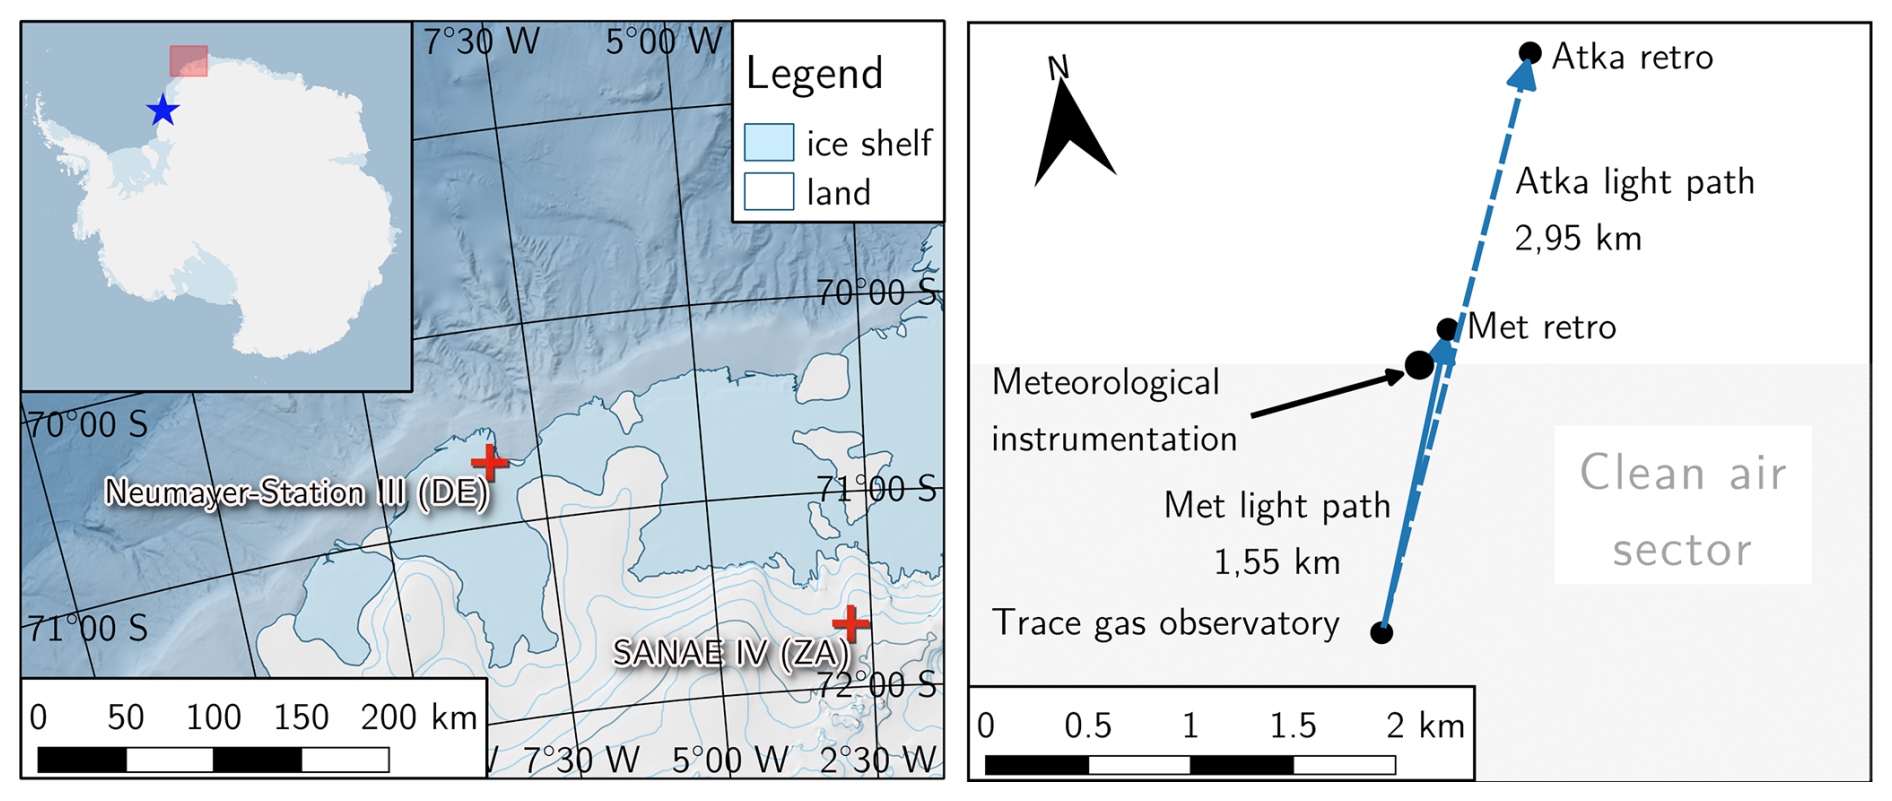
Figure 2Location of the Neumayer III station on the Ekström ice shelf (left) and overview of the installations in the vicinity of the station (right). The closest neighbouring station is the South African base SANAE IV about 225 km to the south-east, while the British station Halley VI (blue star) is the only other Antarctic station located on an ice shelf and about 800 km south-west of Neumayer III (Schiermeier, 2004). Taken from Nasse (2019).
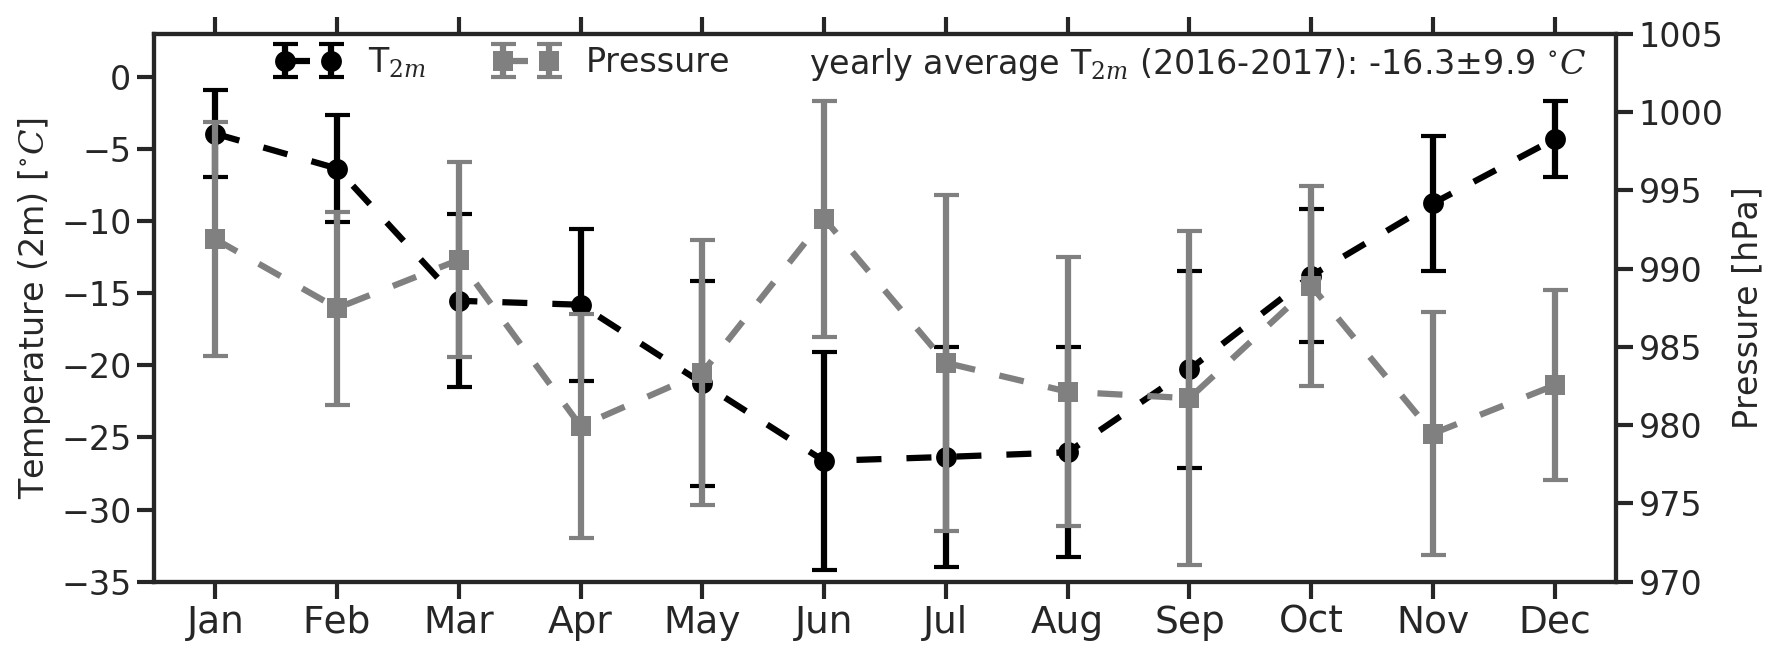
Figure 3Monthly averages of 2 m temperature and atmospheric pressure from 2016 to 2017 at the Neumayer III station. For details, see Nasse (2019). The whiskers indicate one standard deviation of the data. Taken from Nasse (2019).
2.3 Data analysis
Average trace gas concentrations along the light path can be retrieved for each measured spectrum by making use of the Beer–Lambert law. For atmospheric applications, this is commonly referred to as the DOAS approach (Platt and Stutz, 2008). In the study presented here, the spectral analysis of the obtained spectra is performed in HeiDOAS (v1.2). This newly developed Python-based library was programmed for the analysis of DOAS measurements and conducts the fit using a Levenberg–Marquardt algorithm (Levenberg, 1944; Marquardt, 1963) allowing for the commonly used parameters in DOAS analyses.
While MAX-DOAS applications usually use zenith measurements as a reference, the LP-DOAS instrument can measure an absorption-free spectrum of the light source by moving a reference plate into the light path and thereby creating a short-cut for the light, which does not traverse the atmosphere but enters the spectrograph directly. To determine and correct the influence of the atmospheric background as well as instrumental contributions of the dark current signal from the CCD and the electronic offset, regular background spectra are recorded in addition without the light source. The wavelength calibration is accomplished by determining the channel-to-wavelength attribution from measurements of emission line spectra of a mercury and a neon vapour lamp. These calibration spectra were recorded regularly throughout the measurement campaign and also allow the retrieval of the instrumental slit function needed for the convolution of the fitted absorption cross-sections.
The spectral resolution of the O4 absorption cross-sections range from 0.32 to 0.45 nm and 0.31 to 0.42 nm for Thalman and Volkamer (2013) and Finkenzeller and Volkamer (2022), respectively. Since the observed absorption features are 10 to 30 times wider and also the spectral resolution of the LP-DOAS (0.54 nm) is lower, the absorption cross-sections can be considered as “fully resolved” and are directly convolved with the respective instrument slit function.
After the preprocessing of the data, i.e. conducting the wavelength calibration and accounting for the background, the measured spectra are fitted according the DOAS fit settings listed in Table 1. In order to remove broad-band spectral features that are caused by the light source or the optical components and that can have characteristic shapes, a binomial high-pass filter and a low-order closure polynomial are applied. Different analyses are shown in the following, including one of the O4 absorption cross-sections listed in the table.
To account for quickly varying atmospheric conditions between the acquisition of the atmospheric spectrum and the respective background spectrum, an atmospheric background spectrum is also included in the DOAS fit which becomes important if the background correction cannot fully compensate for the background signal (Pöhler, 2010).
Figure 4 exemplarily shows a fit in the UV spectral range with the clearly visible O4 absorption. In contrast, in the visible spectral range the absorption band of the oxygen collision complex is not fully covered, leading to a less stable retrieval as can be seen from Fig. A1 in the appendix. Additionally, strong water vapour absorption features lead to higher residuals. Altogether, this demonstrates the challenges of LP-DOAS data analysis in the visible spectral range for which reason the following study focuses on the UV retrieval. Assuring good data quality, fits are filtered for a root-mean-square (RMS) of the residual of less than .
During the analysis, it was found that modifications of the applied binomial high-pass filter can influence the retrieved O4 column densities; this was thus studied more carefully. The variation of other fit settings, e.g. the choice of fitted cross-sections or in-/excluding an atmospheric background spectrum in the fit, has little effect compared to the choice of the high-pass filter.
Systematic differences of the measured spectra, e.g. arising from broad-band spectral variations caused by the reflectivity of the short-cut plate, require the application of a high-pass filter since the correction of the spectral features arising from these differences is hardly possible by the use of a polynomial only (Pöhler, 2010). Also, the cut-off frequency between narrow- and broad-band absorptions is well-defined by the width of the binomial kernel of the high-pass filter. Note that the filter is defined inversely, i.e. the smaller the width the stronger the filtering effect. For instance, the filters' full width at half maximum correspond to 2.5, 3.5 and 4.3 nm for the high-pass filters applying 4000, 8000 (standard) and 12 000 iterations, respectively, given the spectral dispersion of 68.7 nm to 2048 channels. The variation of the cut-off frequency leads to a relative difference in the retrieved O4 column densities well below 5 % and mainly an enhanced scatter of the values in case of a too strong filter (HP 4000) as can be seen from Fig. 5. The exact choice of the high-pass filter settings has consequently no discernible effect on the results of the comparison between the measured and calculated O4 concentrations which is introduced and discussed in the following.
(228 K; Wilmouth et al., 1999)(294 K; Vandaele et al., 1998)(243 K; Serdyuchenko et al., 2014)Thalman and Volkamer, 2013Finkenzeller and Volkamer, 2022Table 1DOAS fit settings for the “standard” analysis in the UV spectral range. Different analyses will be shown in the following, including one of the O4 absorption cross-sections listed in the table.
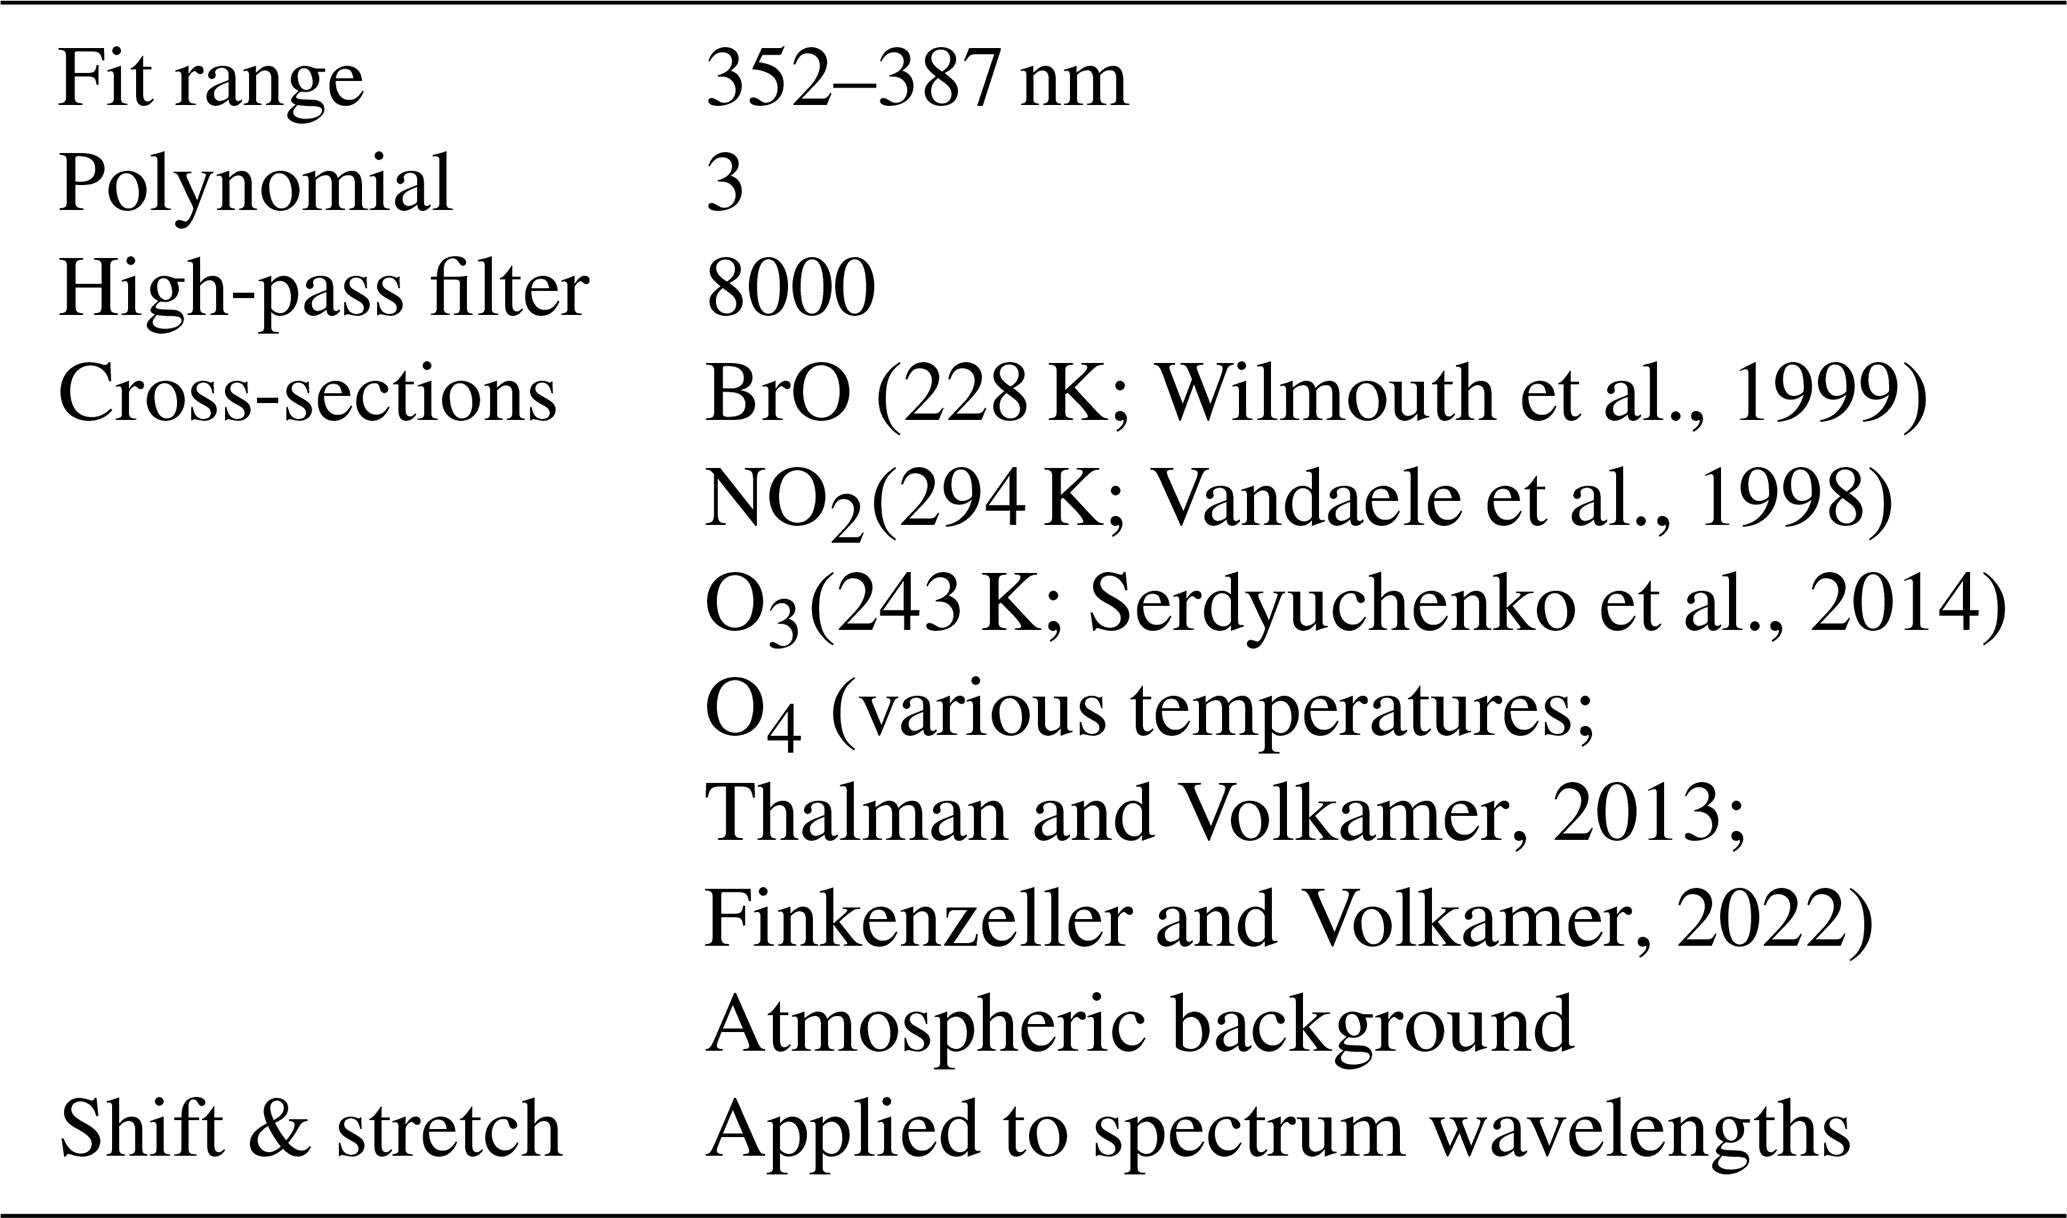
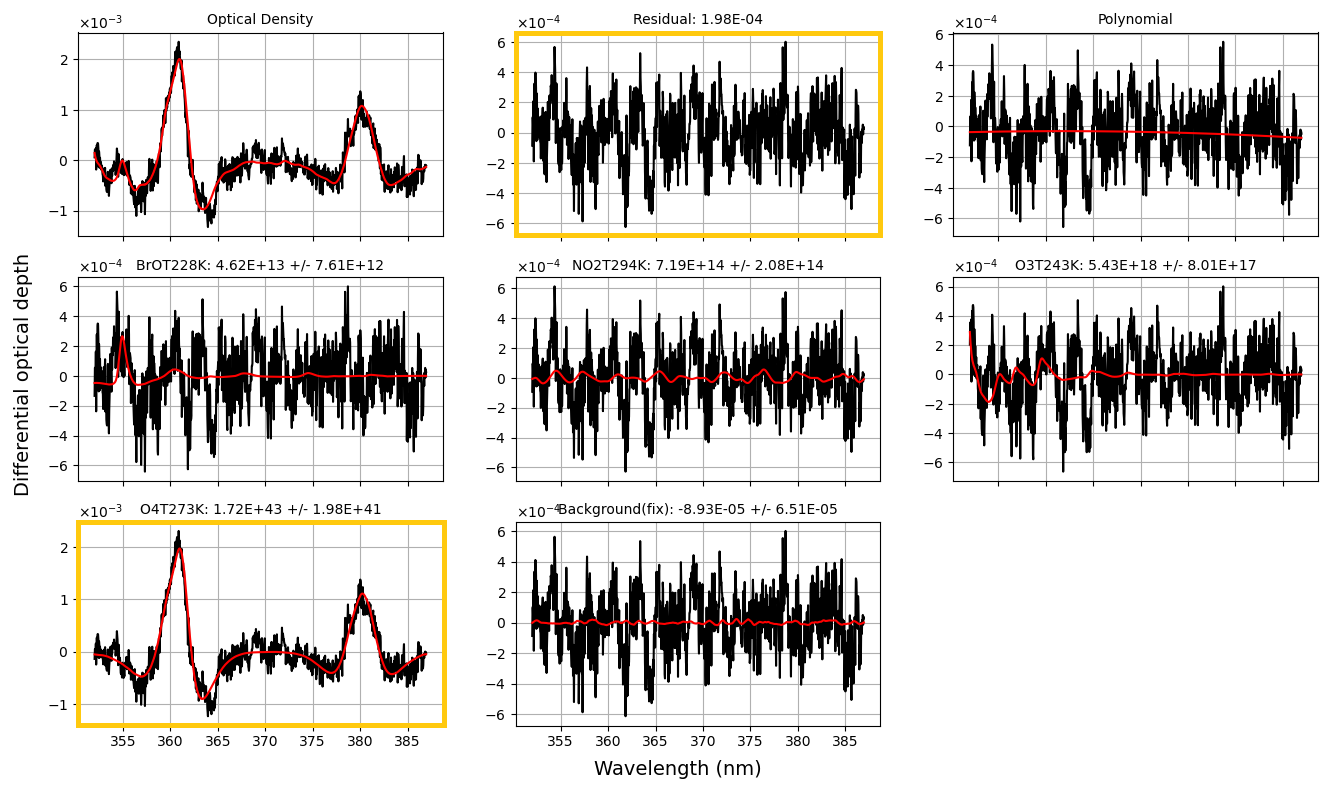
Figure 4Example fit in the UV for the standard fit settings as given in Table 1, using the O4 absorption cross-section at 273 K from Thalman and Volkamer (2013). The optical density panel depicts the logarithm of the high-pass filtered ratio of measured atmospheric spectrum and its respective reference, i.e. short-cut spectrum. The residual as well as the fitted O4 are highlighted by the yellow frames. The remaining panels show the other fitted cross-sections as given in the title (red) and the fit plus residuum (black). The titles additionally name the temperature at which each absorption cross-section was measured and the retrieved column density in molec cm−2 (in the case of O4: molec2 cm−5).
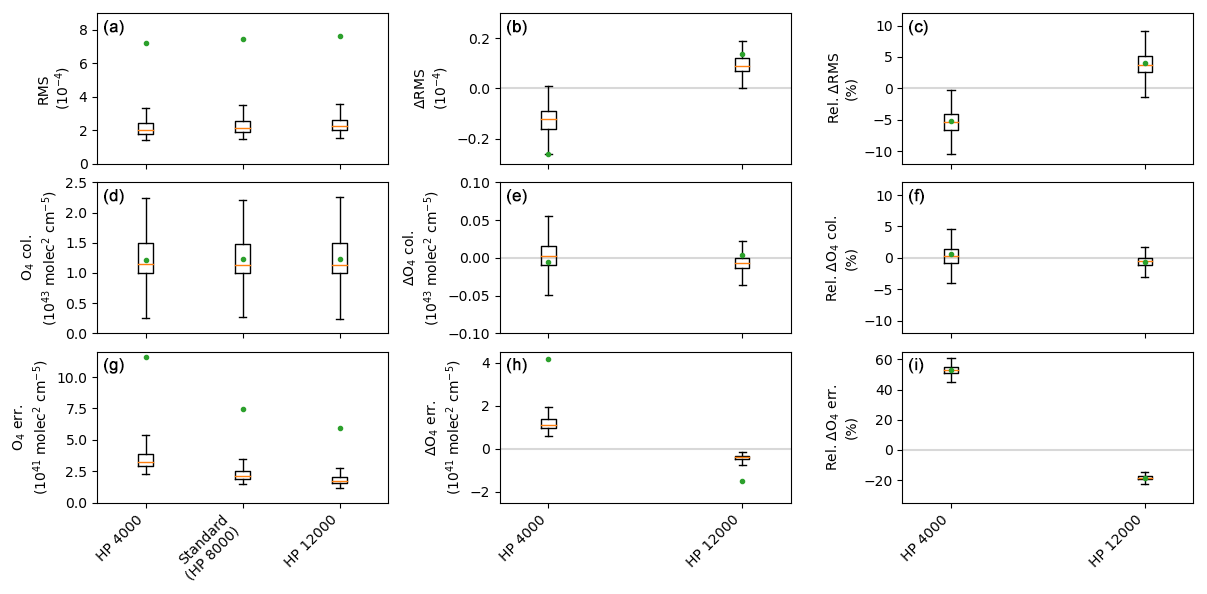
Figure 5RMS, retrieved O4 column and fit error in box-whisker-plots for the standard fit settings as given in Table 1, using the O4 absorption cross-section at 273 K from Thalman and Volkamer (2013), as well as fit settings with a high-pass filter (HP) of 12 000 and 4000 iterations as indicated in the label (a, d, g). Absolute and relative differences to the standard retrieval are shown for all three quantities in the middle (b, e, h) and right column (c, f, i), respectively. Each box extends from the lower to upper quartile values of the data (interquartile range, IQR), with an orange line at the median. The mean value is represented by a green dot. The whiskers extend to 1.5 × IQR from the edges of the box, ending at the farthest data point within that interval.
3.1 Set-up of the comparison study
First, the measured O4 column densities are converted into O4 concentrations by dividing by the light path length which can easily be done since the light path for LP-DOAS measurements is well-defined. Given the fact that the O4 concentration is proportional to the square of the O2 concentration in the atmosphere, the expected O4 concentrations can be computed via the ideal gas law,
where p is the pressure, V the volume, N the number of particles, kB the Boltzmann constant and T the temperature. Rearranging the formula yields the O4 concentration,
Since the equilibrium constant (2O2↔ O4) is unknown, the unit of the O4 “concentration” is molec2 cm−6. However, the common O4 absorption cross-sections are scaled accordingly such that a direct comparison to the squared O2 concentration is possible. The expected O4 concentration is then calculated for each time of a spectral measurement by inserting the respective pressure and temperature values from the meteorological long-term observations at the measurement site (Schmithüsen, 2023). The meteorological data feature a higher temporal resolution (1 min) than the one of the LP-DOAS data (2 to 30 min), for which reason the meteorological data was interpolated on to the time grid of the spectra for which the midst of the integration time is reported. It should be noted that considering humidity in the above equation leads to negligible differences in the calculated O4 concentrations, which are more than an order of magnitude smaller than the observed deviations from the measured O4 concentrations.
Figure 6 shows the correlation of measured and calculated O4 concentrations for the complete data set covering data from January 2016 to August 2018 and a temperature range of more than 35 K. In total, more than 69 000 spectra were analysed. The DOAS analysis was carried out with the fit settings as listed in Table 1 in the UV spectral range using the Thalman and Volkamer (2013) absorption cross-section at 253 K. Assuming that best agreement is found for an ambient temperature of the O4 absorption cross-section, i.e. in this case at 253 K, a range of O4 concentrations can be calculated for this fixed temperature and considering the highest and lowest pressure values observed during the measurement period. For this range, best agreement between measured and calculated values is expected as indicated by the grey bar. However, mostly slight underestimations of the measured O4 concentrations compared to the computed ones are observed within the shaded area. Generally, the retrieval yields too low O4 values at higher temperatures and too high O4 values at lower temperatures indicating the importance of the temperature dependence of the O4 absorption.
To investigate the temperature dependence of the cross-sections, analyses are done not only with the Thalman and Volkamer (2013) absorption cross-section at 253 K but also other available temperatures as well as the newer absorption cross-sections by Finkenzeller and Volkamer (2022). The corresponding results are summarised in Figs. A2 and A3 in the appendix, respectively.
It can be seen that the usage of the Thalman and Volkamer (2013) absorption cross-section at 233 K yields too low O4 concentrations even for temperatures around 233 K (compare grey bar, upper left plot in Fig. A2). For the absorption cross-sections at 273 K and 293 K, good agreement for measurements at the respective temperatures is found. Overall, the O4 absorption cross-sections by Thalman and Volkamer (2013) show a nonlinear temperature dependence with larger deviations for low-temperature cross-sections.
This finding is in accordance to the change of the spectral bands' shapes, or, in other words the decrease of the peak values of the O4 absorption cross-sections with temperature, which are particularly important to DOAS observations, while the integrated absorption cross-sections remain independent of temperature in the case of the Thalman and Volkamer (2013) absorption cross-sections. Note, however, that Finkenzeller and Volkamer (2022) found a temperature sensitivity of the integral cross-sections given the different approach to derive the spectrum baseline which is in line with stronger induced dipoles and thus greater absorption.
Nonetheless, similar results are obtained for the analyses including Finkenzeller and Volkamer (2022) absorption cross-sections shown in Fig. A3. Here, the temperature dependence of the cross-sections seems to be weaker and especially at low temperatures a better agreement with the calculated O4 concentrations is observed.
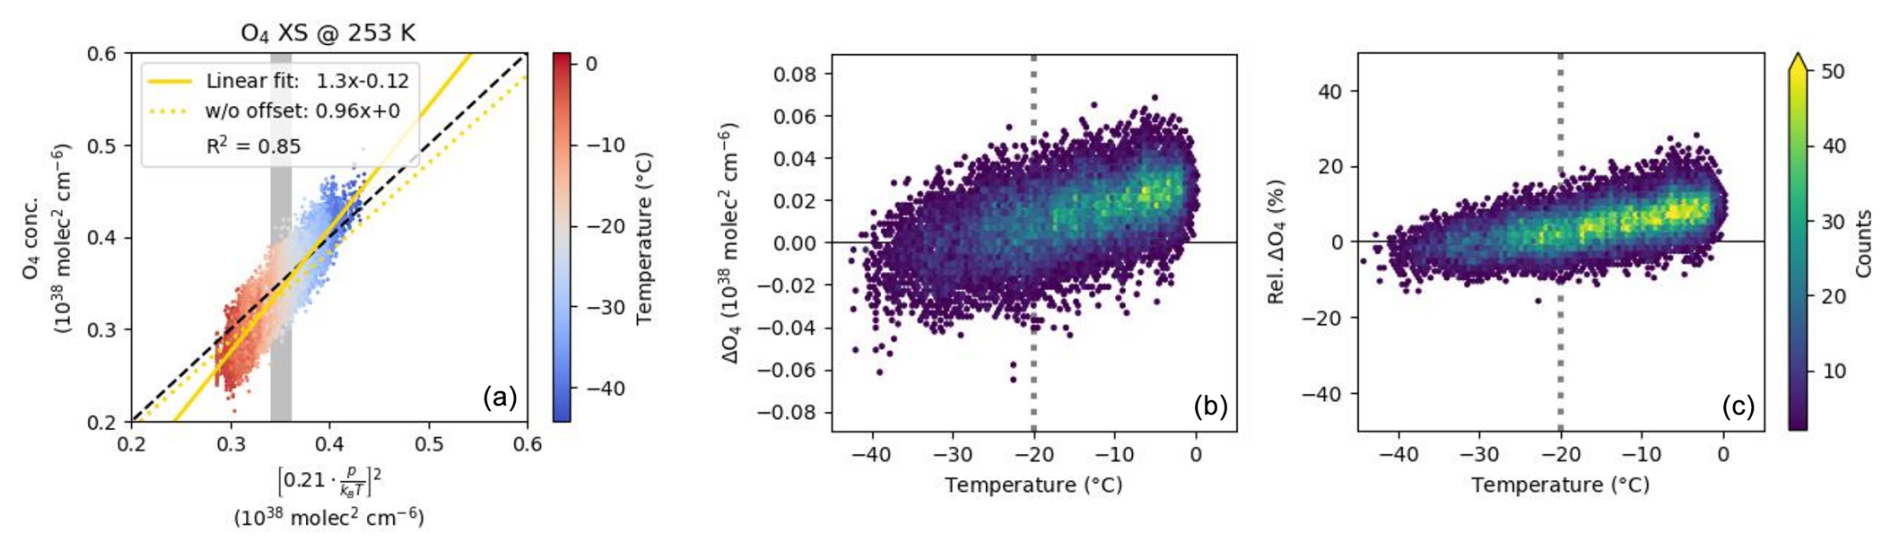
Figure 6Correlation of measured O4 concentrations using a fixed absorption cross-section (from Thalman and Volkamer, 2013, at 253 K, corresponding to −20 °C) (ordinate) to O4 concentrations calculated from ambient temperature and pressure (abscissa) (a). Details on the retrieval and calculation are given in the main text. The grey bar indicates the range where for the chosen cross-section at 253 K best agreement between measured and calculated values is expected. Fit parameters of a linear fit with and without (w/o) intercept as well as the correlation coefficient are given in the legend. Data points are colour-coded for the respective temperature during the measurement. The middle and right panels show the absolute (b) and relative difference (c) between the measured and calculated O4 concentration with regard to temperature, respectively. The dashed vertical line indicates the temperature of the used O4 absorption cross-section.
In general, identical results are found for both O4 absorption cross-sections at 293 K from Thalman and Volkamer (2013) and from Finkenzeller and Volkamer (2022) (compare lowermost panels in Figs. A2 and A3), respectively.
All in all, these results indicate a good agreement between measured and calculated O4 concentrations for LP-DOAS measurements in the UV spectral range. However, some deviations at ambient temperatures other than those corresponding to the temperature of the used absorption cross-section are found. To eliminate these, an interpolated O4 absorption cross-section could be used as is detailed in the next section.
3.2 Usage of interpolated O4 absorption cross-sections
The advantage of LP-DOAS observations with collocated temperature measurements is the exact knowledge of the ambient temperature for each spectrum acquisition. Thus, the best matching O4 absorption cross-section can be chosen individually for each spectrum during the DOAS retrieval. However, the absorption cross-sections are only available for a few specific temperatures (at 203, 233, 253, 273 and 293 K for Thalman and Volkamer, 2013; 223, 263 and 293 K for Finkenzeller and Volkamer, 2022). In order to match a given temperature, the set of available cross-sections is linearly interpolated to fit the required temperature. This newly calculated interpolated O4 absorption cross-section is then used in the DOAS fit. Note that the results remain the same for quadratically interpolated cross-sections.
This approach differs from other studies where two absorption cross-sections of the same trace gas species but at different temperatures are included in the DOAS fit to compensate for temperature dependencies (e.g. Spinei et al., 2015).
Using these interpolated O4 absorption cross-sections leads to a clear improvement in the comparison between measured and computed O4 concentrations for the Thalman and Volkamer (2013) as well as Finkenzeller and Volkamer (2022) cross-sections. The results are shown in Figs. 7 and 8, respectively. As already noted, largest discrepancies exist for the Thalman and Volkamer (2013) version at low ambient temperatures (below ca. −25 °C) indicating that the peak values of the O4 absorption cross-section at low temperatures are too large. In contrast, the interpolated version of Finkenzeller and Volkamer (2022) cross-sections shows nearly perfect agreement for the entire temperature range with a median difference of only 0.006×1038 molec2 cm−5 (or in relative terms 2 %) and a slope of the data close to unity (compare golden lines in Fig. 8).
This demonstrates the consistency between the O4 absorption cross-sections from Finkenzeller and Volkamer (2022) measured under laboratory conditions and real atmospheric measurements.
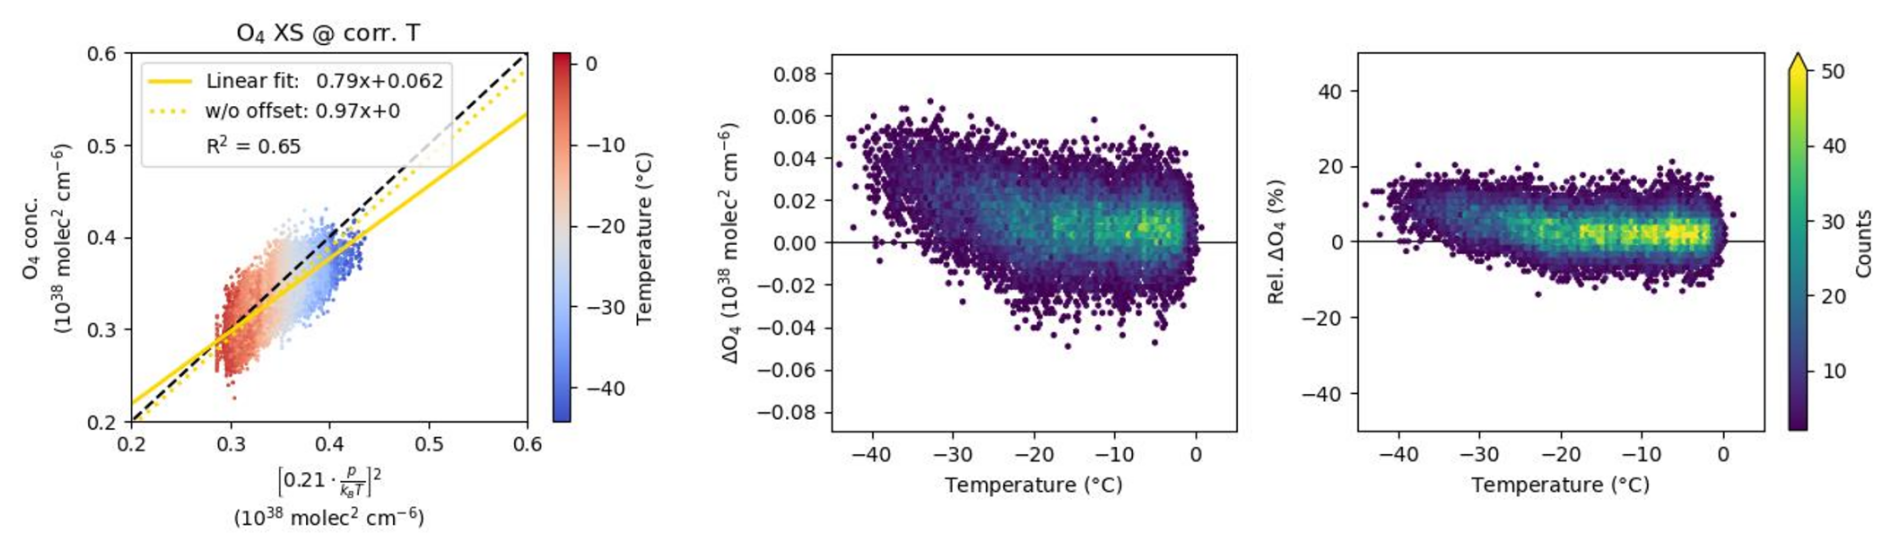
Figure 7Correlation of measured O4 concentrations using an interpolated absorption cross-section based on all Thalman and Volkamer (2013) cross-sections to calculated O4 concentrations. Details on the retrieval and calculation are given in the main text. For the plot description, see Fig. 6.
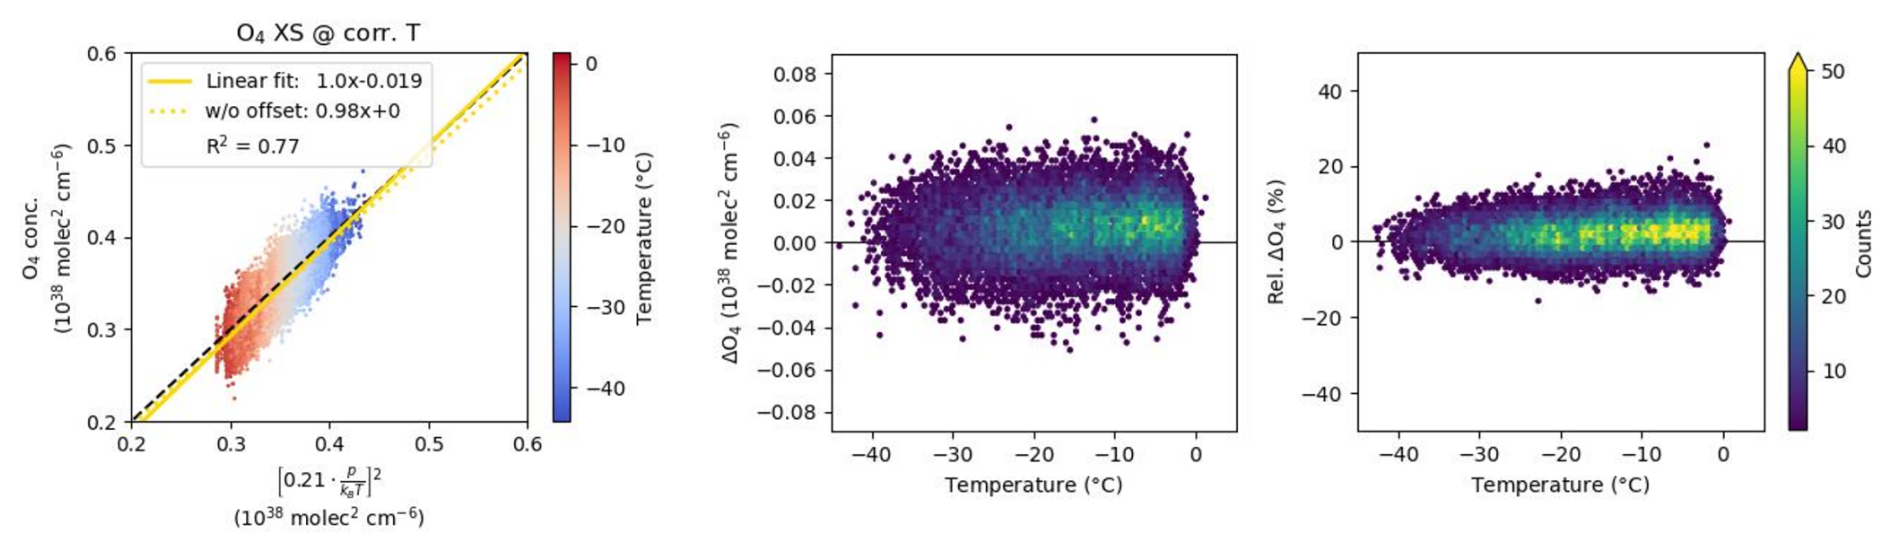
Figure 8Correlation of measured O4 concentrations using an interpolated absorption cross-section based on all Finkenzeller and Volkamer (2022) cross-sections to calculated O4 concentrations. Details on the retrieval and calculation are given in the main text. For the plot description, see Fig. 6.
The comparison of measured and calculated O4 concentrations shows a good agreement of the O4 absorption from atmospheric LP-DOAS observations with the commonly used O4 absorption cross-sections measured under laboratory conditions when properly accounting for the temperature dependence of the O4 absorption. Thereby, the DOAS analysis was run for the spectral range from 352 to 387 nm covering the strong absorption band at 360 nm. Best agreement was found for the recently published O4 absorption cross-sections of Finkenzeller and Volkamer (2022) and the approach of an interpolated O4 absorption cross-section fitting to the ambient temperature of the measurements. The retrieval using the Thalman and Volkamer (2013) absorption cross-sections shows larger than calculated O4 concentrations at low temperatures (below ca. −25 °C). Overall, deviations between the measured and calculated O4 concentrations are well below 20 % (mean: 7 %–9 %, median: 2 %–3 %) and indicate little to no bias (apart from the Thalman and Volkamer, 2013, cross-sections at cold temperatures).
Therefore, the small discrepancies from perfect agreement seen is this study are too small to explain the issues seen in MAX-DOAS studies. Moreover, the differences of measured and calculated O4 concentrations at cold temperatures have the opposite sign to the effects that lead to the O4 SF. Deviations of measured and simulated O4 absorptions were mainly reported in the UV, but also in the visible spectral range (see, e.g. references in Wagner et al., 2019). Hence, similar LP-DOAS measurements in the visible spectral range are needed to test the O4 absorption cross-sections under ambient conditions.
This study shows that the need for an SF in MAX-DOAS profile inversions is not caused by a possible systematic error of the available O4 absorption cross-sections, but leaves the problem of the O4 SF yet unresolved. Many other hypotheses have already been tested, e.g. in Wagner et al. (2019, 2021). These studies included the investigation of the temperature dependence of the O4 absorption and temperature variations along the light path of MAX-DOAS measurements, but concluded that this alone cannot explain the observed discrepancies.
Therefore, further work is needed to understand why an O4 SF becomes necessary in some MAX-DOAS retrievals, while this is not the case for LP-DOAS data. It should include a direct comparison of LP-DOAS and MAX-DOAS observations at the Neumayer III station, which was, however, beyond the scope of this study. Also, additional LP-DOAS measurements covering the 477 nm absorption band as well as an improved retrieval for spectra in the visible spectral range could help to enhance the understanding of the O4 SF. Finally, it should be considered to repeat some of the previous studies with the newer O4 absorption cross-sections of Finkenzeller and Volkamer (2022).
Table A1DOAS fit settings for the analysis in the visible spectral range.
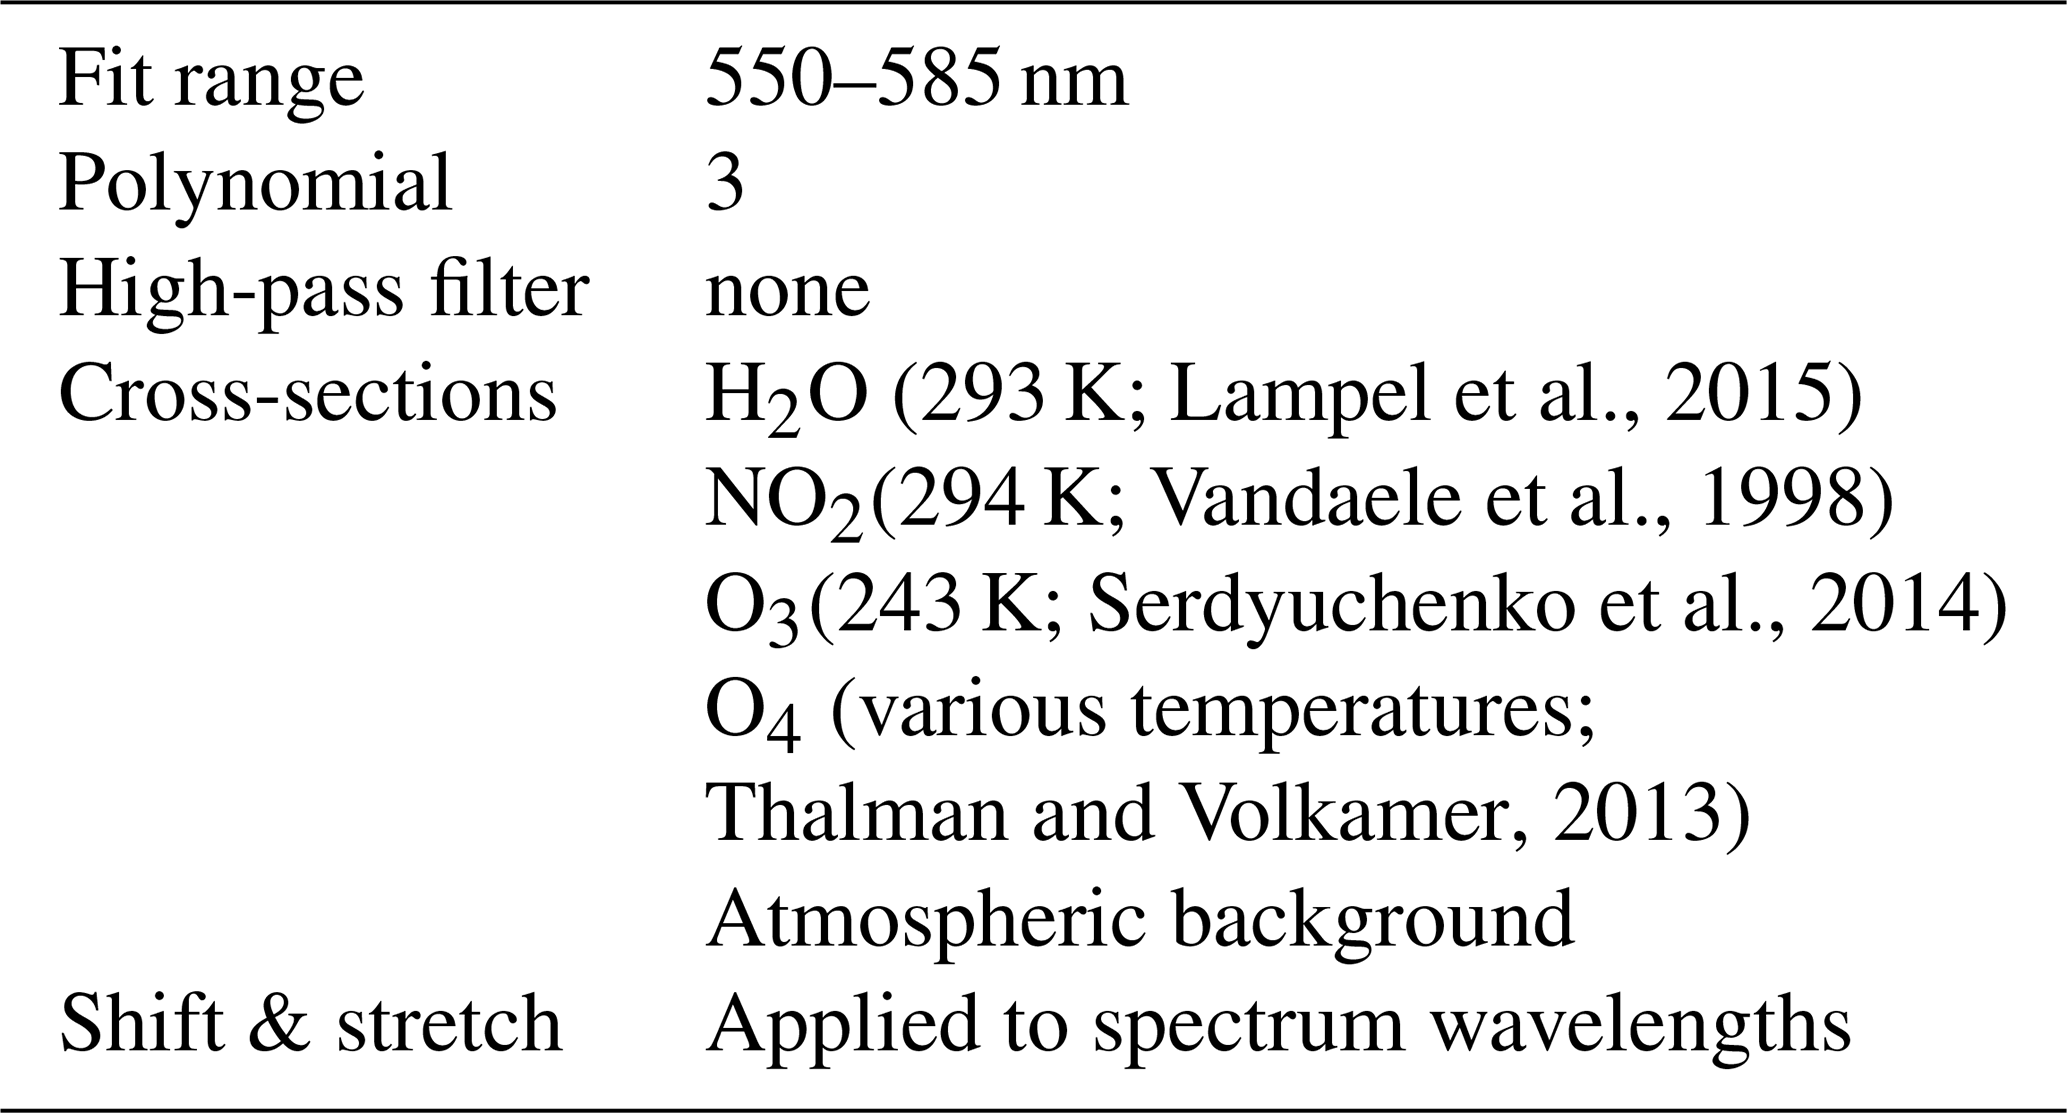
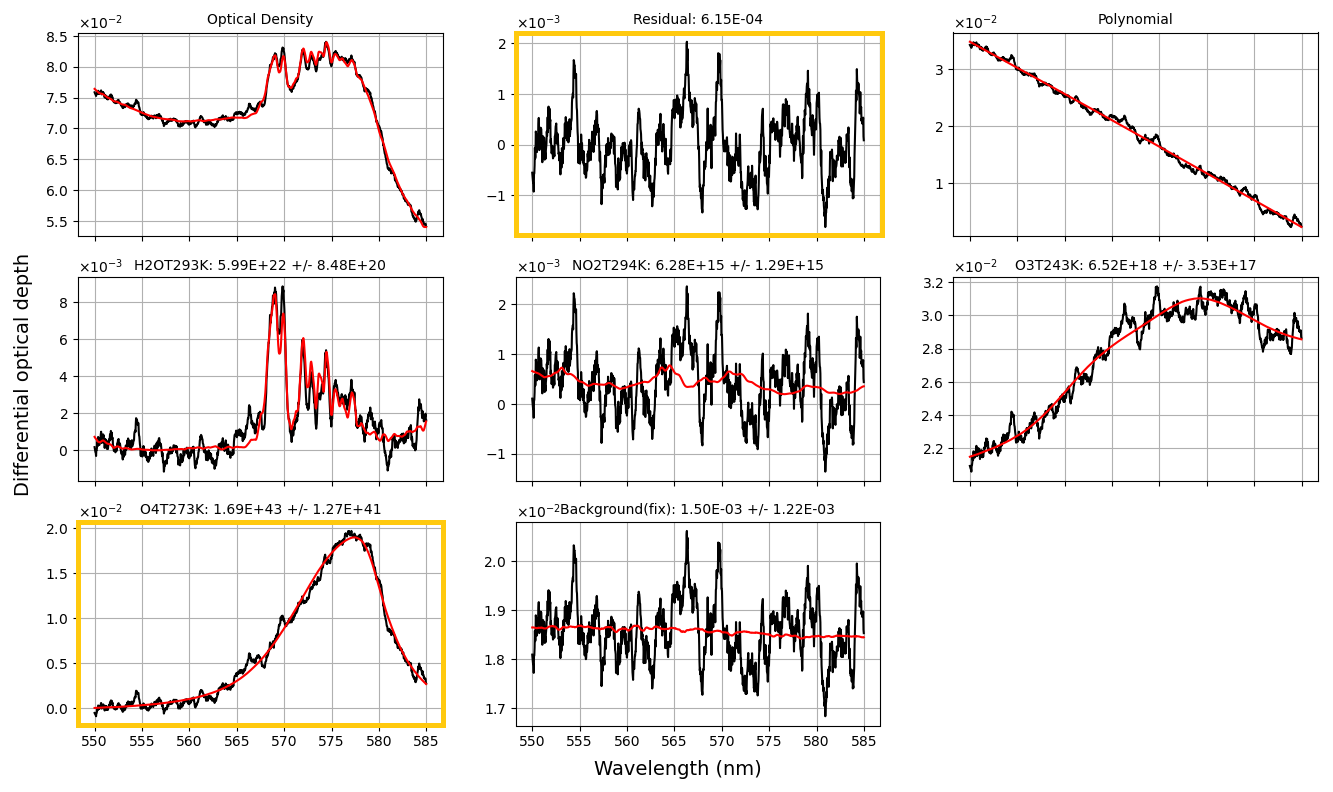
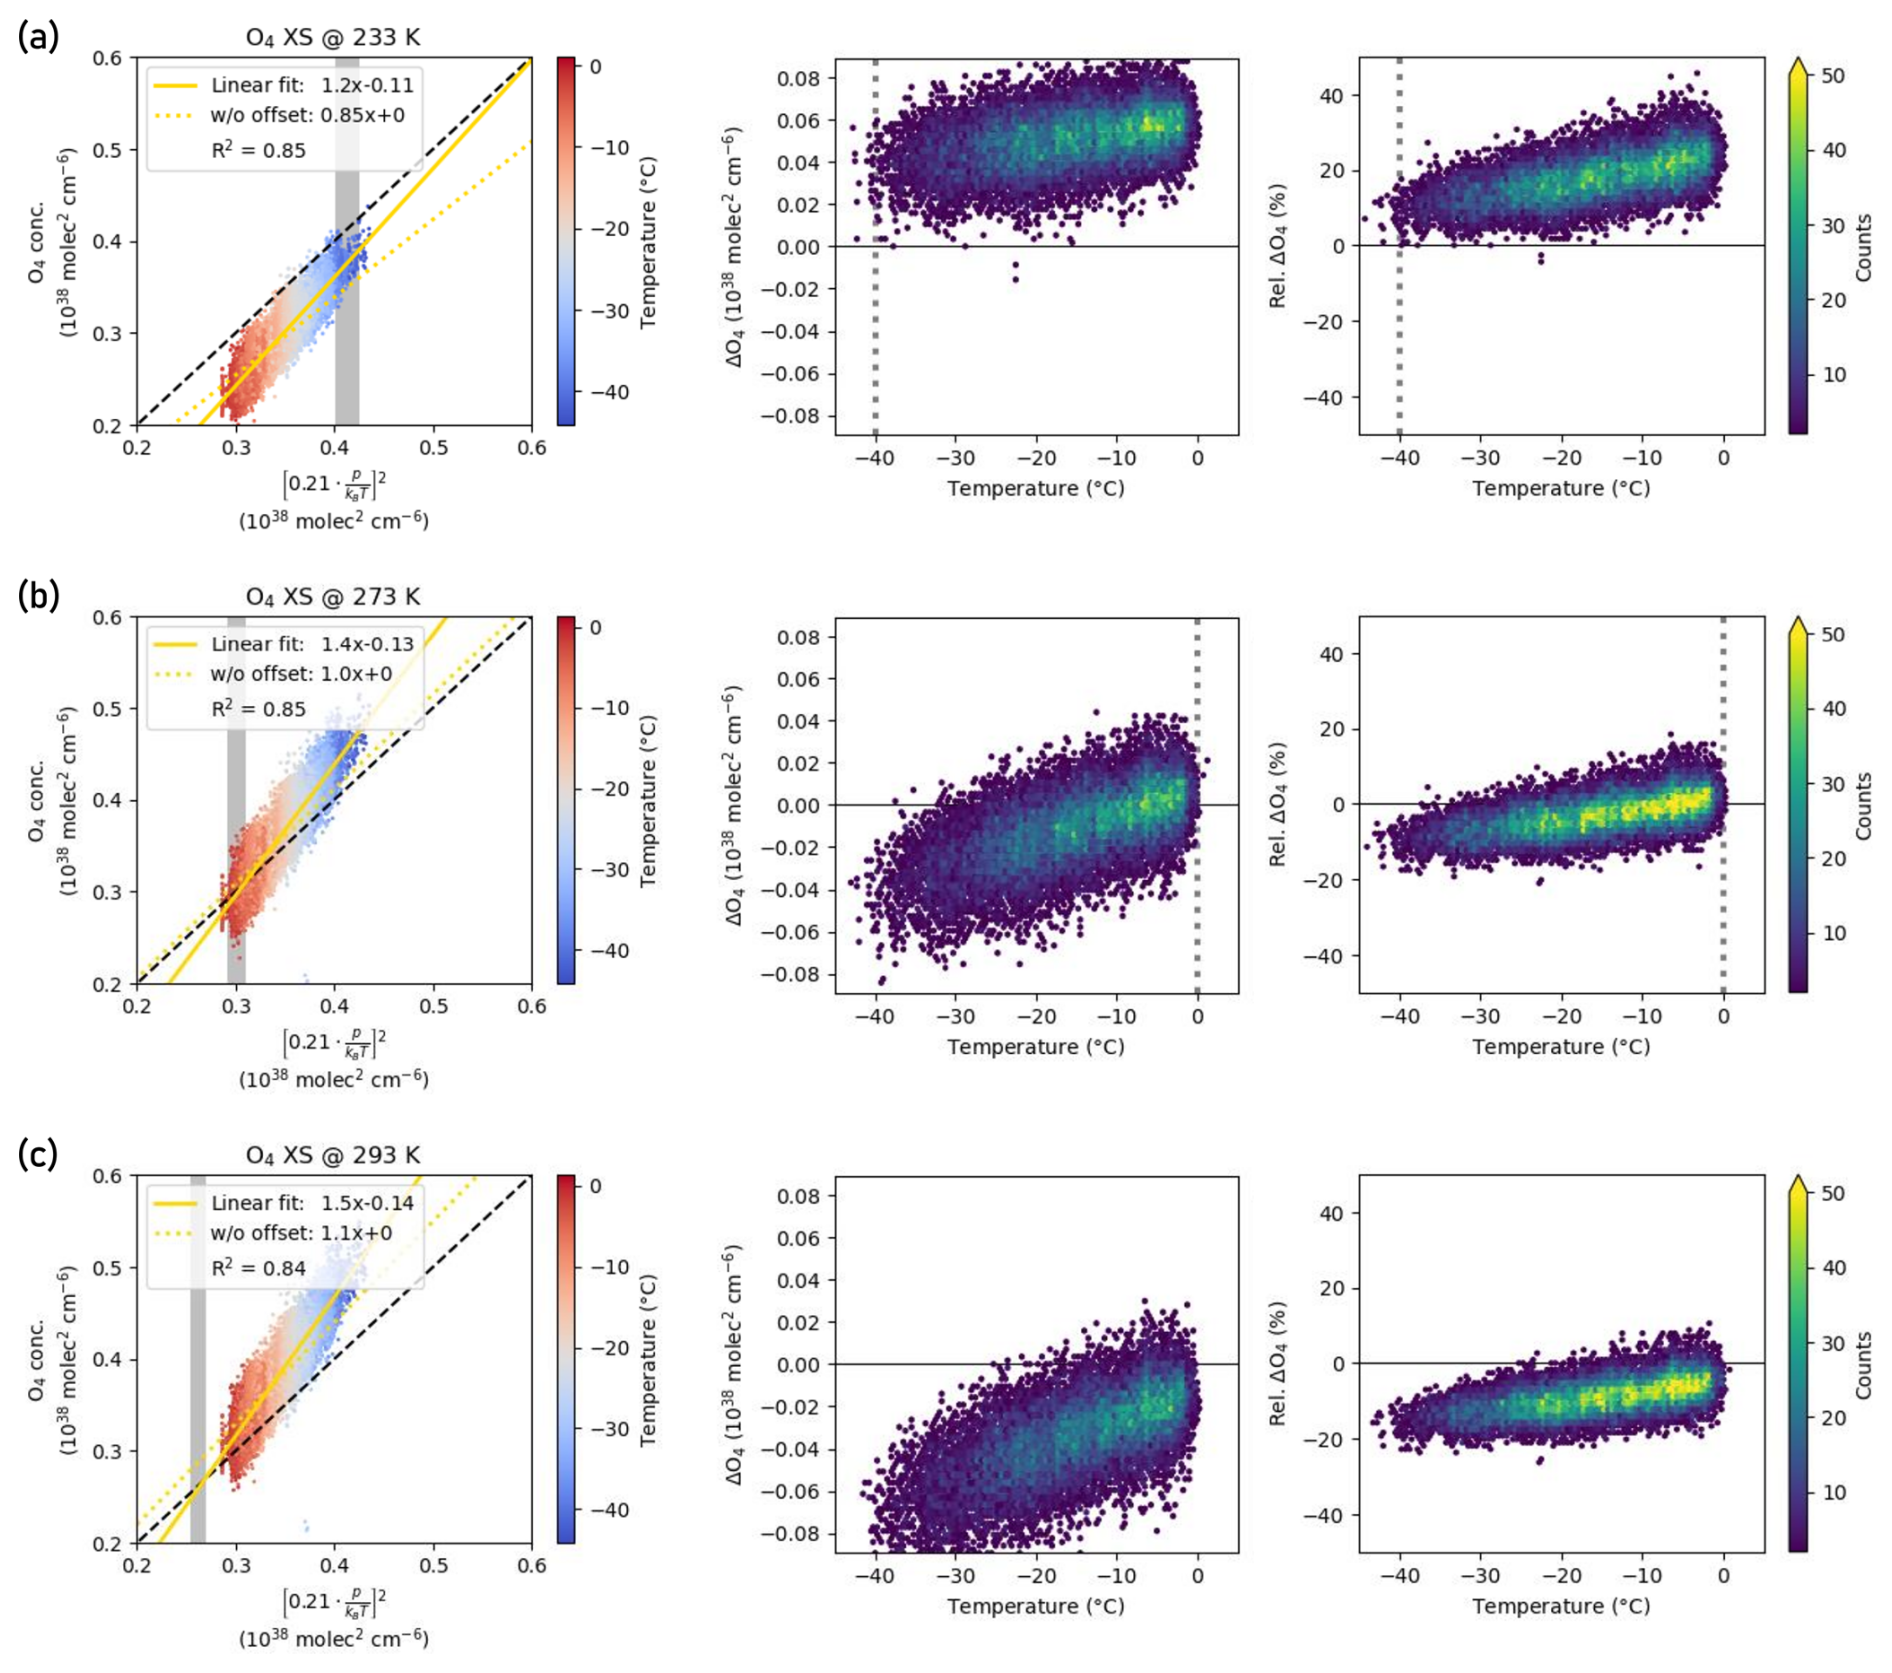
Figure A2Same as Fig. 6 but for the Thalman and Volkamer (2013) absorption cross-sections at 233 K (a), 273 K (b) and 293 K (c).
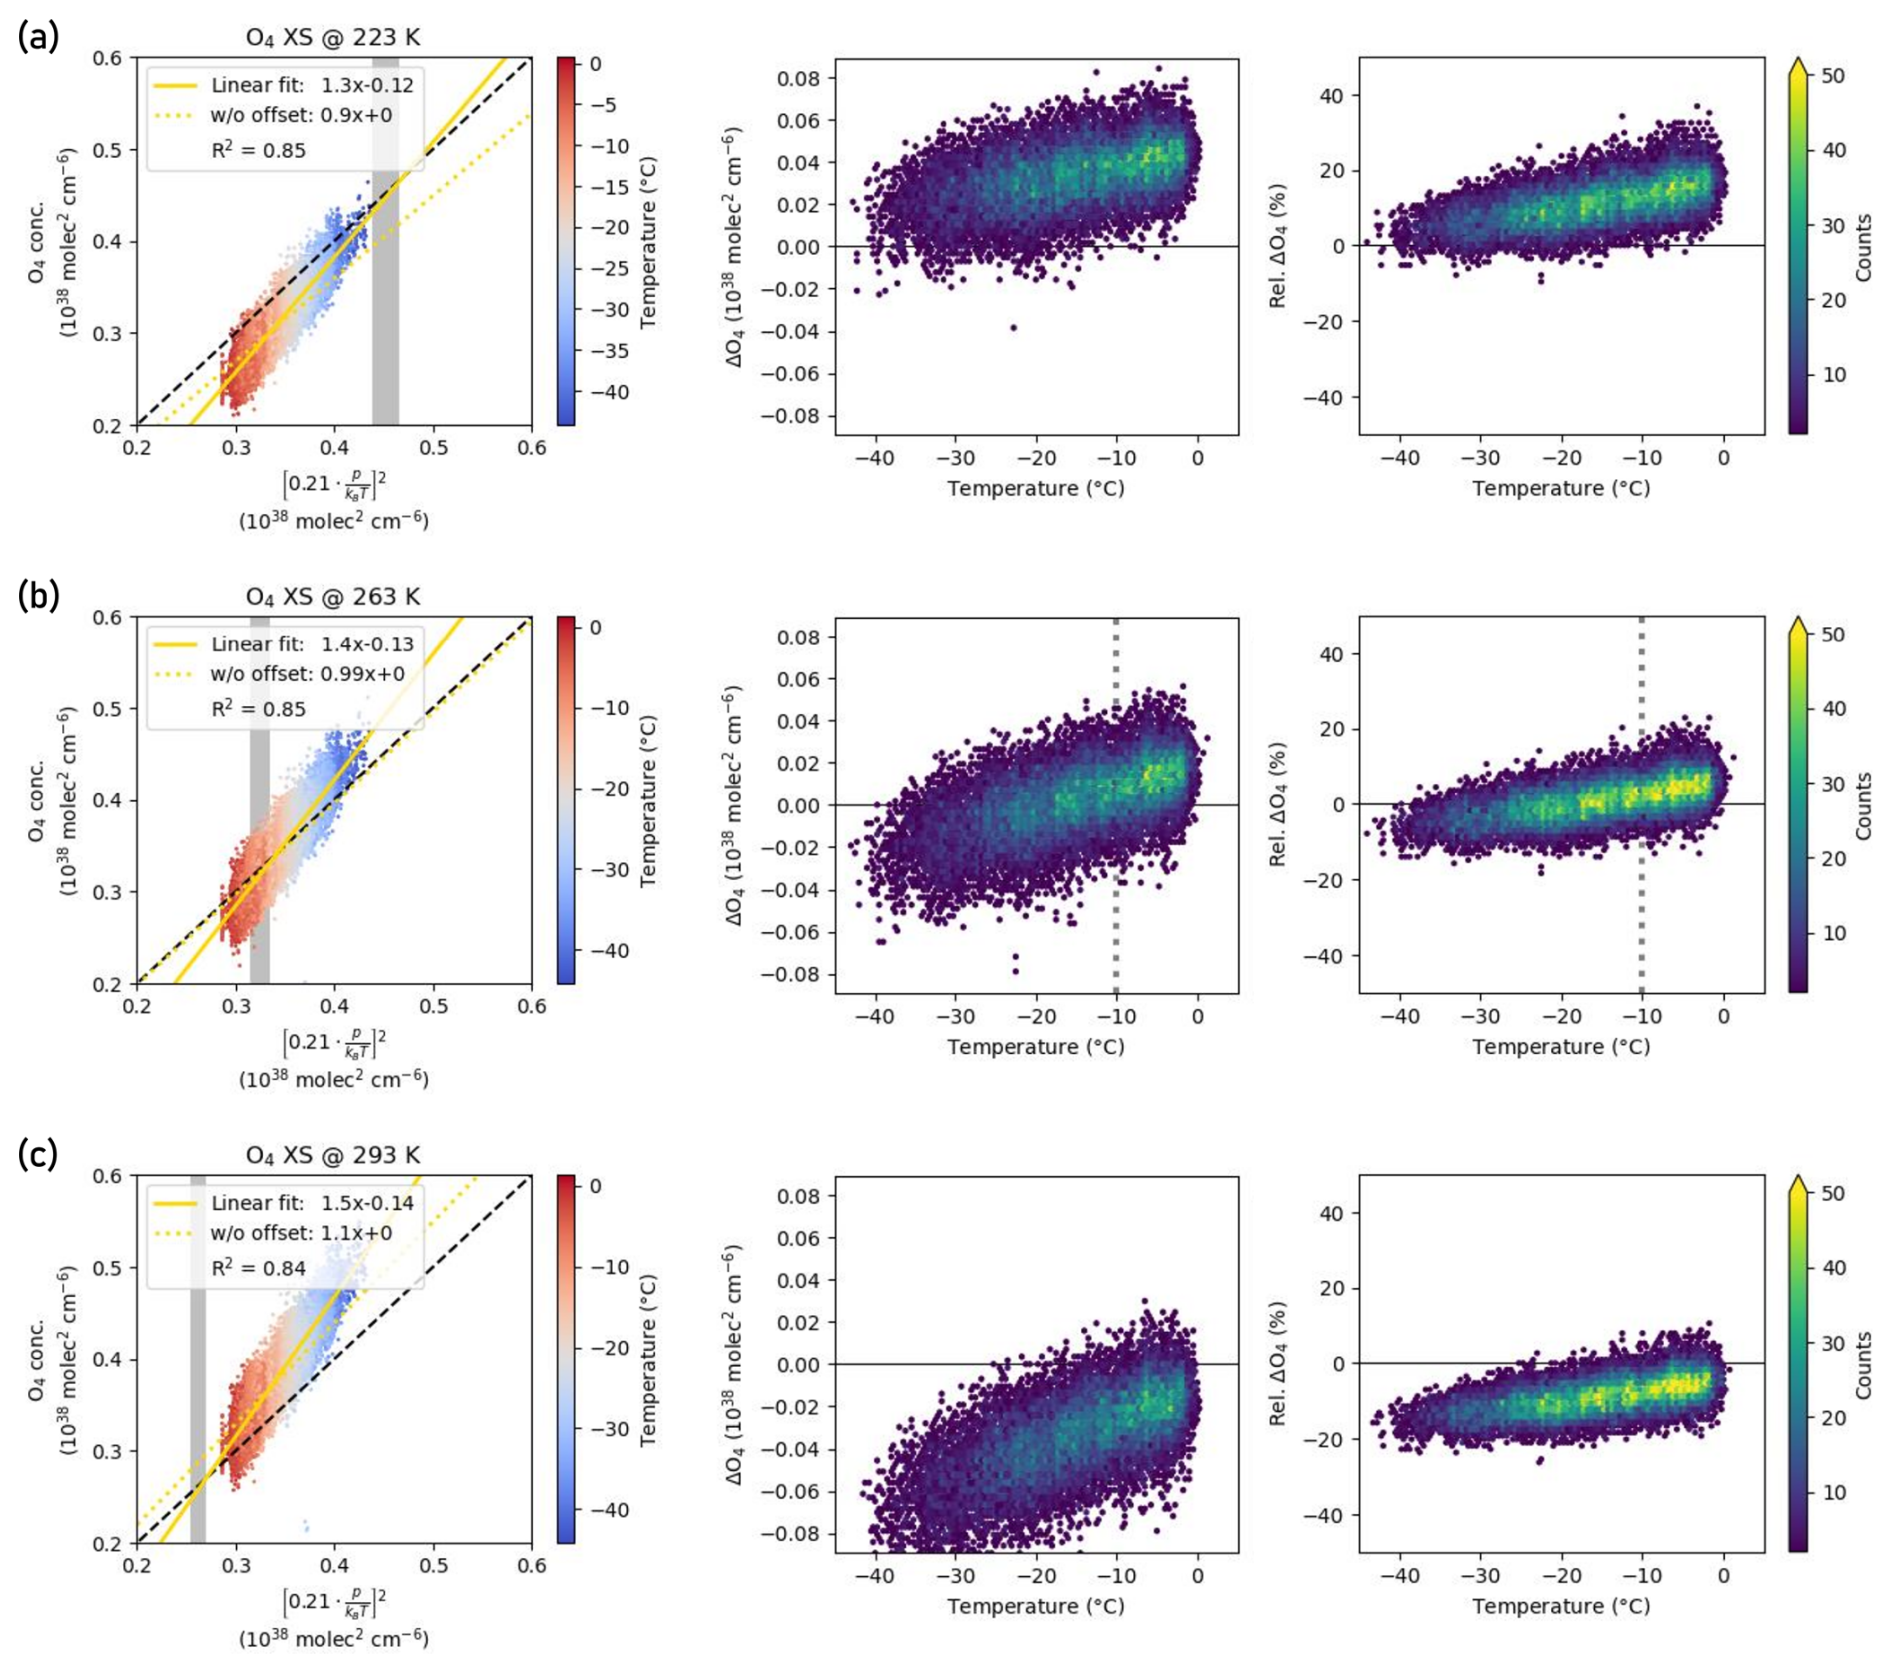
Figure A3Same as Fig. 6 but for the Finkenzeller and Volkamer (2022) absorption cross-sections at 223 K (a), 263 K (b) and 293 K (c).
LP-DOAS data and analysis software are available upon request from the corresponding author. The meteorological data are accessible online at https://doi.org/10.1594/PANGAEA.962313 (Schmithüsen, 2022).
BL and TW designed the study. BL ran the data analysis with support by UF and interpreted the results together with TW, UP and UF. JN and UF designed the LP-DOAS instrument and performed the measurements in Antarctica. UF developed the HeiDOAS analysis software. BL prepared the manuscript with contributions from all co-authors.
At least one of the (co-)authors is a member of the editorial board of Atmospheric Measurement Techniques. The peer-review process was guided by an independent editor, and the authors also have no other competing interests to declare.
Publisher’s note: Copernicus Publications remains neutral with regard to jurisdictional claims made in the text, published maps, institutional affiliations, or any other geographical representation in this paper. While Copernicus Publications makes every effort to include appropriate place names, the final responsibility lies with the authors.
We acknowledge the workshop of IUP Heidelberg and all involved people for the thorough construction of the LP-DOAS instrument. Special thanks go to Denis Pöhler and Stefan Schmitt who were involved in the planning, design and set-up of the LP-DOAS instrument. Furthermore, we thank Rolf Weller and colleagues of the Alfred Wegener Institute that made it possible to acquire this data set at the Antarctic research station Neumayer III. In particular, we acknowledge the air chemists Thomas Schaefer, Zsòfia Jurànyi and Helene Hoffmann as well as the entire 36th, 37th and 38th wintering crews that stayed at the Neumayer station and kept the LP-DOAS running throughout all weather conditions.
This research has been supported by the Deutsche Forschungsgemeinschaft (grant no. FR 2497/3-2).
The article processing charges for this open-access publication were covered by the Max Planck Society.
This paper was edited by Michel Van Roozendael and reviewed by Henning Finkenzeller and two anonymous referees.
Clémer, K., Van Roozendael, M., Fayt, C., Hendrick, F., Hermans, C., Pinardi, G., Spurr, R., Wang, P., and De Mazière, M.: Multiple wavelength retrieval of tropospheric aerosol optical properties from MAXDOAS measurements in Beijing, Atmos. Meas. Tech., 3, 863–878, https://doi.org/10.5194/amt-3-863-2010, 2010. a
Finkenzeller, H. and Volkamer, R.: O2–O2 CIA in the gas phase: Cross-section of weak bands, and continuum absorption between 297–500 nm, J. Quant. Spectrosc. Ra., 279, 108063, https://doi.org/10.1016/j.jqsrt.2021.108063, 2022. a, b, c, d, e, f, g, h, i, j, k, l, m, n, o, p, q, r, s, t
Frieß, U., Monks, P. S., Remedios, J. J., Rozanov, A., Sinreich, R., Wagner, T., and Platt, U.: MAX‐DOAS O4 measurements: A new technique to derive information on atmospheric aerosols: 2. Modeling studies, J. Geophys. Res.-Atmos., 111, D14203, https://doi.org/10.1029/2005jd006618, 2006. a
Frieß, U., Klein Baltink, H., Beirle, S., Clémer, K., Hendrick, F., Henzing, B., Irie, H., de Leeuw, G., Li, A., Moerman, M. M., van Roozendael, M., Shaiganfar, R., Wagner, T., Wang, Y., Xie, P., Yilmaz, S., and Zieger, P.: Intercomparison of aerosol extinction profiles retrieved from MAX-DOAS measurements, Atmos. Meas. Tech., 9, 3205–3222, https://doi.org/10.5194/amt-9-3205-2016, 2016. a, b
Frommhold, L.: Collision-induced Absorption in Gases, no. 2 in Cambridge monographs on atomic, molecular, and chemical physics, Cambridge University Press, Cambridge, online-ausg. Edn., ISBN 9780511524523, 2006. a
Gordon, I., Rothman, L., Hargreaves, R., Hashemi, R., Karlovets, E., Skinner, F., Conway, E., Hill, C., Kochanov, R., Tan, Y., Wcisło, P., Finenko, A., Nelson, K., Bernath, P., Birk, M., Boudon, V., Campargue, A., Chance, K., Coustenis, A., Drouin, B., Flaud, J., Gamache, R., Hodges, J., Jacquemart, D., Mlawer, E., Nikitin, A., Perevalov, V., Rotger, M., Tennyson, J., Toon, G., Tran, H., Tyuterev, V., Adkins, E., Baker, A., Barbe, A., Canè, E., Császár, A., Dudaryonok, A., Egorov, O., Fleisher, A., Fleurbaey, H., Foltynowicz, A., Furtenbacher, T., Harrison, J., Hartmann, J., Horneman, V., Huang, X., Karman, T., Karns, J., Kassi, S., Kleiner, I., Kofman, V., Kwabia–Tchana, F., Lavrentieva, N., Lee, T., Long, D., Lukashevskaya, A., Lyulin, O., Makhnev, V., Matt, W., Massie, S., Melosso, M., Mikhailenko, S., Mondelain, D., Müller, H., Naumenko, O., Perrin, A., Polyansky, O., Raddaoui, E., Raston, P., Reed, Z., Rey, M., Richard, C., Tóbiás, R., Sadiek, I., Schwenke, D., Starikova, E., Sung, K., Tamassia, F., Tashkun, S., Vander Auwera, J., Vasilenko, I., Vigasin, A., Villanueva, G., Vispoel, B., Wagner, G., Yachmenev, A., and Yurchenko, S.: The HITRAN2020 molecular spectroscopic database, J. Quant. Spectrosc. Ra., 277, 107949, https://doi.org/10.1016/j.jqsrt.2021.107949, 2022. a
Hönninger, G., von Friedeburg, C., and Platt, U.: Multi axis differential optical absorption spectroscopy (MAX-DOAS), Atmos. Chem. Phys., 4, 231–254, https://doi.org/10.5194/acp-4-231-2004, 2004. a, b
Irie, H., Kanaya, Y., Akimoto, H., Iwabuchi, H., Shimizu, A., and Aoki, K.: First retrieval of tropospheric aerosol profiles using MAX-DOAS and comparison with lidar and sky radiometer measurements, Atmos. Chem. Phys., 8, 341–350, https://doi.org/10.5194/acp-8-341-2008, 2008. a
Karman, T., Gordon, I. E., van der Avoird, A., Baranov, Y. I., Boulet, C., Drouin, B. J., Groenenboom, G. C., Gustafsson, M., Hartmann, J.-M., Kurucz, R. L., Rothman, L. S., Sun, K., Sung, K., Thalman, R., Tran, H., Wishnow, E. H., Wordsworth, R., Vigasin, A. A., Volkamer, R., and van der Zande, W. J.: Update of the HITRAN collision-induced absorption section, Icarus, 328, 160–175, https://doi.org/10.1016/j.icarus.2019.02.034, 2019. a
König-Langlo, G., King, J. C., and Pettré, P.: Climatology of the three coastal Antarctic stations Dumont d’Urville, Neumayer, and Halley, J. Geophys. Res.-Atmos., 103, 10935–10946, https://doi.org/10.1029/97jd00527, 1998. a
Lampel, J., Pöhler, D., Tschritter, J., Frieß, U., and Platt, U.: On the relative absorption strengths of water vapour in the blue wavelength range, Atmos. Meas. Tech., 8, 4329–4346, https://doi.org/10.5194/amt-8-4329-2015, 2015. a
Levenberg, K.: A method for the solution of certain non-linear problems in least squares, Q. Appl. Mathe., 2, 164–168, https://doi.org/10.1090/qam/10666, 1944. a
Marquardt, D. W.: An Algorithm for Least-Squares Estimation of Nonlinear Parameters, J. Soc. Indust. Appl. Mathe., 11, 431–441, https://doi.org/10.1137/0111030, 1963. a
NASA-GSFC: AERONET (Aerosol Robotic Network), https://aeronet.gsfc.nasa.gov/ (last access: 6 August 2024), 2024. a
Nasse, J.-M.: Halogens in the coastal boundary layer of Antarctica, phdthesis, Universität Heidelberg, https://doi.org/10.11588/HEIDOK.00026489, 2019. a
Nasse, J.-M., Eger, P. G., Pöhler, D., Schmitt, S., Frieß, U., and Platt, U.: Recent improvements of long-path DOAS measurements: impact on accuracy and stability of short-term and automated long-term observations, Atmos. Meas. Tech., 12, 4149–4169, https://doi.org/10.5194/amt-12-4149-2019, 2019. a
Ortega, I., Berg, L. K., Ferrare, R. A., Hair, J. W., Hostetler, C. A., and Volkamer, R.: Elevated aerosol layers modify the O2–O2 absorption measured by ground-based MAX-DOAS, J. Quant. Spectrosc. Ra., 176, 34–49, https://doi.org/10.1016/j.jqsrt.2016.02.021, 2016. a
Perner, D. and Platt, U.: Absorption of light in the atmosphere by collision pairs of oxygen (O2)2, Geophys. Res. Lett., 7, 1053–1056, https://doi.org/10.1029/gl007i012p01053, 1980. a
Perner, D., Ehhalt, D. H., Pätz, H. W., Platt, U., Röth, E. P., and Volz, A.: OH ‐ Radicals in the lower troposphere, Geophys. Res. Lett., 3, 466–468, https://doi.org/10.1029/gl003i008p00466, 1976. a
Platt, U. and Perner, D.: Measurements of Atmospheric Trace Gases by Long Path Differential UV/Visible Absorption Spectroscopy, 97–105 pp., Springer Berlin Heidelberg, ISBN 9783540395522, https://doi.org/10.1007/978-3-540-39552-2_13, 1983. a
Platt, U. and Stutz, J.: Differential Optical Absorption Spectroscopy: Principles and Applications, Springer Science & Business Media, ISBN 9783540757764, https://doi.org/10.1007/978-3-540-75776-4, 2008. a
Prados-Roman, C., Butz, A., Deutschmann, T., Dorf, M., Kritten, L., Minikin, A., Platt, U., Schlager, H., Sihler, H., Theys, N., Van Roozendael, M., Wagner, T., and Pfeilsticker, K.: Airborne DOAS limb measurements of tropospheric trace gas profiles: case studies on the profile retrieval of O4 and BrO, Atmos. Meas. Tech., 4, 1241–1260, https://doi.org/10.5194/amt-4-1241-2011, 2011. a
Pöhler, D.: Determination of two dimensional trace gas distributions using tomographic LP-DOAS measurements in the city of Heidelberg, Germany, phdthesis, Universität Heidelberg, https://doi.org/10.11588/HEIDOK.00010996, 2010. a, b
Schiermeier, Q.: Cold comfort, Nature, 431, 734–735, https://doi.org/10.1038/431734a, 2004. a
Schmithüsen, H.: Continuous meteorological observations at Neumayer station (1982-03 et seq), Pangaea [data set], https://doi.org/10.1594/PANGAEA.962313, 2023. a
Serdyuchenko, A., Gorshelev, V., Weber, M., Chehade, W., and Burrows, J. P.: High spectral resolution ozone absorption cross-sections – Part 2: Temperature dependence, Atmos. Meas. Tech., 7, 625–636, https://doi.org/10.5194/amt-7-625-2014, 2014. a, b
Spinei, E., Cede, A., Herman, J., Mount, G. H., Eloranta, E., Morley, B., Baidar, S., Dix, B., Ortega, I., Koenig, T., and Volkamer, R.: Ground-based direct-sun DOAS and airborne MAX-DOAS measurements of the collision-induced oxygen complex, O2O2, absorption with significant pressure and temperature differences, Atmos. Meas. Tech., 8, 793–809, https://doi.org/10.5194/amt-8-793-2015, 2015. a, b
Thalman, R. and Volkamer, R.: Temperature dependent absorption cross-sections of O2–O2 collision pairs between 340 and 630 nm and at atmospherically relevant pressure, Phys. Chem. Chem. Phys., 15, 15371, https://doi.org/10.1039/c3cp50968k, 2013. a, b, c, d, e, f, g, h, i, j, k, l, m, n, o, p, q, r, s, t, u, v, w, x, y
Vandaele, A., Hermans, C., Simon, P., Carleer, M., Colin, R., Fally, S., Mérienne, M., Jenouvrier, A., and Coquart, B.: Measurements of the NO2 absorption cross-section from 42 000 cm−1 to 10 000 cm−1 (238–1000 nm) at 220 K and 294 K, J. Quant. Spectrosc. Ra., 59, 171–184, https://doi.org/10.1016/s0022-4073(97)00168-4, 1998. a, b
Vlemmix, T., Hendrick, F., Pinardi, G., De Smedt, I., Fayt, C., Hermans, C., Piters, A., Wang, P., Levelt, P., and Van Roozendael, M.: MAX-DOAS observations of aerosols, formaldehyde and nitrogen dioxide in the Beijing area: comparison of two profile retrieval approaches, Atmos. Meas. Tech., 8, 941–963, https://doi.org/10.5194/amt-8-941-2015, 2015. a
Wagner, T., Dix, B., Friedeburg, C. v., Frieß, U., Sanghavi, S., Sinreich, R., and Platt, U.: MAX-DOAS O4 measurements: A new technique to derive information on atmospheric aerosols – Principles and information content, J. Geophys. Res.-Atmos., 109, D22205, https://doi.org/10.1029/2004jd004904, 2004. a
Wagner, T., Deutschmann, T., and Platt, U.: Determination of aerosol properties from MAX-DOAS observations of the Ring effect, Atmos. Meas. Tech., 2, 495–512, https://doi.org/10.5194/amt-2-495-2009, 2009. a, b
Wagner, T., Beirle, S., Deutschmann, T., and Penning de Vries, M.: A sensitivity analysis of Ring effect to aerosol properties and comparison to satellite observations, Atmos. Meas. Tech., 3, 1723–1751, https://doi.org/10.5194/amt-3-1723-2010, 2010. a
Wagner, T., Beirle, S., Benavent, N., Bösch, T., Chan, K. L., Donner, S., Dörner, S., Fayt, C., Frieß, U., García-Nieto, D., Gielen, C., González-Bartolome, D., Gomez, L., Hendrick, F., Henzing, B., Jin, J. L., Lampel, J., Ma, J., Mies, K., Navarro, M., Peters, E., Pinardi, G., Puentedura, O., Puķīte, J., Remmers, J., Richter, A., Saiz-Lopez, A., Shaiganfar, R., Sihler, H., Van Roozendael, M., Wang, Y., and Yela, M.: Is a scaling factor required to obtain closure between measured and modelled atmospheric O4 absorptions? An assessment of uncertainties of measurements and radiative transfer simulations for 2 selected days during the MAD-CAT campaign, Atmos. Meas. Tech., 12, 2745–2817, https://doi.org/10.5194/amt-12-2745-2019, 2019. a, b, c
Wagner, T., Dörner, S., Beirle, S., Donner, S., and Kinne, S.: Quantitative comparison of measured and simulated O4 absorptions for one day with extremely low aerosol load over the tropical Atlantic, Atmos. Meas. Tech., 14, 3871–3893, https://doi.org/10.5194/amt-14-3871-2021, 2021. a, b
Wilmouth, D. M., Hanisco, T. F., Donahue, N. M., and Anderson, J. G.: Fourier Transform Ultraviolet Spectroscopy of the A 2Π3/2 ← X 2Π3/2 Transition of BrO, The J. Phys. Chem. A, 103, 8935–8945, https://doi.org/10.1021/jp991651o, 1999. a
Wittrock, F., Oetjen, H., Richter, A., Fietkau, S., Medeke, T., Rozanov, A., and Burrows, J. P.: MAX-DOAS measurements of atmospheric trace gases in Ny-Ålesund – Radiative transfer studies and their application, Atmos. Chem. Phys., 4, 955–966, https://doi.org/10.5194/acp-4-955-2004, 2004. a