the Creative Commons Attribution 4.0 License.
the Creative Commons Attribution 4.0 License.
 | 28 Jul 2025
The T-Bird – a new aircraft-towed instrument platform to measure aerosol properties and turbulence close to the surface: introduction to the aerosol measurement system
Zsófia Jurányi
Christof Lüpkes
Frank Stratmann
Jörg Hartmann
Jonas Schaefer
Anna-Marie Jörss
Alexander Schulz
Bruno Wetzel
David Simon
Eduard Gebhard
Maximilian Stöhr
Paula Hofmann
Dirk Kalmbach
Sarah Grawe
Manfred Wendisch
Andreas Herber
This study introduces the T-Bird, a novel aircraft-towed platform developed to measure aerosol and turbulence properties close to the surface, particularly over sea ice and open water in the polar regions. The T-Bird, towed by the Alfred Wegener Institute's Polar aircraft, offers a unique capability to capture data from altitudes as low as 10 m while the aircraft operates at its lowest allowed operation altitude. This measurement platform allows for simultaneous data collection of aerosol, turbulence, and meteorological parameters across multiple vertical layers. The T-Bird is equipped with specialized aerosol instrumentation to assess particle number concentration, number size distribution, and absorption coefficient and to collect filter samples. It has been tested under Arctic conditions during the BACSAM (Boundary layer and Aerosol and Cloud Study in the Arctic, based on aircraft and T-Bird Measurements) campaign in October 2022. This paper provides technical details on the T-Bird's design, with special focus on the aerosol instrumentation and its performance during Arctic flights addressing measurement challenges in the lowermost atmosphere. The first measurements demonstrate its potential to enhance our understanding of aerosol dynamics and atmospheric boundary layer processes in remote environments.
- Article
(2883 KB) - Full-text XML
- BibTeX
- EndNote


Aerosols play a crucial role in atmospheric radiative energy budget and climate, directly by scattering and absorbing solar radiation and indirectly by modifying cloud microphysical properties (e.g. Szopa et al., 2021). The global warming due to the increase in greenhouse gas concentrations is amplified in the Arctic (Jeffries et al., 2013; AMAP, 2021) as a result of various processes and feedback mechanisms summarized by the term “Arctic amplification” (e.g. Wendisch et al., 2017). One of these interactions within the Arctic climate system is related to changes in aerosol concentrations (AMAP, 2021). The natural aerosol baseline in the Arctic is changing rapidly, accompanied by significant regional variations. The majority of Arctic aerosols originate from sources at lower latitudes travelling long distances through the atmosphere (Barrie et al., 1992). However, the recently growing human influence in the Arctic accentuates the significance of local pollution sources as well (Law et al., 2017). Altogether, the role of long-range-transported or locally emitted aerosol particles in Arctic amplification, particularly aerosol–cloud interaction, is complex and still not well understood (Mauritsen et al., 2011; Pithan and Mauritsen, 2014; Wendisch et al., 2017). In this regard, more measurements are required to improve our understanding of aerosol effects (e.g. Schmale et al., 2021).
Limited accessibility, harsh weather conditions, and the vastness of the Arctic complicate long-term and comprehensive aerosol measurements. Nevertheless, several ground-based research stations and monitoring sites have been established since the 1970s to collect continuous, long-term aerosol data. Some of the oldest stations are Barrow/Utqiaġvik (Bodhaine, 1989; Polissar et al., 1999), situated in Alaska, and Zeppelin in Ny-Ålesund, Svalbard (Platt et al., 2022). In the 1980s Alert station in Canada (Sirois and Barrie, 1999) and Villum Research Station in Greenland (Heidam et al., 1999; Nguyen et al., 2016) started their operations in the high Arctic. These ground-based sites provide valuable information on the seasonal variations and long-term trends of aerosol properties. However, these data are limited to single geographic points on the ground.
Ship-based aerosol measurements can cover wide ranges of oceanic, sea-ice, and coastal regions, providing a more extensive and diverse sampling of the Arctic environment (e.g. Chang et al., 2011; Tjernström et al., 2014; Wendisch et al., 2019). The most comprehensive atmospheric measurement programme conducted over the Arctic sea ice to date was part of the MOSAiC (Multidisciplinary drifting Observatory for the Study of Arctic Climate) campaign, which provided year-around, continuous aerosol observations from the central Arctic (Shupe et al., 2022).
In situ data on the vertical distribution of aerosols are rare compared to data collected at ground level. In the last two decades, aircraft campaigns have allowed researchers to study the vertical distribution of aerosols, gaining insights into their transport, mixing, and interactions with clouds (Yamanouchi et al., 2005; Brock et al., 2011; Willis et al., 2019; Wendisch et al., 2019, 2024; Jurányi et al., 2023). These fast-moving platforms can reach almost any remote location except the lowermost part of the atmosphere below 60–100 m above ground.
The Arctic atmospheric boundary layer (ABL) in winter is shallow, often less than 100 m deep, due to strong surface inversions and stable atmospheric conditions (Vihma et al., 2014; Peng et al., 2023). Surface processes like water/ice/snow–atmosphere exchanges of gases and aerosol particles have a significant impact on the atmospheric composition in the Arctic ABL. Therefore, the lowest layer of the Arctic atmosphere exhibits unique dynamics, chemistry, and sensitivity to surface exchange that can only be resolved through in situ measurements within this critical layer height. Arctic tethered balloon (Ferrero et al., 2019; Cappelletti et al., 2022; Lata et al., 2023; Pilz et al., 2024; Pohorsky et al., 2024) and uncrewed aerial vehicle (UAV) (Bates et al., 2013; de Boer et al., 2018) measurements can cover these lowest altitudes inaccessible to aircraft and provide high vertically resolved information on the aerosol processes occurring. However, these platforms can only be operated from specific locations with sufficient infrastructure available. Tethered balloons are fixed to a single point, whereas the operation range is very limited for a UAV. Towed bodies offer a possibility to perform long-range measurements using either a helicopter (Siebert et al., 2006; Pätzold et al., 2023) or an aircraft (Frey et al., 2009) to tow the instrument platform and eventually perform simultaneous measurements (aircraft and towed body) as well.
To enable long-range turbulence and aerosol measurements in the lowermost layer of the polar atmosphere and simultaneously at a second altitude, the towed-body system, T-Bird, has been developed. Here, the focus is on the technical description of the system (emphasizing the aerosol instrumentation) and the first application during the BACSAM (Boundary layer and Aerosol and Cloud Study in the Arctic, based on aircraft and T-Bird Measurements) campaign in the Arctic over the Fram Strait close to Svalbard. The technical description follows in Sect. 2, and the first acquired data are shown in Sect. 3. In a case study (Sect. 3.3.1), we focus on the question of whether the vertical aerosol concentration profile follows the ABL structure as obtained from potential temperature measurements.
2.1 Technical details of T-Bird
In this section we give a technical introduction to the T-Bird system. The T-Bird is a passive trailing body towed below the Alfred Wegener Institute's (AWI) aircraft Polar 5 or Polar 6. The body is attached to the aircraft by a cable of variable length, which also supplies power from the aircraft to the trailing body. When the T-Bird is found in a winched-in position, it is mechanically fixed in the so-called nest, which is a frame construction located at the bottom of the aircraft fuselage. The T-Bird can be winched to a maximum of 100 m cable length, allowing a vertical distance between the trailing body and the aircraft of about 60 m at typical measurement speeds of 185–220 km h−1. The actual rules of the air safety regulations allow aircraft measurements higher than 60 m above ground. The application of the T-Bird extends the measurement range to as low as 10 m above flat surfaces. This unique measurement setup enables us to measure key parameters (e.g. meteorological, turbulence, and aerosol properties) within the Arctic ABL at the important 10 m level with a simultaneous second measurement level above realized by the sensors on board the aeroplane. Beyond this, various other dual-level measurements in polar regions are feasible.
The overall design of the T-Bird's body, especially shape and size, is based on the successfully utilized EM-Bird (Haas et al., 2009). The outer body is made of fibre-reinforced polymer (FRP); the inner structure consists of aluminium. The length of the T-Bird including nose boom and tail is 396 cm, with a diameter of 35 cm. The stabilizing tail has a width and height of 107 cm. The fully equipped system weighs about 108 kg. Figure 1 shows a drawing of the system. The T-Bird is anchored to the rope at a single clamp in the middle above its centre of gravity. The power connector is located behind the anchor clamp. Most data are sent in real time via wireless LAN to the data management system on board the aeroplane. A video camera is located at the tail, allowing real-time optical monitoring of the system environment during flight. Fully equipped, the installed instruments can be grouped into three payload types: aerosol, turbulence, and support equipment. Figure 2 shows where the different sensors are situated in the T-Bird. In the following sections the different types of sensors will be introduced, with special focus on the aerosol instrumentation. The T-Bird's instrumental payload could also be adjusted if required. However, it should be kept in mind that changing the T-Bird's configuration requires a new certification, which has to be planned well in advance and requires both human and financial resources.
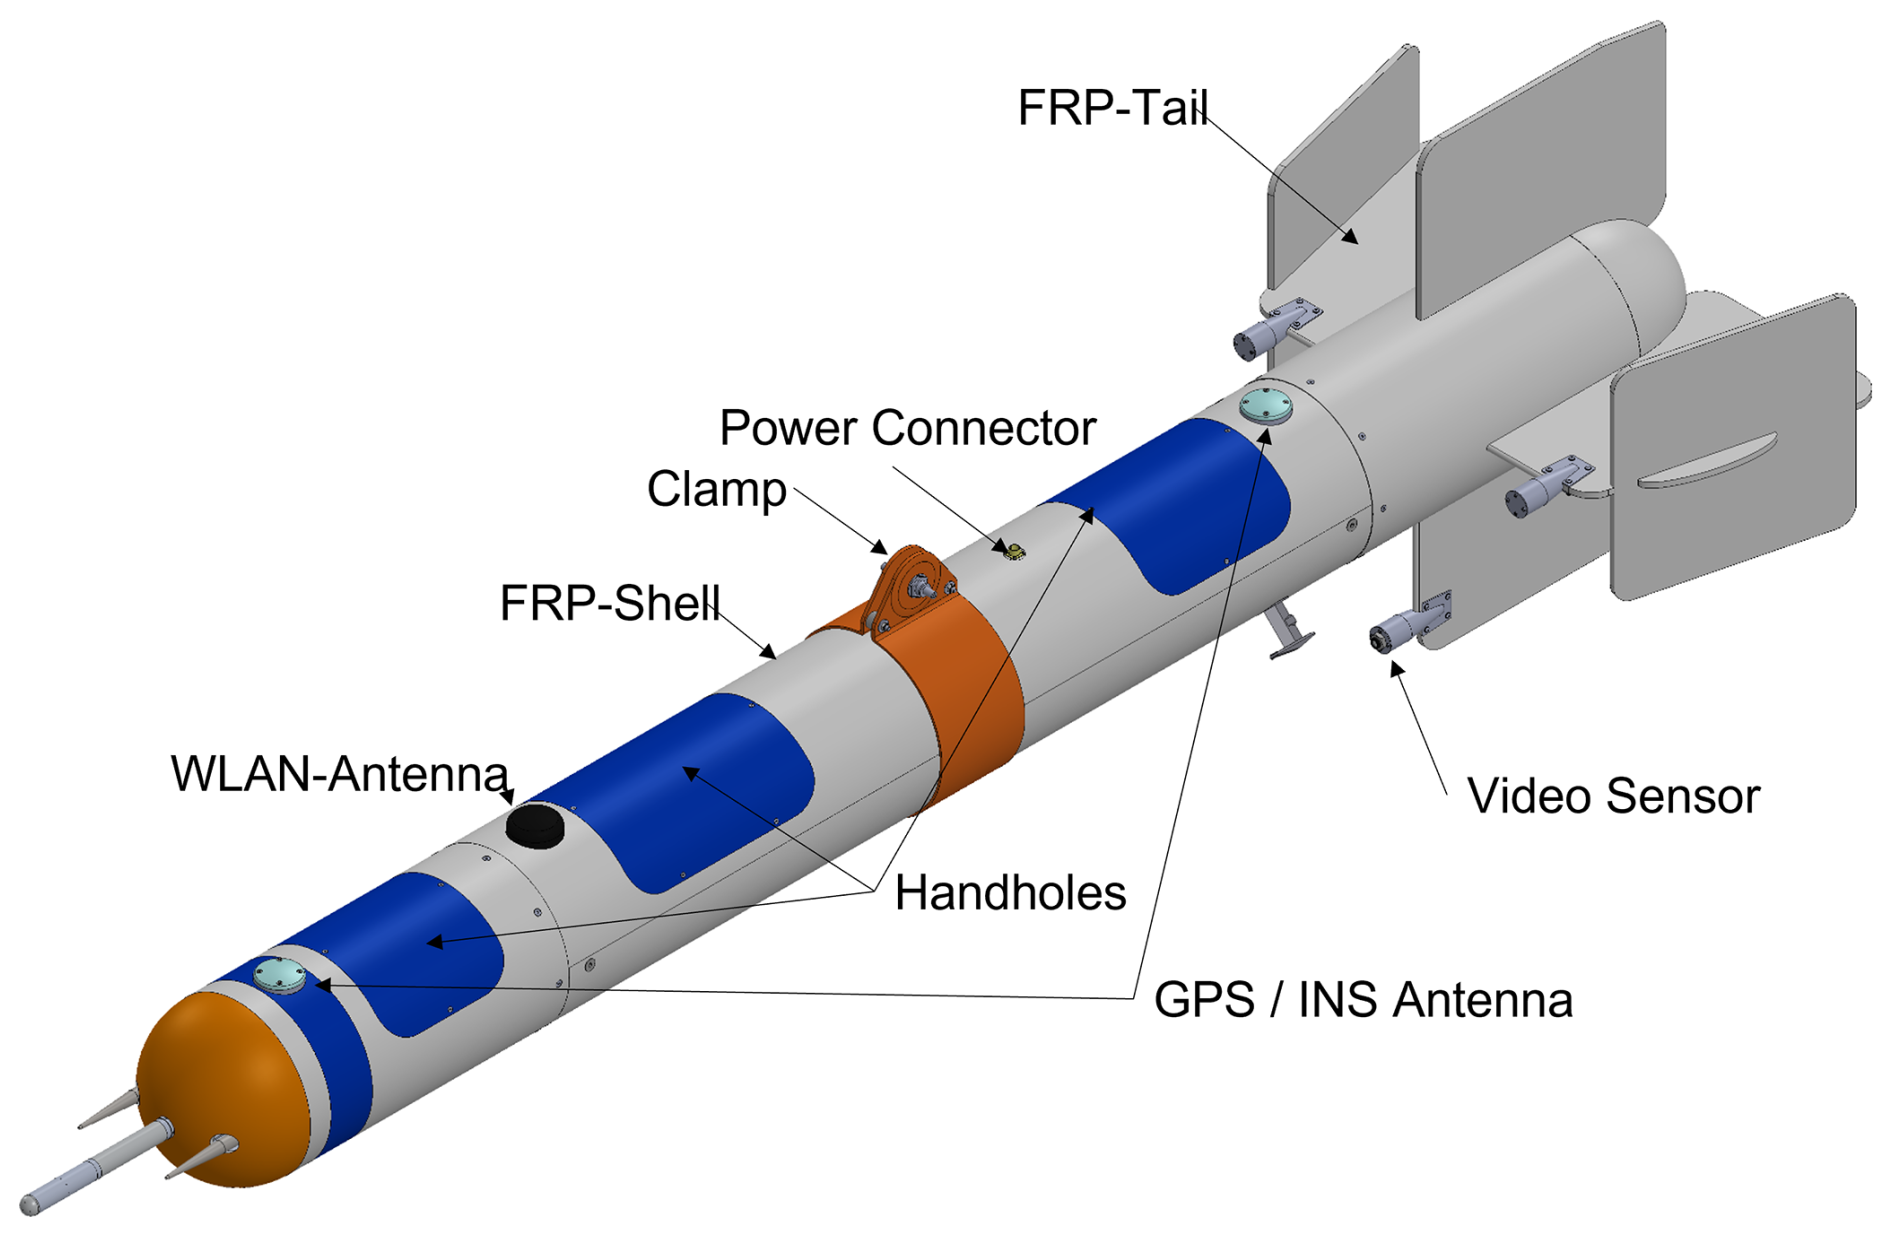
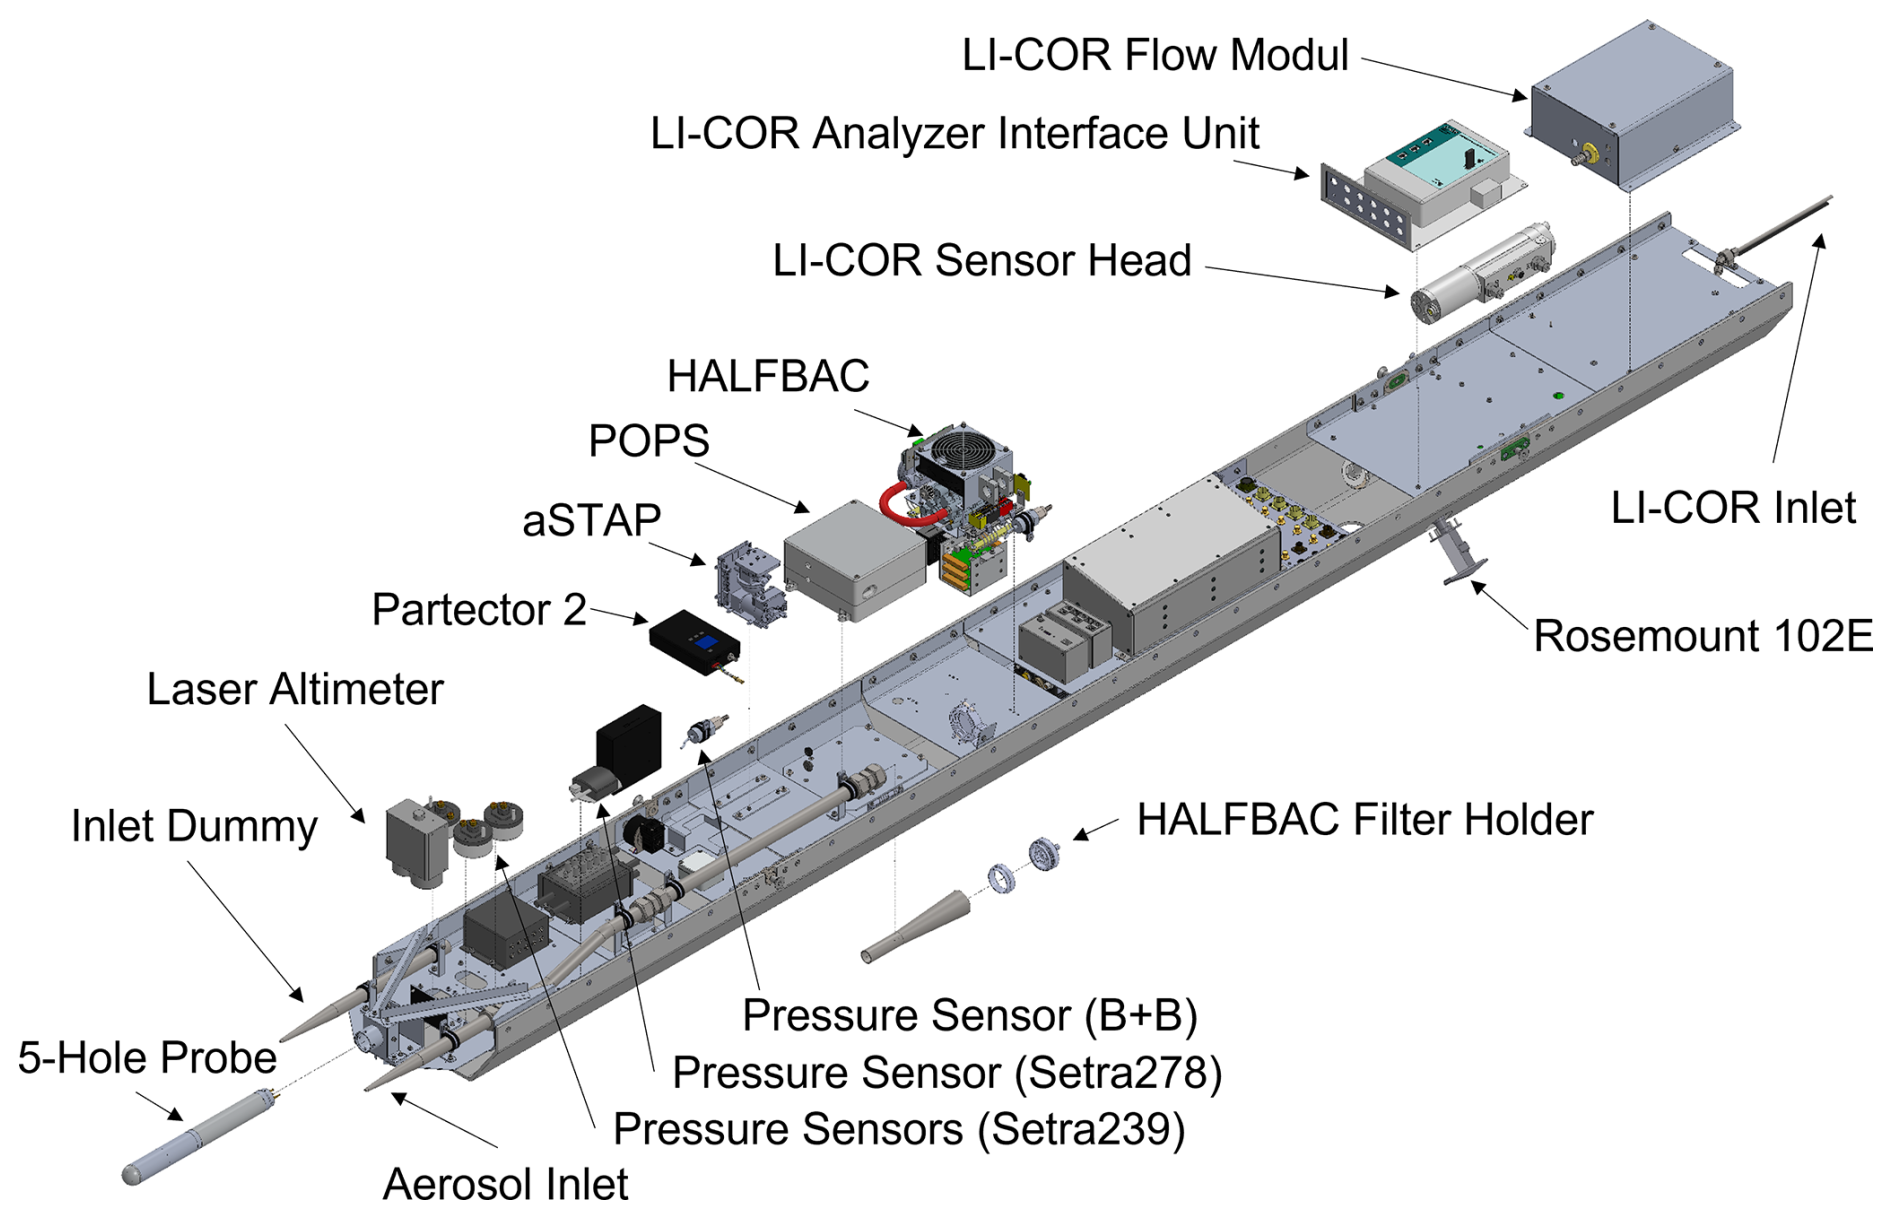
Figure 2Exploded-view drawing of the T-Bird system including descriptions of main sensor parts.
2.1.1 Turbulence instrumentation
The turbulence equipment is in principal the same as that mounted on the aircraft where it has been used successfully in the polar ABL during several campaigns (e.g. Ehrlich et al., 2019; Gryanik and Hartmann, 2022; Chechin et al., 2023). Namely, the same five-hole probe (Aventech) is installed at the front of the T-Bird (Fig. 2), wherein Setra 239R and Setra 278 pressure transducers in combination with NI Compact Rio AD conversion modules provide static and dynamic (Pitot) pressure and differential pressure measurements to derive the angles of attack and sideslip and finally the 3D wind vector with a frequency of 100 Hz (Hartmann et al., 2018). A LI-COR infrared gas analyser (LI-COR Biosciences, LI-7200) measures gas-phase H2O and CO2 concentrations through an actively aspirated and heated gas inlet situated at the back of the system. The turbulence instrument bunch is completed by a Pt100 temperature sensor in a Rosemount housing (Rosemount, type 102E) mounted on the underside of the T-Bird's rear third. The turbulence payload allows the determination of the momentum, sensible and latent heat fluxes, and, as will be shown in a later research paper, in combination with high-frequency measurements of aerosol particle concentrations, also particle fluxes.
2.1.2 Support instrumentation
Position, heading, and altitude information of the T-Bird is provided by a GPS (Global Positioning System)-supported inertial navigation system (INS, IMAR Navigation and Control iNAT-M200-SLN-DA) during flight. These are essential measurements to correct the wind vector from the five-hole probe for the T-Bird's own movements. A camera system (AXIS F1005-E sensor and AXIS F41 main unit) was installed with the camera sensor located at the T-Bird's tail looking in the flight direction to document the overflown ground. Furthermore, a laser altimeter (ASTECH LDM 301) measures the height of the T-Bird above ground.
2.1.3 Aerosol instrumentation
The T-Bird's aerosol inlet (Enviscope/Knebel; see Fig. 1) is mounted on the nose, next to the five-hole probe but behind it to minimize its influence on turbulence measurements. In order to keep the T-Bird's symmetry and with that its balance, a blind copy of the inlet was placed on the opposite side of the five-hole probe. The inlet is constructed of stainless steel, and the ambient air enters a cone-shaped diffuser (131.7 mm length, 3.7 mm opening diameter, and 4° opening angle) to decelerate it. This enables isokinetic sampling at a total flow of 38.7 L min−1 and flight speed of 60 m s−1. The inlet enters the T-Bird through a 22.1 mm diameter stainless steel tube, and the individual sample lines to the various instruments were drawn from that tube using angled inserts and connected to the individual instruments by conductive rubber tubing; or, in the case of the Partector 2 instrument, we applied PVC (Tygon) tubing, as recommended by the manufacturer (Asbach et al., 2016).
The amount of heat produced by the instruments during operation was high enough during the Arctic autumn test campaign BACSAM (minimal measured outside temperature during flight of −21.4 °C) to keep the temperature high enough for the instruments installed inside the T-Bird to work properly. The temperature was not actively controlled; no extra heater or cooler was installed in the T-Bird. The higher inside temperature of the T-Bird was also enough to keep the relative humidity of the aerosol sample below 40 %, so no additional drying was used. An optional heating system can be installed for campaigns performed at even lower temperatures present.
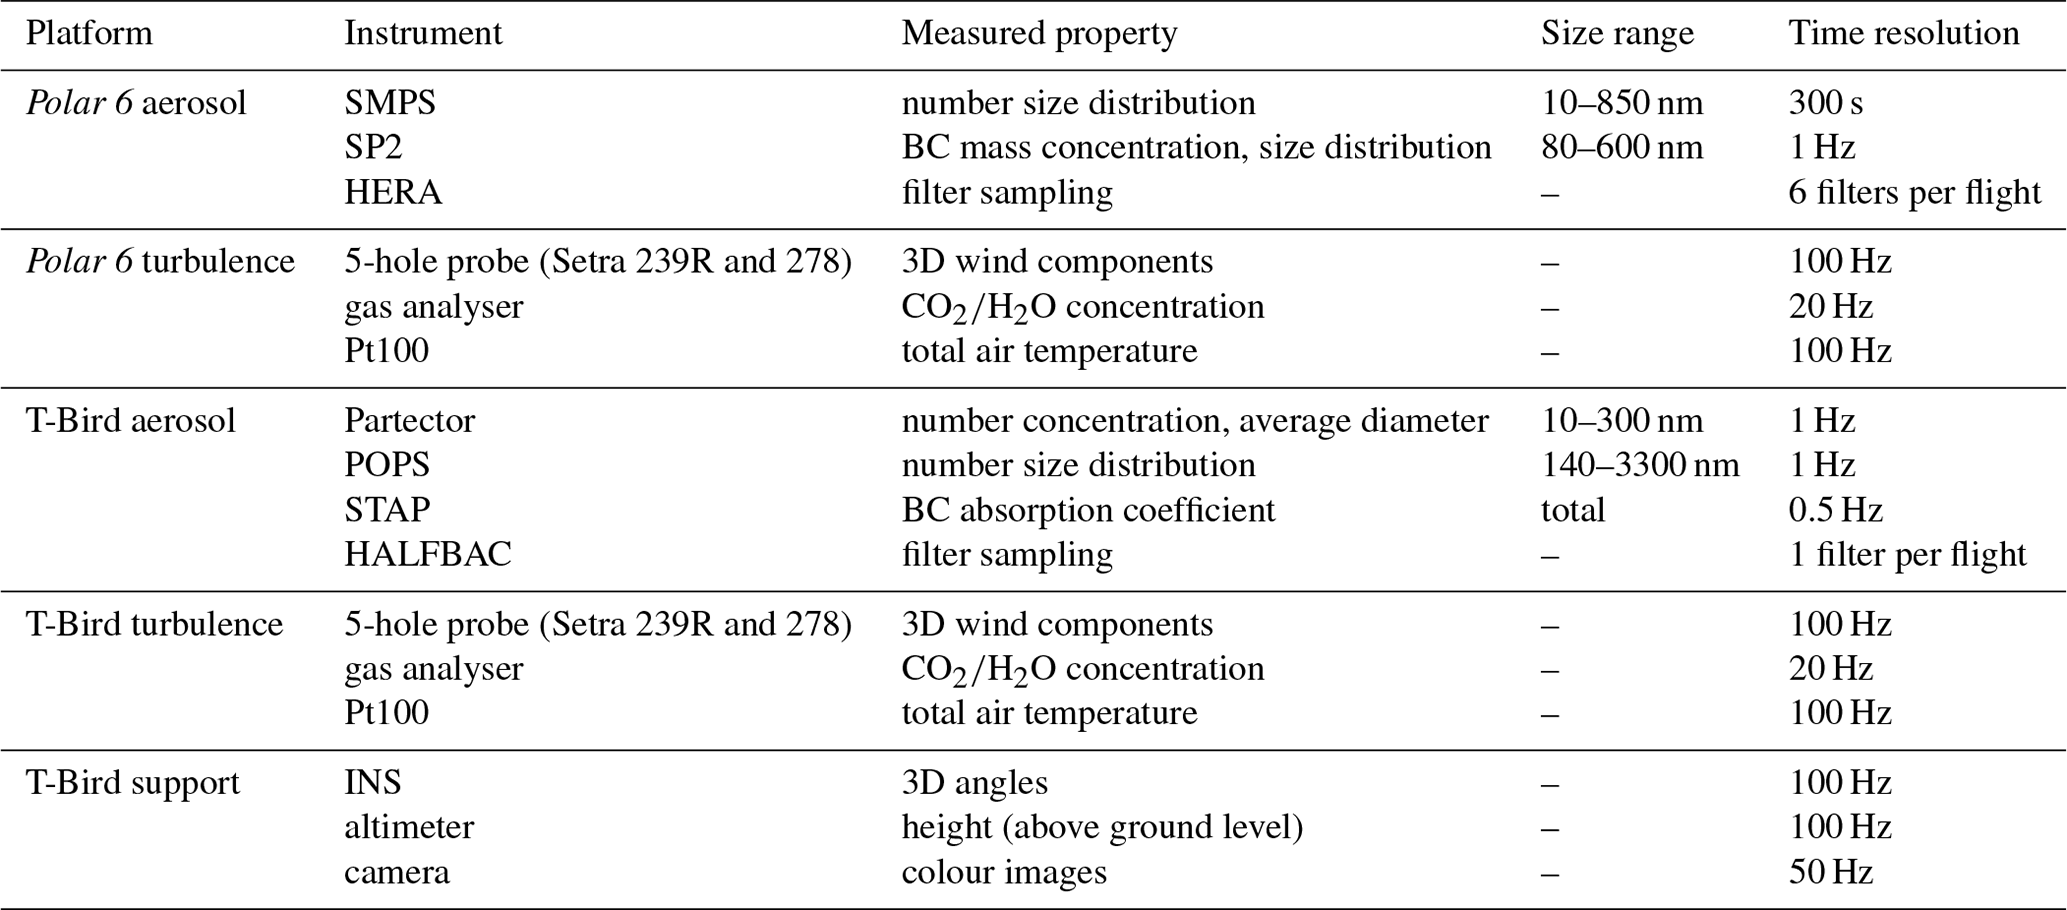
Due to the limited space and payload capacity of the T-Bird, only miniaturized aerosol instruments were installed in it: a Partector 2, a portable optical particle spectrometer (POPS), a single-channel tricolour absorption photometer (STAP), and a high-volume and light-weight balloon-borne filter sampler (HALFBAC). Table 1 shows a list of the T-Bird aerosol instrumentation, the measured properties, and their time resolution. In the following we give a short introduction of the individual instruments.
Table 1List of the scientific instrumentation including the measurement platform, the description of the measured quantity, size range and time resolution.
A Partector 2 (Naneos particle solutions GmbH, Windisch, Switzerland, from here on called Partector for simplicity) was installed in the T-Bird to measure the aerosol particle number concentration and the average diameter of particles in the diameter range of 10–300 nm. The instrument's measurement principle is based on unipolar corona diffusion charging and subsequent electrical current measurement. The unipolar charger is operated in a pulsed mode, which leads to packets of charged aerosol inducing currents in a two-stage Faraday cage connected to high-sensitivity electrometers. Between the two Faraday cages, an electrostatic precipitator is installed, where part of the charged aerosol particles is removed (Fierz et al., 2014). The two measured currents are dependent on the particles' size and concentration. Using assumptions on the shape of the particle number size distribution (lognormal with a certain width and being monomodal), the two-stage measurement makes it possible to determine both the total aerosol particle number concentration and an average aerosol particle diameter. The instrument's miniature size (), its light weight (415 g), and the lack of the need of a condensation fluid (butanol or water, which is needed by the most commonly used particle counters) make it an ideal instrument to be operated in the T-Bird.
The POPS (Handix Scientific, Fort Collins, CO, USA) is an optical particle counter that was developed for UAV and balloon deployment (Gao et al., 2016; Mei et al., 2020). Its small size and low power consumption make it ideal for our applications. The instrument operates at a wavelength of 405 nm and optically sizes the sampled particles based on their single-particle elastic light scattering for diameters in the range of approximately 140 nm–3 µm. The POPS works with a sample-sheath flow system, where a single miniature pump is responsible for establishing both flows simultaneously. The pump draws air through the optical chamber from the instrument's aerosol inlet and at the same time ambient air through an orifice and a particle filter as the sheath air. The sample flow rate through a laminar flow element is measured by a differential pressure sensor, and the pump speed is controlled such that the sample flow stays constant at 200 cm3 min−1. The particle-free sheath air ensures that the particles pass through the middle of the instrument's laser beam. It is not monitored in the system, but the orifice (normally) guarantees its stable flow of 150 cm3 min−1.
The STAP (Brechtel Inc, Hayward, CA, USA – model 9406) was built based on the particle soot absorption photometer (PSAP; Bond et al., 1999). Diffused light from three LED sources with wavelengths of 445, 515, and 633 nm (blue, green, red) are alternatingly transmitted through two glass fibre filters, and the transmitted light is monitored by photodetectors. One of the filters serves as a reference that no particles will be sampled through; the other will be loaded with aerosol particles. A decrease in the transmitted light indicates the accumulation of absorbing particles on the filter and provides a measure of the light-absorption coefficient at the three wavelengths. These absorption coefficients can be converted to equivalent BC (eBC; Petzold et al., 2013) mass concentrations. The instrument's lower detection limit is defined by its noise level, which is 0.2 Mm−1 at 60 s averaging time (Bates et al., 2013). This translates to 10–20 ng m−3 eBC depending on the applied mass absorption efficiency.
The filter sampler used for the collection of aerosol particles in the T-Bird is based on the TROPOS-built High-volume And Light-weight Filter samplers for BAlloon-borne appliCation (HALFBAC; Grawe et al., 2023). It features a filter holder (47 mm; PFA, Savillex, MN, USA) and a vacuum scroll pump (SVF-E0-50PF, Scroll Labs, USA), as well as temperature, pressure before and behind the filter, volume, and mass flow sensors. The instrument is controlled by means of a Raspberry PI, which is utilized for collecting the measured data and pump control. Polycarbonate filters with an 800 nm pore size (Nuclepore™ track-etched membranes, Whatman, UK) were used, and the sample flow rate was set to 30 L min−1, resulting in sampled air volumes per filter between 2 and 7.2 m3.
2.2 Polar 6 aircraft and BACSAM aircraft campaign
Polar 6 is one of the research aircraft of the Alfred Wegener Institute, and it was deployed to tow the T-Bird and host measurement instrumentation onboard. The aircraft is specifically a modified Basler BT-67 aircraft for polar missions that has the ability to fly at low cruising speeds of 185–400 km h−1 performing measurements in an altitude range from 60 to 8000 m (Wesche et al., 2016).
The Boundary layer and Aerosol and Cloud Study in the Arctic, based on aircraft and T-Bird Measurements (BACSAM) took place between 1 and 16 October 2022 over the Fram Strait with an operation base at Longyearbyen airport (78°14′43′′ N, 15°28′57′′ E) in Svalbard. The aircraft campaign was carried out within the framework of the project Arctic Amplification: Climate Relevant Atmospheric and Surface Processes and Feedback Mechanisms (AC)3 (Wendisch et al., 2023).
The main goal of the campaign was to test the T-Bird for the first time in Arctic conditions, including dynamic flight behaviour characterization and T-Bird's instrumentation calibrations, testing, and comparison, as well as to perform aerosol and turbulence measurements with both the T-Bird and the aircraft across the ABL up to the free troposphere (FT) over open ocean and over the marginal sea-ice zone. All together nine scientific flights were carried out with a total 29 h of flight time.
2.3 Aircraft turbulence instrumentation
The aircraft was equipped with a nose boom hosting the instrumentation bunch for turbulence observations. This consists of a five-hole probe (Aventech) with Setra 239R and Setra 278 pressure transducers and a Pt100 temperature sensor (Rosemount, type 102E). Additionally, there are a deiced (heated) Pt100 temperature sensor (Rosemount, type 102E, not used here for data analysis) and a humidity sensor (Vaisala HMT333) mounted on Polar 6 with dedicated inlets. Furthermore, a LI-COR Biosciences LI-7200 system for H2O and CO2 concentration measurements is installed in the aircraft cabin with an inlet on the aircraft's roof.
2.4 Aircraft aerosol instrumentation
The aircraft aerosol inlet with an intake diameter of 0.35 cm is located ahead of the engines, and all aircraft aerosol instruments sampled air through this shrouded stainless-steel inlet diffuser. At the typical cruising speeds of Polar 6, the inlet has a transmission efficiency close to unity in the particle diameter range of 20 nm–1 µm (Leaitch et al., 2016). The relative humidity of the aerosol sample was always below 30 % due to the higher cabin temperature compared to the ambient temperature; no additional measure was needed to dry the aerosol.
The Polar 6 aerosol instrumentation, installed in the aircraft cabin during BACSAM, consisted of a single-particle soot photometer (SP2), a scanning mobility particle sizer (SMPS), and a high-volume flow aerosol particle filter sampler (HERA).
The SP2 (Droplet Measurement Technologies, Longmont, CO, USA) measures BC mass of individual aerosol particles in the mass equivalent diameter range from ∼80 to ∼600 nm (assuming void-free bulk material density of 1.8 g cm−3; Moteki and Kondo, 2010). The BC detection is based on laser-induced incandescence, whereby a continuous-wave, high-intensity, intra-cavity laser (Nd:YAG crystal, wavelength of 1060 nm) heats up absorbing particles until they reach their vaporization temperature and emit incandescent light. Its intensity is proportional to the BC mass of the particle (Schwarz et al., 2006; Moteki and Kondo, 2010). The SP2 was calibrated before and after the measurement campaign using size-selected fullerene particles (Moteki and Kondo, 2010; Gysel et al., 2011; Laborde et al., 2012). The calibration curves before and after the campaign agreed within 5 %, and therefore we can assume that the instrument's sensitivity remained constant during the campaign.
The SMPS (Wiedensohler et al., 2012) is a custom-built system, which consists of a differential mobility analyser (Vienna-type, custom built) and a condensational particle counter (TSI CPC3760A; TSI Incorporated, USA). It measures the aerosol number size distribution within the particle mobility diameter range of 10–850 nm. It was operated with a sheath flow of 5 L min−1 and sample flow of 1 L min−1. A single SMPS scan lasted 300 s.
For the sampling of aerosol particles for subsequent offline analysis, concerning ice-nucleating particle (INP) abundance and properties, the TROPOS-developed HERA sampler was used. HERA is an aerosol filter sampler for airborne applications which has been described in detail in Grawe et al. (2023). It features a revolver-like arranged set of six filter holders, through which the sample flow is guided by a ball valve. During the T-Bird test campaign, the volumetric sample flow rate of HERA was set to 30 L min−1. As filters, 800 nm pore-size polycarbonate filters (Nuclepore™ track-etched membranes, Whatman, UK) were used. The sampling time varied between 16 and 1666 min, resulting in sampled air volumes between 0.4 and 4.5 m3.
3.1 T-Bird's flight behaviour
To evaluate the flight characteristics of the T-Bird, a special flight test was carried out during the BACSAM campaign. A series of defined manoeuvres were flown to provide information on the interactions between the T-Bird and the towing aircraft. The manoeuvres were based on the explanations of Jategaonkar (2006) and were used to analyse the longitudinal and lateral motions of the T-Bird. Using INS and GPS data, a state space model was created. This revealed the excellent flight characteristics of the T-Bird. Therefore, the T-Bird is characterized by uncritical flight behaviour with good damping behaviour in lateral motion, which makes it ideal for the scientific mission.
T-Bird's motion relative to the towing plane represents a pendulum movement with a period depending on the length of rope. The largest amplitude of this movement is parallel to the flight direction and is a result of towing force changes due to vertical movement of the plane. This movement is shown in speed undulations of the T-Bird. It has a negligible effect on the accuracy of the wind measurement as this movement is very precisely measured by the inertial system. Pendulum movement across flight direction results from turns of the aircraft to align itself along a desired track. The across movement eases out after two or three pendulum periods if the aircraft is flying steady on a straight track. The aerodynamics of the bird lead to very low sideslip angles, typically less than 1° during straight measurement flights. Even in regular turns sideslip angles greater than 2 or 3° are very rarely exceeded. Thus the five-hole probe is nearly always in its specified and calibrated range.
3.2 Instrument performance in the T-Bird and in the aircraft
During BACSAM, most of the aerosol instrumentation functioned properly both in the aircraft and in the T-Bird, including the SMPS, HERA, and SP2 in Polar 6 and Partector and HALFBAC in the T-Bird.
The STAP showed no indication of malfunctioning; however during the BACSAM aircraft campaign we encountered extremely low BC concentrations below 1 ng m−3. This concentration is even much lower than the Arctic average summer season (outside of the Arctic haze season) concentration of 4.7 ng m−3 (Jurányi et al., 2023), and with that, the BC concentration was well below the detection limit of the instrument. The only times when the instrument delivered values above the noise level were directly before take-off and after landing, when the aircraft emissions were sampled. With that, during BACSAM we only could test that the instrument is functional and that the data acquisition works properly. During future deployments, in the spring season and/or closer to local sources we expect much higher BC concentrations above the instrument's detection limit and with that valid measurements.
The POPS encountered flow problems during BACSAM. The instrument works with a sample-sheath flow system, where the particle-free sheath flow ensures that the aerosol particles pass through the middle of the laser beam. With the ram pressure present at the instrument's inlet during flight, the sample flow was always higher than the desired 200 cm3 min−1. As a consequence, the instrument's pump was regulated down completely, and the sheath flow was below the desired value or even reversed. Additionally, the sample flow was so high that it could not be measured anymore (higher than the highest value that the laminar flow element could detect). After realizing this problem, the inlet tube of the instrument was perforated such that the ram-pressure-induced excess flow was diverted before entering the instrument. This makeshift solution did not completely solve the problem, but at least the sample flow remained in the measurable range during the slower flight sections when the T-Bird was winched out.
The filter sampling instruments HALFBAC and HERA worked properly during the BACSAM campaign: 8 filter samples with HERA and 18 with HALFBAC could be collected for INP analysis. The filter analysis is still in progress; a comparison between HALFBAC and HERA collected filter results will be the subject of a separate future publication.
The main goal of the T-Bird application during future campaigns will be to obtain the vertical aerosol distribution in the entire ABL focusing on its lowest layers down to 10 m above the surface. This will be done with simultaneous measurements at two altitudes such that highly resolved vertical profiles can be obtained with only a few horizontal flight sections at different heights. Such missions involving flights with the T-Bird at the lowest possible altitude above ground were not within the scope of the first test campaign; the flight behaviour of the system was rather tested at safer, higher altitudes. Therefore, most of the time during the scientific flights, it can be expected that both aircraft and T-Bird sampled aerosols from the same atmospheric layer with only negligible vertical gradients of aerosol properties. This gives us the opportunity to investigate the performance of the “miniature” aerosol instrumentation deployed in the T-Bird by comparing their measured quantities to the “standard” instruments on board the Polar 6 aircraft, though we still have to keep in mind the above-described instrumental problems.
3.2.1 Comparison of Partector and SMPS results
The aerosol number concentration data from the Partector instrument deployed in the T-Bird were compared to the number concentration derived from the aircraft's SMPS measurements. All concentration data in this paper are reported as ambient concentration and are not corrected to standard conditions. For this comparison, all flight data were considered excluding solely take-off and landing. The data were separated according to the position of the T-Bird compared to the aircraft: i.e. we distinguish data when the T-Bird was in the nest directly below Polar 6 and when it was winched out completely (60 m altitude difference between T-Bird and aircraft). With the T-Bird in the nest, the inlets of both systems are only separated by some metres and thus sample almost the same air. For this situation we expect both instruments' delivered aerosol number concentration values to agree, and the arising differences give us information on the instrumental and measurement uncertainties. For the case with the winched-out T-Bird, some additional uncertainty might originate from sampling different aerosol, but as was mentioned before, due to the chosen flight patterns, we expect that only a small fraction of measurements are taken in layers with strong vertical gradients of aerosol properties. The winched-out T-Bird case was treated separately to check the extent of such an influence.
The measured SMPS aerosol number size distributions were integrated in the diameter range of 10–300 nm in order to match the size range of the Partector. The 1 s data from the Partector were averaged to the 5 min scan interval of the SMPS. Here, we have to take into account that the SMPS counts the aerosol particles within a certain narrow diameter interval and scans through the considered diameter range. Therefore, when the aerosol concentration highly fluctuates within the scan time of the SMPS, the derived aerosol number concentration will be erroneous. Such cases were sorted out after a manual inspection of each individual SMPS up and down scans.
The comparison of the aerosol number concentration between the Partector (Np) and the SMPS (N10–300) is shown in Fig. 3 for both cases of winched-in (round green markers) and winched-out (red triangles) T-Bird. First of all, it is obvious that Partector data and SMPS data agree well with each other independent of the case confirming the assumption that most of the time we sampled the same aerosol. The only difference between the winched-in and winched-out cases is the smaller concentration range of data for the latter case. The reason is that the T-Bird was only winched out when flying closer to the surface (below ∼ 1000 m altitude), whereas transit flights (with T-Bird in its nest) took place at higher altitudes (between 2000 and 3000 m), where significantly higher concentrations were encountered during BACSAM.
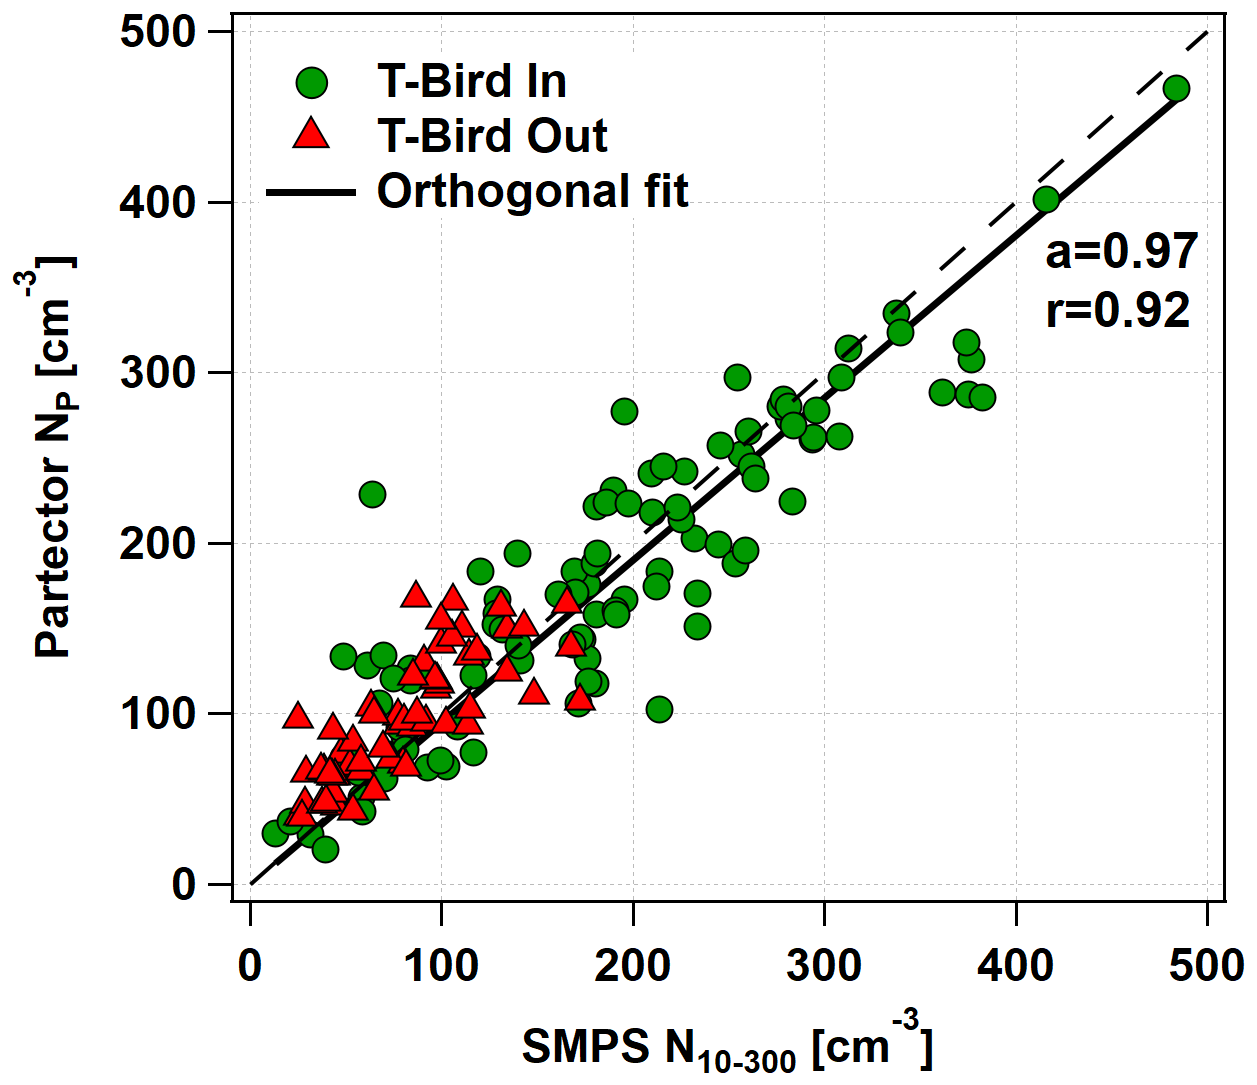
Figure 3Comparison of the measured aerosol number concentration between the Partector and the SMPS between 10 and 300 nm particle diameter during the BACSAM campaign. The round green markers represent the periods when the T-Bird was directly below the aircraft, and the red triangles when the T-Bird was winched out. The solid black line is the corresponding orthogonal regression line, and the dashed black line shows the line of equality to guide the eyes.
Based on this result, we have chosen to investigate the relationship between the measured number concentration from the two different instruments without splitting the data according to the T-Bird's position. The orthogonal distance regression line (green line) forced through the origin shows that on average the Partector reported an Np close to the SMPS with a slope of 0.97, and the data are highly correlated (correlation coefficient of 0.92). Despite the very good agreement, some individual measurement points can still show high scatter. It also has to be mentioned that due to the working principle of the Partector, the original 1 s time resolution data (with a 4 s integration time) show high noise at such low concentrations. The average ratio between Np's standard deviation and mean value was 1.09, which means that the level of noise is comparable to the level of the measured signal. This should be considered for further data analysis.
The average aerosol particle diameter obtained by the Partector is compared to the measurements of the SMPS. For this comparison, the geometric mean diameter of the size distribution was chosen considering the diameter range between 10 and 300 nm. Even with perfect instrument performance, we do not expect an agreement between these values, since the “average diameter” reported by the Partector is based on many assumptions, as mentioned in Sect. 2.1.3. Only if the measured number size distribution exactly fulfilled all these assumptions does the Partector's average diameter agree with the geometric mean diameter of the number size distribution. The Partector data were again averaged through the duration of the single SMPS scans, and the same criterion for not considering the points with aerosol concentration fluctuating too highly was applied as before. The comparison is presented in Fig. 4, showing the cases according to the T-Bird's position separately (round green markers vs. red triangles).
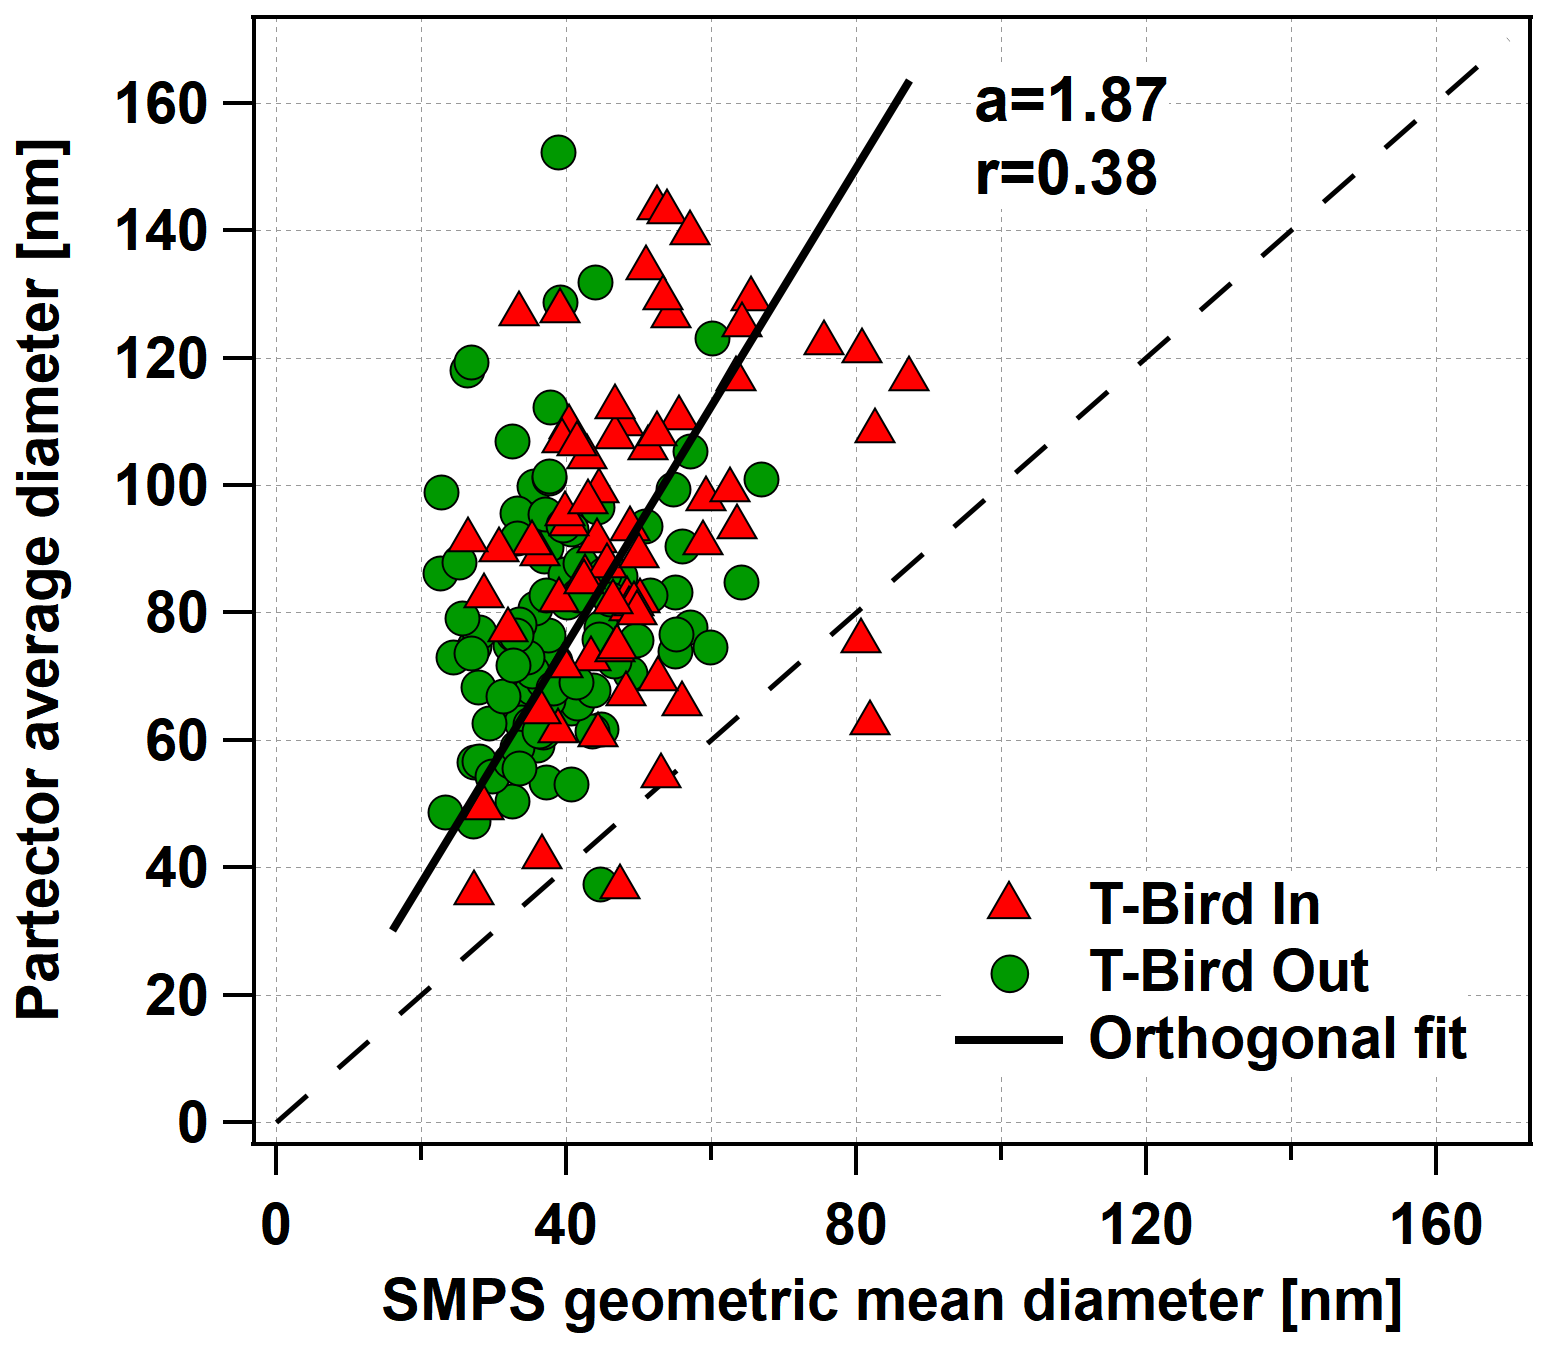
Figure 4Comparison of the reported average diameter by the Partector to the number mean diameter from the SMPS. The round green markers represent the periods when the T-Bird was directly below the aircraft, and the red triangles when the T-Bird was winched out. The solid black line is the corresponding orthogonal regression line, and the dashed black line shows the line of equality to guide the eye.
The Partector reports on average almost a factor of 2 (orthogonal regression fit line has a slope of 1.87) higher diameter than the geometric mean diameter measured by the SMPS, with a correlation coefficient of 0.38. The spread of the individual measurement points is high, but no difference between the two cases regarding the T-Bird's position can be identified. Based on this, we can conclude that the average diameter from the Partector cannot be directly compared to the geometric mean diameter of the number size distribution. Nevertheless, results might still be used as an indicator of the average size of the ultrafine particle size range.
3.2.2 Comparison of POPS and SMPS results
The data originating from the POPS in the T-Bird were compared to the Polar 6's SMPS system. The instruments have a sufficient overlap within their size ranges (SMPS: 10–850 nm; POPS: 153–3000 nm) from 153 to 850 nm. To elucidate the effects of the above-described flow problems of the POPS, we carried out a comparison of the SMPS and POPS measured size distributions. The data were sorted according to sample flow being within the instruments' measurement range (flow in range) or being even higher (flow out of range). The number size distributions were integrated between 153 and 850 nm for both instruments, and the 1 s POPS data were averaged for the duration of the SMPS scan. SMPS scans were again excluded from the comparison, for which the POPS concentration fluctuated too much within the time period of one SMPS scan.
The comparison of the number concentration is shown in Fig. 5. Firstly, there is no significant difference between the cases if the POPS sample flow was in the measurable range or not. Secondly, the POPS number concentration is highly correlated (correlation coefficient of 0.81) to the measured SMPS number concentration. However, due to the flow problem, it seems that the POPS on average counted a 2 times higher concentration than the SMPS (slope of the orthogonal fit is 2.12). A total of 90 % of the points can be found within 1.22 and 3.26 times the number concentration of the SMPS (grey shading in Fig. 5). This factor of 2.12 can be considered the “counting efficiency” of the instrument.
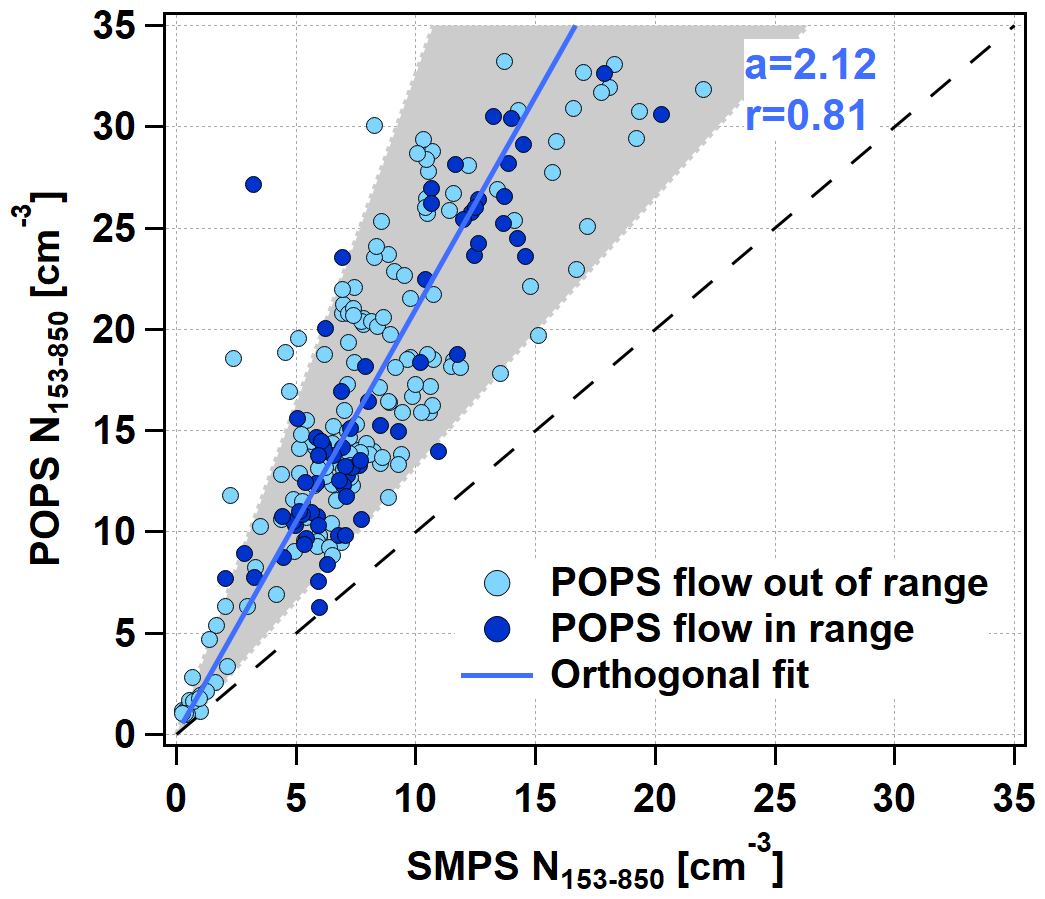
Figure 5Comparison of the measured aerosol number concentration between the POPS instrument and the SMPS between 153 and 850 nm particle diameter during the BACSAM campaign. The dark blue markers represent the periods when the POPS sample flow was in the measurement range and the light blue markers the ones when the flow was even higher. The blue line is the corresponding orthogonal regression line, and the dashed black line shows the line of equality to guide the eye. The light grey shaded area ends at the 95th and 5th percentiles of the ratio between the POPS and SMPS concentrations.
To investigate solely the sizing performance of the instrument, the POPS number size distributions were corrected with the previously determined “counting efficiency” factor. The median number size distributions after this correction are presented in Fig. 6 for the case when the sample flow was within the measurement range. The median number size distributions are not too far from each other, and the ranges between 25th and 75th percentiles overlap well. Generally, the POPS seems to overestimate the number of the “smaller” (< 250 nm) particles and underestimate the number of the “larger” (> 250 nm) particles. The case with the flow being outside of the measurement range shows very similar results (not shown here). This difference can partly exist because we compare different types of number size distributions with each other. The SMPS measures the number size distribution based on the mobility diameter, whereas the POPS measures it based on the optical diameter using polystyrene latex particles with a refractive index of 1.615+0.001i (Gao et al., 2016) for calibration. As atmospheric aerosol particles may feature an in our case unknown size-dependent refractive index, a direct qualitative comparison of POPS and SMPS measured size distributions is difficult. Another issue in this context is the sheath airflow that is too low inside POPS, which has the consequence that aerosol particles that were supposed to pass through the middle of the laser beam might have passed the laser closer to the edge of the beam with significantly lower intensity and therefore been falsely identified as smaller particles. In the measured number size distribution, this would appear as measuring too many smaller particles and too few larger ones, just as our comparison shows. A similar effect can be caused by the presence of a size-dependent refractive index if the larger aerosol particles have a significantly lower refractive index than the calibration aerosol. Due to all these uncertainties, in the following we will solely use the POPS data as an indicator for the presence of larger (>153 nm) particles, which is justified due to the good correlation between the POPS's and SMPS's measured number concentration.
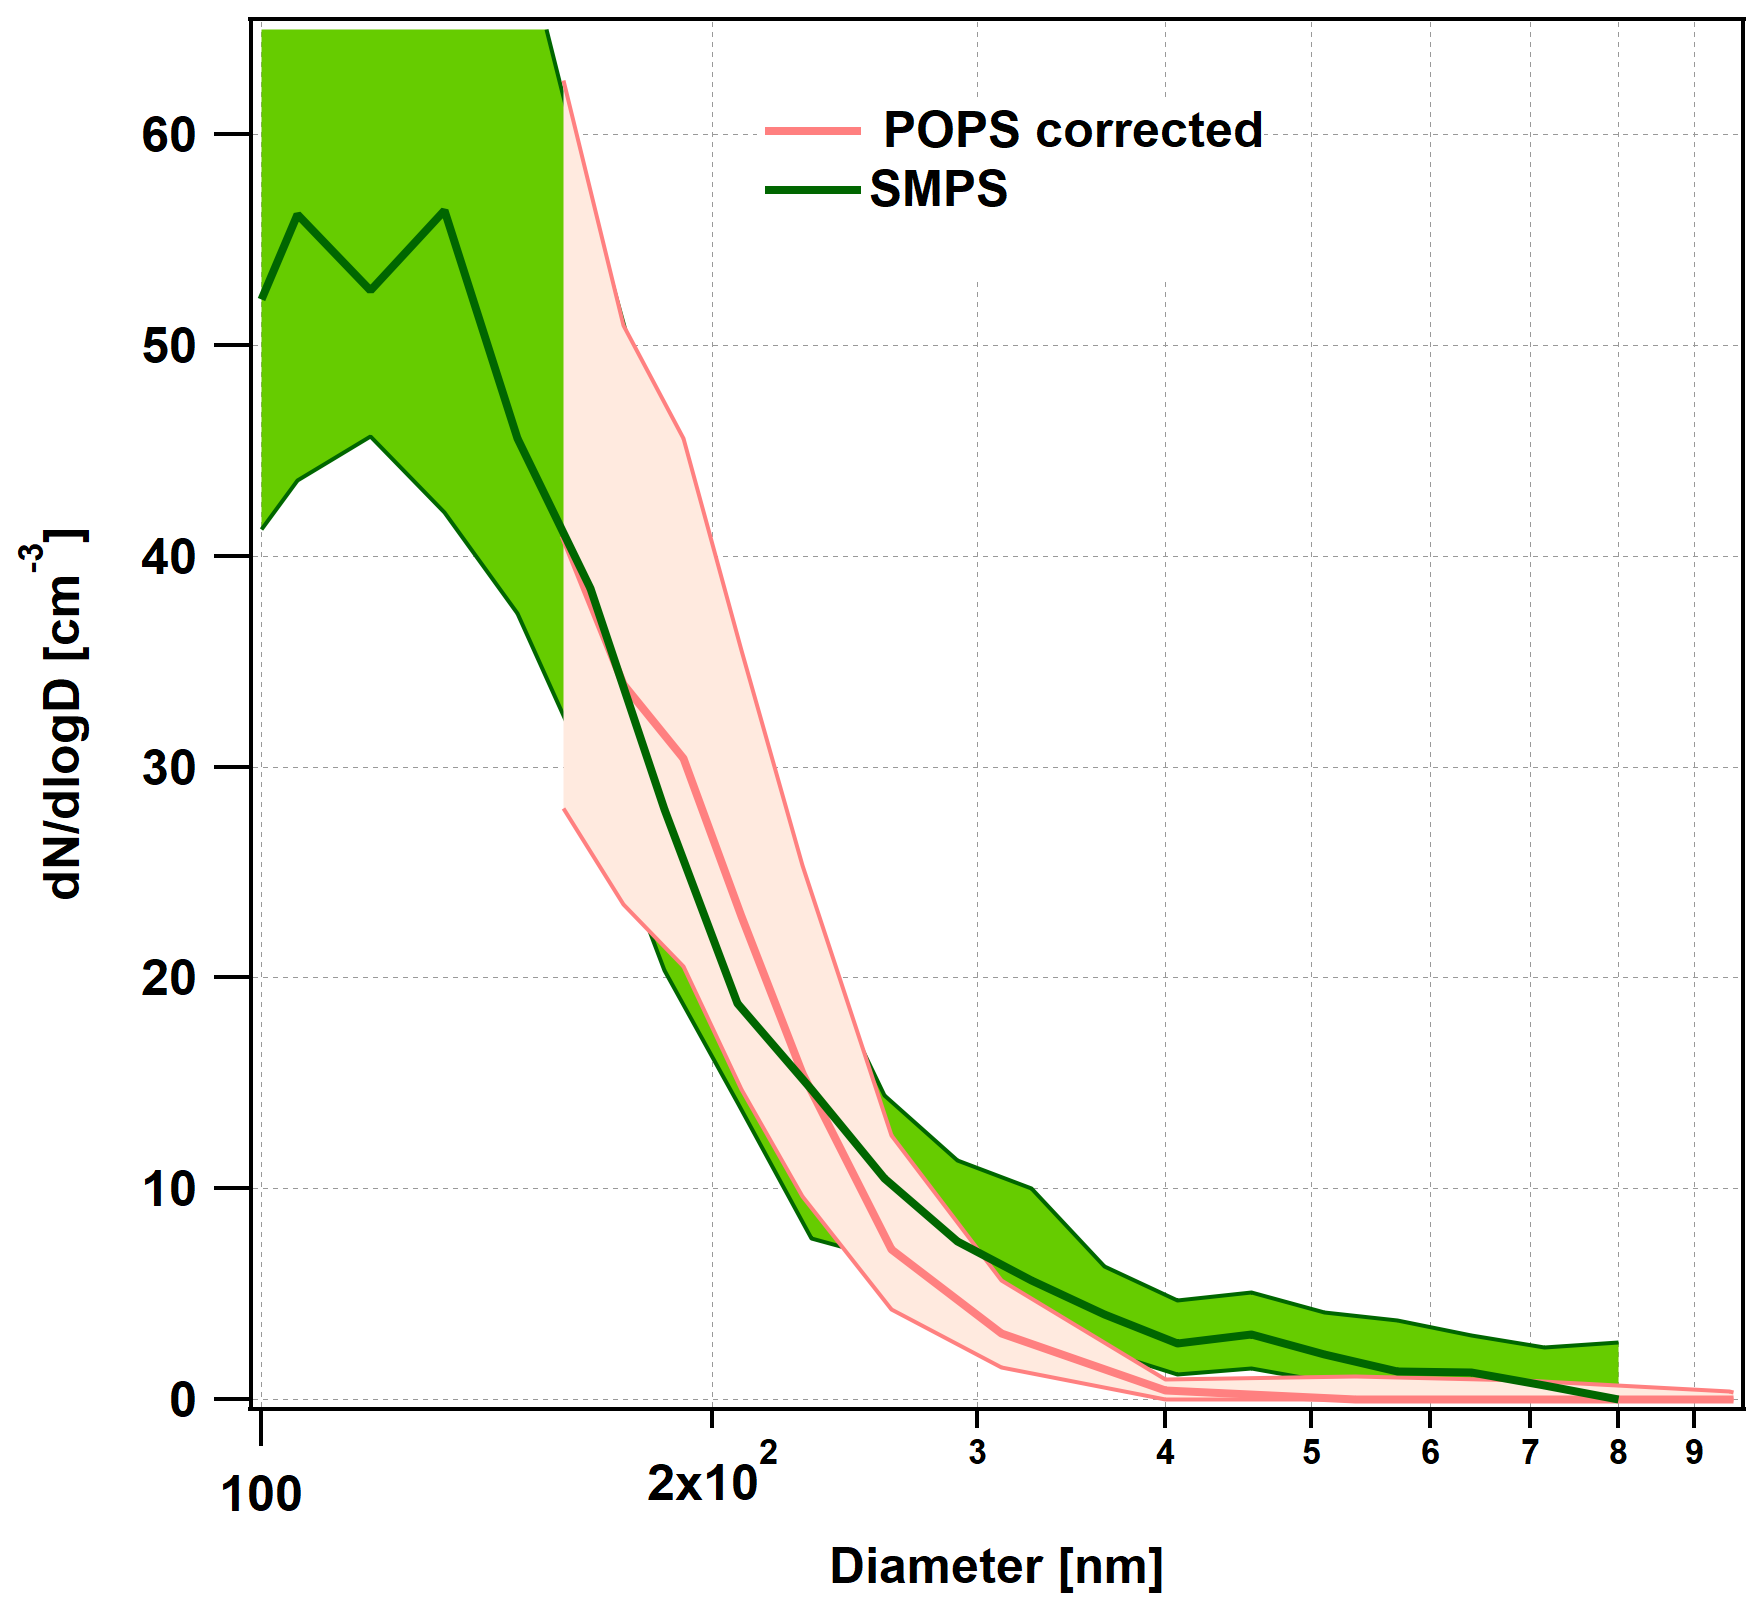
Figure 6Comparison of the median number size distributions in the size range of 100–900 nm between POPS (pink line, corrected to match the SMPS number concentration) and SMPS (green line) for the periods when the POPS sample flow was within the measurement range. The shadings were drawn between the 25th and 75th percentiles.
3.3 Case study
In the following, we will focus on one research flight as an example to show the influence of mixing processes in the lower atmosphere (here below 2500 m) on the vertical distribution of aerosol particles. This flight took place on 5 October 2022 with the following flight pattern: after take-off, Polar 6 flew to the target area and performed horizontal flight sections at increasing altitudes between two waypoints (WP1 and WP2). After that, the aircraft returned to the air base and landed (Fig. 7).
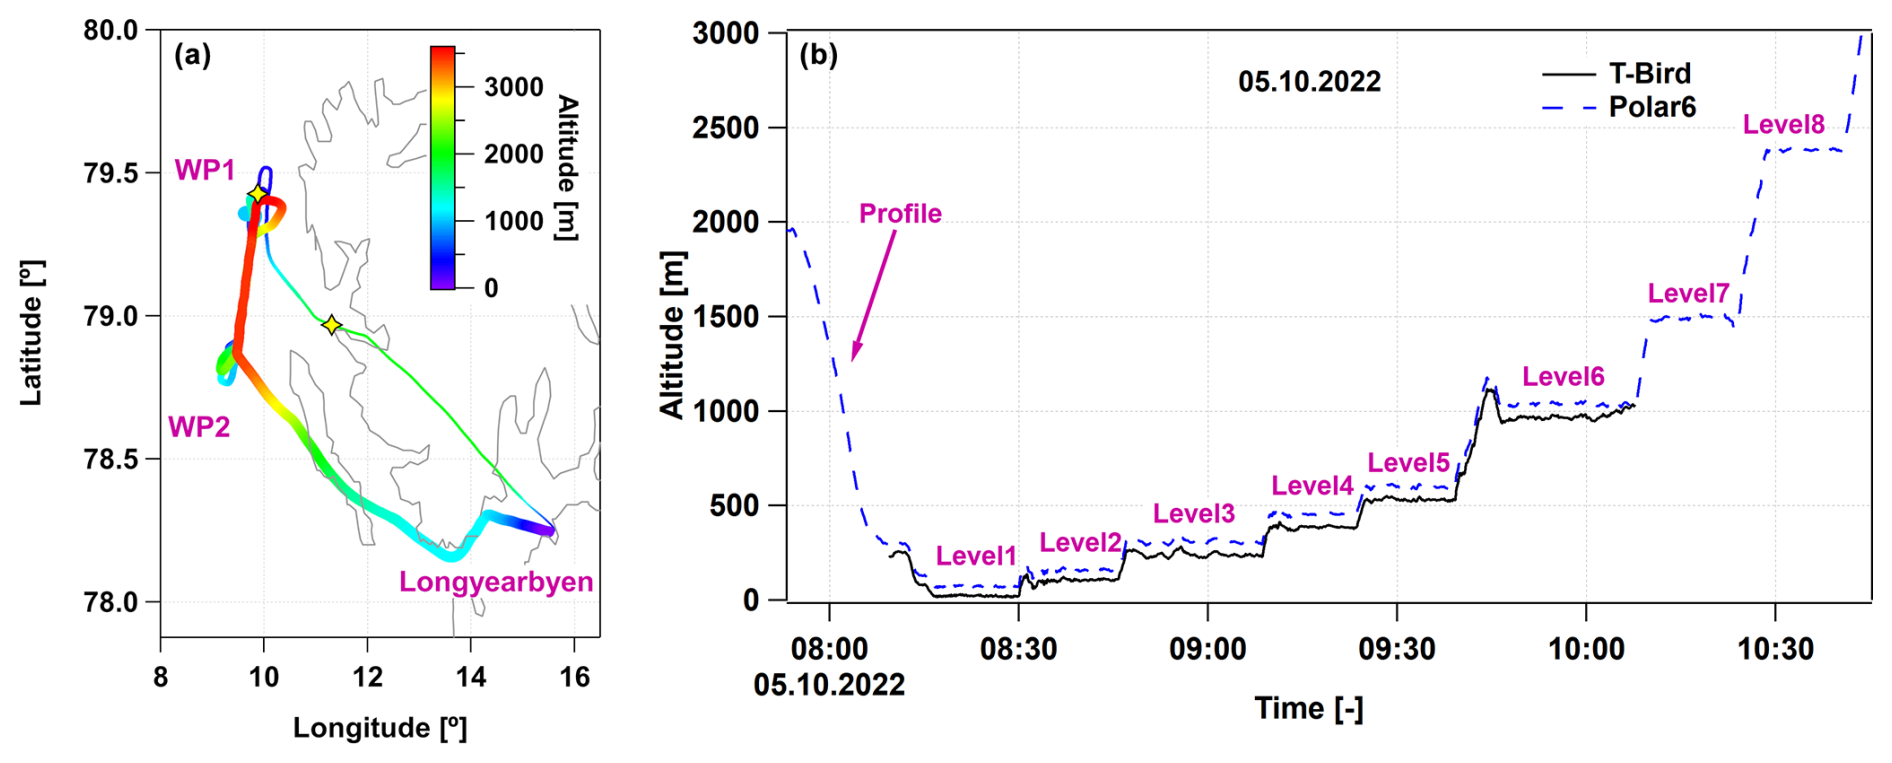
Figure 7(a) Flight pattern on 5 October 2022: the different colours indicate the flight level of the aircraft, and the thickness of the pattern increases with the elapsed time. The yellow stars show the start and end points of the profile measurement. (b) Flight altitude of the Polar 6 aircraft (dashed blue line) and the T-Bird (solid black line) as a function of time on 5 October 2022, measured by GPS. The T-Bird had only GPS reception when the system was winched out.
3.3.1 Research flight on 5 October 2022
Due to the pronounced lee effect caused by Svalbard's orography and prevailing easterly wind, a cloud-free area was formed west of Svalbard, which became the target area of the research flight. Within this area, a northern WP1 and a southern WP2 were defined (Fig. 7a), and between them, horizontal legs of approximately 15 min duration (equivalent to about 60 km distance) were performed at eight different altitudes (Fig. 7b) above the open-water surface. The length of the legs was chosen such that independent of SMPS's exact scan start time, it was guaranteed that two full scans could be performed at that single altitude. The T-Bird was winched out shortly before the first horizontal leg and was winched into its nest at the end of the sixth leg. Therefore, during the measurements of the two legs with the highest altitudes, the T-Bird measured at the same altitude as the aircraft (Fig. 7b).
The T-bird also offers the possibility of measuring vertical profiles of meteorological properties such as temperature, pressure, and wind components during climb and descent. POPS and Partector have a time resolution of 1 Hz; however the Partector has a 4–32 s averaging window, which is manually set depending on the expected concentration. For the derivation of turbulence properties (e.g. fluxes, turbulent kinetic energy) from high-resolution wind and temperature measurements, we need leg lengths at constant altitude of at least 8–10 km for statistical reasons.
Before reaching WP1 for the first time, the aircraft descended to the target area, and this provided us vertical profiles of meteorological quantities to investigate the structure of the lower atmosphere. Note that the descent started already close to the western tip of Svalbard (Fig. 7a, yellow star) and one should be aware of the fact that for this reason the potential temperature profile includes to some extent the effect of horizontal inhomogeneity along the distance flown during descent. Also between WP1 and WP2 the potential temperature changed by 1–2 K along horizontal legs (not shown). Thus, the mean stability in the lowermost layer can be analysed most accurately from leg averages rather than from the data obtained during descent at the northern end of the leg. These horizontal leg averages are shown in Fig. 8, whereas Fig. 9 (solid grey line) shows the potential temperature as a function of the altitude during the descent to WP1.
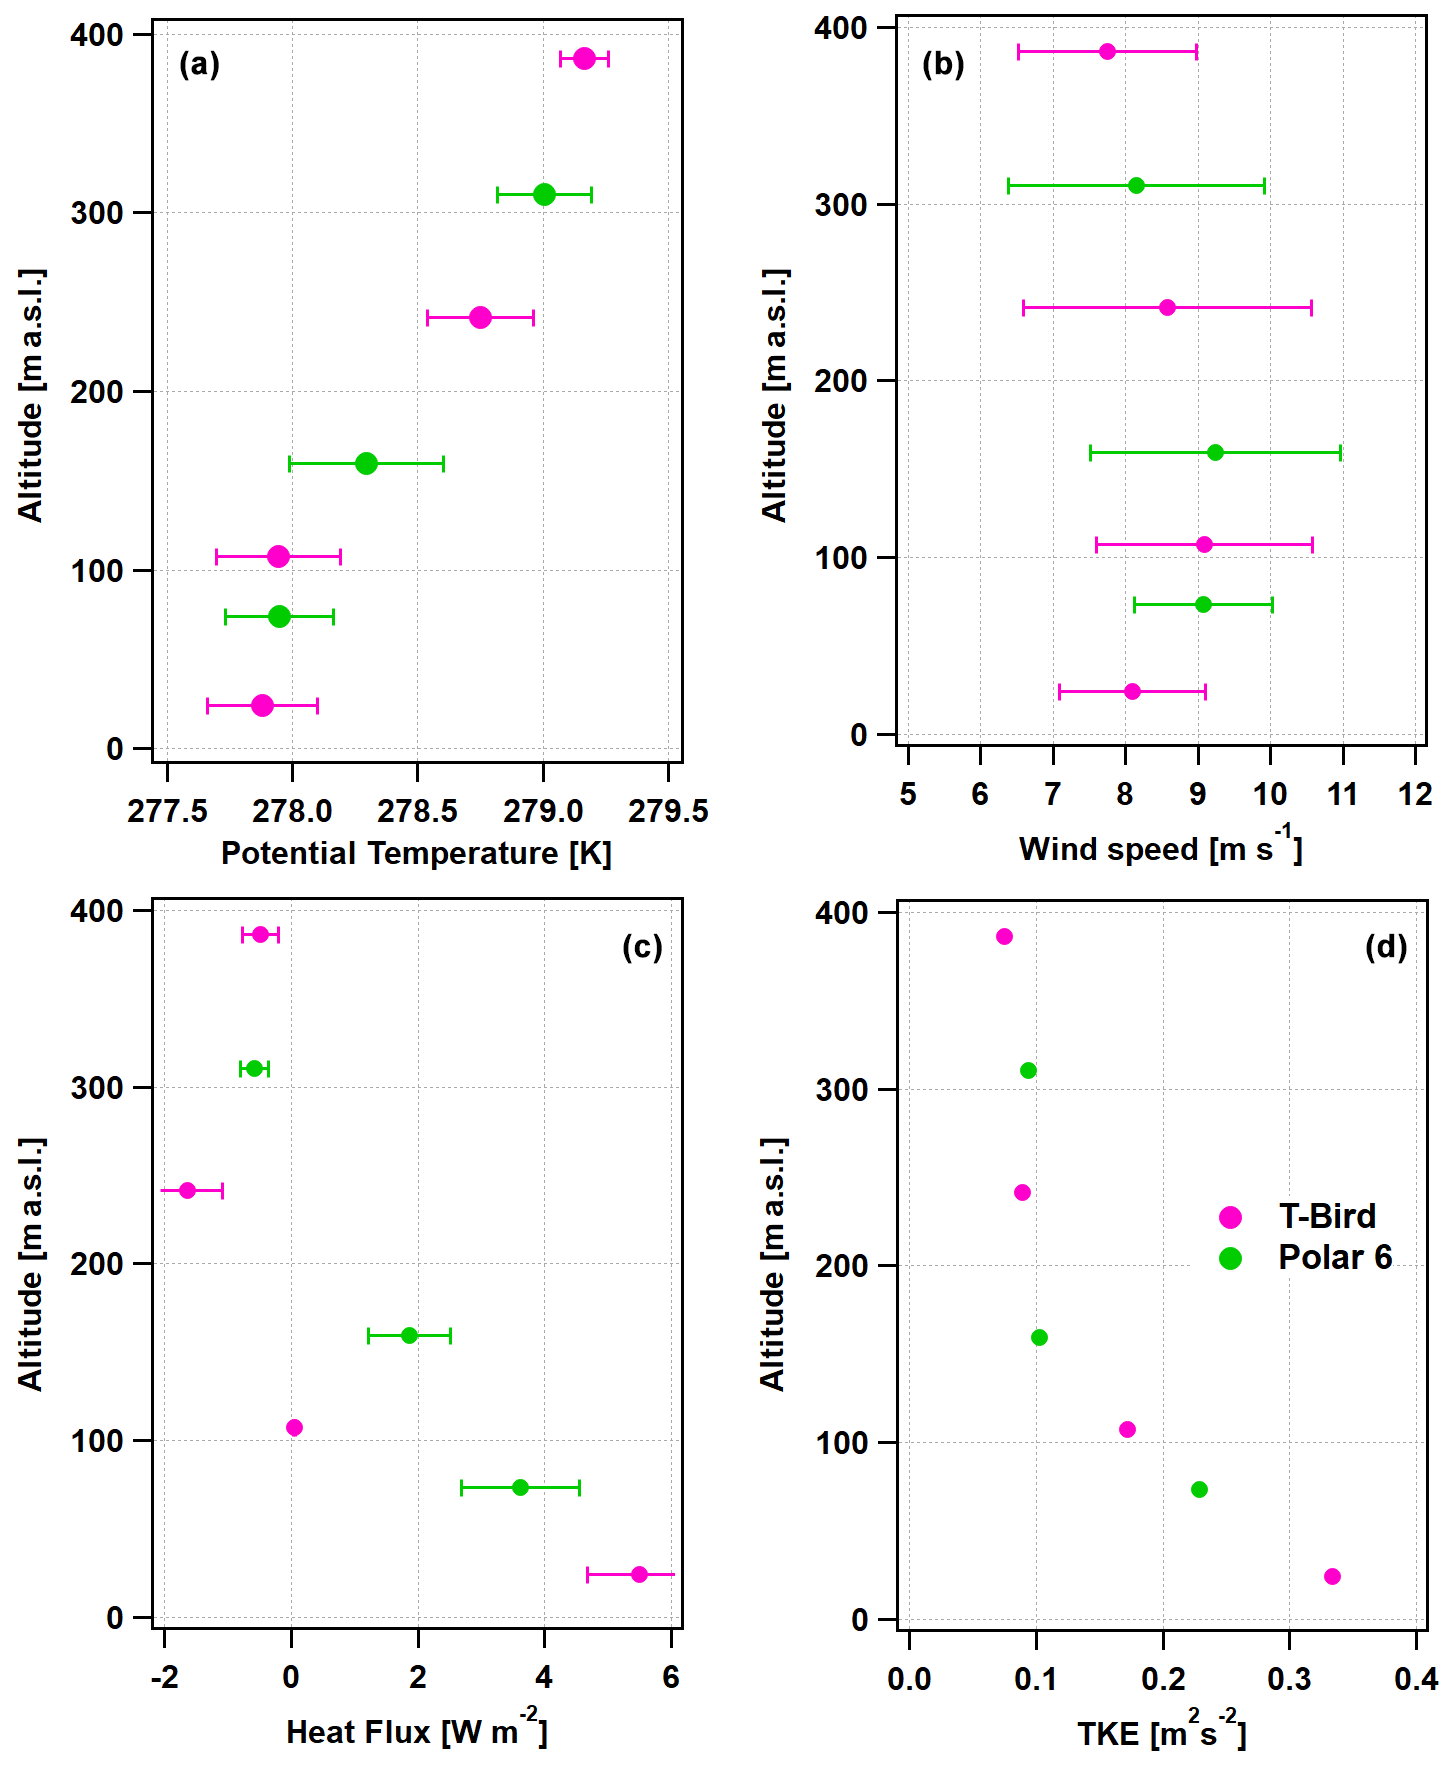
Figure 8Turbulence measurements as a function of altitude during the research flight on 5 October 2022 measured by Polar 6 (green markers) and the T-Bird (purple markers). Panel (a) shows the potential temperature (standard deviation as error bars), panel (b) the wind speed (standard deviation as error bars), panel (c) the sensible heat flux (sampling error as error bars), and panel (d) the turbulent kinetic energy. The sampling error in panel (c) at about 100 m is almost zero because it is proportional to the measured flux (Sreenivasan et al., 1978), which is close to zero at this point.
The temperature profile at WP1 (Fig. 9) reveals that the structure of the lower atmosphere is characterized by multiple inversions and mixed layers in between. The lowest one is the strong ABL capping inversion at about 100–130 m height. Above the inversion a well-mixed layer (in the following called residual layer) follows again. This layer is also capped by a strong inversion at about 750 m height, which reaches to about 1000 m. Then, another layer follows, which is also mixed but not so well as the residual layer. Finally, another inversion starts at about 1500 m height.
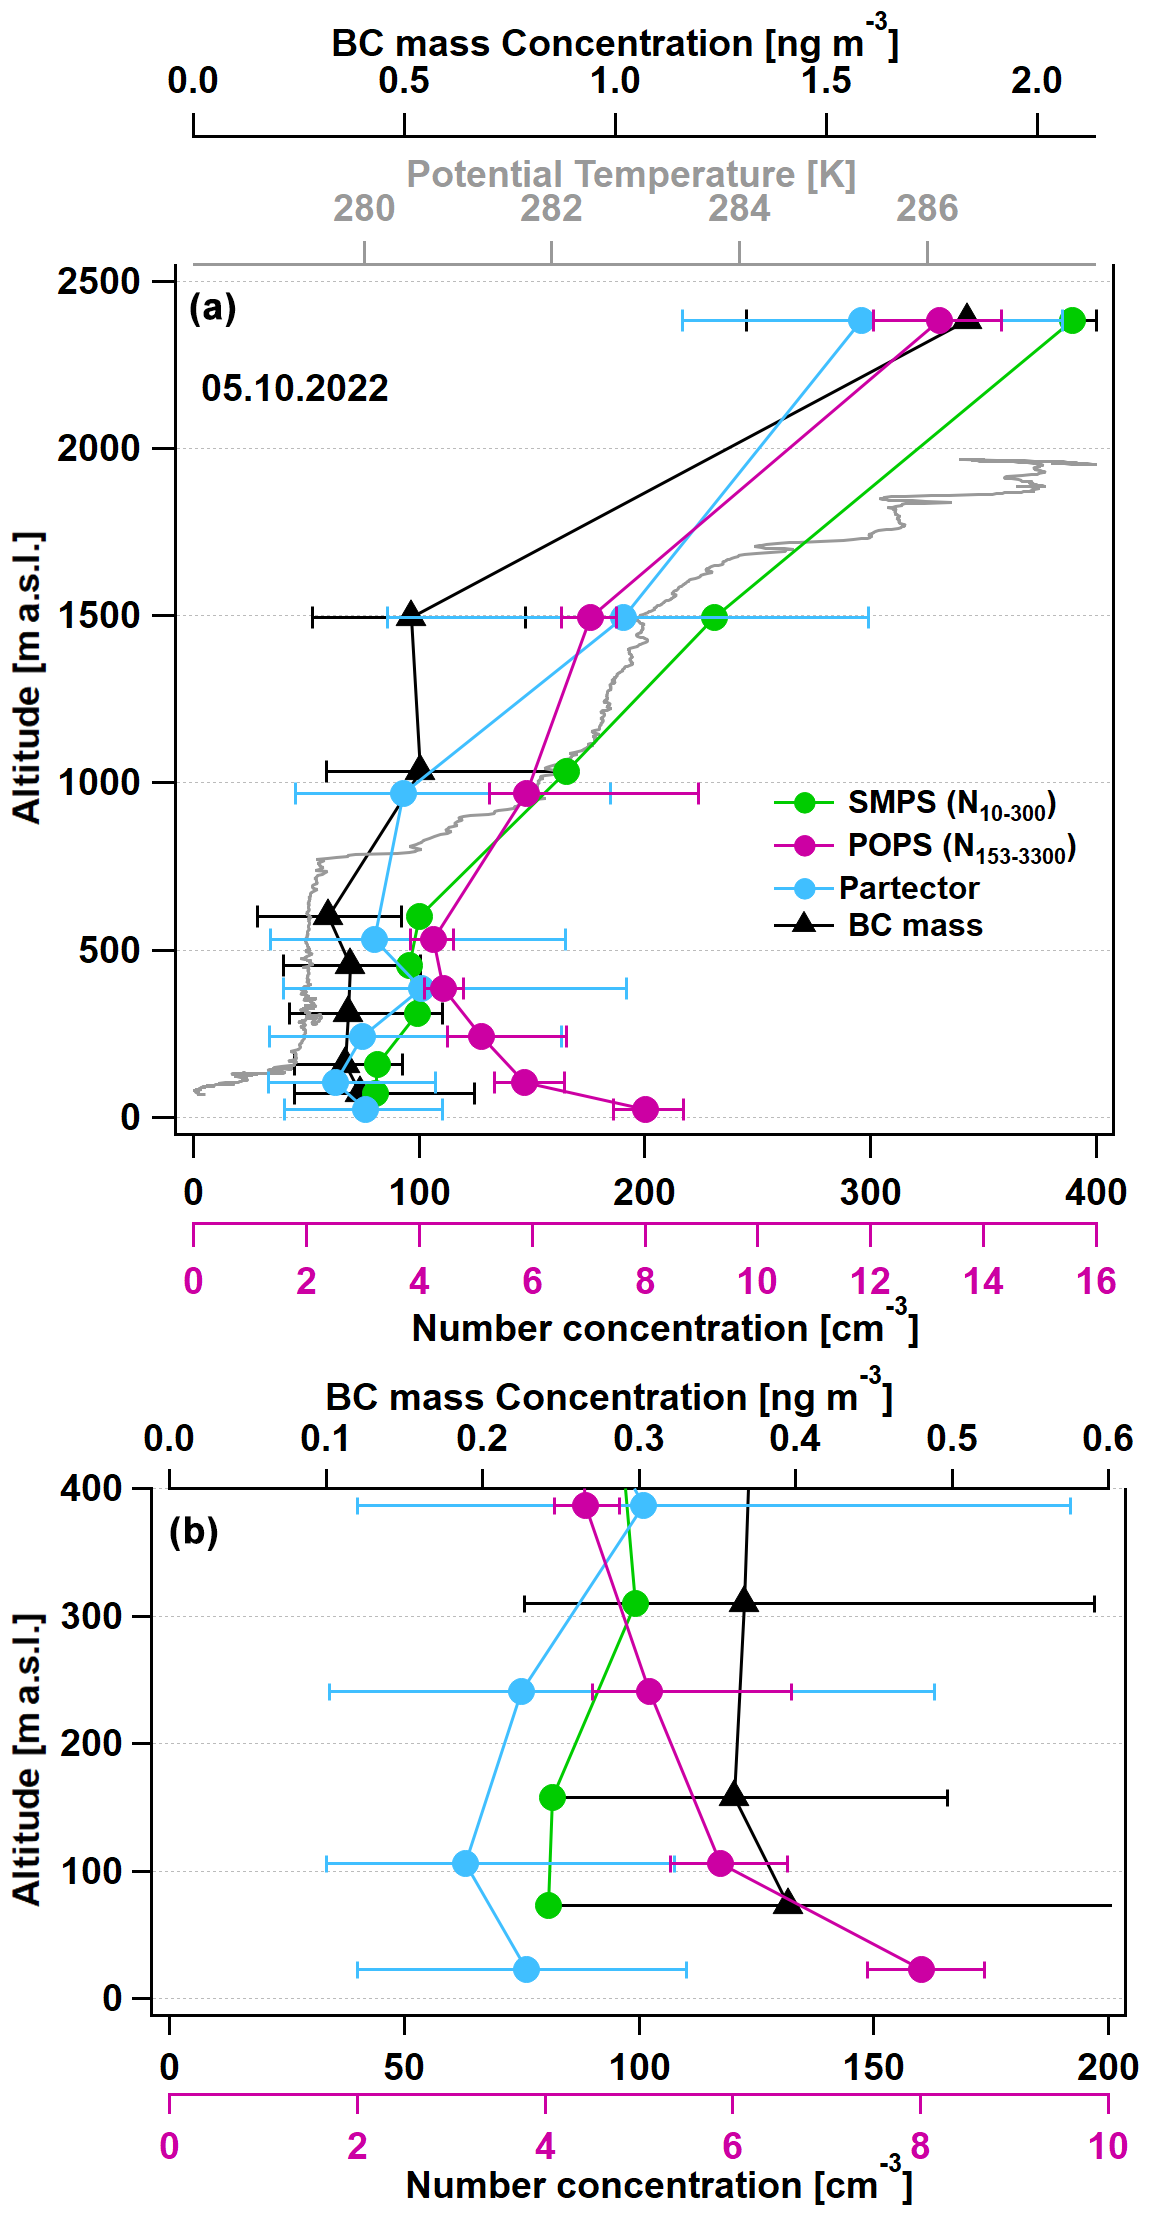
Figure 9Aerosol properties as a function of the altitude on 5 October 2022. The round markers show median aerosol number concentrations (blue: Partector; green: SMPS integrated between 10 and 300 nm; purple: POPS-corrected number concentration, bottom purple x axis), the black triangles (top black axis) show the median BC mass concentration, and the solid grey line shows the potential temperature (top grey axis). The error bars show the 25th and 75th percentiles. Panel (a) shows the entire altitude range, whereas panel (b) shows the same data zoomed into the lowermost altitude range up to 400 m altitude for better visibility.
The leg averages show the potential temperature, wind speed (Fig. 8a and b), and turbulence quantities (Fig. 8c and d), namely sensible heat flux and turbulent kinetic energy (TKE). For the calculation of these turbulence quantities by the eddy covariance method, the linear trends of wind and temperature between both WPs have been eliminated. Both the altitude-dependent potential temperature and heat fluxes (both obtained from the horizontal flight legs; Fig. 8a and c) point to a weak convectively mixed ABL below about 100 m height with small upward fluxes of sensible heat. It can be seen that the results from T-Bird (purple markers) and Polar 6 (green markers) fit very well with the results obtained from Polar 6 (green markers). This concerns especially potential temperature and wind with a weak low-level jet and turbulent kinetic energy. Also the sensible heat fluxes are reasonable, but at 150 m, the heat flux seems to be overestimated by Polar 6 since negative values could be expected near the inversion bottom. However, one should not overinterpret the heat flux values, since they are close to the detection limit. Usually, one would not expect an accuracy larger than ±2 W m−2 because of further errors other than the sampling error (shown in the figure as error bars), which are calculated following Sreenivasan et al. (1978) and Fiedler et al. (2010); e.g. especially near the inversion bottom, inhomogeneity can occur along the leg as well as intermittent turbulence, which makes the measurements less reliable during such legs (see Tetzlaff et al., 2015). In such cases the measured flux profile can deviate from its ideal shape described, for example, in Rampanelli and Zardi (2004). Nevertheless, it is impressing that although the ABL is only slightly convective and heat fluxes are very small in this considered case, in this considered case, the expected linear decrease from a maximum of heat flux near the surface to very small and sometimes negative (downward) values in the capping inversion is reproduced by the measurements. Also, the TKE altitude dependence with a maximum near the surface is physically reasonable.
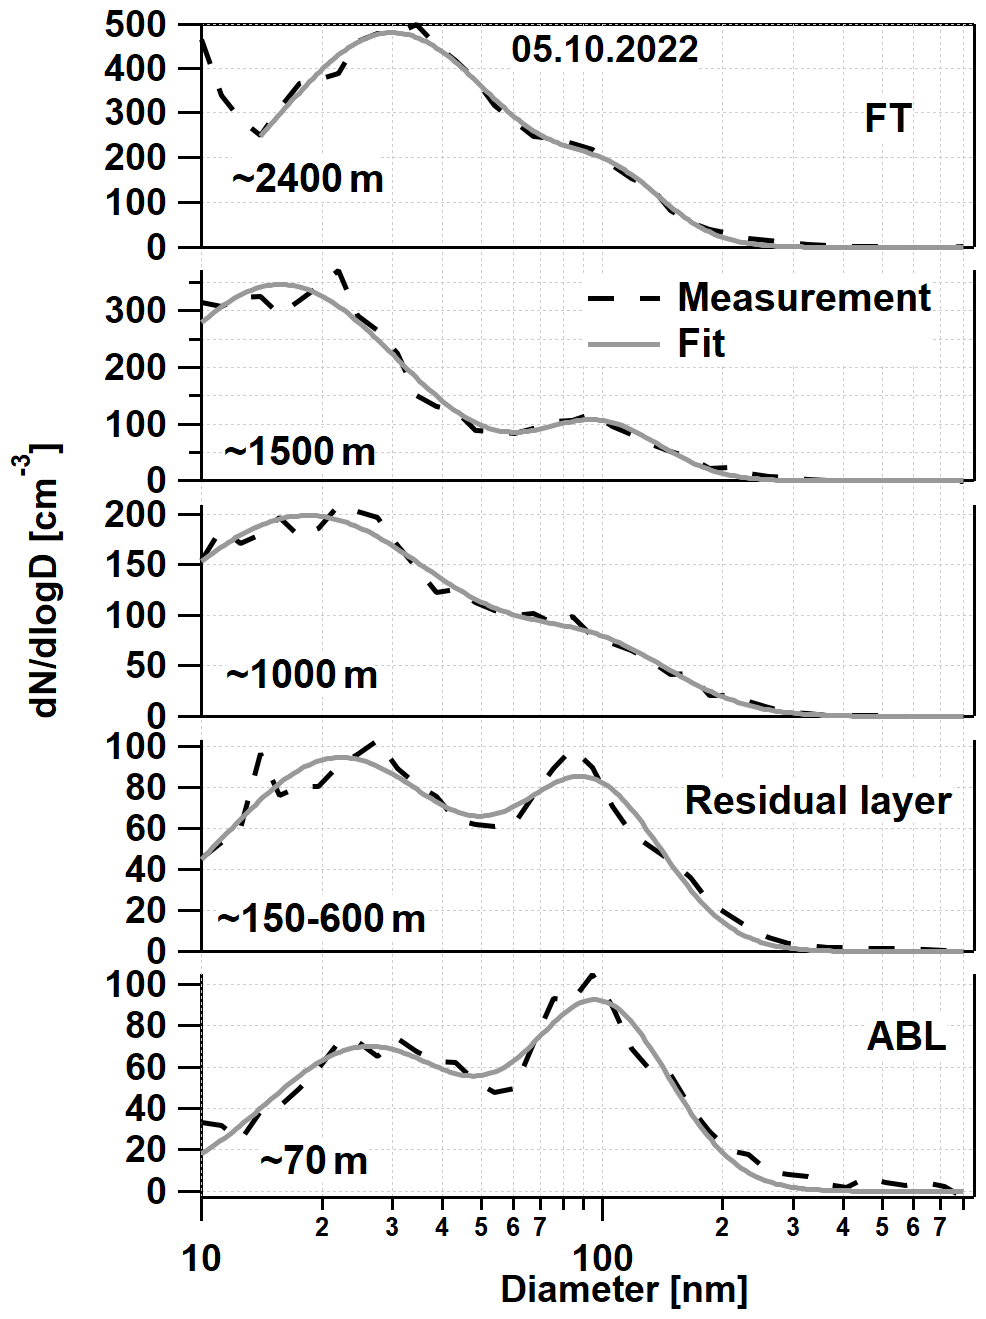
Figure 10The averaged aerosol number size distribution at different atmospheric layers during the research flight on 5 October 2022. The dashed black lines show the measurement, and the solid grey lines the fitted double lognormal distributions.
To investigate if and how the aerosol properties vary within these above-mentioned different atmospheric layers, median values and the 25th and 75th percentiles of the measured particle number concentrations encountered during each horizontal leg were determined and are marked by horizontal whiskers in Fig. 9. Since the SMPS instrument has a 5 min time resolution, during one altitude leg only 1–3 full scans could be performed. These scans were averaged and the number size distribution was integrated between 10 and 300 nm to obtain a number concentration comparable to the Partector. The measured aerosol concentrations as a function of the measurement altitude are shown in Fig. 9.
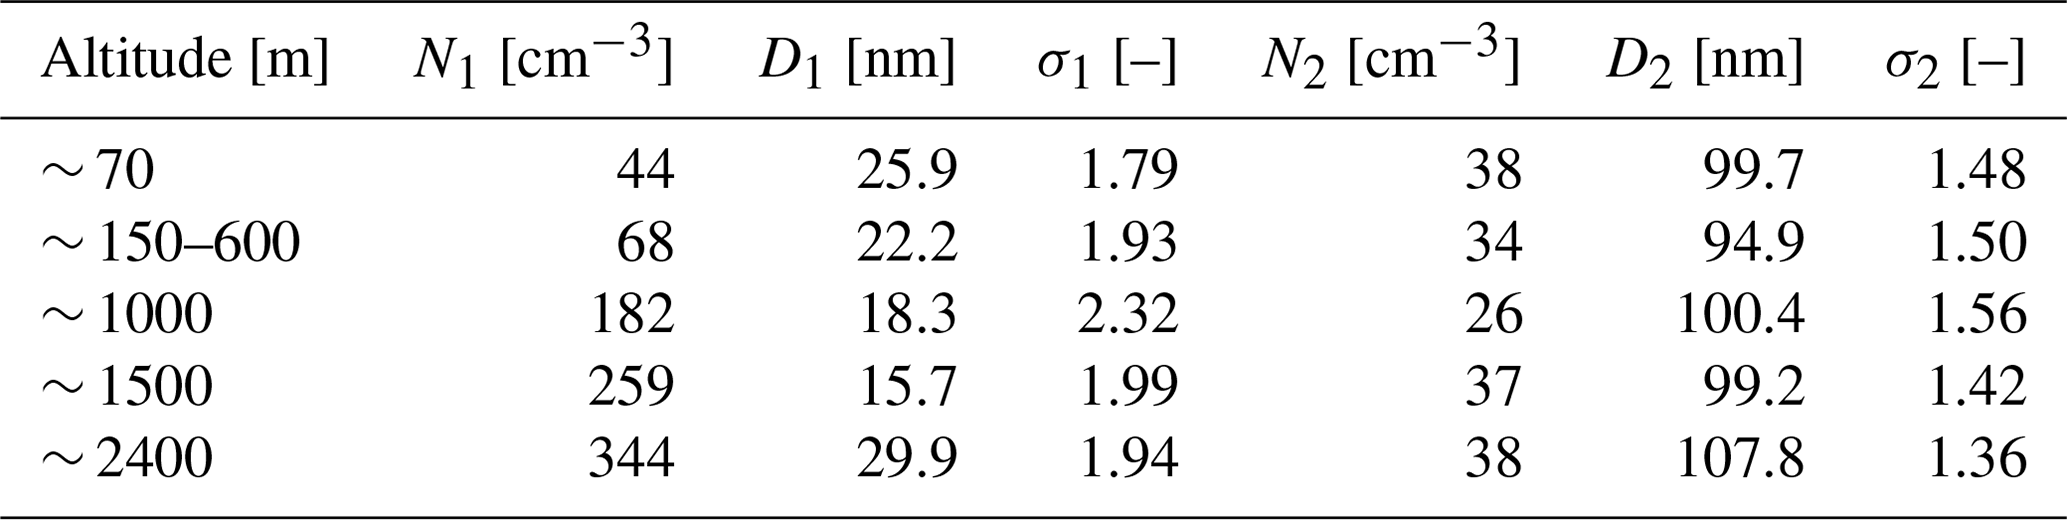
Table 2Number size distribution fit parameters on 5 October 2022 at the different altitude levels. N1 and N2 are number concentrations, D1 and D2 are geometric mean diameters, and σ1 and σ2 are geometric standard deviations of the first and second size distribution modes.
The median Np measured by the Partector stays relatively stable with increasing altitude through the boundary and residual layers (≈20–550 m) with values between 63 and 101 cm−3. Such low number concentrations are not unusual outside of the Arctic haze season in the region (e.g. Heintzenberg et al., 1991; Kupiszewski et al., 2013; Freud et al., 2017). Above the residual layer Np increases with the altitude in the free troposphere (FT) reaching a median concentration of ≈300 cm−3 at 2400 m altitude. N10–300 measured by the SMPS features similar behaviour as Np, with constant concentrations within the boundary and residual layers of 91–101 cm−3 and increasing concentration within the FT and a highest value of 386 cm−3. It is remarkable that the strong capping inversion above 100 m height has only little influence on the concentrations, while there are changes in concentrations at the inversions in the higher layers.
The situation changes if the number concentration of larger particles is investigated. The median of the corrected POPS number concentration between 153 nm and 3 µm is shown as purple dots in Fig. 9 corresponding to the purple abscissa. Due to the instrumental problems, we take these values as a qualitative measure for the amount of large particles. Thanks to the technology of the T-Bird, we were able to perform measurements as low as ≈20 m and this reveals a decreasing concentration from the ABL to the residual layer, which points to a source of large particles at the surface, which is probably sea spray. Apart from this, the behaviour of the larger particles at higher altitudes follows the behaviour of the number concentration of the smaller particles; i.e. we find much higher concentrations in the FT than below with an almost 3 times higher concentration at the highest measurement altitude compared to the residual layer.
Additionally to the number concentration, the SMPS aerosol number size distribution was also investigated at the different atmospheric layers (Fig. 10). The measured SMPS scans (1–3) were averaged within the individual layers and are shown as dashed black lines (please note the different y axis for the different panels). To follow the change in the size distribution modes, a double lognormal function was fitted to the measured data and is shown as grey lines. The obtained fit parameters are shown in Table 2.
At the highest altitude, in the FT, we see a sudden increase in the particle number concentration at the lowest size bins (∼10 nm), which can be an indication for new particle formation. However, we only see a small fraction of this mode due to the diameter limit of the SMPS. Therefore, we neither apply a fit to this mode nor speculate about it.
Furthermore, it seems that the increasing aerosol number concentration towards the FT is connected to the increasing number of particles below 40 nm. The concentration of the mode around 90–100 nm seems to stay relatively stable with concentrations between 25 and 40 cm−3, whereas the concentration of the first mode around 15–30 nm particle size increases continuously from ∼40 cm−3 in the ABL to more than 300 cm−3 in the FT.
The increased fraction of larger particles in the ABL can also be seen here, and the number size distribution at diameters larger than the second mode does not converge to zero (better visible with logarithmic y axis, not shown here), which might indicate the presence of another mode with even larger particle diameters around 400–600 nm. This points also to the presence of sea spray over the open water emitting larger sea-salt particles into the ABL.
Last but not least, the behaviour of the measured BC mass concentration through the different atmospheric layers will be discussed (Fig. 9, black dots with error bars showing the median and 25th and 75th percentiles), as measured by the SP2. The median values ranged between 0.32 and 1.83 ng m−3. These values are extremely low compared to the median summer (outside of the Arctic haze season) BC concentration of 4.7 ng m−3 measured during 2 aircraft campaigns in the European and Canadian Arctic region (Jurányi et al., 2023). The BC mass concentration follows the same pattern as the total aerosol number concentration with higher values in the FT and lower ones in the residual and boundary layers. This indicates that the BC is not freshly emitted and there is no larger source in the lower atmosphere on Svalbard.
To summarize the overall situation during the case study on 5 October 2022, we have encountered much higher aerosol number and BC mass concentration in the FT than in the layers below. This shows us that the FT is an important aerosol source, and particles are mainly transported downwards to the lower atmospheric layers. The origin of these particles might be long-range transport and recent new particle formation. The observed increased BC mass is an indication for the former and the presence of the high concentration of small particles for the latter. Next to this, the higher concentration of larger particles close to the open-water surface suggests the presence of an additional local aerosol source of sea spray.
The T-Bird towed instrument platform represents a valuable tool for studying aerosol and turbulence properties in the challenging low-altitude regions of the polar atmosphere. Initial tests during the BACSAM campaign demonstrated the system's ability to capture key aerosol parameters, even in areas previously inaccessible to standard aircraft due to altitude constraints. Despite some technical challenges, the results indicate promising performance for future studies.
The comparison between the T-Bird's onboard aerosol instruments and the aircraft's standard instrumentation showed strong correlation in particle number concentration when sampling the same air mass, confirming the functionality of the T-Bird system. Additionally, the ability to perform simultaneous two-level measurements offers new opportunities to study the vertical distribution of aerosols in relation to turbulent ABL processes.
Future deployments of the T-Bird, especially under different seasonal and geographic conditions, will enhance its utility in providing critical data for understanding aerosol–cloud interactions, long-range transport of pollutants, and Arctic amplification. Continued refinement of the system, particularly in addressing instrumental limitations, will further improve its capabilities and reliability as a key resource for polar atmospheric research. To support better intercomparison and validation of observations, future measurement campaigns will also aim to integrate the T-Bird aerosol instrumentation into the aircraft itself, where feasible.
The master tracks of the individual research flights during BACSAM can be found in the PANGAEA database: https://doi.org/10.1594/PANGAEA.958870 (Herber et al., 2023a); https://doi.org/10.1594/PANGAEA.958872 (Herber et al., 2023b); https://doi.org/10.1594/PANGAEA.958873 (Herber et al., 2023c); https://doi.org/10.1594/PANGAEA.958874 (Herber et al., 2023d); https://doi.org/10.1594/PANGAEA.958875 (Herber et al., 2023e); https://doi.org/10.1594/PANGAEA.958876 (Herber et al., 2023f); https://doi.org/10.1594/PANGAEA.958877 (Herber et al., 2023g); https://doi.org/10.1594/PANGAEA.958878 (Herber et al., 2023h).
The aerosol and turbulence data used in this study are available upon request.
ZJ took part in the planning of the T-Bird and in the BACSAM campaign, analysed and interpreted the data, and wrote the paper. CL initiated the T-Bird's development, took part in BACSAM, and analysed and interpreted the turbulence data. FS functioned as campaign PI during the BACSAM campaign and took part in flight planning and instrument operation on the aircraft, as well as in the analysis and interpretation of the aerosol-related data. JH took part in the flight campaign and analysed the meteorological and turbulence data. EG and MS designed and built the T-Bird and operated it during BACSAM. PH took part in BACSAM and analysed the flight behaviour of the T-Bird. DK helped with the T-Bird development and operated the aerosol instruments during BACSAM. BW and JS took part in BACSAM and operated the instrumentation. AS and DS helped with the data analysis and interpretation. SG designed the T-Bird's aerosol inlet and helped in the campaign preparations. MW took part in BACSAM. AH took part in the planning of the T-Bird, organized BACSAM, acted as PI, and took part in the data interpretation. All authors read and edited the manuscript.
The contact author has declared that none of the authors has any competing interests.
Publisher's note: Copernicus Publications remains neutral with regard to jurisdictional claims made in the text, published maps, institutional affiliations, or any other geographical representation in this paper. While Copernicus Publications makes every effort to include appropriate place names, the final responsibility lies with the authors.
The authors would like to thank all participants of the BACSAM aircraft campaign. The authors acknowledge support by the open-access publication funds of the Alfred-Wegener-Institut Helmholtz-Zentrum für Polar- und Meeresforschung.
This research has been supported by the Deutsche Forschungsgemeinschaft (grant no. 268020496).
The article processing charges for this open-access publication were covered by the Alfred-Wegener-Institut Helmholtz-Zentrum für Polar- und Meeresforschung.
This paper was edited by Glenn Wolfe and reviewed by Joshua Schwarz and one anonymous referee.
AMAP: Arctic Climate Change Update 2021: Key Trends and Impacts. Summary for Policy-makers, Arctic Monitoring and Assessment Programme (AMAP), Tromsø, Norway, 16 pp., https://www.amap.no/documents/doc/arctic-climate-change-update-2021-key-trends-and-impacts.-summary-for-policy-makers/3508 (last access: 21 July 2025), 2021. a, b
Asbach, C., Kaminski, H., Lamboy, Y., Schneiderwind, U., Fierz, M., and Todea, A. M.: Silicone sampling tubes can cause drastic artifacts in measurements with aerosol instrumentation based on unipolar diffusion charging, Aerosol Sci. Tech., 50, 1375–1384, https://doi.org/10.1080/02786826.2016.1241858, 2016. a
Barrie, L., Gregor, D., Hargrave, B., Lake, R., Muir, D., Shearer, R., Tracey, B., and Bidleman, T.: Arctic contaminants: sources, occurrence and pathways, Sci. Total Environ., 122, 1–74, https://doi.org/10.1016/0048-9697(92)90245-N, 1992. a
Bates, T. S., Quinn, P. K., Johnson, J. E., Corless, A., Brechtel, F. J., Stalin, S. E., Meinig, C., and Burkhart, J. F.: Measurements of atmospheric aerosol vertical distributions above Svalbard, Norway, using unmanned aerial systems (UAS), Atmos. Meas. Tech., 6, 2115–2120, https://doi.org/10.5194/amt-6-2115-2013, 2013. a, b
Bodhaine, B. A.: Barrow surface aerosol: 1976–1986, Atmos. Environ., 23, 2357–2369, https://doi.org/10.1016/0004-6981(89)90249-7, 1989. a
Bond, T. C., Anderson, T. L., and Campbell, D.: Calibration and intercomparison of filter-based measurements of visible light absorption by aerosols, Aerosol Sci. Tech., 30, 582–600, https://doi.org/10.1080/027868299304435, 1999. a
Brock, C. A., Cozic, J., Bahreini, R., Froyd, K. D., Middlebrook, A. M., McComiskey, A., Brioude, J., Cooper, O. R., Stohl, A., Aikin, K. C., de Gouw, J. A., Fahey, D. W., Ferrare, R. A., Gao, R.-S., Gore, W., Holloway, J. S., Hübler, G., Jefferson, A., Lack, D. A., Lance, S., Moore, R. H., Murphy, D. M., Nenes, A., Novelli, P. C., Nowak, J. B., Ogren, J. A., Peischl, J., Pierce, R. B., Pilewskie, P., Quinn, P. K., Ryerson, T. B., Schmidt, K. S., Schwarz, J. P., Sodemann, H., Spackman, J. R., Stark, H., Thomson, D. S., Thornberry, T., Veres, P., Watts, L. A., Warneke, C., and Wollny, A. G.: Characteristics, sources, and transport of aerosols measured in spring 2008 during the aerosol, radiation, and cloud processes affecting Arctic Climate (ARCPAC) Project, Atmos. Chem. Phys., 11, 2423–2453, https://doi.org/10.5194/acp-11-2423-2011, 2011. a
Cappelletti, D., Petroselli, C., Mateos, D., Herreras, M., Ferrero, L., Losi, N., Gregori?, A., Frangipani, C., La Porta, G., Lonardi, M., Chernov, D., and Dekhtyareva, A.: Vertical profiles of black carbon and nanoparticles pollutants measured by a tethered balloon in Longyearbyen (Svalbard islands), Atmos. Environ., 290, 119373, https://doi.org/10.1016/j.atmosenv.2022.119373, 2022. a
Chang, R. Y.-W., Leck, C., Graus, M., Müller, M., Paatero, J., Burkhart, J. F., Stohl, A., Orr, L. H., Hayden, K., Li, S.-M., Hansel, A., Tjernström, M., Leaitch, W. R., and Abbatt, J. P. D.: Aerosol composition and sources in the central Arctic Ocean during ASCOS, Atmos. Chem. Phys., 11, 10619–10636, https://doi.org/10.5194/acp-11-10619-2011, 2011. a
Chechin, D. G., Lüpkes, C., Hartmann, J., Ehrlich, A., and Wendisch, M.: Turbulent structure of the Arctic boundary layer in early summer driven by stability, wind shear and cloud-top radiative cooling: ACLOUD airborne observations, Atmos. Chem. Phys., 23, 4685–4707, https://doi.org/10.5194/acp-23-4685-2023, 2023. a
de Boer, G., Ivey, M., Schmid, B., Lawrence, D., Dexheimer, D., Mei, F., Hubbe, J., Bendure, A., Hardesty, J., Shupe, M. D., McComiskey, A., Telg, H., Schmitt, C., Matrosov, S. Y., Brooks, I., Creamean, J., Solomon, A., Turner, D. D., Williams, C., Maahn, M., Argrow, B., Palo, S., Long, C. N., Gao, R.-S., and Mather, J.: A bird's-eye view: development of an operational ARM unmanned aerial capability for atmospheric research in Arctic Alaska, B. Am. Meteorol. Soc., 99, 1197–1212, https://doi.org/10.1175/BAMS-D-17-0156.1, 2018. a
Ehrlich, A., Wendisch, M., Lüpkes, C., Buschmann, M., Bozem, H., Chechin, D., Clemen, H.-C., Dupuy, R., Eppers, O., Hartmann, J., Herber, A., Jäkel, E., Järvinen, E., Jourdan, O., Kästner, U., Kliesch, L.-L., Köllner, F., Mech, M., Mertes, S., Neuber, R., Ruiz-Donoso, E., Schnaiter, M., Schneider, J., Stapf, J., and Zanatta, M.: A comprehensive in situ and remote sensing data set from the Arctic CLoud Observations Using airborne measurements during polar Day (ACLOUD) campaign, Earth Syst. Sci. Data, 11, 1853–1881, https://doi.org/10.5194/essd-11-1853-2019, 2019. a
Ferrero, L., Ritter, C., Cappelletti, D., Moroni, B., Mo?nik, G., Mazzola, M., Lupi, A., Becagli, S., Traversi, R., Cataldi, M., Neuber, R., Vitale, V., and Bolzacchini, E.: Aerosol optical properties in the Arctic: the role of aerosol chemistry and dust composition in a closure experiment between Lidar and tethered balloon vertical profiles, Sci. Total Environ., 686, 452–467, https://doi.org/10.1016/j.scitotenv.2019.05.399, 2019. a
Fiedler, E., Lachlan-Cope, T., Renfrew, I., and King, J.: Convective heat transfer over thin ice covered coastal polynyas, J. Geophys. Res.-Oceans, 115, C10051, https://doi.org/10.1029/2009JC005797, 2010. a
Fierz, M., Meier, D., Steigmeier, P., and Burtscher, H.: Aerosol measurement by induced currents, Aerosol Sci. Tech., 48, 350–357, https://doi.org/10.1080/02786826.2013.875981, 2014. a
Freud, E., Krejci, R., Tunved, P., Leaitch, R., Nguyen, Q. T., Massling, A., Skov, H., and Barrie, L.: Pan-Arctic aerosol number size distributions: seasonality and transport patterns, Atmos. Chem. Phys., 17, 8101–8128, https://doi.org/10.5194/acp-17-8101-2017, 2017. a
Frey, W., Eichler, H., de Reus, M., Maser, R., Wendisch, M., and Borrmann, S.: A new airborne tandem platform for collocated measurements of microphysical cloud and radiation properties, Atmos. Meas. Tech., 2, 147–158, https://doi.org/10.5194/amt-2-147-2009, 2009. a
Gao, R. S., Telg, H., McLaughlin, R. J., Ciciora, S. J., Watts, L. A., Richardson, M. S., Schwarz, J. P., Perring, A. E., Thornberry, T. D., Rollins, A. W., Markovic, M. Z., Bates, T. S., Johnson, J. E., and Fahey, D. W.: A light-weight, high-sensitivity particle spectrometer for PM2.5 aerosol measurements, Aerosol Sci. Tech., 50, 88–99, https://doi.org/10.1080/02786826.2015.1131809, 2016. a, b
Grawe, S., Jentzsch, C., Schaefer, J., Wex, H., Mertes, S., and Stratmann, F.: Next-generation ice-nucleating particle sampling on board aircraft: characterization of the High-volume flow aERosol particle filter sAmpler (HERA), Atmos. Meas. Tech., 16, 4551–4570, https://doi.org/10.5194/amt-16-4551-2023, 2023. a, b
Gryanik, V. M. and Hartmann, J.: On a solution of the closure problem for dry convective boundary layer turbulence and beyond, J. Atmos. Sci., 79, 1405–1428, https://doi.org/10.1175/JAS-D-21-0107.1, 2022. a
Gysel, M., Laborde, M., Olfert, J. S., Subramanian, R., and Gröhn, A. J.: Effective density of Aquadag and fullerene soot black carbon reference materials used for SP2 calibration, Atmos. Meas. Tech., 4, 2851–2858, https://doi.org/10.5194/amt-4-2851-2011, 2011. a
Haas, C., Lobach, J., Hendricks, S., Rabenstein, L., and Pfaffling, A.: Helicopter-borne measurements of sea ice thickness, using a small and lightweight, digital EM system, J. Appl. Geophys., 67, 234–241, https://doi.org/10.1016/j.jappgeo.2008.05.005, 2009. a
Hartmann, J., Gehrmann, M., Kohnert, K., Metzger, S., and Sachs, T.: New calibration procedures for airborne turbulence measurements and accuracy of the methane fluxes during the AirMeth campaigns, Atmos. Meas. Tech., 11, 4567–4581, https://doi.org/10.5194/amt-11-4567-2018, 2018. a
Heidam, N. Z., Wåhlin, P., and Christensen, J. H.: Tropospheric gases and aerosols in Northeast Greenland, J. Atmos. Sci., 56, 261–278, https://doi.org/10.1175/1520-0469(1999)056<0261:TGAAIN>2.0.CO;2, 1999. a
Heintzenberg, J., Ström, J., Ogren, J., and Fimpel, H.-P.: Vertical profiles of aerosol properties in the summer troposphere of central Europe, scandinavia and the svalbard region, Atmos. Environ. A-Gen., 25, 621–627, https://doi.org/10.1016/0960-1686(91)90059-G, 1991. a
Herber, A., Lüpkes, C., and Stratmann, F.: Master track from POLAR 6 flight P6_237_BACSAM_2022_2210030201 in 1 sec resolution (zipped, 64 kBytes), PANGAEA [data set], https://doi.org/10.1594/PANGAEA.958870, 2023a. a
Herber, A., Lüpkes, C., and Stratmann, F.: Master track from POLAR 6 flight P6_237_BACSAM_2022_2210050301 in 1 sec resolution (zipped, 151 kBytes), PANGAEA [data set], https://doi.org/10.1594/PANGAEA.958872, 2023b. a
Herber, A., Lüpkes, C., and Stratmann, F.: Master track from POLAR 6 flight P6_237_BACSAM_2022_2210060401 in 1 sec resolution (zipped, 167 kBytes), PANGAEA [data set], https://doi.org/10.1594/PANGAEA.958873, 2023c. a
Herber, A., Lüpkes, C., and Stratmann, F.: Master track from POLAR 6 flight P6_237_BACSAM_2022_2210090501 in 1 sec resolution (zipped, 97 kBytes), PANGAEA [data set], https://doi.org/10.1594/PANGAEA.958874, 2023d. a
Herber, A., Lüpkes, C., and Stratmann, F.: Master track from POLAR 6 flight P6_237_BACSAM_2022_2210110601 in 1 sec resolution (zipped, 86 kBytes), PANGAEA [data set], https://doi.org/10.1594/PANGAEA.958875, 2023e. a
Herber, A., Lüpkes, C., and Stratmann, F.: Master track from POLAR 6 flight P6_237_BACSAM_2022_2210130701 in 1 sec resolution (zipped, 171 kBytes), PANGAEA [data set], https://doi.org/10.1594/PANGAEA.958876, 2023f. a
Herber, A., Lüpkes, C., and Stratmann, F.: Master track from POLAR 6 flight P6_237_BACSAM_2022_2210140801 in 1 sec resolution (zipped, 35 kBytes), PANGAEA [data set], https://doi.org/10.1594/PANGAEA.958877, 2023g. a
Herber, A., Lüpkes, C., and Stratmann, F.: Master track from POLAR 6 flight P6_237_BACSAM_2022_2210150901 in 1 sec resolution (zipped, 169 kBytes), PANGAEA [data set], https://doi.org/10.1594/PANGAEA.958878, 2023h. a
Jategaonkar, R. V.: Flight Vehicle System Identification: A Time-Domain Methodology, American Institute of Aeronautics and Astronautics, https://doi.org/10.2514/4.102790, 2006. a
Jeffries, M. O., Overland, J. E., and Perovich, D. K.: The Arctic shifts to a new normal, Phys. Today, 66, 35–40, https://doi.org/10.1063/PT.3.2147, 2013. a
Jurányi, Z., Zanatta, M., Lund, M. T., Samset, B. H., Skeie, R. B., Sharma, S., Wendisch, M., and Herber, A.: Atmospheric concentrations of black carbon are substantially higher in spring than summer in the Arctic, Commun. Earth Environ., 4, 91, https://doi.org/10.1038/s43247-023-00749-x, 2023. a, b, c
Kupiszewski, P., Leck, C., Tjernström, M., Sjogren, S., Sedlar, J., Graus, M., Müller, M., Brooks, B., Swietlicki, E., Norris, S., and Hansel, A.: Vertical profiling of aerosol particles and trace gases over the central Arctic Ocean during summer, Atmos. Chem. Phys., 13, 12405–12431, https://doi.org/10.5194/acp-13-12405-2013, 2013. a
Laborde, M., Mertes, P., Zieger, P., Dommen, J., Baltensperger, U., and Gysel, M.: Sensitivity of the Single Particle Soot Photometer to different black carbon types, Atmos. Meas. Tech., 5, 1031–1043, https://doi.org/10.5194/amt-5-1031-2012, 2012. a
Lata, N. N., Cheng, Z., Dexheimer, D., Zhang, D., Mei, F., and China, S.: Vertical gradient of size-resolved aerosol compositions over the Arctic reveals cloud processed aerosol in-cloud and above cloud, Environ. Sci. Technol., 57, 5821–5830, https://doi.org/10.1021/acs.est.2c09498, 2023. a
Law, K. S., Roiger, A., Thomas, J. L., Marelle, L., Raut, J.-C., Dalsøren, S., Fuglestvedt, J., Tuccella, P., Weinzierl, B., and Schlager, H.: Local Arctic air pollution: sources and impacts, Ambio, 46, 453–463, https://doi.org/10.1007/s13280-017-0962-2, 2017. a
Leaitch, W. R., Korolev, A., Aliabadi, A. A., Burkart, J., Willis, M. D., Abbatt, J. P. D., Bozem, H., Hoor, P., Köllner, F., Schneider, J., Herber, A., Konrad, C., and Brauner, R.: Effects of 20–100 nm particles on liquid clouds in the clean summertime Arctic, Atmos. Chem. Phys., 16, 11107–11124, https://doi.org/10.5194/acp-16-11107-2016, 2016. a
Mauritsen, T., Sedlar, J., Tjernström, M., Leck, C., Martin, M., Shupe, M., Sjogren, S., Sierau, B., Persson, P. O. G., Brooks, I. M., and Swietlicki, E.: An Arctic CCN-limited cloud-aerosol regime, Atmos. Chem. Phys., 11, 165–173, https://doi.org/10.5194/acp-11-165-2011, 2011. a
Mei, F., McMeeking, G., Pekour, M., Gao, R.-S., Kulkarni, G., China, S., Telg, H., Dexheimer, D., Tomlinson, J., and Schmid, B.: Performance assessment of Portable Optical Particle Spectrometer (POPS), Sensors, 20, 6294, https://doi.org/10.3390/s20216294, 2020. a
Moteki, N. and Kondo, Y.: Dependence of laser-induced incandescence on physical properties of black carbon aerosols: measurements and theoretical interpretation, Aerosol Sci. Tech., 44, 663–675, https://doi.org/10.1080/02786826.2010.484450, 2010. a, b, c
Nguyen, Q. T., Glasius, M., Sørensen, L. L., Jensen, B., Skov, H., Birmili, W., Wiedensohler, A., Kristensson, A., Nøjgaard, J. K., and Massling, A.: Seasonal variation of atmospheric particle number concentrations, new particle formation and atmospheric oxidation capacity at the high Arctic site Villum Research Station, Station Nord, Atmos. Chem. Phys., 16, 11319–11336, https://doi.org/10.5194/acp-16-11319-2016, 2016. a
Pätzold, F., Bretschneider, L., Nowak, S., Brandt, B., Schlerf, A., Asmussen, M. O., Bollmann, S., Bärfuss, K., Harm-Altstädter, B., Hecker, P., Wehner, B., van der Wall, B. G., Sachs, T., Huntrieser, H., Roiger, A., and Lampert, A.: HELiPOD – Revolution and evolution of a helicopter-borne measurement system for multidisciplinary research in demanding environments, Elementa: Science of the Anthropocene, 11, 00031, https://doi.org/10.1525/elementa.2023.00031, 2023. a
Peng, S., Yang, Q., Shupe, M. D., Xi, X., Han, B., Chen, D., Dahlke, S., and Liu, C.: The characteristics of atmospheric boundary layer height over the Arctic Ocean during MOSAiC, Atmos. Chem. Phys., 23, 8683–8703, https://doi.org/10.5194/acp-23-8683-2023, 2023. a
Petzold, A., Ogren, J. A., Fiebig, M., Laj, P., Li, S.-M., Baltensperger, U., Holzer-Popp, T., Kinne, S., Pappalardo, G., Sugimoto, N., Wehrli, C., Wiedensohler, A., and Zhang, X.-Y.: Recommendations for reporting ”black carbon” measurements, Atmos. Chem. Phys., 13, 8365–8379, https://doi.org/10.5194/acp-13-8365-2013, 2013. a
Pilz, C., Cassano, J. J., de Boer, G., Kirbus, B., Lonardi, M., Pöhlker, M., Shupe, M. D., Siebert, H., Wendisch, M., and Wehner, B.: Tethered balloon measurements reveal enhanced aerosol occurrence aloft interacting with Arctic low-level clouds, Elementa: Science of the Anthropocene, 12, 00120, https://doi.org/10.1525/elementa.2023.00120, 2024. a
Pithan, F. and Mauritsen, T.: Arctic amplification dominated by temperature feedbacks in contemporary climate models, Nat. Geosci., 7, 181–184, https://doi.org/10.1038/ngeo2071, 2014. a
Platt, S. M., Hov, Ø., Berg, T., Breivik, K., Eckhardt, S., Eleftheriadis, K., Evangeliou, N., Fiebig, M., Fisher, R., Hansen, G., Hansson, H.-C., Heintzenberg, J., Hermansen, O., Heslin-Rees, D., Holmén, K., Hudson, S., Kallenborn, R., Krejci, R., Krognes, T., Larssen, S., Lowry, D., Lund Myhre, C., Lunder, C., Nisbet, E., Nizzetto, P. B., Park, K.-T., Pedersen, C. A., Aspmo Pfaffhuber, K., Röckmann, T., Schmidbauer, N., Solberg, S., Stohl, A., Ström, J., Svendby, T., Tunved, P., Tørnkvist, K., van der Veen, C., Vratolis, S., Yoon, Y. J., Yttri, K. E., Zieger, P., Aas, W., and Tørseth, K.: Atmospheric composition in the European Arctic and 30 years of the Zeppelin Observatory, Ny-Ålesund, Atmos. Chem. Phys., 22, 3321–3369, https://doi.org/10.5194/acp-22-3321-2022, 2022. a
Pohorsky, R., Baccarini, A., Tolu, J., Winkel, L. H. E., and Schmale, J.: Modular Multiplatform Compatible Air Measurement System (MoMuCAMS): a new modular platform for boundary layer aerosol and trace gas vertical measurements in extreme environments, Atmos. Meas. Tech., 17, 731–754, https://doi.org/10.5194/amt-17-731-2024, 2024. a
Polissar, A., Hopke, P., Paatero, P., Kaufmann, Y., Hall, D., Bodhaine, B., Dutton, E., and Harris, J.: The aerosol at Barrow, Alaska: long-term trends and source locations, Atmos. Environ., 33, 2441–2458, https://doi.org/10.1016/S1352-2310(98)00423-3, 1999. a
Rampanelli, G. and Zardi, D.: A method to determine the capping inversion of the convective boundary layer, J. Appl. Meteorol., 43, 925–933, 2004. a
Schmale, J., Zieger, P., and Ekman, A. M. L.: Aerosols in current and future Arctic climate, Nat. Clim. Change, 11, 95–105, https://doi.org/10.1038/s41558-020-00969-5, 2021. a
Schwarz, J. P., Gao, R. S., Fahey, D. W., Thomson, D. S., Watts, L. A., Wilson, J. C., Reeves, J. M., Darbeheshti, M., Baumgardner, D. G., Kok, G. L., Chung, S. H., Schulz, M., Hendricks, J., Lauer, A., Kärcher, B., Slowik, J. G., Rosenlof, K. H., Thompson, T. L., Langford, A. O., Loewenstein, M., and Aikin, K. C.: Single-particle measurements of midlatitude black carbon and light-scattering aerosols from the boundary layer to the lower stratosphere, J. Geophys. Res.-Atmos., 111, D16207, https://doi.org/10.1029/2006JD007076, 2006. a
Shupe, M. D., Rex, M., Blomquist, B., Persson, P. O. G., Schmale, J., Uttal, T., Althausen, D., Angot, H., Archer, S., Bariteau, L., Beck, I., Bilberry, J., Bucci, S., Buck, C., Boyer, M., Brasseur, Z., Brooks, I. M., Calmer, R., Cassano, J., Castro, V., Chu, D., Costa, D., Cox, C. J., Creamean, J., Crewell, S., Dahlke, S., Damm, E., de Boer, G., Deckelmann, H., Dethloff, K., Dütsch, M., Ebell, K., Ehrlich, A., Ellis, J., Engelmann, R., Fong, A. A., Frey, M. M., Gallagher, M. R., Ganzeveld, L., Gradinger, R., Graeser, J., Greenamyer, V., Griesche, H., Griffiths, S., Hamilton, J., Heinemann, G., Helmig, D., Herber, A., Heuzé, C., Hofer, J., Houchens, T., Howard, D., Inoue, J., Jacobi, H.-W., Jaiser, R., Jokinen, T., Jourdan, O., Jozef, G., King, W., Kirchgaessner, A., Klingebiel, M., Krassovski, M., Krumpen, T., Lampert, A., Landing, W., Laurila, T., Lawrence, D., Lonardi, M., Loose, B., Lüpkes, C., Maahn, M., Macke, A., Maslowski, W., Marsay, C., Maturilli, M., Mech, M., Morris, S., Moser, M., Nicolaus, M., Ortega, P., Osborn, J., Pätzold, F., Perovich, D. K., Petäjä, T., Pilz, C., Pirazzini, R., Posman, K., Powers, H., Pratt, K. A., Preußer, A., Quéléver, L., Radenz, M., Rabe, B., Rinke, A., Sachs, T., Schulz, A., Siebert, H., Silva, T., Solomon, A., Sommerfeld, A., Spreen, G., Stephens, M., Stohl, A., Svensson, G., Uin, J., Viegas, J., Voigt, C., von der Gathen, P., Wehner, B., Welker, J. M., Wendisch, M., Werner, M., Xie, Z., and Yue, F.: Overview of the MOSAiC expedition: atmosphere, Elementa: Science of the Anthropocene, 10, 00060, https://doi.org/10.1525/elementa.2021.00060, 2022. a
Siebert, H., Franke, H., Lehmann, K., Maser, R., Saw, E. W., Schell, D., Shaw, R. A., and Wendisch, M.: Probing finescale dynamics and microphysics of clouds with helicopter-borne measurements, B. Am. Meteorol. Soc., 87, 1727–1738, https://doi.org/10.1175/BAMS-87-12-1727, 2006. a
Sirois, A. and Barrie, L. A.: Arctic lower tropospheric aerosol trends and composition at Alert, Canada: 1980–1995, J. Geophys. Res.-Atmos., 104, 11599–11618, https://doi.org/10.1029/1999JD900077, 1999. a
Sreenivasan, K., Chambers, A., and Antonia, R.: Accuracy of moments of velocity and scalar fluctuations in the atmospheric surface layer, Bound.-Lay. Meteorol., 14, 341–359, 1978. a
Szopa, S., Naik, V., Adhikary, B., Artaxo, P., Berntsen, T., Collins, W., Fuzzi, S., Gallardo, L., Kiendler-Scharr, A., Klimont, Z., Liao, H., Unger, N., and Zanis, P.: Short-Lived Climate Forcers, Cambridge University Press, Cambridge, UK and New York, NY, USA, https://doi.org/10.1017/9781009157896.008, 817–922, 2021. a
Tetzlaff, A., Lüpkes, C., and Hartmann, J.: Aircraft-based observations of atmospheric boundary-layer modification over Arctic leads, Q. J. Roy. Meteor. Soc., 141, 2839–2856, 2015. a
Tjernström, M., Leck, C., Birch, C. E., Bottenheim, J. W., Brooks, B. J., Brooks, I. M., Bäcklin, L., Chang, R. Y.-W., de Leeuw, G., Di Liberto, L., de la Rosa, S., Granath, E., Graus, M., Hansel, A., Heintzenberg, J., Held, A., Hind, A., Johnston, P., Knulst, J., Martin, M., Matrai, P. A., Mauritsen, T., Müller, M., Norris, S. J., Orellana, M. V., Orsini, D. A., Paatero, J., Persson, P. O. G., Gao, Q., Rauschenberg, C., Ristovski, Z., Sedlar, J., Shupe, M. D., Sierau, B., Sirevaag, A., Sjogren, S., Stetzer, O., Swietlicki, E., Szczodrak, M., Vaattovaara, P., Wahlberg, N., Westberg, M., and Wheeler, C. R.: The Arctic Summer Cloud Ocean Study (ASCOS): overview and experimental design, Atmos. Chem. Phys., 14, 2823–2869, https://doi.org/10.5194/acp-14-2823-2014, 2014. a
Vihma, T., Pirazzini, R., Fer, I., Renfrew, I. A., Sedlar, J., Tjernström, M., Lüpkes, C., Nygård, T., Notz, D., Weiss, J., Marsan, D., Cheng, B., Birnbaum, G., Gerland, S., Chechin, D., and Gascard, J. C.: Advances in understanding and parameterization of small-scale physical processes in the marine Arctic climate system: a review, Atmos. Chem. Phys., 14, 9403–9450, https://doi.org/10.5194/acp-14-9403-2014, 2014. a
Wendisch, M., Brückner, M., Burrows, J. P., Crewell, S., Dethloff, K., Ebell, K., Lüpkes, C., Macke, A., Notholt, J., Quaas, J., Rinke, A., and I., T.: Understanding causes and effects of rapid warming in the Arctic, Arctic. Eos, 98, 22–26, https://doi.org/10.1029/2017EO064803, 2017. a, b
Wendisch, M., Macke, A., Ehrlich, A., Lüpkes, C., Mech, M., Chechin, D., Dethloff, K., Velasco, C. B., Bozem, H., Brückner, M., Clemen, H.-C., Crewell, S., Donth, T., Dupuy, R., Ebell, K., Egerer, U., Engelmann, R., Engler, C., Eppers, O., Gehrmann, M., Gong, X., Gottschalk, M., Gourbeyre, C., Griesche, H., Hartmann, J., Hartmann, M., Heinold, B., Herber, A., Herrmann, H., Heygster, G., Hoor, P., Jafariserajehlou, S., Jäkel, E., Järvinen, E., Jourdan, O., Kästner, U., Kecorius, S., Knudsen, E. M., Köllner, F., Kretzschmar, J., Lelli, L., Leroy, D., Maturilli, M., Mei, L., Mertes, S., Mioche, G., Neuber, R., Nicolaus, M., Nomokonova, T., Notholt, J., Palm, M., van Pinxteren, M., Quaas, J., Richter, P., Ruiz-Donoso, E., Schäfer, M., Schmieder, K., Schnaiter, M., Schneider, J., Schwarzenböck, A., Seifert, P., Shupe, M. D., Siebert, H., Spreen, G., Stapf, J., Stratmann, F., Vogl, T., Welti, A., Wex, H., Wiedensohler, A., Zanatta, M., and Zeppenfeld, S.: The Arctic cloud puzzle: using ACLOUD/PASCAL multiplatform observations to unravel the role of clouds and aerosol particles in Arctic amplification, B. Am. Meteorol. Soc., 100, 841–871, https://doi.org/10.1175/BAMS-D-18-0072.1, 2019. a, b
Wendisch, M., Brückner, M., Crewell, S., Ehrlich, A., Notholt, J., Lüpkes, C., Macke, A., Burrows, J. P., Rinke, A., Quaas, J., Maturilli, M., Schemann, V., Shupe, M. D., Akansu, E. F., Barrientos-Velasco, C., Bärfuss, K., Blechschmidt, A.-M., Block, K., Bougoudis, I., Bozem, H., Böckmann, C., Bracher, A., Bresson, H., Bretschneider, L., Buschmann, M., Chechin, D. G., Chylik, J., Dahlke, S., Deneke, H., Dethloff, K., Donth, T., Dorn, W., Dupuy, R., Ebell, K., Egerer, U., Engelmann, R., Eppers, O., Gerdes, R., Gierens, R., Gorodetskaya, I. V., Gottschalk, M., Griesche, H., Gryanik, V. M., Handorf, D., Harm-Altstädter, B., Hartmann, J., Hartmann, M., Heinold, B., Herber, A., Herrmann, H., Heygster, G., Höschel, I., Hofmann, Z., Hölemann, J., Hünerbein, A., Jafariserajehlou, S., Jäkel, E., Jacobi, C., Janout, M., Jansen, F., Jourdan, O., Jurányi, Z., Kalesse-Los, H., Kanzow, T., Käthner, R., Kliesch, L. L., Klingebiel, M., Knudsen, E. M., Kovács, T., Körtke, W., Krampe, D., Kretzschmar, J., Kreyling, D., Kulla, B., Kunkel, D., Lampert, A., Lauer, M., Lelli, L., von Lerber, A., Linke, O., Löhnert, U., Lonardi, M., Losa, S. N., Losch, M., Maahn, M., Mech, M., Mei, L., Mertes, S., Metzner, E., Mewes, D., Michaelis, J., Mioche, G., Moser, M., Nakoudi, K., Neggers, R., Neuber, R., Nomokonova, T., Oelker, J., Papakonstantinou-Presvelou, I., Pätzold, F., Pefanis, V., Pohl, C., van Pinxteren, M., Radovan, A., Rhein, M., Rex, M., Richter, A., Risse, N., Ritter, C., Rostosky, P., Rozanov, V. V., Donoso, E. R., Saavedra-Garfias, P., Salzmann, M., Schacht, J., Schäfer, M., Schneider, J., Schnierstein, N., Seifert, P., Seo, S., Siebert, H., Soppa, M. A., Spreen, G., Stachlewska, I. S., Stapf, J., Stratmann, F., Tegen, I., Viceto, C., Voigt, C., Vountas, M., Walbröl, A., Walter, M., Wehner, B., Wex, H., Willmes, S., Zanatta, M., and Zeppenfeld, S.: Atmospheric and surface processes, and feedback mechanisms determining Arctic amplification: a review of first results and prospects of the (AC)3 project, B. Am. Meteorol. Soc., 104, E208–E242, https://doi.org/10.1175/BAMS-D-21-0218.1, 2023. a
Wendisch, M., Crewell, S., Ehrlich, A., Herber, A., Kirbus, B., Lüpkes, C., Mech, M., Abel, S. J., Akansu, E. F., Ament, F., Aubry, C., Becker, S., Borrmann, S., Bozem, H., Brückner, M., Clemen, H.-C., Dahlke, S., Dekoutsidis, G., Delanoë, J., De La Torre Castro, E., Dorff, H., Dupuy, R., Eppers, O., Ewald, F., George, G., Gorodetskaya, I. V., Grawe, S., Groß, S., Hartmann, J., Henning, S., Hirsch, L., Jäkel, E., Joppe, P., Jourdan, O., Jurányi, Z., Karalis, M., Kellermann, M., Klingebiel, M., Lonardi, M., Lucke, J., Luebke, A. E., Maahn, M., Maherndl, N., Maturilli, M., Mayer, B., Mayer, J., Mertes, S., Michaelis, J., Michalkov, M., Mioche, G., Moser, M., Müller, H., Neggers, R., Ori, D., Paul, D., Paulus, F. M., Pilz, C., Pithan, F., Pöhlker, M., Pörtge, V., Ringel, M., Risse, N., Roberts, G. C., Rosenburg, S., Röttenbacher, J., Rückert, J., Schäfer, M., Schaefer, J., Schemann, V., Schirmacher, I., Schmidt, J., Schmidt, S., Schneider, J., Schnitt, S., Schwarz, A., Siebert, H., Sodemann, H., Sperzel, T., Spreen, G., Stevens, B., Stratmann, F., Svensson, G., Tatzelt, C., Tuch, T., Vihma, T., Voigt, C., Volkmer, L., Walbröl, A., Weber, A., Wehner, B., Wetzel, B., Wirth, M., and Zinner, T.: Overview: quasi-Lagrangian observations of Arctic air mass transformations – introduction and initial results of the HALO–(𝒜𝒞)3 aircraft campaign, Atmos. Chem. Phys., 24, 8865–8892, https://doi.org/10.5194/acp-24-8865-2024, 2024. a
Wesche, C., Steinhage, D., and Nixdorf, U.: Polar aircraft Polar 5 and Polar 6 operated by the Alfred Wegener Institute, J. Large-Scale Res. Facil., 2, A87 https://doi.org/10.17815/jlsrf-2-153, 2016. a
Wiedensohler, A., Birmili, W., Nowak, A., Sonntag, A., Weinhold, K., Merkel, M., Wehner, B., Tuch, T., Pfeifer, S., Fiebig, M., Fjäraa, A. M., Asmi, E., Sellegri, K., Depuy, R., Venzac, H., Villani, P., Laj, P., Aalto, P., Ogren, J. A., Swietlicki, E., Williams, P., Roldin, P., Quincey, P., Hüglin, C., Fierz-Schmidhauser, R., Gysel, M., Weingartner, E., Riccobono, F., Santos, S., Grüning, C., Faloon, K., Beddows, D., Harrison, R., Monahan, C., Jennings, S. G., O'Dowd, C. D., Marinoni, A., Horn, H.-G., Keck, L., Jiang, J., Scheckman, J., McMurry, P. H., Deng, Z., Zhao, C. S., Moerman, M., Henzing, B., de Leeuw, G., Löschau, G., and Bastian, S.: Mobility particle size spectrometers: harmonization of technical standards and data structure to facilitate high quality long-term observations of atmospheric particle number size distributions, Atmos. Meas. Tech., 5, 657–685, https://doi.org/10.5194/amt-5-657-2012, 2012. a
Willis, M. D., Bozem, H., Kunkel, D., Lee, A. K. Y., Schulz, H., Burkart, J., Aliabadi, A. A., Herber, A. B., Leaitch, W. R., and Abbatt, J. P. D.: Aircraft-based measurements of High Arctic springtime aerosol show evidence for vertically varying sources, transport and composition, Atmos. Chem. Phys., 19, 57–76, https://doi.org/10.5194/acp-19-57-2019, 2019. a
Yamanouchi, T., Treffeisen, R., Herber, A., Shiobara, M., Yamagata, S., Hara, K., Sato, K., Yabuki, M., Tomikawa, Y., Rinke, A., Neuber, R., Schumachter, R., Kriews, M., Ström, J. ., Schrems, O., and Gernandt, H.: Arctic Study of Tropospheric Aerosol and Radiation (ASTAR) 2000: Arctic haze case study, Tellus B, 57, 141–152, https://doi.org/10.3402/tellusb.v57i2.16784, 2005. a