the Creative Commons Attribution 4.0 License.
the Creative Commons Attribution 4.0 License.
 | 30 Jul 2025
Interpretation of mass spectra by a Vocus proton-transfer-reaction mass spectrometer (PTR-MS) at an urban site: insights from gas chromatographic pre-separation
Ying Zhang
Yuwei Wang
Chuang Li
Yueyang Li
Sijia Yin
Megan S. Claflin
Brian M. Lerner
Douglas Worsnop
Volatile organic compounds (VOCs) are important atmospheric components that contribute to air pollution, but their accurate quantification by proton-transfer-reaction mass spectrometry (PTR-MS) remains challenging. In this work, we coupled a gas chromatograph (GC) prior to PTR-MS and analyzed complex ambient air in urban Shanghai to speciate the PTR signal to identify the VOC species that were responsible for the generation of the ions detected by PTR. We classified 176 individual PTR signals with associated compounds resolved by the GC based on whether they could be used to quantify a VOC species without pre-separation. In this classification, Category I includes 45 decent signal ions that were produced from a single VOC species and thus can be used for reliable quantification, although some of the Category I ions are not the conventionally used protonated quasi-molecular ions (MH+). Category II includes 39 signal ions that were produced from a group of isomers and can be used to quantify the isomeric sum, but with an increased uncertainty if a single calibration factor for one specific isomer is used to represent all structures. Category III includes 92 signal ions that were generated from more than one non-isomeric species (e.g., through protonation, fragmentation, cluster formation) and thus merely gave an upper limit of VOC concentrations. In addition, we propose taking aromatic compounds, for instance, the quantification of selected VOCs, utilizing either non-MH+ or non-Category I ions. Our results help to achieve more comprehensive species identification and reliable VOC quantification in PTR measurements.
- Article
(4631 KB) - Full-text XML
-
Supplement
(1318 KB) - BibTeX
- EndNote


Volatile organic compounds (VOCs) are ubiquitous in the atmosphere and have been extensively studied and regulated due to their negative impacts on human health (Zhou et al., 2023) and air quality (Mozaffar and Zhang, 2020). Tens of thousands of VOCs have been observed in the atmosphere (Williams and Koppmann, 2010) as a result of the enormous variations in their primary emissions from both biogenic and anthropogenic sources and the additional complexity acquired during their secondary transformation (Chen et al., 2019; Li et al., 2021; von Schneidemesser et al., 2010). To understand the sources, fates, and environmental and health effects of VOCs, comprehensive identification of VOCs together with accurate quantification is essential.
Gas chromatography mass spectrometry (GC-MS), one of the most widely used techniques for VOC measurements, separates mixed VOCs through GC and detects VOCs through various MS detectors. GC-MS enables isomer-specific measurements of VOCs, but the chromatographic separation process together with the potential pre-concentration step limits the time resolution of the sample analysis and thus prevents real-time measurements of VOCs (Hamilton, 2010; Helmig, 1999; Santos and Galceran, 2002). On the other hand, proton-transfer-reaction mass spectrometry (PTR-MS) is an technique with high temporal resolution to capture the rapid variations in VOCs in a real-time manner (Badjagbo et al., 2007; Blake et al., 2009; Nozière et al., 2015; Yuan et al., 2017). This, together with other advantages of PTR-MS such as convenient calibration, has caused the method to be widely adopted in recent years (Li et al., 2024c; Vettikkat et al., 2023; Wang et al., 2022; Yesildagli et al., 2023).
PTR is considered a soft-ionization technique. The reagent ion (H3O+) can undergo proton-transfer reactions with VOCs that have proton affinities higher than that of H2O. Ideally, the collision between the reagent ion H3O+ and an analyte molecule (M) in the ion–molecule reactor (IMR) leads to the generation of a protonated molecule MH+ without fragmentation as an assumption, so hundreds of trace VOCs can be detected simultaneously (Hansel et al., 1995; Lindinger et al., 1998). Quantitative analysis of PTR-MS measurements of VOCs using MH+ requires calibration of authentic standards, but it is impractical to calibrate all VOC species detected by PTR. For uncalibrated VOCs, their mixing ratios can be calculated theoretically (Cappellin et al., 2012) because the sensitivities of VOCs in PTR-MS measurements are considered to be proportional to their rate constants, kPTR (Sekimoto et al., 2017; Smith and Španěl, 2011), of the corresponding proton-transfer reactions, providing an approach to estimate the quantity of VOCs that have not been explicitly calibrated for (Sekimoto and Koss, 2021).
Inter-comparisons between PTR-MS and other measurement techniques, such as GC and liquid chromatograph (LC) with mass spectrometry or flame ionization detectors, have been widely performed (Anderson et al., 2019; Cui et al., 2016; Dunne et al., 2018; de Gouw et al., 2003a; de Gouw and Warneke, 2007). Several VOCs, for example acetaldehyde, acetic acid, and isoprene, show poor agreement (Coggon et al., 2024; Cui et al., 2016; Dunne et al., 2018; de Gouw et al., 2003a, b; de Gouw and Warneke, 2007; Warneke et al., 2003). This observation can be attributed to multiple reasons. In the chromatographic measurement, for example, inappropriate columns and/or temperature programming led to incomplete elution and underreporting, and contamination of the Na2SO3 ozone trap resulted in the production of artifact aldehydes (de Gouw et al., 2003a). In the PTR measurements, for example, side ion–molecule reactions including fragmentation, dehydration, and water clustering between M and H3O+ led to complex product ion distributions in addition to the protonated quasi-molecular ion MH+ (Romano and Hanna, 2018). In addition, the discharge of back-flowed nitrogen and oxygen produces the reagent ions O and NO+ in the IMR to ionize VOC molecules via other ionization pathways (e.g., charge transfer to form M+ signal ions) (Link et al., 2025).
Fragmentation and dehydration of MH+ and the generation of M+ lead to interference with lower (mass-to-charge ratio) ions, and formation of the [MH+(H2O)n]+ cluster interferes with larger ions (Leglise et al., 2019; Pagonis et al., 2019). Thus, artifacts arise when measuring ambient air with complex VOC mixtures since many ion formulas can be produced by multiple VOCs with different molecular formulas (Baasandorj et al., 2015). The lack of specificity of the PTR, i.e., not solely producing protonated quasi-molecular ions (MH+) of the VOC molecules (M), makes it difficult to accurately quantify VOC molecules without further analysis or the employment of complementary analytical methods.
One way to study the possible interference incurred during PTR-MS measurements is to measure standards (Ambrose et al., 2010; Aprea et al., 2007; Brown et al., 2010; Buhr et al., 2002; Leglise et al., 2019; Li et al., 2024a; Romano and Hanna, 2018; Tani et al., 2003). With the elucidation of the full distribution of product ions generated by an authentic VOC standard in the PTR, the user can determine whether this VOC will interfere with the values that are used to quantify other VOCs. For example, previous studies show that pentanal (C5H10O) (Li et al., 2024a) and octanal (C8H16O) (Buhr et al., 2002) undergo fragmentation in the IMR to generate C5H signals that interfere with the measurement of isoprene (C5H8) and that ethyl acetate (C4H4O2) generates C2H5O signals that interfere with the measurement of acetic acid (C2H4O2) (Aprea et al., 2007). Although libraries for reference are available (Pagonis et al., 2019; Yáñez-Serrano et al., 2021; Yuan et al., 2017), it is impractical to quantitatively account for all this potential interference, given the number of VOCs that can be simultaneously ionized and detected by PTR-MS and because the interference is dependent on the environment.
Another approach is to pre-separate VOCs via chromatographic techniques, for instance GC, prior to their ionization in the PTR reactor (Coggon et al., 2024; de Gouw et al., 2003b; de Gouw and Warneke, 2007; Link et al., 2025; Warneke et al., 2003). In situ GC pre-separation properly characterizes the relative contributions of different VOC species to a PTR signal of interest in an ambient measurement. A key assumption to this approach is that the species detected by PTR are not lost in the pre-concentration and separation processes of the GC, i.e., the GC chromatogram should separate and elute all species that can be detected by PTR, and these species can be preferentially identified unambiguously. GC chromatograms of several key PTR signals were investigated in previous studies (Table S1 in the Supplement), showing varying extents of disturbance in different locations and seasons (Coggon et al., 2024; de Gouw et al., 2003b; Warneke et al., 2003; Vermeuel et al., 2023). These studies have predominately presented measurements from relatively clean sites compared to the typical air quality in Shanghai, which will be the focus of our study. Since VOC interference in more polluted air samples could be much more severe, there is an urgent demand to expand our knowledge on interference to the full PTR-MS spectra in new environments and to establish a method to derive accurate VOC concentrations from PTR-MS measurements.
In this study, we coupled an online GC equipped with thermal desorption pre-concentration and two parallel chromatographic columns to a Vocus PTR-MS and measured ambient air with a complex VOC composition at an urban site in Shanghai. Through application of three VOC measurement modes, (1) direct PTR measurements that analyze ambient air in a real-time manner (RT-PTR), (2) PTR measurements of eluted VOCs that were sampled and separated by the GC system (GC-PTR-MS), and (3) EI (electron impact) MS measurements of eluted VOCs that were sampled and separated by the GC system (GC-EI-MS), we established a reference table for compound identification i.e., assigning individual PTR signals to the contributing compounds. Quantitative inter-comparisons between GC-PTR-MS and RT-PTR-MS were also performed to quantify the extent of interference. Methods for appropriate quantification and correction of selected PTR signals, taking aromatic compounds as examples, were proposed.
2.1 Measurement site
VOC measurements were conducted from 24 January to 28 February 2022 on the rooftop of the Environmental Science Building (31.34° N, 121.52° E) at the Jiangwan campus of Fudan University in urban Shanghai, China (Fig. S1 in the Supplement). The site is surrounded by residential dwellings and a few industrial enterprises and is characterized by strong anthropogenic emissions (Abudumutailifu et al., 2024; Zhang et al., 2024). Note that the instrument was under maintenance from 20:00 LT on 11 February to 20:00 LT on 16 February 2022 (note that all times in this paper are in local time, UTC+8).
2.2 Instrument description and data acquisition
Measurements were performed in cycles that lasted 1 h, with the switch between three detection modes as shown in Fig. 1: (1) RT-PTR (brown): real-time measurements of ambient air using a Vocus PTR-MS; (2) GC-PTR (green): GC combined with Vocus PTR-MS; and (3) GC-EI-MS (blue): GC combined with EI-ToF-MS (ToF is time of flight).
The GC system (Aerodyne Research) is equipped with two separation channels, i.e., Ch1 and Ch2. Overall, for this study, the GC system was optimized to resolve VOCs and oxygenated VOCs (OVOCs) in the C5–C15 n-alkane volatility range. Ch1 utilizes a Rxi-624 column (30 m length × 0.25 mm inner diameter, 1.4 µm film thickness; Restek, USA) that is suitable for non-polar to mid-polarity VOCs including hydrocarbons, oxygenates, and nitrogen- and sulfur-containing compounds. Ch2 is equipped with an MXT-WAX column (30 m length × 0.25 mm inner diameter, 0.25 µm film thickness; Restek, USA) that is suitable for the separation of hydrocarbons with higher carbon numbers and VOCs with higher polarities. The two-channel GC has an integrated two-stage thermal desorption pre-concentration system (TDPC) similar to the systems described by Claflin et al. (2021) and Vermeuel et al. (2023). The detailed description of measuring setups and procedures are provided in the Supplement together with the temperature profiles of the two-channel GC system (Fig. S2).
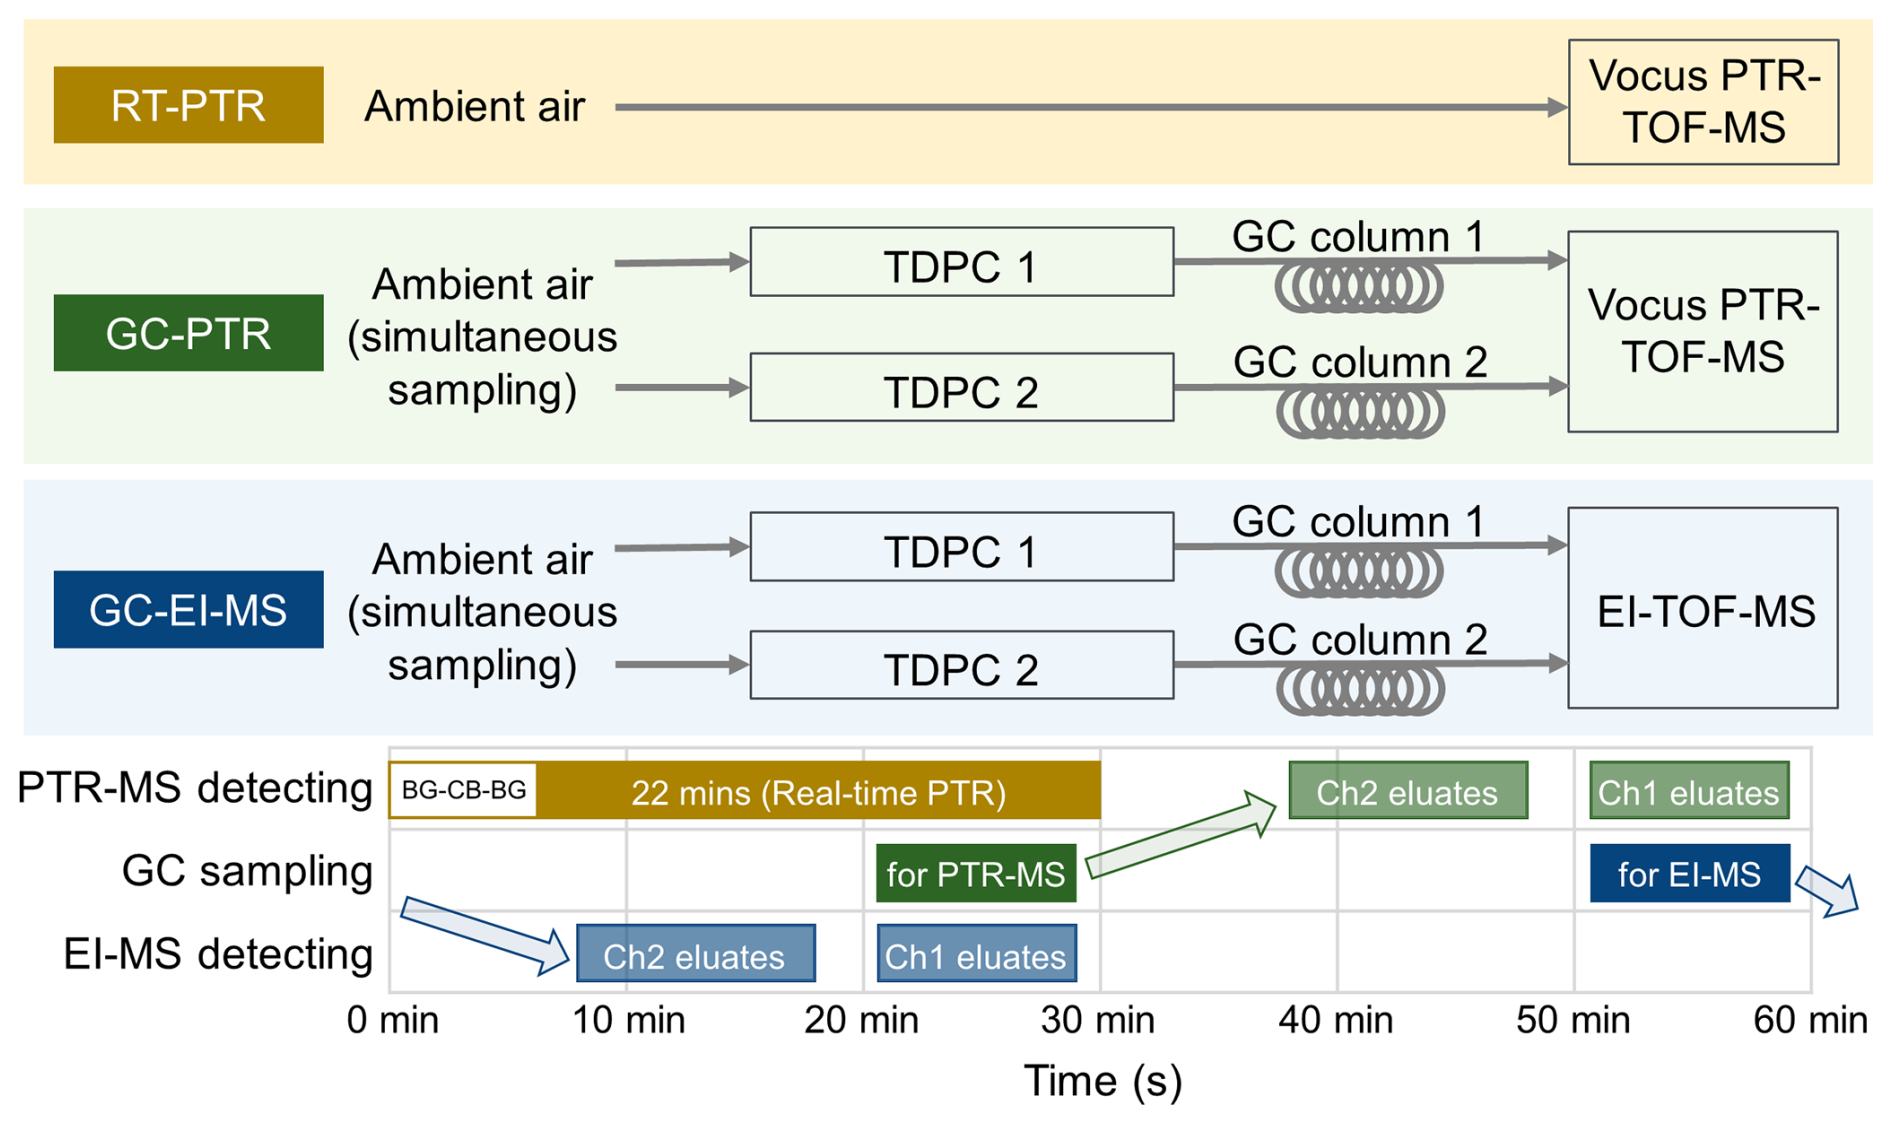
Figure 1Instrument setup for VOC measurements, which were switched among RT-PTR, GC-PTR, and GC-EI-ToF modes. BG-CB-BG stands for background (2 min) calibration (2 min) background (4 min). TDPC stands for the thermal desorption pre-concentration system.
In each instrument cycle (Fig. 1), a 2 min background measurement was performed for the RT-PTR mode, followed by a 2 min calibration and then a 4 min introduction of zero gas to remove excess calibrants in the flow path. Then, PTR-MS measured the ambient air in a real-time manner for 22 min (brown, RT-PTR). In the GC-PTR and GC-EI-MS measurements, ∼ 760 cm3 (standard cubic centimeters) of ambient air was sampled for 500 s every 30 min (dark green and dark blue), followed by pre-concentration in the TDPC, then separated through the GC columns and introduced into the PTR-MS (gray-green) and the EI-MS (gray-blue) detectors alternatively. The GC collected samples for PTR-MS detection (dark green) starting at 1225 s for 500 s in a given cycle. PTR-MS detection for GC eluates (gray-green) started at 3025 s for Ch1 and at 2265 s for Ch2. The chromatograms were 500 and 600 s long for Ch1 and Ch2, respectively. For EI-MS detection, the GC collected samples (dark blue) starting at 3025 s for 500 s. EI-MS detection for GC eluates (blue-gray) started at 1225 s for Ch1 and started at 465 s for Ch2. Note that during the sampling for the GC-PTR mode, EI-MS was detecting GC eluates from Ch1, while the RT-PTR detection was running simultaneously.
A total of 1170 ambient air samples each for Ch1 and Ch2 were collected, pre-concentrated, separated by GC, and then transferred alternately to PTR-MS and EI-MS for detection. One background check, one VOC calibration, and one residual removal for GC-PTR and GC-EI-MS measurements are performed every 26 cycles, i.e., 22 normal cycles followed by 1 cycle with zero air for GC-PTR and GC-EI-MS, 1 cycle with authentic VOC standards for GC-PTR and GC-EI-MS, and again 2 cycles with zero air samples for GC-PTR and GC-EI-MS to remove residual calibrants.
The H3O+ ion source for the Vocus PTR-MS (Tofwerk AG (Krechmer et al., 2018)) was supplied with a 20 sccm flow of water vapor at standard temperate and pressure (STP). The focusing IMR was operated at 100 °C at 2 mbar with 585 V for the axial voltage and 450 V for the radial frequency (RF) voltage at a frequency of 1.5 MHz, giving a stable C10H signal-to-all signal ratio of 0.422 for α-pinene (see Fig. S3 for detail), suggesting a stable E/N ratio (where E is electric field and N is the concentration of neutral particles) of ∼ 130 Td (Materić et al., 2017).
The EI-ToF-MS (Tofwerk AG) used in this study is described in detail elsewhere (Obersteiner et al., 2016). The ionizer temperature was maintained at 280 °C, the ionization energy was set at 70 eV, and the filament emission current was 0.2 mA.
2.3 Data analysis
GC-EI-MS chromatograms were used to identify VOCs in the ambient atmosphere. The measured EI mass spectrum of a chromatographic peak was compared with standard EI mass spectra in the NIST database (https://webbook.nist.gov/chemistry/, last access: 12 December 2024). The identification was verified together with the comparison between the measured retention time and the estimated retention time based on the Kovat number (van Den Dool and Kratz, 1963) queried in the NIST library from columns that have a similar polarity.
The Vocus PTR-MS was characterized by a mass resolution (full width at half maximum) of ∼ 9000 for C8H10H+ (, 107.0855 Th) during the measurement, allowing assignment of an ion formula to a detected PTR mass-to-charge ratio with a deviation of less than 2 ppm. Representative high-resolution fittings at ∼ 59, ∼ 69 ∼ 79, and ∼ 107 Th are shown in Fig. S4.
After GC-EI-MS confirmation of a species, RT-PTR and GC-PTR were used for quantitative analysis. To compare PTR signals between RT-PTR and GC-PTR, the RT-PTR signals (in counts per second (cps)) that coincided with the GC-PTR sampling (500 s) were averaged, whereas the signals for GC eluates detected by the PTR were integrated over the GC peak elution time to obtain total counts and then divided by 500 s to obtain a signal that is comparable to the RT-PTR signal (Claflin and Lerner, 2023; Link et al., 2024). The GC-PTR signal was also normalized based on the sampling volumes of the GC-PTR and RT-PTR measurements.
3.1 Overview of PTR mass spectra
A total of 239 high-resolution PTR signals were detected in RT-PTR measurements and assigned ion formulas. Kendrick mass defects (Hughey et al., 2001) of these 239 PTR signals are shown in Fig. 2, sized by the campaign-average values of their signals in our RT-PTR measurements. The chromatograms of these 239 signals in the GC-PTR measurement were screened in all 1170 ambient air samples. Together with six reagent ions (H3O+, H5O, H7O, H9O, O, and NO+), 57 signals were absent in GC-PTR chromatograms in both channels (shown by solid-gray circles in Fig. 2a), indicating that they were detected in RT-PTR measurements but that their precursor VOCs did not elute in either of the two channels of the GC system. As listed in Table S2, these PTR signal ions include reagent ions, NO, some CxH ions that have more than seven carbon atoms, and some CxHyO ions that have a large O and/or C number. NO and CxHyO ions with a large O number could be produced by PAN (peroxyacetyl nitrate) (Yuan et al., 2017) and by multifunctional oxygenated species that are generally difficult to analyze with GC, respectively. CxH and CxHyO ions with a large C number are likely produced by low-volatility unsaturated hydrocarbons and OVOCs with long carbon chains, respectively, which are generally beyond our choice of GC columns and heating programs. Although with a high level of uncertainty, we used assumed kPTR to estimate the concentration levels of these less explored VOC species that are potentially intermediately volatile or semi-volatile organic compounds (I/SVOCs). The average concentration of gray data points in Fig. 2a, except for reagent ions and PAN (NO) measured in this field campaign, was 0.70 ppb, and the upper and lower quartiles were 0.57 and 0.85 ppb, respectively. Note that the bulk signal measured by the RT-PTR is the sum of many isomeric compounds, while the estimate of the kPTR covers only a limited number of substances, and the calculation of the kPTR itself has an uncertainty of at least 20 %–50 % (Sekimoto et al., 2017). In addition, the loss of I/SVOCs in the sampling tube is not considered.
The remaining 176 signal ions were observed in chromatograms for at least one GC channel of the GC-PTR configuration. The relative difference between signals measured by RT-PTR and by GC-PTR is defined as follows: where [PTR]RT,Sig is the averaged RT-PTR signal (in cps) that coincided with the GC-PTR sampling (500 s), and [PTR]GC,Sig is the GC-PTR signal processed by integrating the entire chromatogram of a given ion to obtain the total counts and then dividing by 500 s. Also, taking into account the sampling volumes of the GC-PTR and RT-PTR modes, [PTR]GC,Sig was normalized.
In Fig. 2b for Ch1 and Fig. 2c for Ch2, the color donates the average relative difference between the RT-PTR and GC-PTR samples throughout the campaign. Positive relative differences (red circles), i.e., larger RT-PTR signals, are believed to come from uncertainties and the loss of VOCs in the GC system. The number of signals that had a relative difference between 0 % and 10 % was 59 in Ch1 and 97 in Ch2, with an overlap of 37. Negative relative differences (blue circles), i.e., larger GC-PTR signals, come from instrument uncertainties and potential slight aldehyde production from the ozone reaction in the GC system (Vermeuel et al., 2023). The number of signals that had a relative difference between −10 % and 0 % was 34 in Ch1 and 42 in Ch2, with an overlap of 24. There were 78 signals that had a relative difference between −10 % and 10 % in both Ch1 and Ch2. The number of signals that had a positive relative difference larger than 10 % is 83 in Ch1 and 37 in Ch2, with an overlap of 22. These 22 PTR signals, listed in Table S3, were characterized by relatively large uncertainty in both GC channels. Most of them are CxH ions (x>7) and CxHyO ions that have a large O and/or C number, as discussed earlier. A combination of two GC channels could provide more complete information for such an ion, for example C5H, as discussed in the following section. Thus, by excluding the 22 signals that were not well characterized by both GC channels from the 176 PTR signals with chromatographic peaks, we focused on the remaining 154 that had a −10 % to 10 % relative difference in at least one GC channel. Consistent with the characteristics of the GC column Rxi-624 in Ch1, MXT-WAX in Ch2, and the heating programs, Ch1 showed good consistency with RT-PTR results for low PTR signals such as C2H5O+ and C4H (normally assigned to acetaldehyde and butylenes, respectively), and Ch2 showed better performance for high PTR signals such as C8H9O+ and C10H (normally assigned to acetophenone and C10H14 aromatics, respectively). The combination of GC Ch1 and Ch2 helps to achieve measurements of more VOC species.
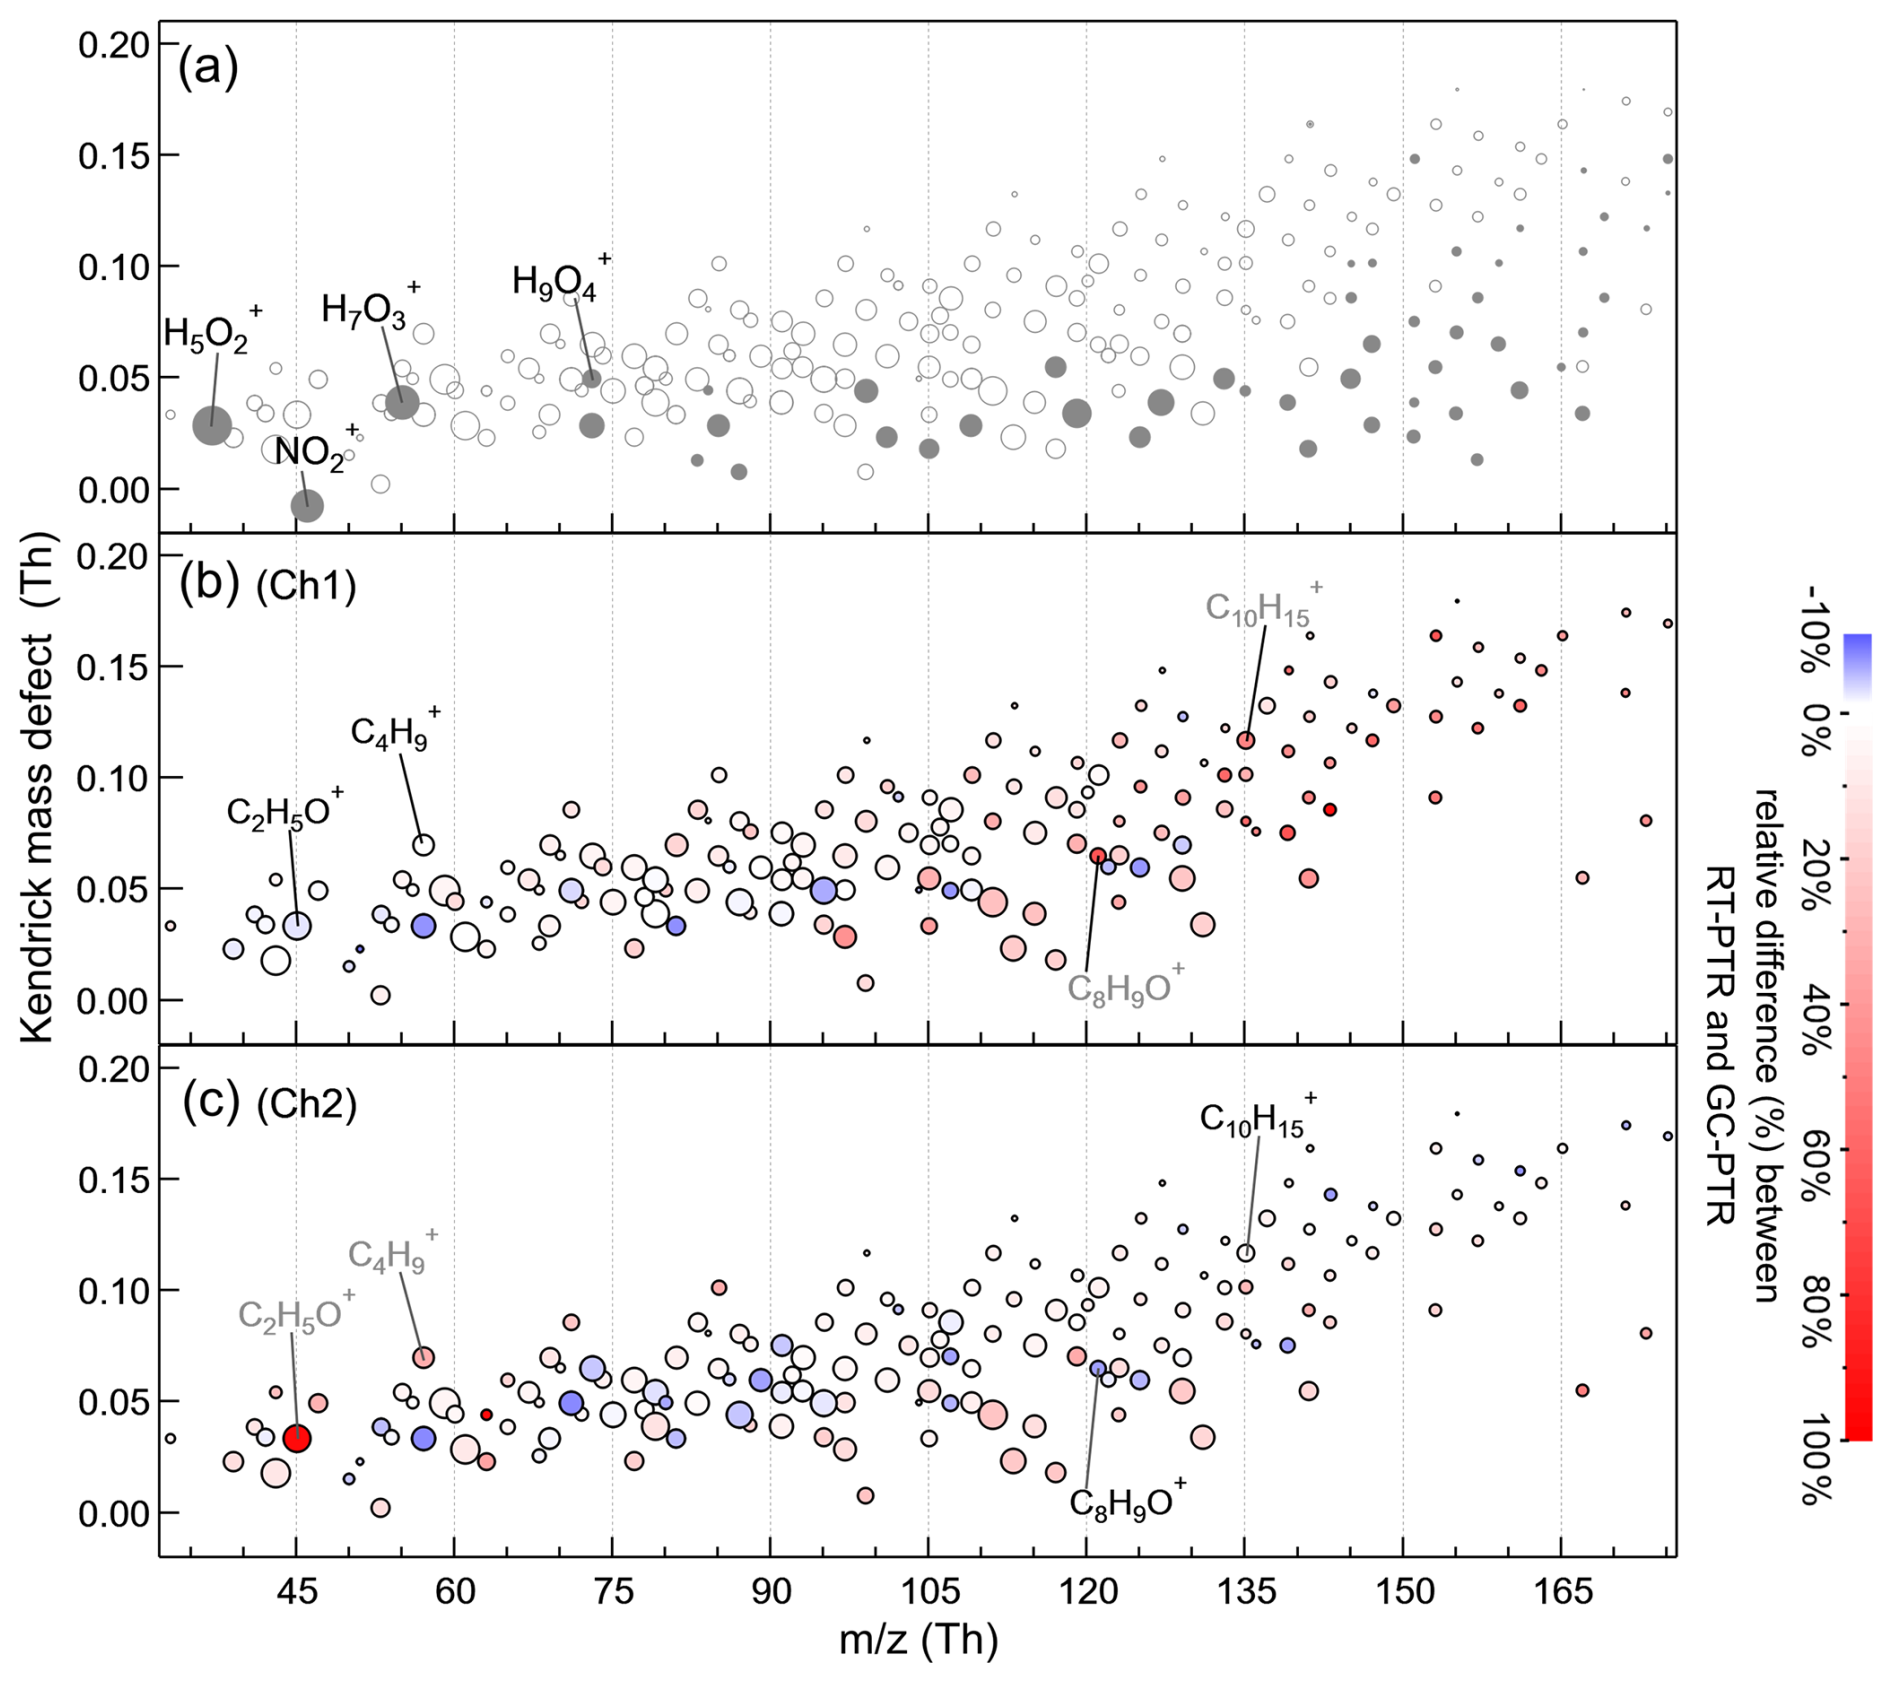
Figure 2Kendrick mass defects of PTR signals, sized with average values of RT-PTR signals in our measurement. 63 signals were detected in RT-PTR but did not eluate in GC-PTR chromatograms in either of the two GC channels that are shown as solid-gray circles in (a). Also shown are the 176 PTR signals that have eluted in at least one GC channel, colored according to the campaign-average relative differences between RT-PTR and GC-PTR throughout the measurement in (b) Ch1 and (c) Ch2, respectively.
3.2 Attribution of PTR signals to VOCs
The chromatographic peaks in the GC-EI-MS that have similar retention times and peak shapes as those in the GC-PTR are located and identified. Figure 3 shows the GC-PTR chromatograms of four representative PTR signals of (A) 59.0491 Th, (B) 107.0855 Th, (C) 79.0542 Th, and (D) 69.0699 Th in both channels in the samples that were collected from 16:26:46 to 16:35:07 on 19 February 2022, denoting VOCs that produce the PTR signal ions C3H7O+, C8H, C6H, and C5H, respectively. High-resolution fittings and ion formula assignments are provided in Fig. S4. The eluates identified are numbered from a1 to d5 in the GC-PTR chromatogram and are listed in detail in Table S4. Peaks not labeled in Fig. 3 and not listed in Table S4 are not assigned a VOC identity.
The GC eluates that generated C3H7O+ (a1 and a2) were identified as acetone (CH3COCH3) in both channels. Isomers of C8H10, including xylenes and ethylbenzene (b1–b7), were observed to produce the C8H signal, as evidenced in both channels. Co-elution of m- and p-xylenes using non-polar columns (like the Rxi-624 employed here for Ch1) is a known behavior, while polar columns (like the MXT-WAX employed for Ch2) are able to separate all four of the C8-aromatic isomers, as shown by the appearance of four elution peaks in Ch2 and only three elution peaks in Ch1. Authentic o-/m-/p-xylenes and ethylbenzene were analyzed during the GC-PTR calibration to confirm the aforementioned identification. Eluted benzene (c1 and c8), ethylbenzene (c2 and c9), xylenes (c3, c4, c10, and c12), isopropyl-benzene (c5 and c11), n-propyl-benzene (c6 and c13), and benzaldehyde (c7 and c14) produced the C6H signal in both channels due to fragmentation of the larger aromatic species in the IMR. C5H was produced by many identified and unidentified VOC species, including isoprene (d1, Ch1), octanal (d2, Ch1 and d3, Ch2), nonanal (d4, Ch2), and decanal (d5, Ch2). The C5H chromatographic peaks labeled with d-NI in Fig. 3d in Ch1 and Ch2 were identified as the same VOC species because of their identical signal values throughout the measurement period. The specific identity was not confirmed because, as shown in Fig. S5, its co-elution with several high-abundance C5-OVOCs in both Ch1 and Ch2 during the whole campaign makes isolating its EI mass spectra and subsequent comparison with the NIST database difficult. d-NI had a PTR peak only at values corresponding to C5H, unlike other carbonyl compounds that would produce MH+, [M+H2O]+, and [M – H2O]+ in PTR measurements (Buhr et al., 2002; Li et al., 2024a; Pagonis et al., 2019; Romano and Hanna, 2018; Warneke et al., 2003).
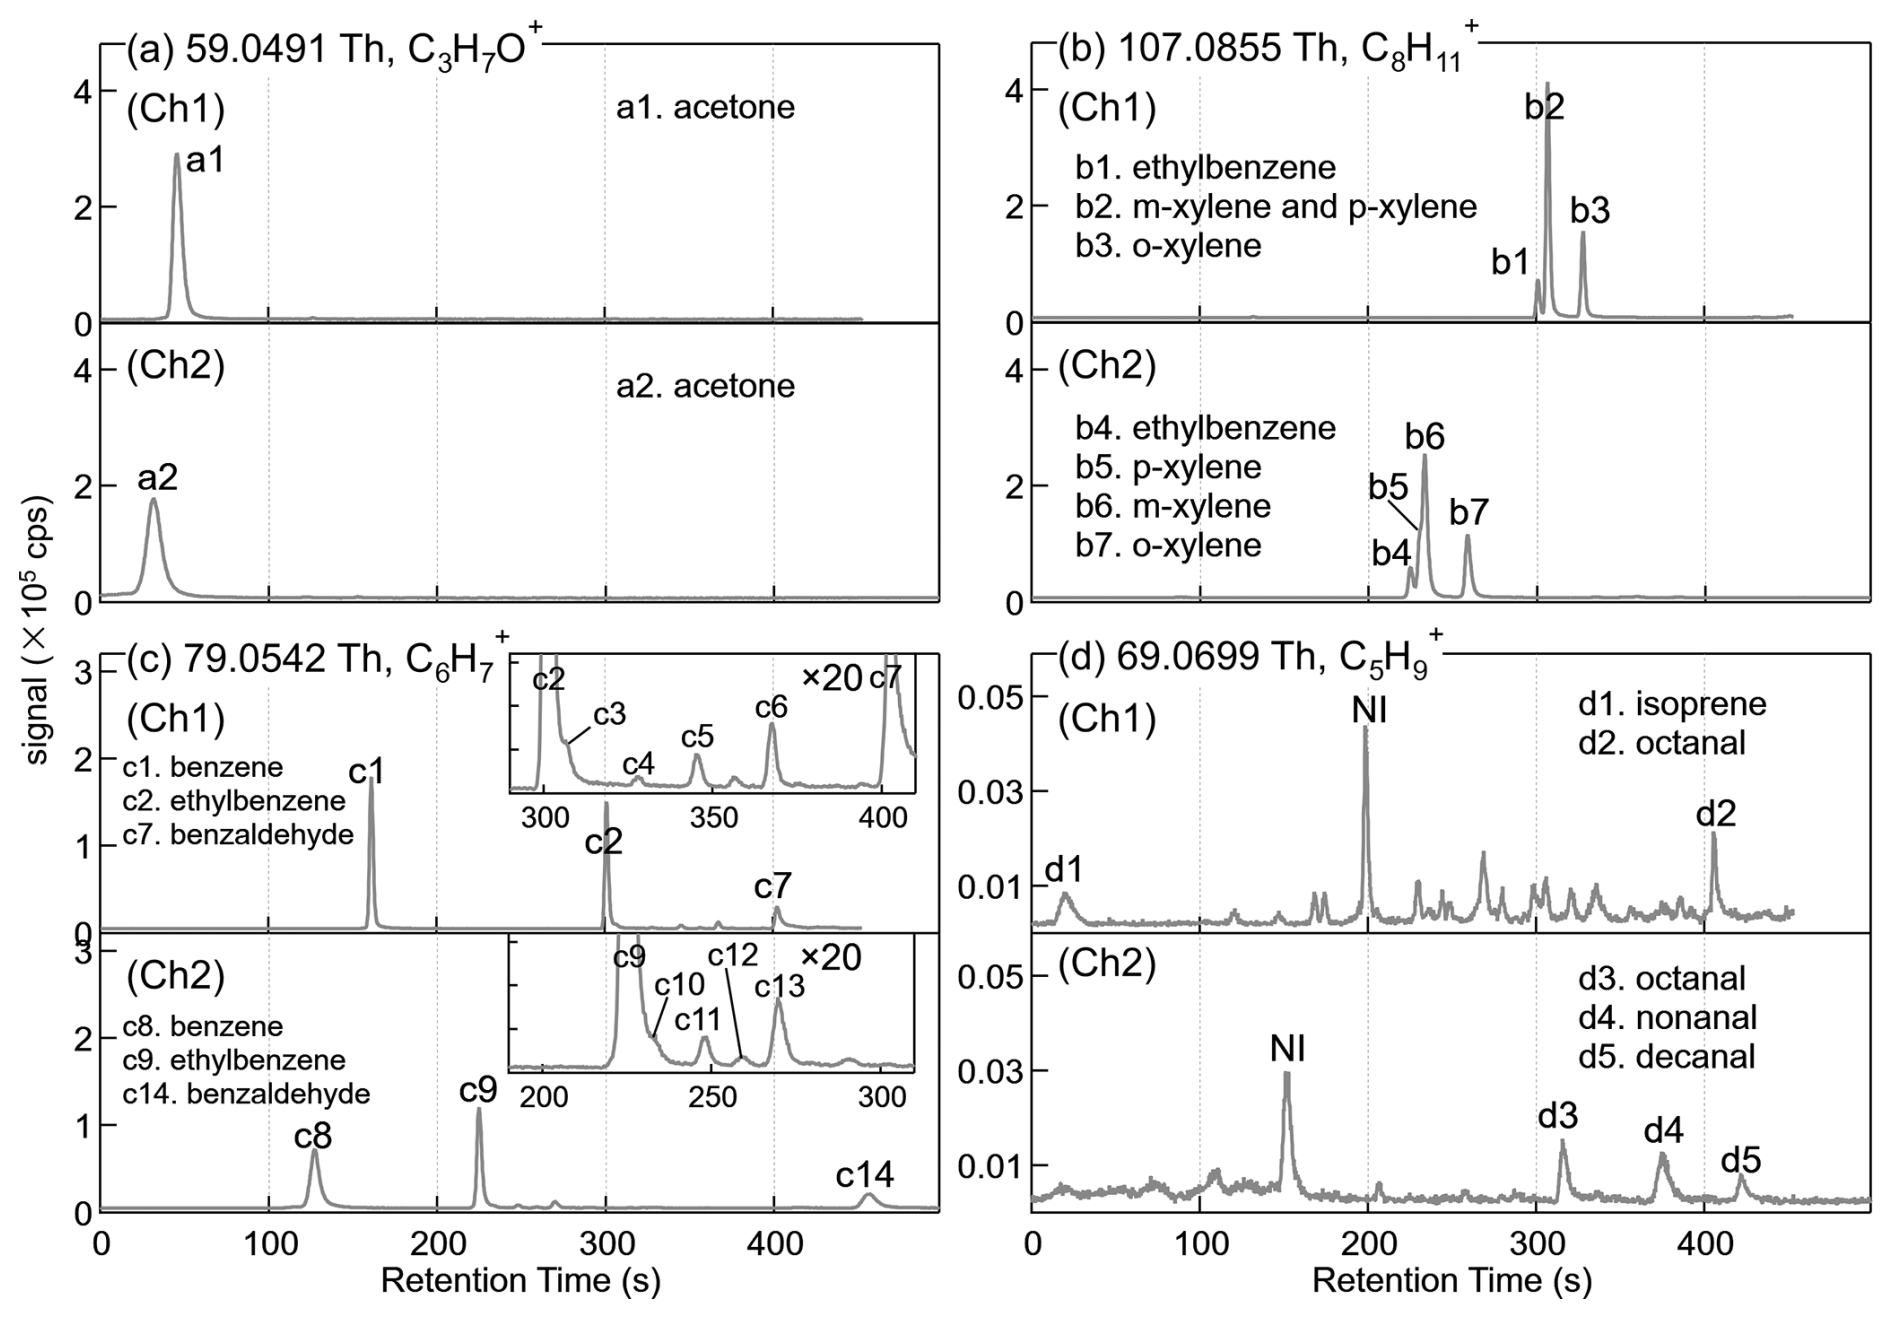
Figure 3GC-PTR chromatograms of PTR signals at of (a) 59.0491 Th (C3H7O+), (b) 107.0855 Th (C8H, (c) 79.0542 Th (C6H), and (d) 69.0699 Th (C5H) sampled from 16:26:46 to 16:35:07 on 19 February 2022. NI stands for “not identified”.
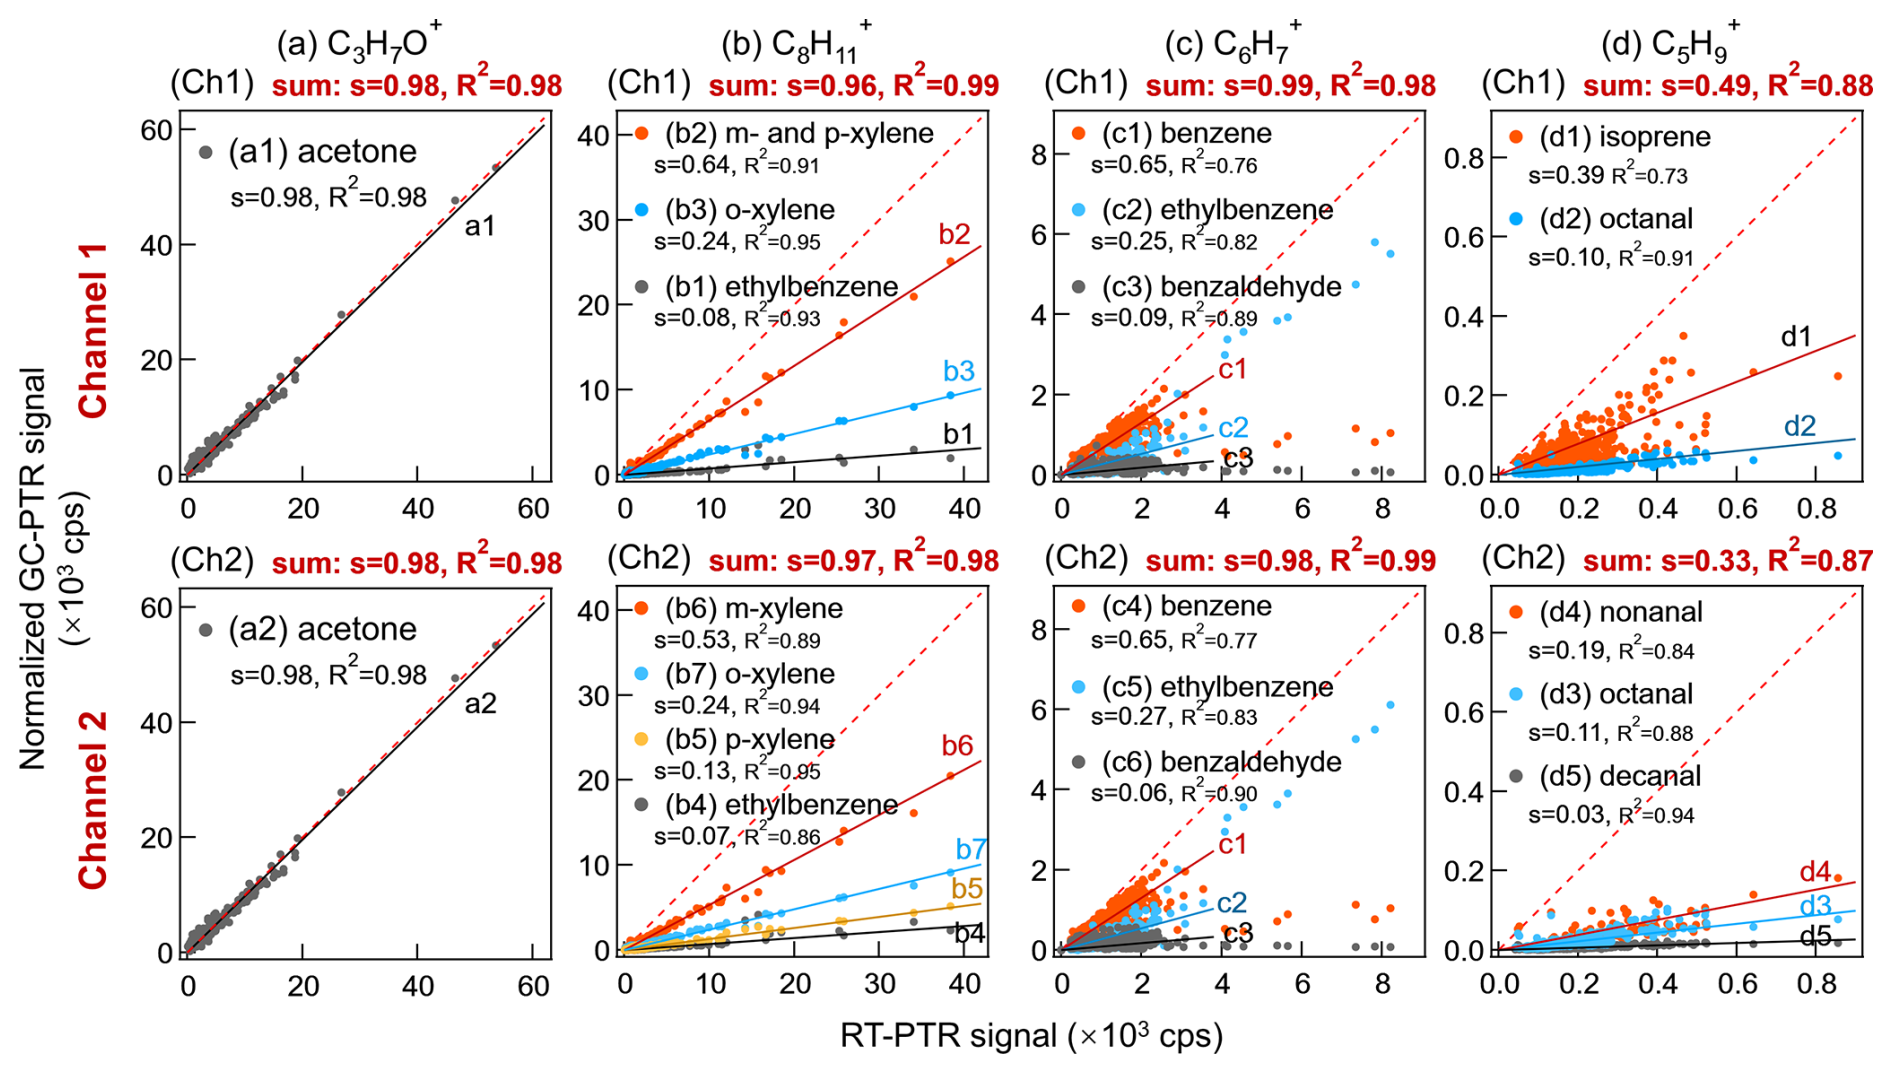
Figure 4Inter-comparison of PTR signals between RT-PTR and GC-PTR with a time resolution of 1 h. First row: Ch1; second row: Ch2. (a) C3H7O+, acetone, in both Ch1 and Ch2. (b) C8H in Ch1: co-eluted m-xylene and p-xylene, o-xylene, and ethylbenzene and in Ch2: m-xylene, p-xylene, o-xylene, and ethylbenzene. (c) C6H, ethylbenzene, benzene, and benzaldehyde, in both Ch1 and Ch2. (d) C5H in Ch1: isoprene and octanal and in Ch2: octanal, nonanal, and decanal. s denotes the slope of the linear fitting, and R2 denotes R squared. The red dashed line is a 1:1 line for reference.
Signal comparisons in cps between RT-PTR and GC-PTR measurements of VOCs identified during the entire campaign were performed for both GC channels (Fig. 4). The PTR signals of identified GC-elution peaks were integrated over the elution time for both GC channels to obtain their peak areas (signal counts) and then divided by the sampling time (500 s) to obtain signals (back in cps), as described above in Sect. 2.3, so that they are comparable with the RT-PTR signals, hereinafter referred to as GC-PTR signals.
As shown in Fig. 4a, the slopes of the linear fitting between the PTR signals of directly sampled air and acetone eluted through GC, both at 59.0491 Th, are 0.98 in both Ch1 and Ch2, indicating that atmospheric acetone accounted for ∼ 98 % of C3H7O+ signals in RT-PTR. The residual ∼ 2 % of C3H7O+ signals in RT-PTR were contributed by propanal, which is normally several orders of magnitude less abundant in the atmosphere than acetone. Propanal did not show a distinct elution peak in Fig. 3a due to its low abundance in that particular sample but was detected well in samples in other time periods (e.g., Fig. S6). Therefore, the C3H7O+ signal in RT-PTR was identified as acetone and negligible propanal, which is consistent with previous studies (Coggon et al., 2024; de Gouw et al., 2003b; Warneke et al., 2003).
Also, in line with previous studies (Coggon et al., 2024; de Gouw et al., 2003b; Warneke et al., 2003), the RT-PTR C8H signals were mainly contributed by ethylbenzene and xylenes because the sum of ethylbenzene and xylenes explained more than 95 % of C8H signals, as shown in Fig. 4b. In addition, the C8H signal was dominated by xylenes, and only ∼ 8 % of the total signal was ethylbenzene.
C6H in RT-PTR was dominated by benzene, ethylbenzene, and benzaldehyde because the sum of these three VOCs in GC-PTR explained more than 96 % of the C6H signals in RT-PTR (Fig. 4c), consistent with earlier observations in Las Vegas (Coggon et al., 2024). The residual ∼ 4 % of the C6H signals were contributed by xylenes, n-propyl benzene, and isopropyl benzene, i.e., the small elution peaks labeled c3–c6 (Ch1) and c10–c13 (Ch2) in Fig. 3c. During most of our measurement time, about 65 % of the C6H signals in RT-PTR were produced by benzene. However, C6H was almost dominated by ethylbenzene when the measured C6H signals in RT-PTR were of higher than 4000 cps.
Among VOC species that contributed to C5H, isoprene eluted only in Ch1, nonanal and decanal only eluted in Ch2, and octanal eluted in both Ch1 and Ch2. Isoprene only accounted for 39 % of the C5H signals in RT-PTR for the entire campaign, with a correlation of R2=0.73. Since this was a wintertime urban campaign, it is not surprising that the isoprene signal is being swamped by interference here. Even if both Ch1 and Ch2 were considered, the sum of isoprene, octanal (average of Ch1 and Ch2), nonanal, and decanal only explained ∼ 72 % of the C5H signals. Although many VOCs that could produce C5H remain unidentified (Fig. 3d), we can conclude that the C5H signals in RT-PTR are not suitable to characterize isoprene concentrations in our measurement environment.
3.3 Classification of RT-PTR ions
As discussed above, among the 176 PTR signals with chromatographic peaks, 22 were not properly characterized by the GC system. We examined the remaining 154 RT-PTR signals that corresponded to obvious elution peaks in GC-PTR and attributed VOC identities to each of the 154 values (Table 1). Definitive identifications were achieved for small values, normally produced by VOCs with high abundances such as aromatic compounds and small OVOCs (C1–C4). However, an unambiguous identification becomes increasingly challenging as the value increases because the number of isomers increases and the atmospheric abundance decreases in the gas phase as the number of carbon atoms increases. Thus, a number of RT-PTR signal ions, especially those that contain more than one O atom and more than five carbon atoms, are only given molecular formulas.
According to linear fittings between the RT-PTR signals and the GC-PTR signals of the VOC(s) identified for each of the 154 PTR signal ions, an identified VOC or a group of VOCs is arbitrarily considered to dominate the PTR signal if such a linear fitting results in a slope between 0.9 and 1.1 and R2>0.9. To cover as many VOCs that can produce a given PTR signal ion as possible, Table 1 also includes VOCs that generate less than 10 % of this PTR signal (denoted “minor”). Ions that were dominated by one specific VOC are grouped into Category I; ions that were dominated by one set of VOC isomers are grouped into Category II; and an ion is considered to be Category III because of (1) poor GC elution or non-retention, i.e., the 22 signals that were characterized by large uncertainty in both GC channels, or (2) detection that is too complicated (e.g., fragments, water clusters, and dehydration products) for it to be used as a quantitative tracer for a compound or family of isomers.
Table 1Identity attribution for each RT-PTR signal.
a Quantification is based on the usage of GC-PTR values of Ch1, Ch2, or the average of Ch1 and Ch2 (Avg.). 61 signals were quantified using Ch2 because of a relative difference of larger than 10 % between GC-Ch1-PTR and RT-PTR, 15 signals were quantified using Ch1 because of a relative difference of larger than 10 % between GC-Ch2-PTR and RT-PTR, and 78 signals were quantified using the average GC-PTR value of Ch1 and Ch2 because of a relative difference between −10 % and 10 % in both channels. b “NC” stands for the 22 signals that were not properly characterized by either GC channel.
In the following discussion, the quantification of GC-PTR and RT-PTR measurements was achieved using authentic standards.
Category I contains 45 ions that were dominantly produced by 25 VOC species because a number of VOC species produced more than one Category I ion. For example, C3H7O+ and C3H9O are representative Category I ions that can be attributed to be MH+ and [MH+H2O]+ from various reaction channels of acetone in the IMR. The quantification of VOCs according to Category I ions in our measurement is deemed to be reliable. As shown in Fig. 5a, taking acetone for instance, the acetone concentrations between RT-PTR and GC-PTR measurements resulted in an excellent linear relationship, with a slope of 1.02 and an R2 of 0.95. In addition, a number of N-containing species, such as acetonitrile, acrylonitrile, propanenitrile, etc., are of Category I, which means that the confidence level for their identification and quantification is quite high. The consistency of the RT-PTR and GC-PTR measurements of these N-containing species is shown in the Supplement (Fig. S7), indicating that these species can be reliably used as tracers for biomass burning (Coggon et al., 2016; de Gouw et al., 2003c).
Category II contains 39 signal ions, each of which was dominantly produced by a group of isomers. C8H and C8H are representative Category II ions that are both generated by ethylbenzene and xylenes. Since Category II ions are conventionally quantified using the calibration factor of one of the isomers, caution must be taken because isomers undergo proton-transfer reactions with different rates (kPTR) and subsequent fragmentation patterns in the PTR. Taking C8 aromatics (ethylbenzene and xylenes) for instance, the average calibration factor using C8H measured from o-/m-/p-xylene is (mean ± standard deviation) times that from ethylbenzene because C8H represents ∼ 81.2 % of the total signals of all product ions from xylenes, whereas only ∼ 24.7 % exists in the case of ethylbenzene in PTR measurements. Adopting the average calibration factor of xylenes (Fig. 5b) resulted in an underestimation of the total concentrations of isomers, especially when the ratios of xylene/ethylbenzene were low, whereas adopting the calibration factor of ethylbenzene (Fig. 5c) resulted in a significant overestimation.
Figure 5Mixing ratios of acetone and C8 aromatics (xylenes and ethylbenzene) measured by GC-PTR vs. RT-PTR. The quantification of GC-PTR measurements was achieved using authentic acetone, xylenes, and ethylbenzene. Also shown are the quantification of acetone in the RT-PTR measurement using the calibration factor of C3H7O+ derived from authentic acetone (a) and the quantification of C8 aromatics in RT-PTR using the calibration factor of C8H derived from authentic (b) xylenes and (c) ethylbenzene. The slope and R squared are written as s and R2, respectively. The red dashed line denotes a 1:1 line for reference.
Including the 22 ions that were not well characterized by the GC system, Category III contains 92 PTR ions that were produced by various non-isomeric VOCs. Typical examples are C6H and C5H, which are traditionally used for benzene and isoprene quantification, respectively. Upper limits for Category III ions were normally obtained since there could be contributors without assigned identities.
3.4 Quantification of selected VOCs using either non-MH+ or non-Category I ions
Our discussion in the previous section suggests that only a limited number of MH+ ions in RT-PTR can be used to reliably derive atmospheric concentrations of a VOC species (M). Clearly, it is also impractical to couple every single PTR-MS with a GC for better quantification. Nevertheless, the overall product ion distributions of various reaction channels for an atmospheric species are expected to vary only slightly under a given PTR-MS setting (Jensen et al., 2023), especially during one campaign. Indeed, the signal ion distributions obtained in this study are overall consistent with those obtained by Jensen et al. (2023) under an E/N of 160 Td but show higher water-clustering products and lower fragments and de-watering products. Here we propose additional PTR-MS calibration steps with authentic VOC standards, together with the understanding obtained in this study with the help of gas chromatographic pre-separation, to derive more reliable concentrations solely from PTR-MS measurements for a number of VOC species.
3.4.1 Quantification of benzene and toluene using C6H and C7H, respectively
As discussed above, about 65 % of the C6H signals in RT-PTR were produced by benzene during most of our measurement time, leading to an unreliable PTR quantification of benzene through C6H. As proposed by Coggon et al. (2024), we instead quantified benzene using the charge transfer product ion, C6H (Category I ion), which has not been observed to be produced from other VOCs so far, rather than the normally used C6H (Category III ion). The sensitivity of our RT-PTR to benzene is ∼ 3800 cps ppbv−1 when using C6H and is ∼ 840 cps ppbv−1 when using C6H. The ratio of C6H to C6H that we observed for authentic benzene is comparable to those of Coggon et al. (2024) and Link et al. (2025). As shown in Fig. 6, the mixing ratios of benzene measured by GC-PTR are used for reference, resulting in a satisfactory linear relationship, with a slope of 1.02 and an R2 of 0.98. The severe overestimation of benzene on 25 January and 24 February (Fig. 6, brown line) quantified by the C6H (MH+) signal was due to the high concentrations of ethylbenzene (see Fig. 8).
The quantification of toluene by C7H resulted in a slight overestimation of 19 % due to the fragmentation of ethyl-methyl-benzenes, as shown in Fig. S8. Using a similar approach as for benzene, the toluene charge transfer product ion C7H is more reliable because the slope and R2 of the linear fitting were 0.96 and 0.98, respectively.
Figure 6Inter-comparison of mixing ratios of benzene between GC-PTR measurements and RT-PTR measurements quantified by the C6H signal and C6H. The red dashed line denotes a 1:1 line for reference. The slope and R squared are noted as s and R2, respectively.
3.4.2 Quantification of aromatic isomers
A matrix (Fig. 7) between common aromatic compounds, a relatively independent group of compounds, and all of their PTR-MS ions was prepared for the sample collected from 16:26:46 to 16:35:07 on 19 February 2022 to investigate the mutual interference between these aromatics and to seek quantitative correction recommendations based solely on the RT-PTR signals and the distributions of the aromatics' product ions. The aromatic compounds discussed here include benzene, phenol, toluene, benzaldehyde, styrene, o-/m-/p-xylenes, ethylbenzene, acetophenone, trimethylbenzenes, ethyl-methyl-benzenes, n-propyl-benzene, and isopropyl-benzenes. Isomers with the same functional groups, such as o-/m-/p-xylenes, show almost identical product ion distributions in PTR-MS and are thus considered together. These aromatic VOCs involve 17 product ions. There was interference with the C7H ion due to the fragmentation of monoterpenes (C10H16) (Table 1). However, toluene and ethyl-methyl-benzenes explained 96 % of the C7H RT-PTR signals in our 1-month measurement, and monoterpene concentrations were low enough that they did not represent a significant interference and thus are not further considered within the matrix.
In this matrix, seven ions belonging to Category I were not interfered with by other substances: C6H for benzene and C7H for toluene as discussed previously, C7H7O+ and C7H9O for benzaldehyde, C8H for styrene, and C8H9O+ and C8H11O for acetophenone. Thus, benzene, toluene, benzaldehyde, styrene, and acetophenone can be accurately quantified using their corresponding Category I ions directly. C8H, C8H, C9H, and C9H are Category II ions, representing the sum of the C8 and C9 aromatic isomers. The other six ions belong to Category III, among which C6H7O+ and C8H led to significant and uncorrectable overestimations of phenol and styrene, respectively; C6H and C7H led to overestimations of benzene and toluene, respectively.
Figure 7A representative matrix between aromatic species and their 17 PTR-MS signals (in cps) for a sample collected from 16:26:46 to 16:35:07 on 19 February 2022.
Allocating the C8H signal in RT-PTR to xylenes and ethylbenzene relies on the ratio of the charge transfer product M+ to the protonated MH+, which is
where S[_xylenes] and S[_ethylbenzene] are the estimated C8H signals that are produced from xylenes and ethylbenzene in the RT-PTR, respectively; r1 and r2 are the ratios of C8H C8H produced by authentic xylenes and ethylbenzene, respectively, being 0.0813 and 0.123 under our PTR setting; and S[] and S[] are signals of C8H and C8H in the RT-PTR measurement. The calculated S[_xylenes] and S[_ethylbenzene] are shown in Fig. 8a and b, with comparisons with those measured by GC-PTR. The estimated mixing ratios of xylenes and ethylbenzene were calculated using the calibration factors of xylenes and ethylbenzene, respectively, and are presented in Fig. 8c–f. The estimated xylene mixing ratios are slightly higher than, i.e., 1.06 times those of, the measured values from GC-PTR, and the estimated values of ethylbenzene are slightly lower, i.e., 0.95 times those of the measured ones.
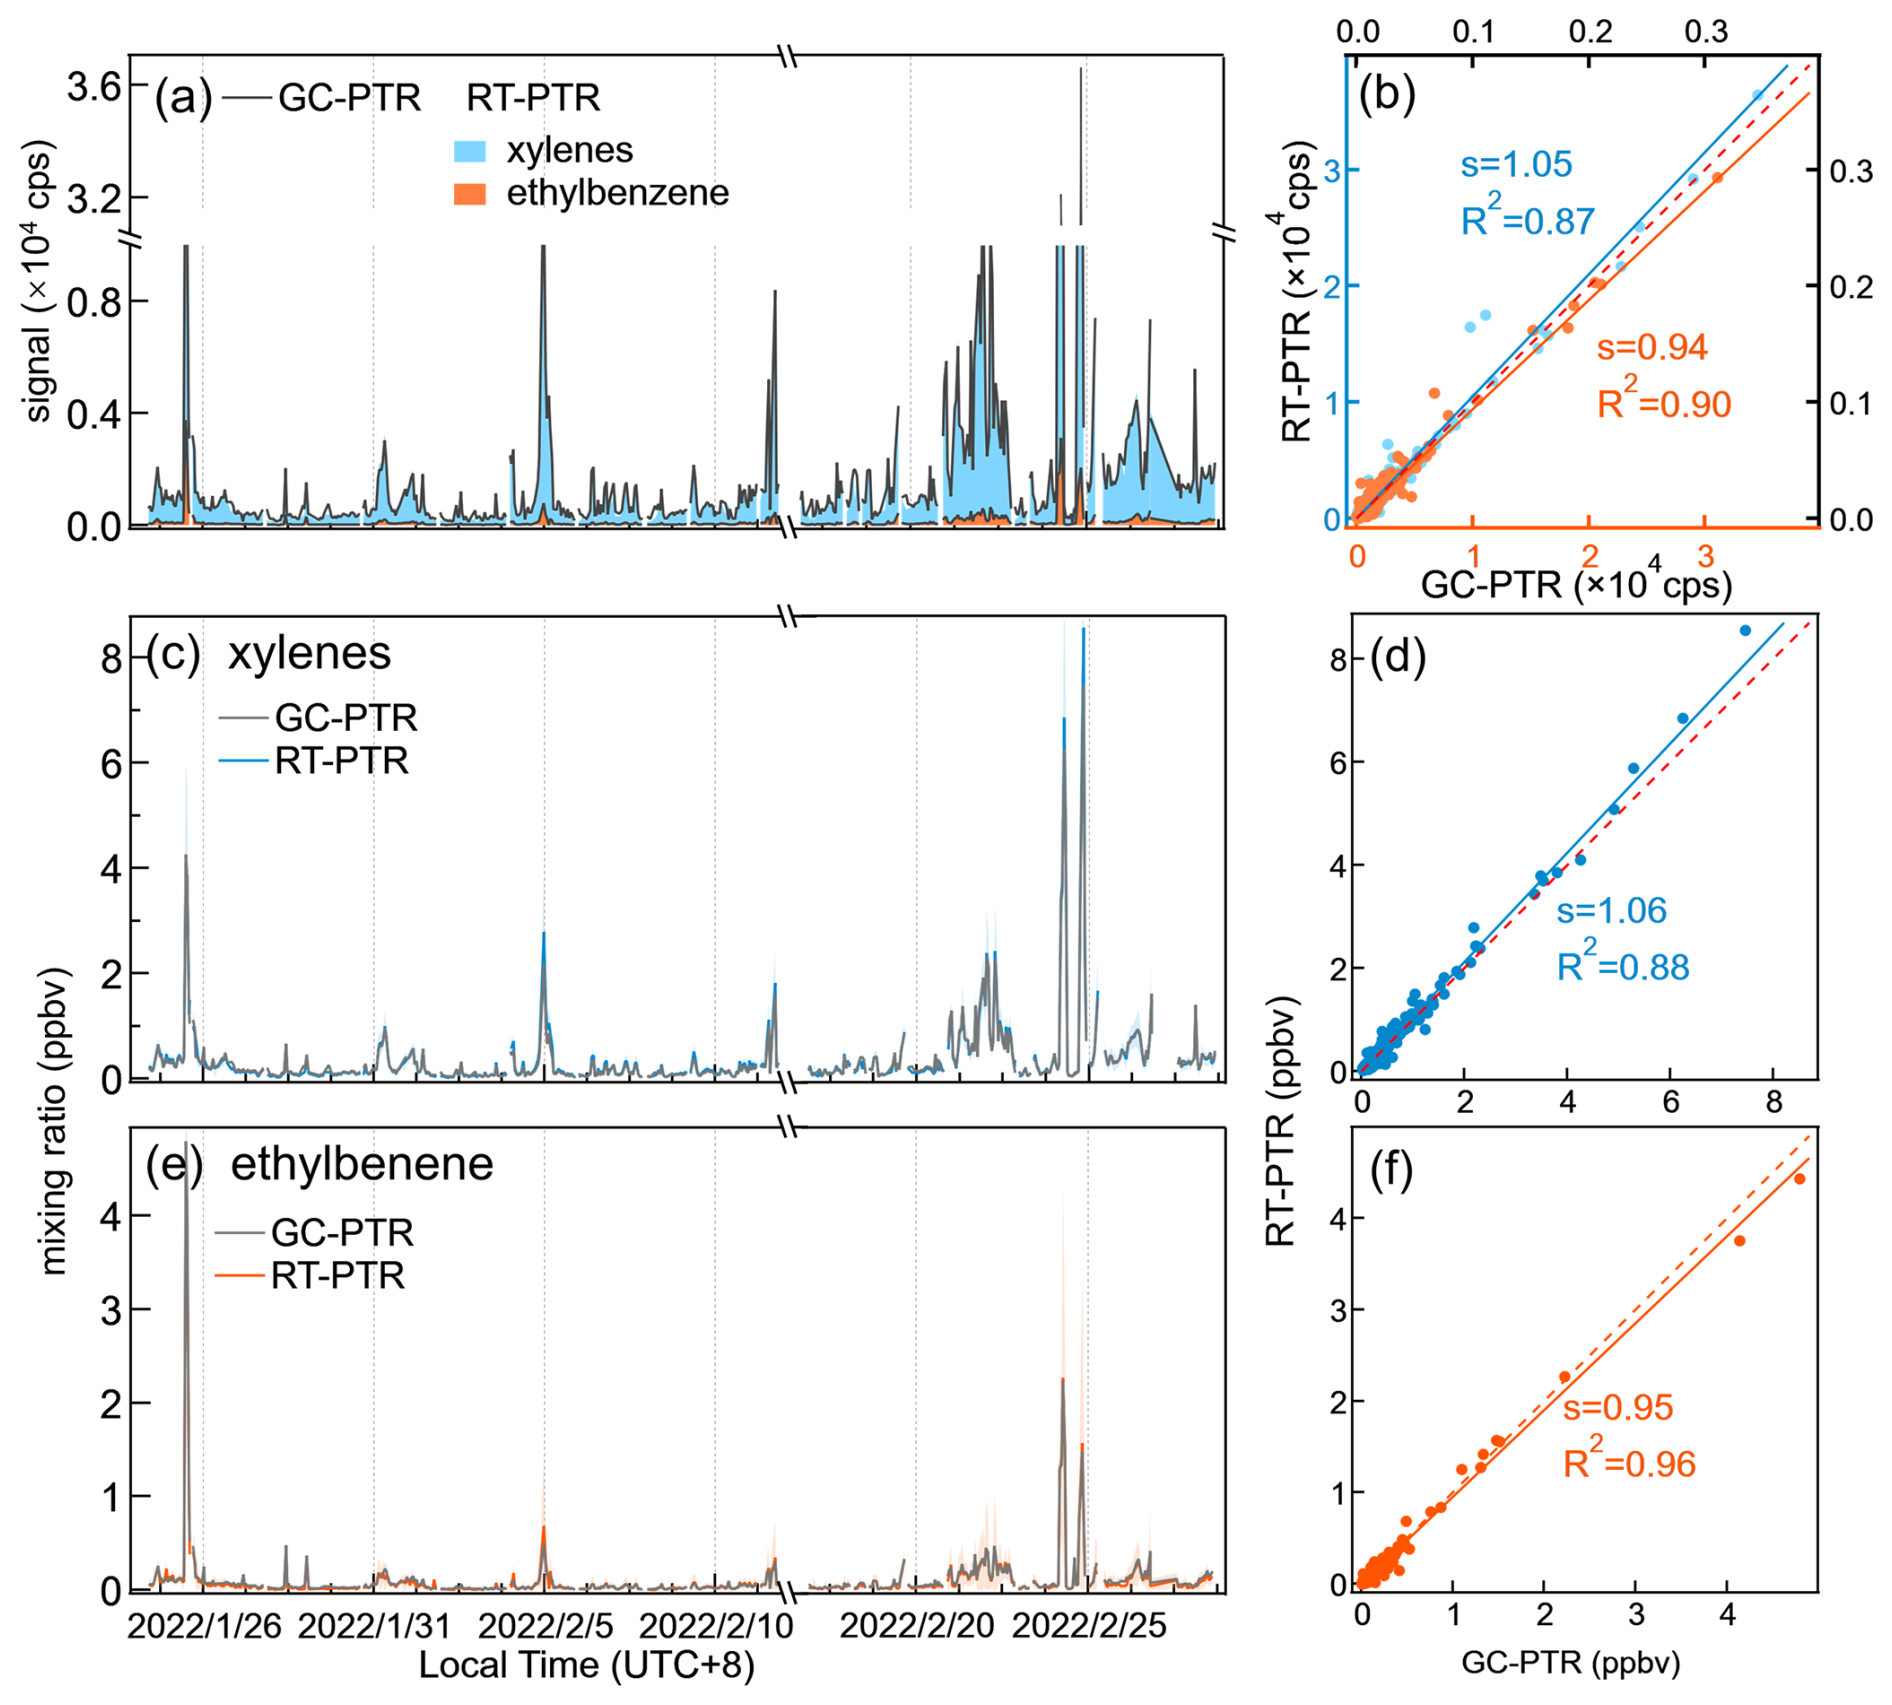
Figure 8(a, b) Allocation of C8H PTR signals to xylenes and ethylbenzene and the mixing ratios of xylenes (c, d) and ethylbenzene (e, f) quantified by the calculated PTR signals and calibration factors derived from authentic compounds. The red dashed line denotes a 1:1 line for reference.
The extrapolation of _ethylbenzene], i.e., the C8H signal that was produced by ethylbenzene in RT-PTR, provides an opportunity to correct the C6H signal (Category III) for the quantification of benzene by deducting the C6H signals generated by interferents (benzaldehyde and ethylbenzene) as follows:
where is the corrected C6H signals that were produced from benzene in the RT-PTR measurement; r3 and r4 are the ratio of C6H C7H7O+ produced by authentic benzaldehyde (0.366) and the ratio of C6H C8H produced by authentic ethylbenzene (2.130), respectively; and S[C7H7O+] are signals of C6H and C7H7O+ in the RT-PTR measurement, respectively; and _ethylbenzene] is the estimated C8H that was produced from ethylbenzene, as discussed above. The corrected mixing ratios of benzene are shown in Fig. S9. The benzene concentration calculated using the corrected RT-PTR C6H signal is characterized by an overestimation of 23 % compared to that measured by GC-PTR, potentially due to the uncertainties introduced during the multi-step calculation.
Nevertheless, this matrix will change with the product ion distributions (i.e., setting of the PTR-MS) and ambient abundances of various aromatics. Caution must be taken and on-site measurements of ion ratios should be performed when applying this matrix to other measurements.
3.4.3 Uncorrectable overestimation of isoprene using C5H in the urban atmosphere
C5H, a Category III ion that is traditionally used for isoprene quantification by PTR, has been suggested to originate from methylbutanal, pentanal, octanal, nonanal, and 1-nonene in addition to isoprene in previous studies (Coggon et al., 2024; Vermeuel et al., 2023). However, the GC-PTR chromatogram of C5H obtained in Shanghai during winter 2022 with weakened biogenic sources for isoprene, as expected, is much more complex (Fig. 3d). As a result, quantifying isoprene in RT-PTR according to C5H using a PTR-MS calibration factor of isoprene led to an average concentration that is 1.56-fold larger than that measured by GC-PTR (Fig. 9). Since deducting the C5H signal generated by octanal, nonanal, and decanal demonstrates improved accuracy of the isoprene measurement in the forest area (Vermeuel et al., 2023), we make an attempt according to the following formula:
where is the corrected C5H signals; r5, r6, and r7 are the ratio of C5H C8H17O+ produced by octanal (2.961), the ratio of C5H C9H19O+ produced by nonanal (2.161), and the ratio of C5H C10H21O+ produced by decanal (0.260), respectively; and , S[C8H17O+], S[C9H19O+], and S[C10H21O+] are the signals of C5H, C8H17O+, C9H19O+, and C10H21O+ in the RT-PTR measurement, respectively.
As shown in Fig. 9, there is still a gap between the isoprene concentration calculated by the corrected C5H signal in RT-PTR and the concentration measured by GC-PTR, indicating that considering the interference of octanal, nonanal, and decanal identified is not sufficient for isoprene correction in RT-PTR detection in our measurement in urban Shanghai.
Another approach to C5H signal correction was tested, which assumes that the isoprene concentration is zero at nighttime, so the C5H signal at night is generated entirely by interference, and the extent of interference is proportional to the sum of the 125 and 111 signals generated from aldehydes, i.e., the dehydrated signals of C8H16OH+ and C9H18OH+, respectively (Coggon et al., 2024). Our corrected C5H signal had a large number of negative values (Fig. S10a), probably resulting from the abundant isoprene at night emitted from anthropogenic activities that was verified by GC measurement, as shown in Fig. S10b.
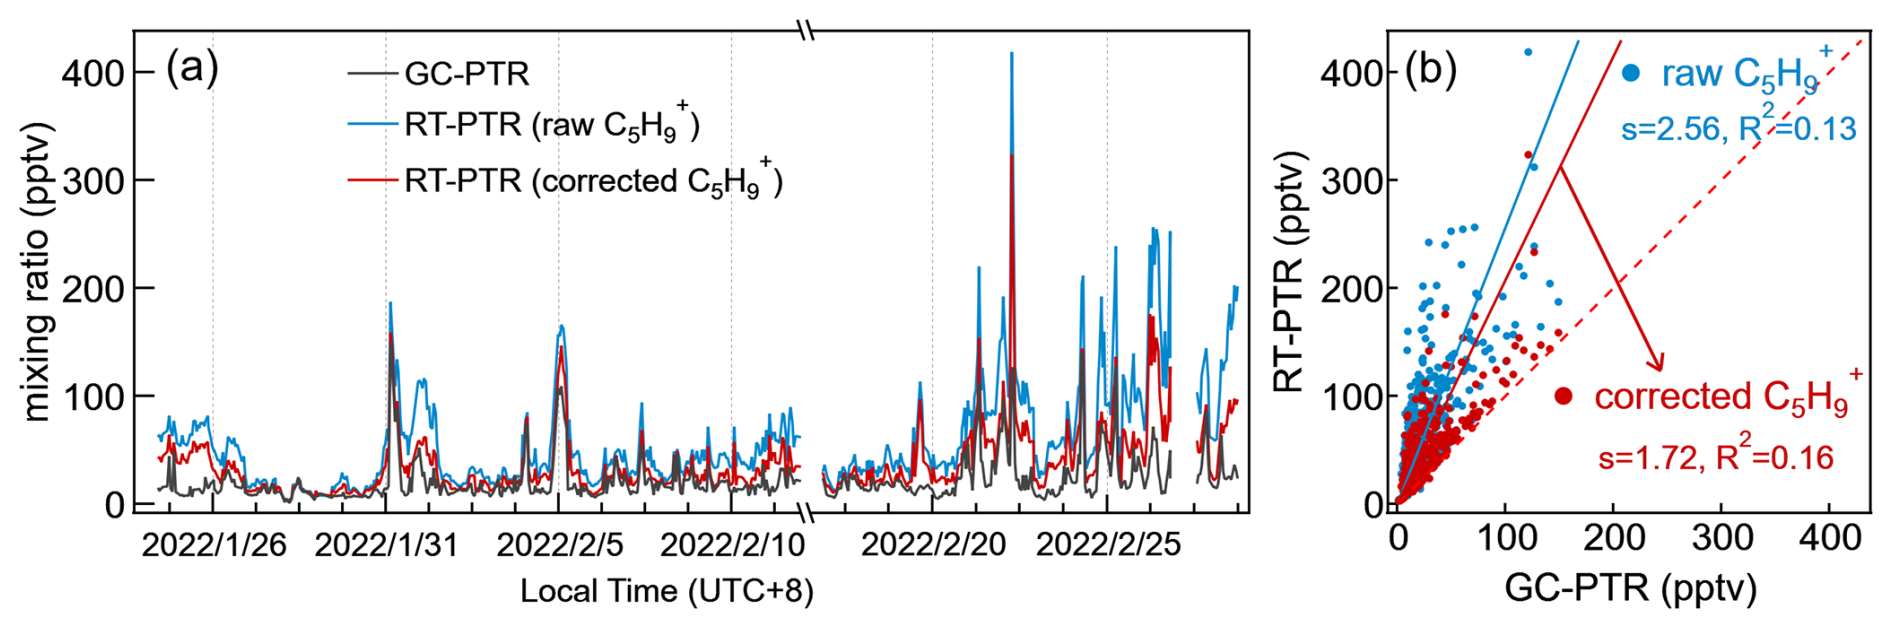
Figure 9Inter-comparison of mixing ratios of isoprene between GC-PTR measurements and RT-PTR measurements quantified by raw and corrected C5H signals. The red dashed line denotes a 1:1 line for reference. The slope and R squared are written as s and R2, respectively.
PTR-MS enables real-time VOC measurements with a high time resolution, but its inherent drawbacks include the inability to distinguish between isomers and the non-exclusivity between MH+ signals and concentrations of a VOC species (M). Signals such as [MH – CxHy)]+, [MH – (H2O)]+, [MH+(H2O)n]+, and M+ complicate the interpretation of the PTR mass spectrum and cause quantification bias.
In this study, we sampled and pre-separated ambient VOC molecules via chromatographic techniques prior to PTR measurements to gain insight into how a single ion measured by the PTR is produced by multiple VOC species. We provided a widely applicable reference table to attribute the PTR signal to the contributing VOC species, with as many PTR signals and VOCs as possible. The PTR signals are grouped into three categories according to the complexity of their potential identities. 45 decent signal ions (Category I) were generated from only one VOC species and can be used for reliable quantification; 39 signal ions (Category II) were produced from a group of isomers and can be used to quantify the sum of isomers, with inevitable uncertainty if a calibration factor for one specific isomer is used; and 92 signal ions (Category III) came from more than one non-isomeric species, and thus the signal of a Category III ion merely gives an upper limit of a VOC concentration.
PTR-MS is widely applied to simultaneously measure hundreds of VOCs, and inaccurate quantifications of VOCs may mislead source apportionments derived from positive-matrix-factorization analysis (Vlasenko et al., 2009), skew ozone formation sensitivity by the empirical kinetics modeling approach (EKMA) curve (Huang et al., 2024; Li et al., 2024b), and misguide estimation of atmospheric oxidation capacity based on VOC concentrations (Wang et al., 2022). For example, the overestimation of isoprene, especially in urban areas, will cause significant errors in the calculation of its flux and global budget (Eerdekens et al., 2009; Kalogridis et al., 2014). Since our recommended correction depends on the specific measurement time and location and the instrument settings, it is therefore necessary to carry out more measurements under various atmospheric environments, such as industrial estates and rural areas. In addition, there is a need to measure at different PTR settings to better understand how signal distributions vary for different VOCs.
Data are available from the authors upon request.
The supplement related to this article is available online at https://doi.org/10.5194/amt-18-3547-2025-supplement.
LW designed the study. MSC, BML, and DW provided support for the experimental setup. YW, CL, YL, and SY conducted the filed measurement. YZ analyzed the data and wrote the draft, and LW revised the paper with contributions from all co-authors.
The contact author has declared that none of the authors has any competing interests.
Publisher’s note: Copernicus Publications remains neutral with regard to jurisdictional claims made in the text, published maps, institutional affiliations, or any other geographical representation in this paper. While Copernicus Publications makes every effort to include appropriate place names, the final responsibility lies with the authors.
This research has been supported by the National Natural Science Foundation of China (grant no. 21925601).
This paper was edited by Keding Lu and reviewed by two anonymous referees.
Abudumutailifu, M., Shang, X., Wang, L., Zhang, M., Kang, H., Chen, Y., Li, L., Ju, R., Li, B., Ouyang, H., Tang, X., Li, C., Wang, L., Wang, X., George, C., Rudich, Y., Zhang, R., and Chen, J.: Unveiling the Molecular Characteristics, Origins, and Formation Mechanism of Reduced Nitrogen Organic Compounds in the Urban Atmosphere of Shanghai Using a Versatile Aerosol Concentration Enrichment System, Environ. Sci. Technol., 58, 7099–7112, https://doi.org/10.1021/acs.est.3c04071, 2024.
Ambrose, J. L., Haase, K., Russo, R. S., Zhou, Y., White, M. L., Frinak, E. K., Jordan, C., Mayne, H. R., Talbot, R., and Sive, B. C.: A comparison of GC-FID and PTR-MS toluene measurements in ambient air under conditions of enhanced monoterpene loading, Atmos. Meas. Tech., 3, 959–980, https://doi.org/10.5194/amt-3-959-2010, 2010.
Anderson, D. C., Pavelec, J., Daube, C., Herndon, S. C., Knighton, W. B., Lerner, B. M., Roscioli, J. R., Yacovitch, T. I., and Wood, E. C.: Characterization of ozone production in San Antonio, Texas, using measurements of total peroxy radicals, Atmos. Chem. Phys., 19, 2845–2860, https://doi.org/10.5194/acp-19-2845-2019, 2019.
Aprea, E., Biasioli, F., Märk, T. D., and Gasperi, F.: PTR-MS study of esters in water and water/ethanol solutions: Fragmentation patterns and partition coefficients, Int. J. Mass Spectrom., 262, 114–121, https://doi.org/10.1016/j.ijms.2006.10.016, 2007.
Baasandorj, M., Millet, D. B., Hu, L., Mitroo, D., and Williams, B. J.: Measuring acetic and formic acid by proton-transfer-reaction mass spectrometry: sensitivity, humidity dependence, and quantifying interferences, Atmos. Meas. Tech., 8, 1303–1321, https://doi.org/10.5194/amt-8-1303-2015, 2015.
Badjagbo, K., Sauvé, S., and Moore, S.: Real-time continuous monitoring methods for airborne VOCs, TRAC-Trend. Anal. Chem., 26, 931–940, https://doi.org/10.1016/j.trac.2007.07.004, 2007.
Blake, R. S., Monks, P. S., and Ellis, A. M.: Proton-Transfer Reaction Mass Spectrometry, Chem. Rev., 109, 861–896, https://doi.org/10.1021/cr800364q, 2009.
Brown, P., Watts, P., Märk, T. D., and Mayhew, C. A.: Proton transfer reaction mass spectrometry investigations on the effects of reduced electric field and reagent ion internal energy on product ion branching ratios for a series of saturated alcohols, Int. J. Mass Spectrom., 294, 103–111, https://doi.org/10.1016/j.ijms.2010.05.028, 2010.
Buhr, K., Ruth, S. van, and Delahunty, C.: Analysis of volatile flavour compounds by Proton Transfer Reaction-Mass Spectrometry: fragmentation patterns and discrimination between isobaric and isomeric compounds, Int. J. Mass Spectrom., 221, 1–7, https://doi.org/10.1016/s1387-3806(02)00896-5, 2002.
Cappellin, L., Karl, T., Probst, M., Ismailova, O., Winkler, P. M., Soukoulis, C., Aprea, E., Märk, T. D., Gasperi, F., and Biasioli, F.: On Quantitative Determination of Volatile Organic Compound Concentrations Using Proton Transfer Reaction Time-of-Flight Mass Spectrometry, Environ. Sci. Technol., 46, 2283–2290, https://doi.org/10.1021/es203985t, 2012.
Chen, X., Millet, D. B., Singh, H. B., Wisthaler, A., Apel, E. C., Atlas, E. L., Blake, D. R., Bourgeois, I., Brown, S. S., Crounse, J. D., de Gouw, J. A., Flocke, F. M., Fried, A., Heikes, B. G., Hornbrook, R. S., Mikoviny, T., Min, K.-E., Müller, M., Neuman, J. A., O'Sullivan, D. W., Peischl, J., Pfister, G. G., Richter, D., Roberts, J. M., Ryerson, T. B., Shertz, S. R., Thompson, C. R., Treadaway, V., Veres, P. R., Walega, J., Warneke, C., Washenfelder, R. A., Weibring, P., and Yuan, B.: On the sources and sinks of atmospheric VOCs: an integrated analysis of recent aircraft campaigns over North America, Atmos. Chem. Phys., 19, 9097–9123, https://doi.org/10.5194/acp-19-9097-2019, 2019.
Claflin, M. S. and Lerner, B. M.: Quantitative Comparison of Direct and GC-Speciated CI-TOF-MS Measurements, Zenodo, https://doi.org/10.5281/zenodo.10069421, 2023.
Claflin, M. S., Pagonis, D., Finewax, Z., Handschy, A. V., Day, D. A., Brown, W. L., Jayne, J. T., Worsnop, D. R., Jimenez, J. L., Ziemann, P. J., de Gouw, J., and Lerner, B. M.: An in situ gas chromatograph with automatic detector switching between PTR- and EI-TOF-MS: isomer-resolved measurements of indoor air, Atmos. Meas. Tech., 14, 133–152, https://doi.org/10.5194/amt-14-133-2021, 2021.
Coggon, M. M., Veres, P. R., Yuan, B., Koss, A., Warneke, C., Gilman, J. B., Lerner, B. M., Peischl, J., Aikin, K. C., Stockwell, C. E., Hatch, L. E., Ryerson, T. B., Roberts, J. M., Yokelson, R. J., and de Gouw, J. A.: Emissions of nitrogen-containing organic compounds from the burning of herbaceous and arboraceous biomass: Fuel composition dependence and the variability of commonly used nitrile tracers, Geophys. Res. Lett., 43, 9903–9912, https://doi.org/10.1002/2016gl070562, 2016.
Coggon, M. M., Stockwell, C. E., Claflin, M. S., Pfannerstill, E. Y., Xu, L., Gilman, J. B., Marcantonio, J., Cao, C., Bates, K., Gkatzelis, G. I., Lamplugh, A., Katz, E. F., Arata, C., Apel, E. C., Hornbrook, R. S., Piel, F., Majluf, F., Blake, D. R., Wisthaler, A., Canagaratna, M., Lerner, B. M., Goldstein, A. H., Mak, J. E., and Warneke, C.: Identifying and correcting interferences to PTR-ToF-MS measurements of isoprene and other urban volatile organic compounds, Atmos. Meas. Tech., 17, 801–825, https://doi.org/10.5194/amt-17-801-2024, 2024.
Cui, L., Zhang, Z., Huang, Y., Lee, S. C., Blake, D. R., Ho, K. F., Wang, B., Gao, Y., Wang, X. M., and Louie, P. K. K.: Measuring OVOCs and VOCs by PTR-MS in an urban roadside microenvironment of Hong Kong: relative humidity and temperature dependence, and field intercomparisons, Atmos. Meas. Tech., 9, 5763–5779, https://doi.org/10.5194/amt-9-5763-2016, 2016.
Dunne, E., Galbally, I. E., Cheng, M., Selleck, P., Molloy, S. B., and Lawson, S. J.: Comparison of VOC measurements made by PTR-MS, adsorbent tubes–GC-FID-MS and DNPH derivatization–HPLC during the Sydney Particle Study, 2012: a contribution to the assessment of uncertainty in routine atmospheric VOC measurements, Atmos. Meas. Tech., 11, 141–159, https://doi.org/10.5194/amt-11-141-2018, 2018.
Eerdekens, G., Ganzeveld, L., Vilà-Guerau de Arellano, J., Klüpfel, T., Sinha, V., Yassaa, N., Williams, J., Harder, H., Kubistin, D., Martinez, M., and Lelieveld, J.: Flux estimates of isoprene, methanol and acetone from airborne PTR-MS measurements over the tropical rainforest during the GABRIEL 2005 campaign, Atmos. Chem. Phys., 9, 4207–4227, https://doi.org/10.5194/acp-9-4207-2009, 2009.
de Gouw, J. and Warneke, C.: Measurements of volatile organic compounds in the earth's atmosphere using proton-transfer-reaction mass spectrometry, Mass Spectrom. Rev., 26, 223–257, https://doi.org/10.1002/mas.20119, 2007.
de Gouw, J. A., Goldan, P. D., Warneke, C., Kuster, W. C., Roberts, J. M., Marchewka, M., Bertman, S. B., Pszenny, A. A. P., and Keene, W. C.: Validation of proton transfer reaction-mass spectrometry (PTR-MS) measurements of gas-phase organic compounds in the atmosphere during the New England Air Quality Study (NEAQS) in 2002, J. Geophys. Res.-Atmos., 108, 4682, https://doi.org/10.1029/2003jd003863, 2003a.
de Gouw, J., Warneke, C., Karl, T., Eerdekens, G., Veen, C. van der, and Fall, R.: Sensitivity and specificity of atmospheric trace gas detection by proton-transfer-reaction mass spectrometry, Int. J. Mass Spectrom., 223, 365–382, https://doi.org/10.1016/s1387-3806(02)00926-0, 2003b.
de Gouw, J. A., Warneke, C., Parrish, D. D., Holloway, J. S., Trainer, M., and Fehsenfeld, F. C.: Emission sources and ocean uptake of acetonitrile (CH3CN) in the atmosphere, J. Geophys. Res.-Atmos., 108, 4329, https://doi.org/10.1029/2002jd002897, 2003c.
Hamilton, J. F.: Using Comprehensive Two-Dimensional Gas Chromatography to Study the Atmosphere, J. Chromatogr. Sci., 48, 274–282, https://doi.org/10.1093/chromsci/48.4.274, 2010.
Hansel, A., Jordan, A., Holzinger, R., Prazeller, P., Vogel, W., and Lindinger, W.: Proton transfer reaction mass spectrometry: on-line trace gas analysis at the ppb level, Int. J. Mass Spectrom. Ion Process., 149, 609–619, https://doi.org/10.1016/0168-1176(95)04294-u, 1995.
Helmig, D.: Air analysis by gas chromatography, J. Chromatogr. A, 843, 129–146, https://doi.org/10.1016/s0021-9673(99)00173-9, 1999.
Huang, D., Li, Q., Han, Y., Xia, S.-Y., Zhou, J., Che, H., Lu, K., Yang, F., Long, X., and Chen, Y.: Biogenic volatile organic compounds dominated the near-surface ozone generation in Sichuan Basin, China, during fall and wintertime, J. Environ. Sci., 141, 215–224, https://doi.org/10.1016/j.jes.2023.04.004, 2024.
Hughey, C. A., Hendrickson, C. L., Rodgers, R. P., Marshall, A. G., and Qian, K.: Kendrick Mass Defect Spectrum: A Compact Visual Analysis for Ultrahigh-Resolution Broadband Mass Spectra, Anal. Chem., 73, 4676–4681, https://doi.org/10.1021/ac010560w, 2001.
Jensen, A. R., Koss, A. R., Hales, R. B., and de Gouw, J. A.: Measurements of volatile organic compounds in ambient air by gas-chromatography and real-time Vocus PTR-TOF-MS: calibrations, instrument background corrections, and introducing a PTR Data Toolkit, Atmos. Meas. Tech., 16, 5261–5285, https://doi.org/10.5194/amt-16-5261-2023, 2023.
Kalogridis, C., Gros, V., Sarda-Esteve, R., Langford, B., Loubet, B., Bonsang, B., Bonnaire, N., Nemitz, E., Genard, A.-C., Boissard, C., Fernandez, C., Ormeño, E., Baisnée, D., Reiter, I., and Lathière, J.: Concentrations and fluxes of isoprene and oxygenated VOCs at a French Mediterranean oak forest, Atmos. Chem. Phys., 14, 10085–10102, https://doi.org/10.5194/acp-14-10085-2014, 2014.
Krechmer, J., Lopez-Hilfiker, F., Koss, A., Hutterli, M., Stoermer, C., Deming, B., Kimmel, J., Warneke, C., Holzinger, R., Jayne, J., Worsnop, D., Fuhrer, K., Gonin, M., and de Gouw, J.: Evaluation of a New Reagent-Ion Source and Focusing Ion–Molecule Reactor for Use in Proton-Transfer-Reaction Mass Spectrometry, Anal. Chem., 90, 12011–12018, https://doi.org/10.1021/acs.analchem.8b02641, 2018.
Leglise, J., Müller, M., Piel, F., Otto, T., and Wisthaler, A.: Bulk Organic Aerosol Analysis by Proton-Transfer-Reaction Mass Spectrometry: An Improved Methodology for the Determination of Total Organic Mass, O:C and H:C Elemental Ratios, and the Average Molecular Formula, Anal. Chem., 91, 12619–12624, https://doi.org/10.1021/acs.analchem.9b02949, 2019.
Li, B., Ho, S. S. H., Li, X., Guo, L., Chen, A., Hu, L., Yang, Y., Chen, D., Lin, A., and Fang, X.: A comprehensive review on anthropogenic volatile organic compounds (VOCs) emission estimates in China: Comparison and outlook, Environ. Int., 156, 106710, https://doi.org/10.1016/j.envint.2021.106710, 2021.
Li, F., Huang, D. D., Tian, L., Yuan, B., Tan, W., Zhu, L., Ye, P., Worsnop, D., Hoi, K. I., Mok, K. M., and Li, Y. J.: Response of protonated, adduct, and fragmented ions in Vocus proton-transfer-reaction time-of-flight mass spectrometer (PTR-ToF-MS), Atmos. Meas. Tech., 17, 2415–2427, https://doi.org/10.5194/amt-17-2415-2024, 2024a.
Li, P., Chen, C., Liu, D., Lian, J., Li, W., Fan, C., Yan, L., Gao, Y., Wang, M., Liu, H., Pan, X., and Mao, J.: Characteristics and source apportionment of ambient volatile organic compounds and ozone generation sensitivity in urban Jiaozuo, China, J. Environ. Sci., 138, 607–625, https://doi.org/10.1016/j.jes.2023.04.016, 2024b.
Li, Y., Ma, X., Lu, K., Gao, Y., Xu, W., Yang, X., and Zhang, Y.: Investigation of the Cyclohexene Oxidation Mechanism Through the Direct Measurement of Organic Peroxy Radicals, Environ. Sci. Technol., 58, 19807–19817, https://doi.org/10.1021/acs.est.4c06744, 2024c.
Lindinger, W., Hansel, A., and Jordan, A.: On-line monitoring of volatile organic compounds at pptv levels by means of proton-transfer-reaction mass spectrometry (PTR-MS) medical applications, food control and environmental research, Int. J. Mass Spectrom. Ion Process., 173, 191–241, https://doi.org/10.1016/s0168-1176(97)00281-4, 1998.
Link, M. F., Robertson, R., Claflin, M. S., and Poppendieck, D.: Quantification of Byproduct Formation from Portable Air Cleaners Using a Proposed Standard Test Method, Environ. Sci. Technol., 58, 7916–7923, https://doi.org/10.1021/acs.est.3c09331, 2024.
Link, M. F., Claflin, M. S., Cecelski, C. E., Akande, A. A., Kilgour, D., Heine, P. A., Coggon, M., Stockwell, C. E., Jensen, A., Yu, J., Huynh, H. N., Ditto, J. C., Warneke, C., Dresser, W., Gemmell, K., Jorga, S., Robertson, R. L., de Gouw, J., Bertram, T., Abbatt, J. P. D., Borduas-Dedekind, N., and Poppendieck, D.: Product ion distributions using H3O+ proton-transfer-reaction time-of-flight mass spectrometry (PTR-ToF-MS): mechanisms, transmission effects, and instrument-to-instrument variability, Atmos. Meas. Tech., 18, 1013–1038, https://doi.org/10.5194/amt-18-1013-2025, 2025.
Materić, D., Lanza, M., Sulzer, P., Herbig, J., Bruhn, D., Gauci, V., Mason, N., and Turner, C.: Selective reagent ion-time of flight-mass spectrometry study of six common monoterpenes, Int. J. Mass Spectrom., 421, 40–50, https://doi.org/10.1016/j.ijms.2017.06.003, 2017.
Mozaffar, A. and Zhang, Y.-L.: Atmospheric Volatile Organic Compounds (VOCs) in China: a Review, Curr. Pollut. Rep., 6, 250–263, https://doi.org/10.1007/s40726-020-00149-1, 2020.
Nozière, B., Kalberer, M., Claeys, M., Allan, J., D'Anna, B., Decesari, S., Finessi, E., Glasius, M., Grgić, I., Hamilton, J. F., Hoffmann, T., Iinuma, Y., Jaoui, M., Kahnt, A., Kampf, C. J., Kourtchev, I., Maenhaut, W., Marsden, N., Saarikoski, S., Schnelle-Kreis, J., Surratt, J. D., Szidat, S., Szmigielski, R., and Wisthaler, A.: The Molecular Identification of Organic Compounds in the Atmosphere: State of the Art and Challenges, Chem. Rev., 115, 3919–3983, https://doi.org/10.1021/cr5003485, 2015.
Obersteiner, F., Bönisch, H., and Engel, A.: An automated gas chromatography time-of-flight mass spectrometry instrument for the quantitative analysis of halocarbons in air, Atmos. Meas. Tech., 9, 179–194, https://doi.org/10.5194/amt-9-179-2016, 2016.
Pagonis, D., Sekimoto, K., and de Gouw, J.: A Library of Proton-Transfer Reactions of H3O+ Ions Used for Trace Gas Detection, J. Am. Soc. Mass Spectrom., 30, 1330–1335, https://doi.org/10.1007/s13361-019-02209-3, 2019.
Romano, A. and Hanna, G. B.: Identification and quantification of VOCs by proton transfer reaction time of flight mass spectrometry: An experimental workflow for the optimization of specificity, sensitivity, and accuracy, J. Mass Spectrom., 53, 287–295, https://doi.org/10.1002/jms.4063, 2018.
Santos, F. J. and Galceran, M. T.: The application of gas chromatography to environmental analysis, TRAC-Trend. Anal. Chem., 21, 672–685, https://doi.org/10.1016/s0165-9936(02)00813-0, 2002.
Sekimoto, K. and Koss, A. R.: Modern mass spectrometry in atmospheric sciences: Measurement of volatile organic compounds in the troposphere using proton-transfer-reaction mass spectrometry, J. Mass Spectrom., 56, ii–ii, https://doi.org/10.1002/jms.4548, 2021.
Sekimoto, K., Li, S.-M., Yuan, B., Koss, A., Coggon, M., Warneke, C., and de Gouw, J.: Calculation of the sensitivity of proton-transfer-reaction mass spectrometry (PTR-MS) for organic trace gases using molecular properties, Int. J. Mass Spectrom., 421, 71–94, https://doi.org/10.1016/j.ijms.2017.04.006, 2017.
Smith, D. and Španěl, P.: Direct, rapid quantitative analyses of BVOCs using SIFT-MS and PTR-MS obviating sample collection, TRAC-Trend. Anal. Chem., 30, 945–959, https://doi.org/10.1016/j.trac.2011.05.001, 2011.
Tani, A., Hayward, S., and Hewitt, C. N.: Measurement of monoterpenes and related compounds by proton transfer reaction-mass spectrometry (PTR-MS), Int. J. Mass Spectrom., 223, 561–578, https://doi.org/10.1016/s1387-3806(02)00880-1, 2003.
van Den Dool, H. and Kratz, P. D.: A generalization of the retention index system including linear temperature programmed gas—liquid partition chromatography, J. Chromatogr. A, 11, 463–471, https://doi.org/10.1016/s0021-9673(01)80947-x, 1963.
Vermeuel, M. P., Novak, G. A., Kilgour, D. B., Claflin, M. S., Lerner, B. M., Trowbridge, A. M., Thom, J., Cleary, P. A., Desai, A. R., and Bertram, T. H.: Observations of biogenic volatile organic compounds over a mixed temperate forest during the summer to autumn transition, Atmos. Chem. Phys., 23, 4123–4148, https://doi.org/10.5194/acp-23-4123-2023, 2023.
Vettikkat, L., Miettinen, P., Buchholz, A., Rantala, P., Yu, H., Schallhart, S., Petäjä, T., Seco, R., Männistö, E., Kulmala, M., Tuittila, E.-S., Guenther, A. B., and Schobesberger, S.: High emission rates and strong temperature response make boreal wetlands a large source of isoprene and terpenes, Atmos. Chem. Phys., 23, 2683–2698, https://doi.org/10.5194/acp-23-2683-2023, 2023.
Vlasenko, A., Slowik, J. G., Bottenheim, J. W., Brickell, P. C., Chang, R. Y. -W., Macdonald, A. M., Shantz, N. C., Sjostedt, S. J., Wiebe, H. A., Leaitch, W. R., and Abbatt, J. P. D.: Measurements of VOCs by proton transfer reaction mass spectrometry at a rural Ontario site: Sources and correlation to aerosol composition, J. Geophys. Res.-Atmos., 114, D21305, https://doi.org/10.1029/2009jd012025, 2009.
von Schneidemesser, E., Monks, P. S., and Plass-Duelmer, C.: Global comparison of VOC and CO observations in urban areas, Atmos. Environ., 44, 5053–5064, https://doi.org/10.1016/j.atmosenv.2010.09.010, 2010.
Wang, W., Yuan, B., Peng, Y., Su, H., Cheng, Y., Yang, S., Wu, C., Qi, J., Bao, F., Huangfu, Y., Wang, C., Ye, C., Wang, Z., Wang, B., Wang, X., Song, W., Hu, W., Cheng, P., Zhu, M., Zheng, J., and Shao, M.: Direct observations indicate photodegradable oxygenated volatile organic compounds (OVOCs) as larger contributors to radicals and ozone production in the atmosphere, Atmos. Chem. Phys., 22, 4117–4128, https://doi.org/10.5194/acp-22-4117-2022, 2022.
Warneke, C., de Gouw, J. A., Kuster, W. C., Goldan, P. D., and Fall, R.: Validation of Atmospheric VOC Measurements by Proton-Transfer- Reaction Mass Spectrometry Using a Gas-Chromatographic Preseparation Method, Environ. Sci. Technol., 37, 2494–2501, https://doi.org/10.1021/es026266i, 2003.
Williams, J. and Koppmann, R.: Volatile Organic Compounds in the Atmosphere, Wiley, 1–32, https://doi.org/10.1002/9780470988657.ch1, 2010.
Yáñez-Serrano, A. M., Filella, I., LLusià, J., Gargallo-Garriga, A., Granda, V., Bourtsoukidis, E., Williams, J., Seco, R., Cappellin, L., Werner, C., de Gouw, J., and Peñuelas, J.: GLOVOCS – Master compound assignment guide for proton transfer reaction mass spectrometry users, Atmos. Environ., 244, 117929, https://doi.org/10.1016/j.atmosenv.2020.117929, 2021.
Yesildagli, B., Lee, S.-B., and Lee, J.: Temporal variations of volatile organic compounds inside the cabin of a new electric vehicle under different operation modes during winter using proton transfer reaction time-of-flight mass spectrometry, J. Hazard. Mater., 453, 131368, https://doi.org/10.1016/j.jhazmat.2023.131368, 2023.
Yuan, B., Koss, A. R., Warneke, C., Coggon, M., Sekimoto, K., and de Gouw, J. A.: Proton-Transfer-Reaction Mass Spectrometry: Applications in Atmospheric Sciences, Chem. Rev., 117, 13187–13229, https://doi.org/10.1021/acs.chemrev.7b00325, 2017.
Zhang, M., Cai, D., Lin, J., Liu, Z., Li, M., Wang, Y., and Chen, J.: Molecular characterization of atmospheric organic aerosols in typical megacities in China, npj Clim. Atmos. Sci., 7, 230, https://doi.org/10.1038/s41612-024-00784-1, 2024.
Zhou, X., Zhou, X., Wang, C., and Zhou, H.: Environmental and human health impacts of volatile organic compounds: A perspective review, Chemosphere, 313, 137489, https://doi.org/10.1016/j.chemosphere.2022.137489, 2023.