the Creative Commons Attribution 4.0 License.
the Creative Commons Attribution 4.0 License.
 | 26 Aug 2025
Description and validation of a carbon monoxide and nitrous oxide instrument for high-altitude airborne science (COMA)
Emma L. Yates
Levi M. Golston
James R. Podolske
Laura T. Iraci
Kristen E. Okorn
Caroline Dang
Roy R. Johnson
James Eilers
Richard Kolyer
Ian Astley
J. Brian Leen
In this work, we describe the development of the Carbon monOxide Measurement from Ames (COMA) instrument for measurement of carbon monoxide (CO) and nitrous oxide (N2O) aboard NASA's WB-57 high-altitude research aircraft. While COMA has previously flown in the cabin of the NASA P3 platform, here the instrument was modified to operate in a significantly different environment – an unpressurized pallet flying primarily above 12 km (40 000 ft). Modifications were made to the laser to allow for detection of CO and N2O, ruggedization and thermal management were addressed, and a calibration system was designed to quantify the measurement stability in-flight. Testing was conducted in a thermal vacuum chamber to mimic anticipated ambient conditions experienced inside the WB-57 pallet bay and found that the electronic components remained within the thermal limits. COMA was operated successfully during 9 unattended transit flights to and from South Korea and 15 research flights during NASA's Asian summer monsoon Chemical & CLImate Project (ACCLIP) 2022 campaign, which was focused on studying the Asian summer monsoon anticyclone in the western Pacific. The CO measurement has an overall uncertainty ranging between 4.1 ppb (at 50 ppb CO) and 5.6 ppb (at 200 ppb CO). N2O has an overall uncertainty of 2.7 ppb (at 320 ppb N2O). In addition, COMA observations were compared with two other in situ CO instruments co-located on the WB-57: the Carbon Monoxide Laser Detector 2 (COLD2) and the Airborne Carbonic Oxides and Sulfide Spectrometer (ACOS). Comparisons for the 15 flights during the ACCLIP campaign indicate ranges in slope of 1.10–1.15 for COLD2 vs. COMA and 0.94–1.10 for ACOS vs. COMA.
- Article
(4386 KB) - Full-text XML
- BibTeX
- EndNote


The transport of trace gases and aerosols into and within the upper troposphere and lower stratosphere (UTLS) during the Asian summer monsoon was the focus of the Asian summer monsoon Chemical & CLImate Project (ACCLIP) field campaign in the summer of 2022 (Honomichl and Pan, 2020; Pan et al., 2022, 2025). Carbon monoxide (CO) and nitrous oxide (N2O) were key measurements during ACCLIP due to their long atmospheric lifetimes. CO is used as a tracer of boundary layer air transport and to infer air-mass age (e.g., Pan et al., 2016; Park et al., 2009). Additionally, N2O is a dominant ozone-depleting substance (Ravishankara et al., 2009) with surface sources and stratospheric losses (Tian et al., 2020), which can indicate in-mixing of aged stratospheric air (e.g., Gonzalez et al., 2021; Hintsa et al., 1998). As such, understanding the transport mechanisms and behavior of CO and N2O during the Asian summer monsoon is crucial for evaluating their impact on the regional and global climate.
Given its importance, CO has been measured in numerous airborne field campaigns using different aircraft platforms and several different measurement techniques. Established airborne measurements of CO and N2O with fast instrument response times (s) frequently use high-precision infrared (IR) spectroscopic techniques to create spatially and temporally dense datasets. Existing spectroscopic sensor systems operating in the mid-IR use optical sources such as quantum cascade lasers (QCLs) or inter-band cascade lasers (ICLs) in conjunction with path length enhancement techniques such as multi-pass cells (Gvakharia, Vicicani, etc.) or off-axis integrated cavity output spectroscopy (OA-ICOS) (Kloss et al., 2021; Gvakharia et al., 2018; Kostinek et al., 2019; Pitt et al., 2016; Viciani et al., 2018). Systems operating in the near-IR and utilizing cavity ring-down spectroscopy (CRDS) have also been fielded (Filges et al., 2015). A detailed overview of these different methods can be found in Zellweger et al. (2019).
This paper describes the work undertaken to convert NASA's Carbon monOxide Measurement from Ames (COMA), a laboratory-based OA-ICOS instrument (Los Gatos Research, now ABB Ltd.), into an airborne instrument capable of high-altitude (18 km) airborne measurements of CO and N2O. The airborne operational requirements were that COMA had to operate autonomously in an unpressurized, unheated payload bay of NASA's WB-57 aircraft while flying at altitudes up to 18 km for up to 5 h of flight time during the ACCLIP campaign. Restrictions on the instrument design included space, size, low operating pressure (∼ 75 hPa), low in-flight temperature (−20 °C), high pre- and post-flight temperature (> 30 °C) and humidity, and requirements for accurate and precise CO and N2O measurements.
This work details the instrument testing, modifications, and final design of COMA, an instrument designed to meet the operational requirements necessary for high-altitude flights on NASA's WB-57. We also describe COMA's in-flight performance and operation and briefly discuss observations of CO and N2O in the UTLS region during the Asian summer monsoon in the summer of 2022.
The operational requirements to fly in one half of a pallet for the payload bay of NASA's WB-57 included instrument size restrictions to physically fit within the space provided, inlet and operating pressures as low as 50 torr (∼ 75 hPa) when flying at 18 km, a low in-flight temperature (−20 °C), and high pre- and post-flight temperatures (> 30 °C) and humidity during the ACCLIP field campaign. Operation in an unpressurized UTLS environment presents multiple challenges to instrument stability and performance, since the instrument is designed for ground-based operation. To address these challenges, the COMA instrument underwent significant modifications, followed by laboratory and environmental chamber testing to simulate instrument behavior under expected flight conditions.
2.1 Instrument description
COMA is based on a laboratory-oriented OA-ICOS instrument (Los Gatos Research (now ABB Ltd.) GLA251-N2OCM) which detects a CO absorption feature as well as nearby N2O and H2O absorption features. The original instrument was manufactured for NASA Ames Research Center in December 2015. The unmodified instrument flew on NASA's P3 aircraft in a 19 in. (48.3 cm) rack within the pressurized cabin during the ObseRvations of Aerosols above CLouds and their intEractionS (ORACLES) field campaign in 2018, providing observations of CO and CO2 on 41 flights up to 7 km altitude (Redemann et al., 2021).
In preparation for ACCLIP, some initial instrument modifications were made, including a computer stack upgrade and replacement of the laser with one with increased sensitivity to CO. Changing the laser allowed for N2O observations but at the expense of removing the CO2 channel. This was to accommodate the low values of CO expected to be observed in ACCLIP's UTLS-focused campaign. Other modifications included the installation of higher-conductance vacuum control valves, increasing the measurement range of the sample gas temperature thermistor, and modification of the secondary laser temperature controller set point for the expected thermal environment. The sample cell pressure was adjusted to operate at 52.8 torr (70.4 hPa) to accommodate the ambient UTLS pressures. Enclosure heaters and two 150 W box fans were added to the COMA payload to help reduce condensation on the optical windows and to stabilize the COMA enclosure temperature.
2.1.1 Payload design
COMA was installed in a pallet for upload into NASA's WB-57 payload bay, as shown in Fig. 1. COMA's external mounting structure (chassis) was made of alodine-treated aluminum and featured side rails to allow for easy installation. The total assembled payload (excluding the pallet) weighed 97.8 kg. The instrument was run from 115 VAC 60 Hz power from the aircraft. A 28 VDC line for relay activation to power the instrument from the experimental control panel (ECP) was added. The power distribution box contained breakers for the inlet heater, COMA analyzer, commercial multiport inlet unit (MIU), inlet pump, and master switch. The external pump was controlled by COMA and was the default pump used (COMA switches from operating using an internal to external pump on initial startup). Addition of an eight-channel thermocouple temperature data logger (Madgetech TCTempX8LCD and Type K thermocouples) allowed for measurements of the thermal operating conditions experienced in-flight by COMA as shown in Fig. 2.
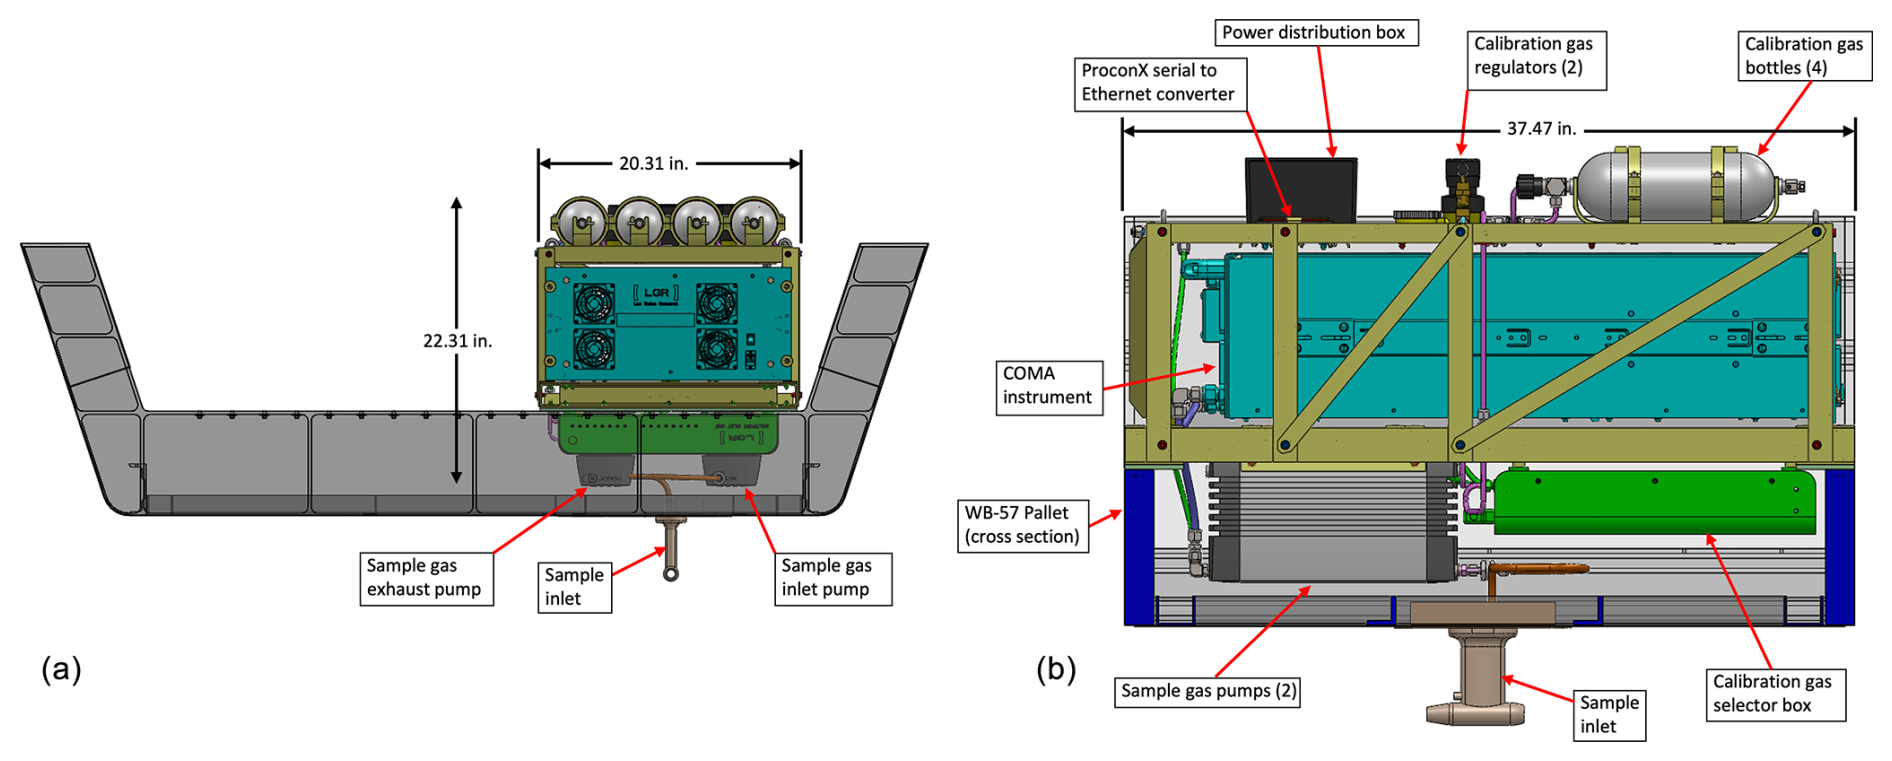
Figure 1COMA payload design (b) and COMA payload installed in NASA's WB-57 payload pallet (looking aft) (a). The engineering drawings show the layout of COMA within NASA's WB-57 payload bay, including the locations of the main COMA instrument (teal) and the two sample pumps (sample gas pumps), the calibration system (four calibration standard gas bottles), two regulators (calibration gas regulators), the MIU (calibration gas selector box), the power distribution box and sample inlet (bottom), and a cross-sectional view of COMA within the permitted envelope, including the COMA dimension details (inches) (a).
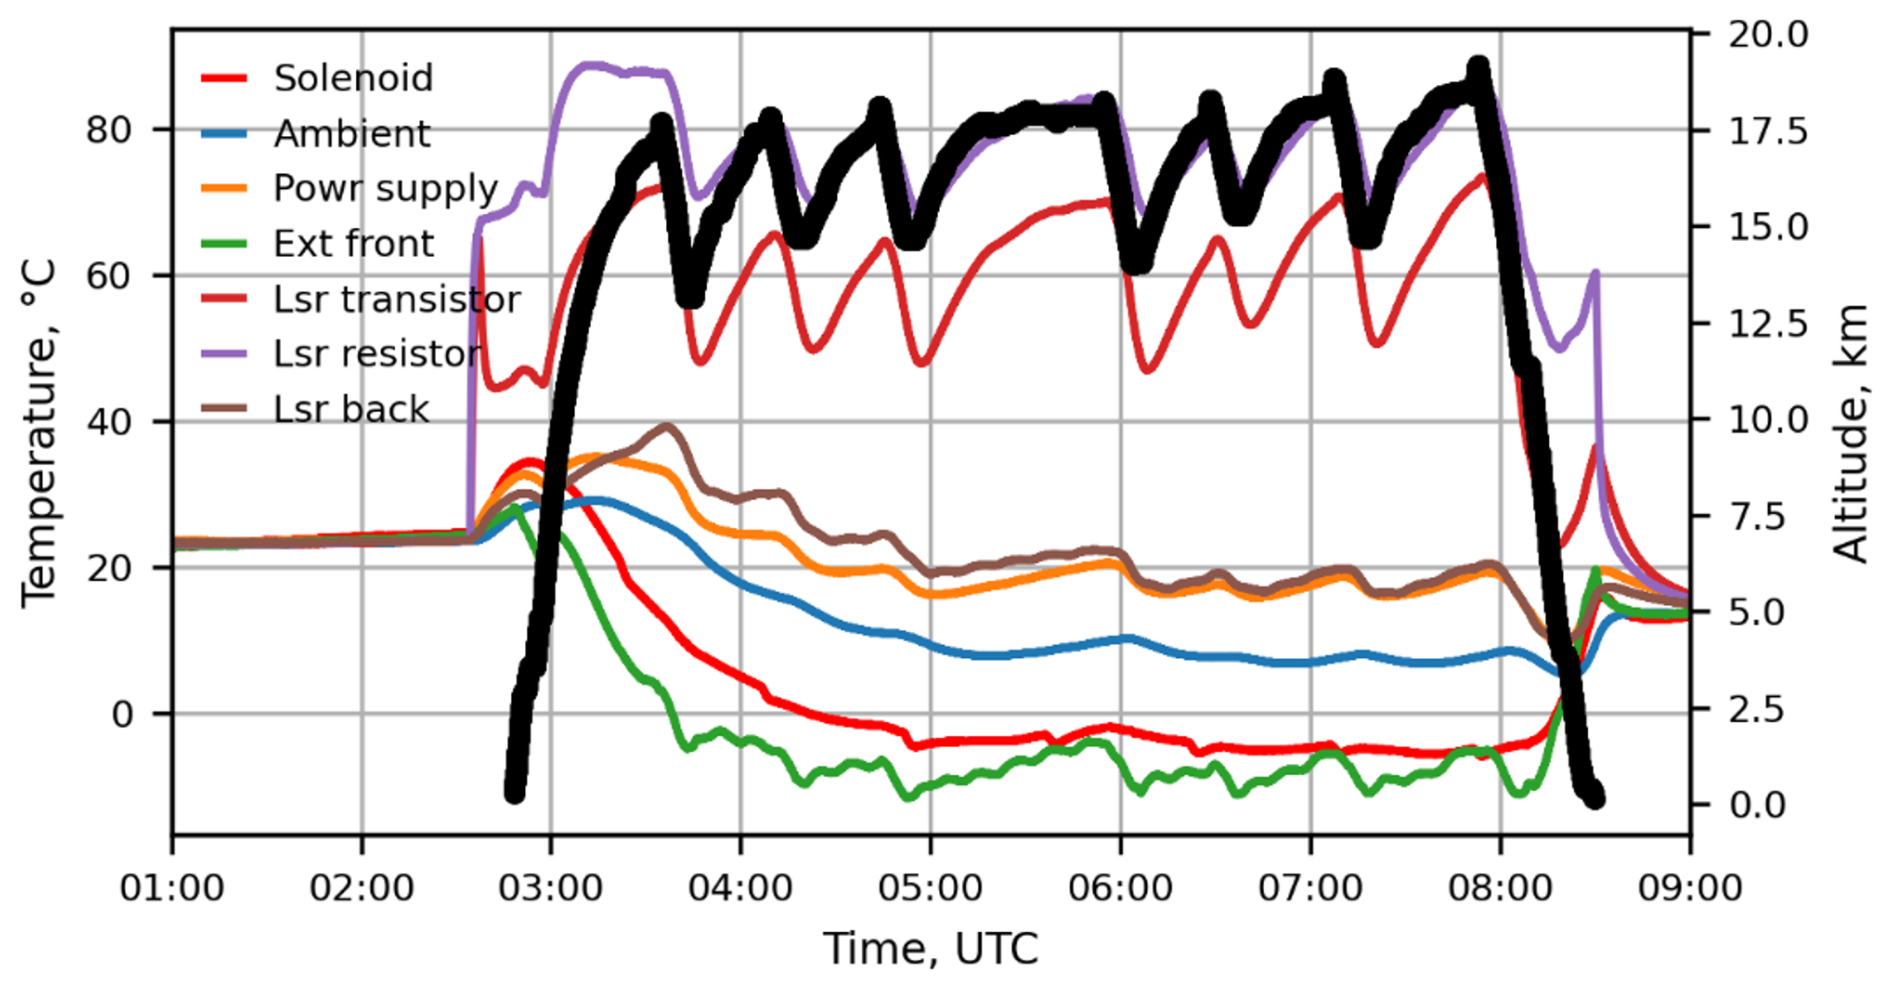
Figure 2Typical operating thermal conditions experienced by COMA during ACCLIP research flights. The data are from 21 August 2022 (Research Flight no. 11). The black line shows the aircraft altitude (right axis), and the other lines show the measured temperatures at multiple locations inside and outside the COMA chassis. Orange red (dash): external front (Ext front). Orange: power supply (PWR SPLY). Light blue (dash): laser transistor (Lsr transistor). Blue: laser resistor (Lsr resistor). Light orange: solenoid. Purple: laser backing. Purple (dash): ambient temperature (Amb T).
2.1.2 Flow system
COMA used an inlet probe, which has previously flown on NASA's WB-57, from NASA's Goddard Space Flight Center known as the “CAFE Inlet” (St. Clair et al., 2019) and mounted on the underside of the pallet. The inlet includes a cartridge heater (SunRod) controlled to 30 °C by a proportional controller (Minco CT335). Inside the payload bay, Teflon FEP or stainless-steel tubing carries the sample flow from the inlet to the instrument via an inlet diaphragm pump (KNF Group, NF N90 APE-W), a relief valve (TAVCO 20 psia), and a high-flow solenoid valve. The solenoid valve directs the sample air to one of the eight available ports on the MIU, which is programmed to control COMA's air sampling and calibration sampling pattern (discussed in Sect. 4.3). The inlet diaphragm pump, an internal (to COMA) pump, and an external (to COMA) exhaust pump (KNF Group, NF N90 APE-W) pull the sample through COMA and exhaust it into the ambient atmosphere. COMA contains internal valves that maintain a pressure of 52.8 torr within its sampling cell. A diagram of COMA's flow system is shown in Fig. 3.
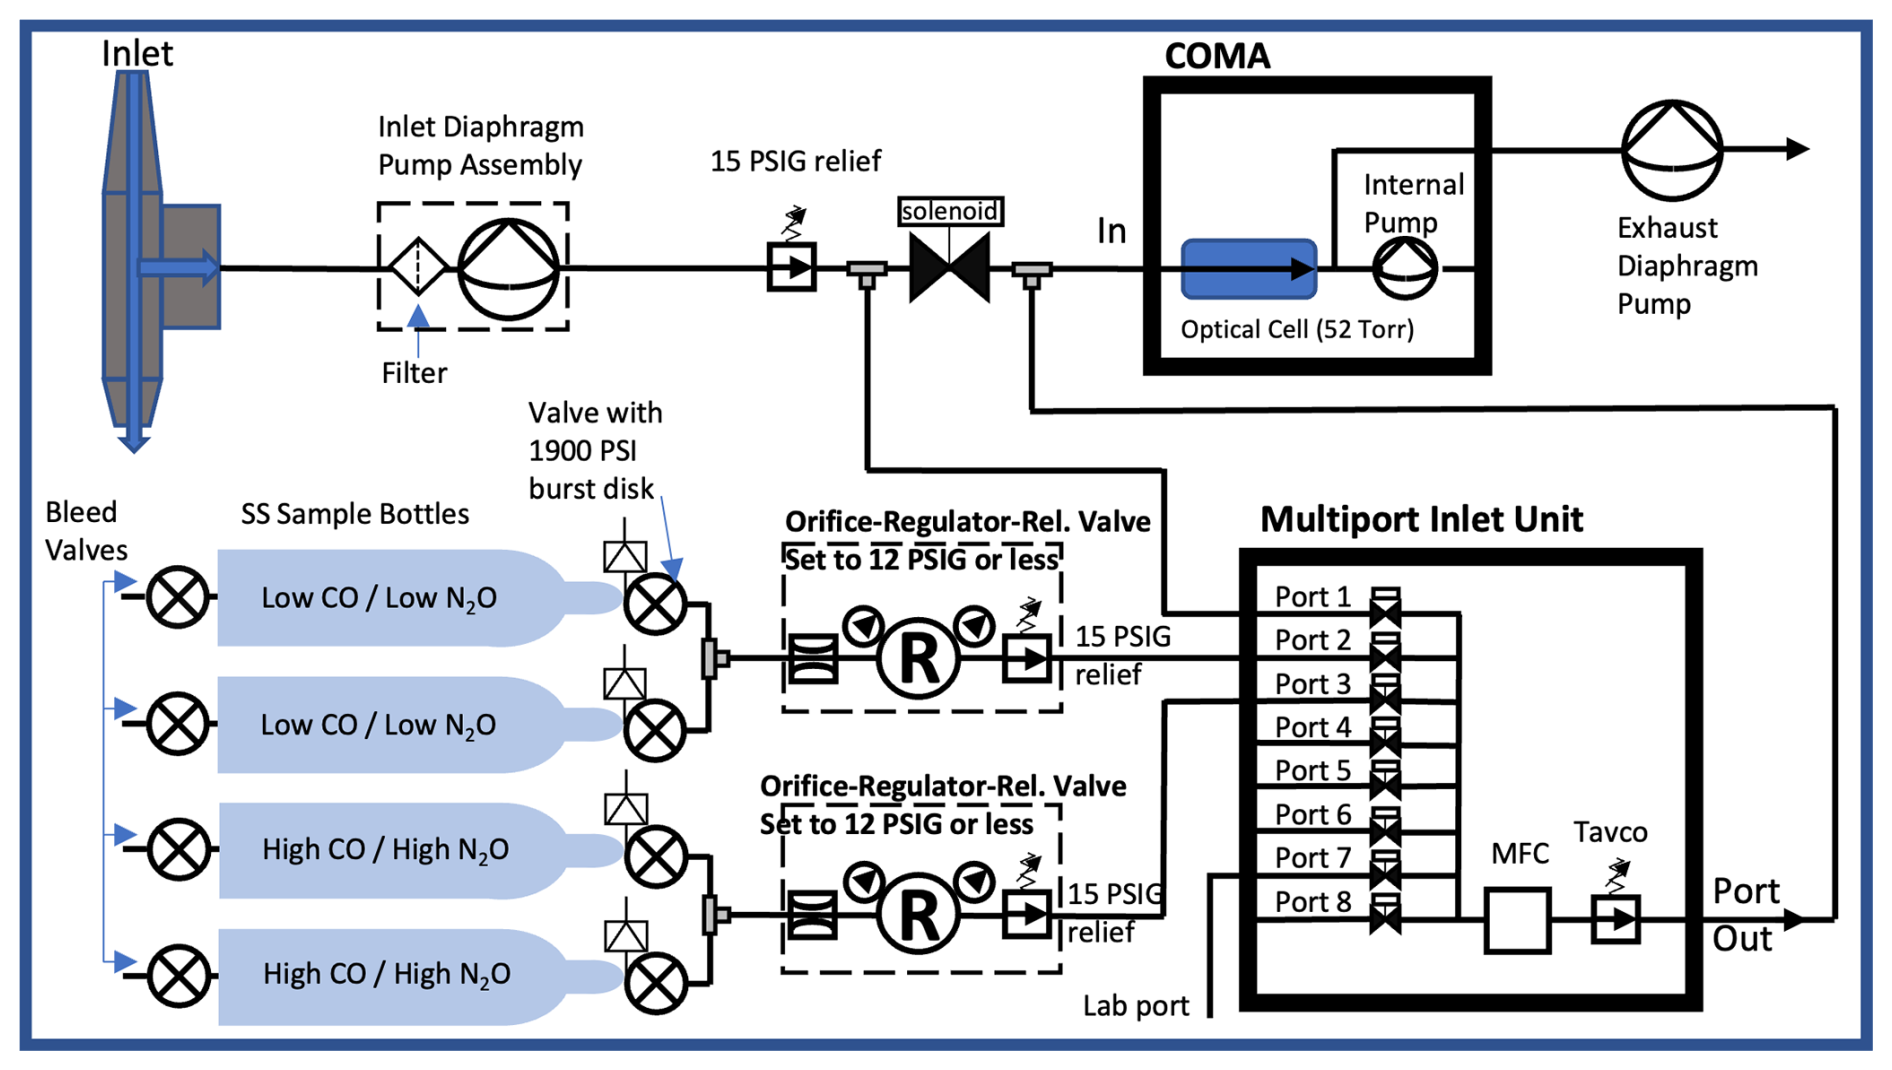
COMA's in-flight calibration system consisted of four Swagelok double-ended stainless-steel cylinders (304L-HDF4-1000) with 1800 PSI maximum allowable working pressure (MAWP) and 1000 PSIG maximum operating pressure (MOP). Prior to the ACCLIP campaign deployment, the in-flight cylinders were filled from one of four source cylinders: two primary NOAA Global Monitoring Laboratory whole-air standards, certified by the WMO Central Calibration Laboratory for CO (Novelli et al., 1991) and N2O (Hall et al., 2007). These were the low CO standard “NOAA 1” (tank no. CC745344; CO ∼ 51.77 ppb ± 0.94 and N2O ∼ 265.89 ppb ± 0.03) and high CO standard “NOAA 2” (tank no. CC746190; CO ∼ 164.34 ppb ± 1.84 and N2O ∼ 348.06 ppb ± 0.05). The two secondary standards were “Matheson 1” (∼ 200 ppb each for CO and N2O) and “Matheson 2” (∼ 1000 ppb each for CO and N2O). The NOAA standards are referenced on the WMO CO_X2014A scale for CO and the NOAA-2006A scale for N2O. Further details on the calibration scales can be found at https://gml.noaa.gov/ccl/refgas.html (last access: 8 August 2025). Only two standard cylinders were open at any one time (the other two had valve locks installed on the unopened cylinders to prevent leakage). The two NOAA-filled cylinders were the first to be sampled by COMA during in-flight calibrations before the secondary standards were sampled. The standards were deployed during the field campaign, which allowed the in-flight calibration system to be re-filled with the secondary standards and sampled throughout the duration of the ACCLIP deployment.
2.1.3 Telemetry
COMA was required to run autonomously aboard the WB-57. The instrument could be controlled (on/off) by the Science Equipment Operator located in the rear cockpit to power cycle the instrument. Bandwidth to communicate with the instrument in-flight was limited. To address this, we developed communication and processing software for real-time monitoring on the ground, consisting of a Python script which ran on the analyzer to access data files and output 1 Hz user data protocol (UDP) packets. It also included a proconX SERIP-100 serial-to-ethernet converter as a backup system, which sent UDP packets for real-time monitoring on the ground. In addition, NASA's Mission Tools Suite (MTS) was used to communicate with the ground while in-flight (https://airbornescience.nasa.gov/tracker/, last access: 8 August 2025).
2.2 Instrument performance
2.2.1 Environmental chamber testing
Prior to deployment, COMA was tested extensively in the NASA Ames Research Center Engineering Evaluation Laboratory (EEL). The environmental chamber testing plans centered around two main concerns. First, the thermal stability of the instrument's components was tested to ensure safe operation of the laser and other components under UTLS-like conditions. Second, the stability of the instrument was tested by sampling from a standard gas mixture while simulating UTLS conditions.
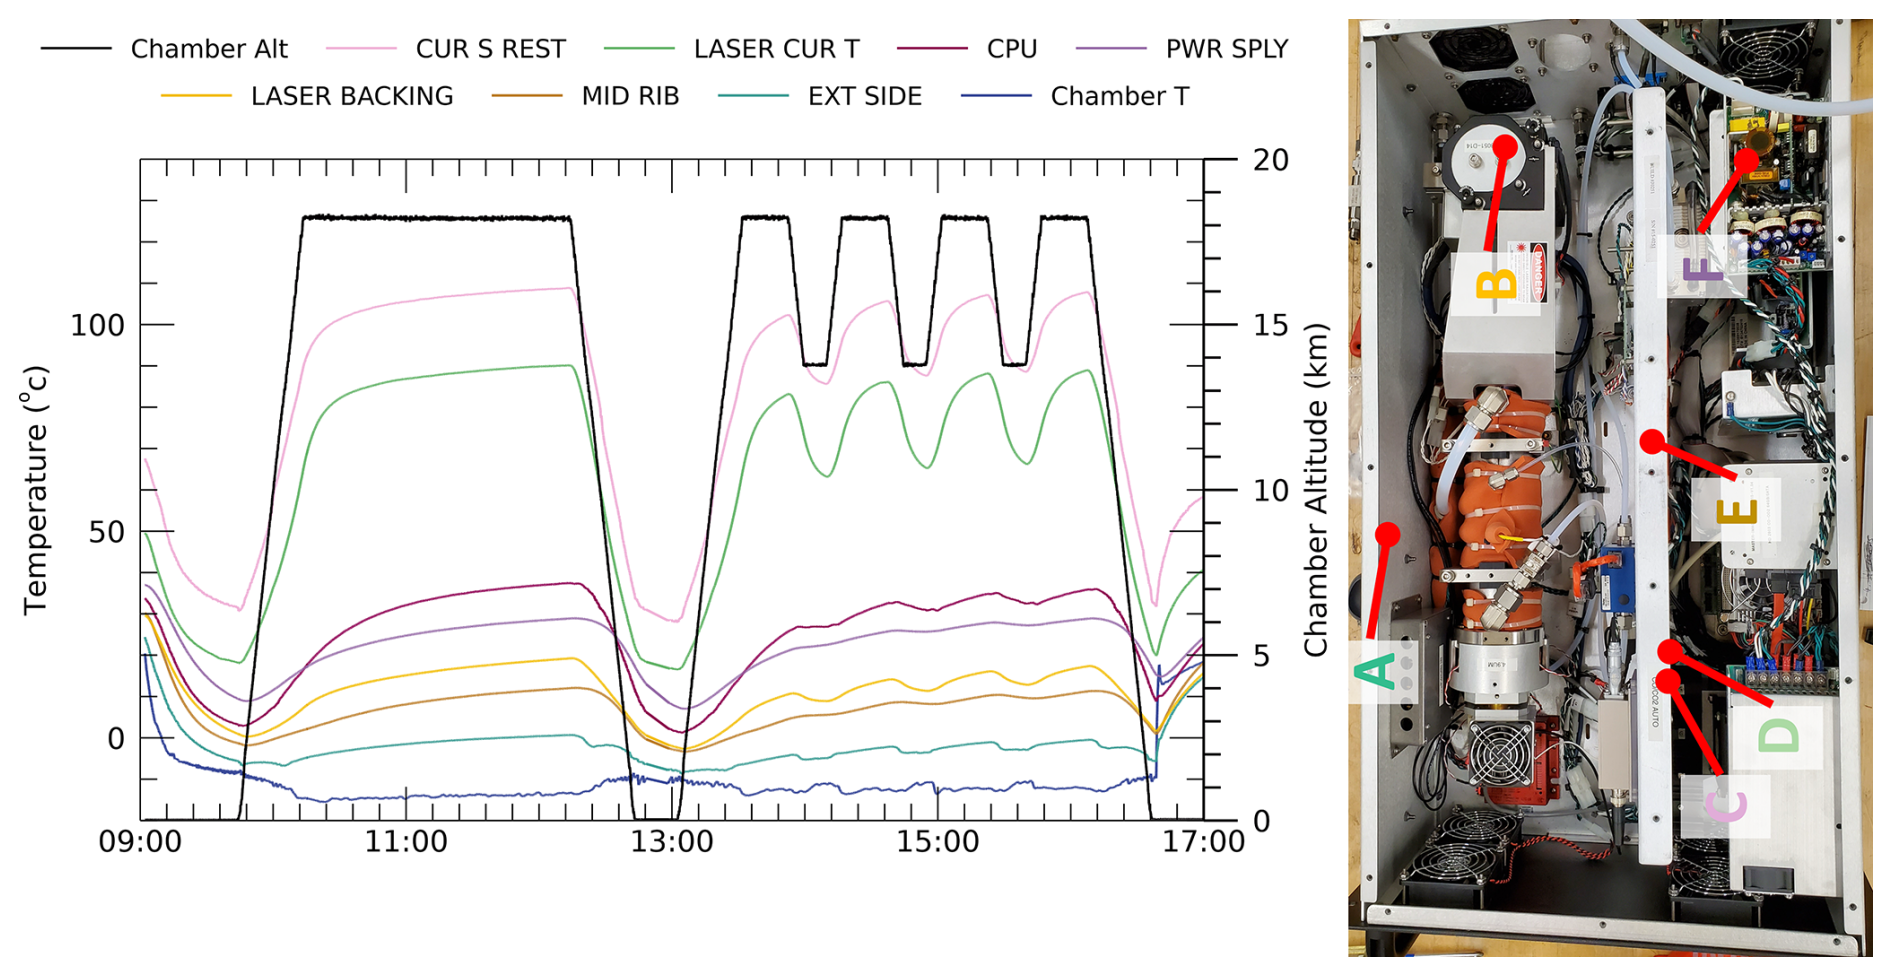
Figure 4Environmental chamber time series showing COMA's component temperatures during a simulated UTLS flight conducted on 20 May 2022 (right). The corresponding thermocouple locations are shown on the right. External side: EXT SIDE (A), laser backing (B), laser current sensing resistor: CUR S REST (C), laser current temperature: LASER CUR T (D), internal dividing panel: MID-RIB (E), and power supply: PWR SPLY (F).
In the environmental chamber, seven thermocouples were placed inside the COMA instrument, one along the middle dividing panel inside the sensor (Fig. 4: mid-rib) and at six locations considered critical or at risk of overheating. Figure 4 shows the thermal performance of COMA's individual components during a simulated UTLS flight, when the chamber altitude (pressure) was varied (Fig. 4: black line, secondary y axis). The results from the thermal testing showed that, at altitudes up to 18 km, the components did not become unstable or overheat outside the expected operational ranges identified for these components.
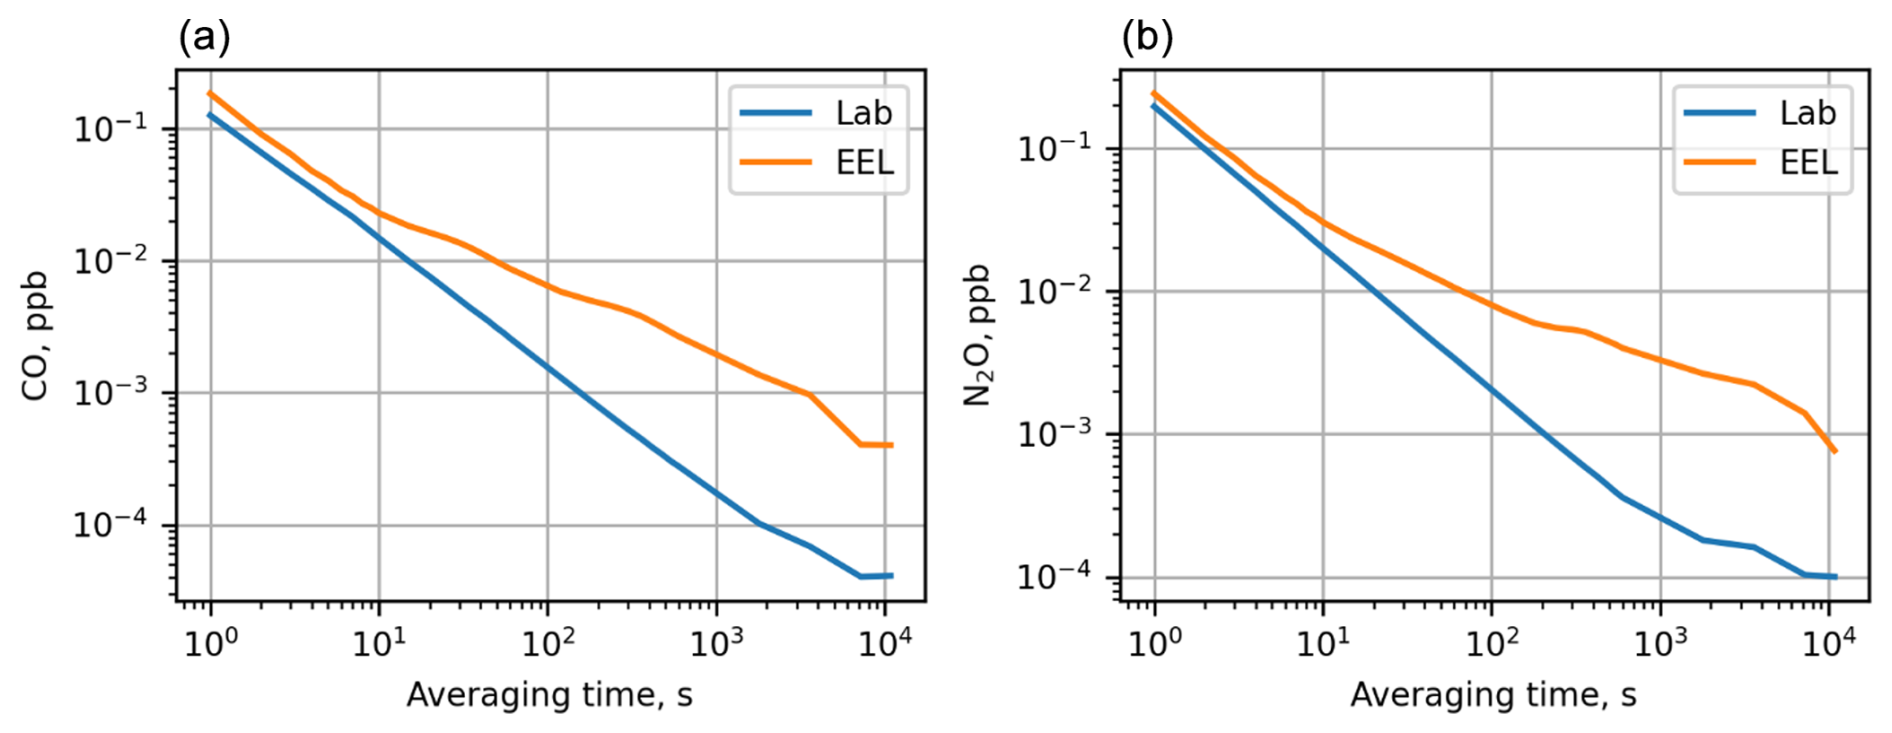
Figure 5Allan deviation results, comparing data collected in the laboratory (blue) and an environmental chamber (EEL, orange) during standard sampling for CO (a) and N2O (b). Under both conditions, there was 1 Hz precision for ∼ 0.1–0.2 ppb for both gases. See Fig. 4 for the chamber pressure and temperature details.
Allan deviation (Allan, 1987) was used as a metric of COMA's stability as shown in Fig. 5, which presents the Allan deviation as a function of averaging time to illustrate how precision changes based on data averaging. The results show laboratory 1 Hz precisions of ∼ 0.13 ppb for CO and ∼ 0.19 ppb for N2O. The precision improves with increased data averaging during standard sampling in the laboratory (blue) up to ∼ 1000 s, after which additional time averaging has little benefit. In the environmental chamber, under the conditions shown in Fig. 4, precision is similar at 1 Hz and improves with increased averaging at approximately the same rate of change as in the laboratory up to 10 s, after which the improvements in precision are at a slower rate of change, likely due to noise or additional uncertainty in the measurements from changing operational (chamber temperature and pressure) conditions.
2.2.2 Instrument linearity
Linearity assessments were performed using a flow mixing system equipped with high-accuracy mass flow controllers from Alicat Scientific Inc. (MC-1SLP-D; most recent calibration, reported accuracy ±0.6 % from a reading on 3 November 2021) and OMEGA Engineering inc. (FMA-2602A; most recent calibration, reported accuracy ±0.4 % from a reading on 11 July 2021). A secondary synthetic CO standard (∼ 1000 ppb each of CO and N2O) and a zero-air standard were used to perform the linearity mixing analysis. The linearity assessment for COMA is shown in Fig. 6 and demonstrates that COMA is highly linear over a wide range of CO and N2O mixing ratios. Figure 6 shows COMA to be linear (slope of 1.00) to within 0.1 % between 25 and 1000 ppb CO and linear (slope of 1.00) to within 0.1 % between 25 and 850 ppb N2O, with the largest uncertainty equal to the reported accuracies of the flow meters stated above.
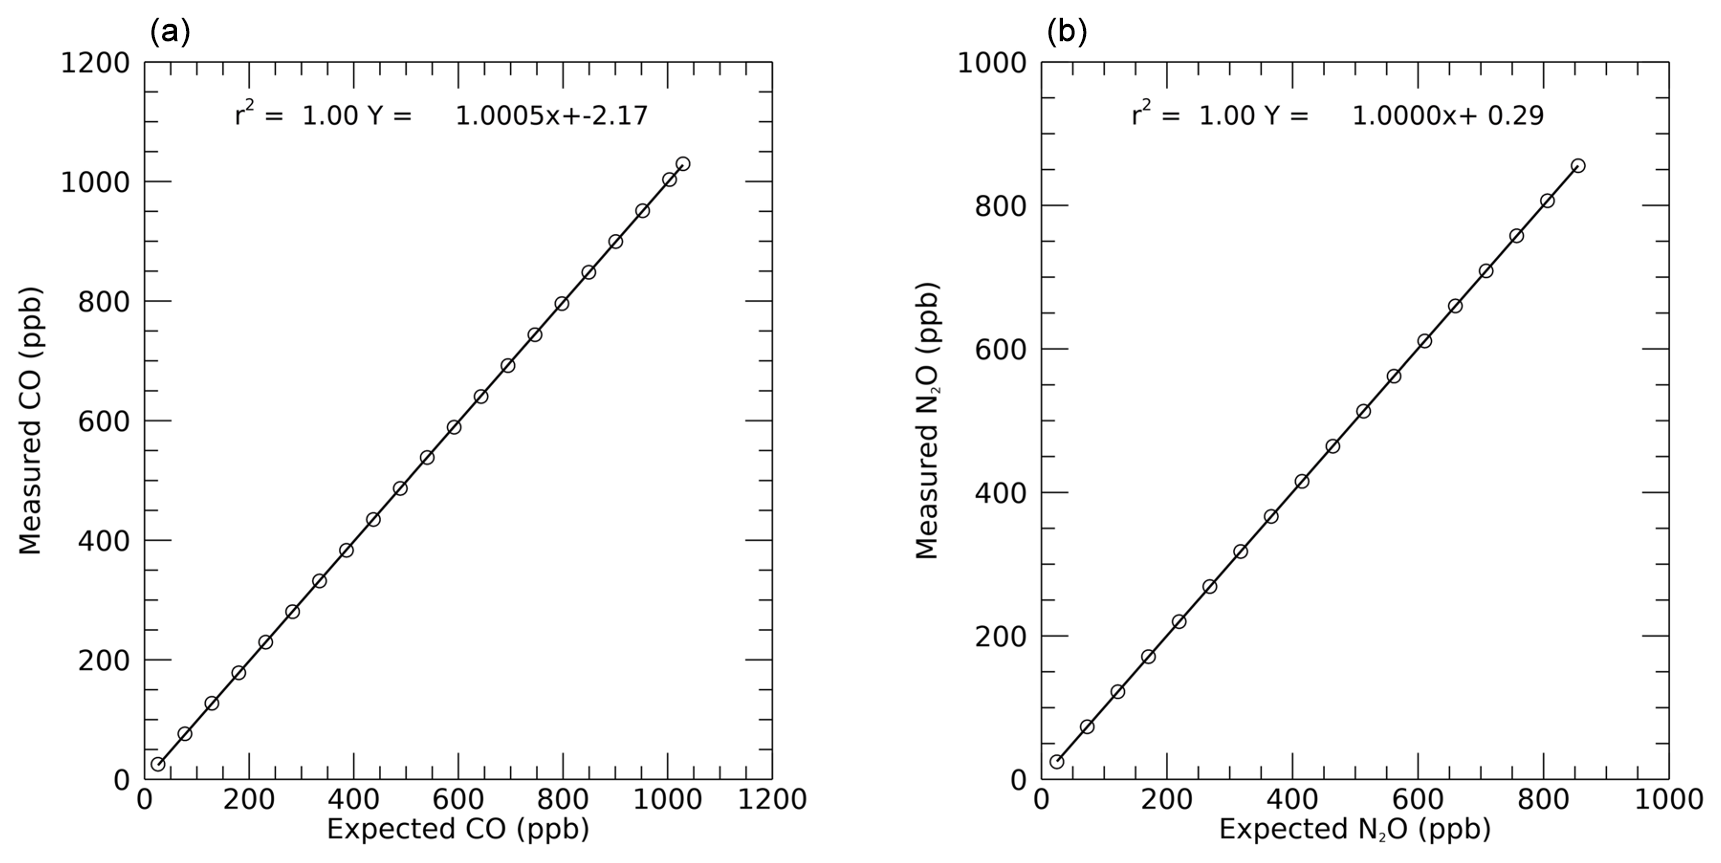
Figure 6COMA instrument linearity for CO (a) and N2O (b) as performed under laboratory conditions on 20 October 2023.
2.2.3 Instrument calibration and measurement uncertainty
Calibration to NOAA standards was applied (see Sect. 2.1.2) using data collected at ground level throughout the campaign as well as after to help account for time drift in the instrument. Outliers, which deviated from the mean by more than 4 standard deviations, were removed. Multivariate linear regressions with time and measured concentration as dependent variables were applied for both CO and N2O. Slight degradation in the instrument response was observed over the course of the campaign and was accounted for with the inclusion of an elapsed time term in the final calibrations. The estimation of the overall accuracy of CO includes small contributions due to the accuracy of the standard gases but was dominated by the residuals remaining after this calibration to NOAA standards. The overall accuracy for CO was determined to be ±3.8 ppb over the calibration range. Accuracy for N2O is comprised equally of the contributions from the residuals after calibration to NOAA standards (1.0 ppb) and NOAA scale uncertainty (0.31 %). Given the relatively small range of N2O values observed in the field, the overall accuracy in N2O can be approximated by the value of ±1.4 ppb, as calculated at N2O = 320 ppb.
The in-flight calibration system ran a cycle of 60 s of low-mixing-ratio calibration gas followed by 60 s of high-mixing-ratio gas periodically throughout each flight. Figure 7 shows the results from in-flight calibrations for CO (bottom) and N2O (top) during the ACCLIP deployment for primary whole-air NOAA standards (left) and secondary synthetic standards (right). Note that only the NOAA standards were used for linear calibration fits; the secondary synthetic standards were only used for internal assessment. The intra- and inter-flight variability in the flight calibrations gives an indication of the in-flight instrument's 1σ precision. The standard deviations of observations at three different mixing ratios were seen to vary slightly with the mixing ratio, as shown in Eqs. (1) and (2). For example, at 320 ppb, the N2O precision was 2.3 ppb (equivalent to 0.7 %). At 50 ppb, the CO precision was 1.4 ppb (equivalent to 2.8 %), while at 200 ppb the CO precision was 4.1 ppb (equivalent to 2.1 %). Readers should use discretion if extrapolation of precision is required outside the range used to determine these equations (CO: 48–203 ppb; N2O: 195–345 ppb).
The overall uncertainty is determined by the square root of the sum of the squares of the accuracy and precision terms. If desired, the total uncertainty for each measurement can be calculated from the individual terms. Under flight conditions at 320 ppb, the N2O total uncertainty is 2.7 ppb. At 50 ppb, the CO total uncertainty is 4.1 ppb. At 200 ppb, the CO total uncertainty is 5.6 ppb.
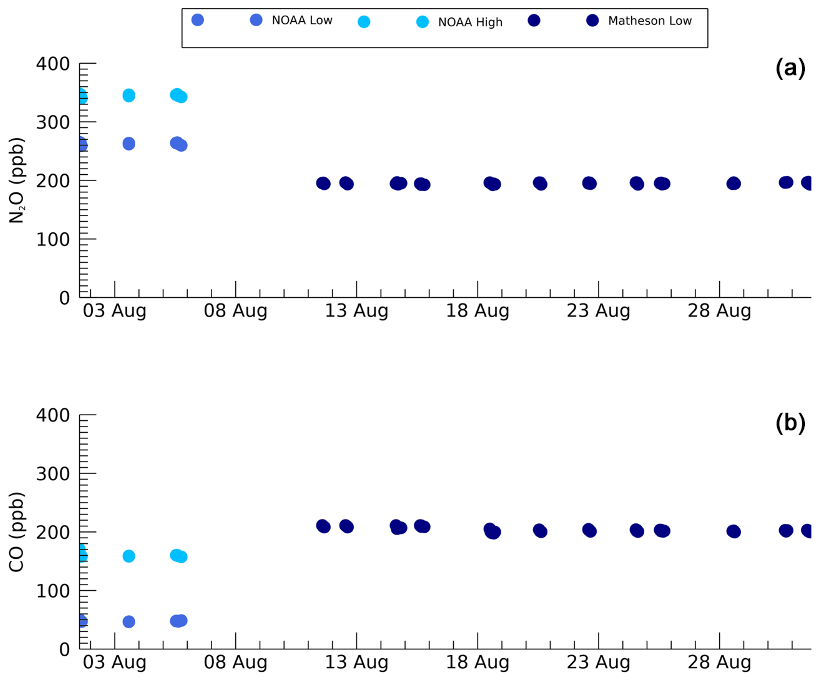
Figure 7Mean value from individual in-flight calibration periods for CO (b) and N2O (a) during the ACCLIP deployment for primary whole-air NOAA standards (prior to 8 August 2022) and secondary Matheson synthetic standards (after 11 August 2022). The standard deviation of each calibration mean value is significantly smaller than the size of the symbol plotted. Note that the primary whole-air standards (NOAA) were sampled during in-flight calibrations prior to 8 August 2022. Once these were exhausted, the secondary standards (Matheson) were used for in-flight calibrations on or after 11 August 2022.
2.2.4 Data processing
In addition to applying the calibration equations described in Sect. 2.2.3, several steps were taken to ensure the quality of the reported atmospheric observations of CO and N2O. Measurements recorded during periodic calibration cycles and up to 1 min of data before and after were removed, as were measurements before and during takeoff and after landing. A time lag is present in the raw data due to a combination of physical effects and clock offsets, which were accounted for by determining a median offset for each flight by correlation with an additional CO instrument (Carbon Monoxide Laser Detector 2 – COLD2) aboard the WB-57. When COMA's measurement cell pressure deviated from the median pressure by more than 0.25 %, N2O data were omitted, and CO data were omitted on a case-by-case basis. (CO measurements were more robust against cell pressure oscillations but were not immune.) Additional deviations from nominal operating conditions were evaluated on a case-by-case basis.
COMA flew aboard NASA's WB-57 on 4 test flights (TFs) from Ellington Field, TX, in the summer of 2021; 1 functional check flight and 2 test flights in Ellington Field, TX, in July 2022; 5 outbound transit flights from Ellington Field, TX, USA, to Osan Air Base, South Korea; 15 research flights (RFs) from Osan Air Base; and 4 return transit flights to Ellington Field, TX, USA. The data are archived and publicly available at the NASA Langley Research Center (LaRC) Distributed Active Archive Center (DAAC) (https://www-air.larc.nasa.gov/cgi-bin/ArcView/acclip.2022, last access: 8 August 2025).
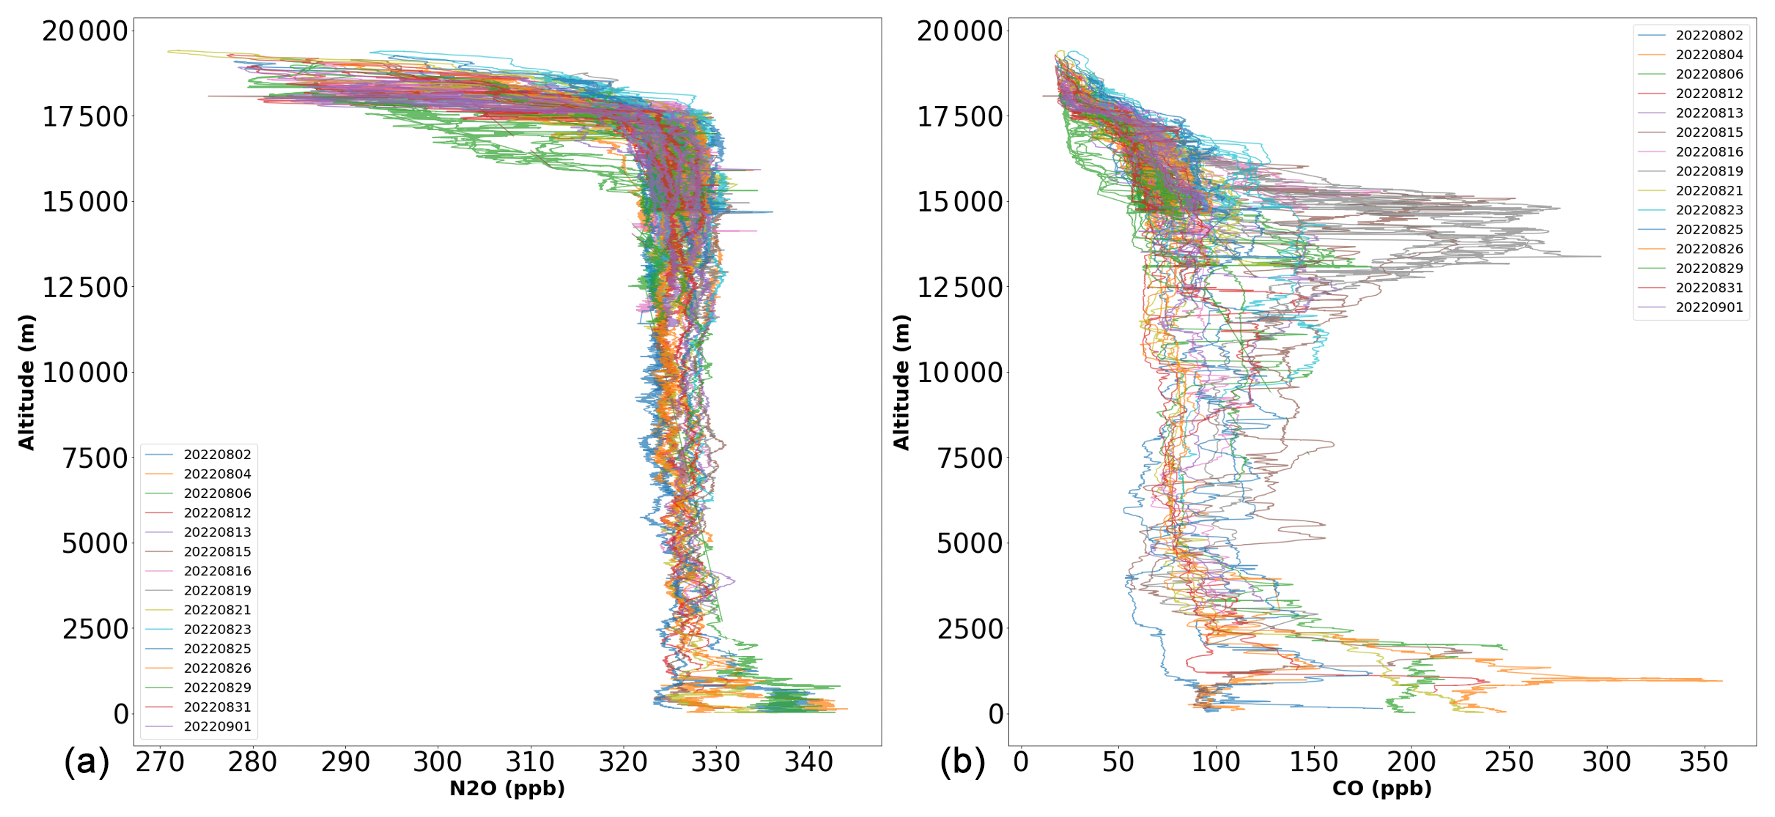
Figure 8Vertical profiles of all N2O (a) and CO (b) measurements taken by COMA during the ACCLIP campaign research flights from Osan, South Korea, in July and August 2022.
The WB-57 typically profiled multiple times through the UTLS during each research flight, resulting in vertical profiles of CO and N2O. Figure 8 shows a summary of observations of N2O and CO reported by COMA, plotted by altitude and colored by flight date for ACCLIP campaign research flights from Osan, South Korea. General observations include day-to-day variability in CO and N2O within the boundary layer (≲ 2 km). Within the free troposphere (∼ 2.5 to 12.5 km), N2O is well-mixed, with little day-to-day variability. However, there is more variability observed in CO. The UTLS region (∼ 12.5 to 16 km) shows highly variable CO, with the interception of lofted pollution originating from convective influences over Asia during different flights. In contrast, N2O remains well-mixed in this altitude region. Decreasing profiles of both CO and N2O were observed within the stratosphere (≳ 16 km).
Data comparison with COLD2 and the Airborne Carbonic Oxides and Sulfide Spectrometer (ACOS)
During the ACCLIP campaign, two other instruments were aboard NASA's WB-57 that measured CO: COLD2 and ACOS. COLD2, operated by CNR-INO (CNR National Institute of Optics), is a mid-infrared quantum cascade laser spectrometer that has previously flown on an M55 aircraft during StratoClim (Stratospheric and upper tropospheric processes for better Climate predictions) (Viciani et al., 2018). ACOS is a NOAA-operated, off-axis integrated cavity output spectrometer (ICOS) that measures carbonyl sulfide (OCS) and CO (Gurganus et al., 2024).
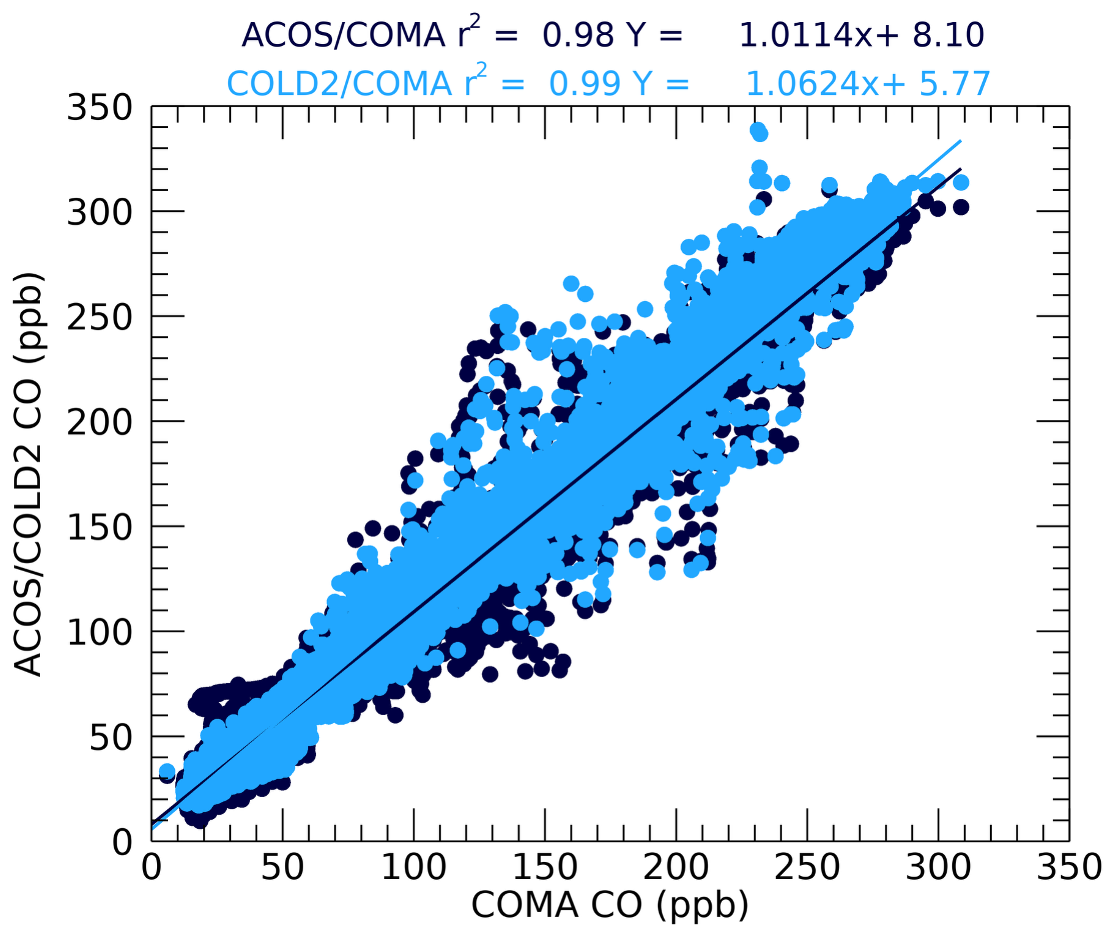
Figure 9 shows the CO data comparison as a linear regression and demonstrates excellent overall agreement between the three CO instruments. The cross plot shows the correlation of the 1 Hz CO measurements with ACOS and COLD2 CO on the vertical axis and COMA CO on the horizontal axis, with slopes of 1.06 for COLD2 (r2=0.99) and 1.01 for ACOS (r2=0.98), indicating strong agreement throughout the ACCLIP field campaign. Comparisons of the 15 individual flights from the campaign indicate ranges in slope of 1.02–1.08 for COLD2 and 0.89–1.10 for ACOS.
The NASA COMA instrument provides high-sensitivity measurements of CO and N2O from ground level to an altitude of ∼ 18 km. COMA flew aboard NASA's WB-57 during 24 flights, supporting the ACCLIP field campaign based in South Korea during 2022. COMA data from this campaign are archived and publicly available (https://www-air.larc.nasa.gov/cgi-bin/ArcView/acclip.2022).
During ACCLIP, COMA flew primarily between 12 and 19 km within an unpressurized pallet of the WB-57. To operate successfully under these conditions, significant modifications were made to the original laboratory-oriented instrument, followed by laboratory and environmental chamber testing to simulate the instrument behavior under the expected flight conditions.
This paper details the COMA design modifications, including the installation in the WB-57 payload pallet required for flight. Details of the internal instrument modifications and changes to the operational parameters are given in Sect. 2. External modifications to COMA to accommodate flights in the UTLS region included additional heaters and fans to help reduce condensation and manage thermal conditions. An in-flight calibration system was added to the COMA payload to allow an evaluation of COMA in-flight performance, together with an MIU to allow gas sampling selection (e.g., an inlet or calibration standard, as detailed in Sect. 2.1.2).
COMA instrument performance was assessed through extensive laboratory and environmental chamber testing (detailed in Sect. 2.2). This testing included assessments of COMA operation under simulated UTLS conditions, linearity assessment, assessment of laboratory and in-flight COMA calibrations, and data comparison of COMA to two independent instruments measuring CO (COLD2 and ACOS). Overall, the instrument achieved uncertainties during ACCLIP of 2.7 ppb N2O (at 320 ppb) and 5.6 ppb CO (at 200 ppb). COMA's successful integration aboard NASA's WB-57, demonstrated field performance, and favorable comparison to other independent instruments enable a new CO and N2O capability for airborne science measurements in the upper troposphere and lower stratosphere.
The code used in the paper is available at https://doi.org/10.5281/zenodo.16921588 (Okorn, 2025).
The data are archived and publicly available at the NASA Langley Research Center (LaRC) Distributed Active Archive Center (DAAC) at https://www-air.larc.nasa.gov/cgi-bin/ArcView/acclip.2022 (Podolske, 2025). The creator is James Podolske. The ACCLIP dataset is also available at https://doi.org/10.5067/SUBORBITAL/ACCLIP/DATA001 (Atmospheric Science Data Center (ASDC), 2022), Level-2 collections. ACCLIP_TraceGas_AircraftInSitu_WB57_Data_1 provides access to the COMA dataset.
JRP and LTI supervised the project. JE, RRJ, and JRP led the design and integration into the WB-57 aircraft. JBL, IA, JRP, and RRJ contributed towards the environmental chamber testing and system design. LMG, JRP, RRJ, RK, LTI, KEO, CD, and ELY were involved in the laboratory and field investigation. KEO, JRP, and LMG curated the COMA data. KEO and LMG wrote the software used. LMG and ELY wrote the original draft, which was revised with feedback from all of the authors.
The contact author has declared that none of the authors has any competing interests.
Publisher's note: Copernicus Publications remains neutral with regard to jurisdictional claims made in the text, published maps, institutional affiliations, or any other geographical representation in this paper. While Copernicus Publications makes every effort to include appropriate place names, the final responsibility lies with the authors.
The COMA team was supported by the NASA Earth Science Research and Analysis Program (Ken Jucks and Jack Kaye), the NASA Postdoctoral Program, and NASA Ames Internal Research and Development funding. Technical contributions from Bob Provencal at ABB, Chris Wilson at NASA Ames, and staff at the Ames EEL are greatly appreciated. We gratefully recognize the efforts of all involved in the ACCLIP mission, from inception to project management to aircraft support and beyond. This work benefited from the COLD2 data provided by Francesco D'Amato, Silvia Viciani, and Giovanni Bianchini at CNR-INO. The COLD2 team was supported by ESA within the framework of the SVANTE-QA4EO project. The ACOS data provided by Colin Gurganus at the NOAA Chemical Sciences Laboratory (CSL) were supported by NOAA CSL and the University of Colorado through the Cooperative Institute for Earth System Research and Data Science (CIESRDS).
This research has been supported by the NASA headquarters (Earth Science Research and Analysis Program).
This paper was edited by Haichao Wang and reviewed by three anonymous referees.
Allan, D. W.: Should the Classical Variance be Used as a Basic Measure in Standards Metrology?, IEEE T. Instrum. Meas., IM-36, 646–654, https://doi.org/10.1109/TIM.1987.6312761, 1987.
Atmospheric Science Data Center (ASDC): ACCLIP data archive, Asian Summer Monsoon Chemical and CLimate Impact Project, EarthData [data set], https://doi.org/10.5067/SUBORBITAL/ACCLIP/DATA001, 2022.
Diskin, G. S., Podolske, J. R., Sachse, G. W., and Slate, T. A.: Open-path airborne tunable diode laser hygrometer, International Symposium on Optical Science and Technology, Seattle, WA, USA,Proc. SPIE, 4817, 196–204, https://doi.org/10.1117/12.453736, 2002.
Filges, A., Gerbig, C., Chen, H., Franke, H., Klaus, C., and Jordan, A.: The IAGOS-core greenhouse gas package: a measurement system for continuous airborne observations of CO2, CH4, H2O and CO, Tellus B, 67, 27989–28008, https://doi.org/10.3402/tellusb.v67.27989, 2015.
Gonzalez, Y., Commane, R., Manninen, E., Daube, B. C., Schiferl, L. D., McManus, J. B., McKain, K., Hintsa, E. J., Elkins, J. W., Montzka, S. A., Sweeney, C., Moore, F., Jimenez, J. L., Campuzano Jost, P., Ryerson, T. B., Bourgeois, I., Peischl, J., Thompson, C. R., Ray, E., Wennberg, P. O., Crounse, J., Kim, M., Allen, H. M., Newman, P. A., Stephens, B. B., Apel, E. C., Hornbrook, R. S., Nault, B. A., Morgan, E., and Wofsy, S. C.: Impact of stratospheric air and surface emissions on tropospheric nitrous oxide during ATom, Atmos. Chem. Phys., 21, 11113–11132, https://doi.org/10.5194/acp-21-11113-2021, 2021.
Gurganus, C., Rollins, A. W., Waxman, E., Pan, L. L., Smith, W. P., Ueyama, R., Feng, W., Chipperfield, M. P., Atlas, E. L., Schwarz, J. P., Lee, S., and Thornberry, T. D.: Highlighting the impact of anthropogenic OCS emissions on the stratospheric budget with in-situ observations, ESS Open Archive, https://doi.org/10.22541/essoar.172801406.62154439/v1, 2024.
Gvakharia, A., Kort, E. A., Smith, M. L., and Conley, S.: Testing and evaluation of a new airborne system for continuous N2O, CO2, CO, and H2O measurements: the Frequent Calibration High-performance Airborne Observation System (FCHAOS), Atmos. Meas. Tech., 11, 6059–6074, https://doi.org/10.5194/amt-11-6059-2018, 2018.
Hall, B. D., Dutton, G. S., and Elkins, J. W.: The NOAA nitrous oxide standard scale for atmospheric observations, J. Geophys. Res., 112, D09305, https://doi.org/10.1029/2006JD007954, 2007.
Hintsa, E., Boering, K. A.,Weinstock, E. M., Anderson, J. G., Gary, B. L., Pfister, L., Daube, B. C., Wofsy, S. C., Loewenstein, M., Podolske, J. R., Margitan, J. J., and Bu, T. T.: Troposphere-to stratosphere transport in the lowermost stratosphere from measurements of H2O, CO, N2O and O3, Geosphys. Res. Lett., 25, 14, 2655–2658, https://doi.org/10.1029/98GL01797, 1998.
Honomichl, S. B. and Pan, L. L.: Transport from the Asian Summer Monsoon Anticyclone Over the Western Pacific, J. Geophys. Res., 125, e2019JD032094, https://doi.org/10.1029/2019JD032094, 2020.
Kostinek, J., Roiger, A., Davis, K. J., Sweeney, C., DiGangi, J. P., Choi, Y., Baier, B., Hase, F., Groß, J., Eckl, M., Klausner, T., and Butz, A.: Adaptation and performance assessment of a quantum and interband cascade laser spectrometer for simultaneous airborne in situ observation of CH4, C2H6, CO2, CO and N2O, Atmos. Meas. Tech., 12, 1767–1783, https://doi.org/10.5194/amt-12-1767-2019, 2019.
Kloss, C., Tan, V., Leen, J. B., Madsen, G. L., Gardner, A., Du, X., Kulessa, T., Schillings, J., Schneider, H., Schrade, S., Qiu, C., and von Hobe, M.: Airborne Mid-Infrared Cavity enhanced Absorption spectrometer (AMICA), Atmos. Meas. Tech., 14, 5271–5297, https://doi.org/10.5194/amt-14-5271-2021, 2021.
Novelli, P. C., Elkins, E. W., and Steele, L. P.: The development and evaluation of a gravimetric reference scale for measurements of atmospheric carbon monoxide, J. Geophys, Res., 96, 13109–13121, https://doi.org/10.1029/91JD01108, 1991.
Okorn, K.: KristenOkorn/COMA: COMA 2025 release (v1.0.0), Zenodo [code], https://doi.org/10.5281/zenodo.16921588, 2025.
Pan, L. L., Honomichl, S. B., Kinnison, D. E., Abalos, M., Randel, W. J., Bergman, J. W., and Bian, J.: Transport of chemical tracers from the boundary layer to stratosphere associated with the dynamics of the Asian summer monsoon, J. Geophys. Res.-Atmos., 121, 159–174, https://doi.org/10.1002/2016JD025616, 2016.
Pan, L. L., Kinnison, D., Liang, Q., Chin, M., Santee, M. L., Flemming, J., Smith, W. P., Honomichl, S. B., Bresch, J. F., Lait, L. R., Zhu, Y., Tilmes, S., Colarco, P. R., Warner, J., Vuvan, A., Clerbaux, C., Atlas, E. L., Newman, P. A., Thornberry, T., Randel, W. J., and Toon, O. B.: A Multimodel Investigation of Asian Summer Monsoon UTLS Transport Over the Western Pacific, J. Geophys. Res.-Atmos., 127, e2022JD037511, https://doi.org/10.1029/2022JD037511, 2022.
Pan, L. L., Atlas, E. L., Newman, P. A., Thornberry, T., Jucks, K. W., Toon, L. B., Randel, W. J., Liang, Q., Kinnison, D. E., Honomichl, S. B., Hornbrook, R. S., Smith, W. P., Ueyama, R., Bresch, J. F., Ziemba, L., Fujiwara, M., Apel, E. C., Barucci, M., Bianchini, G., Brown, M., Bui, T. P., Campos, T., Chin, M., D'Amato, F., Dean-Day, J., Diskin, G., Franchin, A., Gurganus, C., Iraci, L. T., Koo, J.-H., Kim, J., Lait, L. R., Lesko, K., Podolsky, J. R., Rollins, A., Sakai, T., Shiraishi, K., Treadway, V., Viciani, S., and Waxman, E.: The Asian Summer Monsoon Chemical and Climate Impact Project (ACCLIP): An Overview, ESS Open Archive, https://doi.org/10.22541/essoar.175337658.88281458/v1, 2025.
Park, M., Randel, W. J., Emmons, L. K., and Livesey, N. J.: Transport pathways of carbon monoxide in the Asian summer monsoon diagnosed from Model of Ozone and Related Tracers (MOZART), J. Geophys. Res., 114, D08303, https://doi.org/10.1029/2008JD010621, 2009.
Pitt, J. R., Le Breton, M., Allen, G., Percival, C. J., Gallagher, M. W., Bauguitte, S. J.-B., O'Shea, S. J., Muller, J. B. A., Zahniser, M. S., Pyle, J., and Palmer, P. I.: The development and evaluation of airborne in situ N2O and CH4 sampling using a quantum cascade laser absorption spectrometer (QCLAS), Atmos. Meas. Tech., 9, 63–77, https://doi.org/10.5194/amt-9-63-2016, 2016.
Podolske, J.: Current list for the WB57_AIRCRAFT Data, NASA Langley Research Center (LaRC) Distributed Active Archive Center (DAAC) [data set], https://www-air.larc.nasa.gov/cgi-bin/ArcView/acclip.2022, last access: 8 August 2025.
Ravishankara, A. R., Daniel, J. S., and Portmann R. W.: Nitrous Oxide (N2O): The Dominant Ozone-Depleting Substance Emitted in the 21st Century, Science, 326, 5929, 123–125, https://doi.org/10.1126/science.1176985, 2009.
Redemann, J., Wood, R., Zuidema, P., Doherty, S. J., Luna, B., LeBlanc, S. E., Diamond, M. S., Shinozuka, Y., Chang, I. Y., Ueyama, R., Pfister, L., Ryoo, J.-M., Dobracki, A. N., da Silva, A. M., Longo, K. M., Kacenelenbogen, M. S., Flynn, C. J., Pistone, K., Knox, N. M., Piketh, S. J., Haywood, J. M., Formenti, P., Mallet, M., Stier, P., Ackerman, A. S., Bauer, S. E., Fridlind, A. M., Carmichael, G. R., Saide, P. E., Ferrada, G. A., Howell, S. G., Freitag, S., Cairns, B., Holben, B. N., Knobelspiesse, K. D., Tanelli, S., L'Ecuyer, T. S., Dzambo, A. M., Sy, O. O., McFarquhar, G. M., Poellot, M. R., Gupta, S., O'Brien, J. R., Nenes, A., Kacarab, M., Wong, J. P. S., Small-Griswold, J. D., Thornhill, K. L., Noone, D., Podolske, J. R., Schmidt, K. S., Pilewskie, P., Chen, H., Cochrane, S. P., Sedlacek, A. J., Lang, T. J., Stith, E., Segal-Rozenhaimer, M., Ferrare, R. A., Burton, S. P., Hostetler, C. A., Diner, D. J., Seidel, F. C., Platnick, S. E., Myers, J. S., Meyer, K. G., Spangenberg, D. A., Maring, H., and Gao, L.: An overview of the ORACLES (ObseRvations of Aerosols above CLouds and their intEractionS) project: aerosol–cloud–radiation interactions in the southeast Atlantic basin, Atmos. Chem. Phys., 21, 1507–1563, https://doi.org/10.5194/acp-21-1507-2021, 2021.
St. Clair, J. M., Swanson, A. K., Bailey, S. A., and Hanisco, T. F.: CAFE: a new, improved nonresonant laser-induced fluorescence instrument for airborne in situ measurement of formaldehyde, Atmos. Meas. Tech., 12, 4581–4590, https://doi.org/10.5194/amt-12-4581-2019, 2019.
Tian, H., Xu, R., Canadell, J. G., et al.: A comprehensive quantification of global nitrous oxide sources and sinks, Nature, 586, 248–256, https://doi.org/10.1038/s41586-020-2780-0, 2020.
Viciani, S., Montori, A., Chiarugi, A., and D'Amato, F.: A Portable Quantum Cascade Laser Spectrometer for Atmospheric Measurements of Carbon Monoxide, Sensors, 18, 2380–2398, https://doi.org/10.3390/s18072380, 2018.
Zellweger, C., Steinbrecher, R., Laurent, O., Lee, H., Kim, S., Emmenegger, L., Steinbacher, M., and Buchmann, B.: Recent advances in measurement techniques for atmospheric carbon monoxide and nitrous oxide observations, Atmos. Meas. Tech., 12, 5863–5878, https://doi.org/10.5194/amt-12-5863-2019, 2019.