the Creative Commons Attribution 4.0 License.
the Creative Commons Attribution 4.0 License.
 | 27 Aug 2025
Synergy of active and passive airborne observations for heating rate calculation during the AEROCLO-sA field campaign in Namibia
Mégane Ventura
Fabien Waquet
Isabelle Chiapello
Gérard Brogniez
Frédéric Parol
Frédérique Auriol
Rodrigue Loisil
Cyril Delegove
Luc Blarel
Oleg Dubovik
Marc Mallet
Cyrille Flamant
Paola Formenti
Aerosols have important effects on both local and global climate, as well as on clouds and precipitations. We present original results derived from the airborne observations acquired from the AErosol RadiatiOn and CLOud in Southern Africa (AEROCLO-sA) field campaign led in Namibia in August and September 2017. In order to quantify the aerosols' radiative impact on the Namibian regional radiative budget, we use an innovative approach that combines the OSIRIS polarimeter, an airborne prototype of the future 3MI polarimeter of ESA, and lidar data to derive the heating rate of the aerosols. To calculate this parameter we use a radiative transfer code, meteorological parameters provided by dropsondes, and OSIRIS-retrieved aerosol optical thickness, size, and absorption above clouds. This approach is evaluated during massive transports of biomass-burning particles above clouds. We present vertical profiles of heating rates computed in the solar and thermal parts of the spectrum. Our results indicate strong positive heating rate values retrieved above clouds due to aerosols, between +2 and +5 K per day (vertically averaged). Within the smoke layer, water vapor's cooling effect through infrared radiation generally balances its warming effect from solar radiation. At the top of the layer, a stronger cooling effect of −1.5 K d−1 often dominates due to water vapor. In order to validate this methodology, we use irradiance measurements acquired by aircraft during spiral descent during dedicated parts of their flights, which provides direct measurements of irradiance distribution and heating rates as functions of the altitude. Despite the challenges posed by cloud horizontal variability observed during the spiral descent, simulated and measured results generally agree in most cases. Finally, we discuss the possibility of applying this method to available and future spaceborne passive and active sensors.
- Article
(3184 KB) - Full-text XML
- BibTeX
- EndNote


Aerosol particles, from both natural or anthropogenic sources, are complex components of the atmosphere with highly variable chemical, optical, and microphysical properties. Aerosols directly impact the climate by interacting with solar and terrestrial radiation. Depending on their properties and spatial distribution (e.g., above clouds or a dark surface), they can contribute to warming or cooling the planet by directly modifying its radiative balance (Solomon et al., 2007; Trenberth et al., 2009; Peers et al., 2016). These particles may also act as cloud condensation nuclei (or ice nuclei) and modify the cloud properties and lifetime, thereby indirectly influencing the radiative balance. Their effects on clouds and climate are still associated with large uncertainties, especially in the case of aerosols situated within or above the clouds (Bellouin et al., 2020, IPCC, 2022).
The aerosol radiative forcing estimates provided by climate models over the Southeast Atlantic Ocean show large discrepancies (Zuidema et al., 2016a). This area is characterized by a persistent marine stratocumulus deck extending along the African coast from Namibia to Gabon. During the fire season (from June to October), fires related to agricultural practices in Central Africa generate massive smoke plumes over Tropical Africa (Redemann et al., 2021). These smoke plumes, carried across the Atlantic Ocean, travel above the stratocumulus clouds and may interact with them either at the cloud top (Bréon and Costantino, 2013) or below, entering the marine boundary layer. As they represent a unique opportunity to study the complex interactions between biomass-burning aerosols, clouds, and radiation, these situations have been the topic of a number of studies (Pilewskie et al., 2003; Keil and Haywood, 2003; Magi et al., 2008; Stier et al., 2013; Peers et al., 2016; Zuidema et al., 2016a, b; Haywood et al., 2021). Biomass-burning aerosols include black carbon, a compound that strongly absorbs radiation across a wide spectral range. Biomass-burning particles also contain organic carbon, which may include brown carbon, a substance that makes organic carbon absorbing to radiation, particularly in the ultraviolet (Lack et al., 2012; Siméon et al., 2021). Biomass-burning aerosols plumes transported above clouds are linked to a pronounced positive direct radiative forcing (warming) that is still underestimated in climate models (de Graaf et al., 2020). Recently, the latest generation of global climate models used in the CMIP6 modeling exercise have been shown to suffer in the representation of solar heating due to absorbing biomass-burning aerosols (BBAs) over the Southeast Atlantic (SEA) Ocean, due to underestimated aerosol absorption (Mallet et al., 2021). The absorption of solar energy by these aerosols alters the thermodynamic properties of the atmosphere, impacting the vertical development of low-level clouds and the subsidence of dry air from the free troposphere within the marine boundary layer (Johnson et al., 2004), and influencing cloud-top height, water content, and brightness (Lu et al., 2018). This semi-direct aerosol effect has previously been observed off the coast of Angola (Wilcox, 2010; Deaconu et al., 2019). In addition, the semi-direct effect of BBAs on the low-level clouds has also been reproduced with global or regional climate models, showing a general increase of low-level cloud fraction due to BBAs (Sakaeda et al., 2011; Mallet et al., 2020).
This study focuses on quantifying the radiative impact of BBAs and aims to estimate the profiles of atmospheric heating (or cooling) rates attributable to these particles. We use airborne measurements acquired during the AErosol Radiation and CLOud in southern Africa (AEROCLO-sA) campaign (Formenti et al., 2019) conducted over Namibia between 5 and 12 September 2017 with the French Falcon 20 environmental research aircraft of Safire. During AEROCLO-sA, massive plumes of BBAs were observed traveling over the Namibian deserts and above the coastal stratocumulus clouds (Chauvigné et al., 2021). In parallel, other international campaigns have also been conducted in this Southeast Atlantic area, such as ORACLES (ObseRvations of Clouds above Aerosols and their inteEractionS) by NASA (Redemann et al., 2021) and the CLARIFY (Cloud–Aerosol–Radiation Interactions and Forcing: Year 2016) project (Haywood et al., 2021). The aerosol heating rate is a radiative quantity (measured in kelvin per unit time) that represents the ability of aerosol particles to heat or cool the atmospheric layer in which the aerosols are located. Quantifying these heating rates is crucial to understanding the impact of smoke aerosols on the low-level cloud properties and the atmospheric dynamic over the tropical African region. Recent studies have emphasized the importance of accurate heating-rate knowledge for proper modeling of the transport and dynamics of BBA layers (Chaboureau et al., 2022). These BBAs may also warm the lower troposphere sufficiently over the SEA to potentially impact the West African monsoon dynamic and precipitation (Solmon et al., 2021).
However, accurately estimating aerosol heating rates remains a challenge due to their dependence on the aerosol concentration, but also their vertical and spatial distribution as well as their composition and size. In terms of optical parameters, the aerosol optical thickness (AOT) and the aerosol single scattering albedo (SSA) as well as their spectral dependence must ideally be known. The AOT depends on the particle's concentration, whereas the SSA quantitatively describes the ability of aerosols to absorb or scatter solar radiation. Given the same properties of aerosols (AOT, SSA, and particle size), the extent of the heating rates is primarily determined by the brightness of the underlying clouds, which is a function of cloud optical depth. For accurate heating-rate estimates, the vertical profiles of the thermodynamical quantities (humidity and temperature) also need to be known.
Among the different results obtained in the recent international projects, one important common finding is that absorption by BBA appears to be very high over SEA, with maximum absorption in August and minimum absorption in October (Wu et al., 2020; Pistone et al., 2019; Chauvigné et al., 2021; Jethva et al., 2024), with a column-integrated SSA as low as ∼0.85 (at 550 nm) or ∼0.80 (at 865 nm) in August. Even lower SSAs were measured (in situ) within aged smoke layers (Zuidema et al., 2018; Denjean et al., 2020). These are clear indications that these smoke plumes have the ability to strongly absorb solar radiation and consequently heat the lower troposphere in this region.
Current innovative aerosol satellite observations are able to provide estimates of aerosol direct radiative forcing at the top of the atmosphere, even for aerosol layers located above clouds (Meyer et al., 2013; Peers et al., 2015; Zhang et al., 2016). However, such estimates do not capture the full impact of aerosols within the atmosphere or at the surface. Currently, the heating/cooling rate is not provided globally and operationally by satellites, although it is essential for understanding aerosols' influence on atmospheric thermodynamic profiles and their semi-direct effects on clouds. Ongoing satellite products for above-cloud aerosol detection, like those from the Moderate Resolution Imaging Spectroradiometer (MODIS) and the Ozone Monitoring Instrument (OMI) on the A-Train constellation (Jethva et al., 2018) or the Spinning Enhanced Visible and Infrared Imager (SEVIRI) on board the Meteosat Second Generation (MSG) satellites (Peers et al., 2019), primarily focus on AOT retrieved in the ultraviolet–visible–near-infrared (UV–VIS–NIR) range. Flying aboard PARASOL within the A-Train constellation (2005–2013), the Polarization and Directionality of the Earth's Reflectances (POLDER) instrument made multi-angular, multi-polarization, and spectral measurements, enabling the retrieval of more detailed information about the properties of aerosols above clouds, including aerosol absorption (Waquet et al., 2009, 2013a, 2020; Peers et al., 2015). Spaceborne lidars, like the Cloud-Aerosol Lidar with Orthogonal Polarization (CALIOP) on the A-Train, provides vertical profiles of aerosols. These instruments are particularly valuable for detecting aerosols above clouds, even though they offer limited information on the aerosols' detailed properties (Deaconu et al., 2017). If properly constrained, CALIOP vertical extinction profiles can provide altitude-dependent heating rates (Deaconu et al., 2019). Further work is therefore needed to document the semi-direct aerosol effect from satellite observations and this will necessarily include instrument synergy.
Airborne measurements are particularly useful for accessing atmospheric heating/cooling rates. As they can be made at different levels in the atmosphere, they make it possible to obtain vertical profiles of atmospheric and aerosol properties.
In the context of the ORACLES project (Redemann et al., 2021), aerosol heating rates above clouds were calculated from airborne measurements (Cochrane et al., 2022). In Cochrane et al. (2022), the authors rely on in situ irradiance measurements made in smoke plumes at different altitudes to accurately characterize the extinction and absorption properties of aerosols, as well as thermodynamic profiles. These data, coupled with a radiative transfer code, allowed the calculation of heating rates in the shortwave visible range. This latter study notably employed a synergistic approach, combining irradiance data from the Solar Spectral Flux Radiometer (SSFR), with airborne sun-photometer measurements of AOT from the Spectrometers for Sky-Scanning Sun-Tracking Atmospheric Research (4STAR) instrument and HSRL-2 lidar extinction profiles. The irradiances of SSFR were used to measure the below-aerosol-layer scene albedo. Measurements were performed over the South East Atlantic Ocean along the Namibia coast in September 2016 and further north in August 2017, since ORACLES was based on São Tomé Island in 2017. Cochrane et al. (2022) found strong heating rate values in the shortwave spectrum varying between 2 and 8 K d−1 depending on location and period.
Heating rates can also be estimated from calculation of the divergence of measured irradiances, as has been done in the Mediterranean Sea (Mallet et al., 2016). However, the use of airborne irradiance measurements for the calculation of heating rates poses significant difficulties. These are related to different factors, such as accounting for the aircraft's attitude variations (pitch, roll, heading) and their effects in the analysis of the measured fluxes.
During AEROCLO-sA, several instruments were employed on board the aircraft, particularly the Observing System Including PolaRisation in the Solar Infrared Spectrum (OSIRIS) polarimeter (Chauvigné et al., 2021), a prototype of the upcoming European Space Agency's 3MI spaceborne instrument (Fougnie et al., 2018), and the LNG lidar. In the present study, evaluation of the aerosol heating rate profiles is achieved by assimilating airborne polarimeter OSIRIS and lidar LNG data into a radiative transfer code. This synergy of active and passive measurements is used to provide profiles of aerosol heating rates computed above low-level clouds in the solar and thermal infrared spectral domain. The calculation of atmospheric heating rates (including aerosol, water vapor, and other gases) is also discussed. An innovative aspect of our approach lies in utilizing the measurements obtained during spiral descents performed with the F-20 aircraft, particularly irradiance measurements acquired from pyranometers and pyrgeometers, in order to validate the calculated heating/cooling atmospheric rates and the overall methodology.
The paper is organized as follows. Section 2 describes the main flight patterns and the instruments used in our study. Section 3 explains the method and how irradiance measurements are used to calculate atmospheric heating rates, and details the validation processes of our methodology. Section 4 presents the findings from using both active and passive data to quantify aerosol heating rates above clouds throughout the campaign. Section 5 summarizes the key results and main perspectives.
2.1 Flight patterns and general campaign description
The AEROCLO-sA airborne campaign consisted of 10 flights departing from Walvis Bay Airport in Namibia between 5 and 12 September 2017. During the campaign, the air mass intercepted (or measured) by the on-board instruments were mainly transported from the in-land biomass-burning source areas, emitting substantial amounts of carbonaceous aerosols transported over the southeastern Atlantic Ocean, as far as Ascension Island. The air mass then drifted to the southeast towards the Namibian coast due to the anticyclonic circulation located over South Africa (Chauvigné et al., 2021). These meteorological conditions were those encountered throughout the campaign except for 5 September (see Fig. 2 in Chauvigné et al., 2021); the anticyclone was then positioned further east, between the coasts of South Africa and Madagascar, which led to a greater transport of BBAs over the continent (i.e., transport over land from the source areas).
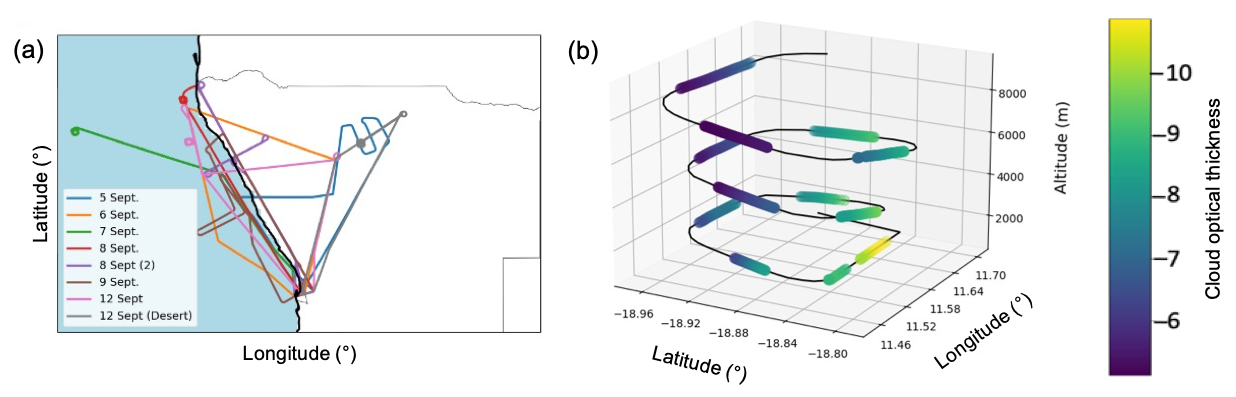
Figure 1(a) Map of flight plans during the AEROCLO-sA campaign in Namibia between 5 and 12 September 2017. (b) Example of an aircraft trajectory for a profile. This profile was performed on 12 September. The cloud optical thickness retrieved at 550 nm is also reported (color scale). The method used to retrieve the COT is described in Sect. 3.3.2.
Figure 1 shows the trajectories of the flights, which were mainly carried out along the Namibian coast and over the Namibian deserts. The flight segments used in this study were solely performed over the ocean under cloudy conditions. The circles represent spiral descents performed during some of the flights. These descents make it possible to obtain vertical profiles of the atmospheric properties over a restricted geographical area. The radius of these spirals is of the order of 10 km (see Fig. 1b). They were carried out between 1 and 8 km altitude and lasted an average of 20 to 30 min. To minimize the influence of aircraft attitude on the data, pilots actively controlled pitch and roll during specific descent segments. This reduces aircraft tilt, transforming the originally spiral trajectory into a more controlled, hippodrome-like path (Fig. 1b). In addition, round-trip flight segments were also performed during one specific flight in the solar plane and perpendicular to the solar plane in order to accurately determine the instrument's position within the aircraft for further data correction.
Table 1Summary of the main characteristics of the flight segments with aerosol above cloud scenes, as observed during the AEROCLO-sA campaign, focusing on average properties (or min and max values) of aerosols and clouds retrieved by the OSIRIS instrument (Chauvigné et al., 2021). “Spiral descent” indicates that an aircraft sounding (i.e., rapid descent of the aircraft) was performed during the flight. COT refers to cloud optical thickness at 550 nm, ImRI stands for the imaginary part of the complex refractive index at 865 nm, AOT refers to aerosol optical thickness at 865 nm (AOT values of > 0.4 at 865 nm translate to AOT of > 1 at 500 nm), and MODE indicates the mean radius of the particle size distribution assuming a lognormal particle size distribution (by number) as retrieved from the polarimetric measurements provided by OSIRIS (Chauvigné et al., 2021).
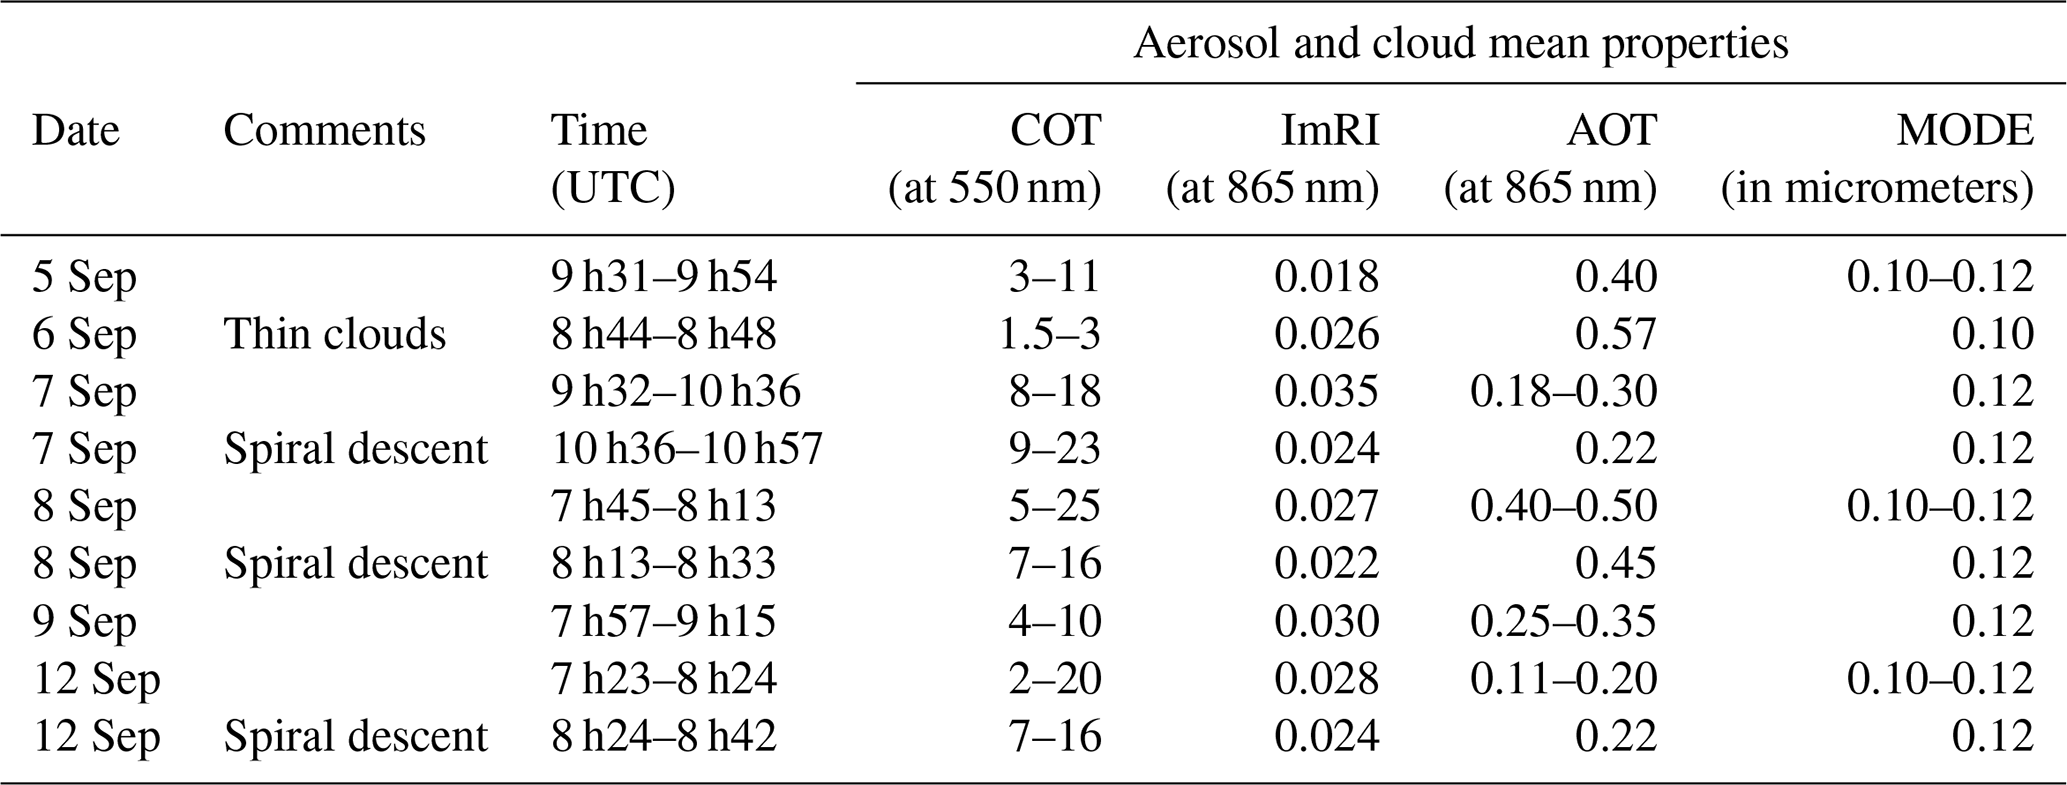
Table 1 presents the characteristics of the flight segments used in our study. The aerosol and cloud parameters in Table 1 were obtained from the OSIRIS data (Chauvigné et al., 2021). Some information on the flights is also reported. Aerosol optical thickness exhibits significant variability, with the most aerosol-laden events occurring primarily during the first phase of the campaign. Flights conducted on 5, 6, and 8 September show particularly AOT values at 865 nm, with values above 0.4. Associated aerosol properties retrieved by OSIRIS show minimal variation in aerosol size and imaginary refractive index (ImRI ≈ 0.025 ± 0.005 and granulometric radius around 0.10±0.02 µm).
2.2 Instrumentation on board the Falcon 20
During AEROCLO-sA the Falcon 20 aircraft carried a suite of instruments, including a lidar, a polarimeter, a sun-photometer, particle probes, cloud microphysics probes, and sensors for irradiance measurements. OSIRIS, an acronym for Observing System Including PolaRisation in the Solar Infrared Spectrum, is an airborne imaging polarimeter designed to measure the spectral, directional, and polarized radiances (Chauvigné et al., 2021); it serves as the airborne prototype for the future European Space Agency (ESA) spaceborne Multi-viewing Multi-channel Multi-polarisation Imager (3MI) instrument. The Stokes parameters are measured in 13 spectral channels (0.44–2.2 µm) and are used here to retrieve aerosol parameters (integrated over the column) above clouds. This instrument provides 20 m-resolution images for visible and near-infrared light (440–940 nm) and 60 m-resolution images for shortwave infrared light (940–2200 nm) at a 10 km altitude.
The Leandre Nouvelle Génération (LNG) lidar provides the aerosol backscatter coefficient at different wavelengths in the ultraviolet (355 nm), visible (532 nm), and near-infrared (1064 nm) that is used to depict the aerosol vertical distribution (Flamant et al., 2022). In our study, we use lidar LNG to depict the vertical profiles of aerosol extinction below the aircraft. A method of the type described in Klett (1981) was used to solve the lidar equation. BBAs over the South East Atlantic Ocean often show particularly strong extinction at ultraviolet and the shortest visible wavelengths. This leads to high optical thicknesses in these plumes, significantly weakening the lidar signal measured at 532 nm (or 355 nm). Consequently, lidar data acquired for optically thick plumes at these wavelengths become less reliable for accurately determining the base altitude of the aerosol layer (Jethva et al., 2014; Deaconu et al., 2019). On the other hand, the 1064 nm signal penetrates deeper into the aerosol layer due to significantly reduced attenuation, providing a better view of the depth of the aerosol layer. For this reason, we used LNG lidar data acquired at 1064 nm to accurately depict the aerosol extinction profile.
PLASMA (Photomètre Léger Aéroporté pour la Surveillance des Masses d'Air) is an instrument designed to measure the aerosol optical thickness of extinction for the atmospheric column above the aircraft (Karol et al., 2013). It operates in 10 spectral bands (340–1640 nm). One extra channel centered on 910 nm is also used to measure the amount of water vapor.
Two CGR-4 pyrgeometers and two CMP-22 pyranometers manufactured by Kipp & Zonen (K&Z) were installed on the top and bottom of the Falcon 20 fuselage during the AEROCLO-sA campaign. The CMP-22 pyranometer integrates irradiance over a wide spectral band covering the 297–3100 nm region. The CGR4 pyrgeometer measurement is also integrated over a wide spectral band covering the 4.5–40 µm region. These data are used to directly measure the heating/cooling rate profiles within the BBA layers.
In addition to these remote-sensing instruments, the aircraft was equipped with probes to measure thermodynamic quantities (temperature, pressure, wind, and humidity). Dropsondes were also released. The particle size distribution of aerosols was also measured in situ during the flight with an Ultra High Sensitivity Aerosol Spectrometer (UHSAS) instrument (Formenti et al., 2019).
2.3 Case studies
Two flights were chosen (on 8 and 12 September) to assess our methodology. These flights exhibited large and moderate aerosol loading, respectively (see Table 1 for AOT), with both flights incorporating a high-altitude transect and a spiral descent over a low-level cloud. Figure 7a and b show the attenuated backscattered coefficient retrieved by lidar LNG at 1064 nm for the selected flights. During the flight on 8 September, a thick layer of biomass-burning plume was observed above the stratocumulus clouds. The stratocumulus cloud top altitude was detected at approximately 600 m above sea level, whereas white areas in Fig. 7a at 6 km altitude indicate high-level clouds. High relative humidity values were frequently measured near the smoke plume's uppermost layer, causing the hygroscopic growth of aerosols and sometimes cloud formation. Note that OSIRIS retrievals were screened for high-level clouds and that this instrument allowed aerosol characterization beyond the lidar's limited field of view (Chauvigné et al., 2021). In Fig. 7a and b, note that the attenuated backscattering coefficient is shown only when lidar-derived aerosol extinction profile is also available. Compared to the flight on 12 September, the increased number of missing lidar retrievals (in white in Fig. 7a) observed on the 8 September flight is attributed to clouds forming at the top of the biomass-burning layer. On the 12 September flight, the aerosol layers were less distinct, with particles distributed between the cloud top, which reached around 1000 m, and an altitude of 6 km (Fig. 7b). In both cases, the sounding associated with the aircraft's spiral descent was made just after the measurement portion of flight presented in Fig. 7a and b.
3.1 Synergy of active, passive, and thermodynamical measurements
The core of the method lies in leveraging the capabilities of both OSIRIS (passive) and the LNG lidar (active) instruments. This approach additionally incorporates other relevant measurements and retrieved quantities, acquired during the airborne campaign, as inputs for a radiative transfer code. The calculations of heating/cooling rates are performed in real time for each extinction profile provided by the lidar and when OSIRIS data are available.
Our approach assumes that the inherent aerosol properties (imaginary refractive index and size retrieved by OSIRIS) exhibit minimal variation with altitude above the cloud layer. Consequently, only the above-cloud aerosol concentration is expected to vary with altitude, as reflected by the variation in the aerosol extinction profile. In our method, the lidar extinction profile is adjusted based on OSIRIS retrievals as follows:
with τ representing the aerosol optical thickness of the aerosol layer above clouds.
This correction (Eq. 1) is primarily used to ensure consistency between the optical properties retrieved by the lidar and those provided by OSIRIS. We also assume that the lidar accurately measures the base and top altitudes of the smoke layer, and that smoke aerosols are primarily confined within this range, typically between the cloud top and 6 km (see Fig. 7a and b). To determine the specific humidity profile for water vapor, combined data from on-board probes and dropsondes are used. Dropsonde measurements are used to set the qualitative shape of the specific humidity profile in the low cloud and a simple assumption is considered to obtain profile continuity with the on-board probes' measurements (see Fig. 4d). The nearest available dropsonde is typically used. PLASMA measurements complement these by providing additional data for the region above the aircraft. PLASMA measurements confirmed that the integrated water vapor content above the aircraft at high altitude was very low for all flights and we therefore considered it to be zero above the aircraft.
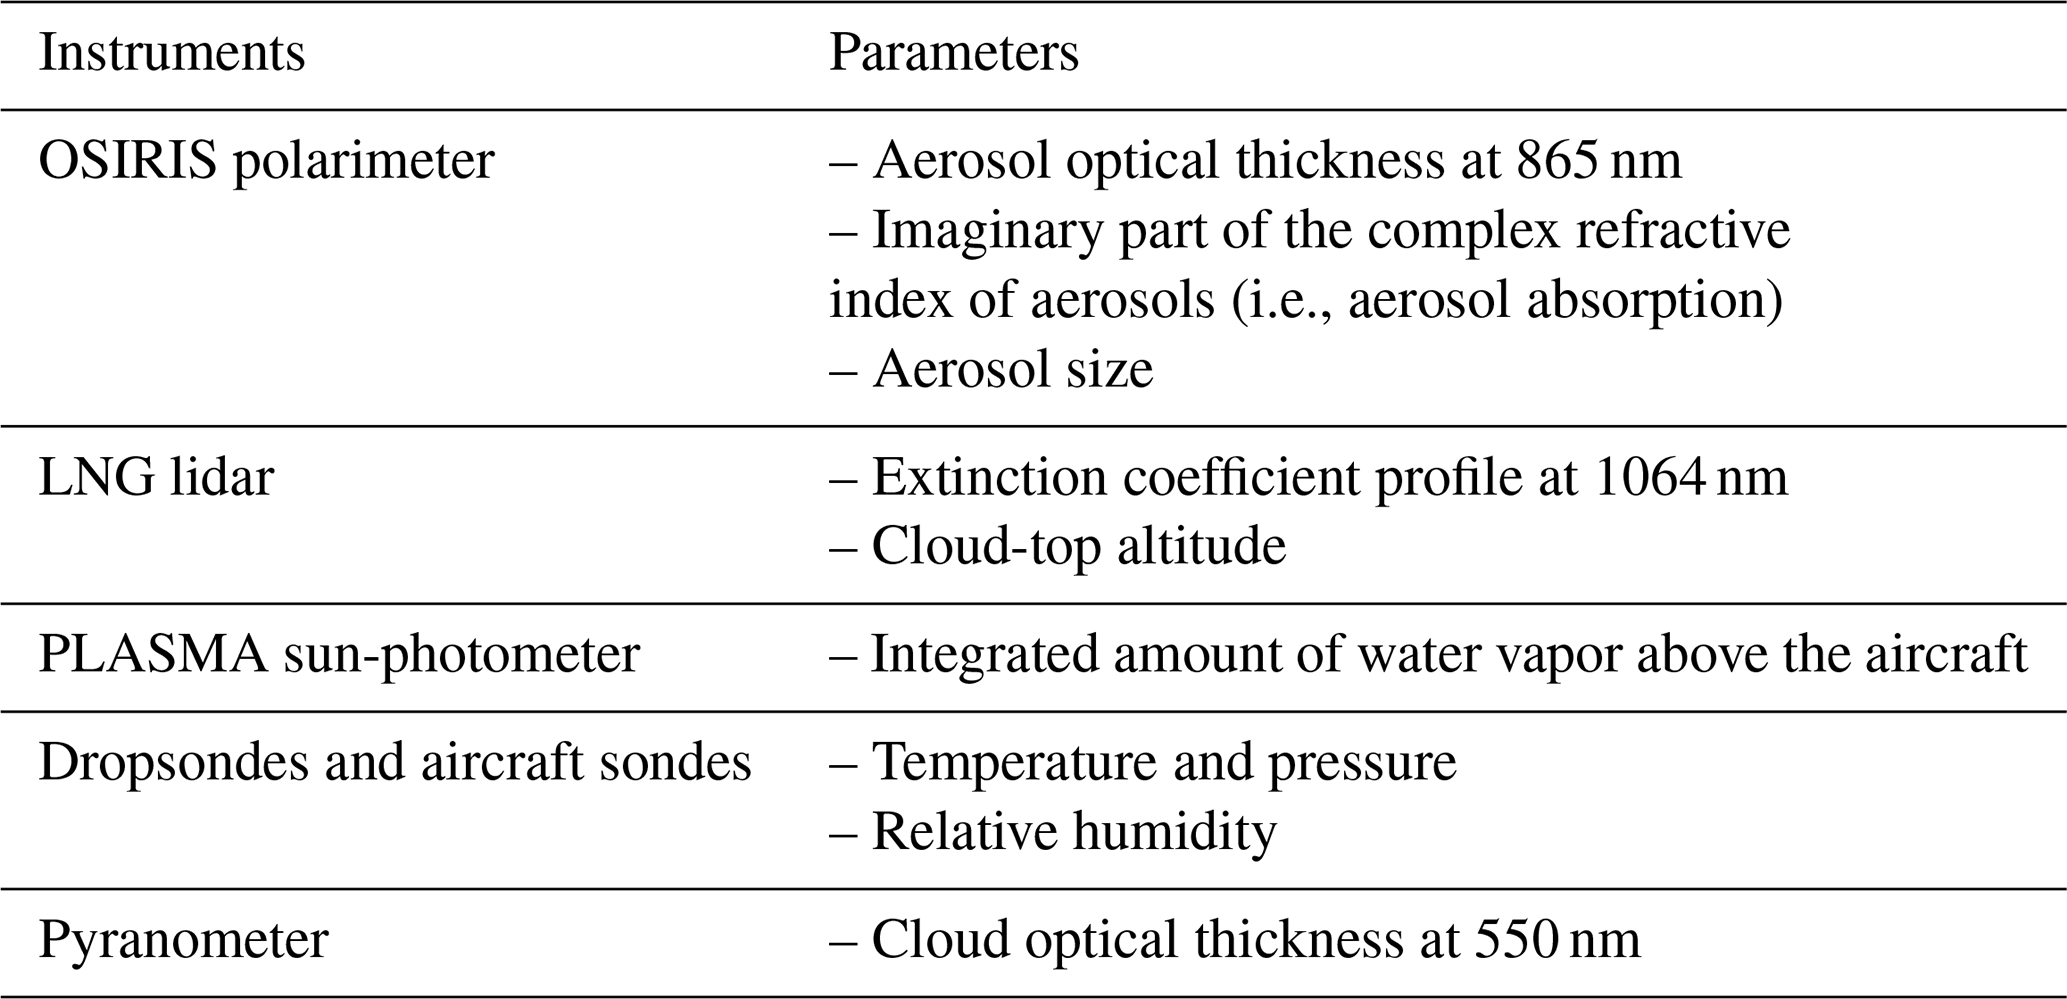
Table 2 summarizes the various instruments, along with the corresponding input parameters used in our methodology.
Table 2Instruments and associated parameters used as input for the GAME code to compute irradiances and heating rates.
3.2 Radiative transfer code
The Global Atmospheric Model (GAME) allows the calculation of irradiance profiles with high spectral resolution (Dubuisson et al., 2006). The code considers 208 spectral intervals distributed between 0.2 and 3 µm for the solar spectrum. For thermal infrared, 115 intervals are used to cover the wavelength range from 4 to 47 µm. The model accounts for the most important absorbing gases, including water vapor. The model uses around 100 vertical layers. Vertical resolution was enhanced between 0 and 8 km, with a spacing of 100 m. GAME utilizes various atmospheric models (temperature, pressure, etc.). In our study, a tropical model is employed for the calculations. The water vapor profile is determined from probe measurements. The total ozone content was adjusted using OMI space-based observations obtained for the campaign period.
GAME integrates the obtained upward and downward irradiances (in W m−2) to compute the net irradiances (calculated between downward and upward irradiances) and heating/cooling rates over the solar or thermal infrared spectrum.
The spectrally integrated heating/cooling rate (in kelvin per day, K d−1) for an infinitesimal atmospheric layer dz at altitude z is given by the general formula
where CP stands for the specific heat capacity of air (J kg−1 K−1) and ρ is the air density (kg m−3). These quantities vary with altitude and can be estimated from either atmospheric models or aircraft probe measurements.
3.3 Aerosol and cloud properties
3.3.1 OSIRIS polarimeter retrieval
The retrieval algorithm for OSIRIS builds upon the same principle used by the POLDER spaceborne polarimeter to detect aerosol properties above clouds (Waquet et al., 2009, 2013a; Peers et al., 2015). The aerosol retrieval is based on solar plane measurements and assumes spatial homogeneity over the entire OSIRIS visible image (an area of 20×10 km−2). This procedure increases the sensitivity to aerosol properties, which are retrieved at this spatial resolution using an optimal estimation method (Chauvigné et al., 2021). The method retrieves the column-integrated AOT, SSA, and the imaginary part of the complex refractive index (i.e., representing aerosol absorption) in the visible spectral range. The optimal estimation method also provides uncertainties on these parameters (see Appendix A). The aerosol optical properties (integrated over the column) retrieved by OSIRIS are used as input for the radiative transfer code GAME. The OSIRIS algorithm and GAME calculations both assume a simplified aerosol representation: the real part of the complex refractive index is constant (1.47) across the spectrum and the imaginary part is independent of wavelength. This assumption implies that our simulation neglects the contribution of brown carbon. Consequently, we assume here that soot exclusively governs the absorption properties of aerosols generated from biomass burning. A single lognormal particle size distribution is used for which the mean radius is retrieved whereas the variance is fixed (Chauvigné et al., 2021). The method directly retrieves the AOT, the mean radius, and the imaginary part of the refractive index. The SSA is computed from the retrieved particle size distribution and the complex refractive index of the particles. The spectral range of the aerosol optical properties is broadened using Mie calculations to encompass both the thermal infrared and shortwave domains utilized by the GAME code.
3.3.2 Retrieval of cloud optical thickness from pyranometer measurements
Despite OSIRIS measurements allowing for cloud property retrieval, the use of cloud optical thicknesses retrieved from the pyranometer was favored in the rest of this study. Irradiance measurements integrate contributions from a spatially extended scene, making them more suitable for defining the average cloud albedo of the overlying cloud scene. The analysis employs a look-up table (LUT) method where the LUT was calculated with the GAME code. The retrieval takes into account the presence of the aerosol layer in the simulations in order to accurately retrieve the cloud properties. The simulation table contains the following variables: zenith angle, COT, AOT, imaginary refractive index of the particles, and altitude. The aerosol size distribution is fixed from the OSIRIS retrievals performed for each flight considered (Chauvigné et al., 2021). The vertical distribution of aerosol extinction follows that given by the lidar. A two-parameter gamma distribution was employed to describe the particle-size distribution of cloud water droplets in the cloud layer situated below the aerosol layer. The effective radius and variance of the droplets were fixed at 10 µm and 0.1, respectively. The cloud droplet effective radius of 10 µm is expected for stratocumulus clouds over this area (Waquet et al., 2013a). The simulation employs a well-mixed cloud model, where cloud particle properties (e.g., concentration, size) are assumed to be uniform between sea level and cloud top. The same assumption is used for the calculation of heating/cooling rates, see later. Interpolations are performed and a least-squares method is used to estimate the COT at 550 nm that best fits the upward shortwave irradiance data.
3.4 Irradiance and heating rates from pyranometer and pyrgeometer measurements
Measured shortwave irradiances are first corrected for aircraft attitude (pitch and roll effects) and sensor non-horizontality. A correction for “air mass” is also applied to the data to compensate for the effects of the variation of the solar angle during the spiral descent. Data associated with excessively high pitch and roll angles (indicating aircraft turning) are excluded. A polynomial model is applied to the profile of net irradiance calculated from downward and upward irradiances. This approach has been used, in particular, to calculate atmospheric heating rates during the ChArMEx campaign over the Mediterranean Sea (Mallet et al., 2016). It enables noise reduction and the creation of a vertical fine sampling of net fluxes, thereby facilitating the calculation of heating rates.
Because of the complex scenes encountered in our study (aerosols above heterogenous low-level clouds) and instrumental noise, the degree of the best polynomial fit for the net irradiance profiles was not unique. Polynomials of degrees 6 to 8 have practically similar results in terms of minimizing the correlation coefficient, and consequently have the same accuracy in modeling the net irradiance profiles. However, the heating rates obtained for degrees 6 and 8 exhibit substantial variations. Therefore, we chose to provide a range of possible values for the heating rate by combining the results of the polynomials of degrees 6 to 8. As illustrated in Figs. 5 and 6, the uncertainty related to the choice of the polynomial (6, 7, or 8) leads to a variation of approximately 1 to 1.5 K in the heating rate.
During spiral descents performed above clouds, the radiative properties of the overflown cloud scenes, their albedo, vary continuously during the descent and to a greater or lesser extent depending on the cloud scene studied. Then, the divergence term dFnet(z)/dz, which is involved in the calculation of heating rates (Eq. 2), can be considered to be calculated as follows:
where ρ1 and ρ2 are the albedos of the cloudy scenes associated with the net irradiance measurements taken at altitudes z1 and z2, respectively.
Airborne irradiance measurements made above clouds during spiral descents are associated with different cloud targets. Thus, the heating rates calculated from the irradiance measurements considered in this study are related to variations in the radiative properties of the atmosphere and also to variations in the radiative properties of the underlying cloud layer. These rates cannot be considered as the “intrinsic” heating rates of the aerosol and atmospheric layers that we seek to calculate and quantify.
However, by integrating target albedo variability into the simulations, the heating rates estimated from the measurements become comparable to the simulated ones. Even if the latter do not reflect the intrinsic properties of the atmosphere, if our theoretical approach, namely the simulations, is able to reproduce the measured heating rates above cloud targets changing at each altitude level z, it will a fortiori also be able to predict these rates if the cloud target remains fixed (a simpler case). The direct comparison of measured and simulated irradiances acquired during the spiral descent will therefore be carried out in a validation perspective. Note that this reasoning applies to measurements acquired in the solar spectrum, with measurements in the thermal infrared appearing to be unaffected or negligibly affected by this effect.
4.1 Sensitivity study utilizing GAME simulations
A reference case was set for the sensitivity analysis. This reference case is based on a real case study of the field campaign. It represents a typical tropical atmosphere with a cloud top at 1 km. Optical properties used were: COT 11.69, AOT 0.43, and the imaginary part of the aerosol complex refractive index 0.03. Fine-mode aerosols are considered between 1 and 6 km above the 1 km cloud. These values reflect the atmospheric conditions observed just before the start of the aircraft descent performed on the 8 September flight.
For particles of the size range shown in Table 1, and based on our assumption of spectrally neutral shortwave aerosol absorption (i.e., the aerosol absorption refers to the imaginary part of the complex refractive index and it is assumed to be the same across both thermal infrared and solar spectrums), the extinction coefficient calculated using Mie theory in the thermal infrared is negligible. This suggests that these biomass-burning particles are too small to exert a measurable influence on thermal infrared radiation and their effect in this spectral range is not discussed.
4.1.1 Aerosol and cloud properties
Figure 2 presents the primary effects observed on shortwave irradiances and heating/cooling rates based on selected aerosol and cloud properties. AOT significantly impacts both downward and upward fluxes, decreasing as AOT increases (Fig. 2a and d). Warming rates also increase with AOT, reaching particularly strong values (+8 K d−1). These effects are most pronounced in the region where the aerosol layer is placed in the model (between 1 km and slightly below 6 km altitude).
Aerosol absorption, another parameter studied (quantified by variations in the imaginary refractive index), reveals that both upward and downward fluxes decrease as absorption increases (Fig. 2c, f). Heating/cooling rates also rise with aerosol absorption as expected (Fig. 2i). With purely scattering particles (i.e., an imaginary refractive index equal to zero), heating rates remain positive (residual warming from water vapor) but are very low. These simulations confirm aerosol absorption's crucial role in modulating irradiances and heating rates. Accurately representing this parameter, along with aerosol optical thickness, is essential for precise estimates of atmospheric warming rates.
The presence of clouds beneath aerosols, primarily characterized by the COT, is another factor considered. The results show that COT has a minimal impact on downward solar flux (Fig. 2b). However, due to the clouds' significant reflective capacity, their impact on upward solar flux is substantial (Fig. 2e). While the choice of cloud optical thickness affects the calculation of heating/cooling rates (Fig. 2h), it is less crucial than knowing aerosol optical thickness and absorption.
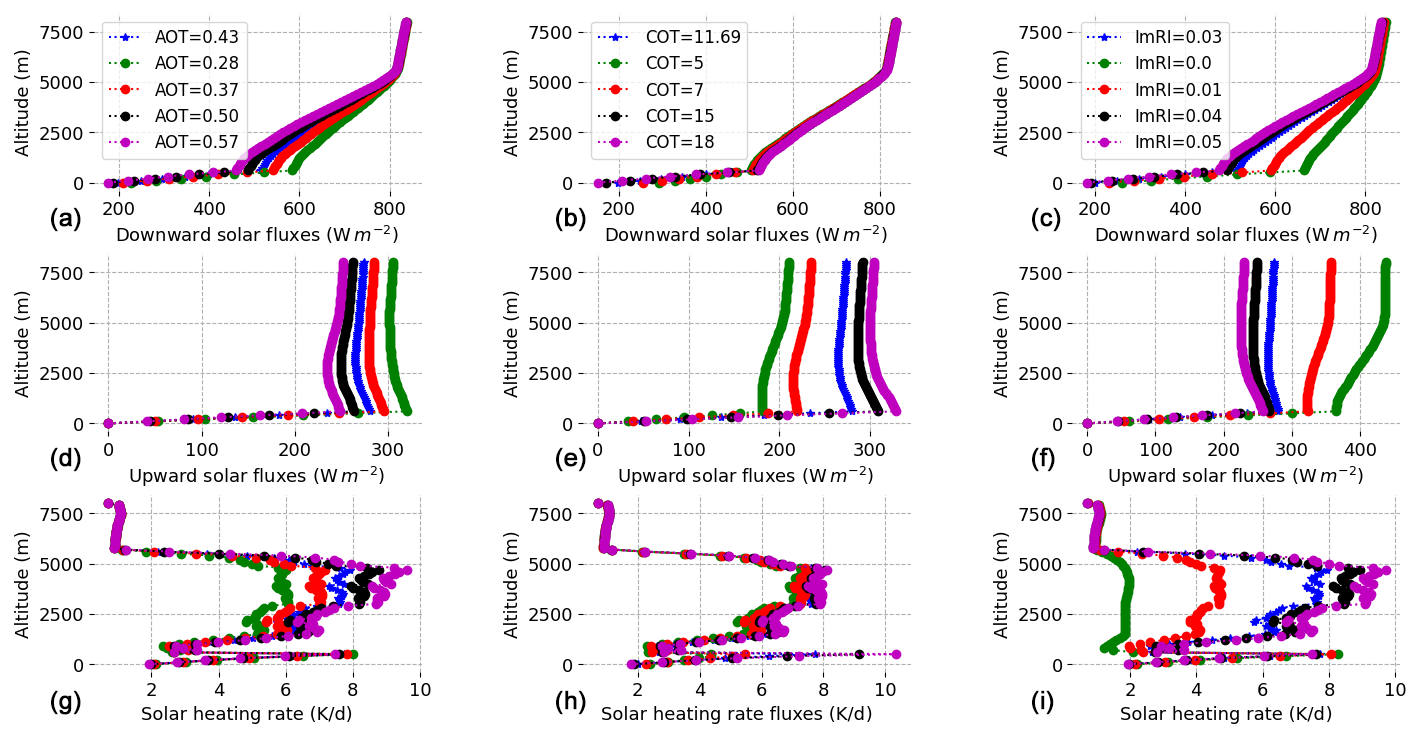
Figure 2Impact of aerosol and cloud parameter changes on simulated solar radiation: downward (top row) and upward irradiances (middle row), and heating/cooling rates (bottom row). Panels (a), (c), and (g) show the impact of AOT variations. Panels (b), (e), and (h) show the impact of COT variations. Panels (c), (f), and (i) show the impact of aerosol absorption variations evaluated by changes in the aerosol imaginary refractive index (ImRI). The blue curve represents the reference case. The imaginary part of the complex refractive index (see c) of 0., 0.01, 0.03, 0.04, and 0.05 respectively correspond to aerosol single scattering albedo values of 1.00, 0.95, 0.85, 0.81, and 0.78 at 550 nm.
4.1.2 Water vapor profile
Figure 3 illustrates how irradiance varies with changes in water vapor concentration. The specific humidity profiles used in this analysis are presented in Fig. 4c. The profiles obtained by the airborne probe, a dropsonde, and provided by a meteorological reanalysis are shown.
The results shown in Fig. 3a and b highlight the importance of incorporating a directly measured water vapor profile into the radiative transfer model.
Downward solar irradiances are sensitive to the choice of water vapor profile. We compare the results obtained with reanalysis profiles and the profile measured with the airborne probes. Although reanalysis data is generally reliable, airborne complementary data are crucial for capturing local variations.
Figure 3a shows differences in the part of the atmosphere between 1 and 6 km for the downward solar flux. This is explained by the observed differences between the specific humidity profiles observed for the same altitudes (see Fig. 4c and d). Distinctions in simulated downward shortwave irradiances also emerge around 8 km altitude when using reanalysis data or direct measurements. The integrated water vapor content above this altitude differs for the two profiles studied (not shown for clarity; zooming in Fig. 4c would be required to see it). Although these quantities are relatively small, these divergences between the profiles are sufficient to explain the observed differences in the simulated downward solar irradiances at this altitude. The presence of water vapor above the aircraft induces a decrease in downward solar radiation. Thus, even a small amount of localized water vapor above the aircraft must be precisely considered in the simulations.
The results obtained in the thermal infrared reveal an even more pronounced sensitivity of fluxes to water vapor. Water vapor contributes by cooling the atmosphere in the thermal infrared. One can note cooling of −4 or −6 K depending on the profile considered (Fig. 3f). Heating/cooling rated profiles show negative values of −4 to −6 K, with vertical variation depending on the specific profile analyzed. As expected, the cooling is most pronounced at the altitude where water vapor content increases significantly, indicating the influence of the humid smoke layer. It is therefore imperative, for calculating the atmospheric heating rates of smoke plumes (aerosol + water vapor), to have precise knowledge of the vertical distribution of water vapor.
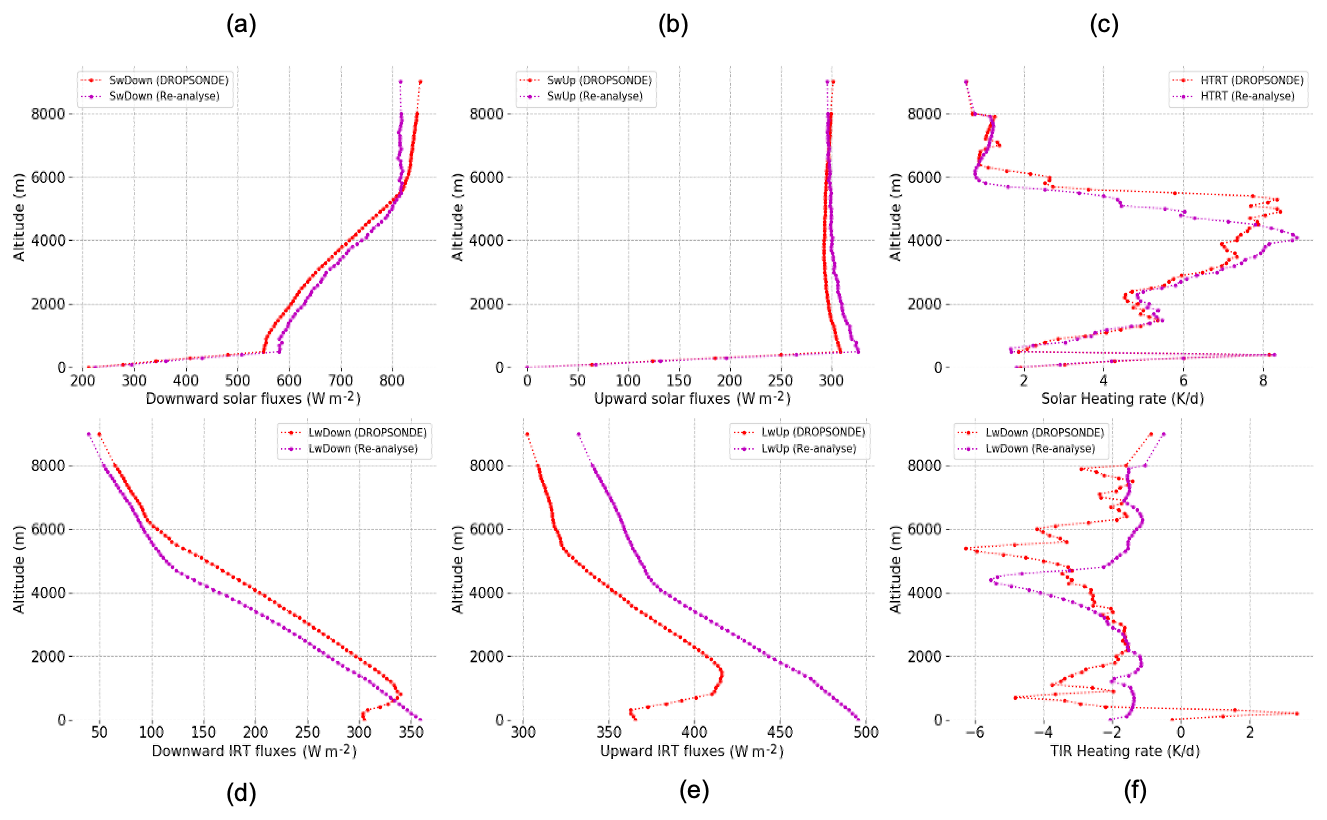
Figure 3The impact of the water vapor profile on the upward and downward fluxes in the solar and thermal infrared spectral domains for two different profiles: one obtained from meteorological data (curves in purple) and the other acquired during the campaign (curves in red). Profiles of (a) upward shortwave irradiances, (b) downward shortwave irradiances, (c) shortwave heating/cooling rates, (d) downward thermal infrared irradiances, (e) upward thermal infrared irradiances, and (f) heating/cooling rates in the thermal infrared.
4.2 Quantifying method accuracy for water vapor and aerosol extinction profiles
Measurements of aerosol optical thicknesses and water vapor taken by PLASMA during the spiral descent were used to validate the extinction and specific humidity profiles used to compute the aerosol heating rates.
Figure 4a shows the extinction profiles retrieved by lidar LNG and OSIRIS before descent (adjusted and unadjusted) on 8 September 2017. Figure 4b presents the corresponding AOT values compared with the PLASMA AOTs. The combined use of active and passive techniques demonstrates a high degree of success for this case in reconstructing the vertical distribution of aerosol properties within the atmosphere. The minimal impact of the correction term in Eq. (1) suggests a strong similarity between the OSIRIS and lidar LNG retrievals of aerosol properties. It is important to note that this good agreement might not always be achievable when applying this method to spaceborne data. For instance, Deaconu et al. (2019) highlight that significant discrepancies are expected between operational spaceborne POLDER and lidar CALIOP aerosol above-cloud optical thicknesses.
As shown in Fig. 4c, PLASMA sun-photometer measurements agree well with on-board probe data for water vapor content above 1 km, which is the minimum altitude attained by the aircraft for this particular profile. We have used instrumental synergy to reconstruct a water vapor profile over the entire atmospheric column (Fig. 4d), which is used in subsequent calculations. The aircraft probe allows the measurement of the water vapor profile between 1 and 8 km (the altitudes of the end and beginning of the spiral descent). The dropsonde provides information on the water vapor present in the cloud. A factor is applied to these data to ensure consistency between the aircraft probe measurements and the dropsonde measurements. PLASMA measurements are used to check the water vapor content above the aircraft, which is negligible in most cases.
4.3 Quantifying method accuracy for irradiances and heating rates
In order to validate the reliability of our methodology, we use the irradiance measurements collected with the pyrgeometer and pyranometer during the vertical spiral descent. Comparing GAME radiative transfer simulations (with inputs of OSIRIS and LNG lidar data) with sounding irradiances will allow the evaluation of the methodology accuracy.
4.3.1 Analysis of fluxes and heating rates
Case study of 8 September 2017
Figure 5 presents the results obtained for the comparison of measured and simulated fluxes and heating rates for the 8 September 2017 case study. The simulated irradiances (in blue) are shown with their associated error bars. These values come from the error propagation calculations linked to the uncertainties associated with the aerosol parameters retrieved by OSIRIS. The error terms associated with aerosol properties were evaluated based on the work of Chauvigné et al. (2021). We refer to Appendix A for details. The measurements are also represented with their uncertainties. We recall that the simulations are based on the OSIRIS and lidar LNG data acquired just before the start of the spiral descent (see the “reference case” described in Sect. 4.1) and the reconstructed water profile shown in Fig. 4c.
We observe excellent agreement between simulations and measurements for this case, both for solar and thermal fluxes. Examining Fig. 5, it is noticeable that the measured upward irradiances on the solar spectrum show significant variations (red curve). These variations, as previously explained, are attributable to the variability of the cloud scene properties under the aircraft. The green curve corresponds to solar irradiance calculations from the average cloud optical thickness retrieved during the spiral descent initiation. For the spiral descent, cloud properties need to be recalculated at each change in altitude. During the spiral descent, the majority of COT retrievals fall within the range of 8 to 14. On the blue curve, the retrieval of cloud optical thicknesses with irradiance measurements was performed for each altitude step. The variations due to the presence of the cloud scene were accurately captured with the method described in Sect. 3.3.2, as shown by our graphical comparison.
In the thermal infrared domain, our simulations also manage to reproduce the observed fluxes in a satisfactory manner. The small discrepancies between the measured and simulated fluxes can largely be explained by measurement uncertainties.
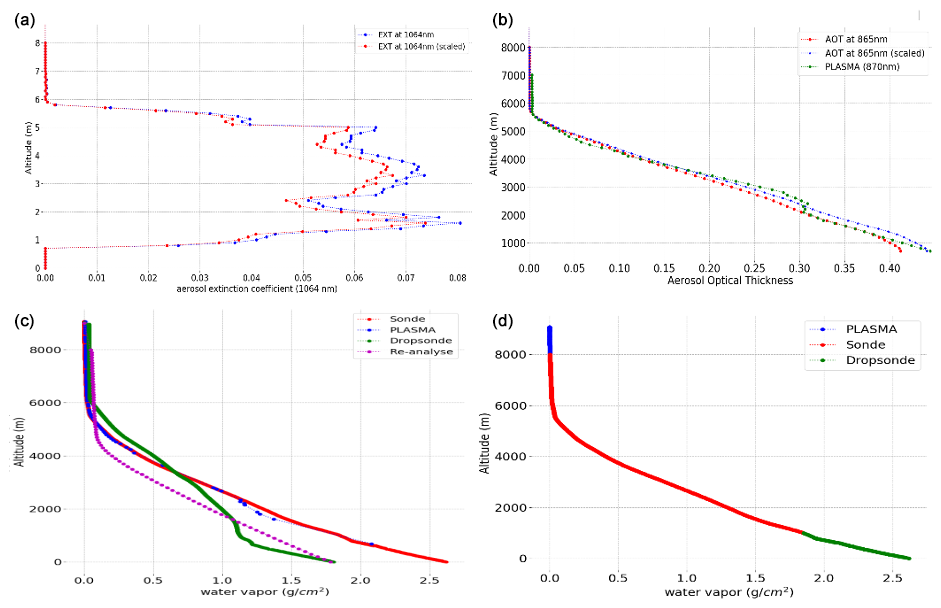
Figure 4Data for the 8 September flight. (a) Aerosol extinction profile measured by the LNG lidar at 1064 nm just before the start of the spiral descent phase. We present results with two approaches: one using the original data and the other applying a correction factor to achieve an integrated optical thickness over the entire atmospheric column that matches the value obtained by OSIRIS at 1064 nm. (b) Aerosol optical thickness profile as a function of altitude: PLASMA photometric measurements at 870 nm (in green), calculated profile at 865 nm from lidar retrievals coupled with the estimated particle model with OSIRIS (in blue), calculated profile at 865 nm solely from lidar retrievals (in red). (c) Variation of integrated water vapor content over the air column above the aircraft as a function of altitude, estimated during spiral descents performed with the aircraft, dropsondes, meteorological reanalysis, and PLASMA sun-photometer data. (d) Reconstructed water vapor profile from aircraft sounding, dropsonde, and PLASMA photometer data (see Sect. 4.2).
The comparison was also carried out for the heating rates. We recall that the fluctuations observed in the rates calculated here cannot be considered as solely associated with the variability of the atmospheric properties. The polynomial modeling approach was applied to both the measured and simulated net fluxes deduced from the upward and downward fluxes presented in Fig. 5. This approach allows us to take into account the fact that the albedo of the target present under the aerosol layer is not the same between altitudes z1 and z2 (see Eq. 3). By applying this approach, the rates calculated from the measurements and simulations become comparable. For the altitude range associated with the presence of aerosols, the differences between the measured and simulated rates do not exceed 2 K d−1, and these differences are within the error bars associated with the calculated rates.
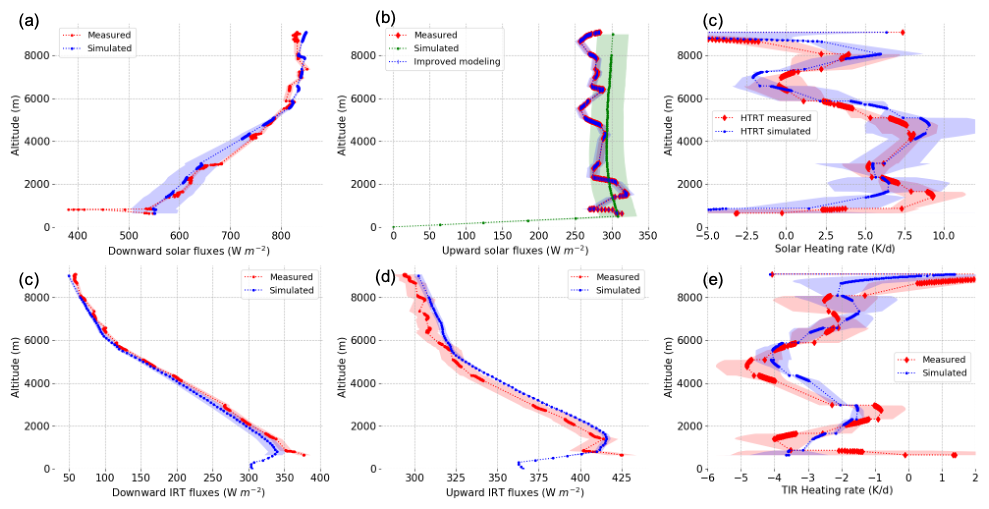
Figure 5Flux and heating rates as a function of altitude for the thermal infrared and solar domains. Measurements and calculations are performed for the loop descent carried out during the flight of 8 September 2017. The blue curves represent the simulations, while the red curves correspond to the measurements made during the airborne campaign. The “zones” represented in red and blue correspond to the error bars associated with the measurements and the simulations, respectively. The green curve corresponds to an alternative simulation of the upward solar flux performed for a single cloud optical thickness while this parameter is adjusted for the upward solar flux (the blue curve strictly superimposing on the upward solar flux measurement). Profiles of (a) downward shortwave irradiances, (b) upward shortwave irradiances, (c) shortwave heating/cooling rates, (d) downward thermal infrared irradiances, (e) upward thermal infrared irradiances, and (f) heating/cooling rates in the thermal infrared.
Case study of 12 September 2017
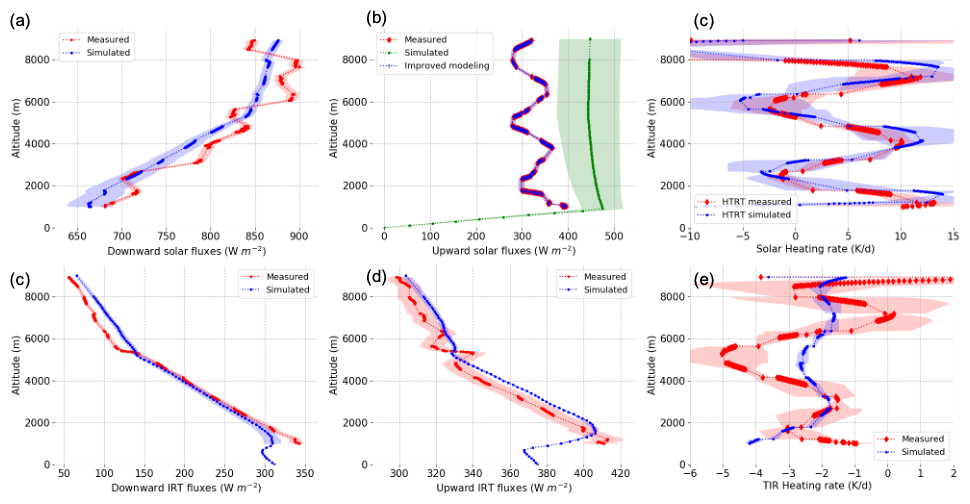
Comparisons of the calculated and measured fluxes and rates are shown Fig. 6 for the flight performed on 12 September 2017.
For this second case study, we apply the same protocol as that previously described for the spiral descent performed on the 8 September flight, with one exception. The extinction profile retrieved from the polarimeter/lidar synergy was replaced with sun-photometer data from PLASMA acquired during the spiral descent. The substitution was made because the region sampled during the spiral descent differed geographically from the high-altitude flight transect where OSIRIS and lidar data were acquired. Simulations were then based on OSIRIS retrievals (i.e., particle size and imaginary refractive index), but AOT came from sun-photometer PLASMA. Compared to the previous case, the cloud properties exhibited greater spatial variability in this second case. Figure 1b illustrates the spatial distribution of the COT along the loop descent path of the 12 September 2017 flight. On the “east side” of the flight path, COT values exceed 8, while on the “west side” of the loop, COT values are less than 8.
Despite heterogeneity in COT, in the solar domain the upward irradiances are remarkably well reproduced after adjusting the cloud optical thickness (see the differences between the green and blue curves in Fig. 6). However, larger variations and discrepancies between measurements and simulations are observed for the downward solar flux between 5 and 8 km altitude. Although the sources of these fluctuations are not fully identified, our main hypothesis is that the spatial variability of atmospheric properties in the region above the aircraft could be responsible. Thus, the large loop radius, variations in the spatial distribution of atmospheric properties above the aircraft, and potentially the presence of high clouds could explain these fluctuations. Errors in the corrections applied to the flux measurements cannot be ruled out. However, on average, the simulated downward flux falls between the maximum and minimum measured flux values. There is very good agreement between the measured and simulated heating rates for spectral solar calculations, despite significant profile variations due to cloud scene variability.
In the thermal infrared domain, the measured and simulated irradiances exhibit remarkable agreement, showing a consistent order of magnitude. The simulated heating rates also show good agreement in terms of order of magnitude with the measured rates. However, a significant difference of the order of 2 K d−1 between the simulated and measured heating rates is observed between 4 and 6 km, and also between 6 and 8 km. This significant discrepancy can be attributed to the observed discrepancies in the upward and downward fluxes, measured and simulated, for this altitude range. During rapid descents with the aircraft, irradiance measurements in the thermal infrared can be affected (Meloni et al., 2018). When thermal equilibrium between the ambient air, the sensor's window, and the instrument is not achieved, the flux measurements performed in the thermal infrared range can be biased (Albrecht et al., 1974; Curry and Herman, 1985). This behavior has already been reported and constitutes our primary explanatory hypothesis for the departure observed here between our measured data and simulation results.
4.4 Mimicking satellite remote sensing: active–passive data synergy from high-altitude-flight measurements
In this section we analyze atmospheric heating/cooling rate profiles retrieved using OSIRIS and lidar LNG data acquired during high-altitude flight segments (8–10 km).
4.4.1 Estimation of cooling/warming rates for the 8 and 12 September flights
Figure 7 (first column) shows the heating/cooling rates obtained with this approach as a function of acquisition time for the 8 September flight. We show the profiles of the aerosol attenuated backscattering coefficient at 1064 nm as a function of altitude (Fig. 7a), the atmospheric heating/cooling rates calculated in the solar spectrum (Fig. 7c), the “aerosol-specific” heating rate (Fig. 7e), the atmospheric heating/cooling rates calculated in the thermal infrared spectrum, and, finally, the global atmospheric heating rate, calculated from the sum of the solar and infrared irradiances. The “aerosol-specific” heating rate quantifies the specific contribution of aerosols to atmospheric heating. It can only be estimated by a radiative transfer calculation. The calculations are performed twice, with and without aerosols. The heating rate calculated in the presence of aerosols is corrected for the calculation performed without aerosols, providing what we will call the aerosol heating rate.
Overall, we observe good spatial homogeneity in the results of the calculated rates for both the atmosphere and aerosols. The main observable flaw in these results is the presence of strong values of heating rates at the top of the aerosol layer, which are found in all rate calculations (>10 K d−1). This corresponds to clouds forming at the top of the aerosol layer. In the context of developing an operational space product, these values should be filtered. This problem disappears between 08:15 and 08:20 (decimal UTC time). For 12 September, no cloud formation was observed at the top of the aerosol layer (see Fig. 7b). Missing data in heating rate figures for this second flight (Fig. 7d, g, h, and j) result from missing OSIRIS data or retrievals. Average AOT at 865 nm was 0.45 and 0.18 respectively on 8 and 12 September, explaining the lower 1064 nm backscatter for the 12 September flight (see Fig. 7a and b). Similar key findings were observed for both flights. The results of the 8 September flight are discussed below.
Over the solar spectrum, we find the order of magnitude of the heating rates estimated during the spiral descent, presented in the previous section. This is particularly the case at the end of the axis, which corresponds to the flight section carried out just before the spiral descent. For the atmospheric rates calculated on the solar spectrum, we note higher values in the top of the smoke layer, which is due to water vapor, as explained in the sensitivity study section. For aerosol heating rates, we observe fairly homogeneous values of the order of 4 to 5 K d−1 between 1 and 6 km approximately.
The profiles of heating rates in the thermal infrared do not show any variability as a function of acquisition time. A single and unique specific humidity profile is used for the calculations and this one which sets the vertical variability on this parameter. We recall that the effect of BBAs is almost negligible in our calculation in the thermal infrared (see the discussion in Sect. 4.1). The only possible spatial variations are linked here to the properties of the low-level cloud (mostly changes in the altitude of the cloud top).
We observe that the calculated thermal infrared warming rates are very close to the warming rates estimated from the measurements. For example, the calculated cooling rate in the upper part of the layer (−4 K d−1) is clearly visible in the rates previously estimated using the pyrgeometer for similar altitudes (see Fig. 6f around −5 K d−1 between 4 and 6 km). A similar cooling at a comparable altitude is also confirmed by the analysis performed for the 7 September profile (not shown), which corroborates this result.
While the atmospheric global heating/cooling rates account for all radiative processes (solar and infrared), they are rather comparable to the heating rates derived solely from aerosols. This suggests that the influence of water vapor on the solar and thermal radiation tends to offset each other, resulting in a relatively neutral effect on average throughout the atmosphere.
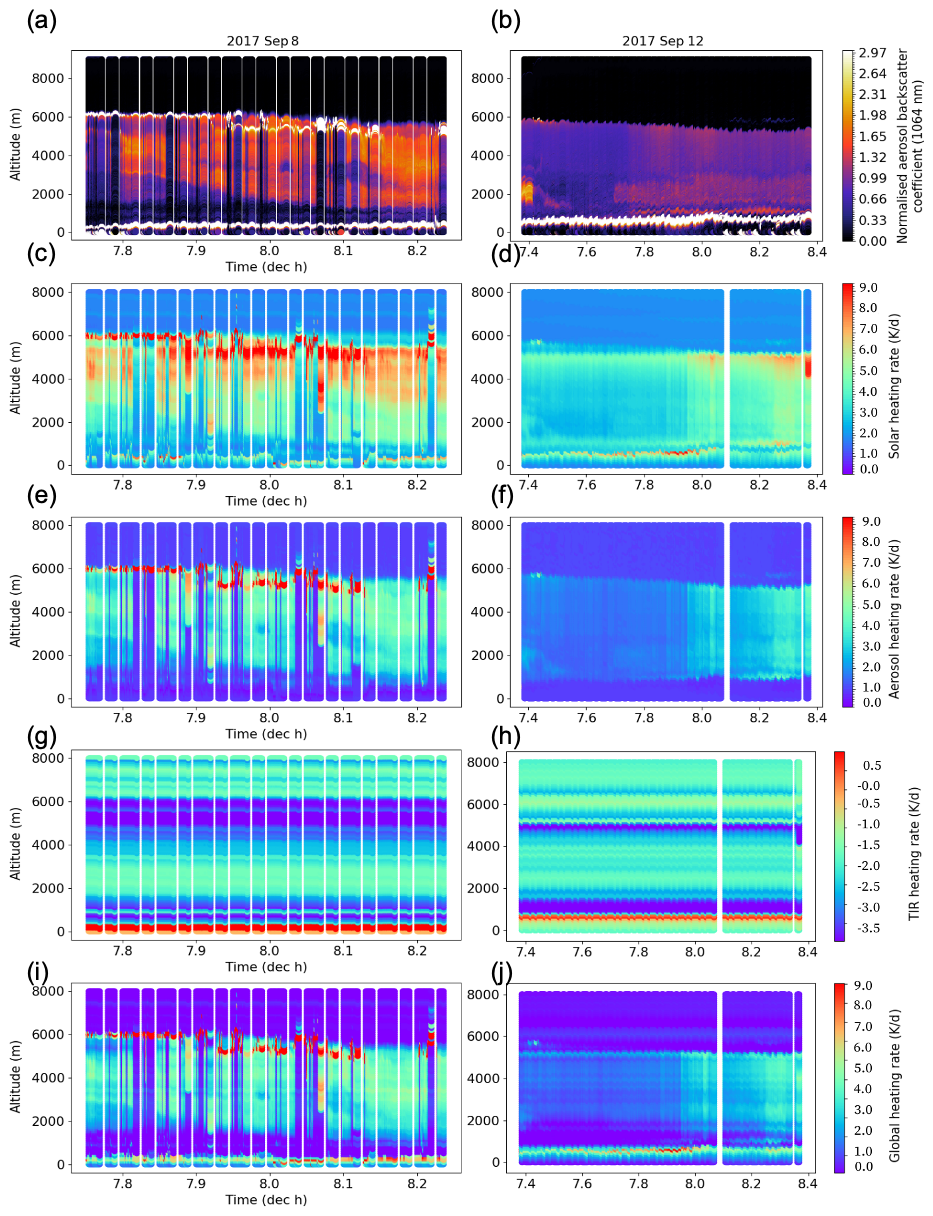
Figure 7Heating rates calculated above clouds as a function of acquisition time and data provided by the LNG lidar. Results for the flight of 8 September 2017 are shown in the left column. Results for the 12 September 2017 are show in the right column. (a) and (b) attenuated backscatter coefficient measured at 1064 nm; (c) and (d) atmospheric heating rates calculated over the solar spectrum; (e) and (f) specific aerosol heating rates calculated over the solar spectrum; (g) and (f) heating (cooling) rate calculated in the thermal infrared; and (i) and (j) global atmospheric heating rate (solar + thermal infrared).
4.4.2 Assessment of heating/cooling rates above clouds for the AEROCLO-sA campaign
Figure 8 presents averaged vertical profiles of atmospheric heating/cooling rates, specific aerosol heating rates, water vapor, and aerosol extinction for the 5, 7, 8, 9 and 12 September flights. The mean cloud-top altitude is also reported (horizontal black line). The plots shown in Fig. 8 are ranked by decreasing heating rate.
Different scenarios of BBAs above clouds are evident in the extinction profiles (Fig. 8, orange curves). On 7 September, two distinct aerosol layers are visible: one near the cloud top (1 km) and the other between 4 and 6 km. A transition zone, with less aerosol extinction and heating, separates these two layers (Fig. 8d, between 2 and 4 km). For 12 September, only one main aerosol layer is visible, starting from the cloud top (1 km). This suggests that aerosols might be within the cloud, or at least in contact with the cloud top for this case. A strong correlation is also observed between the aerosol extinction and specific humidity profiles. On 9 September, the same strong correlation between water vapor and aerosol extinction can be noted for altitudes higher than 3 km (see Fig. 8), with a peak in both profiles around 3.5 km. Below 3 km, water vapor and aerosol extinction appear anti-correlated.
On 7 and 12 September, aerosol-induced atmospheric heating occurs just above the cloud layer. For the other cases, there is generally a distinct transition zone (an area with no or few aerosols) between the cloud top and the base of the layer and the maximum heating occurs at altitudes higher than the cloud top.
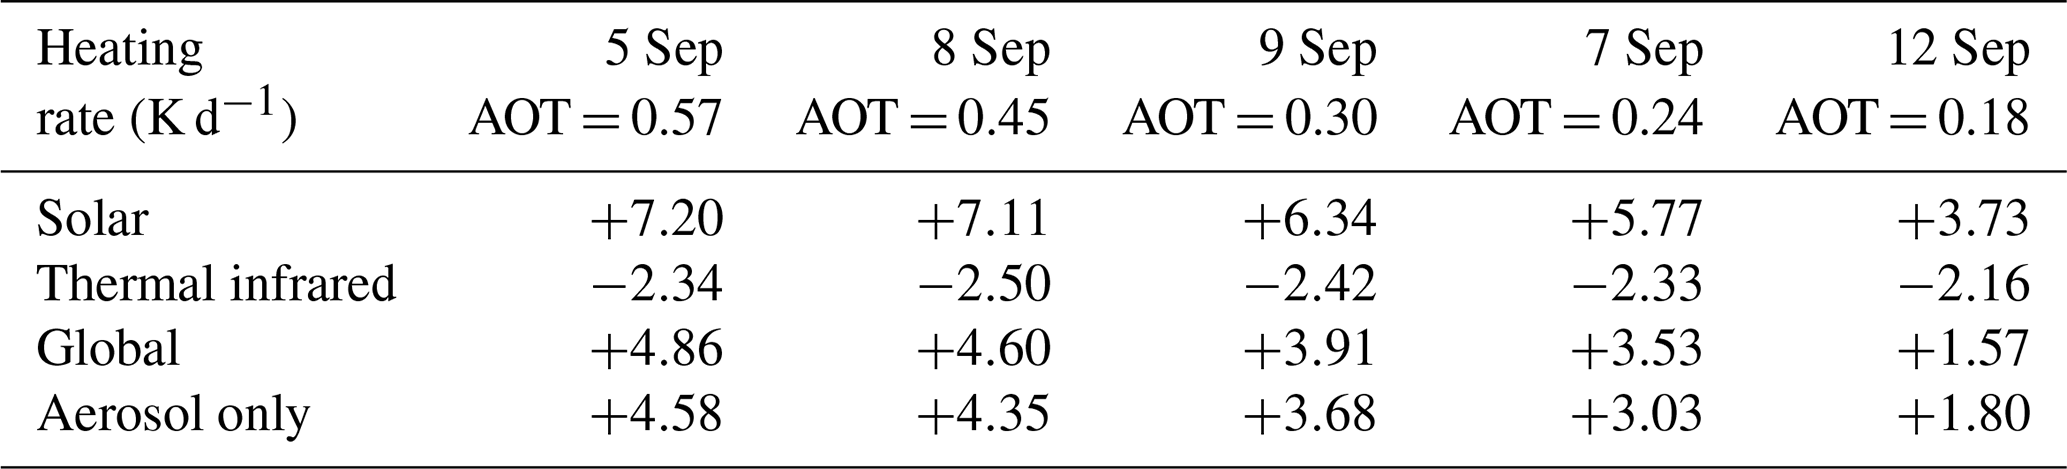
The estimated aerosol-induced heating rates above the clouds vary from 2 to 5 K d−1 on average depending on the observation day and aerosol optical thickness. See Table 3, which contains the vertically integrated values of the heating rates. The aerosol-specific heating and global heating/cooling rate profiles calculated in our study are generally very close. Therefore, both quantities can be used to constrain the warming of biomass-burning plumes observed during AEROCLO-sA. This confirms a relatively neutral global (solar + thermal infrared) effect of water vapor on solar and thermal infrared radiation spectra, at least on average over the vertical profile, which is the case for the values given in Table 3. Cooling due to water vapor in the thermal is about −2 K on average (see Table 3). Locally, as we have seen in earlier discussion (see the sensitivity study section), water vapor can accentuate the cooling occurring at the top of the aerosol layer (see Fig. 8c and d, respectively, for the 9 and 7 September flights around 6 km). For the 5 and 7 September flights, a slight increase in global rates can be noted compared to the rates calculated only for aerosols, suggesting a slightly positive water vapor balance for these cases.
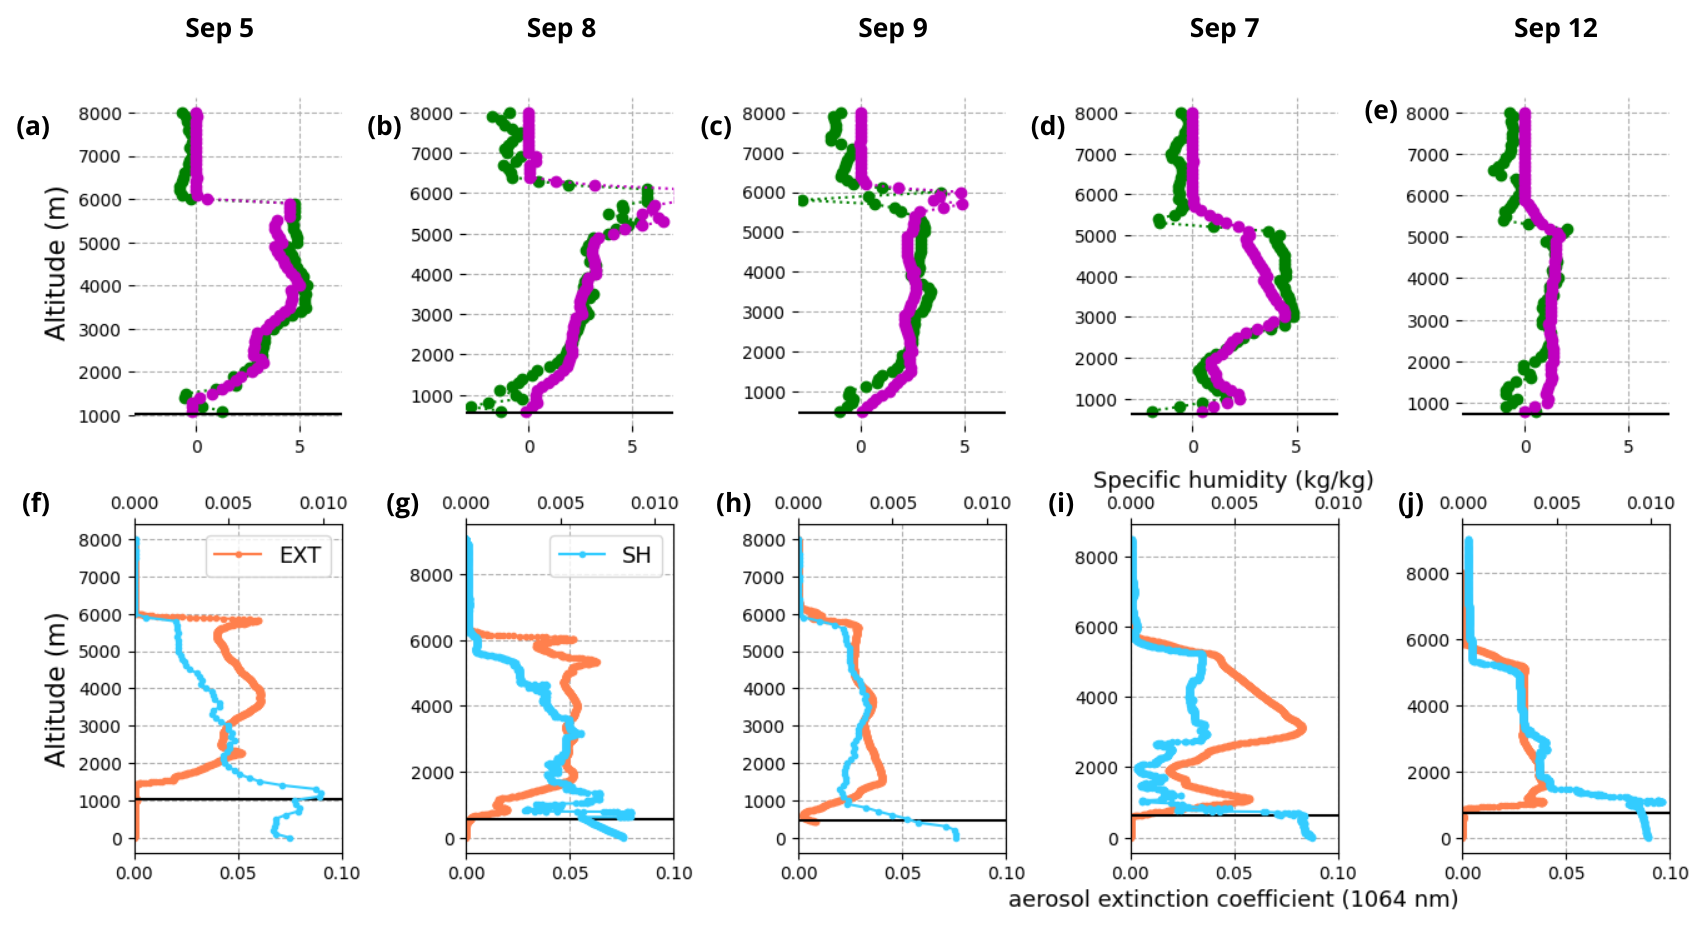
Figure 8Mean values of vertical profiles of heating/cooling rates above clouds for the 5, 8, 9, 7 and 12 September flights. The first line shows the global heating/cooling rates (curves in green) and the aerosol-specific heating rates (curves in purple) as a function of altitude and the day of the flight. The second line represents the associated mean profiles of specific humidity in kg kg−1 (curves in blue, top axis) and aerosol extinction at 1064 nm in 10−3 km−1 units (orange curves, bottom axis). The horizontal black line indicates the mean cloud-top altitude.
Table 3The average values computed over the vertical for heating/cooling rates for the various above-cloud flight segments of the AEROCLO-sA campaign. The mean AOT values at 865 nm for each flight are also reported.
Aerosol-induced atmospheric heating plays a key role in shaping the dynamics of biomass-burning plumes, influencing their vertical distribution, transport, and the dynamics and properties of the low-level clouds.
We developed an innovative approach that combines airborne measurements from the OSIRIS polarimeter and LNG lidar to derive aerosol heating and global atmospheric heating rates incorporating water vapor. To calculate these quantities, we also utilize a radiative transfer code and additional meteorological parameters provided by radiosondes.
This methodology is assessed during massive transports of biomass-burning particles observed during the September 2017 AEROCLO-sA airborne campaign in Namibia.
The spiral descent performed with the aircraft allowed for the acquisition of detailed vertical profiles of irradiances, aerosol optical thickness (measured by PLASMA), and water vapor directly within the plumes. These data were essential for enabling a measurement-based calculation of heating rates, allowing for validation of a unique dimension of the methodology. For the first time, atmospheric heating rates calculated using a radiative transfer code were compared to heating rates directly measured in the atmosphere. Above clouds, estimating shortwave heating rates from irradiance measurements presented challenges due to the rapid variation in the properties of the underlying target (the cloud). However, a comparison between the rates directly derived from irradiance measurements and those estimated from the synergy between OSIRIS and the LNG lidar was achieved. This approach based on airborne irradiance measurements thus allowed for an assessment of the robustness of the active–passive synergy method. Overall, the results showed mostly good agreement between the heating rates and their uncertainties from measurements and calculations (error bar overlap).
This good agreement between measurement and calculation also underscores the importance of the rigorous methods employed and the flight strategy. These methods include minimizing pitch and roll during flight maneuvers (spiral descent) and applying appropriate corrections to the irradiance measurements. To fully utilize these specialized measurements, homogeneous atmospheric conditions are also necessary. Subsequently, analyzing the collected data allows for selecting the descents that achieve the desired scientific objectives.
The aerosol-specific heating rates (vertically averaged) are positive and vary between +2 and +5 K d−1. As noted in previous studies (Pistone et al., 2021), aerosol and water vapor distribution are often correlated within these smoke plumes. Within the smoke layer, for water vapor, the warming effect in the shortwave is generally compensated by cooling in the longwave. However, an exception occurs at the top of the layer, where a stronger cooling effect of −1.5 K d−1 often dominates due to water vapor, with a potential impact on high-level cloud formation. Our estimates are in good agreement with those obtained during the ORACLES campaign (2–8 K d−1, Cochrane et al., 2022). Nevertheless, the global (solar + thermal) atmospheric heating/cooling rates computed above clouds are weaker than in Cochrane et al. (2022), who did not consider the influence of water vapor in the thermal infrared. The specific aerosol heating rate estimates are close since the observed particles primarily interact with the shortwave radiations. Deaconu et al. (2019) used CALIOP and aerosol-above-cloud POLDER products to estimate aerosol-above-cloud heating rates. Their study near the coast of Angola showed values of 5.7 K d−1 for aerosol heating rates above clouds, which also aligns with our results.
A recent study based on the Meso-NH model demonstrated the importance of heating rates on the dynamics of biomass-burning aerosol plumes observed during the AEROCLO-sA campaign (Chaboureau et al., 2022). It would be especially valuable to adjust the heating rates in the model based on our results. This would allow us to verify whether the adjusted model more accurately reproduces the altitudes of the base and top of the smoked layers. This work could lead to better modeling of the aerosol transport and dynamics in this region. Based on these results, one of the objectives will also be to compare observational inversions of the heating rate due to smoke with the output of the ALADIN model over this region (Mallet et al., 2019).
In the long term, our major perspective is the generalization of this method to the global level. The approach presented here, based on the synergy of airborne active and passive remote sensing measurements, could be applied, with some adjustments, to a space-based lidar and polarimeter. In particular, the water vapor and temperature profiles provided here by the dropsonde or probes could be provided by meteorological reanalysis.
As demonstrated in our simulations, the choice of the cloud optical thickness of the target underlying the aerosol layer has an impact on the calculation of heating rates, although its impact is minimal compared to its influence on calculating the direct forcing of aerosols above clouds (de Graaf et al., 2020). Accounting for cloud optical thickness, with corrections applied to address how the presence of the lofted aerosol layer affects the retrieval of cloud properties (as done in Peers et al., 2015), could be valuable for this purpose.
Mineral dust particles should also be included in our method since dust is also usually observed above clouds at regional scale (Waquet et al., 2013b). Coarse mineral particles significantly interact with thermal infrared radiation and their optical properties will have to be accounted for in the algorithm.
Furthermore, our current method assumes constant aerosol properties (size, complex refractive index, and single scattering albedo) with altitude. However, observations suggest that SSA varies with altitude within biomass-burning layers (Wu et al., 2020). As our method currently only considers variable above-cloud aerosol concentration as a function of the altitude, incorporating altitude-dependent aerosol properties could enhance its accuracy.
By considering these important points and leveraging the capabilities of satellite instruments, the method could be extended for current and future satellite-based measurements. There are currently five years of satellite retrievals of aerosol properties above clouds, referred to as the AEROsol Above-Clouds (AERO-AC) products (Waquet et al., 2020), including above-cloud aerosol SSA, AOT, and cloud-corrected optical thicknesses, from the POLDER/PARASOL mission data, which can be used in synergy with CALIOP lidar data (Deaconu et al., 2019). Our approach could also be applied to future European missions such as 3MI and the Earth Clouds, Aerosols and Radiation Explorer (EarthCARE) satellite (Wehr et al., 2023), and also the Atmosphere Observing System (AOS) mission (Gettelman et al., 2021), which also plans to combine passive and active instruments in space. This will enable a more comprehensive analysis of aerosol–cloud–radiation interactions on a regional and global scale, contributing to a better understanding of climate processes and improved climate models for better climate change predictions.
The GAME code is used to perform error propagation calculations to provide a range of possible solutions for irradiance and heating/cooling rate estimates. The error terms associated with aerosol properties were evaluated based on the work of Chauvigné et al. (2021). The relative error is estimated to be 10 % for the aerosol optical thickness (AOT estimated by OSIRIS) at 865 nm (expressed as a relative value). The error on the aerosol imaginary refractive index is 0.005 and the error on aerosol size (radius) is 0.02 µm. It is not easy to validate the cloud thickness retrievals, so the error was estimated to be 2 for the cloud optical thickness. Calculations are performed using the following equation for estimating errors in irradiances:
where σXi stands for the error associated with each individual parameter. A similar formula is used for the errors computed for the heating/cooling rate.
The data are available from the following sources: Perrin (2018) – https://doi.org/10.6096/AEROCLO.1754; Perrin (2019) – https://doi.org/10.6096/AEROCLO.1777; Flamant (2019) – https://doi.org/10.6096/AEROCLO.1774; Waquet (2019) – https://doi.org/10.6096/AEROCLO.1802; Chauvigné et al. (2020) – https://doi.org/10.6096/AEROCLO.1807.
FW and MV developed the methodology, analyzed the results, and led the manuscript writing, with input from IC. Data collection during the AEROCLO-sA field campaign was contributed by FW, CF, MM, FA, CD, RL, LB, and PF (PI), who also provided manuscript feedback. FP, GB, and OD contributed to the irradiance measurements and OSIRIS data analysis.
At least one of the (co-)authors is a member of the editorial board of Atmospheric Measurement Techniques. Moreover, at least one of the (co-)authors is a guest member of the editorial board of Atmospheric Measurement Techniques for the special issue “New observations and related modelling studies of the aerosol–cloud–climate system in the Southeast Atlantic and southern Africa regions”. The peer-review process was guided by an independent editor, and the authors also have no other competing interests to declare.
Publisher’s note: Copernicus Publications remains neutral with regard to jurisdictional claims made in the text, published maps, institutional affiliations, or any other geographical representation in this paper. While Copernicus Publications makes every effort to include appropriate place names, the final responsibility lies with the authors.
This article is part of the special issue “New observations and related modelling studies of the aerosol–cloud–climate system in the Southeast Atlantic and southern Africa regions (ACP/AMT inter-journal SI).” It is not associated with a conference.
Airborne data were obtained using aircraft managed by SAFIRE (http://www.safire.fr, last access: 11 May 2021), the French facility for airborne research, and infrastructure of the French National Centre for Scientific Research (CNRS), Météo-France, and the French National Centre for Space Studies (CNES). The AEROCLO-sA database is maintained by the French national data center for atmospheric data and services, AERIS. The strong diplomatic assistance of the French Embassy in Namibia, the administrative support of the Service Partnership and Valorisation of the Regional Delegation of the Paris–Villejuif region of the CNRS, and the cooperation of the Namibian National Commission on Research, Science, and Technology (NCRST) were invaluable in making the project happen.
The AEROCLO-sA project has been supported by the French National Research Agency (grant no. ANR-15-CE01-0014-01), the French national program LEFE/INSU, the Programme national de Télédetection Spatiale (PNTS; grant no. PNTS-2016-14), the French National Agency for Space Studies (CNES), and the South African National Research Foundation (NRF; grant no. 105958). The research leading to these results has received funding from the European Union's Seventh Framework Programme (FP7/2014–2018) under the EUFAR2 (grant no. 312609). Aurélien Chauvigné and Fabien Waquet additionally received financial support provided by the Programme national de Télédétection Spatial (PNTS; grant no. PNTST-2020-06).
Mégane Ventura and Fabien Waquet also received support from the CaPPA (Chemical and Physical Properties of the Atmosphere) project, which is funded by the French National Research Agency (ANR) through the PIA (Programme d'Investissement d'Avenir) under contract ANR-11-LABX-0005-01 and by the Regional Council Hauts-de-France and the European Funds for Regional Economic Development (FEDER).
This paper was edited by Frank Eckardt and reviewed by two anonymous referees.
Albrecht, B., Poellot, M., and Cox, S.: Pyrgeometer measurements from aircraft, Rev. Sci. Instrum., 45, 33–38, https://doi.org/10.1063/1.1686443, 1974.
Bellouin, N., Quaas, J., Gryspeerdt, E., Kinne, S., Stier, P., Watson-Parris, D., Boucher, O., Carslaw, K.S., Christensen, M., Daniau, A.-L., Dufresne, J.-L., Feinglod, G., Fiedler, S., Forster, P., Gettelman, A., Haywood, J.M., Lohmann, U., Malavelle, F., Maurotsen, T., McCoy, D.T., Myhre, G., Mülmenstädt, J., Neubauer, D., Possner, A., Rugenstein, M., Sato, Y., Schulz, M., Scharts, S.E., Sourdeval, O., Storelvmo, T., Toll, V., Winker, D., and Stevens, B.: Bounding global aerosol radiative forcing of climate change, Rev. Geophys., 58, e2019RG000660, https://doi.org/10.1029/2019RG000660, 2020.
Costantino, L. and Bréon, F.-M.: Aerosol indirect effect on warm clouds over South-East Atlantic, from co-located MODIS and CALIPSO observations, Atmos. Chem. Phys., 13, 69–88, https://doi.org/10.5194/acp-13-69-2013, 2013.
Chaboureau, J.-P., Labbouz, L., Flamant, C., and Hodzic, A.: Acceleration of the southern African easterly jet driven by the radiative effect of biomass burning aerosols and its impact on transport during AEROCLO-sA, Atmos. Chem. Phys., 22, 8639–8658, https://doi.org/10.5194/acp-22-8639-2022, 2022.
Chauvigné, A., Blarel, L., and Formenti, P.: AEROCLO-sA F20 PLASMA2, Baobab [data set], https://doi.org/10.6096/AEROCLO.1807, 2020.
Chauvigné, A., Waquet, F., Auriol, F., Blarel, L., Delegove, C., Dubovik, O., Flamant, C., Gaetani, M., Goloub, P., Loisil, R., Mallet, M., Nicolas, J.-M., Parol, F., Peers, F., Torres, B., and Formenti, P.: Aerosol above-cloud direct radiative effect and properties in the Namibian region during the AErosol, RadiatiOn, and CLOuds in southern Africa (AEROCLO-sA) field campaign – Multi-Viewing, Multi-Channel, Multi-Polarization (3MI) airborne simulator and sun photometer measurements, Atmos. Chem. Phys., 21, 8233–8253, https://doi.org/10.5194/acp-21-8233-2021, 2021.
Cochrane, S. P., Schmidt, K. S., Chen, H., Pilewskie, P., Kittelman, S., Redemann, J., LeBlanc, S., Pistone, K., Segal Rozenhaimer, M., Kacenelenbogen, M., Shinozuka, Y., Flynn, C., Ferrare, R., Burton, S., Hostetler, C., Mallet, M., and Zuidema, P.: Biomass burning aerosol heating rates from the ORACLES (ObseRvations of Aerosols above CLouds and their intEractionS) 2016 and 2017 experiments, Atmos. Meas. Tech., 15, 61–77, https://doi.org/10.5194/amt-15-61-2022, 2022.
Curry, J. A. and Herman, G. F.: Infrared radiative properties of summertime Arctic stratus clouds, J. Climate Appl. Meteor., 24, 525–538, https://doi.org/10.1175/1520-0450(1985)024{\&}lt;0525:IRPOSA>2.0.CO;2, 1985.
Deaconu, L. T., Waquet, F., Josset, D., Ferlay, N., Peers, F., Thieuleux, F., Ducos, F., Pascal, N., Tanré, D., Pelon, J., and Goloub, P.: Consistency of aerosols above clouds characterization from A-Train active and passive measurements, Atmos. Meas. Tech., 10, 3499–3523, https://doi.org/10.5194/amt-10-3499-2017, 2017.
Deaconu, L. T., Ferlay, N., Waquet, F., Peers, F., Thieuleux, F., and Goloub, P.: Satellite inference of water vapour and above-cloud aerosol combined effect on radiative budget and cloud-top processes in the southeastern Atlantic Ocean, Atmos. Chem. Phys., 19, 11613–11634, https://doi.org/10.5194/acp-19-11613-2019, 2019.
de Graaf, M., Schulte, R., Peers, F., Waquet, F., Tilstra, L. G., and Stammes, P.: Comparison of south-east Atlantic aerosol direct radiative effect over clouds from SCIAMACHY, POLDER and OMI–MODIS, Atmos. Chem. Phys., 20, 6707–6723, https://doi.org/10.5194/acp-20-6707-2020, 2020.
Denjean, C., Bourrianne, T., Burnet, F., Mallet, M., Maury, N., Colomb, A., Dominutti, P., Brito, J., Dupuy, R., Sellegri, K., Schwarzenboeck, A., Flamant, C., and Knippertz, P.: Overview of aerosol optical properties over southern West Africa from DACCIWA aircraft measurements, Atmos. Chem. Phys., 20, 4735–4756, https://doi.org/10.5194/acp-20-4735-2020, 2020.
Dubuisson, P., Roger, J. C., Mallet, M., and Dubovik, O.: A code to compute the direct solar radiative forcing: application to anthropogenic aerosols during the Escompte experiment, in: Proceedings of the International Radiation Symposium (IRS 2004) on Current Problems in Atmospheric Radiation, edited by: Fischer, H., Sohn, B.-J., and Deepak, A., Hampton, 127–130, 2006.
Flamant, C.: AEROCLO-sA F20 Lidar LNG aerosols, Baobab [data set], https://doi.org/10.6096/AEROCLO.1774, 2019.
Flamant, C., Gaetani, M., Chaboureau, J.-P., Chazette, P., Cuesta, J., Piketh, S. J., and Formenti, P.: Smoke in the river: an Aerosols, Radiation and Clouds in southern Africa (AEROCLO-sA) case study, Atmos. Chem. Phys., 22, 5701–5724, https://doi.org/10.5194/acp-22-5701-2022, 2022.
Formenti, P., D'Anna, B., Flamant, C., Mallet, M., Piketh, S. J., Schepanski, K., Waquet, F., Auriol, F., Brogniez, G., Burnet, F., Chaboureau, J.-P., Chauvigné, A., Chazette, P., Denjean, C., Desboeufs, K., Doussin, J.-F., Elguindi, N., Feuerstein, S., Gaetani, M., Giorio, C., Klopper, D., Mallet, M. D., Nabat, P., Monod, A., Solmon, F., Namwoonde, A., Chikwililwa, C., Mushi, R., Welton, E. J., and Holben, B.: The aerosols, radiation and clouds in southern Africa. Field campaign in Namibia: Overview, illustrative observations and way forward, B. Am. Meteor. Soc., 100, 1277–1298, https://doi.org/10.1175/BAMS-D-17-0278.1, 2019.
Fougnie, B., Marbach, T., Lacan, A., Lang, R., Schlüssel, P., Poli, G., Munro, R., and Couto, A. B.: The multi-viewing multi-channel multi-polarisation imager – Overview of the 3MI polarimetric mission for aerosol and cloud characterization, J. Quant. Spectrosc. Ra., 219, 23–32, https://doi.org/10.1016/j.jqsrt.2018.07.008, 2018.
Gettelman, A., Carmichael, G. R., Feingold, G., Da Silva, A. M., and Van den Heever, S. C.: Confronting future models with future satellite observations of clouds and aerosols, B. Am. Meteoror. Soc., 14, E1557–E1562, https://doi.org/10.1175/BAMS-D-21-0029.1, 2021.
Haywood, J. M., Abel, S. J., Barrett, P. A., Bellouin, N., Blyth, A., Bower, K. N., Brooks, M., Carslaw, K., Che, H., Coe, H., Cotterell, M. I., Crawford, I., Cui, Z., Davies, N., Dingley, B., Field, P., Formenti, P., Gordon, H., de Graaf, M., Herbert, R., Johnson, B., Jones, A. C., Langridge, J. M., Malavelle, F., Partridge, D. G., Peers, F., Redemann, J., Stier, P., Szpek, K., Taylor, J. W., Watson-Parris, D., Wood, R., Wu, H., and Zuidema, P.: The CLoud–Aerosol–Radiation Interaction and Forcing: Year 2017 (CLARIFY-2017) measurement campaign, Atmos. Chem. Phys., 21, 1049–1084, https://doi.org/10.5194/acp-21-1049-2021, 2021.
IPCC: Climate Change 2022: Impacts, Adaptation, and Vulnerability. Contribution of Working Group II to the Sixth Assessment Report of the Intergovernmental Panel on Climate Change, edited by: Pörtner, H.-O., Roberts, D. C., Tignor, M., Poloczanska, E. S., Mintenbeck, K., Alegría, A., Craig, M., Langsdorf, S., Löschke, S., Möller, V., Okem, A., and Rama, B., Cambridge University Press, Cambridge, UK and New York, NY, USA, https://doi.org/10.1017/9781009325844, 2022.
Jethva, H., Torres, O., Waquet, F., Chand, D., and Hu, Y.: How do A-train sensors intercompare in the retrieval of above-cloud aerosol optical depth? A case study-based assessment, Geophys. Res. Lett., 41, 186–192, https://doi.org/10.1002/2013GL058405, 2014.
Jethva, H., Torres, O., and Ahn, C.: A 12-year long global record of optical depth of absorbing aerosols above the clouds derived from the OMI/OMACA algorithm, Atmos. Meas. Tech., 11, 5837–5864, https://doi.org/10.5194/amt-11-5837-2018, 2018.
Jethva, H. T., Torres, O., Ferrare, R. A., Burton, S. P., Cook, A. L., Harper, D. B., Hostetler, C. A., Redemann, J., Kayetha, V., LeBlanc, S., Pistone, K., Mitchell, L., and Flynn, C. J.: Retrieving UV–Vis spectral single-scattering albedo of absorbing aerosols above clouds from synergy of ORACLES airborne and A-train sensors, Atmos. Meas. Tech., 17, 2335–2366, https://doi.org/10.5194/amt-17-2335-2024, 2024.
Johnson, B. T., Shine, K. P., and Forster, P. M.: The semi-direct aerosol effect: Impact of absorbing aerosols on marine stratocumulus, Q. J. Roy. Meteor. Soc., 130, 1407–1422, https://doi.org/10.1256/qj.03.61, 2004.
Karol, Y., Tanré, D., Goloub, P., Vervaerde, C., Balois, J. Y., Blarel, L., Podvin, T., Mortier, A., and Chaikovsky, A.: Airborne sun photometer PLASMA: concept, measurements, comparison of aerosol extinction vertical profile with lidar, Atmos. Meas. Tech., 6, 2383–2389, https://doi.org/10.5194/amt-6-2383-2013, 2013.
Keil, A. and Haywood J. M.: Solar radiative forcing by biomass burning aerosol particles during SAFARI 2000: A case study based on measured aerosol and cloud properties, J. Geophys. Res., 108, 8467, https://doi.org/10.1029/2002JD002315, 2003.
Klett, J. D.: Stable Analytical Inversion Solution for Processing Lidar Returns, Appl. Opt., 20, 211–220, https://doi.org/10.1364/AO.20.000211, 1981.
Lack, D. A., Langridge, J. M., Bahreinia, R., Cappa, C. D., Middlebrook, A. M., and Schwarz, J. P.: Brown carbon and internal mixing in biomass burning particles, P. Natl. Acad. Sci. USA, 109, 1481–1486, https://doi.org/10.1073/pnas.1206575109, 2012.
Lu, Z., Liu, X., Zhang, Z., Zhao, C., Meyer, K., Rajapakshe, C., Wu, C., Yang, Z., and Penner, J. E.: Biomass smoke from Southern Africa can significantly enhance the brightness of stratocumulus over the southeastern Atlantic Ocean, P. Natl. Acad. Sci. USA, 115, 2924–2929, https://doi.org/10.1073/pnas.1713703115, 2018.
Magi, B. I., Fu Q., Redemann J., and Schmid, B.: Using aircraft measurements to estimate the magnitude and uncertainty of the shortwave direct radiative forcing of southern African biomass burning aerosol, J. Geophys. Res., 113, D5, https://doi.org/10.1029/2007JD009258, 2008.
Mallet, M., Dulac, F., Formenti, P., Nabat, P., Sciare, J., Roberts, G., Pelon, J., Ancellet, G., Tanré, D., Parol, F., Denjean, C., Brogniez, G., di Sarra, A., Alados-Arboledas, L., Arndt, J., Auriol, F., Blarel, L., Bourrianne, T., Chazette, P., Chevaillier, S., Claeys, M., D'Anna, B., Derimian, Y., Desboeufs, K., Di Iorio, T., Doussin, J.-F., Durand, P., Féron, A., Freney, E., Gaimoz, C., Goloub, P., Gómez-Amo, J. L., Granados-Muñoz, M. J., Grand, N., Hamonou, E., Jankowiak, I., Jeannot, M., Léon, J.-F., Maillé, M., Mailler, S., Meloni, D., Menut, L., Momboisse, G., Nicolas, J., Podvin, T., Pont, V., Rea, G., Renard, J.-B., Roblou, L., Schepanski, K., Schwarzenboeck, A., Sellegri, K., Sicard, M., Solmon, F., Somot, S., Torres, B., Totems, J., Triquet, S., Verdier, N., Verwaerde, C., Waquet, F., Wenger, J., and Zapf, P.: Overview of the Chemistry-Aerosol Mediterranean Experiment/Aerosol Direct Radiative Forcing on the Mediterranean Climate (ChArMEx/ADRIMED) summer 2013 campaign, Atmos. Chem. Phys., 16, 455–504, https://doi.org/10.5194/acp-16-455-2016, 2016.
Mallet, M., Nabat, P., Zuidema, P., Redemann, J., Sayer, A. M., Stengel, M., Schmidt, S., Cochrane, S., Burton, S., Ferrare, R., Meyer, K., Saide, P., Jethva, H., Torres, O., Wood, R., Saint Martin, D., Roehrig, R., Hsu, C., and Formenti, P.: Simulation of the transport, vertical distribution, optical properties and radiative impact of smoke aerosols with the ALADIN regional climate model during the ORACLES-2016 and LASIC experiments, Atmos. Chem. Phys., 19, 4963–4990, https://doi.org/10.5194/acp-19-4963-2019, 2019.
Mallet, M., Solmon, F., Nabat, P., Elguindi, N., Waquet, F., Bouniol, D., Sayer, A. M., Meyer, K., Roehrig, R., Michou, M., Zuidema, P., Flamant, C., Redemann, J., and Formenti, P.: Direct and semi-direct radiative forcing of biomass-burning aerosols over the southeast Atlantic (SEA) and its sensitivity to absorbing properties: a regional climate modeling study, Atmos. Chem. Phys., 20, 13191–13216, https://doi.org/10.5194/acp-20-13191-2020, 2020.
Mallet, M., Nabat, P., Johnson, B., Michou, M., Haywood, J. M., Chen, C., and Dubovik, O.: Climate models generally underrepresent the warming by Central Africa biomass-burning aerosols over the Southeast Atlantic, Sci. Adv., 7, eabg9998, https://doi.org/10.1126/sciadv.abg9998, 2021.
Meloni, D., di Sarra, A., Brogniez, G., Denjean, C., De Silvestri, L., Di Iorio, T., Formenti, P., Gómez-Amo, J. L., Gröbner, J., Kouremeti, N., Liuzzi, G., Mallet, M., Pace, G., and Sferlazzo, D. M.: Determining the infrared radiative effects of Saharan dust: a radiative transfer modelling study based on vertically resolved measurements at Lampedusa, Atmos. Chem. Phys., 18, 4377–4401, https://doi.org/10.5194/acp-18-4377-2018, 2018.
Meyer, K., Platnick, S., Oreopoulos, L., and Lee, D.: Estimating the direct radiative effect of absorbing aerosols overlying marine boundary layer clouds in the southeast Atlantic using MODIS and CALIOP, J. Geophys. Res.-Atmos., 118, 4801–4815, https://doi.org/10.1002/jgrd.50449, 2013.
Peers, F., Waquet, F., Cornet, C., Dubuisson, P., Ducos, F., Goloub, P., Szczap, F., Tanré, D., and Thieuleux, F.: Absorption of aerosols above clouds from POLDER/PARASOL measurements and estimation of their direct radiative effect, Atmos. Chem. Phys., 15, 4179–4196, https://doi.org/10.5194/acp-15-4179-2015, 2015.
Peers, F., Bellouin, N., Waquet, F., Ducos, F., Goloub, P., Mollard, J., Myhre, G., Skeie, R. B., Takemura, T., Tanré, D., Thieuleux, F., and Zhang, K.: Comparison of aerosol optical properties above clouds between POLDER and AeroCom models over the South East Atlantic Ocean during the fire season, Geophys. Res. Lett., 43, 3991–4000, https://doi.org/10.1002/2016GL068222, 2016.
Peers, F., Francis, P., Fox, C., Abel, S. J., Szpek, K., Cotterell, M. I., Davies, N. W., Langridge, J. M., Meyer, K. G., Platnick, S. E., and Haywood, J. M.: Observation of absorbing aerosols above clouds over the south-east Atlantic Ocean from the geostationary satellite SEVIRI – Part 1: Method description and sensitivity, Atmos. Chem. Phys., 19, 9595–9611, https://doi.org/10.5194/acp-19-9595-2019, 2019.
Perrin, T.: AEROCLO-sA F20 Core Instruments, Baobab [data set], https://doi.org/10.6096/AEROCLO.1754, 2018.
Perrin, T.: AEROCLO-sA F20 Dropsondes, Baobab [data set], https://doi.org/10.6096/AEROCLO.1777, 2019.
Pilewskie, P., Pommier, J., Bergstrom, R., Gore, W., Howard, S., Rabbette, M., Schmid, B., Hobbs, P. V., and Tsay, S. C.: Solar spectral radiative forcing during the Southern African Regional Science Initiative, J. Geophys. Res., 108, 8486, https://doi.org/10.1029/2002JD002411, D13, 2003.
Pistone, K., Redemann, J., Doherty, S., Zuidema, P., Burton, S., Cairns, B., Cochrane, S., Ferrare, R., Flynn, C., Freitag, S., Howell, S. G., Kacenelenbogen, M., LeBlanc, S., Liu, X., Schmidt, K. S., Sedlacek III, A. J., Segal-Rozenhaimer, M., Shinozuka, Y., Stamnes, S., van Diedenhoven, B., Van Harten, G., and Xu, F.: Intercomparison of biomass burning aerosol optical properties from in situ and remote-sensing instruments in ORACLES-2016, Atmos. Chem. Phys., 19, 9181–9208, https://doi.org/10.5194/acp-19-9181-2019, 2019.
Pistone, K., Zuidema, P., Wood, R., Diamond, M., da Silva, A. M., Ferrada, G., Saide, P. E., Ueyama, R., Ryoo, J.-M., Pfister, L., Podolske, J., Noone, D., Bennett, R., Stith, E., Carmichael, G., Redemann, J., Flynn, C., LeBlanc, S., Segal-Rozenhaimer, M., and Shinozuka, Y.: Exploring the elevated water vapor signal associated with the free tropospheric biomass burning plume over the southeast Atlantic Ocean, Atmos. Chem. Phys., 21, 9643–9668, https://doi.org/10.5194/acp-21-9643-2021, 2021.
Redemann, J., Wood, R., Zuidema, P., Doherty, S. J., Luna, B., LeBlanc, S. E., Diamond, M. S., Shinozuka, Y., Chang, I. Y., Ueyama, R., Pfister, L., Ryoo, J.-M., Dobracki, A. N., da Silva, A. M., Longo, K. M., Kacenelenbogen, M. S., Flynn, C. J., Pistone, K., Knox, N. M., Piketh, S. J., Haywood, J. M., Formenti, P., Mallet, M., Stier, P., Ackerman, A. S., Bauer, S. E., Fridlind, A. M., Carmichael, G. R., Saide, P. E., Ferrada, G. A., Howell, S. G., Freitag, S., Cairns, B., Holben, B. N., Knobelspiesse, K. D., Tanelli, S., L'Ecuyer, T. S., Dzambo, A. M., Sy, O. O., McFarquhar, G. M., Poellot, M. R., Gupta, S., O'Brien, J. R., Nenes, A., Kacarab, M., Wong, J. P. S., Small-Griswold, J. D., Thornhill, K. L., Noone, D., Podolske, J. R., Schmidt, K. S., Pilewskie, P., Chen, H., Cochrane, S. P., Sedlacek, A. J., Lang, T. J., Stith, E., Segal-Rozenhaimer, M., Ferrare, R. A., Burton, S. P., Hostetler, C. A., Diner, D. J., Seidel, F. C., Platnick, S. E., Myers, J. S., Meyer, K. G., Spangenberg, D. A., Maring, H., and Gao, L.: An overview of the ORACLES (ObseRvations of Aerosols above CLouds and their intEractionS) project: aerosol–cloud–radiation interactions in the southeast Atlantic basin, Atmos. Chem. Phys., 21, 1507–1563, https://doi.org/10.5194/acp-21-1507-2021, 2021.
Sakaeda, N., Wood, R., and Rasch, P. J.: Direct and semidirect aerosol effects of southern African biomass burning aerosol, J. Geophys. Res., 116, D12205, https://doi.org/10.1029/2010JD015540, 2011.
Siméon, A., Waquet, F., Péré, J.-C., Ducos, F., Thieuleux, F., Peers, F., Turquety, S., and Chiapello, I.: Combining POLDER-3 satellite observations and WRF-Chem numerical simulations to derive biomass burning aerosol properties over the southeast Atlantic region, Atmos. Chem. Phys., 21, 17775–17805, https://doi.org/10.5194/acp-21-17775-2021, 2021.
Solmon, F., Elguindi, N., Mallet, M., Flamant, C., and Formenti, P.: West African monsoon precipitation impacted by the South Eastern Atlantic biomass burning aerosol outflow, npj Clim. Atmos. Sci., 4, 54, https://doi.org/10.1038/s41612-021-00210-w, 2021.
Solomon, S., Qin, D., Manning, M., Chen, Z., Marquis, M., Averyt, K. B., Tignor, M., and Miller, H. L.: Climate Change 2007: The Physical Science Basis. Contribution of Working Group I to the Fourth Assessment Report of the Intergovernmental Panel on Climate Change, Cambridge University Press, Cambridge, United Kingdom and New York, NY, USA, https://doi.org/10.1017/CBO9780511817457, 2007.
Stier, P., Schutgens, N. A. J., Bellouin, N., Bian, H., Boucher, O., Chin, M., Ghan, S., Huneeus, N., Kinne, S., Lin, G., Ma, X., Myhre, G., Penner, J. E., Randles, C. A., Samset, B., Schulz, M., Takemura, T., Yu, F., Yu, H., and Zhou, C.: Host model uncertainties in aerosol radiative forcing estimates: results from the AeroCom Prescribed intercomparison study, Atmos. Chem. Phys., 13, 3245–3270, https://doi.org/10.5194/acp-13-3245-2013, 2013.
Trenberth, K. E., Fasullo, J. T., and Kiehl, J.: Earth's Global Energy Budget, B. Am. Meteor. Soc., 90, 311–324, https://doi.org/10.1175/2008BAMS2634.1, 2009.
Waquet, F.: AEROCLO-sA F20 OSIRIS L2, Baobab [data set], https://doi.org/10.6096/AEROCLO.1802, 2019.
Waquet, F., Riedi, J., Labonnote, L. C., Goloub, P., Cairns, B., Deuzé, J-L. and Tanré, D.: Aerosol Remote Sensing over Clouds Using A-Train Observations, J. Atmos. Sci., 66, 2468–2480, https://doi.org/10.1175/2009JAS3026.1, 2009.
Waquet, F., Cornet, C., Deuzé, J.-L., Dubovik, O., Ducos, F., Goloub, P., Herman, M., Lapyonok, T., Labonnote, L. C., Riedi, J., Tanré, D., Thieuleux, F., and Vanbauce, C.: Retrieval of aerosol microphysical and optical properties above liquid clouds from POLDER/PARASOL polarization measurements, Atmos. Meas. Tech., 6, 991–1016, https://doi.org/10.5194/amt-6-991-2013, 2013a.
Waquet, F., Peers P., Ducos F., Goloub P., Platnick S. E., Riedi J., Tanré D., and Thieuleux, F.: Global analysis of aerosol properties above clouds, Geophys. Res. Lett., 40, 5809–5814. https://doi.org/10.1002/2013GL057482, 2013b.
Waquet, F., Peers, F., Ducos, F., Thieuleux, F., Deaconu, L., Chauvigné, A., and Riedi, J.: Aerosols above clouds products from POLDER/PARASOL satellite observations (AERO-AC products), ICARE, https://doi.org/10.25326/82, 2020.
Wehr, T., Kubota, T., Tzeremes, G., Wallace, K., Nakatsuka, H., Ohno, Y., Koopman, R., Rusli, S., Kikuchi, M., Eisinger, M., Tanaka, T., Taga, M., Deghaye, P., Tomita, E., and Bernaerts, D.: The EarthCARE mission – science and system overview, Atmos. Meas. Tech., 16, 3581–3608, https://doi.org/10.5194/amt-16-3581-2023, 2023.
Wilcox, E. M.: Stratocumulus cloud thickening beneath layers of absorbing smoke aerosol, Atmos. Chem. Phys., 10, 11769–11777, https://doi.org/10.5194/acp-10-11769-2010, 2010.
Wu, H., Taylor, J. W., Szpek, K., Langridge, J. M., Williams, P. I., Flynn, M., Allan, J. D., Abel, S. J., Pitt, J., Cotterell, M. I., Fox, C., Davies, N. W., Haywood, J., and Coe, H.: Vertical variability of the properties of highly aged biomass burning aerosol transported over the southeast Atlantic during CLARIFY-2017, Atmos. Chem. Phys., 20, 12697–12719, https://doi.org/10.5194/acp-20-12697-2020, 2020.
Zhang, Z., Meyer, K., Yu, H., Platnick, S., Colarco, P., Liu, Z., and Oreopoulos, L.: Shortwave direct radiative effects of above-cloud aerosols over global oceans derived from 8 years of CALIOP and MODIS observations, Atmos. Chem. Phys., 16, 2877–2900, https://doi.org/10.5194/acp-16-2877-2016, 2016.
Zuidema, P., Ping, C., Medeiros, B., Kirtman, B. P., Mechoso, R., Schneider, E. K., and Toniazzo, T.: Challenges and Prospects for Reducing Coupled Climate Model SST Biases in the Eastern Tropical Atlantic and Pacific Oceans: The U.S. CLIVAR Eastern Tropical Oceans Synthesis Working Group, B. Am. Meteorol. Soc., 97, 2305–2328, https://doi.org/10.1175/BAMS-D-15-00274.1, 2016a.
Zuidema, P., Redemann, J., Haywood, J., Wood, R., Piketh, P., Hipondoka, M., and Formenti, P.: Smoke and Clouds above the Southeast Atlantic: Upcoming Field Campaigns Probe Absorbing Aerosol's Impact on Climate, B. Am. Meteorol. Soc., 97, 1131–1135, https://doi.org/10.1175/BAMS-D-15-00082.1, 2016b.
Zuidema, P., Sedlacek, A. J., III, Flynn, C., Springston, S., Delgadillo, R., Zhang, J., Aiken, A., Koontz, A., and Muradyan, P.: The Ascension Island boundary layer in the remote southeast Atlantic is often smoky, Geophys. Res. Lett., 45, 4456–4465, https://doi.org/10.1029/2018GL078141, 2018.