the Creative Commons Attribution 4.0 License.
the Creative Commons Attribution 4.0 License.
 | 09 Sep 2025
Greenhouse gas measurement campaign of the Earth Summit Mission-2022: ground-based in situ and FTIR observations and contribution to satellite validation in the Qomolangma region
Minqiang Zhou
Minzheng Duan
Xiangjun Tian
Jinzhi Ding
Jianrong Bi
Yaoming Ma
Weiqiang Ma
Zhenhua Xi
The Qinghai–Tibetan Plateau (QTP) is a key system that impacts the global carbon balance, but greenhouse gas (GHG) mole fraction measurements in this region are limited due to the tough environment. Supported by the Second Tibetan Plateau Scientific Expedition Program, we carried out an integrated GHG measurement campaign in May 2022 as part of the Earth Summit Mission-2022 at the Qomolangma station for atmospheric and environmental observation and research (QOMS; 28.362° N, 86.949° E; 4276 m a.s.l.). In this study, the first GHG column-averaged mole fraction measurements (Xgas) at QOMS are presented, including XCO2, XCH4, XCO, and XN2O, derived from a ground-based Fourier-transform infrared spectrometer (FTIR; Bruker EM27/SUN). We then compare them to surface in situ and satellite (the TROPOspheric Monitoring Instrument, TROPOMI, and the Orbiting Carbon Observatory-2, OCO-2) measurements. The mean FTIR XCO2 and XCH4 are 7.8 ppm and 97 ppb less than those near the surface, respectively. The difference between OCO-2 land nadir and EM27/SUN XCO2 measurements is 0.21 ± 0.98 ppm, which is consistent with OCO-2 retrieval uncertainty. However, a relatively large bias (1.21 ± 1.29 ppm) is found for OCO-2 glint XCO2 measurements, which is related to the surface albedos and surface altitudes. The EM27/SUN measurements indicate that the uncertainty in OCO-2 satellite XCO2 measurements is relatively large in the QTP mountain region, and its quality needs to be further assessed. The difference between FTIR and TROPOMI XCO measurements is −5.06 ± 5.36 (1σ) ppb (−4.7 ± 5.1 %) within the satellite retrieval uncertainty. The XCO measurements at QOMS show that the local air mass is largely influenced by atmospheric transport from southern Asia, and it is important to carry out long-term measurements to quantify the contribution of the cross-regional transport in this region.
- Article
(7447 KB) - Full-text XML
- BibTeX
- EndNote


The Qinghai–Tibetan Plateau (QTP) plays an important role in regional and global climate systems (Ge et al., 2017; Tada et al., 2016; Zhang et al., 2021). The high mountains in the QTP, including the Earth's highest summit (Mt. Qomolangma; 8848.86 m a.s.l.), strongly affect the atmospheric thermodynamic and dynamic conditions. On the other hand, environmental changes, including human activities, atmospheric warming, and cryosphere thaw, can in turn have significant impacts on the hydrology, ecosystems, and biogeochemistry in the QTP (Rui et al., 2011; Wu et al., 2021; Zhang et al., 2015). The QTP has abundant original forest and soil resources and serves as a huge carbon storage area (Ding et al., 2016; Jia et al., 2021; Wang et al., 2020). A small change in carbon storage of the QTP could have an impact on the global carbon balance. However, there is still large uncertainty regarding the terrestrial ecosystem carbon sink in the QTP (Wang et al., 2021; Piao et al., 2022). The uncertainties associated with eddy covariance data processing may lead to an overestimation of the carbon sink (Wang et al., 2022). Using a “top-down” approach can help us to estimate the carbon sink in the QTP (Jiang et al., 2016). However, limited greenhouse gas (GHG) measurements are currently available in this region because of the tough environment (Guo et al., 2020; Liu et al., 2021; Zhou et al., 2023).
To better understand the level of and temporal variation in the atmospheric GHG mole fraction over the QTP, we carried out an integrated GHG measurement campaign at the Qomolangma station for atmospheric and environmental observation and research, Chinese Academy of Sciences (QOMS), in May 2022 as part of the Second Tibetan Plateau Scientific Expedition Program (Earth Summit Mission-2022). During this campaign, a compact Fourier-transform infrared spectrometer (FTIR), Bruker EM27/SUN, was applied to retrieve the column-averaged dry-air mole fraction of CO2, CH4, CO, and N2O (XCO2, XCH4, XCO, and XN2O) at QOMS between 5 and 24 May 2022. The FTIR measures the GHG columns, which are less affected by the local meteorological parameters, such as the boundary layer height and wind turbulence (Wunch et al., 2011; Zhou et al., 2018). The ground-based FTIR GHG measurement is widely used to validate satellite observation because of its high precision and similar measurement technique to the satellite (Zhou et al., 2016; Wunch et al., 2017; Sha et al., 2021). In addition, a gas analyzer (ABB Ultra-Portable Greenhouse Gas Analyzer; GLA132), using an off-axis integrated cavity output spectroscopy (OA-ICOS) technique, was applied to measure the CO2 and CH4 mole fractions near the surface. In the following sections, we will give an introduction to the observation site and present the XCO2, XCH4, XCO, and XN2O derived from the EM27/SUN FTIR spectra at QOMS. The results from the in situ and ground-based FTIR measurements are shown in Sect. 3. In Sect. 4, the in situ surface measurements are compared to the FTIR column measurements. Moreover, the FTIR measurements are then compared to independent satellite observations. Finally, the conclusions are drawn in Sect. 5.
2.1 The QOMS site
The QOMS (latitude 28.362° N, longitude 86.949° E; elevation of 4276 m a.s.l.) is situated approximately 30 km away from the Everest Base Camp and around 650 km from Lhasa (Fig. 1). The station is located about 3 km to the south of the local village, in an area with minimal human influence. The surface of the station is flat, and it is mainly covered by sand and gravel with sparse vegetation. For more information about the QOMS, refer to Ma et al. (2023).
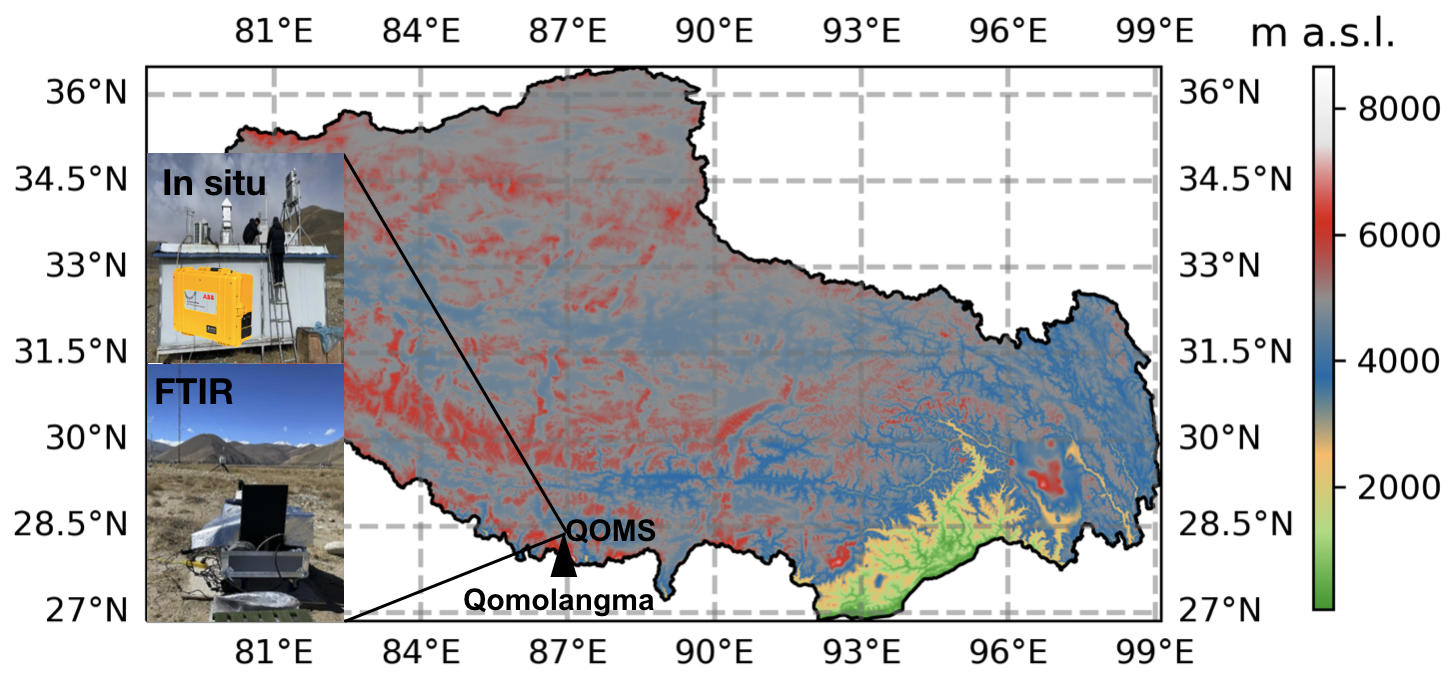
Figure 1The integrated GHG measurement campaign carried out at the Qomolangma station for atmospheric and environmental observation (QOMS) in May 2022 including both the FTIR remote sensing and surface in situ measurements.
2.2 Ground-based FTIR
A Bruker EM27/SUN FTIR was operated at QOMS between 5 and 24 May. The measurement settings of the EM27/SUN follow the guidance of the COllaborative Carbon Column Observing Network (COCCON), which records the direct solar absorption spectra between 4000 and 12 000 cm−1 with a spectral resolution of 0.5 cm−1 using two InGaAs detectors (Frey et al., 2019). The advanced retrieval algorithm GGG2020 is applied to retrieve the O2 and GHG (CO2, CH4, CO, and N2O) total columns, and then Xgas is calculated as 0.2095 (TCGHG ). Using the ratio between the target species and O2 can reduce the same uncertainty from the instrumental and atmospheric parameters (Yang et al., 2002). GGG2020 is commonly used in the ground-based GHG remote sensing community, and it includes (1) the conversion from interferogram to spectrum with the brightness fluctuation correction (Keppel-Aleks et al., 2012), (2) a non-linear least-squares fitting code (GFIT), and (3) a post-correction procedure to reduce the retrieval uncertainty resulting from spectroscopy and observation geometry (Laughner et al., 2023). We observed the EM27/SUN instrument line shape (ILS) parameters before and after the campaign in the lab. Both the modulation efficiency and phase error remained almost unchanged before and after the campaign, reflecting the fact that the instrument was well protected during the long-distance transportation. Table A1 shows that the systematic/random uncertainties in CO2, CH4, CO, and N2O column retrievals are 2.0 %/0.2 %, 2.0 %/0.2 %, 2.0 %/0.9 %, and 2.0 %/1.2 %, respectively. The systematic uncertainty is dominated by the spectroscopy. To further reduce the systematic uncertainty in the EM27/SUN retrievals, the EM27/SUN instrument was operated at a Total Carbon Column Observing Network (TCCON) site at Xianghe (Yang et al., 2020) for 3 weeks in July–August 2022 after the campaign. Based on the co-located measurements of EM27/SUN and TCCON, the scaling factors of 1.001, 0.995, 0.970, and 1.004 have been derived and applied to correct the systematic uncertainties in the EM27/SUN XCO2, XCH4, XCO, and XN2O retrievals, respectively.
2.3 In situ
The near-surface CO2 and CH4 mole fractions were observed by the ABB GLA132 gas analyzer at QOMS continuously between 13 and 24 May 2022 (Fig. 1). To ensure the accuracy of the GHG in situ measurements, we calibrated the gas analyzer using the standard gas once per day. The precisions of the in situ measurements (1 s) are within 0.3 ppm and 2.0 ppb for CO2 and CH4, respectively (https://www.envicontrol.com/storage/app/media/uploaded-files/UGGA%20LGR%20GLA132-GGA.pdf, last access: 1 September 2025). Note that the drifts of CO2 and CH4 within 24 h of the analysis are within their measurement uncertainties.
2.4 Satellite
We use the Orbiting Carbon Observatory-2 (OCO-2) satellite level 2 bias-corrected XCO2 retrospective processing v11.2r (Kiel et al., 2019). The OCO-2 XCO2 is retrieved using the ACOS algorithm by the CO2 absorption lines around 1.61 and 2.06 µm, together with information about surface pressure, cloud, and aerosol scattering constrained by the O2 A band around 0.76 µm (O'Dell et al., 2018). For more details about the OCO-2 XCO2 data, refer to https://docserver.gesdisc.eosdis.nasa.gov/public/project/OCO/OCO_L2_ATBD.pdf (last access: 1 September 2025). The OCO-2 XCO2 uncertainty was assessed by comparison to the Total Carbon Column Observing Network (TCCON), and the absolute median difference at TCCON sites across the globe was found to be less than 0.4 ppm with the root mean square of the differences less than 1.5 ppm (Wunch et al., 2017). The footprint size of each OCO-2 pixel is 2.25 × 1.29 km2. However, the width of the swath is only about 16 km, leading to very small spatial coverage. During the campaign, there were two dates when the orbit of OCO-2 overpassed within 500 km of QOMS. These OCO-2 satellite measurements are compared to EM27/SUN FTIR measurements to assess their quality at QOMS.
Regarding CH4 and CO, we use the ESA operational offline level 2 products from the Sentinel-5 Precursor (S5-P) TROPOspheric Monitoring Instrument (TROPOMI). Unfortunately, there is almost no TROPOMI CH4 retrieval at QOMS, mainly due to the complex orography and high cloud coverage in this region (Lorente et al., 2021). Therefore, in this study, we only look at the TROPOMI XCO data. The TROPOMI XCO retrievals are derived from the reflected solar radiation in the 2.3 µm band, and the stripes of erroneous XCO retrievals are corrected by the fixed masked de-striping method (Landgraf et al., 2016; Borsdorff et al., 2019). The spatial resolution of TROPOMI measurements is 7.0 × 5.5 km2. Thanks to the large swath of about 2600 km, TROPOMI provides XCO measurements in this region at around 15:30 China standard time (CST) every day. According to the validation study made by Martínez-Alonso et al. (2022), the mean difference between TROPOMI XCO data and AirCore measurements is 2.02 ± 11.13 (1σ) %.
3.1 Ground-based FTIR column measurements
The time series of both a priori and retrieved XCO2, XCH4, XCO, and XN2O measurements from the EM27/SUN FTIR at QOMS between 5 and 24 May are shown in Fig. 2. The a priori columns of FTIR retrievals are derived from the global atmospheric chemistry model (GEOS-FPIT), which provides 6-hourly simulations with a spatial resolution of about 50 km. For more information about the GGG2020 a priori profiles, please refer to Laughner et al. (2023). Keep in mind that the FTIR provides the measurements only in the daytime and under a clear-sky condition.
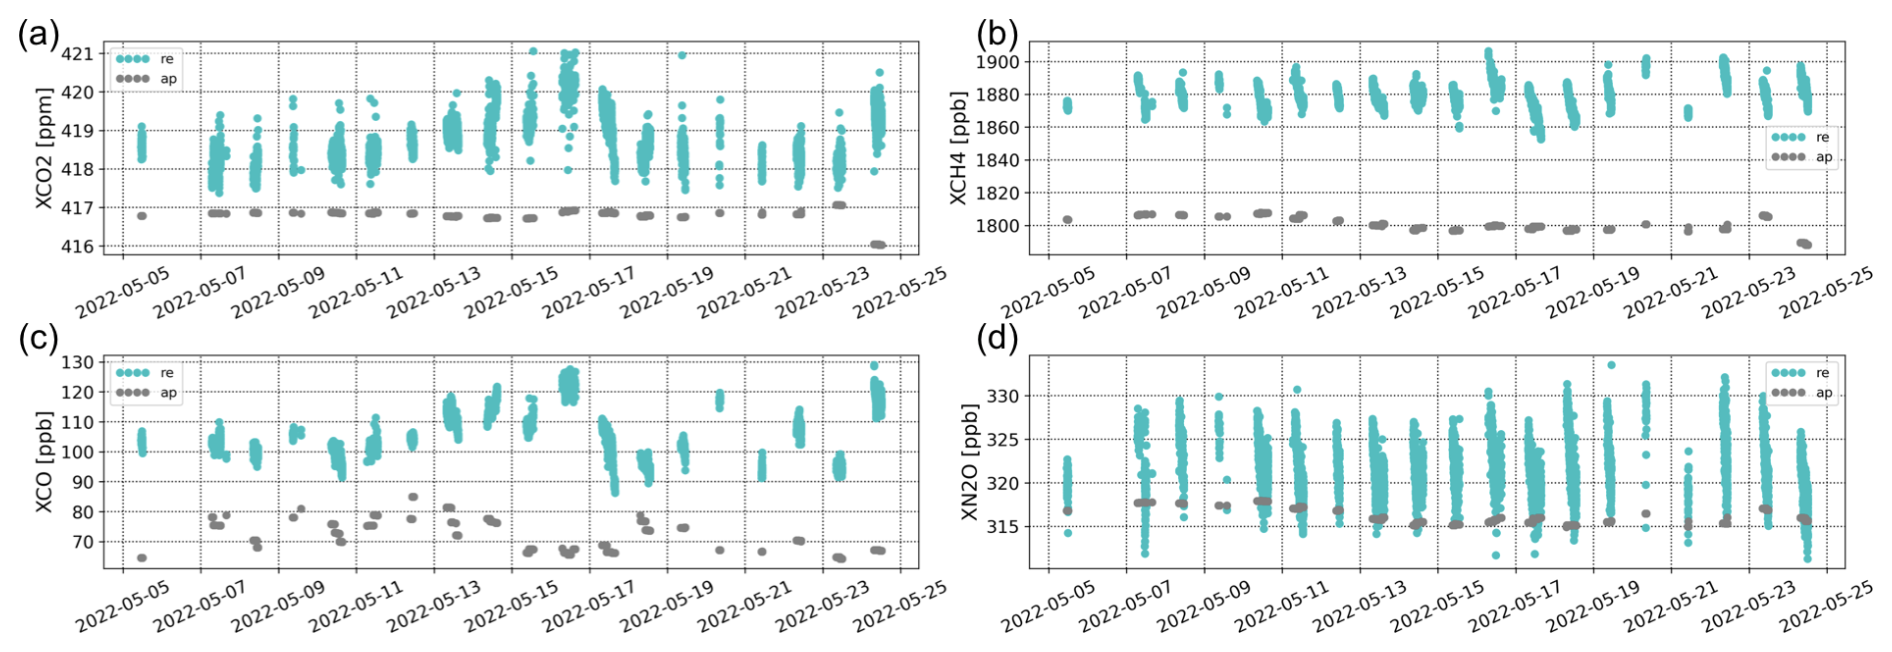
Figure 2The time series of a priori (grey dots) and retrieved (cyan dots) XCO2, XCH4, XCO, and XN2O measurements from the EM27/SUN FTIR between 5 and 24 May 2022 at QOMS.
The means and standard deviations (SDs) of XCO2, XCH4, XCO, and XN2O are 418.4 ± 0.6 ppm, 1888.3 ± 8.0 ppb, 106.2 ± 8.3 ppb, and 321.6 ± 3.2 ppb, respectively. The EM27/SUN retrieved columns are larger than the a priori columns for all these four species, indicating that the TCCON prior is systematically underestimated in this region. In addition, the amplitudes of the variations in XCO2 and XCH4 derived from the EM27/SUN measurements are larger than those of the model simulations. Moreover, the day-to-day variations in these species are not well captured by the GEOS-FPIT model; for example, the maximum XCO value observed by the FTIR measurements on 16 May is not well simulated in the model. The means of XCO2, XCH4, and XCO observed at QOMS are also compared to measurements at seven TCCON sites (Hase et al., 2023; Té et al., 2022; Warneke et al., 2022; Wennberg et al., 2022a, b; Zhou et al., 2022; García et al., 2022) in the Northern Hemisphere during the same time period (Table 1). The mean XCO2 at QOMS is lowest among these sites, about 1.5–3.5 ppm less than urban sites and about 0.5–1.5 ppm less than suburban sites and the mountain site (Izaña). The XCH4 and XCO observed at QOMS are less than those at Xianghe and Caltech but larger than those of other TCCON sites.
Table 1The means and SDs of the XCO2, XCH4, and XCO measurements at six TCCON sites in the Northern Hemisphere, together with our EM27/SUN measurements at QOMS. N is the number of measurements at each site between 5 and 24 May 2022.
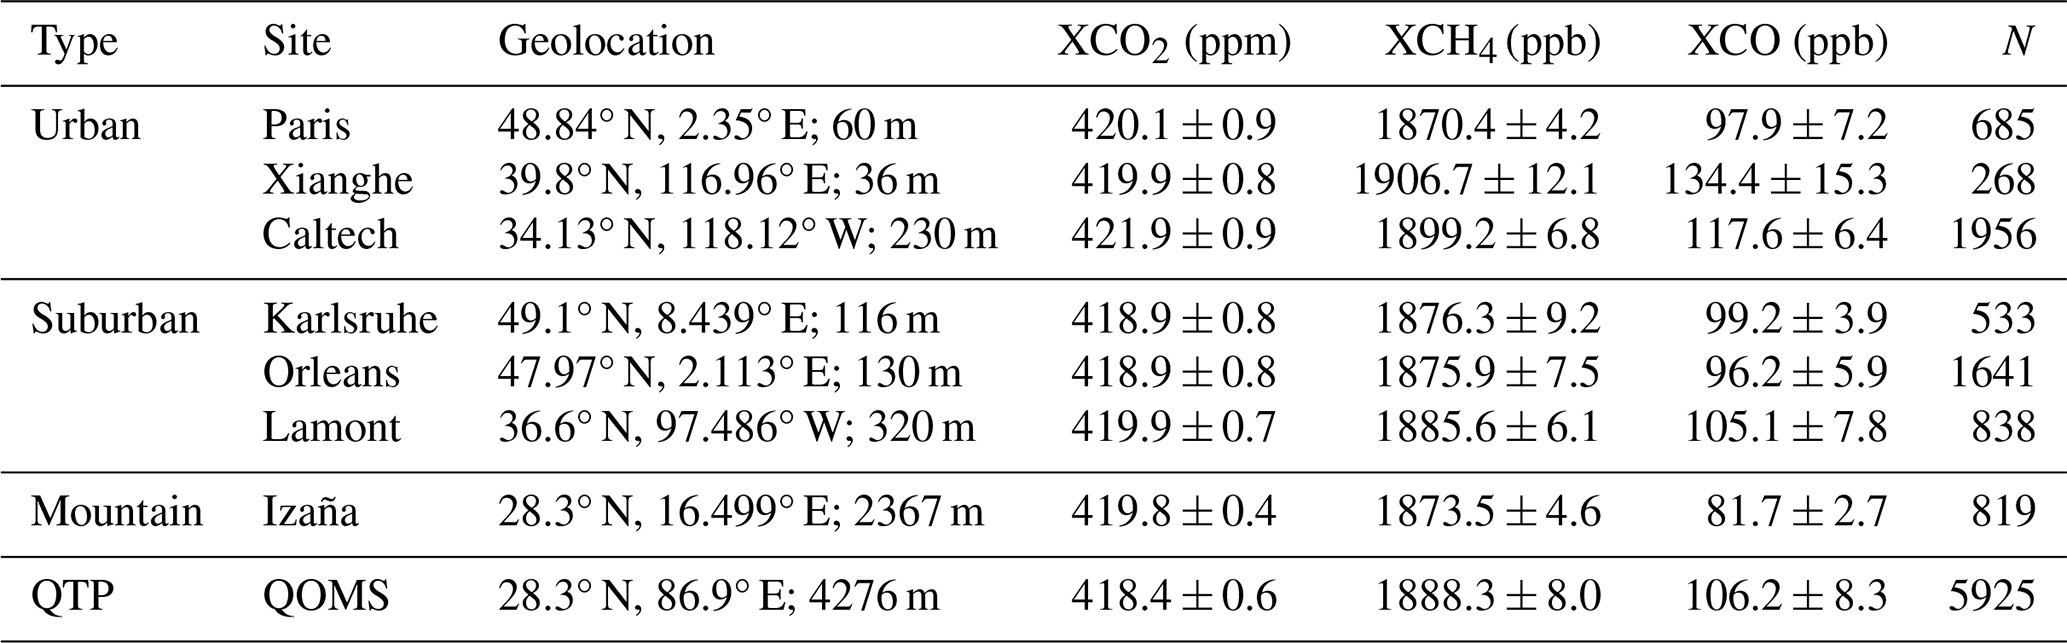
Figure 3 shows the covariance matrix among these four species observed by the EM27/SUN measurements. Good correlations are found between XCO2 and XCO (R = 0.79; p value < 0.001), XCH4 and XCO (R = 0.63; p value < 0.01), and XCH4 and XN2O (R = 0.77; p value < 0.001). However, the correlations are relatively weak between XCO2 and XCH4 (R = 0.16; p value = 0.50), XCO2 and XN2O (R = −0.20; p value = 0.41), and XCO and XN2O (R = 0.19; p value = 0.43). The good correlation between XCH4 and XN2O is probably due to their similar physical and chemical process in the stratosphere (Wang et al., 2014; Ji et al., 2020).
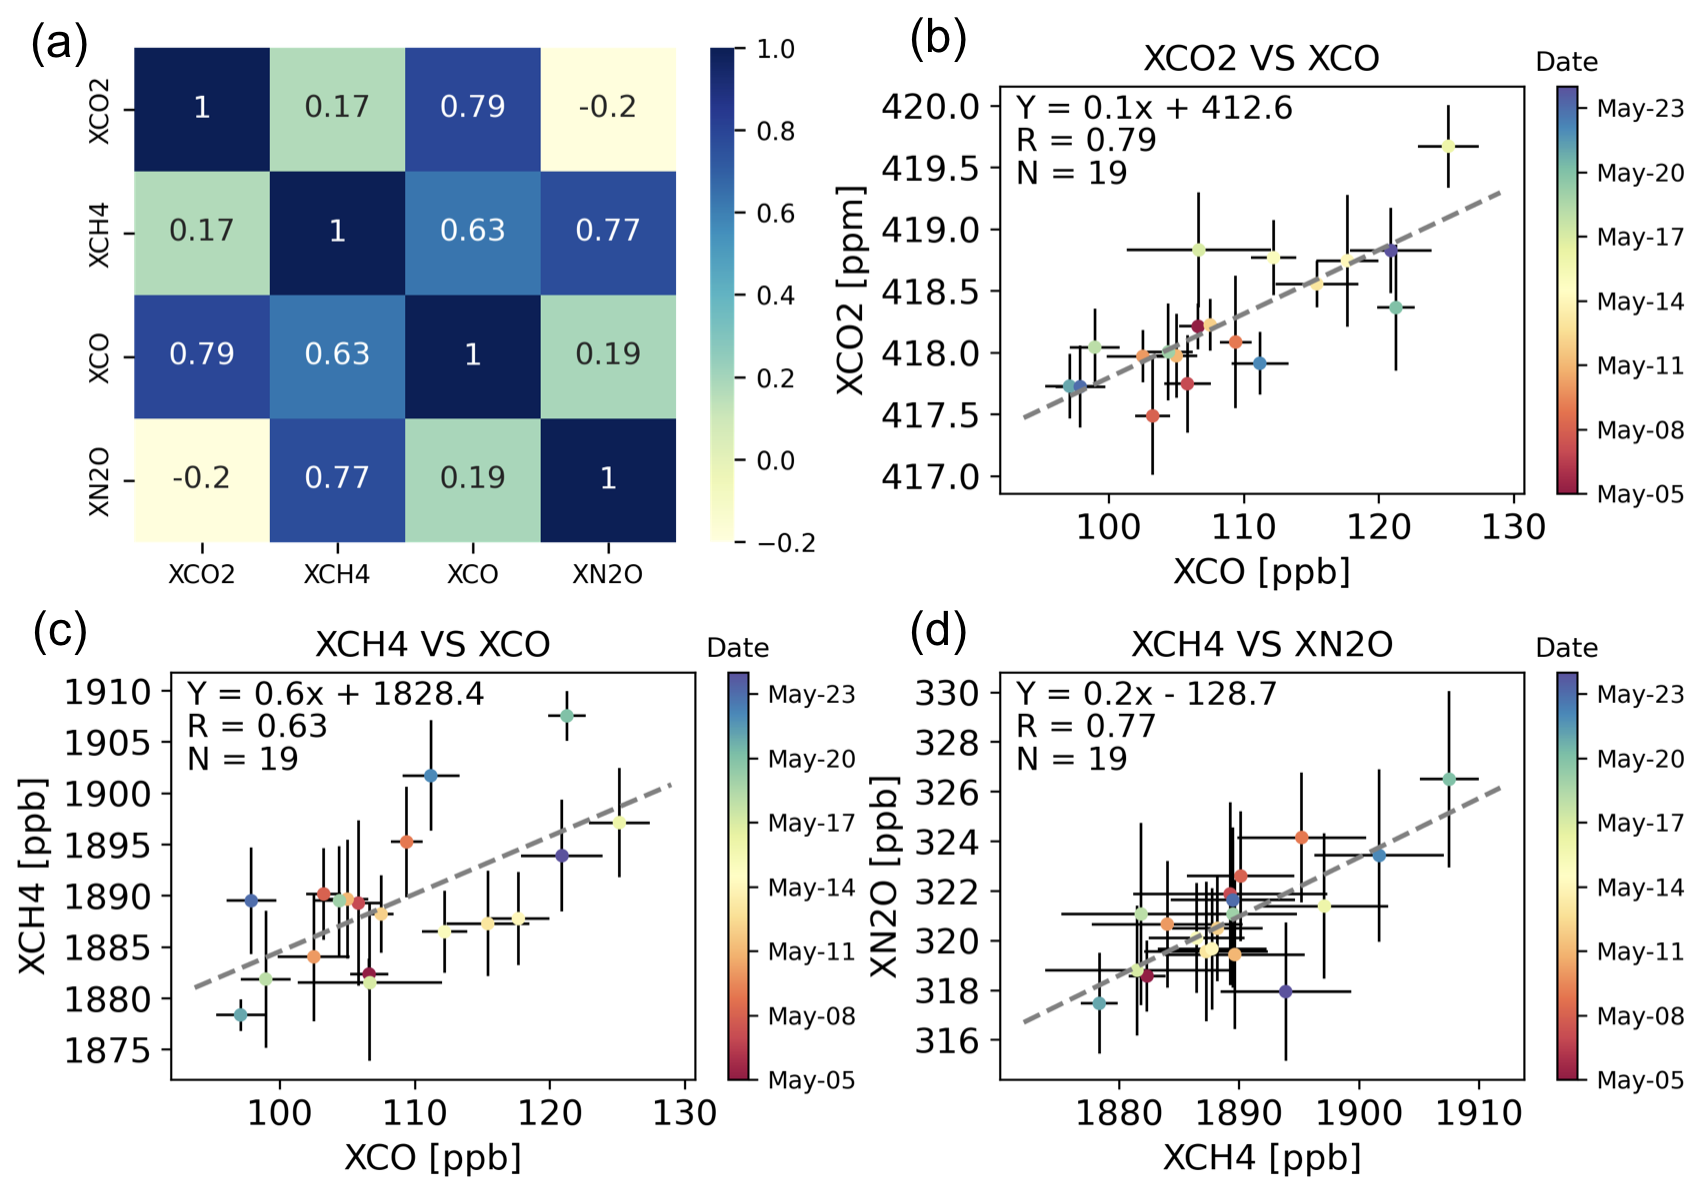
Figure 3The correlation matrix among XCO2, XCH4, XCO, and XN2O observed by the EM27/SUN measurements between 5 and 24 May 2022 at QOMS (a), together with the scatterplots between XCO2 and XCO daily means (b), between XCH4 and XCO daily means (c), and XCH4 and XN2O daily means (d). In each scatterplot, the error bar denotes the daily SD, the dashed line is the linear regression, R is the Pearson correlation coefficient, and N is the number of co-located measurements. The dot is colored by the measurement date.
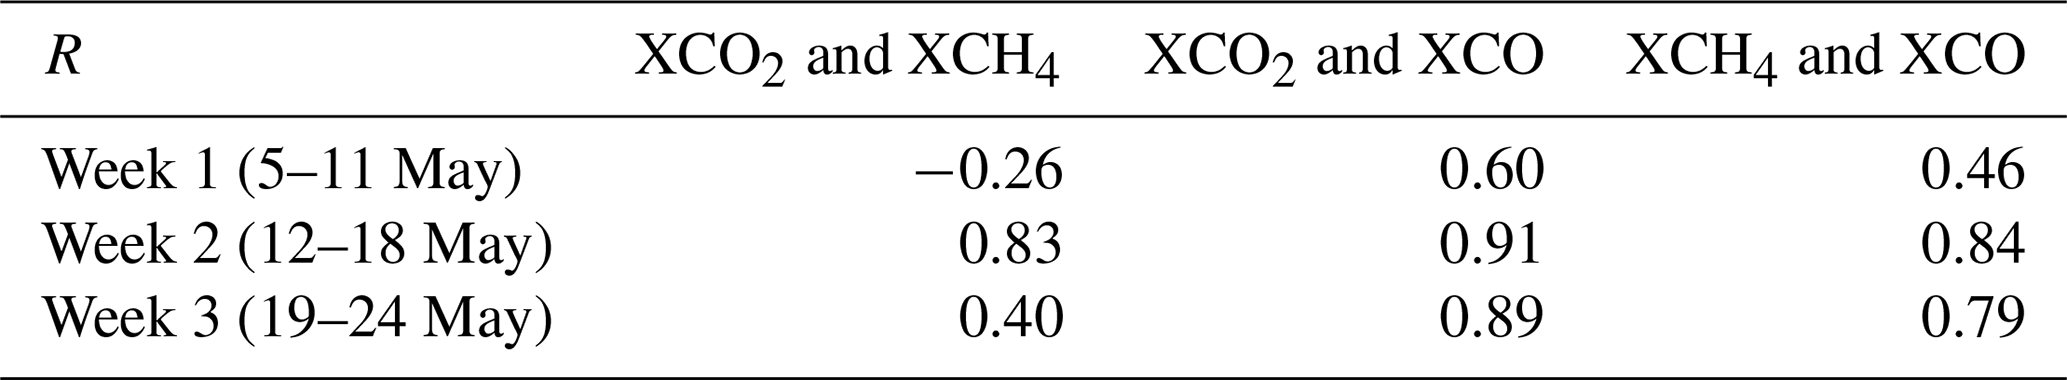
The EM27/SUN measurements indicate that XCO is a good tracer for both XCO2 and XCH4 at QOMS, while the R between XCO2 and CH4 is only 0.17. To better understand this, we separate the time period into 3 weeks (Table 2). The R values are relatively low in the first week, especially between XCO2 and XCH4. The day-to-day variations in these species are pretty low in the first week (Fig. 2). In the second week, large enhancements of the three species on 16 May are observed simultaneously, resulting in large R values. In the third week, strong vibrations in XCO2, XCH4, and XCO are observed, but unlike a single large enhancement in the second week, the enhancements in this week are discontinuous. The R values in the third week are larger than those in the first week but less than those in the second week. Based on the 3 weeks, we understand that a good correlation (R = 0.83) between XCO2 and XCH4 can be also observed when a large continuous enhancement occurs. However, the correlation between XCO2 and XCH4 becomes low and even negative (R = −0.26) when the variations in XCO2 and XCH4 are low.
Table 2The correlations among XCO2, XCH4, and XCO in the first week (5–11 May), second week (12–18 May), and third week (19–24 May).
3.2 In situ CO2 and CH4 measurements near the surface
The time series of CO2 and CH4 observed by the gas analyzer at QOMS near the surface between 13 and 24 May, together with their diurnal variations, are shown in Fig. 4. The means and SDs of CO2 and CH4 are 424.2 ± 2.1 ppm and 1985.2 ± 19.7 ppb, respectively. A good correlation between CO2 and CH4 is observed, with a Pearson correlation coefficient (R) of 0.82. Similarly to the FTIR XCO2 and XCH4, the surface CO2 and CH4 mole fractions are the highest on 16 May. The mean CO2 mole fraction in the daytime is about 0.9 ppm higher than that during the night. Contrary to CO2, we observe the minimum CH4 value at around 13:00 UTC+8, which is about 12 ppb less than that at midnight.
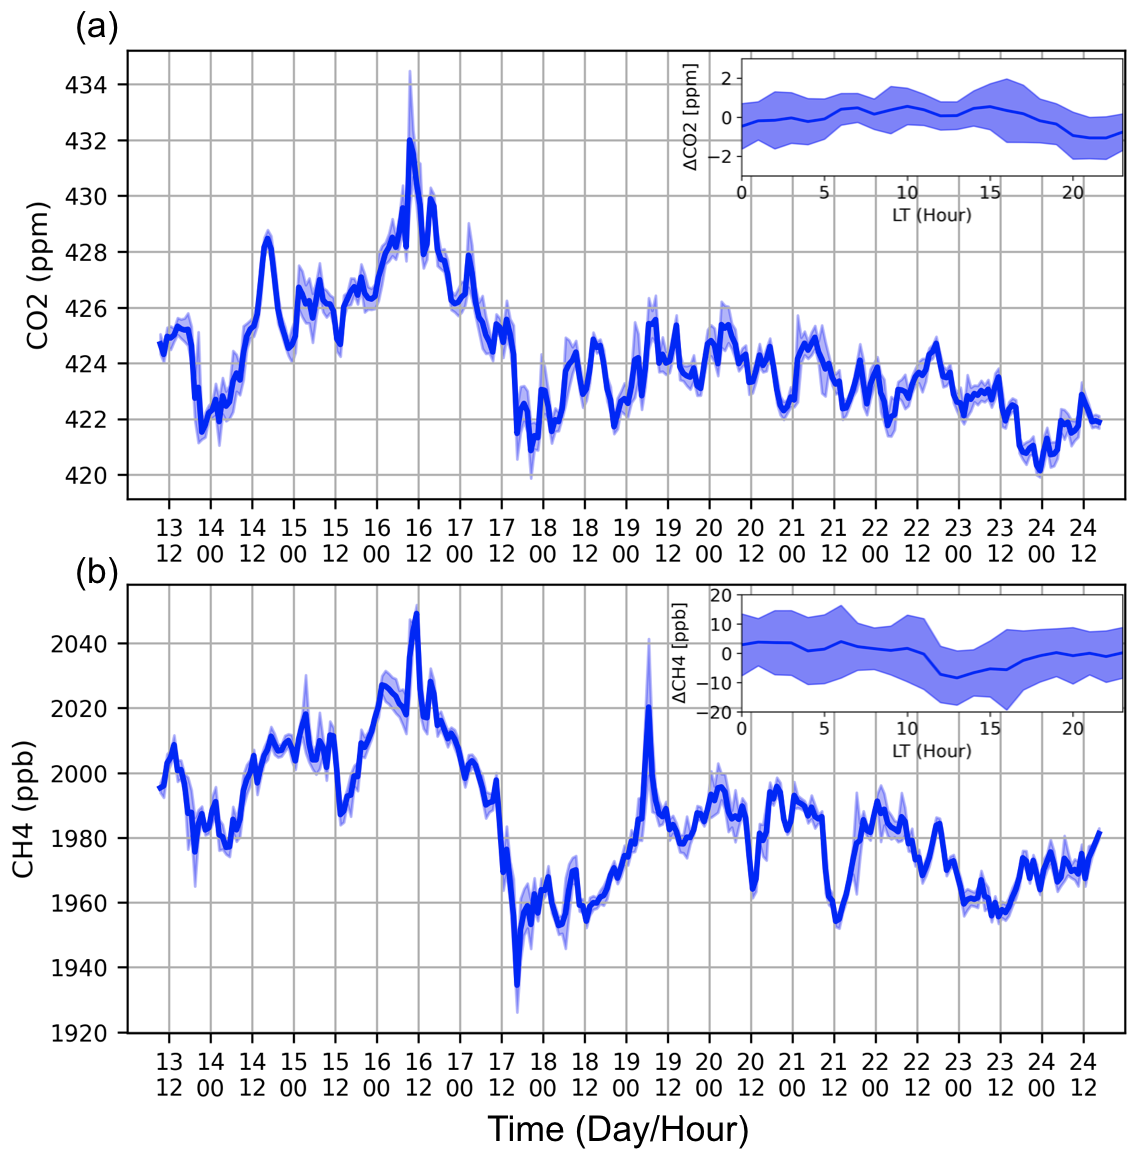
Figure 4The time series of hourly means and SDs of the CO2 (a) and CH4 (b) mole fraction observed by the gas analyzer at QOMS near the surface. The small panel in the upper-right corner shows the daily variation in CO2 and CH4, and the Δgas is derived from the measurements by subtracting the daily median.
4.1 Comparison between FTIR column and surface in situ measurements
The FTIR observes the CO2 and CH4 columns, while the in situ data provide the surface mole fractions. Do the variations in XCO2 and XCH4 differ from the surface measurements? Here, CO2 and CH4 surface mole fractions are compared with the FTIR XCO2 and XCH4 measurements (Fig. 7). To select the co-located data pair, we use the co-existing FTIR and surface hourly means. The mean CO2 surface mole fraction is 7.8 ppm larger than the XCO2, and the amplitude of the variation in CO2 surface variation during this period is 4.8 times larger than the amplitude of the variation in XCO2. According to the GEOS-FPIT model, the CO2 mole fraction decreases with altitude, especially above the tropopause height (Laughner et al., 2023). A good correlation between the surface CO2 and XCO2 is found, with an R of 0.74 (p value < 0.001). The CO2 enhancement on 16 May was observed both near the surface and in the column. We also notice that relatively high XCO2 was observed on 24 May but with low CO2 mole fractions at the surface. It is indicated that CO2 enhancement occurs at high altitudes but not at the surface.
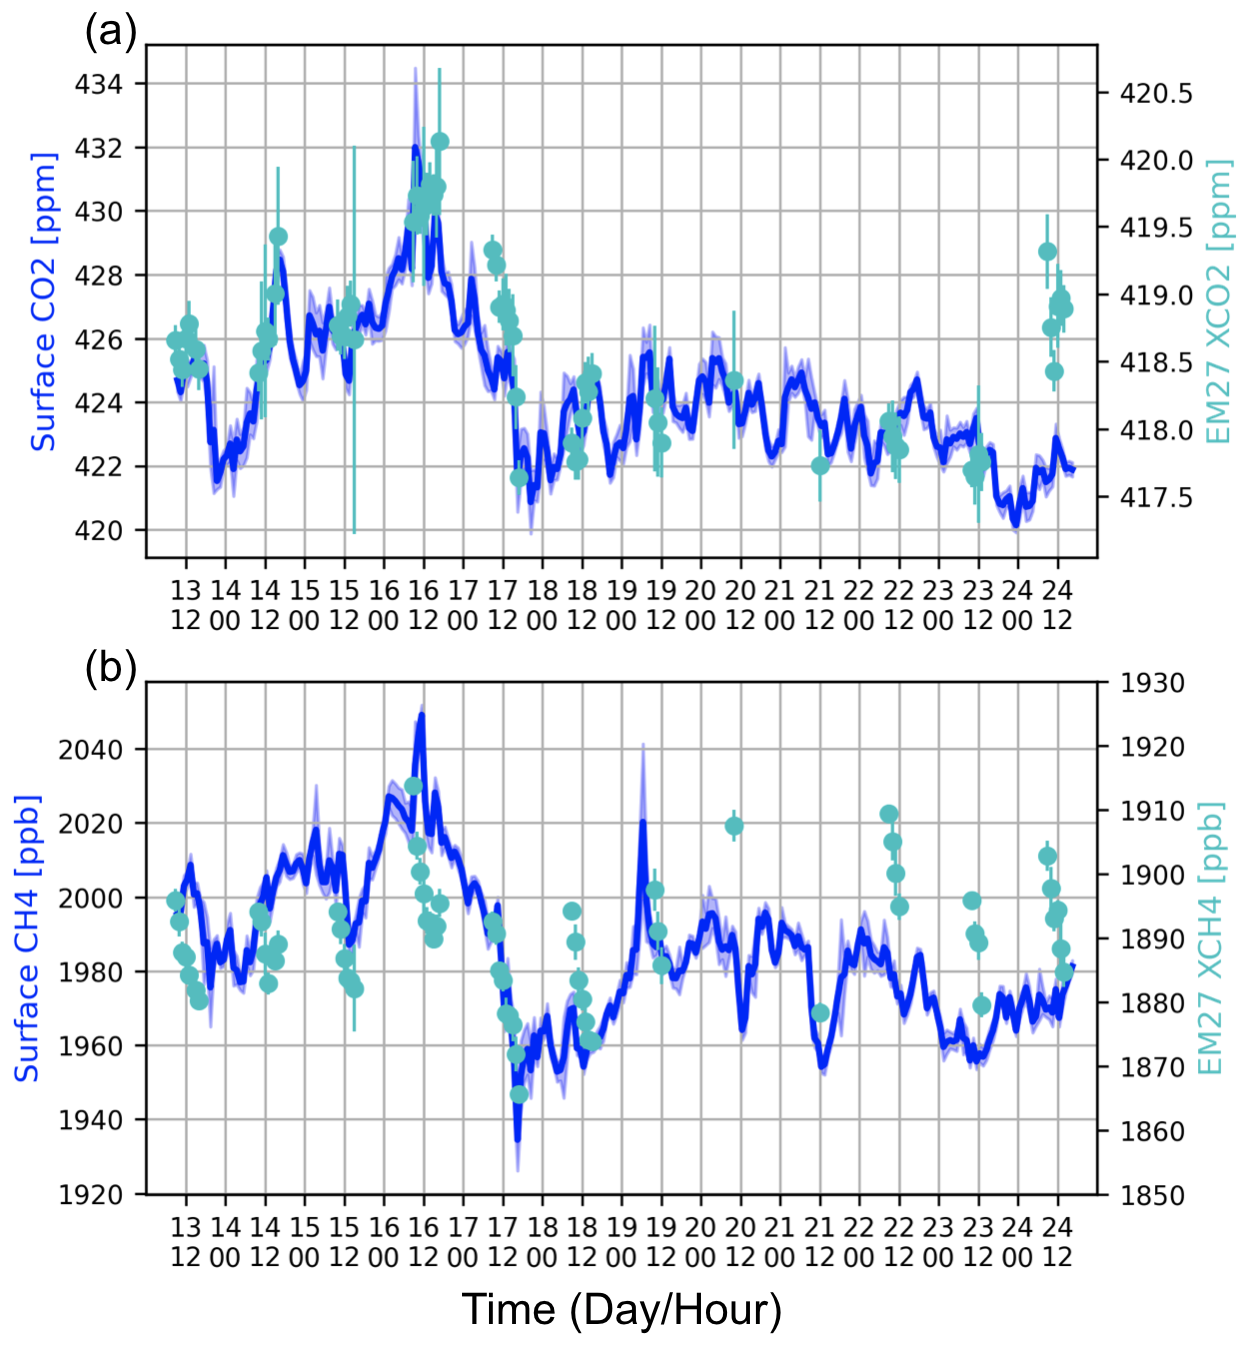
Figure 5Similar to Fig. 4 but adding the EM27/SUN FTIR XCO2 and XCH4 hourly means and SDs (right y axis) between 13 and 24 May 2022.
Similarly to CO2, the mean CH4 surface mole fraction is 97 ppb larger than the XCH4, and the amplitude of the variation in CH4 near the surface during this period is 2.9 times larger than the amplitude of the variation in XCH4. The CH4 mole fractions in the stratosphere are much lower than those in the troposphere due to chemical reaction and atmospheric dynamic transport (Sepúlveda et al., 2014; Wang et al., 2014). The correlation between the surface CH4 and XCH4 is relatively weak as compared to that between CO2 and XCO2 but still statistically significant (R = 0.41; p value < 0.01). The weak correlation in CH4 is probably due to the fact that CH4 has a much larger vertical gradient than the CO2 between the troposphere and the stratosphere (Sepúlveda et al., 2014). Therefore, vertical transport in the upper troposphere and lower stratosphere (UTLS) and horizontal transport in the stratosphere both have strong impacts on the CH4 column. Nevertheless, the CH4 enhancement on 16 May was observed both near the surface and in the column.
To better understand the enhancement of CO2 and CH4 at QOMS on 16 May, we use FLEXPART_v10.4 backward simulations (Pisso et al., 2019) to show where the sources of the air mass came from during this campaign. The main settings of the FLEXPART model are listed in Table 3. Figure 6 shows the backward sensitivities on 7, 16, and 21 May 2022. Compared to 7 and 21 May, there is a significant air mass at QOMS on 16 May coming from North India, with higher gas concentrations. It is inferred that the enhancement of the measurements on 16 May 2022 is mainly due to the atmospheric transport.
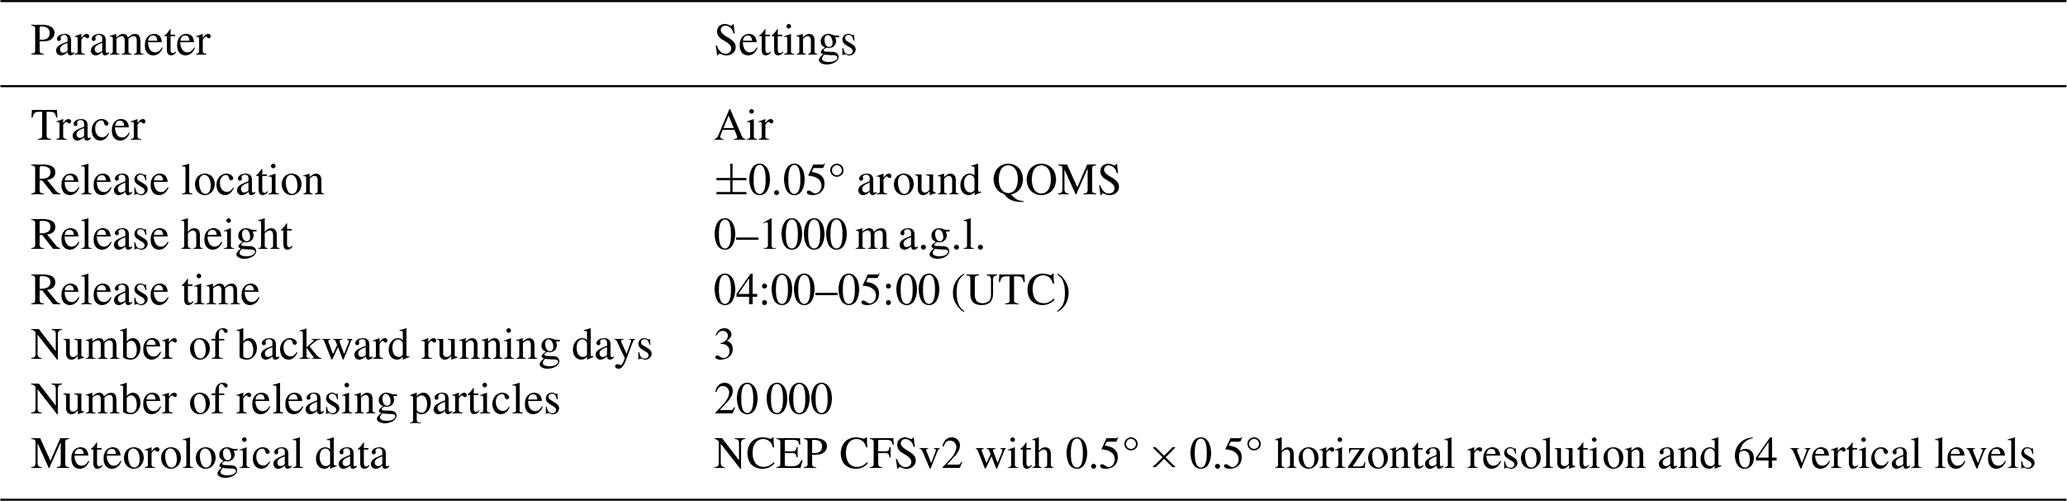
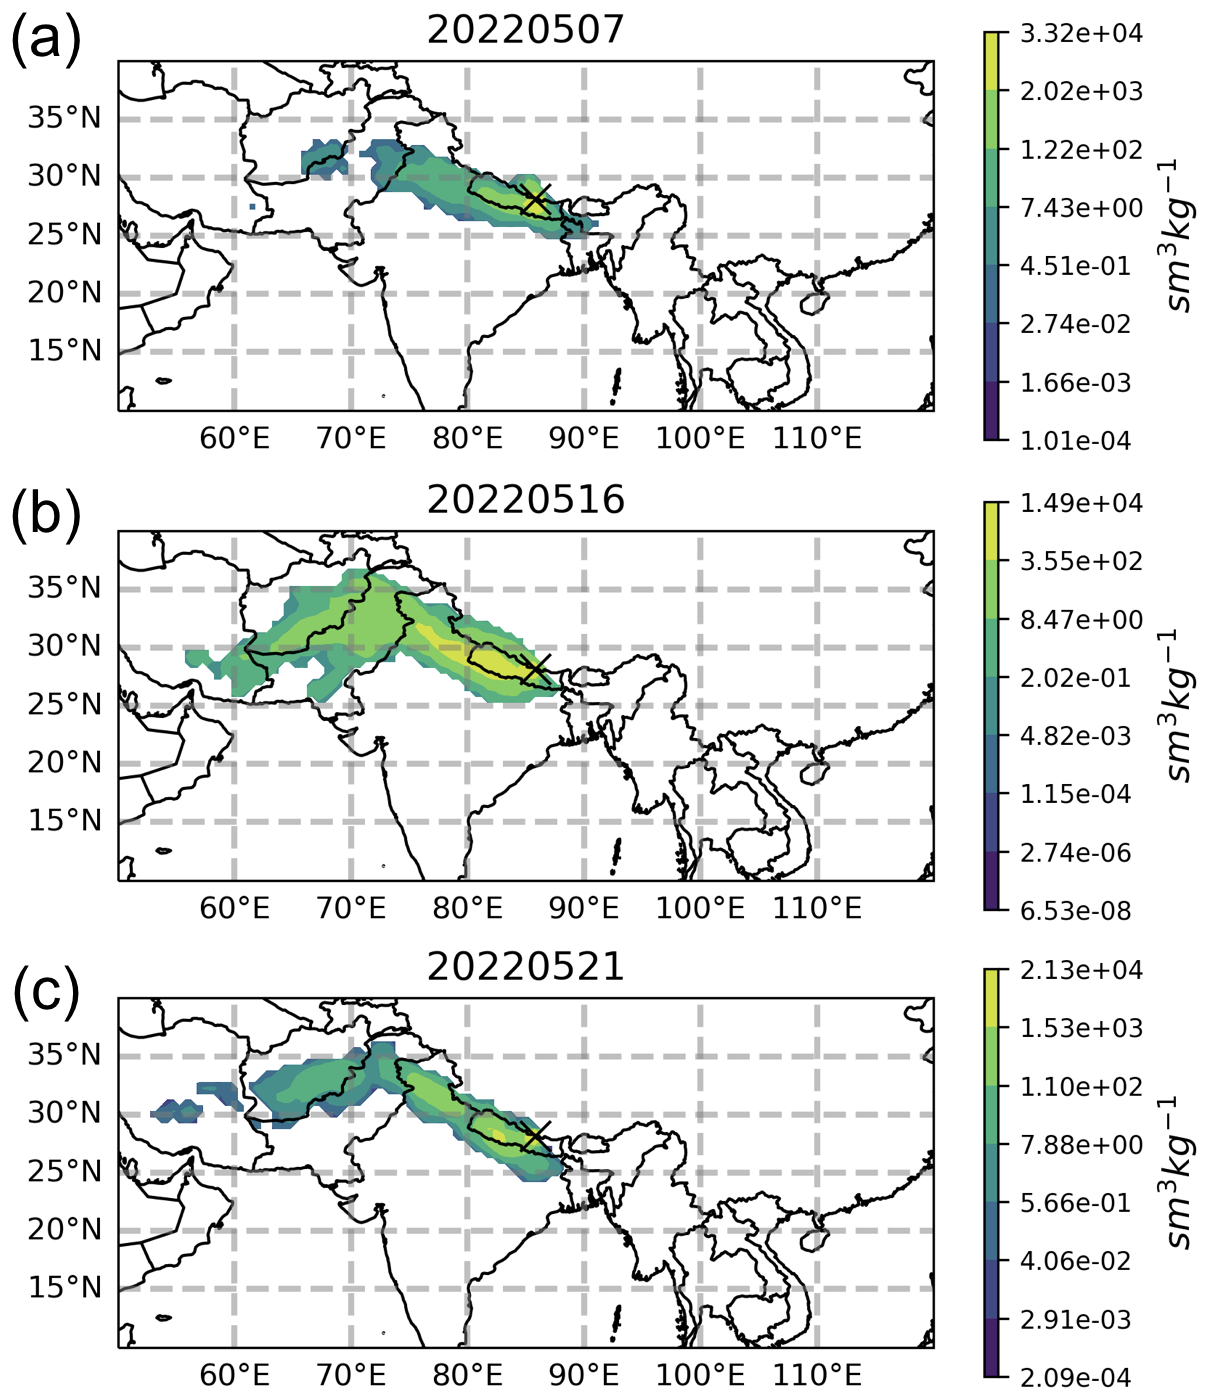
Figure 6The spatial distribution of air backward sensitivities at QOMS between 04:00 and 05:00 (UTC) on 7, 16, 21 May 2022. The QOMS site is marked with a cross symbol. Publisher's remark: please note that the above figure contains disputed territories.
4.2 Ground-based FTIR against TROPOMI XCO measurements
In this section, we compare the ground-based EM27/SUN FTIR measurements (GB) to the TROPOMI satellite XCO measurements (SAT) at QOMS. We use the mean of GB measurements within ±2 h of each satellite overpass time (approximately from 12:30 to 17:30 LT) and select all the satellite measurements within a certain distance of QOMS. For each SAT–GB data pair, we apply the SAT a priori profile (TM5 model) as the common prior to reduce the uncertainty caused by different a priori profiles (Rodgers and Connor, 2003). In addition, to get rid of the discrepancy caused by different surface altitudes of the FTIR and satellite measurements, the FTIR-retrieved XCO is scaled to the same vertical range of each satellite measurement (Langerock et al., 2015). Figure 7b and c show the means and SDs of the differences between co-located TROPOMI satellite and ground-based FTIR XCO measurements (SAT–GB) between 5 and 24 May, varying with the co-located distance criterion ranging from 10 to 105 km. The mean difference varies between −3.9 and −6.3 ppb. The mean difference is enlarged with increasing distance between FTIR and TROPOMI measurements, while the SD reaches a minimum (5.36 ppb) at a distance of 25 km. To ensure there are enough data pairs to get a robust comparison, we set the co-located distance to 25 km, resulting in 17 d with co-located FTIR and satellite measurements.
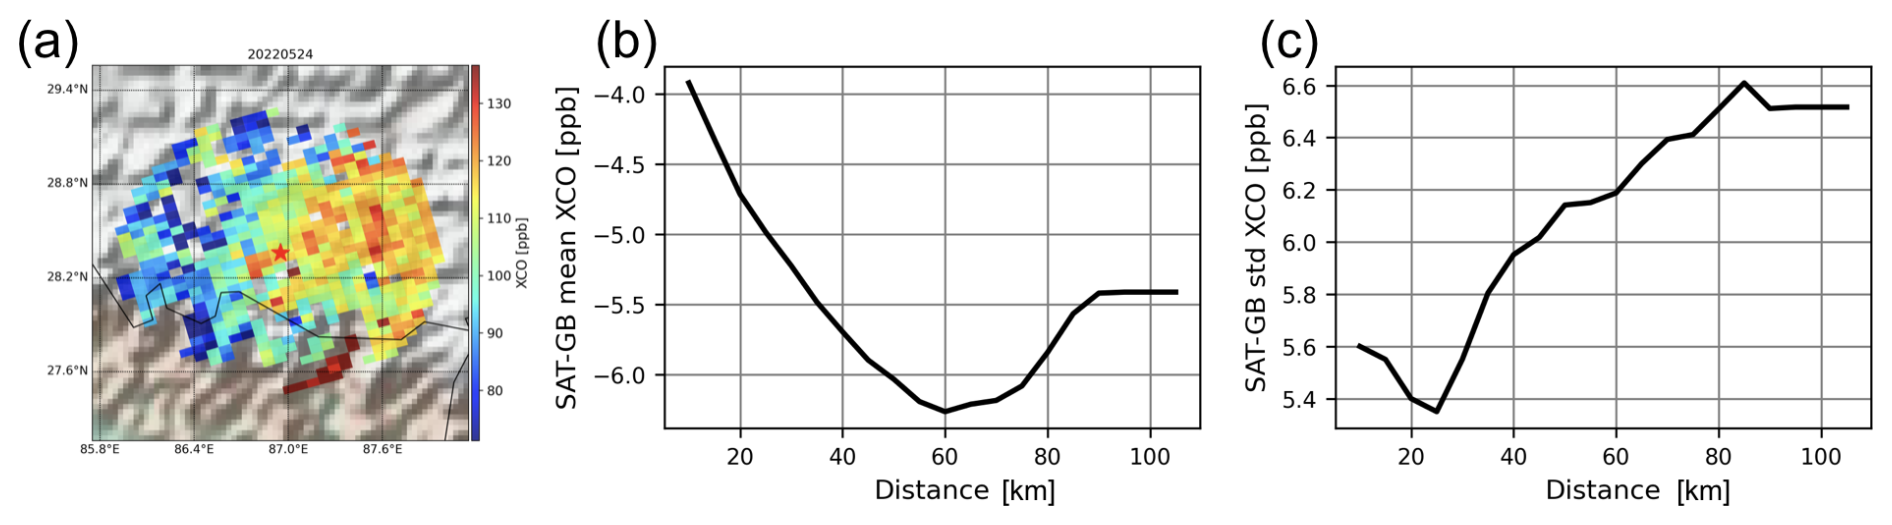
Figure 7The TROPOMI XCO measurements within 100 km of the QOMS (red star) on 24 May 2022 (a). The mean (b) and SD (c) of the differences between co-located TROPOMI satellite and ground-based EM27/SUN XCO measurements (SAT–GB) between 5 and 24 May varying with the co-located distance criterion.
The time series and scatterplot of the co-located FTIR and TROPOMI satellite XCO measurements at QOMS are shown in Fig. 8. A good correlation between FTIR and TROPOMI XCO measurements is observed, with an R value of 0.81 (p value < 0.001). The difference between FTIR and TROPOMI XCO measurements is −5.06 ± 5.36 ppb (−4.7 ± 5.1 %), which is within the S5P mission requirements with a systematic error of 15 % and random error of 10 %. The relative bias at QOMS is also comparable with other places around the world (Sha et al., 2021; Martínez-Alonso et al., 2022). The EM27/SUN measurements at QOMS thus indicate that the TROPOMI XCO data have a good performance in this region.
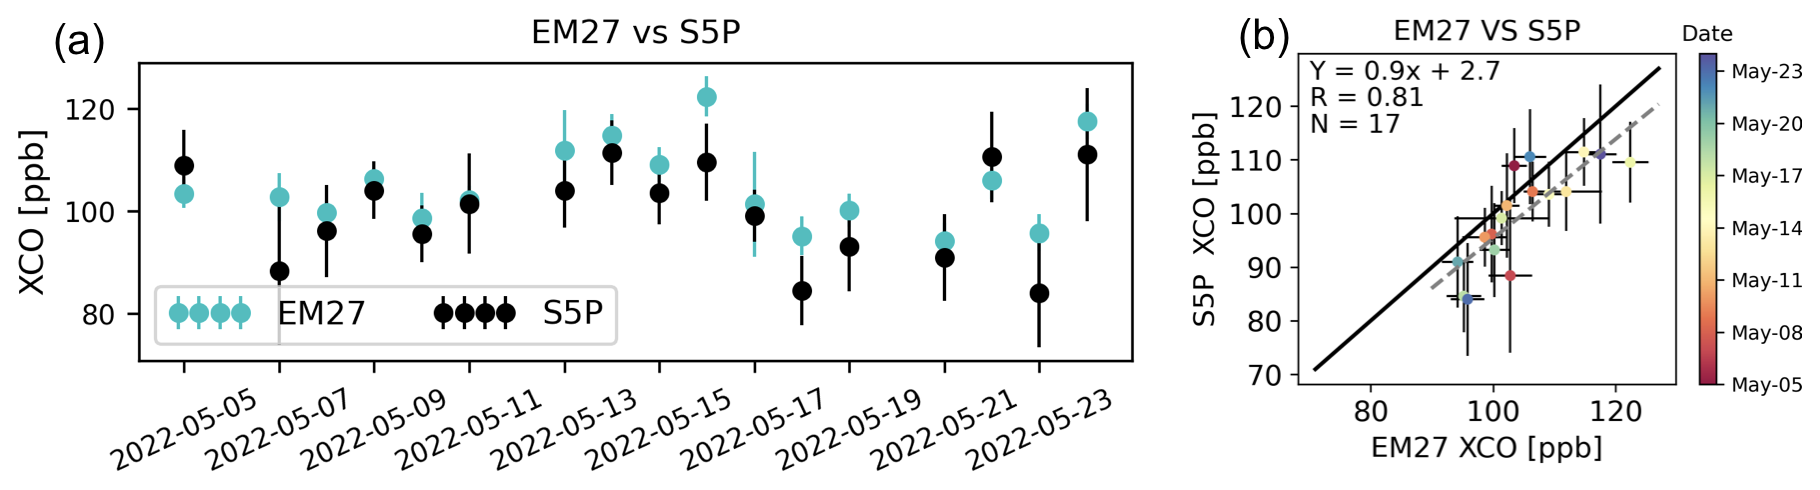
Figure 8The co-located TROPOMI/S5P and EM27/SUN XCO measurements between 5 and 24 May 2022 (a). The error bar of the satellite measurement is the SD of all measurements within 25 km of the site, and the error bar of the FTIR measurement is the SD of all measurements within ±2 h of the satellite overpass time. The scatterplot of the TROPOMI/S5P and EM27/SUN XCO co-located measurements (b). The dashed line is the linear regression, R is the Pearson correlation coefficient, and N is the number of co-located measurements. The dot is colored by the measurement date.
The high and low XCO values at QOMS are observed simultaneously from the ground-based FTIR and TROPOMI satellite measurements. Thanks to the good coverage of the TROPOMI satellite measurements, they are applied to show the spatial distributions of XCO around QOMS in a larger domain. Figure 9 shows the TROPOMI XCO measurements on 16, 22, and 24 May with relatively high XCO values and on 18, 21, and 23 May with relatively low XCO values around QOMS. The wind speed and wind direction are derived from the ERA5 reanalysis pressure-level data at 500 hPa (∼ 5 km a.s.l.). We find that XCO at the south side of Mt. Qomolangma is much larger than that at the QOMS site because of high anthropogenic emissions in Nepal and India (Crippa et al., 2018). The relatively high XCO values at QOMS on 16, 22, and 24 May correspond to south winds, which bring the air mass with a high CO mole fraction to QOMS. On 18 and 21 May, the wind direction was from the west to the east along the southern edge of the Himalayas mountains and did not bring air mass to QOMS, so low XCO values are observed in all regions of the southern Tibetan Plateau. On 23 May, relatively high XCO values are observed at approximately 200 km west or east of QOMS, but low XCO values are observed at QOMS. Based on the TROPOMI satellite measurements and the wind data, we conclude that the day-to-day variation in XCO observed at QOMS is largely influenced by atmospheric transport, and the air mass transported from southern Asia can enhance the CO mole fractions over the Tibetan Plateau.
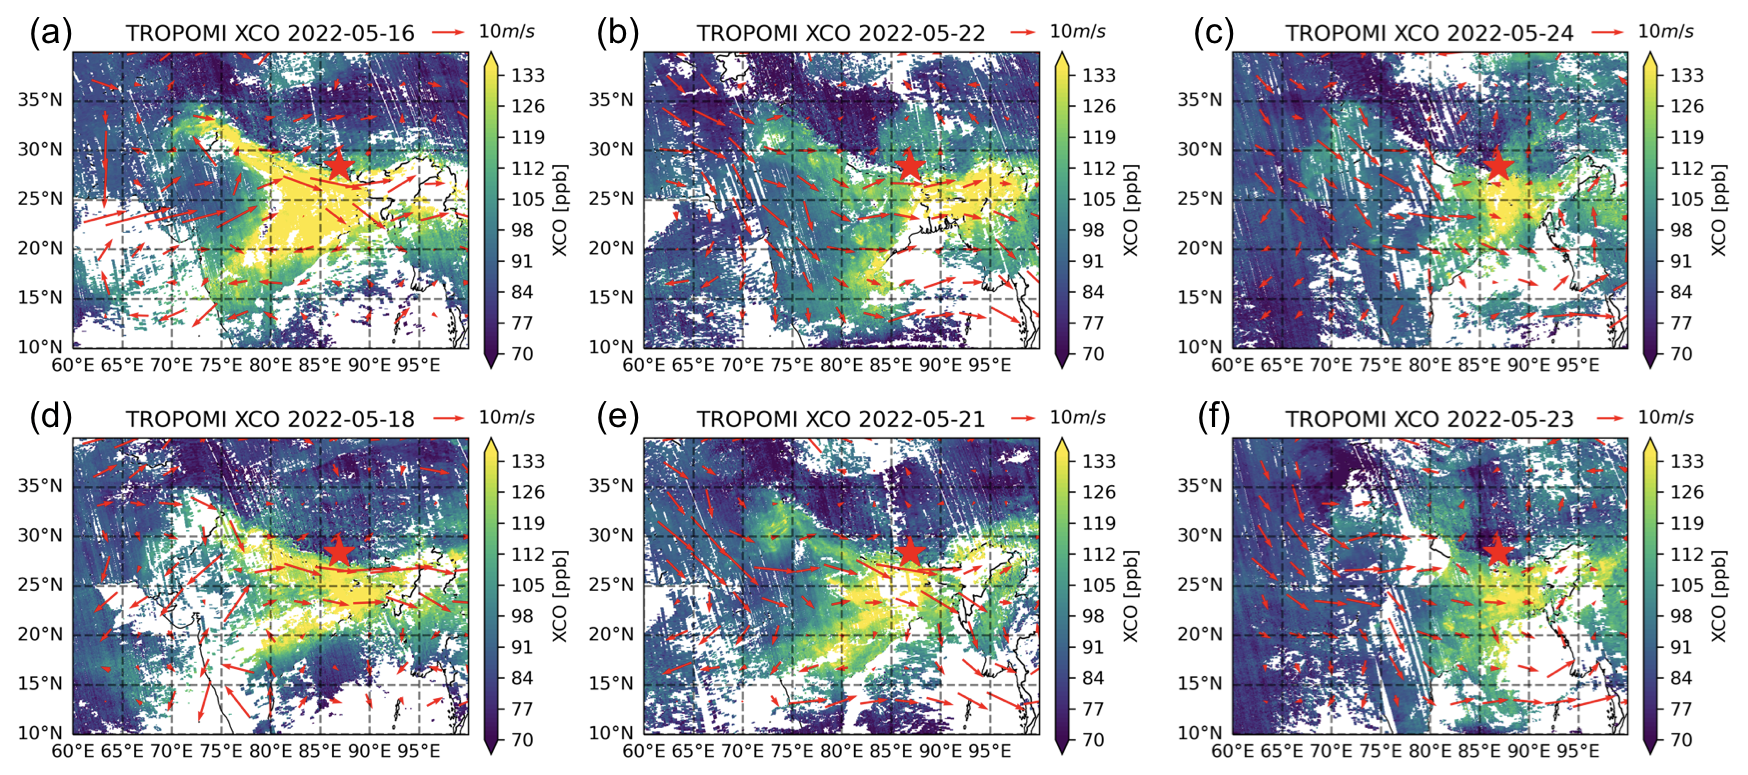
Figure 9The XCO observed by the TROPOMI/S5P satellite on (a) 16, (b) 22, and (c) 25 May 2022, with relatively high XCO values at QOMS (the red star), and on (d) 18, (e) 21, and (f) 23 May 2022, with relatively low XCO values at QOMS. The wind direction and wind speed are derived from the ERA5 reanalysis data at 500 hPa (∼ 5 km a.s.l.).
4.3 Ground-based FTIR against OCO-2 XCO2 measurements
Unlike the TROPOMI XCO measurements, very limited OCO-2 XCO2 measurements are available due to OCO-2's narrow swath. During this campaign, there were only two dates when the OCO-2 satellite provided valid measurements (qflag = 0) around QOMS (Fig. 10). The distances between the OCO-2 measurements and the FTIR site are about 480 and 250 km on 8 and 24 May, respectively. Note that the observation mode of OCO-2 is land glint on 8 May and land nadir on 24 May. As the OCO-2 and EM27/SUN both use GEOS-FPIT model simulations as the a priori profiles, no prior substitution correction is needed (Zhou et al., 2016). For each FTIR–satellite data pair, we correct the FTIR measurement to the same altitude as that of the satellite footprint. As we do not have the FTIR measurement around the OCO-2 overpass time (∼ 15:30 CST), we use the mean of the FTIR measurements in the latest 1 h.
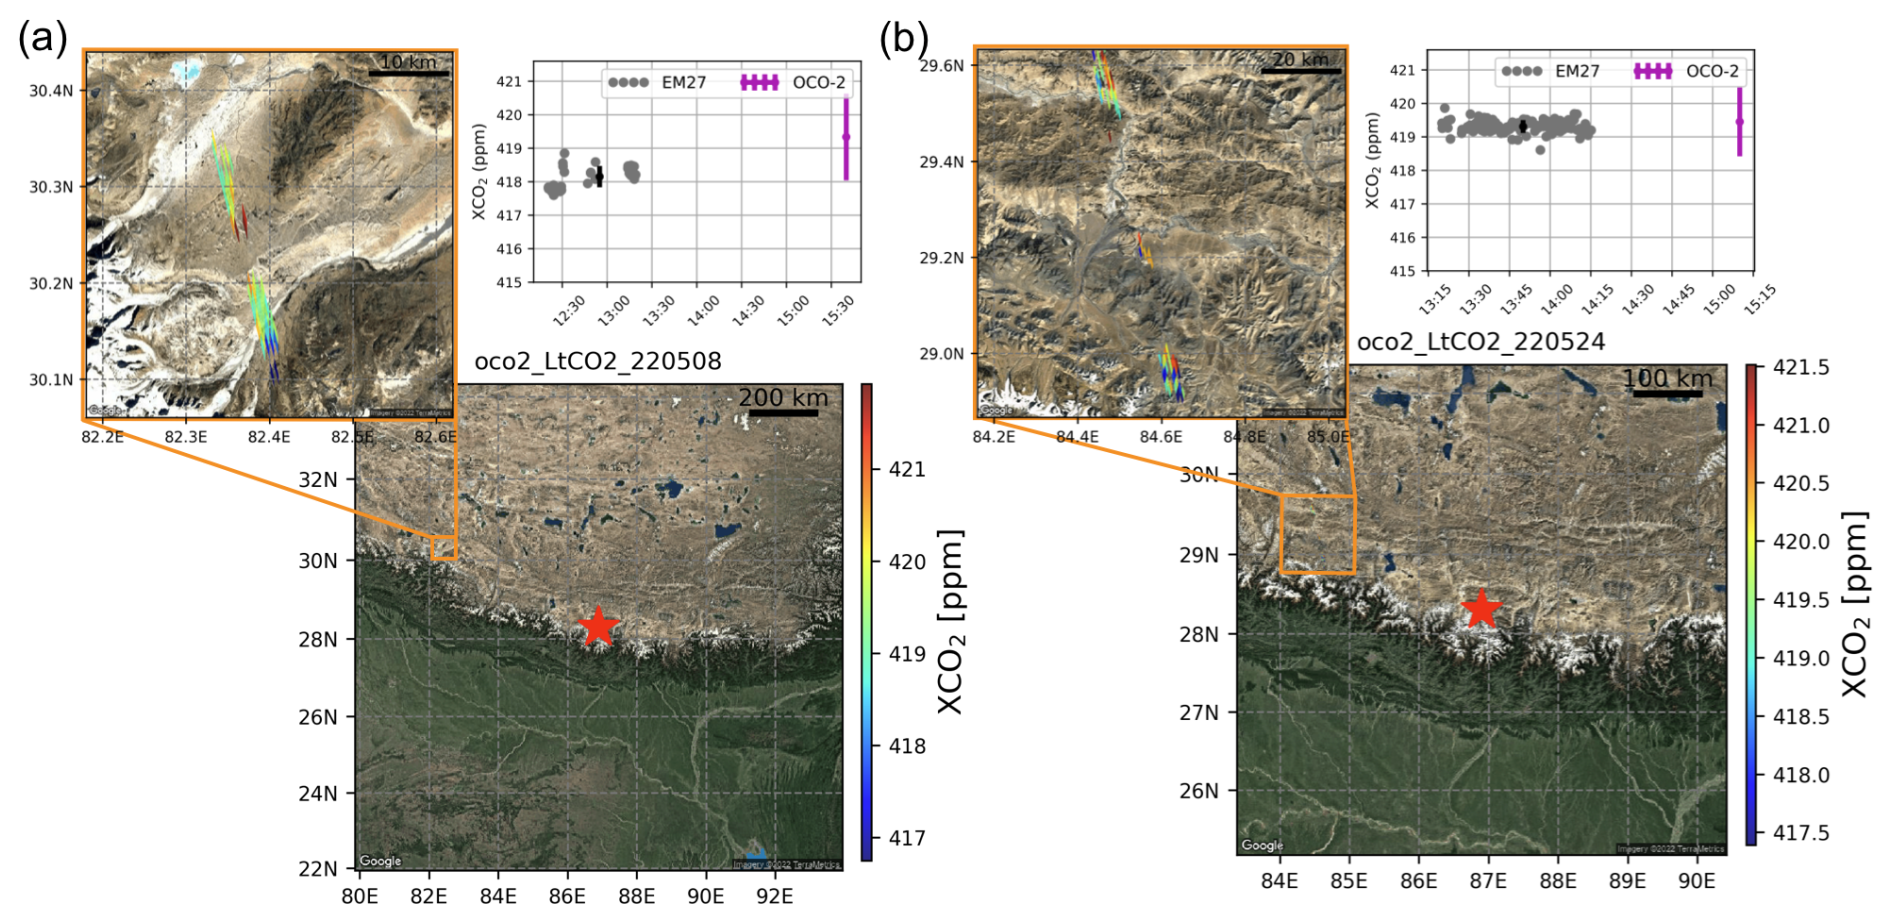
Figure 10The XCO2 observed by the OCO-2 satellite with glint mode on 8 May (a) and with nadir mode on 24 May (b) around QOMS (the red star on the satellite image from © Google Maps). For each day, the time series of the EM27/SUN XCO2 individual measurements in the latest 1 h are shown together with the mean and SD of EM27/SUN measurements (black) and all co-located OCO-2 measurements (magenta) in the top-right panels.
The means and SDs of the differences between EM27/SUN and OCO-2 XCO2 measurements (SAT–GB) are 1.21 ± 1.29 and 0.21 ± 0.98 ppm on 8 and 24 May, respectively. The bias in OCO-2 XCO2 measurements at QOMS is on the same order of magnitude as the bias found at global TCCON sites (Wunch et al., 2017). The reported uncertainty in the OCO-2 XCO2 nadir measurements on 24 May is 0.65 ppm, which is slightly lower than the SD of 0.98 ppm. However, the reported uncertainty in the OCO-2 XCO2 glint measurements on 8 May is 0.57 ppm, which is much smaller than the SD of 1.29 ppm.
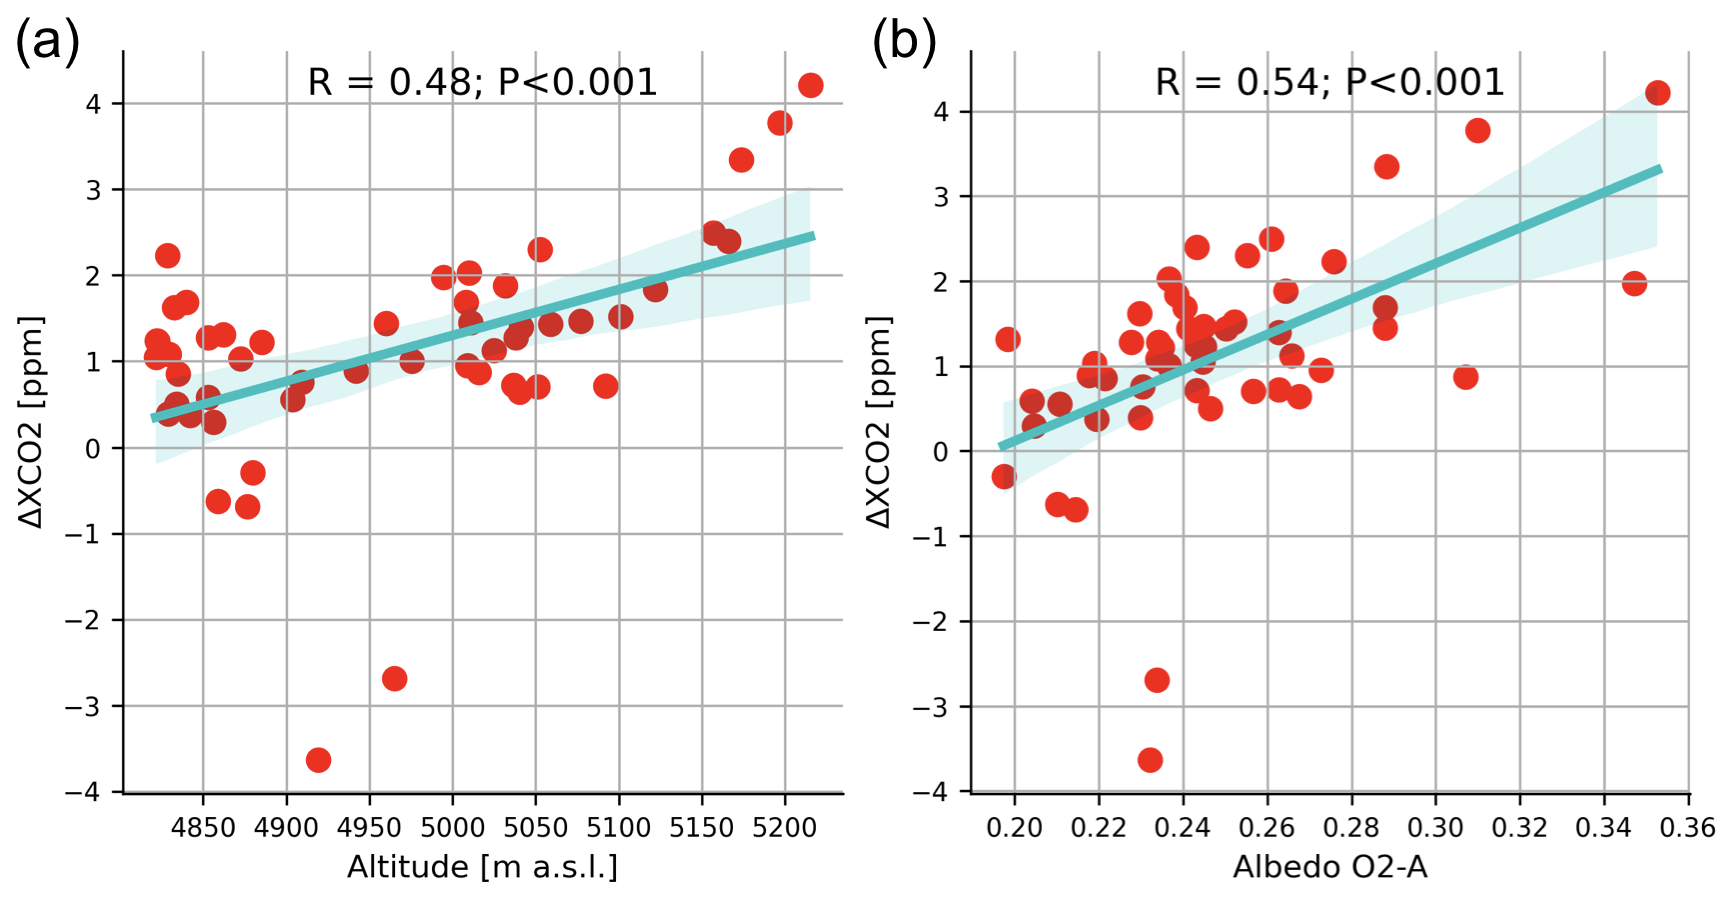
Figure 11The bias in XCO2 observed by OCO-2 land glint measurements (ΔXCO2 = SAT–GB) on 8 May 2022 varying with surface altitude (a) and surface albedo in the O2 A band (b).
As the footprint of OCO-2 is a bit far away from the QOMS site, we use the Copernicus Atmosphere Monitoring Service (CAMS) model simulations (Inness et al., 2019; Agustí-Panareda et al., 2023) in May 2020 to estimate the spatial variability in XCO2 between the QOMS and OCO-2 footprints in this study. The mean and SD of the differences in CAMS XCO2 between the QOMS and OCO-2 footprint around 29.2° N, 84.5° E (∼ 250 km) are 0.02 and 0.27 ppm, respectively. The mean and SD of the differences in CAMS XCO2 between the QOMS and OCO-2 footprint around 30.2° N, 82.4° E (∼ 480 km) are 0.10 and 0.34 ppm, respectively. According to the CAMS model simulations, the XCO2 spatial variability in this region is relatively small.
The OCO-2 measurements on these two dates are both concentrated in a small region without intense human activity. It is assumed that the XCO2 is stable in such a region. Figure 11 shows the bias in OCO-2 glint measurements (SAT–GB) varying with surface altitudes and retrieved surface albedos in the O2 A band on 8 May 2022. It is found that the bias in OCO-2 land glint measurements is strongly related to the retrieved surface albedos (R = 0.54) and footprint surface altitudes (R = 0.48). Further correction of OCO-2 glint measurements in this region using the O2 A band surface albedo/surface altitude is recommended, but more data are required. Regarding the OCO-2 land nadir measurements on 24 May, we do not find significant correlations between the bias and altitudes (R = −0.26) or surface albedos (R = 0.17). Instead, the biases are randomly distributed.
The QTP serves as a huge carbon storage area but is also sensitive to climate change. Currently, there is still large uncertainty regarding the terrestrial ecosystem carbon sink in the QTP. Due to the tough environment, GHG measurements are scarce. In May 2022, an integrated greenhouse gas measurement campaign was carried out at QOMS within the framework of the Second Tibetan Plateau Scientific Expedition Program. In this study, we present the experiments involving in situ measurements near the surface and the ground-based EM27/SUN FTIR column measurements. The following results are presented and discussed:
- 1.
The in situ measurements near the surface at QOMS between 13 and 24 May 2022 show that the CO2 and CH4 mole fractions are 424.2 ± 2.1 ppm and 1985.2 ± 19.7 ppb, respectively. In addition, a good correlation (R = 0.82) between the surface CO2 and CH4 mole fractions is observed.
- 2.
The ground-based FTIR measurements at QOMS between 5 and 24 May show that the mean XCO2, XCH4, XCO, and XN2O are 418.4 ± 0.6 ppm, 1888.3 ± 8.0 ppb, 106.2 ± 8.3 ppb, and 321.6 ± 3.2 ppb, respectively. The mean of XCO2 at QOMS is about 0.5–3.5 ppm lower than the values of six TCCON sites in the mid-latitude Northern Hemisphere during the same time period. The GHG measurements at QOMS significantly differ from the GEOS-FPIT model simulations, indicating the large uncertainty in the model simulations in this region.
- 3.
The ground-based FTIR measurements at QOMS are compared to TROPOMI XCO satellite observations. The difference between FTIR and TROPOMI XCO measurements is −5.06 ± 5.36 ppb (−4.7 ± 5.1 %), which is within the S5P mission requirements. A good correlation between FTIR and TROPOMI XCO measurements is also found, with an R of 0.81. Utilizing the good spatial coverage of TROPOMI satellite measurements together with the wind data, we find that the day-to-day variation in XCO observed at QOMS is largely affected by atmospheric transport. It is important to carry out long-term measurements to calculate the cross-regional transport in this region quantitatively.
- 4.
The ground-based FTIR measurements at QOMS are also compared to OCO-2 XCO2 observations. There were only two dates with OCO-2 measurements within 500 km of QOMS (land glint mode on 8 May 2022 and land nadir mode on 24 May 2022). The mean differences between FTIR and OCO-2 XCO2 measurements are 1.21 ± 1.29 ppm and 0.21 ± 0.98 ppm on 8 and 24 May, respectively. It is found that the bias in OCO-2 glint measurements on 8 May is relatively large, and it is statistically related to the retrieved surface albedos and surface altitudes. The quality of the OCO-2 XCO2 land glint measurements in this region should be further assessed when more ground-based measurements become available.
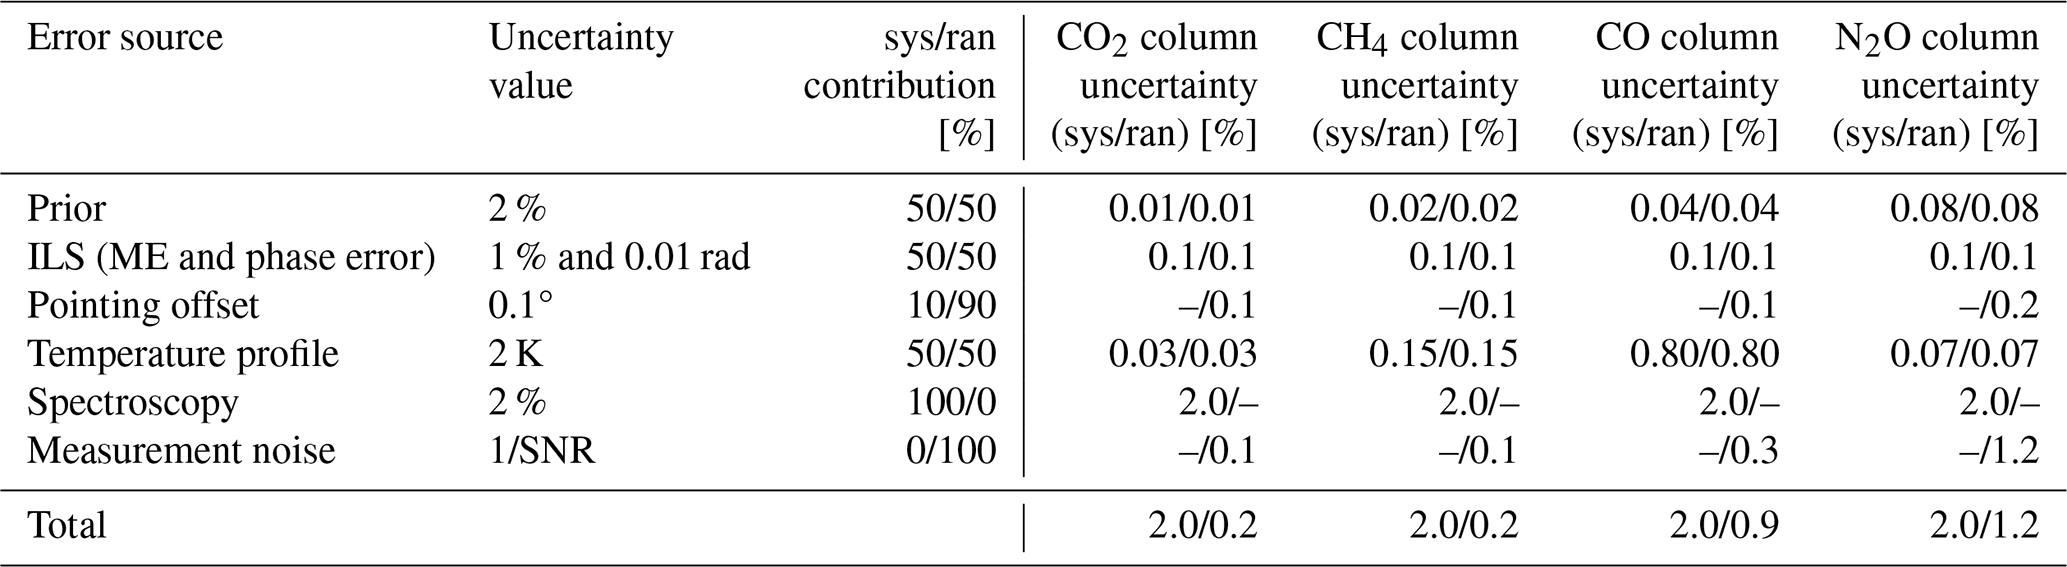
The uncertainties in the EM27/SUN CO2, CH4, CO, and N2O measurements at QOMS are estimated by perturbing the inputs using the GGG2020 code. In this study, we include contributions from instrumental effects (ILS), observation geometry (pointing offset), the temperature profile, spectroscopy (line intensity), a priori dependence, and measurement noise (Table A1).
Table A1List of sources; values used for the uncertainty analysis; and CO2, CH4, CO, and N2O column retrieval uncertainties for all measurements at the QOMS site using the GGG2020 code (ME: modulation efficiency amplitude; SNR: signal-to-noise ratio). The third column provides the partitioning of the error values between random (ran) and systematic (sys) contributions. Note that an uncertainty of less than 0.01 % is indicated as “–”.
The TCCON data were obtained from the TCCON Data Archive hosted by CaltechDATA at https://tccondata.org (last access: 1 September 2025) (https://doi.org/10.14291/TCCON.GGG2020, Total Carbon Column Observing Network (TCCON) Team, 2022). The TROPOMI satellite data are available at https://dataspace.copernicus.eu/ (last access: 1 September 2025) (registration request) (https://doi.org/10.5270/S5P-bj3nry0, Copernicus Sentinel-5P, 2021). OCO-2 satellite data are available at https://ocov2.jpl.nasa.gov/science/oco-2-data-center/ (last access: 1 September 2025) (registration request) (https://doi.org/10.5067/70K2B2W8MNGY, OCO-2/OCO-3 Science Team, 2024). The ground-based FTIR measurements at QOMS are available upon request. The CAMS model simulations are publicly available at https://ads.atmosphere.copernicus.eu/datasets/cams-global-ghg-reanalysis-egg4?tab=overview (last access: 1 September 2025) (https://doi.org/10.24381/cda4ed31, Copernicus Atmosphere Monitoring Service, 2021).
MZ, YW, and MD designed the study. MZ wrote the manuscript with inputs from YW and MD. XT and JD served as the project leaders of the campaign. JB set up the EM27/SUN instrument. YM, WM, and ZX provided local support to collect the data. All authors read and commented on the manuscript.
The contact author has declared that none of the authors has any competing interests.
Publisher’s note: Copernicus Publications remains neutral with regard to jurisdictional claims made in the text, published maps, institutional affiliations, or any other geographical representation in this paper. While Copernicus Publications makes every effort to include appropriate place names, the final responsibility lies with the authors.
The authors would like to thank all staff at QOMS for supporting the GHG measurement campaign. The authors want to thank the TCCON community, ESA, and NASA for providing the TCCON, TROPOMI, and OCO-2 data.
This research has been supported by the Second Tibetan Plateau Scientific Expedition Program (2022QZKK0101), the National Natural Science Foundation of China (42205140), and the Youth Innovation Promotion Association, CAS (2023077).
This paper was edited by Jian Xu and reviewed by two anonymous referees.
Agustí-Panareda, A., Barré, J., Massart, S., Inness, A., Aben, I., Ades, M., Baier, B. C., Balsamo, G., Borsdorff, T., Bousserez, N., Boussetta, S., Buchwitz, M., Cantarello, L., Crevoisier, C., Engelen, R., Eskes, H., Flemming, J., Garrigues, S., Hasekamp, O., Huijnen, V., Jones, L., Kipling, Z., Langerock, B., McNorton, J., Meilhac, N., Noël, S., Parrington, M., Peuch, V.-H., Ramonet, M., Razinger, M., Reuter, M., Ribas, R., Suttie, M., Sweeney, C., Tarniewicz, J., and Wu, L.: Technical note: The CAMS greenhouse gas reanalysis from 2003 to 2020, Atmos. Chem. Phys., 23, 3829–3859, https://doi.org/10.5194/acp-23-3829-2023, 2023.
Borsdorff, T., aan de Brugh, J., Schneider, A., Lorente, A., Birk, M., Wagner, G., Kivi, R., Hase, F., Feist, D. G., Sussmann, R., Rettinger, M., Wunch, D., Warneke, T., and Landgraf, J.: Improving the TROPOMI CO data product: update of the spectroscopic database and destriping of single orbits, Atmos. Meas. Tech., 12, 5443–5455, https://doi.org/10.5194/amt-12-5443-2019, 2019.
Copernicus Atmosphere Monitoring Service: CAMS global greenhouse gas reanalysis (EGG4), Copernicus Atmosphere Monitoring Service (CAMS) Atmosphere Data Store [data set], https://doi.org/10.24381/cda4ed31, 2021.
Copernicus Sentinel-5P (processed by ESA): TROPOMI Level 2 Carbon Monoxide total column products, Version 02, European Space Agency [data set], https://doi.org/10.5270/S5P-bj3nry0, 2021.
Crippa, M., Guizzardi, D., Muntean, M., Schaaf, E., Dentener, F., van Aardenne, J. A., Monni, S., Doering, U., Olivier, J. G. J., Pagliari, V., and Janssens-Maenhout, G.: Gridded emissions of air pollutants for the period 1970–2012 within EDGAR v4.3.2, Earth Syst. Sci. Data, 10, 1987–2013, https://doi.org/10.5194/essd-10-1987-2018, 2018.
Ding, J., Li, F., Yang, G., Chen, L., Zhang, B., Liu, L., Fang, K., Qin, S., Chen, Y., Peng, Y., Ji, C., He, H., Smith, P., and Yang, Y.: The permafrost carbon inventory on the Tibetan Plateau: a new evaluation using deep sediment cores, Glob. Change Biol., 22, 2688–2701, https://doi.org/10.1111/gcb.13257, 2016.
Frey, M., Sha, M. K., Hase, F., Kiel, M., Blumenstock, T., Harig, R., Surawicz, G., Deutscher, N. M., Shiomi, K., Franklin, J. E., B¨sch, H., Chen, J., Grutter, M., Ohyama, H., Sun, Y., Butz, A., Mengistu Tsidu, G., Ene, D., Wunch, D., Cao, Z., Garcia, O., Ramonet, M., Vogel, F., and Orphal, J.: Building the COllaborative Carbon Column Observing Network (COCCON): long-term stability and ensemble performance of the EM27/SUN Fourier transform spectrometer, Atmos. Meas. Tech., 12, 1513–1530, https://doi.org/10.5194/amt-12-1513-2019, 2019.
García, O. E., Schneider, M., Herkommer, B., Gross, J., Hase, F., Blumenstock, T., and Sepúlveda, E.: TCCON data from Izana (ES), Release GGG2020.R1, Version R1, CaltechDATA [data set], https://doi.org/10.14291/tccon.ggg2020.izana01.R1, 2022.
Ge, F., Sielmann, F., Zhu, X., Fraedrich, K., Zhi, X., Peng, T., and Wang, L.: The link between Tibetan Plateau monsoon and Indian summer precipitation: a linear diagnostic perspective, Clim. Dynam., 49, 4201–4215, https://doi.org/10.1007/s00382-017-3585-1, 2017.
Guo, M., Fang, S., Liu, S., Liang, M., Wu, H., Yang, L., Li, Z., Liu, P., and Zhang, F.: Comparison of atmospheric CO2, CH4, and CO at two stations in the Tibetan Plateau of China, Earth Space Sci., 7, e2019EA001051, https://doi.org/10.1029/2019EA001051, 2020.
Hase, F., Herkommer, B., Groß, J., Blumenstock, T., Kiel, M. ä., and Dohe, S.: TCCON data from Karlsruhe (DE), Release GGG2020.R1, Version R1, CaltechDATA [data set], https://doi.org/10.14291/tccon.ggg2020.karlsruhe01.R1, 2023.
Inness, A., Ades, M., Agustí-Panareda, A., Barré, J., Benedictow, A., Blechschmidt, A.-M., Dominguez, J. J., Engelen, R., Eskes, H., Flemming, J., Huijnen, V., Jones, L., Kipling, Z., Massart, S., Parrington, M., Peuch, V.-H., Razinger, M., Remy, S., Schulz, M., and Suttie, M.: The CAMS reanalysis of atmospheric composition, Atmos. Chem. Phys., 19, 3515–3556, https://doi.org/10.5194/acp-19-3515-2019, 2019.
Ji, D., Zhou, M., Wang, P., Yang, Y., Wang, T., Sun, X., Hermans, C., Yao, B., and Wang, G.: Deriving temporal and vertical distributions of methane in Xianghe Using ground-based Fourier transform infrared and gas-analyzer measurements, Adv. Atmos. Sci., 37, 597–607, 2020.
Jia, L., Wang, G., Luo, J., Ran, F., Li, W., Zhou, J., Yang, D., Shi, W., Xu, Q., Zhu, K., and Yang, Y.: Carbon storage of the forest and its spatial pattern in Tibet, China, J. Mt. Sci., 18, 1748–1761, 2021.
Jiang, F., Chen, J. M., Zhou, L., Ju, W., Zhang, H., Machida, T., Ciais, P., Peters, W., Wang, H., Chen, B., Liu, L., Zhang, C., Matsueda, H., and Sawa, Y.: A comprehensive estimate of recent carbon sinks in China using both top-down and bottom-up approaches, Sci. Rep., 6, 22130, https://doi.org/10.1038/srep22130, 2016.
Keppel-Aleks, G., Wennberg, P. O., Washenfelder, R. A., Wunch, D., Schneider, T., Toon, G. C., Andres, R. J., Blavier, J.-F., Connor, B., Davis, K. J., Desai, A. R., Messerschmidt, J., Notholt, J., Roehl, C. M., Sherlock, V., Stephens, B. B., Vay, S. A., and Wofsy, S. C.: The imprint of surface fluxes and transport on variations in total column carbon dioxide, Biogeosciences, 9, 875–891, https://doi.org/10.5194/bg-9-875-2012, 2012.
Kiel, M., O'Dell, C. W., Fisher, B., Eldering, A., Nassar, R., MacDonald, C. G., and Wennberg, P. O.: How bias correction goes wrong: measurement of X affected by erroneous surface pressure estimates, Atmos. Meas. Tech., 12, 2241–2259, https://doi.org/10.5194/amt-12-2241-2019, 2019.
Landgraf, J., aan de Brugh, J., Scheepmaker, R., Borsdorff, T., Hu, H., Houweling, S., Butz, A., Aben, I., and Hasekamp, O.: Carbon monoxide total column retrievals from TROPOMI shortwave infrared measurements, Atmos. Meas. Tech., 9, 4955–4975, https://doi.org/10.5194/amt-9-4955-2016, 2016.
Langerock, B., De Mazière, M., Hendrick, F., Vigouroux, C., Desmet, F., Dils, B., and Niemeijer, S.: Description of algorithms for co-locating and comparing gridded model data with remote-sensing observations, Geosci. Model Dev., 8, 911–921, https://doi.org/10.5194/gmd-8-911-2015, 2015.
Laughner, J. L., Roche, S., Kiel, M., Toon, G. C., Wunch, D., Baier, B. C., Biraud, S., Chen, H., Kivi, R., Laemmel, T., McKain, K., Quéhé, P.-Y., Rousogenous, C., Stephens, B. B., Walker, K., and Wennberg, P. O.: A new algorithm to generate a priori trace gas profiles for the GGG2020 retrieval algorithm, Atmos. Meas. Tech., 16, 1121–1146, https://doi.org/10.5194/amt-16-1121-2023, 2023.
Liu, S., Feng, Z., Lin, H., Liu, P., Liang, M., Qing, X., Xiong, H., Qiu, S., Li, J., Jiang, K., Hong, H., and Fang, S.: Changes of atmospheric CO2 in the Tibetan Plateau from 1994 to 2019, J. Geophys. Res.-Atmos., 126, e2021JD035299, https://doi.org/10.1029/2021JD035299, 2021.
Lorente, A., Borsdorff, T., Butz, A., Hasekamp, O., aan de Brugh, J., Schneider, A., Wu, L., Hase, F., Kivi, R., Wunch, D., Pollard, D. F., Shiomi, K., Deutscher, N. M., Velazco, V. A., Roehl, C. M., Wennberg, P. O., Warneke, T., and Landgraf, J.: Methane retrieved from TROPOMI: improvement of the data product and validation of the first 2 years of measurements, Atmos. Meas. Tech., 14, 665–684, https://doi.org/10.5194/amt-14-665-2021, 2021.
Ma, Y., Xie, Z., Ma, W., Han, C., Sun, F., Sun, G., Liu, L., Lai, Y., Wang, B., Liu, X., Zhao, W., Ma, W., Wang, F., Sun, L., Ma, B., Han, Y., Wang, Z., and Xi, Z.: QOMS: A Comprehensive Observation Station for Climate Change Research on the Top of Earth, B. Am. Meteorol. Soc., 104, E563–E584, https://doi.org/10.1175/BAMS-D-22-0084.1, 2023.
Martínez-Alonso, S., Deeter, M. N., Baier, B. C., McKain, K., Worden, H., Borsdorff, T., Sweeney, C., and Aben, I.: Evaluation of MOPITT and TROPOMI carbon monoxide retrievals using AirCore in situ vertical profiles, Atmos. Meas. Tech., 15, 4751–4765, https://doi.org/10.5194/amt-15-4751-2022, 2022.
OCO-2/OCO-3 Science Team, Payne, V., and Chatterjee, A.: OCO-2 Level 2 bias-corrected XCO2 and other select fields from the full-physics retrieval aggregated as daily files, Retrospective processing V11.2r, Greenbelt, MD, USA, Goddard Earth Sciences Data and Information Services Center (GES DISC) [data set], https://doi.org/10.5067/70K2B2W8MNGY, 2024.
O'Dell, C. W., Eldering, A., Wennberg, P. O., Crisp, D., Gunson, M. R., Fisher, B., Frankenberg, C., Kiel, M., Lindqvist, H., Mandrake, L., Merrelli, A., Natraj, V., Nelson, R. R., Osterman, G. B., Payne, V. H., Taylor, T. E., Wunch, D., Drouin, B. J., Oyafuso, F., Chang, A., McDuffie, J., Smyth, M., Baker, D. F., Basu, S., Chevallier, F., Crowell, S. M. R., Feng, L., Palmer, P. I., Dubey, M., García, O. E., Griffith, D. W. T., Hase, F., Iraci, L. T., Kivi, R., Morino, I., Notholt, J., Ohyama, H., Petri, C., Roehl, C. M., Sha, M. K., Strong, K., Sussmann, R., Te, Y., Uchino, O., and Velazco, V. A.: Improved retrievals of carbon dioxide from Orbiting Carbon Observatory-2 with the version 8 ACOS algorithm, Atmos. Meas. Tech., 11, 6539–6576, https://doi.org/10.5194/amt-11-6539-2018, 2018.
Piao, S., He, Y., Wang, X., and Chen, F.: Estimation of China's terrestrial ecosystem carbon sink: Methods, progress and prospects, Sci. China Earth Sci., 65, 641–651, 2022.
Pisso, I., Sollum, E., Grythe, H., Kristiansen, N. I., Cassiani, M., Eckhardt, S., Arnold, D., Morton, D., Thompson, R. L., Groot Zwaaftink, C. D., Evangeliou, N., Sodemann, H., Haimberger, L., Henne, S., Brunner, D., Burkhart, J. F., Fouilloux, A., Brioude, J., Philipp, A., Seibert, P., and Stohl, A.: The Lagrangian particle dispersion model FLEXPART version 10.4, Geosci. Model Dev., 12, 4955–4997, https://doi.org/10.5194/gmd-12-4955-2019, 2019.
Rodgers, C. D. and Connor, B. J.: Intercomparison of remote sounding instruments, J. Geophys. Res.-Atmos., 108, 4116, https://doi.org/10.1029/2002JD002299, 2003.
Rui, Y., Wang, S., Xu, Z., Wang, Y., Chen, C., Zhou, X., Kang, X., Lu, S., Hu, Y., Lin, Q., and Luo, C.: Warming and grazing affect soil labile carbon and nitrogen pools differently in an alpine meadow of the Qinghai–Tibet Plateau in China, J. Soil. Sediment., 11, 903–914, https://doi.org/10.1007/s11368-011-0388-6, 2011.
Sepúlveda, E., Schneider, M., Hase, F., Barthlott, S., Dubravica, D., García, O. E., Gomez-Pelaez, A., González, Y., Guerra, J. C., Gisi, M., Kohlhepp, R., Dohe, S., Blumenstock, T., Strong, K., Weaver, D., Palm, M., Sadeghi, A., Deutscher, N. M., Warneke, T., Notholt, J., Jones, N., Griffith, D. W. T., Smale, D., Brailsford, G. W., Robinson, J., Meinhardt, F., Steinbacher, M., Aalto, T., and Worthy, D.: Tropospheric CH4 signals as observed by NDACC FTIR at globally distributed sites and comparison to GAW surface in situ measurements, Atmos. Meas. Tech., 7, 2337–2360, https://doi.org/10.5194/amt-7-2337-2014, 2014.
Sha, M. K., Langerock, B., Blavier, J.-F. L., Blumenstock, T., Borsdorff, T., Buschmann, M., Dehn, A., De Mazière, M., Deutscher, N. M., Feist, D. G., García, O. E., Griffith, D. W. T., Grutter, M., Hannigan, J. W., Hase, F., Heikkinen, P., Hermans, C., Iraci, L. T., Jeseck, P., Jones, N., Kivi, R., Kumps, N., Landgraf, J., Lorente, A., Mahieu, E., Makarova, M. V., Mellqvist, J., Metzger, J.-M., Morino, I., Nagahama, T., Notholt, J., Ohyama, H., Ortega, I., Palm, M., Petri, C., Pollard, D. F., Rettinger, M., Robinson, J., Roche, S., Roehl, C. M., Röhling, A. N., Rousogenous, C., Schneider, M., Shiomi, K., Smale, D., Stremme, W., Strong, K., Sussmann, R., Té, Y., Uchino, O., Velazco, V. A., Vigouroux, C., Vrekoussis, M., Wang, P., Warneke, T., Wizenberg, T., Wunch, D., Yamanouchi, S., Yang, Y., and Zhou, M.: Validation of methane and carbon monoxide from Sentinel-5 Precursor using TCCON and NDACC-IRWG stations, Atmos. Meas. Tech., 14, 6249–6304, https://doi.org/10.5194/amt-14-6249-2021, 2021.
Tada, R., Zheng, H., and Clift, P. D.: Evolution and variability of the Asian monsoon and its potential linkage with uplift of the Himalaya and Tibetan Plateau, Prog. Earth Planet. Sci., 3, 4, https://doi.org/10.1186/s40645-016-0080-y, 2016.
Té, Y., Jeseck, P., and Janssen, C.: TCCON data from Paris (FR), Release GGG2020.R0, Version R0, CaltechDATA [data set], https://doi.org/10.14291/tccon.ggg2020.paris01.R0, 2022.
Total Carbon Column Observing Network (TCCON) Team: 2020 TCCON Data Release (GGG2020), CaltechDATA [Data set], https://doi.org/10.14291/TCCON.GGG2020, 2022.
Wang, R., Guo, X., Pan, D., Kelly, J. T., Bash, J. O., Sun, K., Paulot, F., Clarisse, L., Van Damme, M., Whitburn, S., Coheur, P., Clerbaux, C., and Zondlo, M. A.: Monthly Patterns of Ammonia Over the Contiguous United States at 2-km Resolution, Geophys. Res. Lett., 48, e2020GL090579, https://doi.org/10.1029/2020GL090579, 2021.
Wang, T., Yang, D., Yang, Y., Piao, S., Li, X., Cheng, G., and Fu, B.: Permafrost thawing puts the frozen carbon at risk over the Tibetan Plateau, Sci. Adv., 6, eaaz3513, https://doi.org/10.1126/sciadv.aaz3513, 2020.
Wang, Y., Ding, Z., and Ma, Y.: Data processing uncertainties may lead to an overestimation of the land carbon sink of the Tibetan Plateau, P. Natl. Acad. Sci. USA, 119, e2202343119, https://doi.org/10.1073/pnas.2202343119, 2022.
Wang, Z., Deutscher, N. M., Warneke, T., Notholt, J., Dils, B., Griffith, D. W. T., Schmidt, M., Ramonet, M., and Gerbig, C.: Retrieval of tropospheric column-averaged CH4 mole fraction by solar absorption FTIR-spectrometry using N2O as a proxy, Atmos. Meas. Tech., 7, 3295–3305, https://doi.org/10.5194/amt-7-3295-2014, 2014.
Warneke, T., Petri, C., Notholt, J., and Buschmann, M.: TCCON data from Orléans (FR), Release GGG2020.R0, Version R0, CaltechDATA [data set], https://doi.org/10.14291/tccon.ggg2020.orleans01.R0, 2022.
Wennberg, P. O., Roehl, C. M., Wunch, D., Blavier, J.-F., Toon, G. C., Allen, N. T., Treffers, R., and Laughner, J.: TCCON data from Caltech (US), Release GGG2020.R0, Version R0, CaltechDATA [data set], https://doi.org/10.14291/tccon.ggg2020.pasadena01.R0, 2022a.
Wennberg, P. O., Wunch, D., Roehl, C. M., Blavier, J.-F., Toon, G. C., and Allen, N. T.: TCCON data from Lamont (US), Release GGG2020.R0, Version R0, CaltechDATA [data set], https://doi.org/10.14291/tccon.ggg2020.lamont01.R0, 2022b.
Wu, J., Li, M., Zhang, X., Fiedler, S., Gao, Q., Zhou, Y., Cao, W., Hassan, W., Mărgărint, M. C., Tarolli, P., and Tietjen, B.: Disentangling climatic and anthropogenic contributions to nonlinear dynamics of alpine grassland productivity on the Qinghai-Tibetan Plateau, J. Environ. Manage., 281, 111875, https://doi.org/10.1016/j.jenvman.2020.111875, 2021.
Wunch, D., Toon, G. C., Blavier, J.-F. L., Washenfelder, R. A., Notholt, J., Connor, B. J., Griffith, D. W., Sherlock, V., and Wennberg, P. O.: The total carbon column observing network, Philos. T. Roy. Soc. A, 369, 2087–2112, 2011.
Wunch, D., Wennberg, P. O., Osterman, G., Fisher, B., Naylor, B., Roehl, C. M., O'Dell, C., Mandrake, L., Viatte, C., Kiel, M., Griffith, D. W. T., Deutscher, N. M., Velazco, V. A., Notholt, J., Warneke, T., Petri, C., De Maziere, M., Sha, M. K., Sussmann, R., Rettinger, M., Pollard, D., Robinson, J., Morino, I., Uchino, O., Hase, F., Blumenstock, T., Feist, D. G., Arnold, S. G., Strong, K., Mendonca, J., Kivi, R., Heikkinen, P., Iraci, L., Podolske, J., Hillyard, P. W., Kawakami, S., Dubey, M. K., Parker, H. A., Sepulveda, E., García, O. E., Te, Y., Jeseck, P., Gunson, M. R., Crisp, D., and Eldering, A.: Comparisons of the Orbiting Carbon Observatory-2 (OCO-2) measurements with TCCON, Atmos. Meas. Tech., 10, 2209–2238, https://doi.org/10.5194/amt-10-2209-2017, 2017.
Yang, Y., Zhou, M., Langerock, B., Sha, M. K., Hermans, C., Wang, T., Ji, D., Vigouroux, C., Kumps, N., Wang, G., De Mazière, M., and Wang, P.: New ground-based Fourier-transform near-infrared solar absorption measurements of XCO2, XCH4 and XCO at Xianghe, China, Earth Syst. Sci. Data, 12, 1679–1696, https://doi.org/10.5194/essd-12-1679-2020, 2020.
Yang, Z., Toon, G. C., Margolis, J. S., and Wennberg, P. O.: Atmospheric CO2 retrieved from ground-based near IR solar spectra, Geophys. Res. Lett., 29, 53-1–53-4, 2002.
Zhang, G., Nan, Z., Zhao, L., Liang, Y., and Cheng, G.: Qinghai-Tibet Plateau wetting reduces permafrost thermal responses to climate warming, Earth Planet. Sc. Lett., 562, 116858, https://doi.org/10.1016/j.epsl.2021.116858, 2021.
Zhang, Y., Gao, Q., Dong, S., Liu, S., Wang, X., Su, X., Li, Y., Tang, L., Wu, X., and Zhao, H.: Effects of grazing and climate warming on plant diversity, productivity and living state in the alpine rangelands and cultivated grasslands of the Qinghai-Tibetan Plateau, Rangeland J., 37, 57–65, 2015.
Zhou, M., Dils, B., Wang, P., Detmers, R., Yoshida, Y., O'Dell, C. W., Feist, D. G., Velazco, V. A., Schneider, M., and De Mazière, M.: Validation of TANSO-FTS/GOSAT XCO2 and XCH4 glint mode retrievals using TCCON data from near-ocean sites, Atmos. Meas. Tech., 9, 1415–1430, https://doi.org/10.5194/amt-9-1415-2016, 2016.
Zhou, M., Langerock, B., Vigouroux, C., Sha, M. K., Ramonet, M., Delmotte, M., Mahieu, E., Bader, W., Hermans, C., Kumps, N., Metzger, J.-M., Duflot, V., Wang, Z., Palm, M., and De Mazière, M.: Atmospheric CO and CH4 time series and seasonal variations on Reunion Island from ground-based in situ and FTIR (NDACC and TCCON) measurements, Atmos. Chem. Phys., 18, 13881–13901, https://doi.org/10.5194/acp-18-13881-2018, 2018.
Zhou, M., Wang, P., Kumps, N., Hermans, C., and Nan, W.: TCCON data from Xianghe, China, Release GGG2020.R0, Version R0, CaltechDATA [data set], https://doi.org/10.14291/tccon.ggg2020.xianghe01.R0, 2022.
Zhou, M., Ni, Q., Cai, Z., Langerock, B., Jiang, J., Che, K., Wang, J., Nan, W., Liu, Y., and Wang, P.: Ground-Based Atmospheric CO2, CH4, and CO Column Measurements at Golmud in the Qinghai-Tibetan Plateau and Comparisons with TROPOMI/S5P Satellite Observations, Adv. Atmos. Sci., 40, 223–234, https://doi.org/10.1007/s00376-022-2116-0, 2023.
The Qinghai–Tibetan Plateau is a key system that impacts the global carbon balance. This study presents the greenhouse gas (GHG) mole fraction measurement campaign in May 2022 at Mt. Qomolangma station, including ground-based remote sensing and in situ measurements. The GHG measurements are carried out in this region for the first time and used for satellite validation.
The Qinghai–Tibetan Plateau is a key system that impacts the global carbon balance. This study...