the Creative Commons Attribution 4.0 License.
the Creative Commons Attribution 4.0 License.
 | 10 Sep 2025
Temperature-constrained lidar retrieval of planetary boundary layer height over Chiang Mai, Thailand
Ronald Macatangay
Thiranan Sonkaew
Sherin Hassan Bran
Worapop Thongsame
Titaporn Supasri
Mana Panya
Jeerasak Longmali
Raman Solanki
Ben Svasti Thomson
Achim Haug
Accurate determination of the planetary boundary layer (PBL) height, mixing-layer height (MLH), and aerosol layer top (ALT) is essential for air quality and climate studies, particularly in regions with complex aerosol dynamics such as Chiang Mai, northern Thailand. This study introduces a novel lidar-based retrieval method that integrates a temperature-dependent, dynamic maximum analysis altitude (MAA) into the traditional Haar wavelet covariance transform (WCT) framework. Unlike conventional fixed-altitude WCT approaches, which often misclassify the ALT as the PBL – especially under stable nighttime or transitional conditions – this dynamic approach adapts the vertical search range for PBL detection in real time using observed surface temperature variations. The method is physically grounded in boundary layer thermodynamics, allowing for more accurate identification of the true PBL top while reducing contamination from residual aerosol layers and low clouds. Validation against radiosonde observations and comparison with previously validated WRF-Chem simulations demonstrate strong agreement, with the lidar-derived PBL heights capturing diurnal variations more reliably than traditional methods. The findings also reveal model biases during high-aerosol events, highlighting the need for improved aerosol–meteorology coupling in mesoscale models. This integrated retrieval framework represents a significant advancement in lidar-based boundary layer detection and offers a robust tool for enhancing pollutant dispersion analysis, air quality forecasting, and climate modeling across aerosol-rich regions in Southeast Asia.
- Article
(1735 KB) - Full-text XML
- BibTeX
- EndNote


The planetary boundary layer (PBL) height, mixing-layer height (MLH), and aerosol layer top (ALT) are distinct atmospheric parameters essential for understanding air quality and weather dynamics. The PBL height represents the top of the lowest atmospheric layer influenced by surface interactions, encompassing layers such as the daytime mixing layer and the stable boundary layer at night (Stull, 1988). The MLH, a turbulent and well-mixed subset of the PBL, typically aligns with the PBL height under convective conditions but can diverge in stratified or stable atmospheres (Seibert et al., 2000). The ALT, marking the upper boundary of significant aerosol concentrations, often decouples from the PBL due to stratification, entrainment, or advection processes. Moreover, due to stronger vertical mixing over mountainous topography, the aerosol can reach higher altitudes, often resulting in significant aerosol loading above the PBL (De Wekker and Kossmann, 2015). Light detection and ranging (lidar)-based techniques, despite offering high-resolution aerosol profiles, frequently face challenges in distinguishing these layers, particularly during the nighttime or transitions (Ferrare et al., 2012). Emerging approaches that combine normalized relative backscatter (NRB) data with thermodynamic adjustments address these challenges, improving the accuracy of boundary layer height and ALT identification (Su et al., 2018; Ferrare et al., 2012). These developments are particularly relevant to regions like Southeast Asia, where high aerosol loads from industrial and biomass burning activities create complex vertical profiles.
This study focuses on enhancing lidar-based boundary layer characterization by refining the detection of PBL height, MLH, and ALT. Traditional algorithms, such as the Haar wavelet covariance transform (WCT), often misclassify the ALT as the PBL height, especially at night or during transitional periods when aerosol gradients are less distinct. Clouds and other atmospheric complexities make these measurements more challenging. By integrating normalized relative backscatter (NRB) profiles with dynamic thermodynamic adjustments, this approach addresses ambiguities in traditional methods and improves the reliability of boundary layer determinations. The novel method developed in this study was validated using radiosonde measurements and compared against WRF-Chem simulations. To support model–observation comparisons, we use a WRF-Chem configuration that has been previously validated under similar regional conditions in northern Thailand for surface pollutant distributions, boundary layer dynamics, and optical turbulence (Bran et al., 2022, 2024; Macatangay et al., 2024), confirming its suitability as a benchmark.
Numerous studies have significantly advanced the methods for estimating planetary boundary layer (PBL) height using lidar, addressing challenges posed by complex meteorological conditions, aerosol stratification, and limitations in traditional methodologies. For example, Toledo et al. (2017) explored numerical methods under sea–land breeze regimes, revealing discrepancies in residual layers that affect accurate PBL height detection, while Vishnu et al. (2017) highlighted the difficulty of applying a universal method for estimating the mixing-layer height (MLH), which varies under different atmospheric conditions. Li et al. (2017) contributed to improving convective boundary layer height (CBLH) retrievals by developing a convective condensation level algorithm, and Dang et al. (2019a) reviewed various aerosol lidar techniques and developed a robust method (Dang et al., 2019b), achieving strong correlations with radiosonde data to enhance accuracy. In addition, the MLHI-RR technique of Zhong et al. (2020), the cluster analysis of the gradient method of Zhang et al. (2020), and the TDMMAA method for Haar wavelet techniques of Macatangay et al. (2021) improved the precision of PBL measurements, while machine learning approaches, such as the MKnm algorithm of Liu et al. (2022) and other methods like MR-IP of Pan et al. (2022) and ADEILP of Han et al. (2022), have addressed multilayer conditions and diurnal variations in aerosol profiles.
A critical challenge remains in fully distinguishing the PBL height, MLH, and ALT, particularly in regions with high aerosol variability, such as northern Thailand. Diverse pollution sources, including biomass burning, anthropogenic, and biogenic emissions, contribute to intricate vertical aerosol distributions. This study attempts to overcome the limitations of WCT, improving the separation of PBL, MLH, and ALT through a novel integrated NRB and surface temperature approach. The enhanced accuracy of boundary layer detection is pivotal for improving air quality and mesoscale meteorological models, particularly in Southeast Asia, where aerosol concentrations are highly variable and challenging to characterize. This work provides new insights into the vertical aerosol distribution and its implications for air quality, aerosol–meteorology interactions, and public health in regions heavily impacted by agricultural and industrial emissions.
To estimate the planetary boundary layer (PBL) height using micropulse lidar, normalized relative backscatter (NRB) profiles were analyzed, as NRB is proportional to aerosol number concentration (Campbell et al., 2002). Conventional methods, such as the Haar WCT with a fixed maximum analysis altitude (e.g., 4 km), often yield the top of the aerosol layer rather than the actual PBL height. These methods can overestimate the PBL height during the nighttime by identifying the residual-layer top, and during transitional periods (morning growth or evening decay), they fail to capture diurnal PBL variations accurately (Brooks, 2003). Moreover, low clouds can lead to incorrect identification of either their base or their top as the PBL height. To address these limitations, a robust algorithm that adapts dynamically to atmospheric conditions is necessary.
The study was conducted at the headquarters of the National Astronomical Research Institute of Thailand (NARIT), situated at the Princess Sirindhorn AstroPark in Chiang Mai, northern Thailand (18.85° N, 98.96° E; 332 m a.s.l.), a region known for its complex aerosol dynamics driven by mountainous topography, biomass burning (forest and agricultural fires), anthropogenic pollution, and biogenic emissions from forested areas. The site experiences significant seasonal variations in aerosol concentrations, influencing the vertical distribution of particulate matter. To monitor these dynamics, a Mini Micro Pulse LiDAR (MiniMPL) system was deployed at the site and remained fixed throughout the measurement campaign to ensure spatial consistency. The instrument operated at a pulse repetition frequency of 2500 Hz, with each vertical profile averaged over 30 s. For analysis, the data were grouped into 5 min intervals to balance temporal resolution with noise reduction, in line with standard practices in boundary layer studies, including those at this site (Solanki et al., 2019). The lidar was continuously pointed at the zenith, ensuring consistent spatiotemporal overlap for robust monitoring of the vertical aerosol structure and planetary boundary layer (PBL) evolution. The study period, from December 2023 to February 2024, coincided with the beginning of the dry season in northern Thailand, when agricultural and forest fires begin to elevate aerosol concentrations (Bran et al., 2024), complicating the identification of the PBL and aerosol layers. This period provides a unique opportunity to evaluate the performance of the proposed lidar-based approach under high-aerosol-loading and variable meteorological conditions. A more comprehensive description of the study site is given in Solanki et al. (2019).
The dynamic maximum analysis altitude (MAA) method introduced in this study is grounded in boundary layer thermodynamics and turbulence theory. It addresses a key limitation in conventional planetary boundary layer (PBL) detection approaches – namely, the use of a fixed maximum altitude for analysis regardless of prevailing atmospheric conditions. By leveraging real-time surface temperature variations, this method introduces a thermodynamically responsive upper boundary for lidar-based boundary layer retrievals. The physical rationale stems from the well-established relationship between surface heating, buoyant turbulence generation, and boundary layer growth. Under convective conditions, surface warming leads to rising thermals that entrain air and deepen the boundary layer (Stull, 1988). Conversely, cooler surface temperatures typically indicate stable stratification or residual-layer conditions in the early morning or late evening (Seibert et al., 2000). These thermal variations strongly influence the height and structure of the PBL, as described in classic boundary layer turbulence models such as the mixed-layer models (Tennekes, 1973; Garratt, 1994) and first-order closure turbulence schemes implemented in models like WRF-Chem (Skamarock et al., 2008). This dynamic parameter, unlike the fixed altitudes used in conventional methods, is calculated using Eq. (1):
where
-
MAA(t) is the time-varying surface-temperature-based maximum analysis altitude;
-
LAA and HAA represent the lowest and highest allowable maximum analysis altitudes – these are set to 0.5 and 2.5 km, respectively, based on Solanki et al. (2019);
-
T(t) is the observed surface temperature (in °C);
-
min(T) is the minimum temperature of the day (or the previous day for operational use);
-
max[] is the maximum of the expression inside the brackets; and
-
t is time, representing temporal variation for all T values, with data recorded every 5 min.
The normalization ensures that MAA is low under cooler conditions (e.g., early-morning residual-layer regimes) and higher under warmer, convectively unstable conditions typical of late-morning and afternoon boundary layer growth. This dynamic framework enhances robustness when detecting the PBL top using the Haar wavelet covariance transform (WCT) method (Brooks, 2003), as implemented in the Ceilometer Layer Identification and Optimization (Ceilo) code (Ceilo code, 2025). Following the WCT detection, a 6 h moving average is applied to the raw PBL height time series to suppress high-frequency variability associated with short-lived turbulence bursts or instrumental noise. The resulting PBL height estimates are subsequently validated against radiosonde measurements and WRF-Chem model outputs to assess performance and reproducibility. This methodology contributes to a growing body of literature advocating adaptive and physically informed PBL detection methods (Hennemuth and Lammert, 2006), particularly under complex aerosol and meteorological regimes like those encountered in Southeast Asia.
Data from radiosondes launched by the Thai Meteorological Department (TMD) at the Chiang Mai International Airport (18.77° N, 98.96° E; 311 m a.s.l.; approximately 9 km in distance from the study site) were retrieved from the University of Wyoming's atmospheric sounding archive (https://weather.uwyo.edu/upperair/sounding.html, last access: 5 March 2024). These data were interpolated to a vertical grid with 30 m spacing from 100 m to 2 km, corresponding to the lidar minimum detection height or overlap region and the typical aerosol layer top (Solanki et al., 2019), respectively. Although the radiosonde data were interpolated only up to 2 km for consistency with the lidar's effective detection range and overlap region, the dynamic maximum analysis altitude (MAA) used in our retrieval method was permitted to extend up to 2.5 km. This was done to allow for the detection of elevated convective boundary layers on warm days, which may rise above 2 km, as observed in prior studies (e.g., Solanki et al., 2019). Thus, the MAA range (0.5–2.5 km) enables flexible detection without being constrained by the radiosonde's upper limit, while validation comparisons remain within the common 2 km vertical range. PBL heights were determined using the method of Wang and Wang (2014), which identifies the planetary boundary layer height by analyzing the first derivatives of key meteorological variables – specifically, temperature, wind speed, wind direction, potential temperature, dew point, and relative humidity. This approach considers both the maxima and the minima in these gradients to detect significant atmospheric transitions associated with the top of the mixing layer. The final PBL height was computed as the average of the estimates derived from these parameters. This method was selected over traditional single-variable approaches because it integrates multiple physical parameters and accounts for cloud presence and stable stratification, providing more robust and consistent results under diverse atmospheric conditions. Earlier methods that rely solely on individual gradients (e.g., of potential temperature or humidity) are prone to inaccuracies, particularly in regions with residual layers, cloud-capped boundaries, or complex moisture profiles (Seibert et al., 2000; Liu and Liang, 2010). In contrast, the Wang and Wang (2014) method aligns discontinuities across multiple variables to better identify the true extent of turbulent mixing. Its integrative design makes it especially suitable for the complex atmospheric dynamics observed in this study over northern Thailand. However, a significant limitation is that the radiosondes were launched only once daily at 07:00 LT (00:00 UTC), coinciding with the early-morning minimum PBL height. This constraint – stemming from the operational limitations of the Thai Meteorological Department – means that diurnal variations in the PBL height, especially during its daytime growth and decay phases, cannot be captured, potentially reducing the representativeness of radiosonde-derived estimates for broader atmospheric analyses. To address this limitation, future studies should incorporate higher-temporal-resolution datasets – such as those obtained from unoccupied aerial vehicles (UAVs) – which can capture the full diurnal evolution of the boundary layer. Recent studies (e.g., Shen et al., 2023) have demonstrated the utility of UAV-based profiling for validating lidar-derived PBL heights under complex atmospheric conditions. Integrating UAV observations will strengthen validation and improve confidence in the performance of the proposed retrieval method across a wider range of temporal and meteorological regimes.
The simulations used in this study were run in forecast mode to reflect real operational conditions, with model output averaged over overlapping time periods in the forecast cycle to align with lidar data timestamps. Here, “overlapping time periods” refers specifically to the temporal matching between forecast outputs and observational sampling windows, and not to overlap correction in the lidar signal. WRF-Chem simulations were configured and optimized for mainland Southeast Asia (Bran et al., 2024) using version 4.3.3, with the Mellor–Yamada–Nakanishi–Niino (MYNN) Level 3 PBL scheme (Olson et al., 2019). The simulations incorporated updated terrestrial data (Manomaiphiboon et al., 2017), anthropogenic emissions for northern Thailand (Jansakoo et al., 2022), EDGAR-HTAP anthropogenic emissions (Janssens-Maenhout et al., 2015) elsewhere, and biogenic and fire emissions from MEGAN (Guenther et al., 2006) and FINNv1.5 (Wiedinmyer et al., 2011). To project fire emissions into the future (forecast mode), the assumption of persistent fire emissions was applied (Kumar et al., 2020). Initial and boundary conditions for meteorology and chemistry were derived from GFS (National Centers for Environmental Prediction/National Weather Service/NOAA/U.S. Department of Commerce, 2015) and CESM2-WACCM (Gettelman et al., 2019), respectively. The horizontal spatial resolution used in the WRF-Chem simulation was 9 km, covering mainland Southeast Asia. Since WRF-Chem uses a hybrid sigma–pressure, terrain-following coordinate system, the vertical resolution used in this study with 38 vertical levels varies with altitude. Near the surface (0 to ; 24 vertical levels), it ranges from about 45–50 m, increasing to approximately 70–250 m in the lower troposphere (∼1100–2000 m a.g.l.; 4 vertical levels). From the aerosol layer top to the mid-troposphere (∼2000–7000 m a.g.l.; 4 vertical levels), the resolution becomes coarser, ranging from 500 to 2000 m, and further coarsens to over 2000 m from the mid-troposphere to the upper troposphere and stratosphere (∼7000–20 000 m a.g.l.; 6 vertical levels), with finer resolution near the surface to capture smaller-scale processes and coarser resolution at higher altitudes where larger-scale dynamics dominate. The WRF-Chem simulations used in this study have been previously validated under similar regional conditions in northern Thailand. Prior work has demonstrated the model's reliability in capturing key atmospheric dynamics, including surface PM2.5 distributions, optical turbulence, and boundary layer processes. Notably, the model has been successfully applied in the following studies: Bran et al. (2022, 2024) and Macatangay et al. (2024). These validations support the robustness of WRF-Chem for use as a benchmark in our comparison with lidar-derived PBL heights.
This integrated methodology ensures better alignment of lidar-derived PBL heights with thermodynamic and aerosol boundaries, enhancing the reliability of boundary layer characterizations.
Figure 1 shows the NRB signal as a colored curtain plot, where the aerosol layer top (ALT) is marked as a white line, the time-varying maximum analysis altitude (MAA) as a gray line, and the refined PBL estimate as a red line. It is important to note that the MAA does not represent the PBL height but rather defines the maximum vertical range within which the wavelet covariance transform (WCT) analysis is conducted to detect the PBL height. For instance, if the MAA is set at 2.5 km a.g.l., the WCT algorithm only searches for the PBL height below that altitude. This adaptive constraint prevents overestimation of the PBL height, particularly during the nighttime or during the growth and decay phases of the boundary layer. The MAA is defined dynamically and follows the diurnal variation in surface temperature, providing a physically realistic ceiling for analysis that adjusts with expected atmospheric mixing.
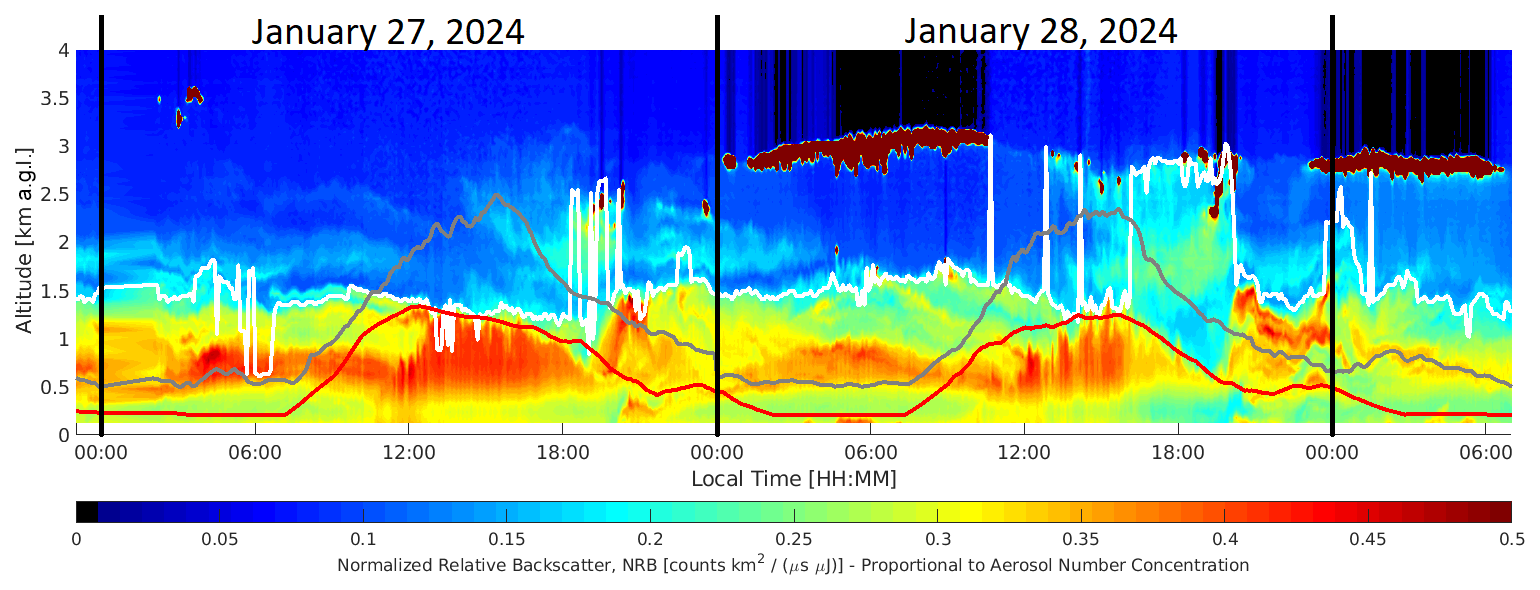
Figure 1The normalized relative backscatter (NRB) signal from the lidar is shown as a colored curtain plot, illustrating variations in aerosol number concentration over time. The aerosol layer top (ALT) is marked as a white line, the time-varying maximum analysis altitude (MAA) as a gray line, and the refined planetary boundary layer (PBL) estimate as a red line. The MAA does not represent the PBL height; rather, it defines the maximum altitude (in km a.g.l.) up to which the WCT algorithm is applied to detect the PBL height. The MAA is dynamically adjusted based on surface temperature to follow the expected diurnal evolution of the boundary layer and to avoid overestimating the PBL height, particularly during the nighttime and transitional phases. Data shown here were collected on 27–29 January 2024.
During 00:00–06:00 LT, conventional PBL detection methods often mischaracterize the PBL height by incorrectly identifying the residual-layer top or aerosol layer top as the PBL. However, during the well-mixed part of the day and under cloud-free conditions (12:00–16:00 LT on 27 January), the red PBL line closely aligns with the white ALT line. This alignment indicates a well-defined mixing layer, allowing for an accurate determination of the mixing-layer height (MLH).
Under partly cloudy conditions (such as on 28 January during the afternoon between 12:00–16:00 LT), conventional algorithms misclassify the cloud base as the PBL height. In contrast, the refined red PBL line successfully separates from the white ALT line and follows the expected diurnal development, demonstrating improved reliability in characterizing the boundary layer, especially in aerosol-rich and meteorologically complex environments.
Transitional periods, such as the morning PBL growth phase (06:00–12:00 LT) and evening decay (16:00–00:00 LT), pose challenges due to aerosol accumulation in residual layers, which creates ambiguous gradients in the NRB signal. By incorporating the novel time-varying MAA and refining the PBL estimates, these limitations are mitigated.
Figures 2 and 3 demonstrate the improved alignment of these estimates with radiosonde data and highlight discrepancies with the WRF-Chem model simulations, respectively. Radiosonde-derived PBL heights, computed using first derivatives of meteorological parameters, provide a baseline comparison but are limited to once-daily measurements at 07:00 LT, often capturing the minimum PBL height. The temperature-based MAA method offers greater temporal resolution and adaptability, enhancing its reliability in capturing diurnal variations and transitions between the PBL and the ALT.
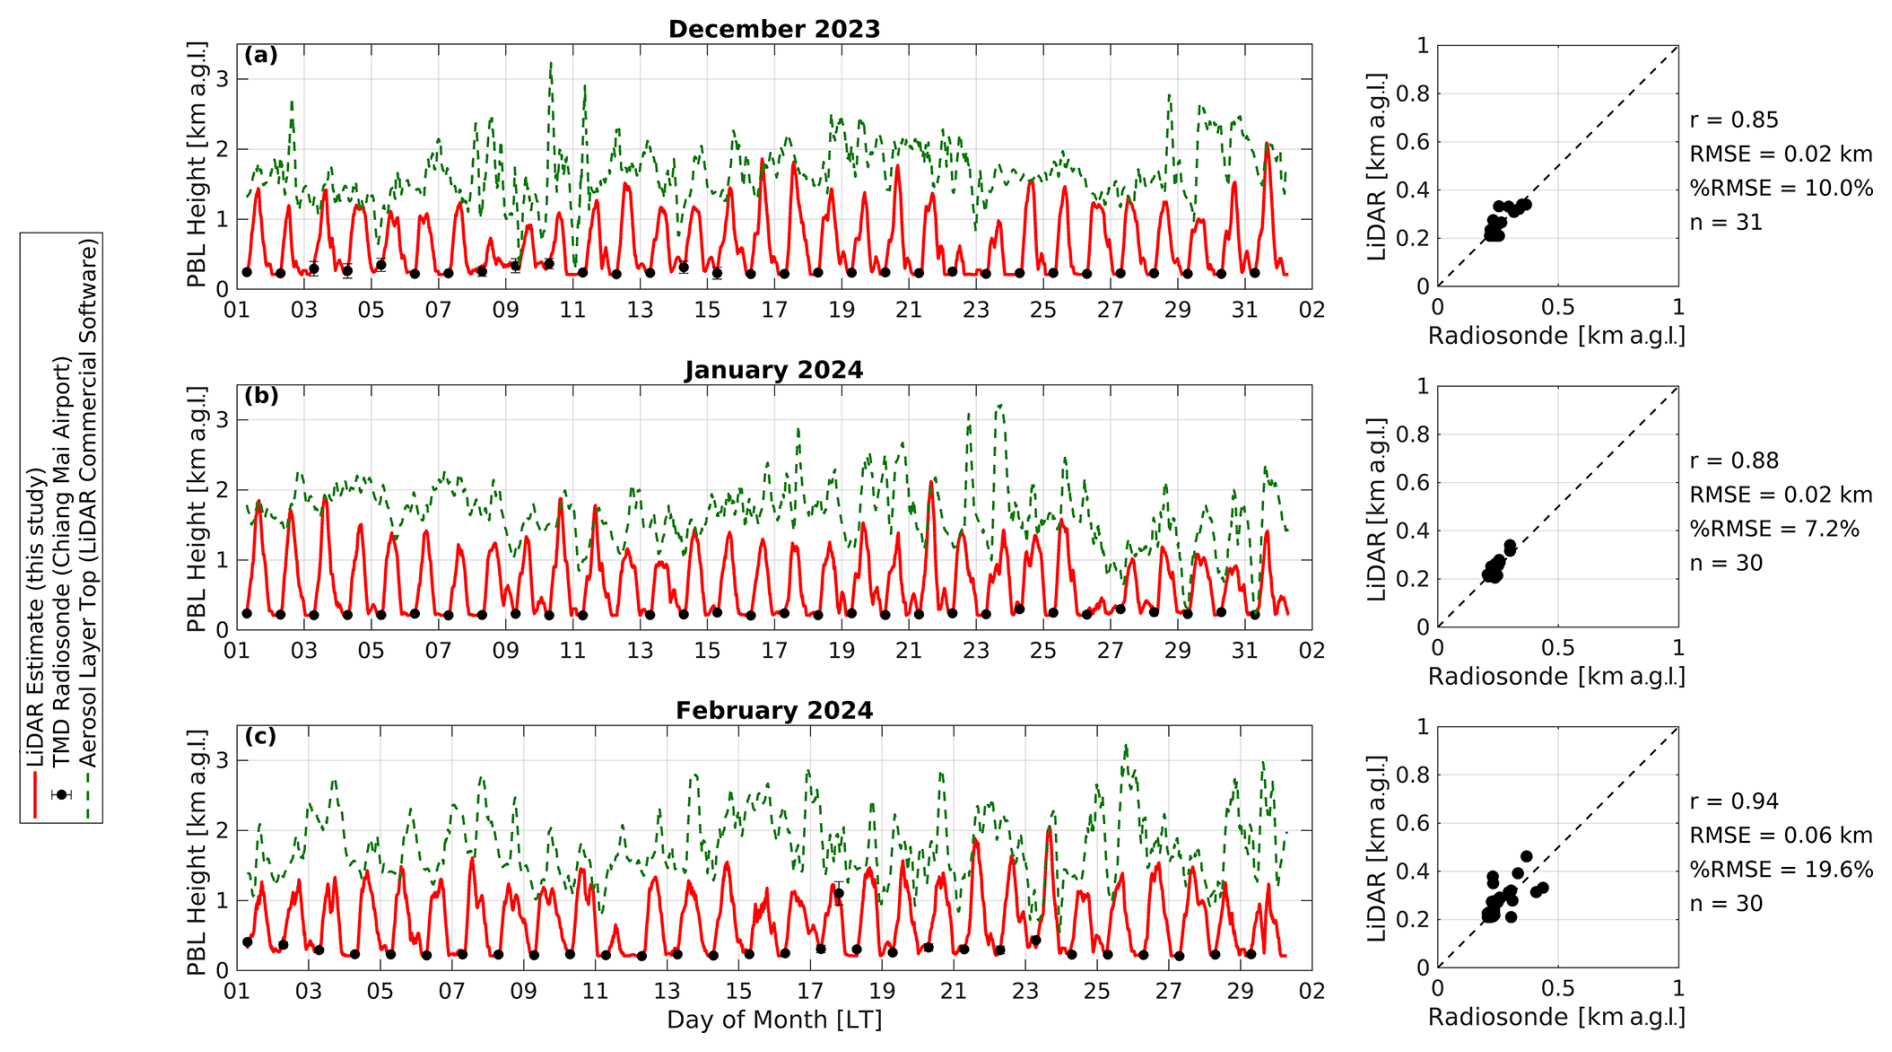
Figure 2Comparison of planetary boundary layer (PBL) height estimates derived from this study's lidar retrievals (red curve), TMD radiosonde measurements at Chiang Mai Airport (black points), and aerosol layer top (ALT) heights calculated using commercial lidar software (dashed green line) for (a) December 2023, (b) January 2024, and (c) February 2024 at NARIT AstroPark, Chiang Mai, northern Thailand. The right panels show the correlations between lidar-based PBL estimates and radiosonde-derived heights, with Pearson correlation coefficients (r values) and %RMSEs ranging from 0.85 to 0.94 and 7.2 % to 19.6 %, respectively, for each month.
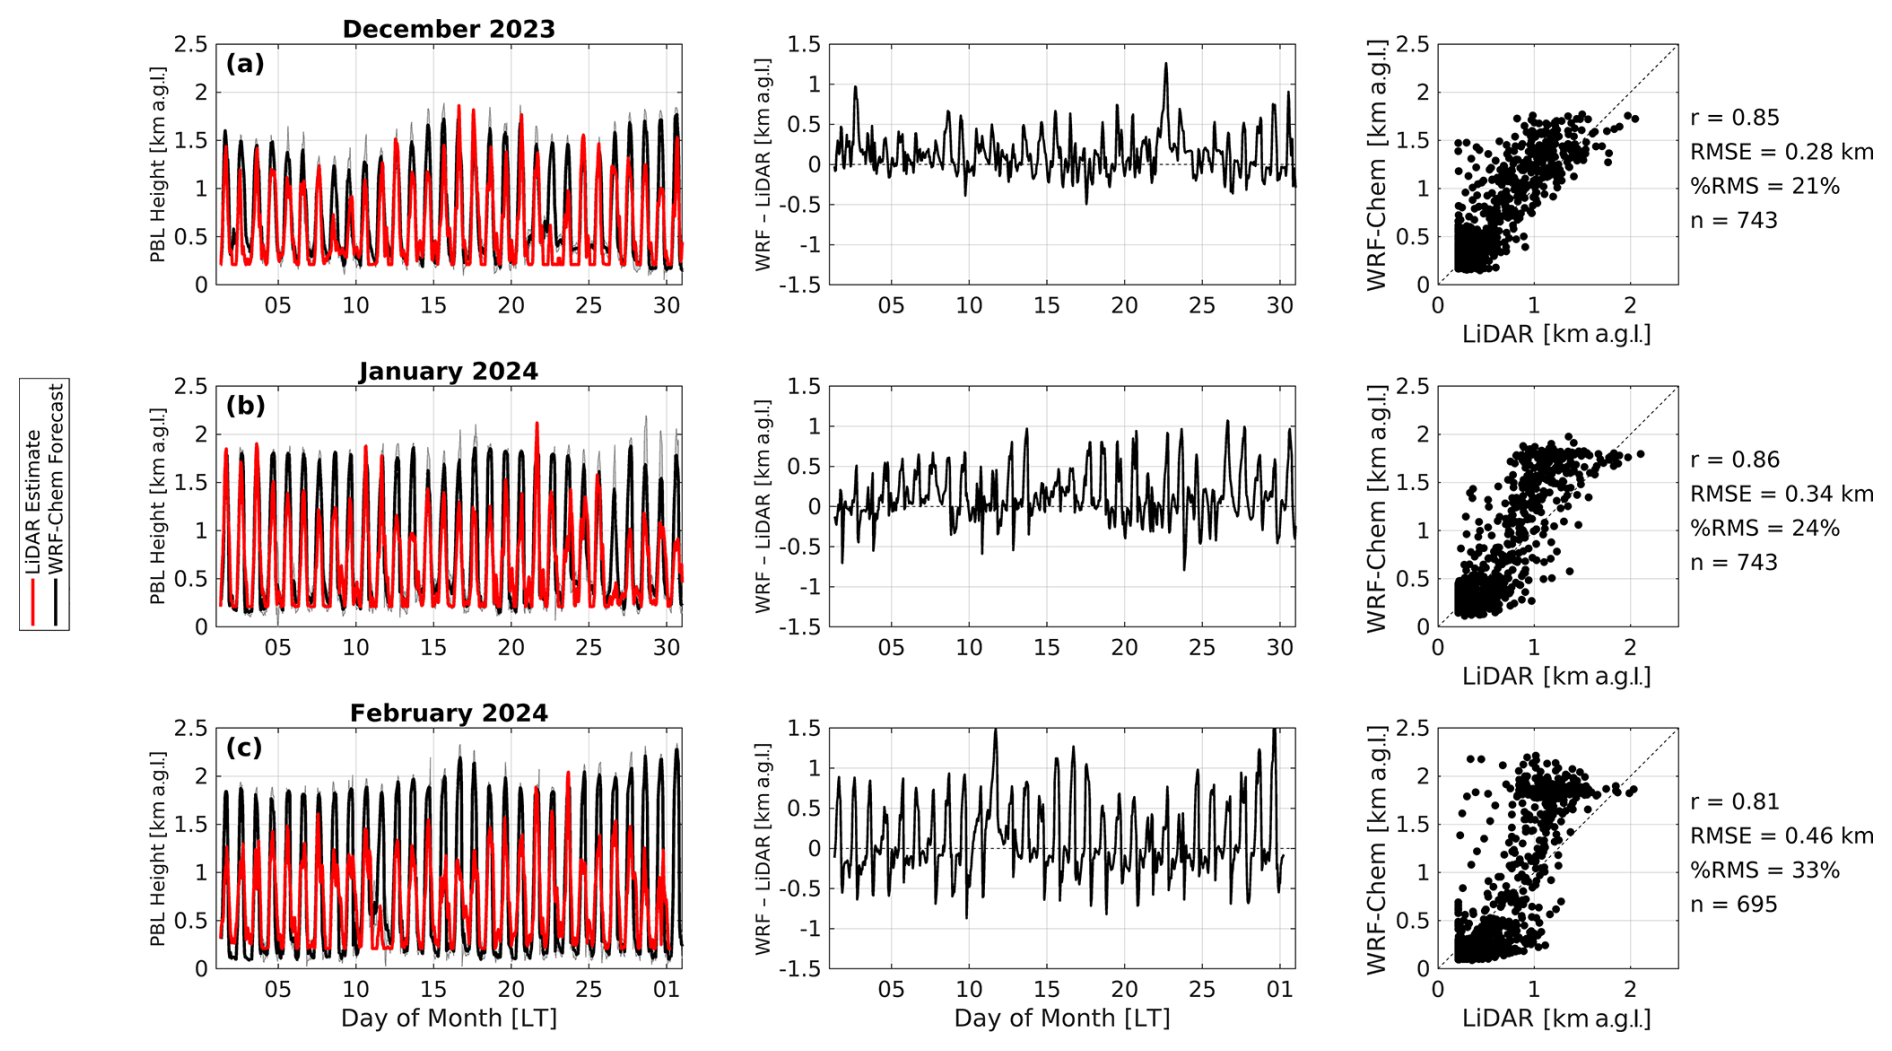
Figure 3Comparison of planetary boundary layer (PBL) height estimates from lidar retrievals (red line) and WRF-Chem forecasts (black line) at NARIT AstroPark, Chiang Mai, Thailand, for (a) December 2023, (b) January 2024, and (c) February 2024 (left column). The middle column shows time series of differences between WRF-Chem and lidar estimates (WRF − lidar), while the right column presents scatterplots with correlation coefficients (r), root mean square error (RMSE), percentage RMSE (%RMSE), and number of matched data points (n). The WRF-Chem model configuration used in this comparison has been previously validated under similar regional conditions in northern Thailand, supporting its use as a reference for PBL height estimation.
Figure 2 illustrates the variability in the PBL height and ALT under different atmospheric conditions for December 2023, January 2024, and February 2024. The lidar-derived PBL height (red curve) exhibits a pronounced diurnal cycle, peaking during the day due to solar-driven convection and decreasing at night under stable conditions. The radiosonde measurements (black points) closely align with the lidar-derived PBL heights, providing independent validation. However, their representativeness is limited by the once-daily launch at 07:00 LT (00:00 UTC), coinciding with the early-morning minimum PBL height. In December 2023, the lidar-derived PBL height ranges between 0.1 and 1.5 km a.g.l., with radiosonde values exhibiting strong agreement and a correlation coefficient of r=0.85 and percentage root mean square error (%RMSE) of 10.0 %. In January 2024, the lidar PBL height varied between 0.1 and 1.6 km a.g.l., with excellent correlation to radiosonde measurements (r=0.88; %RMSE=7.2 %). Similarly, in February 2024, the lidar-derived PBL height ranges from 0.1 to 1.4 km a.g.l., maintaining a strong correlation with radiosonde data (r=0.94; %RMSE=19.6 %), despite some divergence under complex atmospheric conditions. The ALT (dashed green line), representing the upper boundary of significant aerosol backscatter, often exceeds the PBL height during stable nighttime conditions, in the presence of residual aerosol layers, or during aerosol entrainment into the free troposphere. By incorporating surface temperature variations, the proposed method effectively distinguishes the PBL height from the ALT, addressing challenges during transitions between daytime and nighttime conditions. While the PBL height is primarily governed by thermodynamic properties and turbulent mixing, the ALT reflects aerosol stratification and distribution. These layers typically align during well-mixed daytime conditions (mixing-layer height), but they diverge under stratified or complex layering scenarios, emphasizing the necessity of distinguishing between them for accurate air quality modeling and pollutant transport analysis.
Figure 3 compares PBL height estimates from lidar retrievals (red line) and WRF-Chem forecasts (black line) for December 2023, January 2024, and February 2024 at NARIT AstroPark in Chiang Mai, northern Thailand. While the WRF-Chem model generally captures seasonal and diurnal variations in PBL height, it tends to overestimate daytime PBL heights during periods of elevated aerosol loading. This behavior persisted across simulations using different PBL parameterizations (e.g., MYNN2.5, MYNN3, and YSU) and varied fire and anthropogenic emission inputs, suggesting a consistent model response to aerosol–meteorology coupling. The overestimation likely stems from limitations in how current model configurations, particularly those using the MYNN Level 3 scheme, represent aerosol–meteorology–radiation interactions and their feedbacks on turbulence generation and vertical mixing (Du et al., 2020; Petäjä et al., 2016). Correlation coefficients (r=0.85, 0.86, and 0.81 for December, January, and February, respectively) indicate strong agreement between lidar retrievals and model outputs. However, the root mean square error (RMSE) and percentage RMSE (%RMSE) increased from December (0.28 km, 21 %) to February (0.46 km, 33 %), coinciding with peak fire activity. This degradation in model performance further supports the hypothesis that persistent fire emissions amplify the aerosol burden, modifying radiative transfer and boundary layer stability in ways that are not fully captured by current parameterizations (Kumar et al., 2020). These findings underscore the need to refine PBL schemes and improve aerosol–radiation feedback representation in regional models operating under high-aerosol-loading conditions.
These results underscore the significance of dynamic adjustments in lidar analyses for improved boundary layer characterization and the critical need to address limitations in both observational and modeling techniques for regions with complex atmospheric conditions.
This study successfully demonstrated the decoupling of the planetary boundary layer (PBL) height, mixing-layer height (MLH), and aerosol layer top (ALT) using high-resolution lidar measurements in Chiang Mai, northern Thailand. By applying a novel temperature-based dynamic maximum analysis altitude (MAA) approach, the research overcame limitations of conventional methods, such as the Haar wavelet covariance transform (WCT), which often misinterprets the ALT as the PBL height, particularly during the nighttime or transitional periods. The proposed method, integrating normalized relative backscatter (NRB) profiles with surface temperature observations, improves the accuracy of PBL height estimations by accounting for variations in thermodynamic and atmospheric conditions. The results showed good agreement with both radiosonde data and WRF-Chem simulations (up to moderate aerosol loads), emphasizing the value of dynamic adjustments in refining boundary layer characterizations.
This study highlights the complexities of aerosol layering and PBL identification in regions with high aerosol loading, such as Chiang Mai, where seasonal forest fires and agricultural burning contribute to significant atmospheric pollution. By enhancing the accuracy of lidar-based PBL height estimations, the research provides critical insights for improving air quality modeling and understanding pollutant transport under complex meteorological conditions. The results demonstrate a generally consistent relationship between lidar-derived and model-based PBL height estimates, with seasonal variations in agreement metrics. The WRF-Chem model configuration, previously validated over northern Thailand for air quality, turbulence, and PBL structure, continues to perform reliably as a comparison benchmark. These findings support the value of integrating high-resolution lidar retrievals with regional models to evaluate boundary layer processes and diagnose modeling uncertainties across different seasons.
Future research should focus on refining the dynamic MAA approach to lidar methodology for better handling of extreme atmospheric conditions, such as high aerosol loads and abrupt meteorological changes, while its applicability to regions with diverse aerosol profiles should be expanded to validate robustness. Integrating lidar with other remote sensing tools like radar or satellite-based sensors could enhance the accuracy and spatial resolution of PBL and aerosol layer measurements, particularly in areas with dense cloud cover or frequent atmospheric transitions. To address the limitations of once-daily radiosonde measurements, more frequent launches or the adoption of continuous vertical profiling instruments is recommended to capture diurnal variations more effectively, providing a richer dataset for model validation. Comparisons of lidar-derived PBL estimates with simulations from models like WRF-Chem are essential to evaluate model accuracy under high-aerosol conditions and to improve parameterizations for aerosol transport and mixing. Finally, refined PBL height estimation methods can enhance air quality forecasting systems, improving pollutant dispersion predictions and supporting more effective public health advisories and mitigation strategies in regions such as northern Thailand with significant seasonal aerosol emissions.
The code underlying this article will be shared on reasonable request to the corresponding author.
The data underlying this article will be shared on reasonable request to the corresponding author.
RM conceived and led the study. He developed the novel PBL retrieval algorithm and the lidar–radiosonde–WRF-Chem comparison framework, designed the analysis pipeline, acquired funding, supervised all research phases, and was the main author of the original draft and manuscript revisions.
ThS led the analysis of the lidar datasets and contributed to conceptual development in collaboration. She investigated the limitations of conventional planetary boundary layer (PBL) estimation based on the Haar wavelet covariance transform (WCT) technique, co-supervised field deployments, and co-refined the key retrieval algorithm, including statistical analysis and validation. She contributed to both the original draft and subsequent revisions, shaping the manuscript's scientific framing.
SHB developed and implemented the WRF-Chem forecasting system and performed sensitivity analyses to optimize its configuration for the study region.
WT implemented the Haar wavelet covariance transform (WCT) based on the Ceilo code.
TiS secured project funding, coordinated with institutional stakeholders, and managed overall project logistics and reporting.
MP maintained the lidar system, ensuring continuous data acquisition throughout the campaign.
JL supported on-site logistics, including equipment transport and compliance with safety protocols.
RS contributed early insights into the limitations of conventional PBL estimation techniques and provided critical feedback during the manuscript editing phase.
BST indirectly contributed to conceptualization, methodology, and resource sharing through a parallel project on tethered balloon profiling, which informed aspects of the lidar–radiosonde comparison.
AH indirectly supported the technical framework through his involvement in the tethered balloon project, contributing to methodological alignment and shared resources.
All authors reviewed and approved the final paper.
The contact author has declared that none of the authors has any competing interests.
Publisher's note: Copernicus Publications remains neutral with regard to jurisdictional claims made in the text, published maps, institutional affiliations, or any other geographical representation in this paper. While Copernicus Publications makes every effort to include appropriate place names, the final responsibility lies with the authors.
The authors would like to thank the following people: Vilasinee Thumrongchadthai, Panittha Chumpu, Kunakorn Kaewboonpan, Aunnicha Kanipongthanasorn, Natthida Yarangsri, Thammarat Phaengmaphom, Jirasak Noisapung, Vichawan Sakulsupich, Utane Sawangwit, Suchinno Kanthum, Supachai Awiphan, and members of the HPC, OPD, and management teams of NARIT.
The authors would also like to acknowledge the use of AI tools to assist in improving the language and readability of an earlier version of this paper. These tools were used solely to enhance clarity and ensure the paper can be easily understood. No AI tools were used to generate insights or analysis related to the research work presented.
This research has been supported by the Thailand Science Research and Innovation (grant no. FFB680072/0269).
This paper was edited by Edward Nowottnick and reviewed by two anonymous referees.
Bran, S. H., Macatangay, R., Surapipith, V., Chotamonsak, C., Chantara, S., Han, Z., and Li, J.: Surface PM2.5 mass concentrations during the dry season over northern Thailand: Sensitivity to model aerosol chemical schemes and the effects on regional meteorology, Atmos. Res., 277, 106303, https://doi.org/10.1016/j.atmosres.2022.106303, 2022.
Bran, S. H., Macatangay, R., Chotamonsak, C., Chantara, S., and Surapipith, V.: Understanding the seasonal dynamics of surface PM2.5 mass distribution and source contributions over Thailand, Atmos. Environ., 331, 120613, https://doi.org/10.1016/j.atmosenv.2024.120613, 2024.
Brooks, I.: Finding boundary layer top: application of a wavelet covariance transform to lidar backscatter profiles, J. Atmos. Ocean. Tech., 20, 1092–1105, 2003.
Campbell, J. R., Hlavka, D. L., Welton, E. J., Flynn, C. J., Turner, D. D., Spinhirne, J. D., Scott, V. S., and Hwang, I. H.: Full-time, Eye-Safe Cloud and Aerosol Lidar Observation at Atmospheric Radiation Measurement Program Sites: Instrument and Data Processing, J. Atmos. Ocean. Tech., 19, 431–442, 2002.
Ceilo code: Ceilometer Layer Identification and Optimization, GitHub [code], https://eprccaunam.github.io/ceilo/master.html, last access: 5 September 2025.
Dang, R., Yang, Y., Hu, X.-M., Wang, Z., and Zhang, S.: A Review of Techniques for Diagnosing the Atmospheric Boundary Layer Height (ABLH) Using Aerosol Lidar Data, Remote Sens.-Basel, 11, 1590, https://doi.org/10.3390/rs11131590, 2019a.
Dang, R., Yang, Y., Li, H., Hu, X.-M., Wang, Z., Huang, Z., Zhou, T., and Zhang, T.: Atmosphere Boundary Layer Height (ABLH) Determination under Multiple-Layer Conditions Using Micro-Pulse Lidar, Remote Sens.-Basel, 11, 263, https://doi.org/10.3390/rs11030263, 2019b.
De Wekker, S. F. J. and Kossmann, M.: Convective boundary layer heights over mountainous terrain – a review of concepts, Front. Earth Sci., 3, 77, https://doi.org/10.3389/feart.2015.00077, 2015.
Du, Q., Zhao, C., Zhang, M., Dong, X., Chen, Y., Liu, Z., Hu, Z., Zhang, Q., Li, Y., Yuan, R., and Miao, S.: Modeling diurnal variation of surface PM2.5 concentrations over East China with WRF-Chem: impacts from boundary-layer mixing and anthropogenic emission, Atmos. Chem. Phys., 20, 2839–2863, https://doi.org/10.5194/acp-20-2839-2020, 2020.
Ferrare, R., Swanson, A. J., Hostetler, C., Hair, J., Obland, M., Rogers, R., Cook, A., Harper, D., Hare, R., Burton, S., Hoff, R., Delgado, R., Compton, J., Berkoff, T., Joseph, E., Thompson, A., Lenschow, D., and Lee, P.: NASA DISCOVER-AQ Workshop: PBL and aerosol height measurements using HSRL, DISCOVER-AQ Workshop, Marriott City Center, Newport News, Virginia, USA, 14–16 February 2012, NASA Science, https://science.larc.nasa.gov/wp-content/uploads/sites/147/2022/09/Ferrare_PBL.pdf (last access: 5 September 2025), 2012.
Garratt, J. R.: The Atmospheric Boundary Layer, Cambridge Univ. Press, ISBN 13 978-0521467452, ISBN 10 0521467454, 1994.
Gettelman, A., Mills, M. J., Kinnison, D. E., Garcia, R. R., Smith, A. K., Marsh, D. R., Tilmes, S., Vitt, F., Bardeen, C. G., McInerny, J., Liu, H.-L., Solomon, S. C., Polvani, L. M., Emmons, L. K., Lamarque, J.-F., Richter, J. H., Glanville, A. S., Bacmeister, J. T., Phillips, A. S., Neale, R. B., Simpson, I. R., DuVivier, A. K., Hodzic, A., and Randel, W. J.: The Whole Atmosphere Community Climate Model Version 6 (WACCM6), J. Geophys. Res.-Atmos., 124, 12380–12403, https://doi.org/10.1029/2019JD030943, 2019.
Guenther, A., Karl, T., Harley, P., Wiedinmyer, C., Palmer, P. I., and Geron, C.: Estimates of global terrestrial isoprene emissions using MEGAN (Model of Emissions of Gases and Aerosols from Nature), Atmos. Chem. Phys., 6, 3181–3210, https://doi.org/10.5194/acp-6-3181-2006, 2006.
Han, B., Zhou, T., Zhou, X., Fang, S., Huang, J., He, Q., Huang, Z., and Wang, M.: A New Algorithm of Atmospheric Boundary Layer Height Determined from Polarization Lidar, Remote Sens.-Basel, 14, 5436, https://doi.org/10.3390/rs14215436, 2022.
Hennemuth, B. and Lammert, A.: Determination of the atmospheric boundary layer height from radiosonde and lidar backscatter, Bound.-Layer Meteorol., 120, 181–200, https://doi.org/10.1007/s10546-005-9035-3, 2006.
Jansakoo, T., Surapipith, V., and Macatangay, R.: EnvironmentAsia, 15, 26–32, https://doi.org/10.14456/ea.2022.19, 2022.
Janssens-Maenhout, G., Crippa, M., Guizzardi, D., Dentener, F., Muntean, M., Pouliot, G., Keating, T., Zhang, Q., Kurokawa, J., Wankmüller, R., Denier van der Gon, H., Kuenen, J. J. P., Klimont, Z., Frost, G., Darras, S., Koffi, B., and Li, M.: HTAP_v2.2: a mosaic of regional and global emission grid maps for 2008 and 2010 to study hemispheric transport of air pollution, Atmos. Chem. Phys., 15, 11411–11432, https://doi.org/10.5194/acp-15-11411-2015, 2015.
Kumar, R., Ghude, S. D., Biswas, M., Jena, C., Alessandrini, S., Debnath, S., Kulkarni, S., Sperati, S., Soni, V. K., Nanjundiah, R. S., and Rajeevan, M.: Enhancing accuracy of air quality and temperature forecasts during paddy crop residue burning season in Delhi via chemical data assimilation, J. Geophys. Res.-Atmos., 125, e2020JD033019, https://doi.org/10.1029/2020JD033019, 2020.
Li, H., Yang, Y., Hu, X.-M., Huang, Z., Wang, G., and Zhang, B.: Application of Convective Condensation Level Limiter in Convective Boundary Layer Height Retrieval Based on Lidar Data, Atmosphere-Basel, 8, 79, https://doi.org/10.3390/atmos8040079, 2017.
Liu, S. and Liang, X.-Z.: Observed diurnal cycle climatology of planetary boundary layer height, J. Climate, 23, 5790–5809, https://doi.org/10.1175/2010JCLI3552.1, 2010.
Liu, Z., Chang, J., Li, H., Chen, S., and Dai, T.: Estimating Boundary Layer Height from LiDAR Data under Complex Atmospheric Conditions Using Machine Learning, Remote Sens.-Basel, 14, 418, https://doi.org/10.3390/rs14020418, 2022.
Macatangay, R., Thongsame, W., Solanki, R., Wu, Y.-J., Wang, S.-H., Supasri, T., and Noisapung, J.: Improved mixing height estimates from atmospheric LiDAR measurements, J. Phys. Conf. Ser., 2145, 012053, https://doi.org/10.1088/1742-6596/2145/1/012053, 2021.
Macatangay, R., Rattanasoon, S., Butterley, T., Bran, S. H., Sonkaew, T., Sukaum, B., Sookjai, D., Panya, M., and Supasri, T.: Seeing and turbulence profile simulations over complex terrain at the Thai National Observatory using a chemistry-coupled regional forecasting model, Mon. Not. R. Astron. Soc., 530, 1414–1423, https://doi.org/10.1093/mnras/stae727, 2024.
Manomaiphiboon, K., Boonya-Aroonnet, S., Sarinnapakorn, K., Assareh, N., Aman, N., Tantianuparp, P., Thodsan, T., and Pratumthong, A.: Final Report, Hydro and Agro Informatics Institute, 2017.
National Centers for Environmental Prediction/National Weather Service/NOAA/U.S. Department of Commerce: NCEP GDAS/FNL 0.25 Degree Global Tropospheric Analyses and Forecast Grids, NSF NCAR Research Data Archive (RDA) [data set], https://doi.org/10.5065/D65Q4T4Z, 2015.
Olson, J. B., Kenyon, J. S., Angevine, W. A., Brown, J. M., Pagowski, M., and Sušelj, K.: A Description of the MYNN-EDMF Scheme and the Coupling to Other Components in WRF–ARW, NOAA Technical Memorandum OAR GSD, 61, Earth System Research Laboratory, NOAA, https://doi.org/10.25923/n9wm-be49, 2019.
Pan, Y., Wang, Q., Ma, P., Jia, X., Liao, Z., Dou, Y., Cheng, Z., Zhang, Z., Li, L., Xin, J., Wang, Y., and Quan, J.: A new algorithm for planetary boundary layer height calculation based on multilayer recognition, Atmos. Environ., 271, 118919, https://doi.org/10.1016/j.atmosenv.2021.118919, 2022.
Petäjä, T., Järvi, L., Kerminen, V.-M., Ding, A., Sun, J., Nie, W., Kujansuu, J., Virkkula, A., Yang, X., Fu, C., and Kulmala, M.: Enhanced air pollution via aerosol-boundary layer feedback in China, Sci. Rep.-UK, 6, 18998, https://doi.org/10.1038/srep18998, 2016.
Seibert, P., Beyrich, F., Gryning, S.-E., Joffre, S., Rasmussen, A., and Tercier, P.: Review and intercomparison of operational methods for the determination of the mixing height, Atmos. Environ., 34, 1001–1027, https://doi.org/10.1016/S1352-2310(99)00349-0, 2000.
Shen, L., Zhang, J., Cheng, Y., Lu, X., Dai, H., Wu, D., Chen, D.-R., Liu, J., and Gui, H.: Characterization of the vertical evolution of urban nocturnal boundary layer by UAV measurements: Insights into relations to cloud radiative effect, Environ. Res., 232, 116323, https://doi.org/10.1016/j.envres.2023.116323, 2023.
Skamarock, W. C., Klemp, J. B., Dudhia, J., Gill, D. O., Barker, D. M., Duda, M. G., Huang, X.-Y., Wang, W., and Powers, J. G.: A Description of the Advanced Research WRF Version 3, NCAR Tech. Note NCAR/TN-475+STR, https://doi.org/10.5065/D68S4MVH, 2008.
Solanki, R., Macatangay, R., Sakulsupich, V., Sonkaew, T., and Mahapatra, P. S.: Mixing Layer Height Retrievals From MiniMPL Measurements in the Chiang Mai Valley: Implications for Particulate Matter Pollution, Front. Earth Sci., 7, 308, https://doi.org/10.3389/feart.2019.00308, 2019.
Stull, R. B.: An Introduction to Boundary Layer Meteorology, Springer Netherlands, https://doi.org/10.1007/978-94-009-3027-8, 1988.
Su, T., Li, Z., and Kahn, R.: Relationships between the planetary boundary layer height and surface pollutants derived from lidar observations over China: regional pattern and influencing factors, Atmos. Chem. Phys., 18, 15921–15935, https://doi.org/10.5194/acp-18-15921-2018, 2018.
Tennekes, H.: A model for the dynamics of the inversion above a convective boundary layer, J. Atmos. Sci., 30, 558–567, https://doi.org/10.1175/1520-0469(1973)030<0558:AMFTDO>2.0.CO;2, 1973.
Toledo, D., Córdoba-Jabonero, C., Adame, J. A., De La Morena, B., and Gil-Ojeda, M.: Estimation of the atmospheric boundary layer height during different atmospheric conditions: A comparison on the reliability of several methods applied to lidar measurements, Int. J. Remote Sens., 38, 3203–3218, https://doi.org/10.1080/01431161.2017.1292068, 2017.
Vishnu, R., Bhavani Kumar, Y., Sinha, P. R., Narayana Rao, T., James Jebaseelan Samuel, E., and Kumar, P.: Comparison of mixing layer heights determined using LiDAR, radiosonde, and numerical weather prediction model at a rural site in southern India, Int. J. Remote Sens., 38, 6366–6385, https://doi.org/10.1080/01431161.2017.1354264, 2017.
Wang, X. Y. and Wang, K. C.: Estimation of atmospheric mixing layer height from radiosonde data, Atmos. Meas. Tech., 7, 1701–1709, https://doi.org/10.5194/amt-7-1701-2014, 2014.
Wiedinmyer, C., Akagi, S. K., Yokelson, R. J., Emmons, L. K., Al-Saadi, J. A., Orlando, J. J., and Soja, A. J.: The Fire INventory from NCAR (FINN): a high resolution global model to estimate the emissions from open burning, Geosci. Model Dev., 4, 625–641, https://doi.org/10.5194/gmd-4-625-2011, 2011.
Zhang, Y., Chen, S., Chen, S., Chen, H., and Guo, P.: A novel lidar gradient cluster analysis method of nocturnal boundary layer detection during air pollution episodes, Atmos. Meas. Tech., 13, 6675–6689, https://doi.org/10.5194/amt-13-6675-2020, 2020.
Zhong, T., Wang, N., Shen, X., Xiao, D., Xiang, Z., and Liu, D.: Determination of Planetary Boundary Layer height with Lidar Signals Using Maximum Limited Height Initialization and Range Restriction (MLHI-RR), Remote Sens.-Basel, 12, 2272, https://doi.org/10.3390/rs12142272, 2020.