the Creative Commons Attribution 4.0 License.
the Creative Commons Attribution 4.0 License.
 | 21 Oct 2025
Design and application of two consistency verification methods for weather radar networks in the South China region
Heng Hu
Shunqiang Pei
Lei Wu
Nan Shao
Chunyan Zhang
Hao Wen
Yunlei Liu
The observational consistency between ground-based weather radars significantly impacts the quality of mosaic products and severe convection identification products. The real-time monitoring of observational biases between radars can provide a basis for calibration and validation. This study designed a consistency verification method for weather radar networks based on the FY-3G precipitation radar (SGRCM) and a ground-based weather radar network consistency verification method (AWRCM). From January to October 2024, observational experiments were conducted in the South China region involving 19 S-band weather radars and 13 X-band phased-array weather radars. The aim was to analyze the influencing factors of the consistency verification methods and the observational biases of reflectivity factors for radars with different bands and systems. For the S-band weather radars, the difference in the bias between the two methods ranged from −1.5 to 1.4 dB, and the difference in the standard deviation ranged from −1.2 to 1.2 dB. For the X-band phased-array weather radars, the difference in the bias between the two methods ranged from −6.67 to 0.84 dB, and the difference in the standard deviation ranged from −0.38 to 1.51 dB. The evaluation results of the two methods show good consistency for weather radars with different bands. We selected one radar with a larger bias for recalibration and rectification, and the changes in bias before and after rectification thus provide a good indication of the improvement in network consistency among the radars.
- Article
(8839 KB) - Full-text XML
- BibTeX
- EndNote


Currently, there are 252 new-generation weather radars in operational use across mainland China (137 S-band and 115 C-band radars), with over 300 X-band weather radars. Except for certain mountainous and desert regions in the west, the new-generation weather radars cover most of the densely populated areas of the country. In regions with densely deployed radar sites, there are various degrees of overlap between adjacent radars. It has been observed that, over long-term operational use, radar reflectivity errors are influenced by factors such as an inadequate calibration of radar equipment parameters, beam blocking (Dinku et al., 2002; Liu et al., 2020), clutter interference, and electromagnetic interference in radar rainfall measurement (Tang et al., 2020; Zhang, 2018). These errors result in different observational outcomes from various radars for the same meteorological target due to influences such as the direction of the target, atmospheric conditions, attenuation, obstruction, and clutter. Echo intensity has always been an important parameter for identifying severe convective weather, and it directly determines the accuracy of precipitation products estimated based on the Z–R relationship (Fabry and Zawadzki, 1995; Ryzhkov and Zrnić, 1998; Steiner et al., 1995; Bringi and Chandrasekar, 2001). If adjacent radars observe echo intensity values with discrepancies within overlapping areas during the same observation period, it can affect the quality of radar network mosaics and increase uncertainty in the assimilation of radar data with other data sources. Therefore, it is crucial to perform a scientific, quantitative analysis of echo consistency in overlapping areas observed by adjacent radars in order to identify and correct observation biases. Some studies have proposed algorithms for evaluating the consistency between adjacent radars and provided a quality control method for matching points (Gourley et al., 2003; Smith et al., 2016). Zhang and Liu (2011) interpolated radar echoes into a three-dimensional grid to analyze the consistency in the positioning and echo intensity of four radars in the North China region. Vukovic et al. (2014) analyzed the impact of beam blockage in overlap regions between adjacent radars. Wu et al. (2014) and Zhang et al. (2018) conducted comparative studies on the echo differences in consistency between phased-array weather radars and new-generation Doppler weather radars. Xiao and Liu (2006), Ye et al. (2020) studied the echo intensity consistency along equidistant lines between adjacent radars based on quality-controlled CAPPI data. However, the CAPPI interpolation algorithm itself introduces biases, which can lead to uncertain sources of error in the network consistency analysis results (Lakshmanan et al., 2003).
Using adjacent ground-based weather radars for a network consistency analysis can more easily identify observation biases in areas with dense radar deployment. However, in regions in the west with sparse radar stations, it may not be possible to match adjacent stations, thus necessitating the use of multi-source observational data for calibration, with precipitation satellite data being a commonly used reference standard. Internationally, the reflectivity factor deviations between satellite-borne precipitation radars, such as TRMM/PR (Tropical Rainfall Measuring Mission/precipitation radar) and GPM (Global Precipitation Mission), and ground-based radars are used to correct radar reflectivity values (Wang and Wolff, 2009; Park et al., 2015; Warren et al., 2018; Protat et al., 2022; Li et al., 2023). Domestically, He et al. (2002), Luo et al. (2015), Wang et al. (2015) compared the consistency between reflectivity measured using the TRMM precipitation radar and ground-based radar echo intensity in China.
However, the observational biases and stability of precipitation satellite data can also affect comparison results. Simply calculating quantitative biases between satellites and radars is not meaningful (Bolen and Chandrasekar, 2000; Schwaller and Morris, 2011). Using precipitation satellite data as a reference standard, transferring the systematic bias between ground-based weather radars and precipitation satellites to the results of a network consistency analysis for ground-based radars can help ascertain the observational biases of radars.
This study selects the South China region as the analysis area, where there is a rich variety of precipitation types and a wide distribution of multi-system and multi-band radars. Developing a multi-source integrated weather radar network consistency analysis method in this region will provide a solid basis for the method's promotion across China. We utilize observational data from China's independently developed FY-3G satellite, obtaining S/C/X-band reflectivity factors after quality control and frequency correction. During satellite overpasses, we perform spatiotemporal matching with ground-based radars to match overlapping areas and analyze deviations. The satellite–ground comparison results are then integrated into the ground-based radar network consistency results to finally determine the reflectivity factor observation biases of the weather radars. This approach provides a quantitative, automated method for the calibration and adjustment of ground-based weather radars.
2.1 Data Introduction
The FY-3G satellite, part of the third batch of FY-3 satellites, was successfully launched on 16 April 2023, from the Jiuquan Satellite Launch Center. The primary payload for precipitation measurement on this satellite is the Precipitation Measurement Radar (PMR), which includes both Ku- and Ka-band radars. This marks the first time China has achieved active satellite-based precipitation detection, with the ability to obtain three-dimensional structural information within precipitation systems. Both radars employ a fully matched scanning mode with a scanning angle of ±20°. The spatial resolution at the nadir point is 5 km, and the vertical resolution is 250 m. The design sensitivity is 18 dBZ for the Ku radar and 12 dBZ for the Ka radar (CMA, 2023; Wu, 2023).
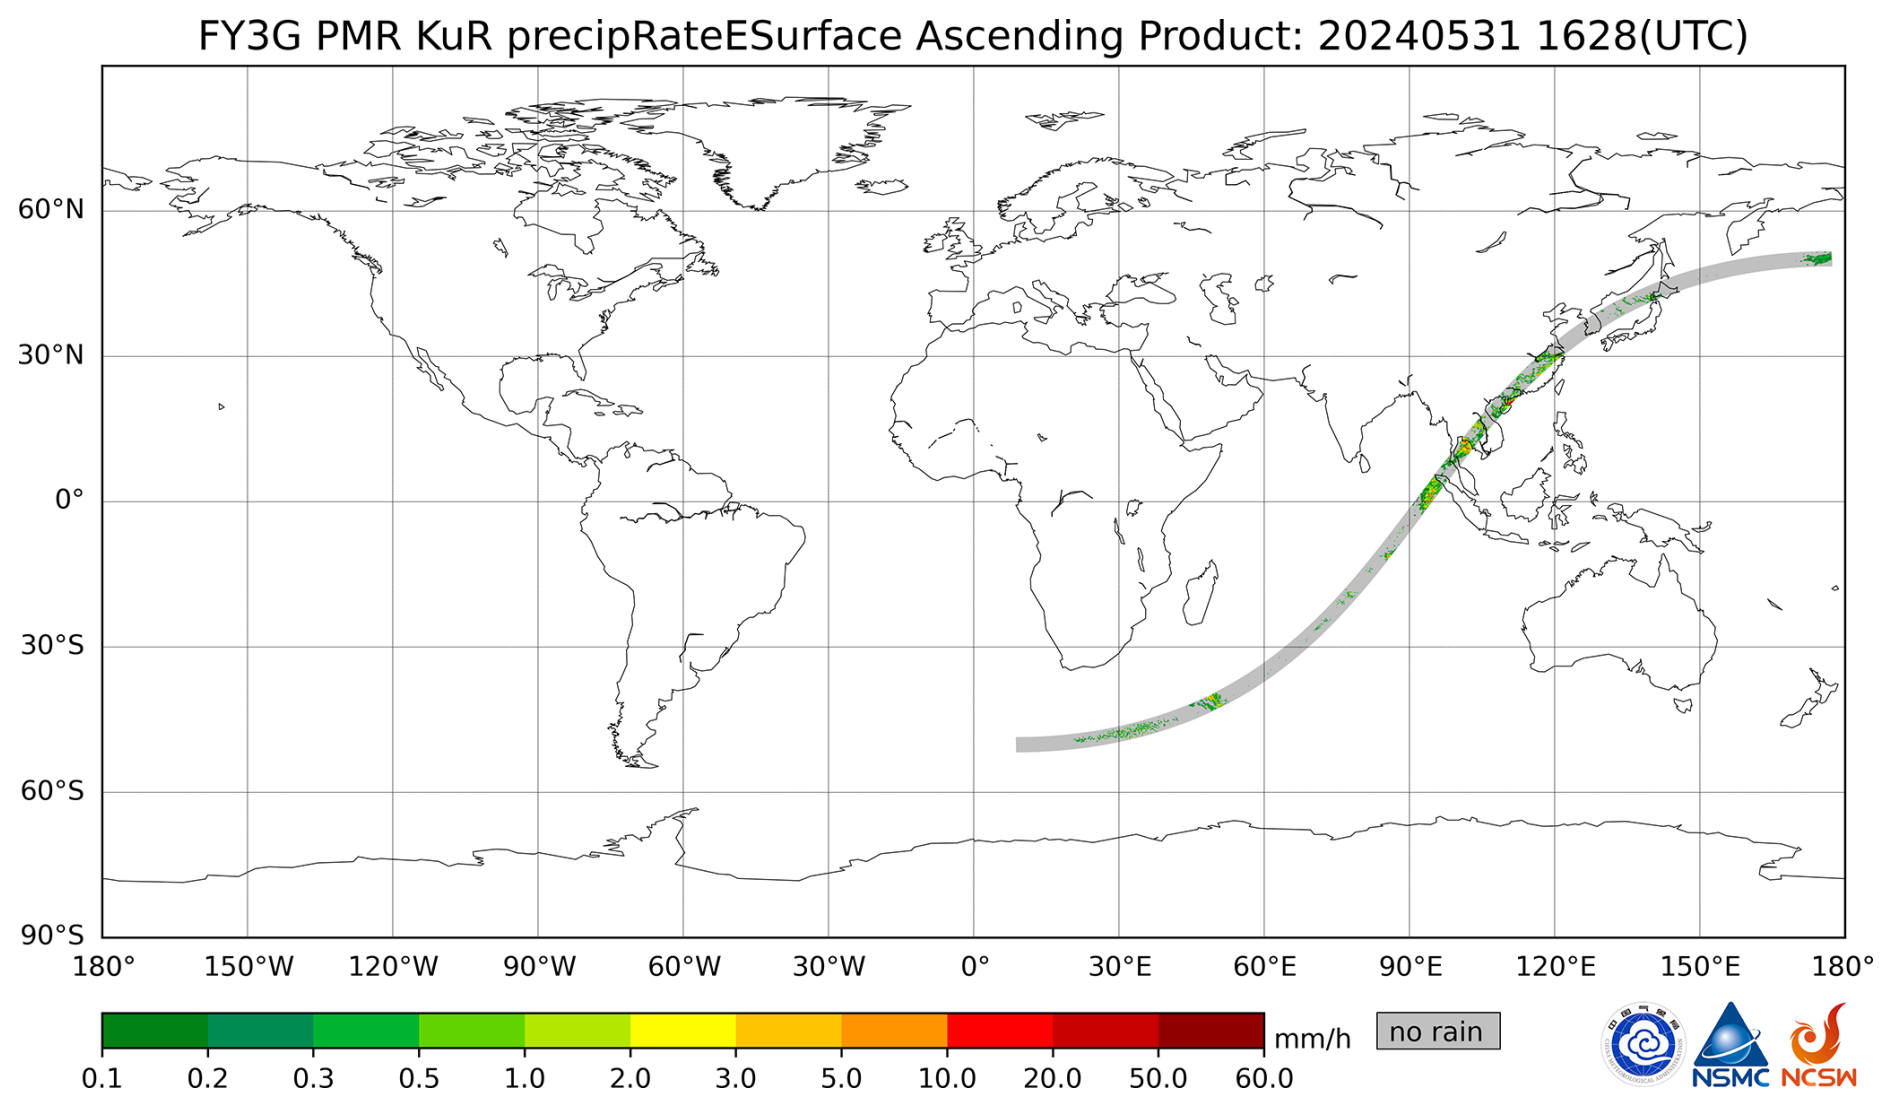
Figure 1Brief overview of descending orbit of FY-3G precipitation satellite PMR Ku radar (cited from the National Satellite Meteorological Center, The satellite operates in a south-to-north direction).
This study utilizes Level 2 products from the FY-3G precipitation measurement radar, focusing primarily on the radar reflectivity factors for both the ascending and descending tracks of the Ku radar, corrected for frequency (Wu et al., 2023). These Level 2 products are provided in a latitudinal and longitudinal grid format ranging from the ground up to 20 km, with a data structure of nscan × nray × nbin. Here, nscan represents the variable number of scan lines, nray denotes the number of angle units per scan line, and nbin refers to the number of vertical range bins. Figure 1 shows a brief overview of the descending orbit of the FY-3G precipitation satellite PMR Ku radar.
During the experiments, we used 19 S-band weather radars and 13 X-band phased-array radars. The distribution of the stations is shown in Fig. 2, and the specific hardware parameters are shown in Table A1. The ground-based weather radars use standard format base data. At present, the radars are undergoing mode switching trials and will automatically switch observation modes according to real-time weather conditions: VCP (Volume Coverage Pattern) 11 (for convective heavy precipitation), VCP21 (for stratiform precipitation), and VCP31 (for clear skies) (NWS, 2025). We selected 10 stations in the national S/C band weather radar network to conduct a consistency analysis before and after mode switching. The evaluation results from 2024 show that mode switching has no significant impact on the method design involved in this study. The SGRCM uses all elevation angle data from the radar, while the AWRCM only uses the lowest 5 elevation angles, primarily to consider calculation efficiency.
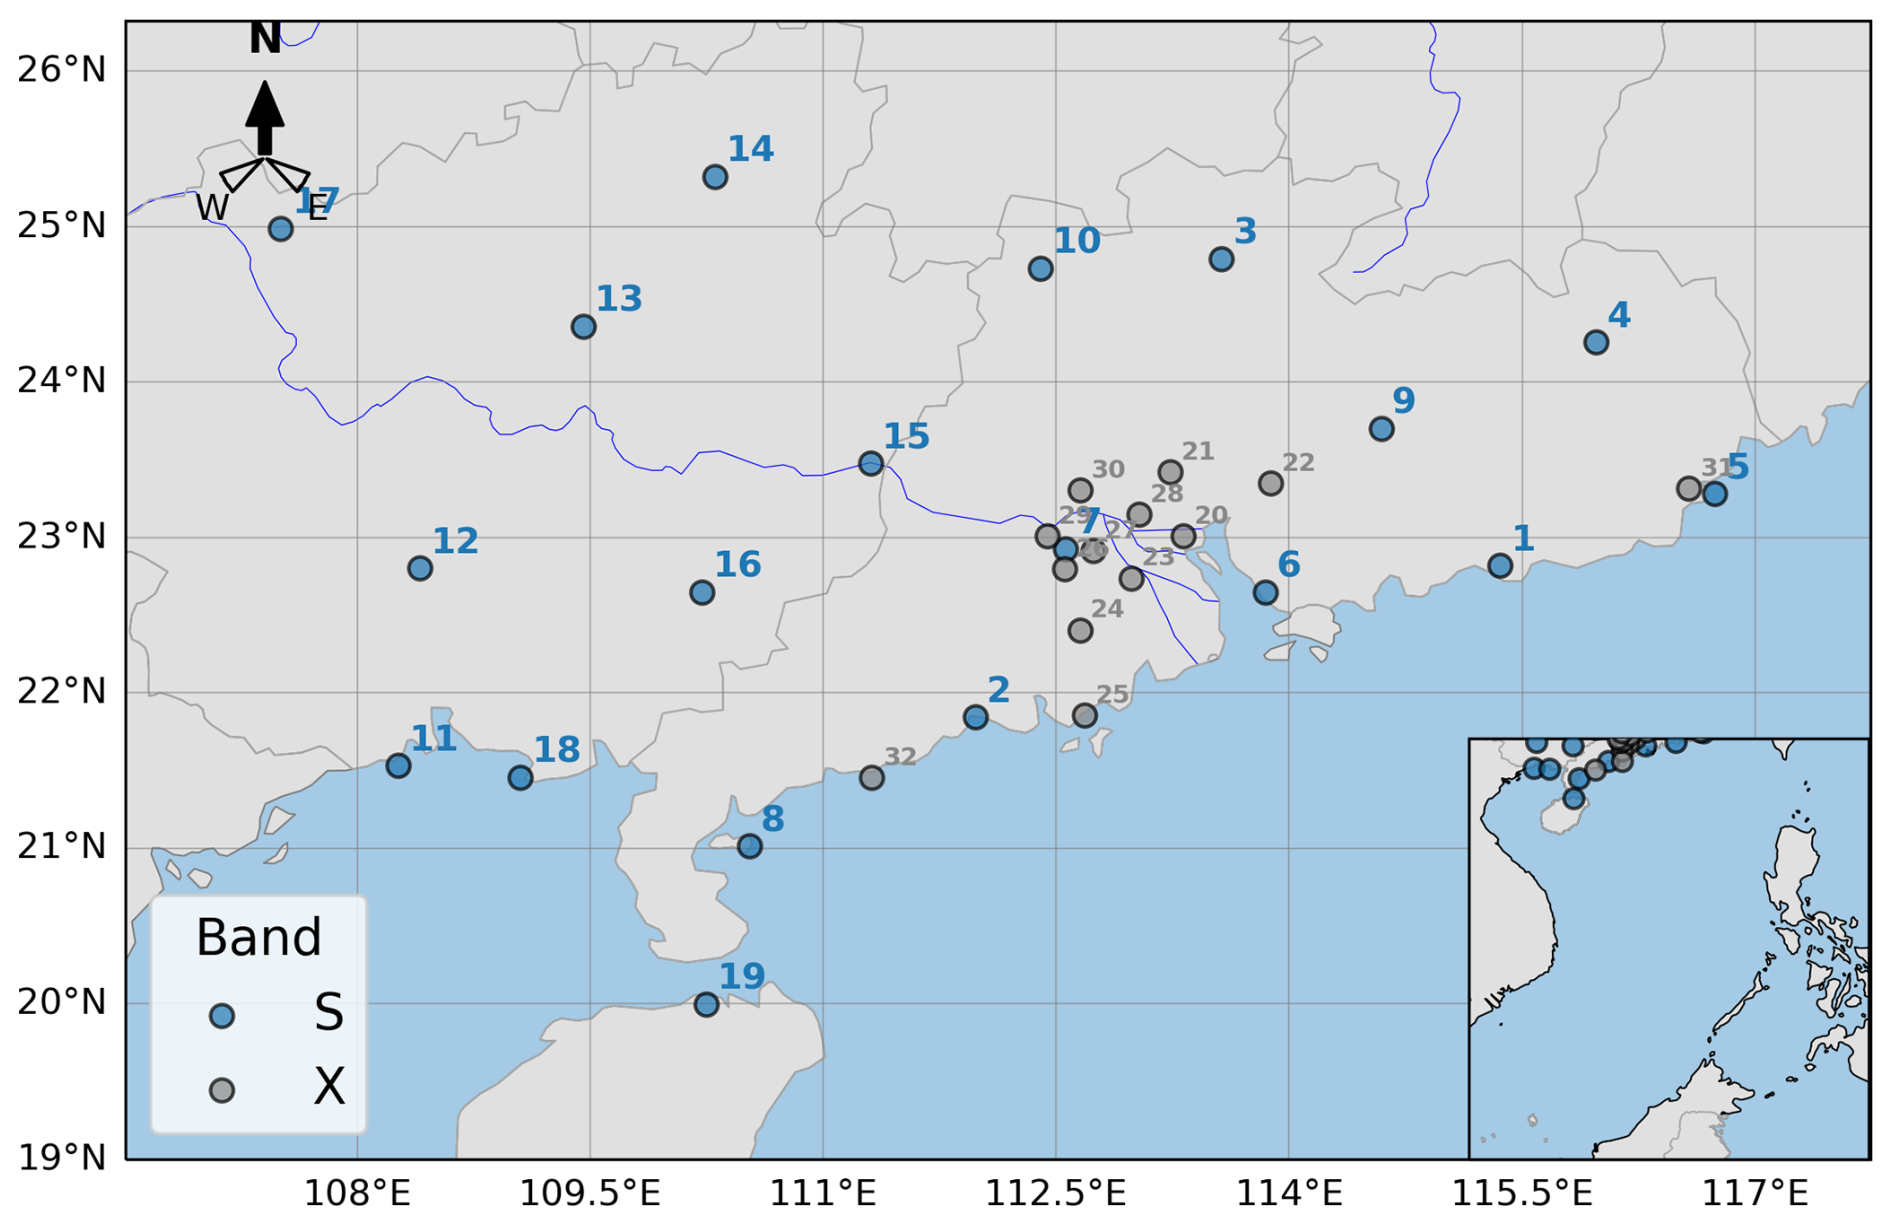
Figure 2Distribution map of ground-based weather radar stations. (Blue dots represent S-band weather radars, gray dots represent X-band weather radars.)
2.2 Method Introduction
2.2.1 Satellite and Ground-Based Radar Comparison Method (SGRCM)
First, the latitude and longitude data from the Geo_Fields module of the FY-3G Level 2 products are read, which represent grid points on the surface and at an 18 km altitude. Both layers consist of nscan × nray (3892 × 59) points. Using nbin as the step, the latitude and longitude for each grid point at every altitude level are calculated. The “height” from the PRE (Data Preprocessing Module) module and the reflectivity factor Ze from the FRE (Frequency Correction Module) module's “zFactorFrequencyCorrectionS” are also read, forming arrays of size 3892 × 59 × 400 (with a vertical sampling rate of 50 m). These data are then combined to obtain the satellite grid geographical information and reflectivity factor array.
The radar base data are read to generate a three-dimensional array of size m × n × k (where m represents the elevation angles, n represents the azimuth angles, and k represents the range bins). Coordinate system transformations are performed from polar coordinates to the first and second reference frames and, finally, to the geodetic coordinate system, which provides the latitude, longitude, and altitude for each range bin (Yang et al., 2023), along with the reflectivity factor array. The steps for satellite–ground consistency comparison are as follows.
-
Spatial and Temporal Collocation
Begin by identifying ground-based radars (GB) whose observational coverage significantly overlaps with the FY-3G PMR (SG) scanning region as shown in Fig. 4. Overlap criteria require that at least 3000 (S/C-band) or 400 (X-band) PMR grid points fall within the GB's observation area. For temporal alignment, only data pairs where the observation times differ by less than 180 s are retained. -
Resampling
The FY-3G PMR Ku L2 product is a resampling dataset with 400 bins and a vertical resolution of 50 m, which differs from the original vertical resolution of 250 m used in the SG scanning mode. In this study, the data at each scanning track grid of SG are resampled into a four-dimensional (longitude, latitude, height, time) grid data with a vertical resolution of 250 m (80 bins) and a horizontal track resolution of 5 km, as the SG scanning mode shown in Fig. 3. That is, each SG grid is 5 km × 5 km × 250 m. Measurements that are too close to or too far away from the GB stations have significant errors. Through multiple experiments, this study selects the time-paired GB reflectivity data with a distance of 50–150 km away from the stations for S/C-band GBs and 9–42 km for X-band GBs. The GB reflectivity data are then transformed into three-dimensional (longitude, latitude, height) data. -
Extraction of Stratiform Rain Cases
Stratiform precipitation is isolated using the precipitation classification provided by the SG product at each grid point. Both satellite and ground-based reflectivity values are further restricted to 20–35 dBZ within the 2–4 km altitude range to focus on relatively stable echoes. -
Pairwise Data Construction
For each spatial-temporal matchup, if multiple GB range bins correspond to a single SG grid cell, they are averaged to produce a composite GB reflectivity value. These paired values SG and averaged GB reflectivity form the basis for subsequent comparison. -
Consistency Assessment
When at least 20 such matched pairs are available, key statistical indices-namely bias, standard deviation, and correlation coefficient are computed to quantitatively evaluate the consistency between the SG and the GB network.
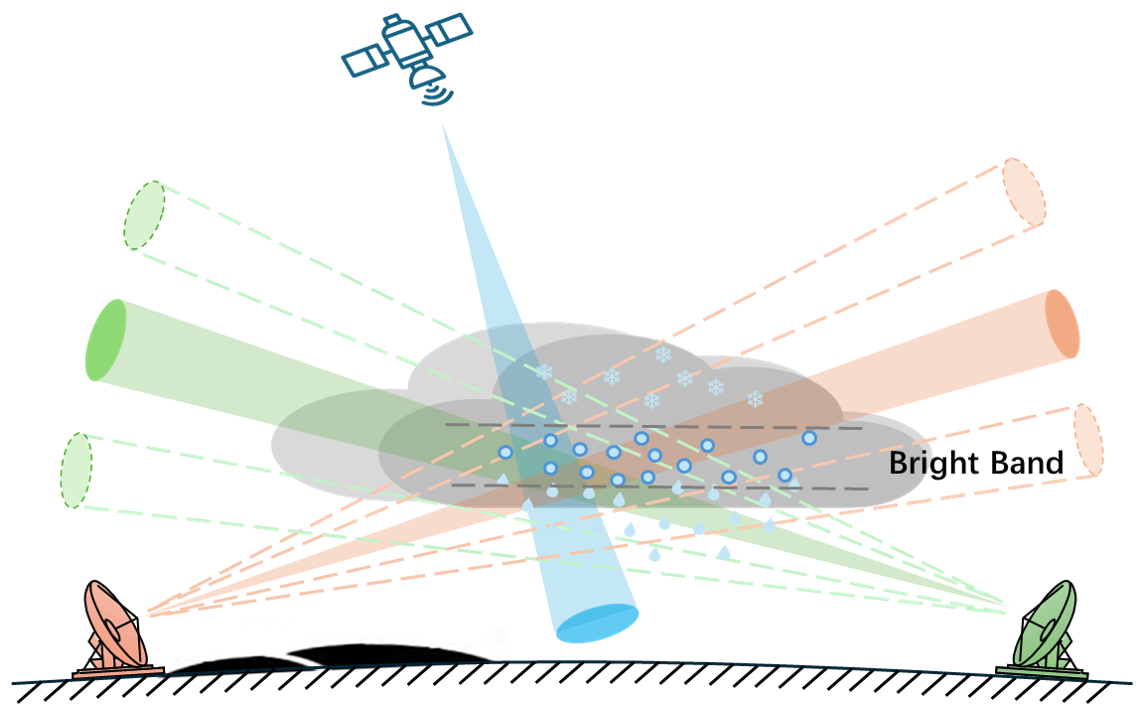
Figure 3A comparison of the overlap region for the reflectivity factors observed by the FY-3G precipitation satellite and the ground-based S-band weather radar.
2.2.2 Adjacent Weather Radar Comparison Method (AWRCM)
The ground-based radar consistency algorithm selects base data from scans with inter-radar distances below a specified threshold (e.g., 300 km for S-band, 100 km for X-band) and volume scan intervals within 3 or 6 min, using elevation angles lower than 4.5° from adjacent radars as the data source, which is for considerations of computational efficiency. Terrain data are used to remove occlusions, and non-precipitation echoes are filtered out. For spatial consistency matching, the horizontal and vertical distance thresholds are set to half the shorter path length among the radars; for temporal consistency, the difference in radial observation times must be below a defined threshold (e.g., 60 s). Observations with a signal-to-noise ratio less than 15 dB or insufficient horizontal filling at echo boundaries are excluded. The reflectivity threshold is set to 15–35 dBZ (with 35 dBZ serving as the S-band boundary between stratiform and convective precipitation echoes (Yu et al., 2007). Convective targets are excluded using vertically integrated liquid water (VIL > 6.5 kg m−2) (Xiao et al., 2009). Finally, according to the 3-sigma rule, outliers in matched targets within overlapping radar regions are removed, and statistical metrics such as standard deviation and mean bias for the evaluation period are calculated to analyze consistency between adjacent radars.
The spatial consistency matching technique constitutes the main challenge. Wu et al. (2014), Zhang and Liu (2011) addressed the challenges of matching S-band phased-array weather radar data with new-generation weather radar data, which result from dissimilar spatial resolutions between the radars. They utilized polar-to-latitude–longitude coordinate transformations, reflectivity spatial interpolation, and other methods to design a spatial matching method for radar data with different resolutions and geographic locations. Zhang et al. (2018) developed a method for the operational new-generation Doppler weather radars, where they transformed the polar coordinates of the first radar into latitude–longitude projection coordinates and searched for targets with consistent projections within the polar coordinates of the second radar. They set altitude thresholds to achieve the spatial matching of data from both radars.
The data addressed in this study pertain to the base data of the new-generation Doppler weather radars in operation. In the spatial matching algorithm, the above-mentioned methods are also employed. The process is described below.
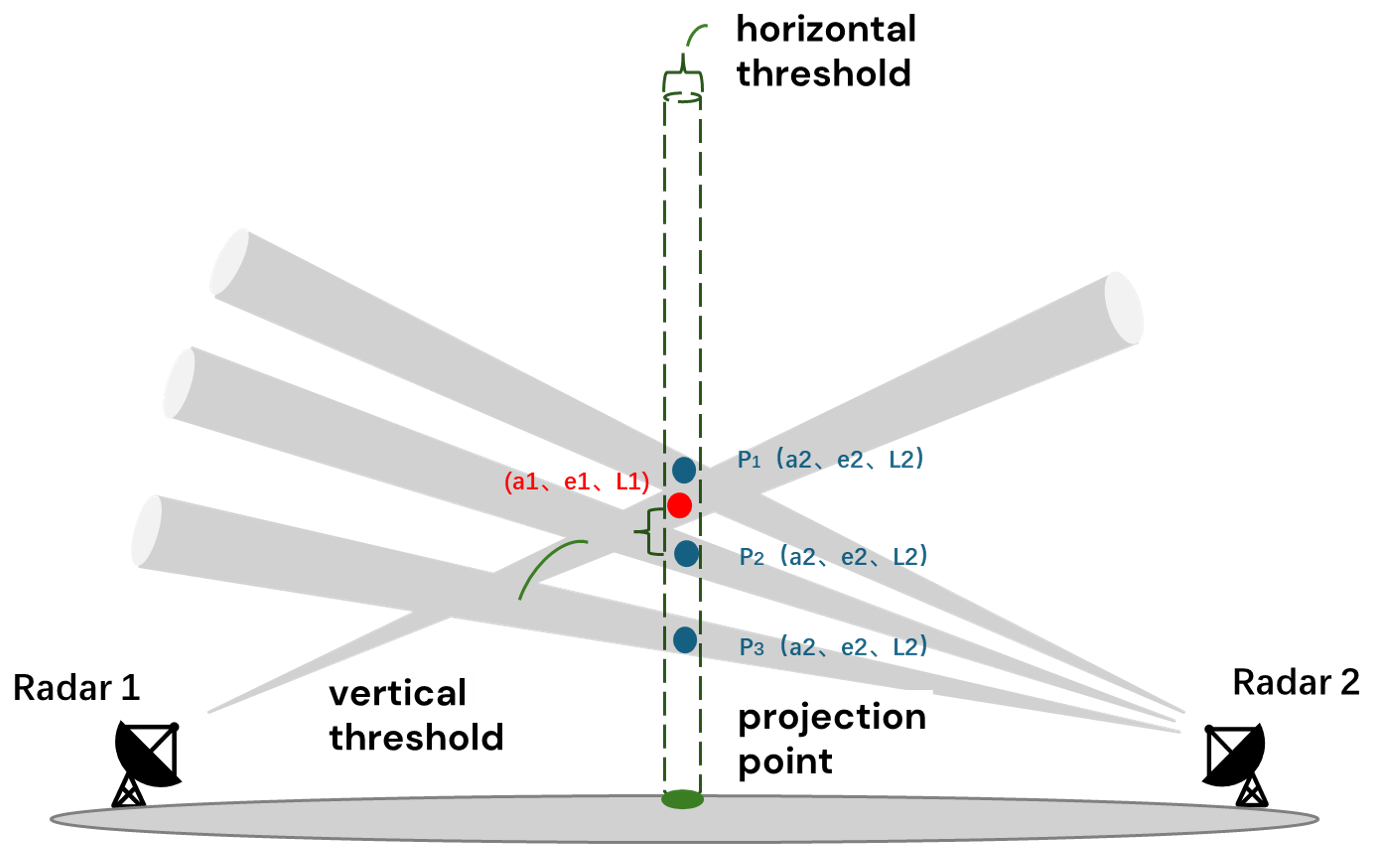
As shown in Fig. 5, let the station coordinates of Radars 1 and 2 be (λ1, ϕ1, h1) and (λ2, ϕ2, h2), respectively. For each volume scan data point from Radar 1, the polar coordinates – azimuth a1, elevation e1, and slant range L1 (the red points in Fig. 5) are transformed into latitude, longitude, and altitude (λ, ϕ, H1) using the formulas for converting radar polar coordinates to geographic coordinates and radar altitude calculations. The ground projection point's longitude and latitude are λ and ϕ. The formulas for these calculations are as follows, where , represents the effective Earth radius factor.
β1 is the angle between the projection point and the center of the Earth at the location of Radar 1.
Then, the formula for converting geographic coordinates to radar polar coordinates is used to calculate the data coordinates of Radar 2 under this projection. Radar 2 has multiple scanning elevation angles, and the scanning elevation angle e2for a data point is known. Using the coordinate transformation formula, it is straightforward to calculate the polar coordinates – azimuth a2, elevation e2, and slant range L2 (the blue points in Fig. 5, with the number of points determined by the intersecting radar 2 radial layers) – as well as their altitude h2, based on the conversion from geographic coordinates to radar polar coordinates.
Here, β2 is the angle between the projection point and the center of the Earth at the location of Radar 2. By using cos β2, sin β2 can be obtained; thus,
Using Eq. (1), cos a2 is obtained, and then the azimuth angle a2 and slant range L2 are calculated as follows:
If a2 < 0, then .
Rm is the equivalent Earth radius. After obtaining the target point polar coordinates for both radars, the altitude calculation formula is used to determine the target's elevation.
When the vertical height difference ΔH between the target point coordinates of the two radars is less than H_thre, where H_thre is the height difference threshold (Lu et al., 2024), the spatial data coordinates are considered to be matched.
The temporal consistency requirement for overlapping points is that the observation times should be close. This time difference can be calculated by using the radar volume scan time or, more precisely, by using the radial scan time in the base data. Here, we first select time-close data using the radar volume scan time and then further filter based on the radial time.
After the base data from the two radars are matched in time and space, we obtain the reflectivity samples of the overlapping points. We refer to the difference in reflectivity (unit: dBZ) at the overlapping points between the two radars as the bias (unit: dB). The mean of the bias and the standard deviation are used as consistency evaluation metrics.
3.1 Method Accuracy Influence Factor Analysis and Processing
3.1.1 Spatial Matching
The horizontal resolution of the trajectory points of the FY-3G polar-orbiting satellite is 5 km, with a resampled vertical resolution of 50 m. As a result, the satellite grid centered on each trajectory point is treated as a flat grid, which significantly limits the number of radar range bins matched and sometimes results in no matches at all. To address this issue, the reflectivity data of the FY-3G polar-orbiting satellite at every 250 m height interval are selected for volume matching. This involves expanding the flat grid with a 50 m height to a larger grid with a 250 m height, allowing for more radar range bins to be matched and ensuring the statistical significance of the satellite and ground-based comparison results.
When matching satellite and ground-based data, it is important to consider the beam widening of weather radar at long distances, which can reduce the spatial geometric matching accuracy. Therefore, the satellite–ground matching distance range is set to 50–150 km. In terms of vertical height, to avoid the reduction in satellite product accuracy below clouds and the effects of the bright band, the height range is set to 2–4 km.
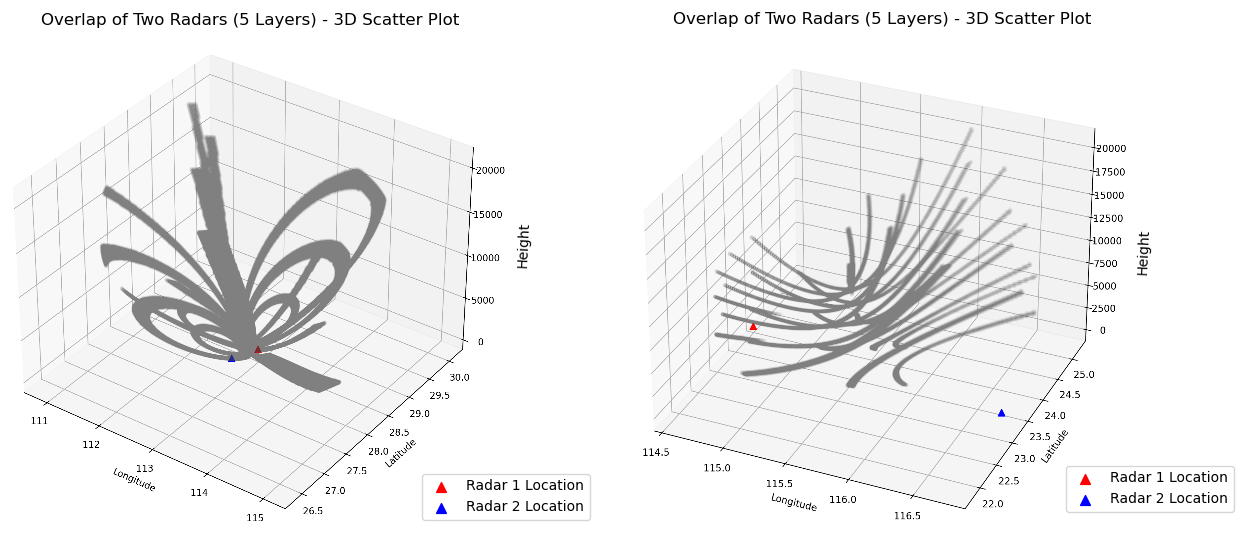
Figure 6The impacts of distance between adjacent radar stations and elevation difference on the distribution of overlapping points.
When analyzing the overlapping observation points of adjacent ground-based weather radars, excluding scenarios with obstructions, the distance between stations and the elevation difference between the radar sites are major influencing factors. Figure 6 shows the three-dimensional distribution of the overlap region between two groups of radars. In the left panel, the distance between the two radar sites is about 50 km, with an elevation difference of 278.8 m in the antenna feed height. In the right panel, the distance between the two radar sites is nearly 200 km, with an elevation difference of 870 m in the antenna feed height. It can be observed that the smaller the distance and elevation difference, the more regular the distribution of the overlap points, with matched points distributed within the same elevation angle layer. As the distance and elevation difference increase, the distribution of overlap points becomes irregular, and the same elevation angle layer might match multiple elevation angle layers from the other radar. These analysis results indicate that it is not sufficient to simply select the midpoint between two radars as the overlap region; various factors such as the distance between stations and elevation differences must be considered.
3.1.2 Terrain blockage
When matching adjacent radars, severe terrain blockage in the direction of the overlap points for one of the radars may weaken the radar echo intensity. This can result in significant echo differences at the overlap points between the two radars, leading to inaccurate consistency evaluation results. This issue is not due to the radar itself (Maddox et al., 2002; Bech et al., 2003).
Regarding terrain blockage, Liu et al. (2020) utilized SRTM (Shuttle Radar Topography Mission) v4.1 digital elevation data to perform simulations and analyses of beam blockage for the new generation of operational weather radars in China. They sampled the radar detection range, calculated the latitude and longitude and detection height of target points based on radar station information, compared these to topographic data, and used radar altitude formulas and beam widening information to determine beam cross-section blockage at specific elevation angles. This provided beam blockage ratio data (hereinafter referred to as the obstruction rate) for each radar station.
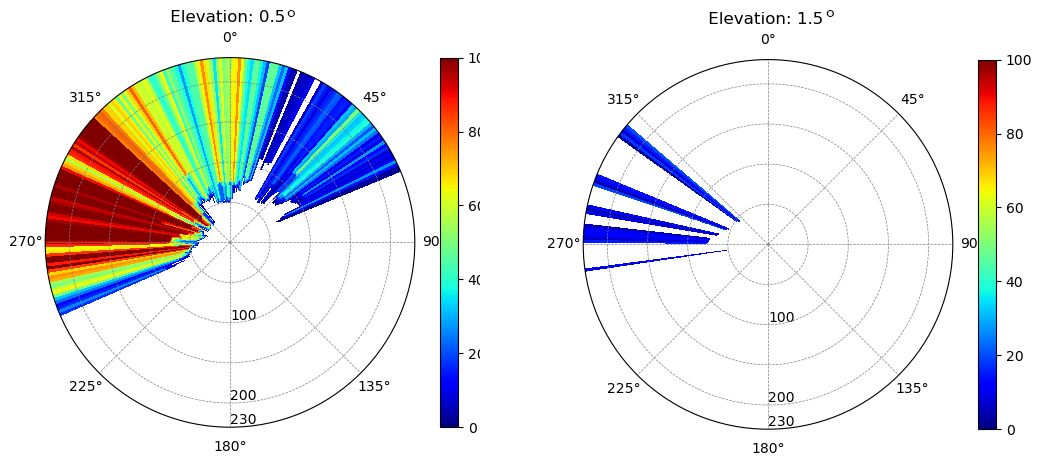
Figure 7Terrain blockage at 0.5 and 1.5° elevation angles for Shantou S-band weather radar station in Guangdong.
Figure 7 illustrates the terrain blockage at 0.5 and 1.5° elevation angles for Shantou station in Guangdong. The blockage is primarily distributed in the northwest direction of the station. When analyzing the observation bias between Shantou station and a adjacent radar located to its northwest, it is necessary to exclude the obstructed radials when calculating the overlap area, as doing so will reduce errors in the network consistency analysis.
3.1.3 Impact of Observation Targets
When the observation target is convective precipitation, the time threshold for calculating observation biases in the overlap areas between the satellite and ground-based radar needs to be limited to a very small range. However, this constraint may not provide a sufficient sample size for statistical analysis. In this study, the target was limited to stable stratiform precipitation, requiring the further classification of precipitation types. In satellite observation data, precipitation classification is performed using two methods: the vertical profile retrieval method and the horizontal pattern method. These methods classify precipitation into three categories: stratiform, convective, and other. The precipitation types identified by these two methods are then consolidated (Wu, 2023).
In the adjacent ground-based radar comparison verification method, we calculated the liquid water content for each grid point. Based on a statistical analysis, we set a threshold (Biggerstaff and Listemaa, 2000; Xiao and Liu, 2007) to classify observation targets into convective and stratiform precipitation. Figure 8 shows a consistency comparison of two S-band weather radars (ID5 and ID8) in Guangdong before and after convective filtering. We adjusted the time threshold from 180 to 60 s and set the vertically integrated liquid (VIL) threshold to 6.5 kg m−2. After filtering, the number of matching points decreased, the correlation coefficient increased from 0.84 to 0.87, the standard deviation decreased from 4.68 to 4.34 dB, and the bias changed from −2.19 to −2.21 dB. It can be seen that increasing the radial time threshold and VIL filtering improved the correlation and standard deviation in the overlap regions of adjacent radars, although the bias slightly decreased. The reason for this requires further analysis with more accumulated samples.
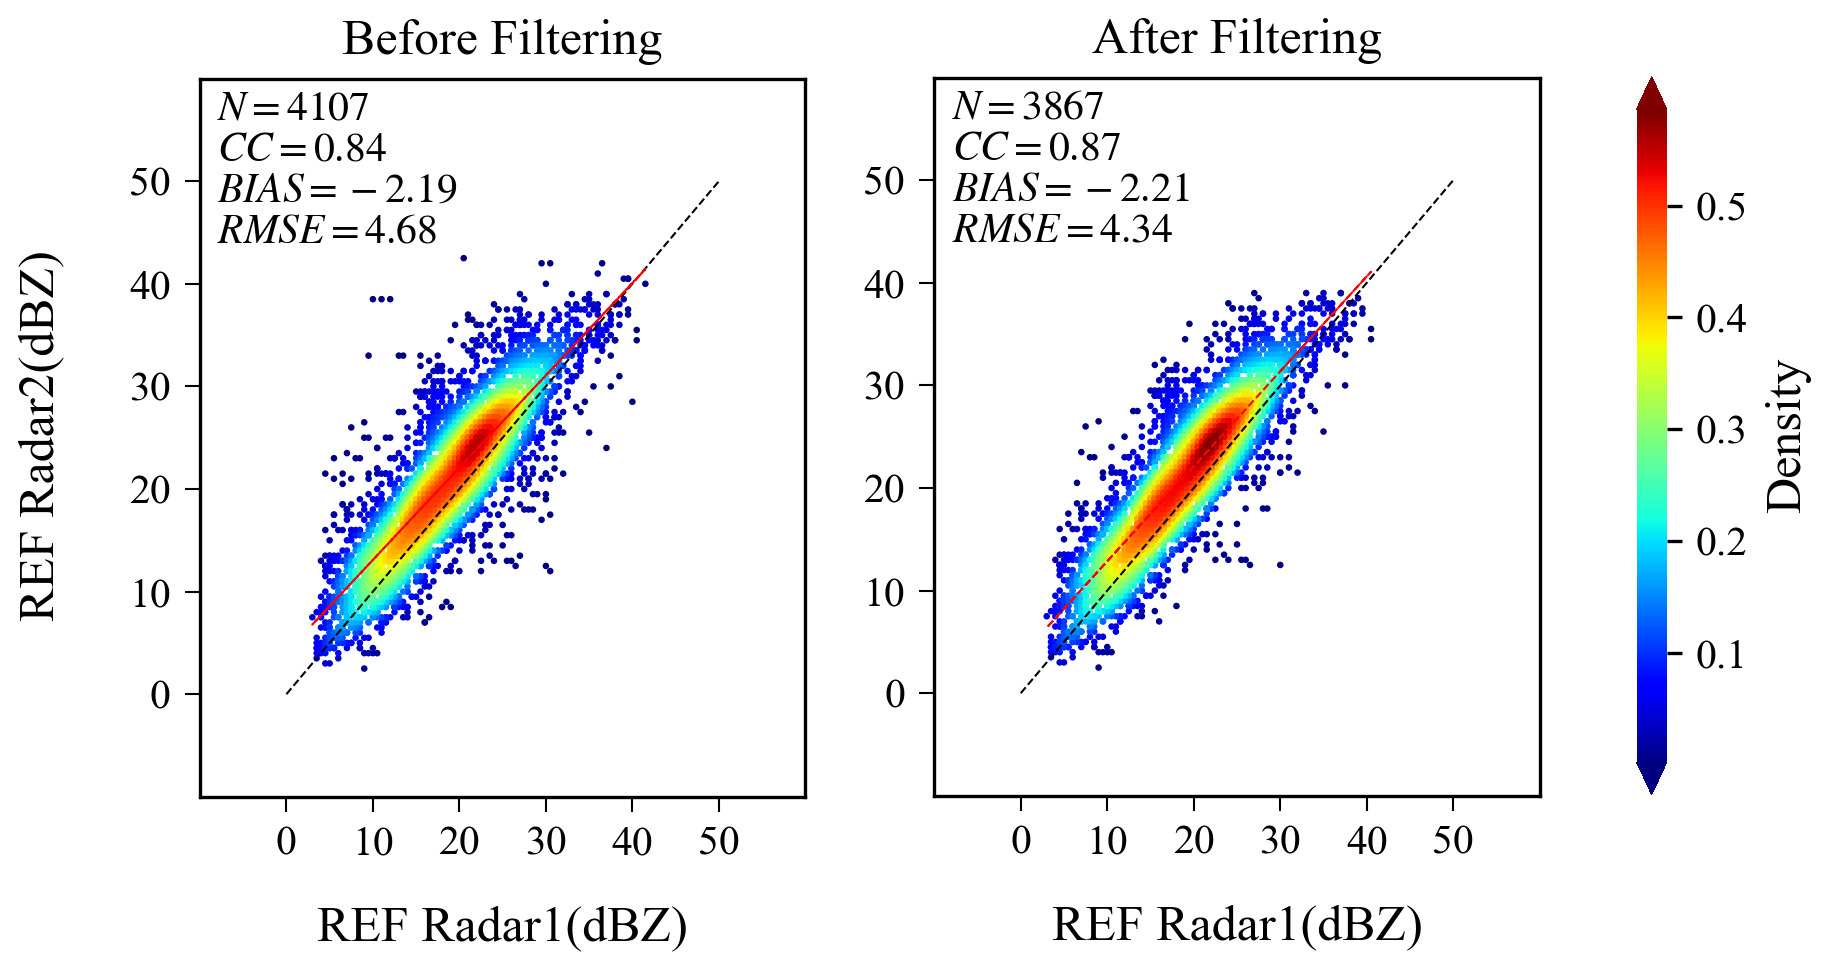
Figure 8Comparison of two adjacent S-band radars before and after convective filtering (left: before filtering, right: after filtering).
3.1.4 Impact of Different Bands
BX5 is a standardized X-band weather radar. As a radar to be calibrated, it experiences co-channel interference when operated simultaneously with surrounding X-band radars, necessitating the creation of a blanking zone and the maintenance of its primary observation direction within the first quadrant. Approximately 2 km away from BX5, an S-band dual-polarization weather radar serves as a reference radar. Both radars can scan simultaneously to observe the same precipitation area.
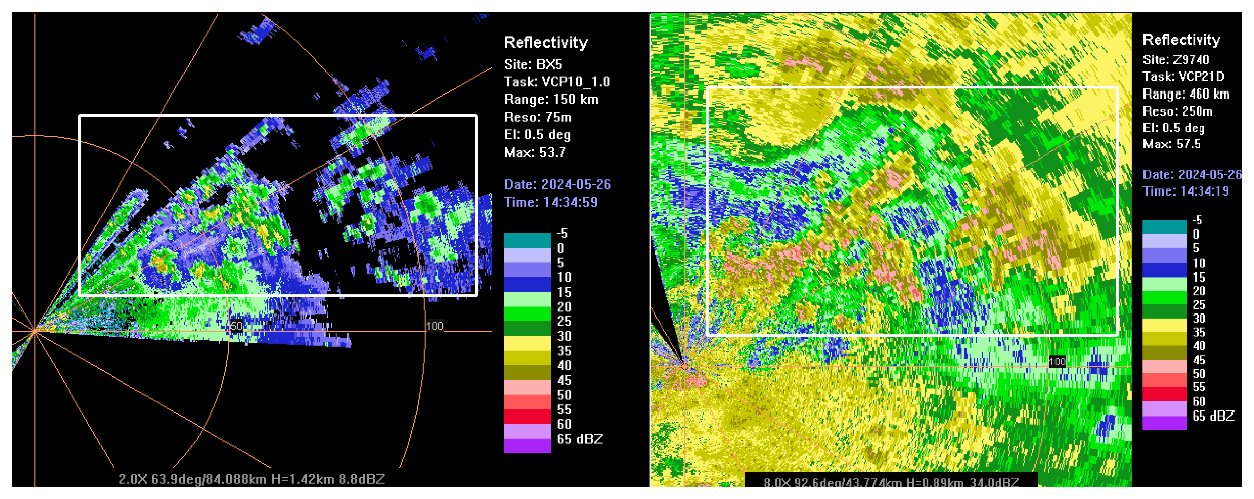
Figure 9Comparison of reflectivity factors observed by adjacent X-band (left) and S-band (right) weather radars during a precipitation event on 26 May 2024, at 14:35.
Figure 9 shows the reflectivity factors observed at a 0.5° elevation angle by the two adjacent S/X-band weather radars around 14:35 UTC on 26 May 2024, with the X-band radar data not corrected for attenuation. The white box in the figure identifies the same echo region. In the left panel, the reflectivity factor observed by the X-band radar is 10–15 dBZ weaker than that in the right panel observed by the S-band radar. A probability distribution analysis of the reflectivity factors from the overlapping observation areas of the two radars is conducted, as shown on the left side of Fig. 10. The calculated bias, standard deviation, and correlation coefficient are −6.74 dB, 10.12 dB, and 0.18, respectively. We applied an adaptive attenuation correction method (Testud et al., 2000a) to the BX5 radar, and then analyzed the bias between the corrected data and that from the adjacent S-band weather radar. The bias was reduced to −1.68 dB. The X-band radar shows significant attenuation in strong echo areas (Testud et al., 2000b; Bringi and Chandrasekar, 2001). Therefore, in subsequent analyses of the network consistency between X-band and other band weather radars, the reflectivity factor range is set (e.g., 15–35 dBZ), with certain limitations also applied to the signal-to-noise ratio.
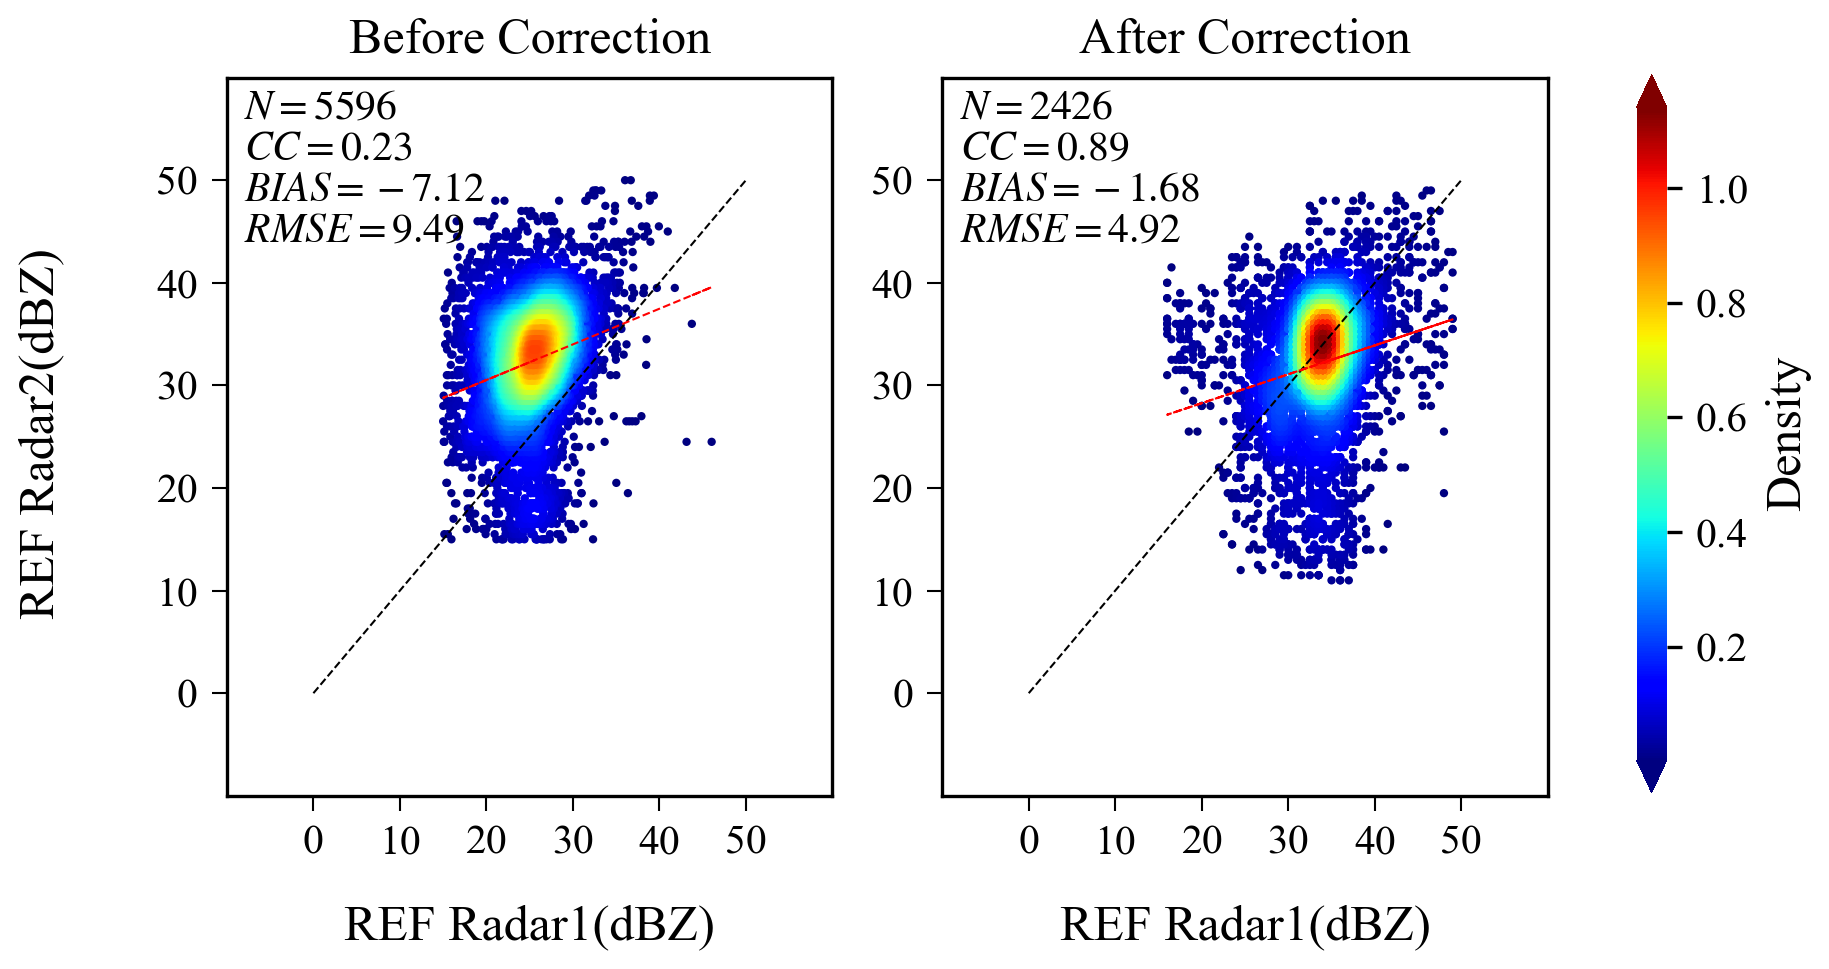
Figure 10Analysis results of reflectivity bias in the overlapping observation area of adjacent X- and S-band weather radars on 26 May 2024, at 14:35 (the horizontal axis (Radar1) represents the X-band radar, while the vertical axis (Radar2) represents the S-band radar). (Left: the results before attenuation correction for the X-band radar. Right: the results after attenuation correction.)
3.1.5 Impact of Non-Meteorological Echoes
In radar consistency evaluation algorithms, the impact of non-meteorological echoes at overlapping points must be considered. These echoes may be caused by noise or insufficient target filling, among other reasons. Coastal stations are often affected by changes in atmospheric refractivity over the ocean (Skolnik, 2008), leading to clear-air echoes or sea clutter, which can significantly influence the comparison results of overlapping areas between adjacent radars.
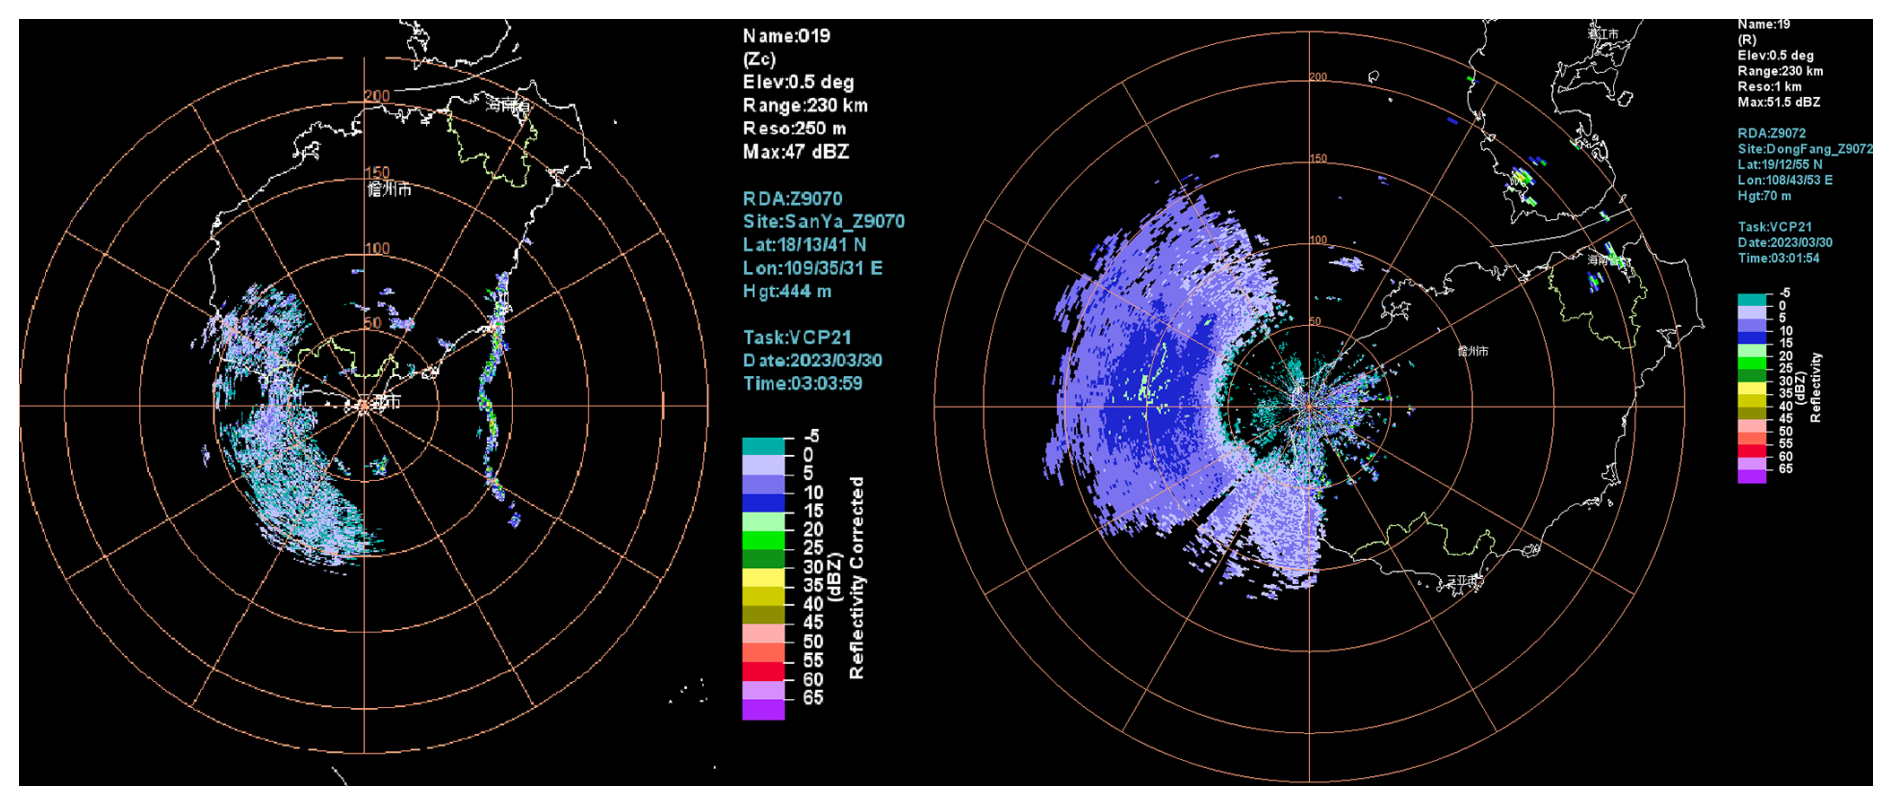
Figure 11Impact of clear-air echoes and sea clutter on overlapping area comparison analysis at coastal weather radar stations.
As illustrated in Fig. 11, the two weather radar stations are coastal stations in South China, with an observation time difference of about 2 min and a distance of approximately 140 km between them. In the left panel, the third and fourth quadrants exhibit clear-air echoes, while in the right panel, these quadrants display sea clutter echoes. When performing overlap area matching, consistency calculations were conducted for these non-precipitation echoes, resulting in a bias of 8.84 dB. This bias clearly does not stem from radar hardware performance. Therefore, when analyzing the comparison results of overlapping areas between adjacent weather radar stations, it is crucial to first exclude non-precipitation echoes in order to minimize their impact on the statistical outcomes.
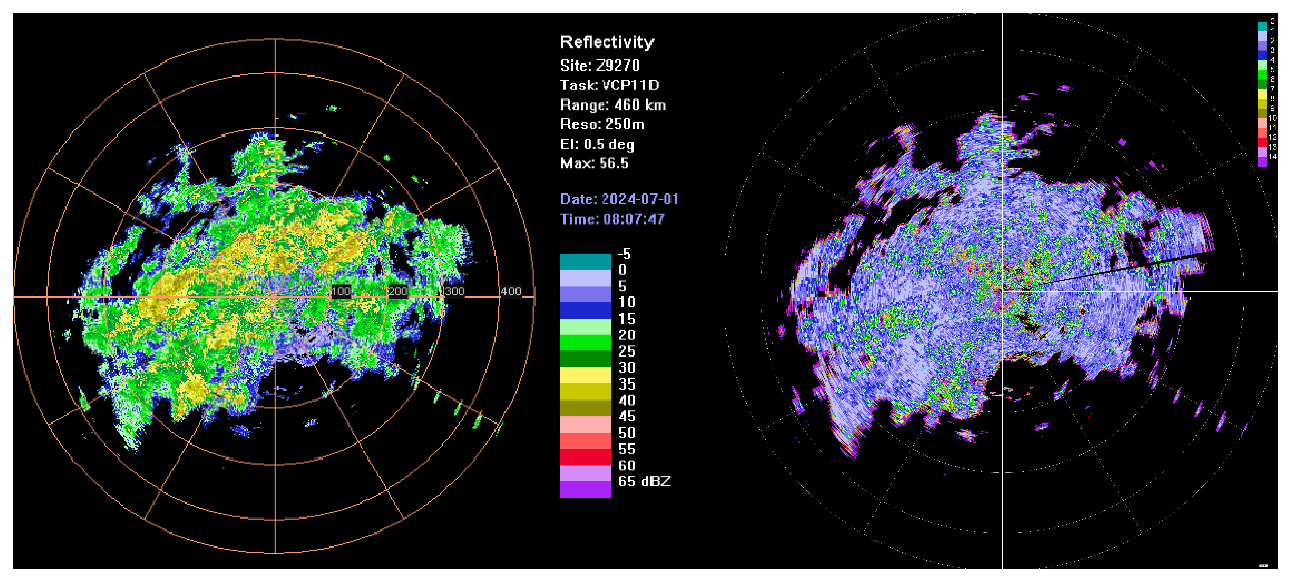
Figure 12Schematic of the degree of beam incomplete filling. (The right side of the figure shows the Ref SD results (unit: dB), with a ring set every 100 km and the outermost ring at 460 km.)
To reduce the impact of noise on the evaluation results, we improved the data filtering method by setting a signal-to-noise ratio threshold (SNR_thre < 15 dB). To calculate the degree of filling, we considered horizontal filling (Kitchen and Jackson, 1993; Doviak and Zrnić, 2006). Typically, target points at the edges of echoes have a lower degree of filling. We used the reflectivity standard deviation (Ref SD) of the radar echo compared to that of the surrounding points to represent the degree of incomplete horizontal filling of reflectivity (as shown in Fig. 12). The larger the reflectivity standard deviation value, the lower the degree of adequate horizontal filling. By removing points with a reflectivity standard deviation greater than a specified threshold (set here to 12 dB), we could eliminate target overlapping points at the edges of echoes with incomplete horizontal filling.
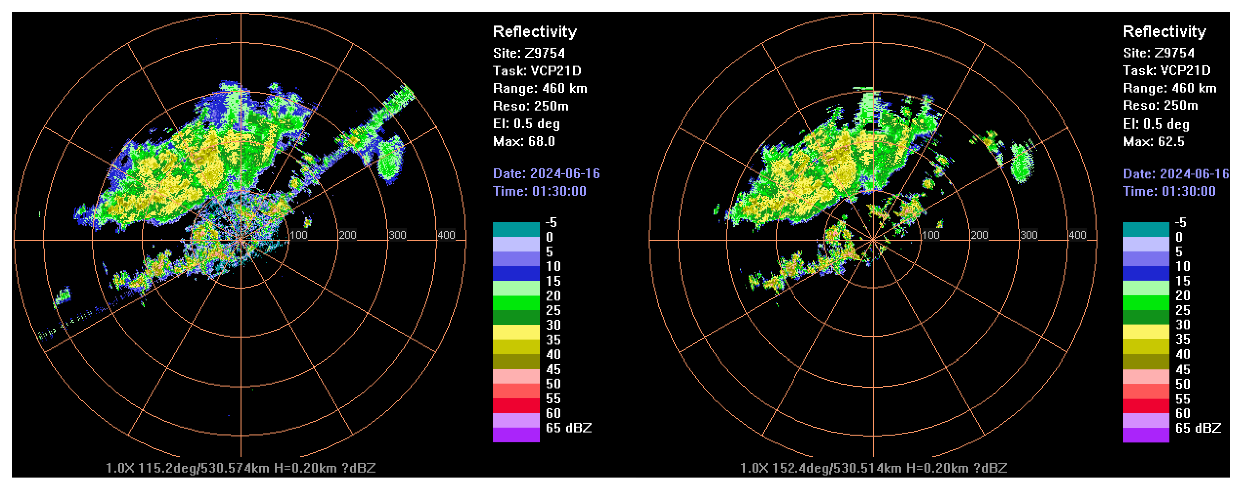
Figure 13Reflectivity factor at a 0.5° elevation angle for the Guangdong Shantou radar before and after electromagnetic interference quality control: before quality control (left); after quality control (right).
Electromagnetic interference can affect the quality of weather radar observation data and the reflectivity factor comparison results between radars (Saltikoff et al., 2016). Figure 13 (left) shows radial interference occurring at an elevation angle of 0.5° between radial angles of 45 and 52° on the Shantou weather radar (ID5) in Guangdong at 01:30 UTC on 16 June 2024. By using a fuzzy logic method (Wen et al., 2020) to eliminate the radial interference, a quality-controlled reflectivity factor map was obtained, as shown in Fig. 13 (right). We extract four physical parameters that characterize radial interference echoes: DB, representing the consistency of echo power between adjacent range gates along the radial. RREF, representing the spatial extent of the reflectivity factor along the radial. TDBZ (units: dB2), representing the texture consistency of the local reflectivity factor along the radial. SPIN, representing the sign change of adjacent reflectivity factors within a local region. Based on the probability distributions of these parameters, we construct corresponding membership functions and a binary (0–1) decision criterion for radial interference echoes. The criterion values are then combined via a weighted summation, and any point whose aggregated value exceeds a threshold is identified as a radial interference echo and removed. A consistency analysis comparing the reflectivity before and after interference removal with that of a adjacent S-band weather radar showed in Fig. 14 that the correlation coefficient, bias, and standard deviation of the two radars improved from 0.88, −1.70 dB, and 4.97 dB to 0.89, −1.68 dB, and 4.92 dB, respectively. This indicates that radial interference reduces the observation consistency between adjacent radars.
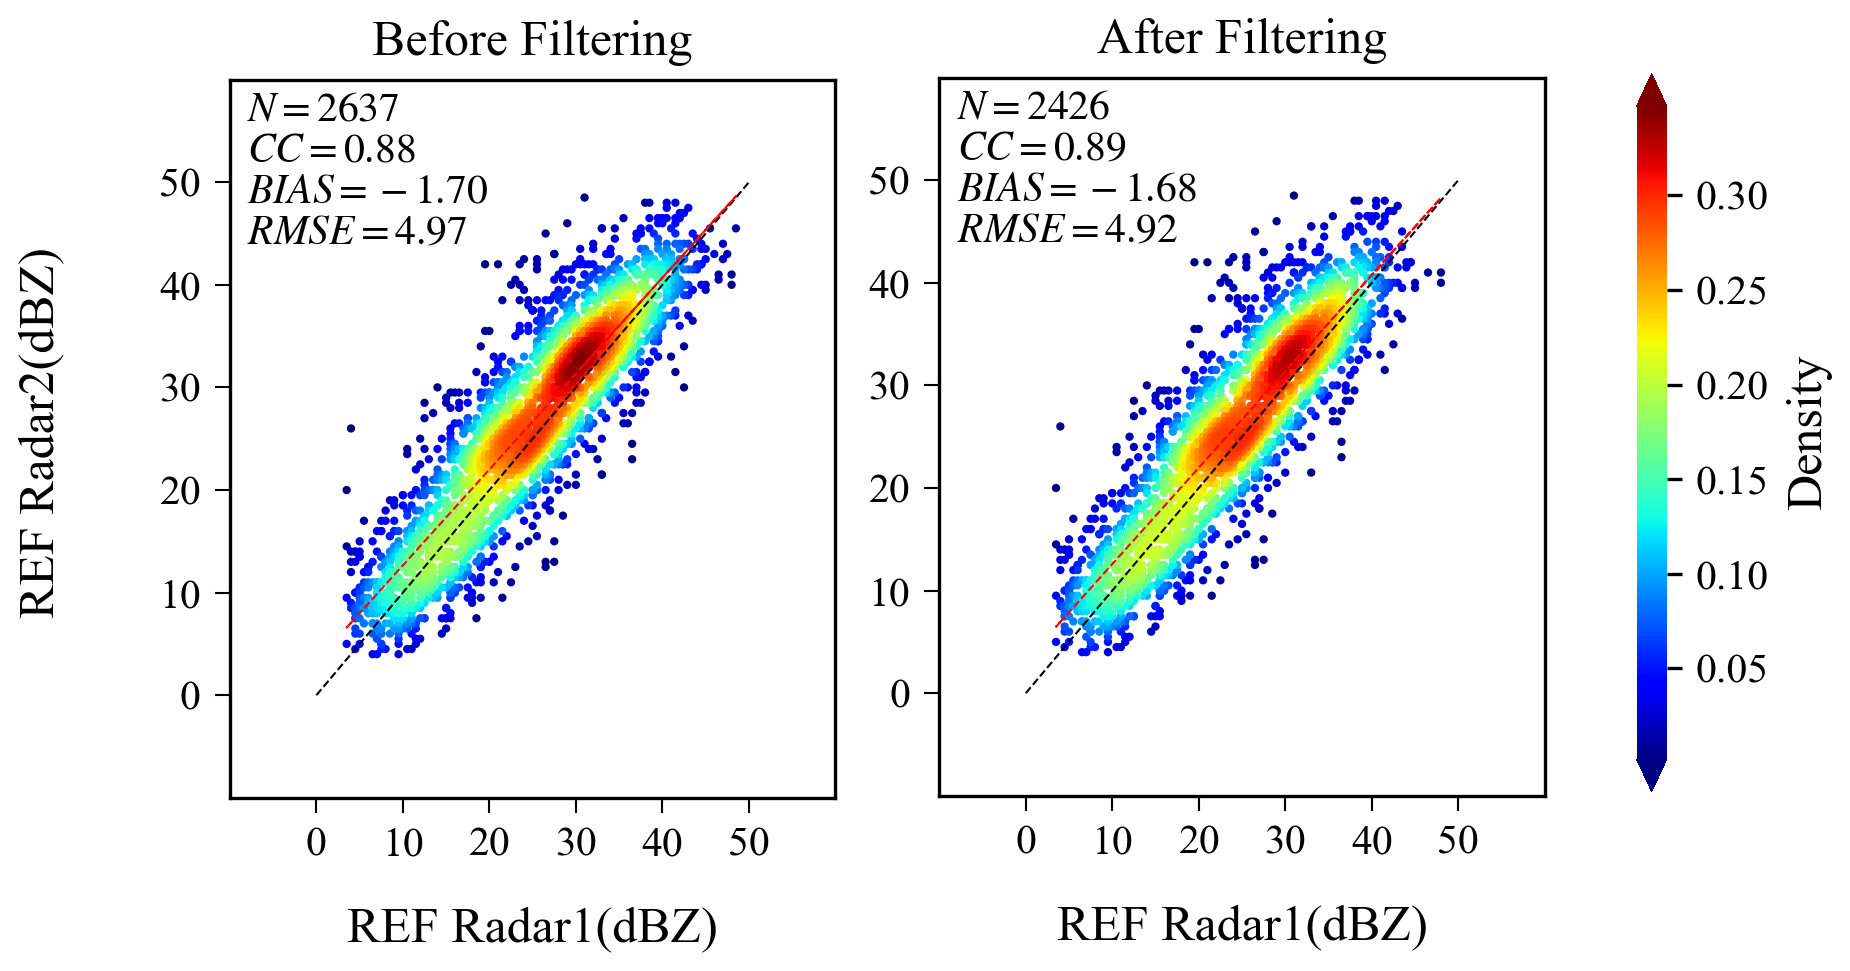
Figure 14Consistency analysis results of the Guangdong Shantou radar with a adjacent S-band weather radar before and after electromagnetic interference quality control. (Radar1 is the ID5, and Radar2 is ID8.)
3.2 Regional Experimental Results
3.2.1 Evaluation Results of the S-band
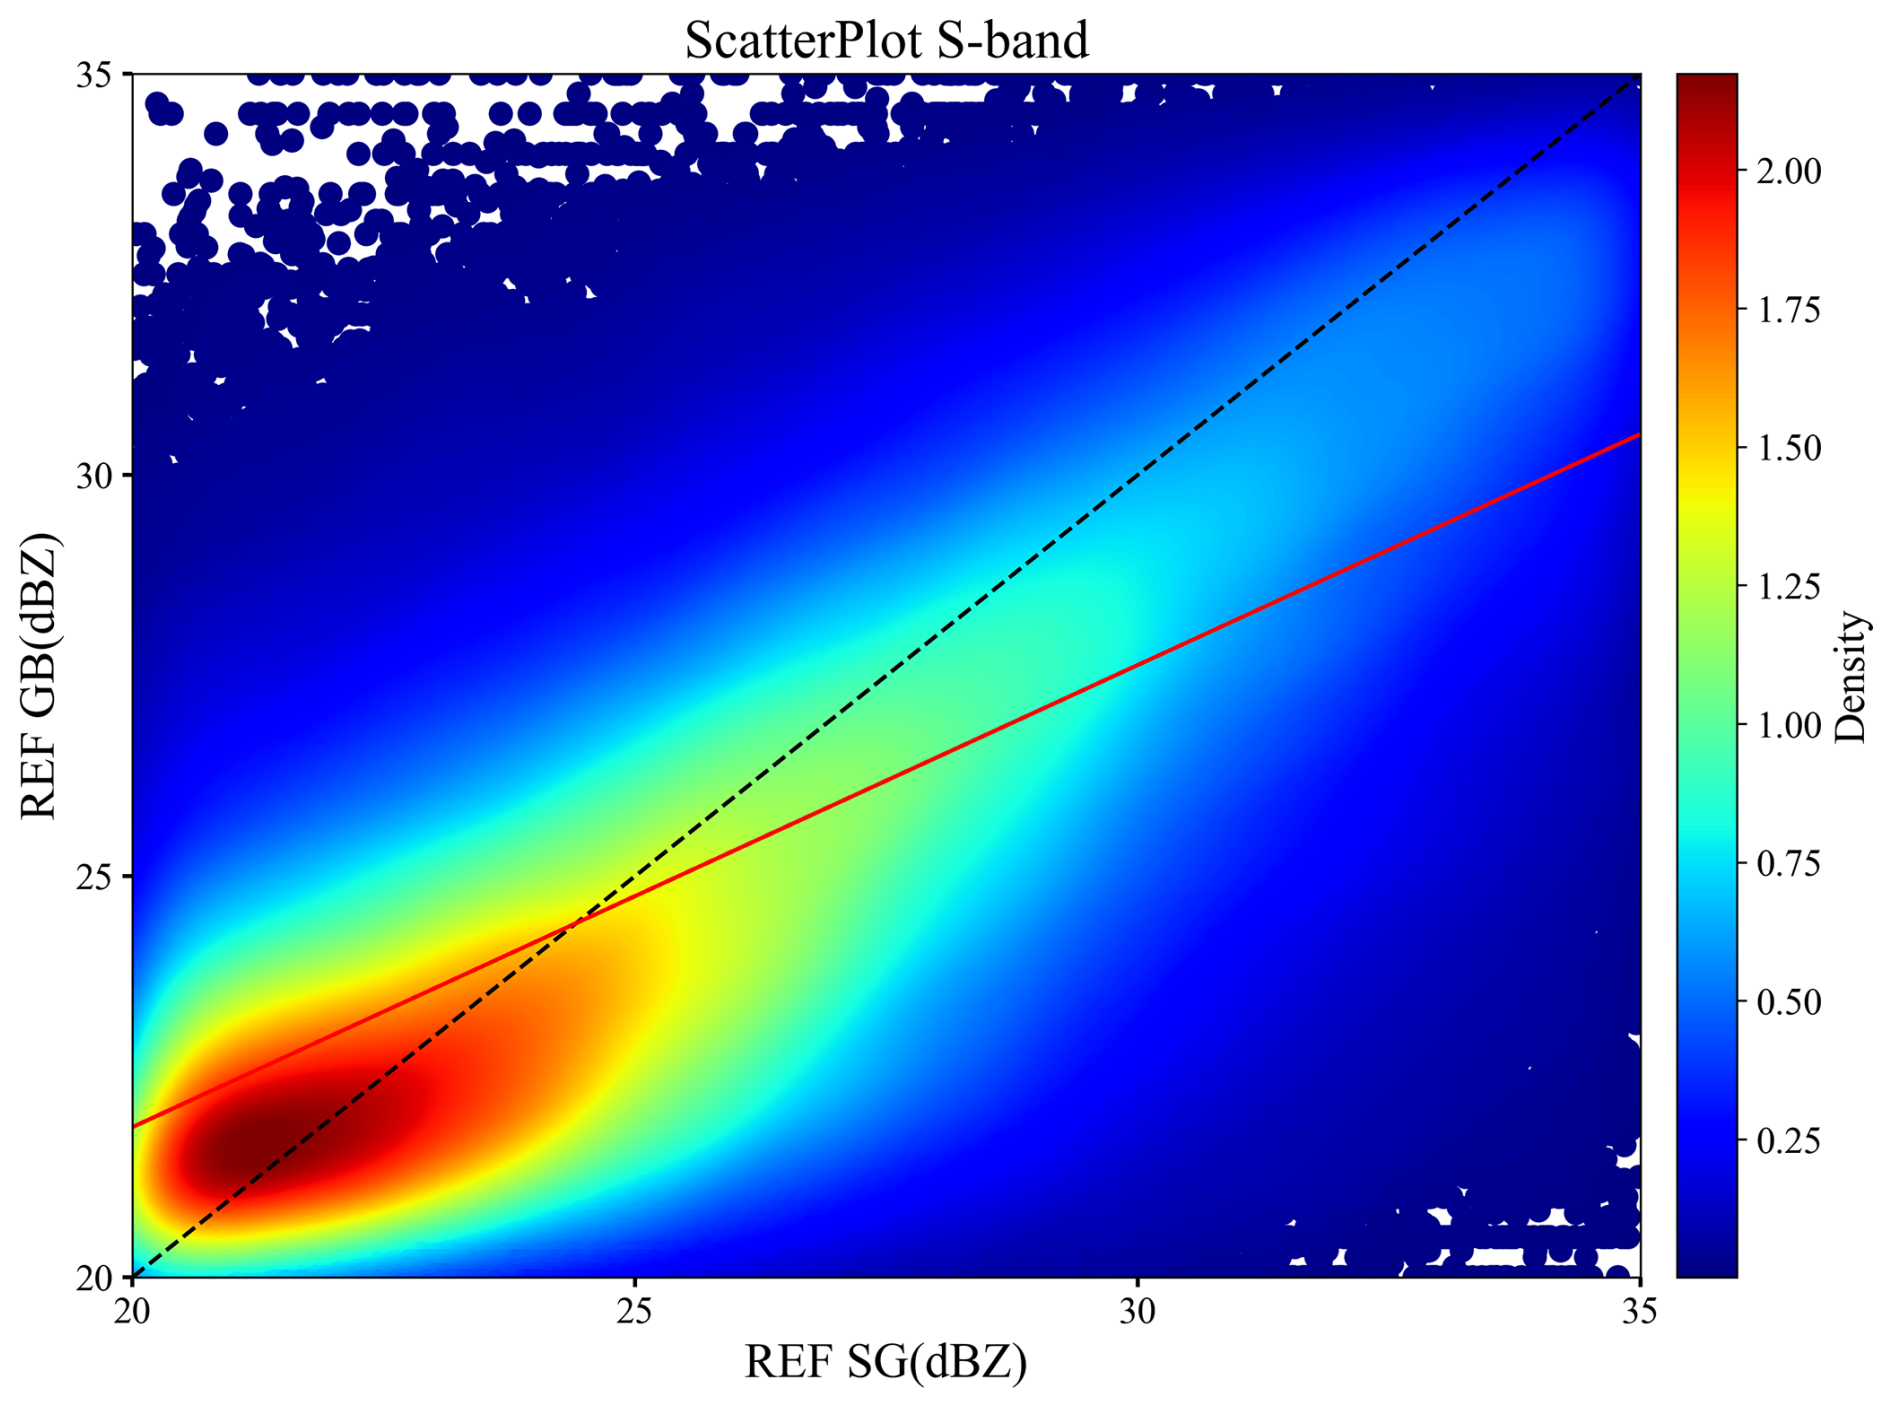
In the AWRCM analysis, we set a distance threshold between adjacent radars (for example, 200 km for S-band radars). Any two radars within this threshold can be paired for comparison. Taking Radar 1 as an example, if it can be paired with n surrounding radars, then each volumetric scan will yield n sets of comparison results, and the average of these n results is taken as the final consistency bias value for Radar 1 at that time. If a particular radar has a large systematic bias, this will be reflected in the bias average. A large standard deviation indicates that the radar's observation results are more dispersed, suggesting a need for further calibration. From January to October 2024, 19 S-band new-generation weather radars in South China were selected to conduct both AWRCM and SGRCM analyses. The differences between the two methods were evaluated using bias and standard deviation as metrics. Figure 15 presents the bias comparison results from both methods. The bias trends are generally similar, with the ground-based consistency analysis showing bias values ranging from −2.06 to 1.65 dB, and a mean of −0.12 dB. The satellite-to-ground consistency analysis produces bias values ranging from −1.28 to 1.13 dB, with a mean of −0.01 dB; notably, the absolute bias is smaller for the satellite-to-ground method than for the ground-based method.
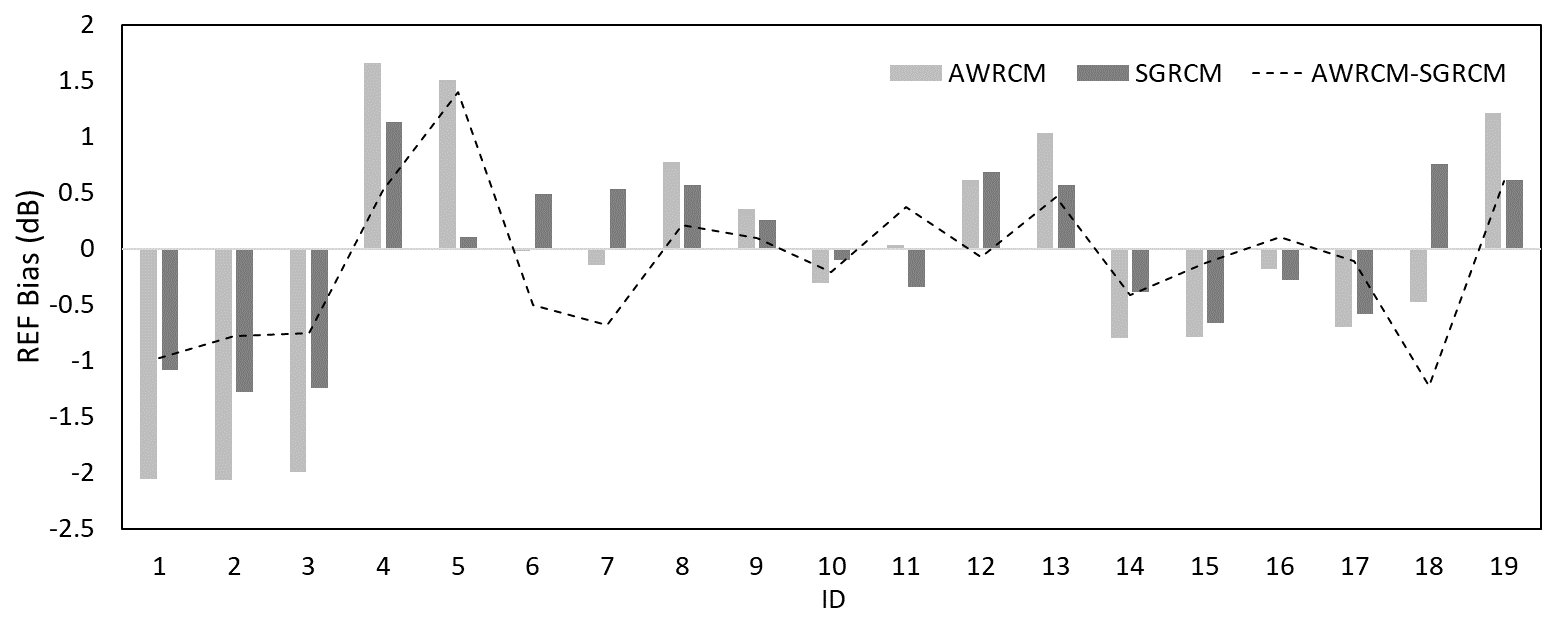
Figure 15Comparison of mean bias between AWRCM and SGRCM for S-band weather radars in the South China region.
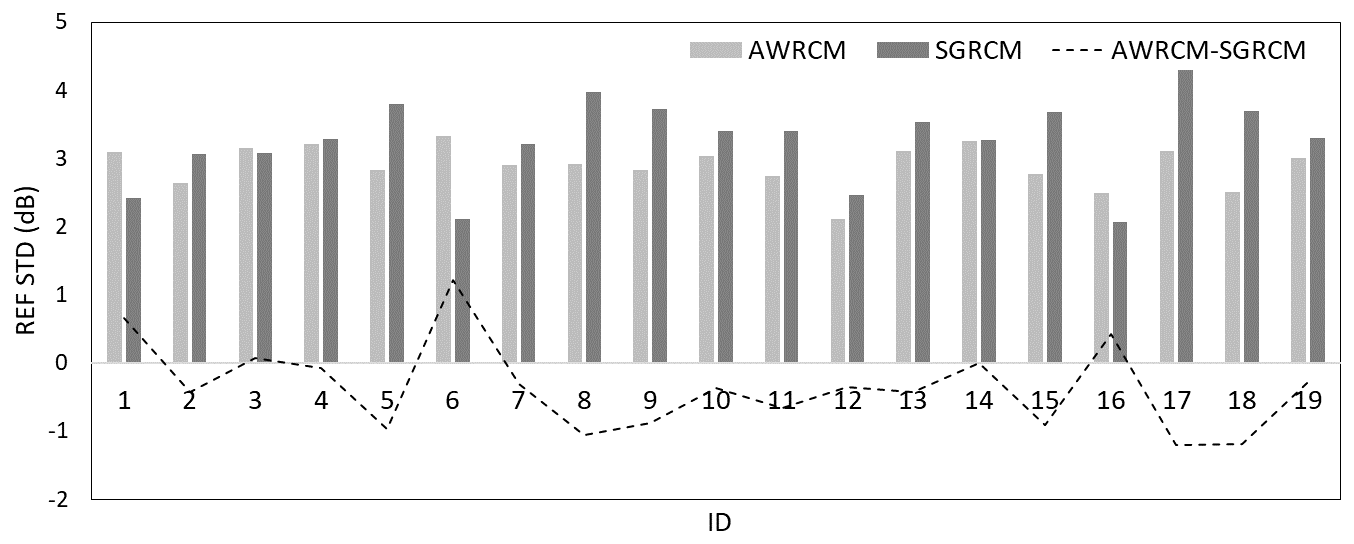
Figure 16Comparison of standard deviations between AWRCM and SGRCM for S-band weather radars in the South China region.
Figure 16 shows the standard deviation comparison for the two methods, mainly concentrated below 4 dB. The differences between the two standard deviations are within ±1.2 dB, indicating that both methods provide relatively close assessments of the dispersion of ground-based radar observation bias.
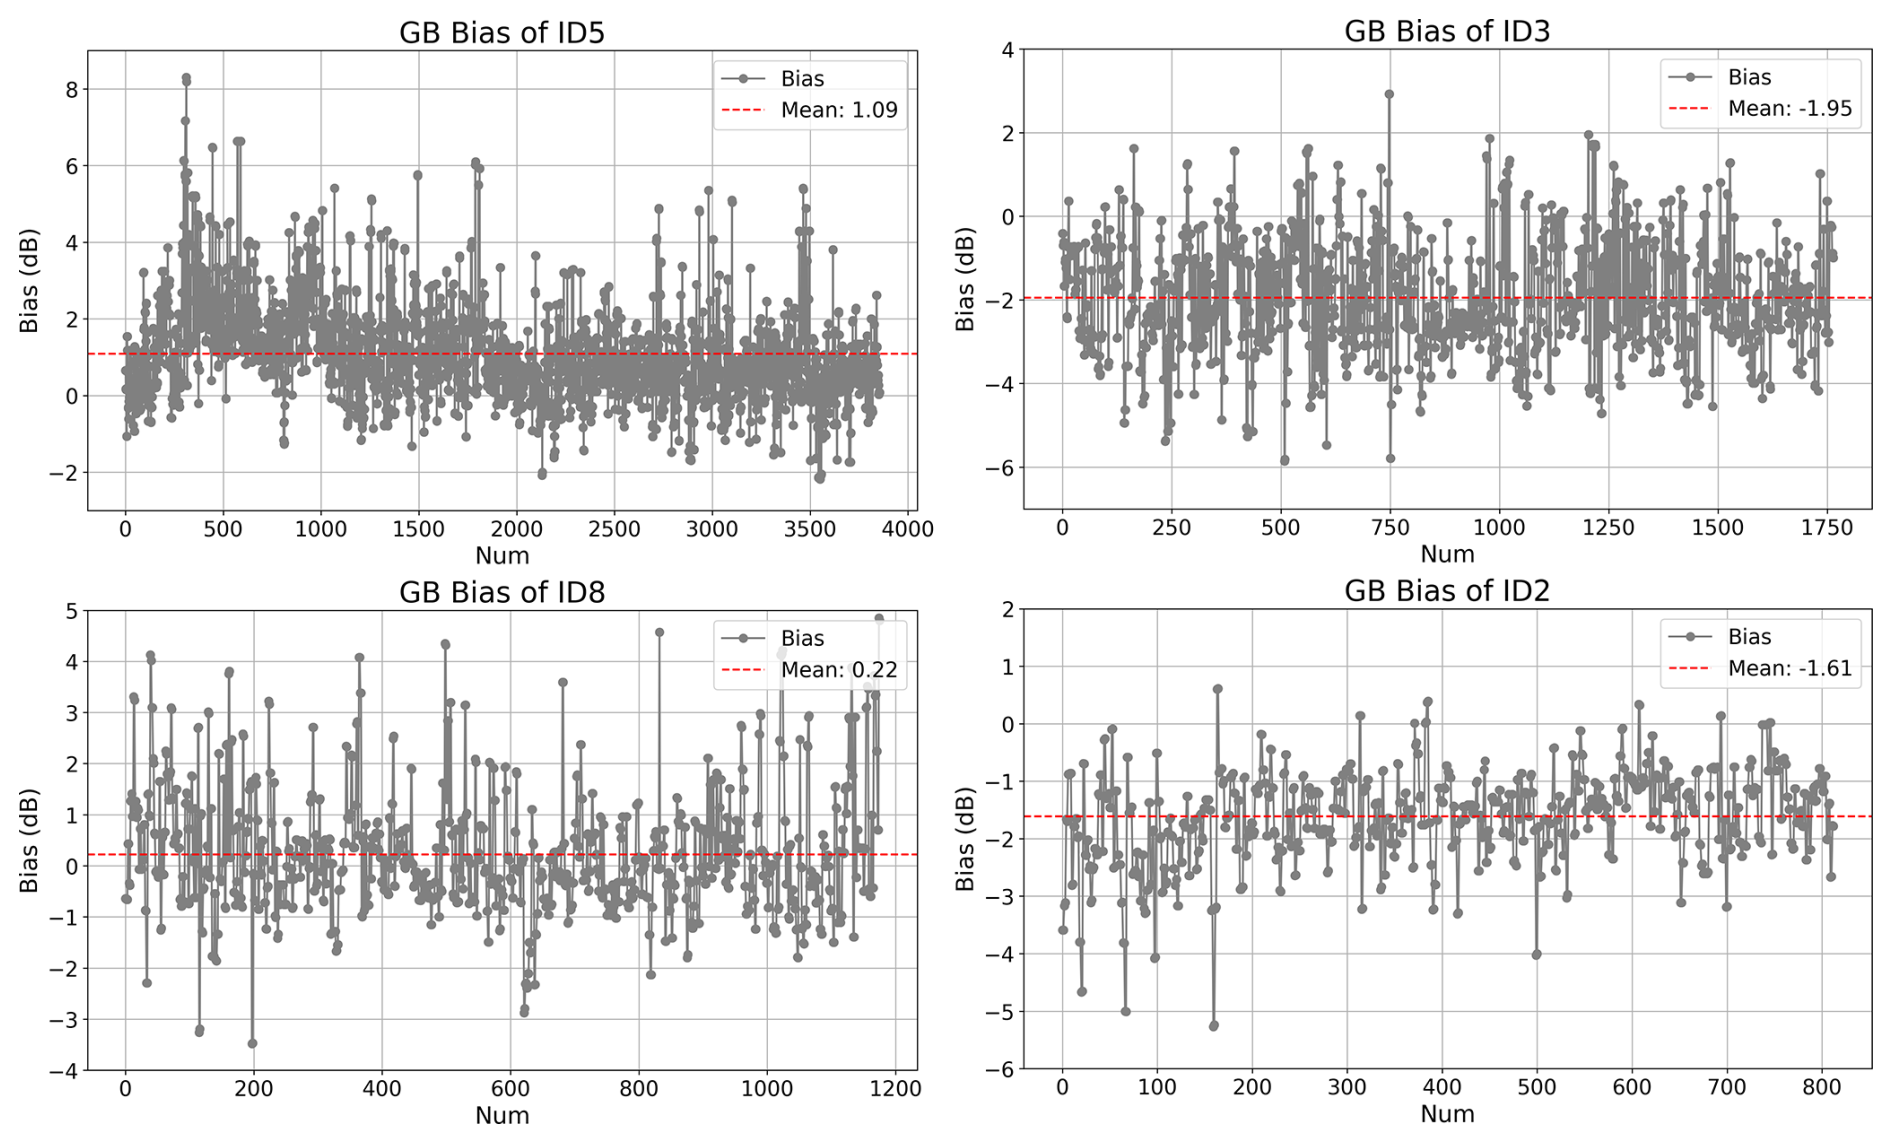
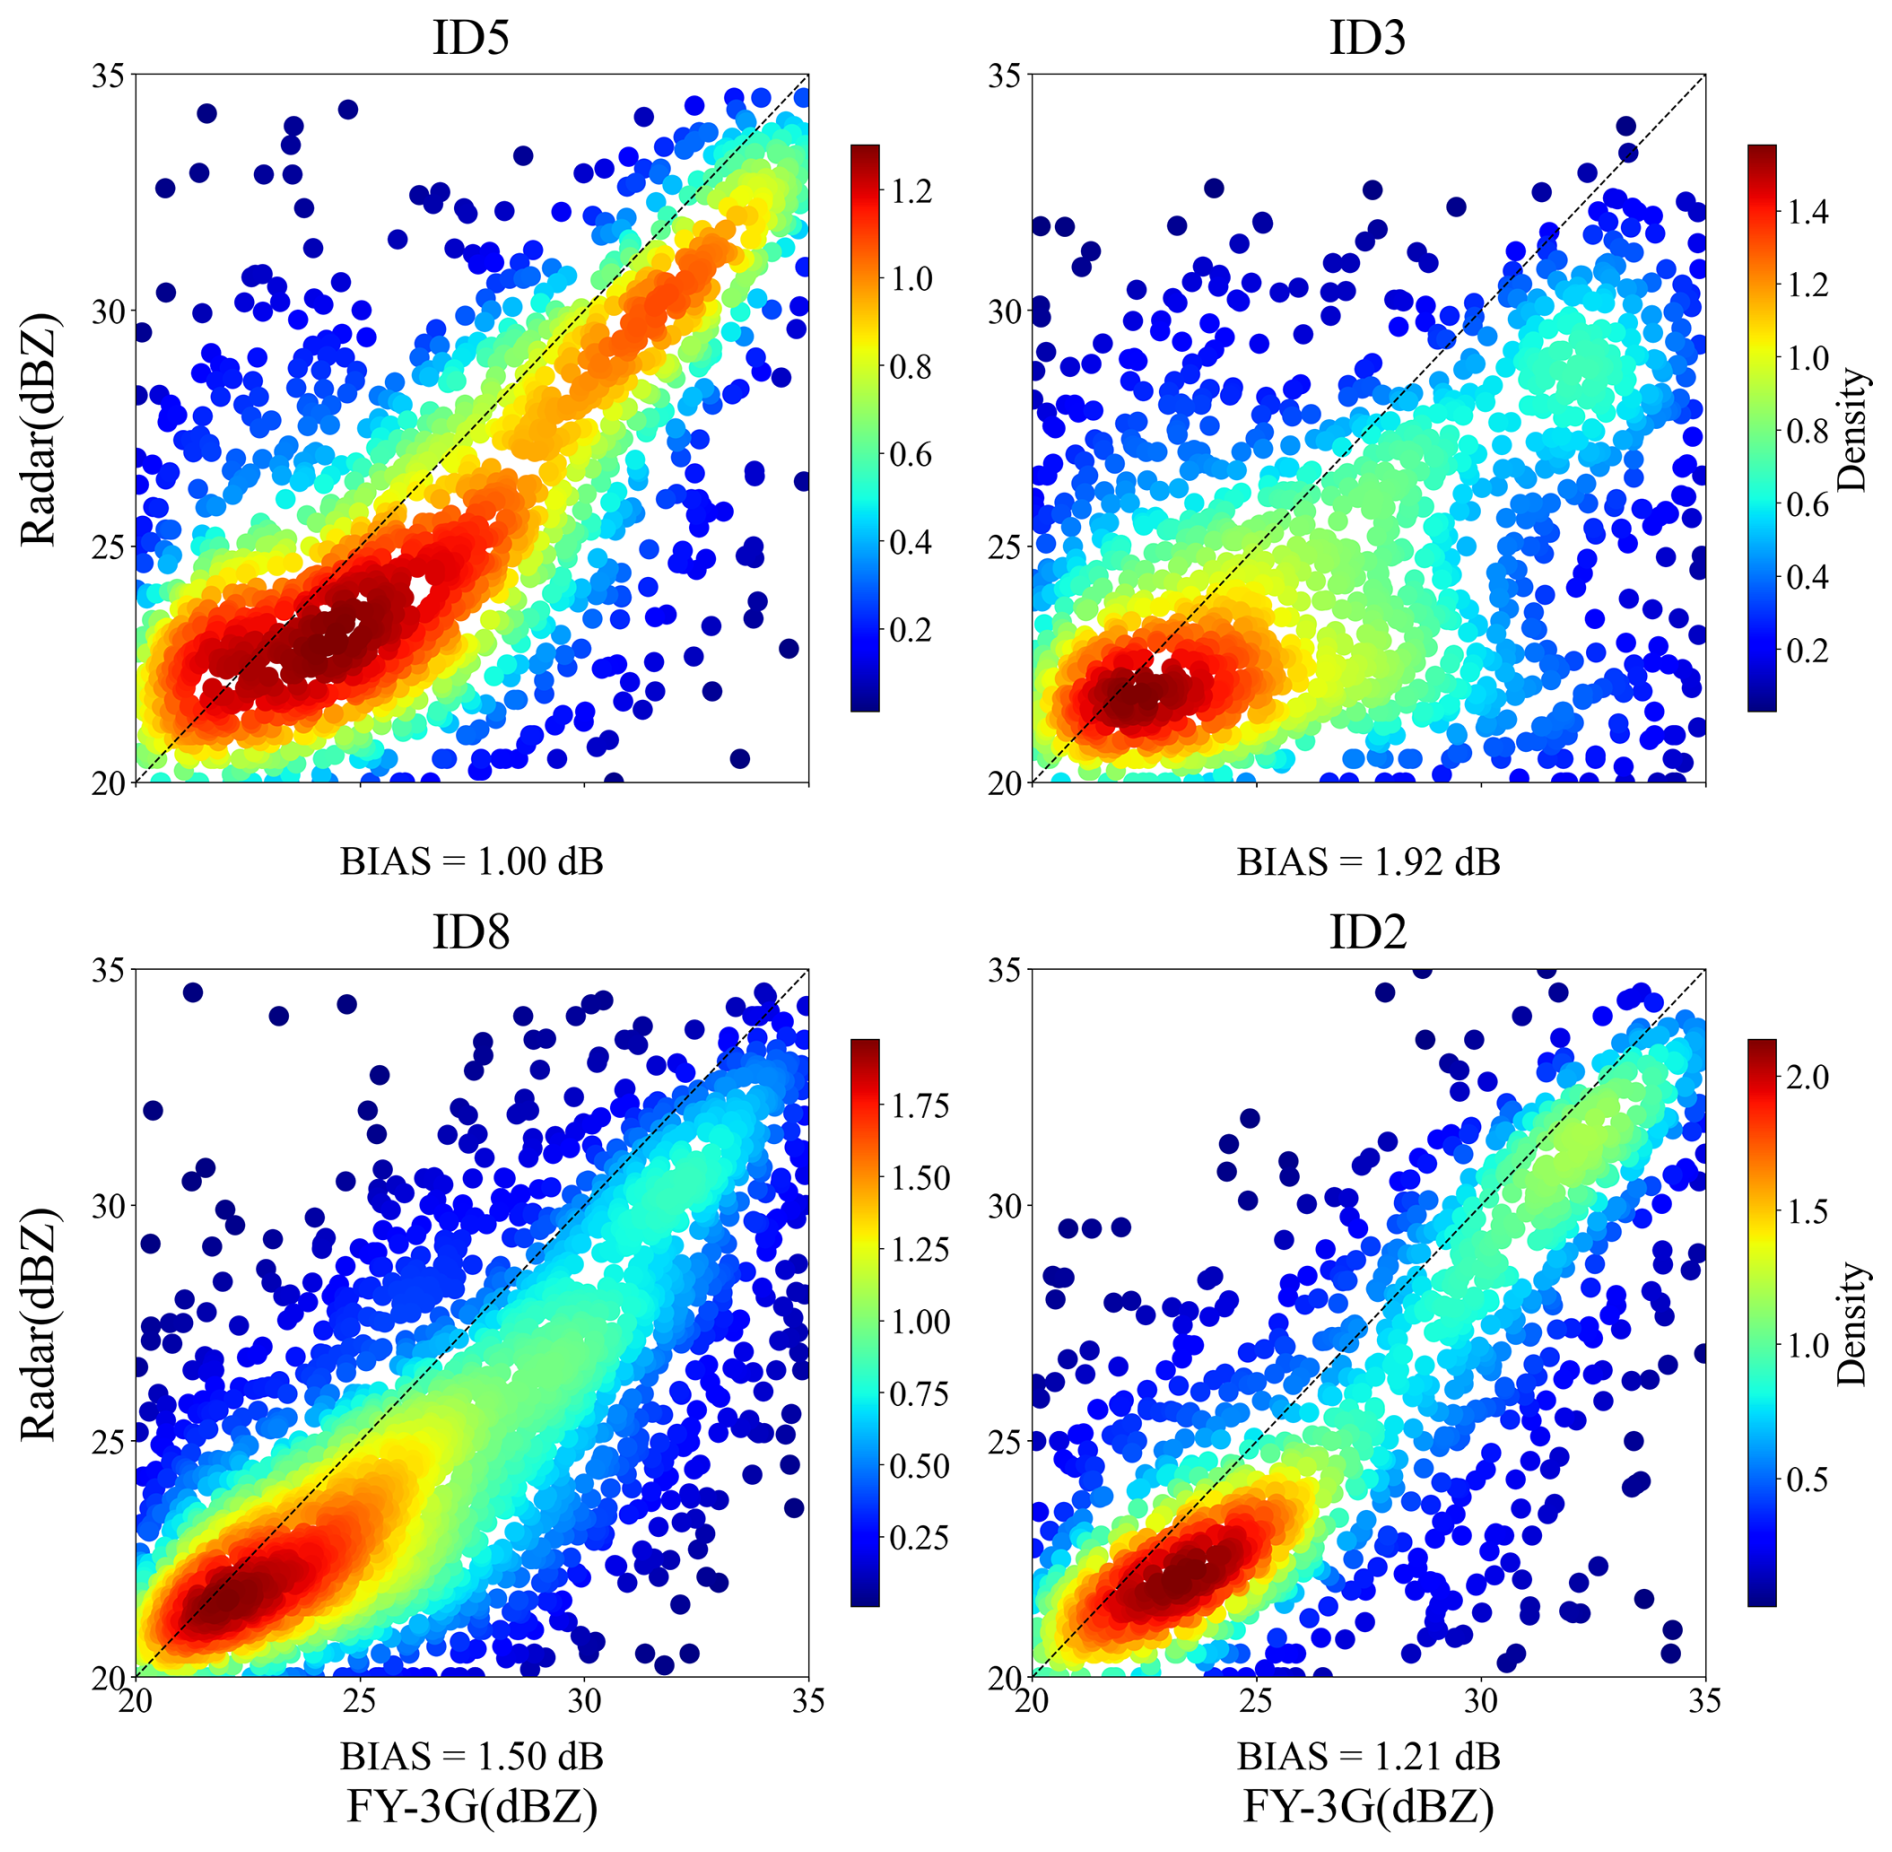
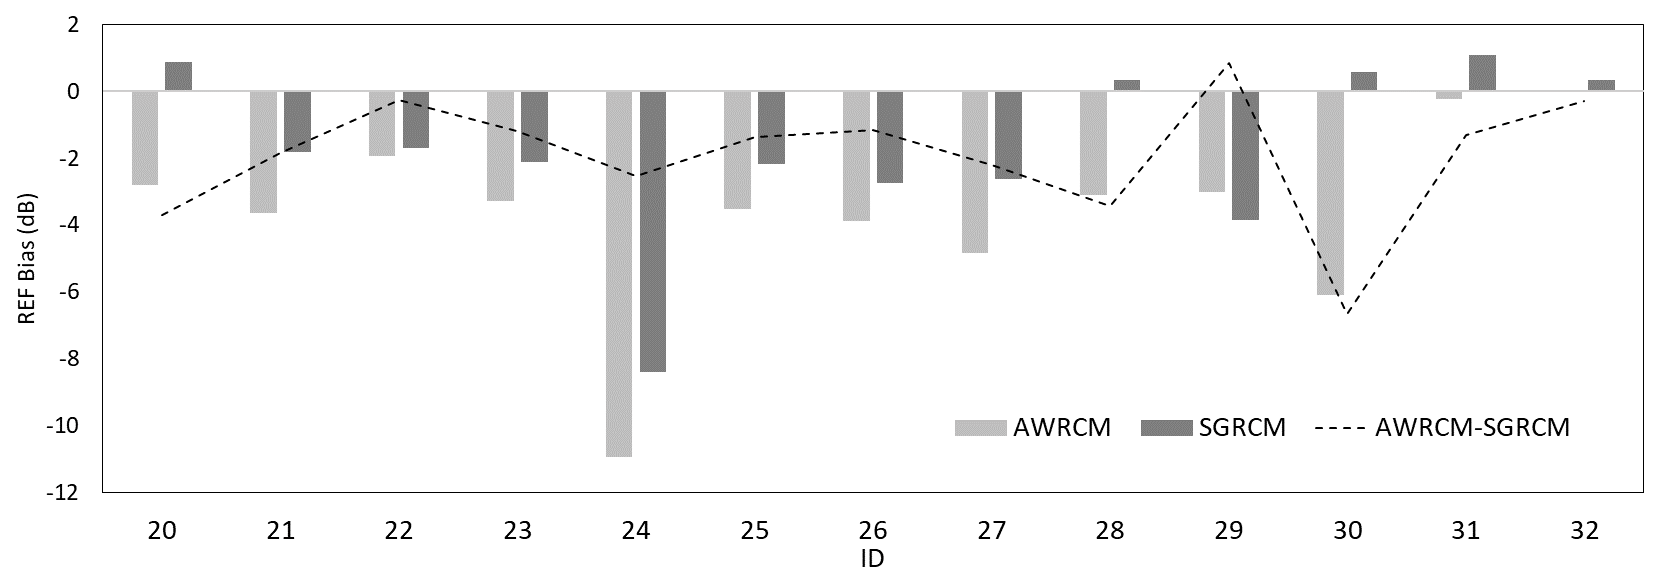
Figure 19Comparison of mean bias between AWRCM and SGRCM for X-band phased-array weather radars in the South China region.
When generating the bar charts for the above statistics, we only selected results where the sample size in the overlapping areas of adjacent radars exceeded 200 to ensure the stability of the results. In the subsequent analysis of single-station, single-time cases, we did not impose this constraint. Data from four selected stations were analyzed. Figure 17 shows the bias analysis results for ground-based consistency. The gray dots represent the bias of single complete volume scan (5–6 min), while the red dashed line represents the mean of bias. Given variations in the number of matched adjacent stations and the weather processes involved, the algorithm computes on a per-time-step volume-scan basis without manual selection of specific weather events; therefore, the analysis sample size varies. The mean of bias between stations ID5, ID8, and their adjacent stations is greater than 0, indicating that these two radars are relatively stronger in the ground-based network, with station ID5 showing a particularly noticeable positive bias. In contrast, stations ID3 and ID2 exhibit negative biases, indicating that these two stations are weaker than their adjacent ground-based radars.
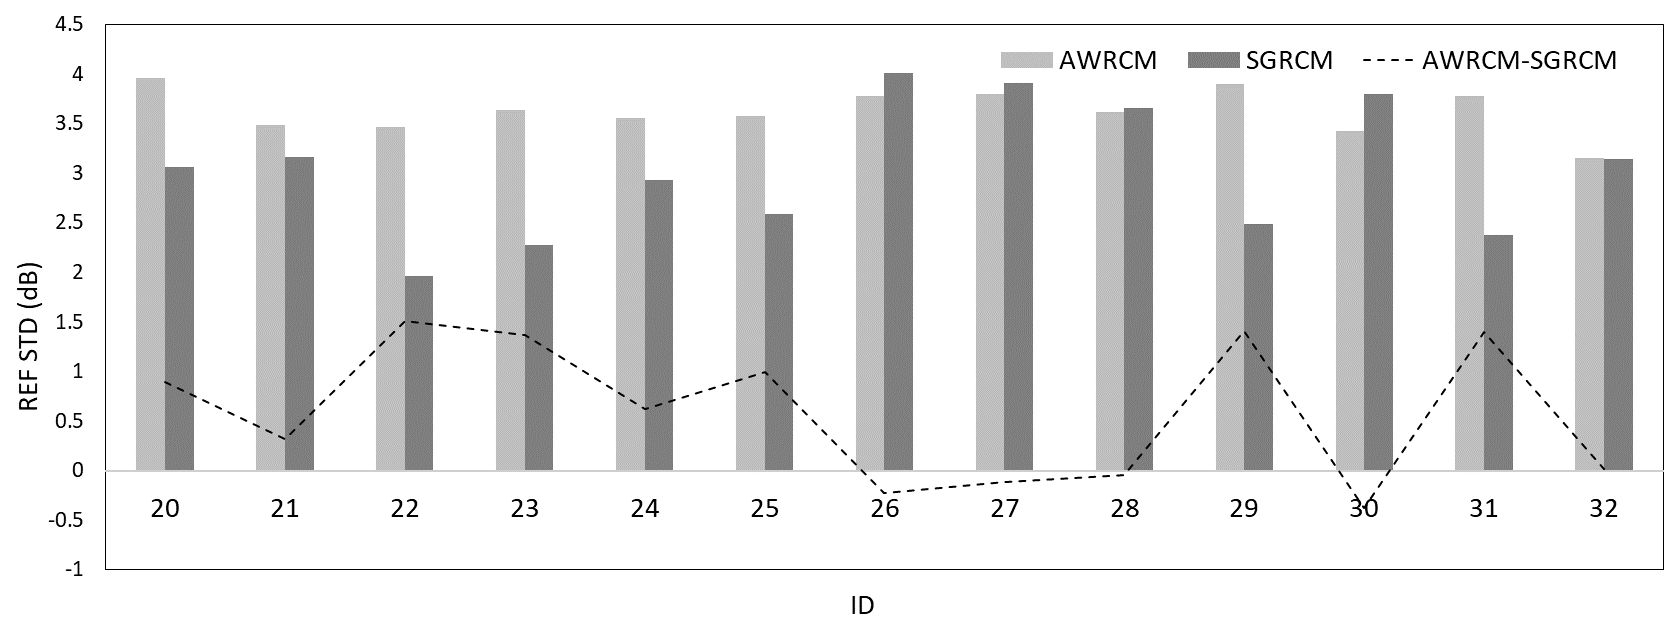
Figure 20Comparison of standard deviations between AWRCM and SGRCM for X-band phased-array weather radars in the South China region.
Figure 18 shows the satellite–ground comparison results for the four stations. It can be observed that the reflectivity factor of the FY-3G PMR is generally larger. Among the four stations, station ID5 has the smallest bias, indicating that ID5's intensity trend is consistent with the ground-based analysis.
3.2.2 Evaluation Results of X-Band Phased-Array Radars
AWRCM and SGRCM analyses were conducted for 13 X-band phased-array weather radars in Guangdong Province, for which attenuation correction has already been applied to the base data (Xiao et al., 2021). The bar chart in Fig. 19 represents the distribution of the mean bias for the two methods. For most phased-array radars, the average bias of both the AWRCM and SGRCM is less than 0, indicating that the reflectivity of the phased-array radars is relatively weaker. This suggests that the attenuation correction applied prior to radar base data generation did not achieve the expected effect, and the reflectivity of X-band phased-array radars remains noticeably weaker compared to S-band radars. The dashed line represents the difference between the AWRCM bias and the SGRCM bias. The results are mainly distributed below 0, suggesting that the bias results from the AWRCM analysis are relatively larger.
The bar chart in Fig. 20 represents the distribution of the standard deviations of the two analysis methods. The results of the AWRCM analysis range from 3.15 to 3.95 dB, while those of the SGRCM analysis range from 1.96 to 4.01 dB, with larger differences in standard deviation observed between different radars in the SGRCM analysis. The dashed line represents the difference between the two analysis results, with most results distributed above 0 dB, indicating that the AWRCM analysis results are relatively larger.
Two X-band phased-array weather radars, ID22 and ID26, were selected for analysis. Figure 21 shows the bias analysis results for the AWRCM. The gray dots represent the bias of single complete volume scan (5–6 min), while the red dashed line represents the mean of bias. It can be observed that the differences in overlapping observation points between the phased-array weather radars and the surrounding S-band weather radars are mainly distributed below 0. The mean biases are −2.02 and −3.83 dB, respectively, indicating that the X-band phased-array radars are weaker than the S-band solid-state weather radars.
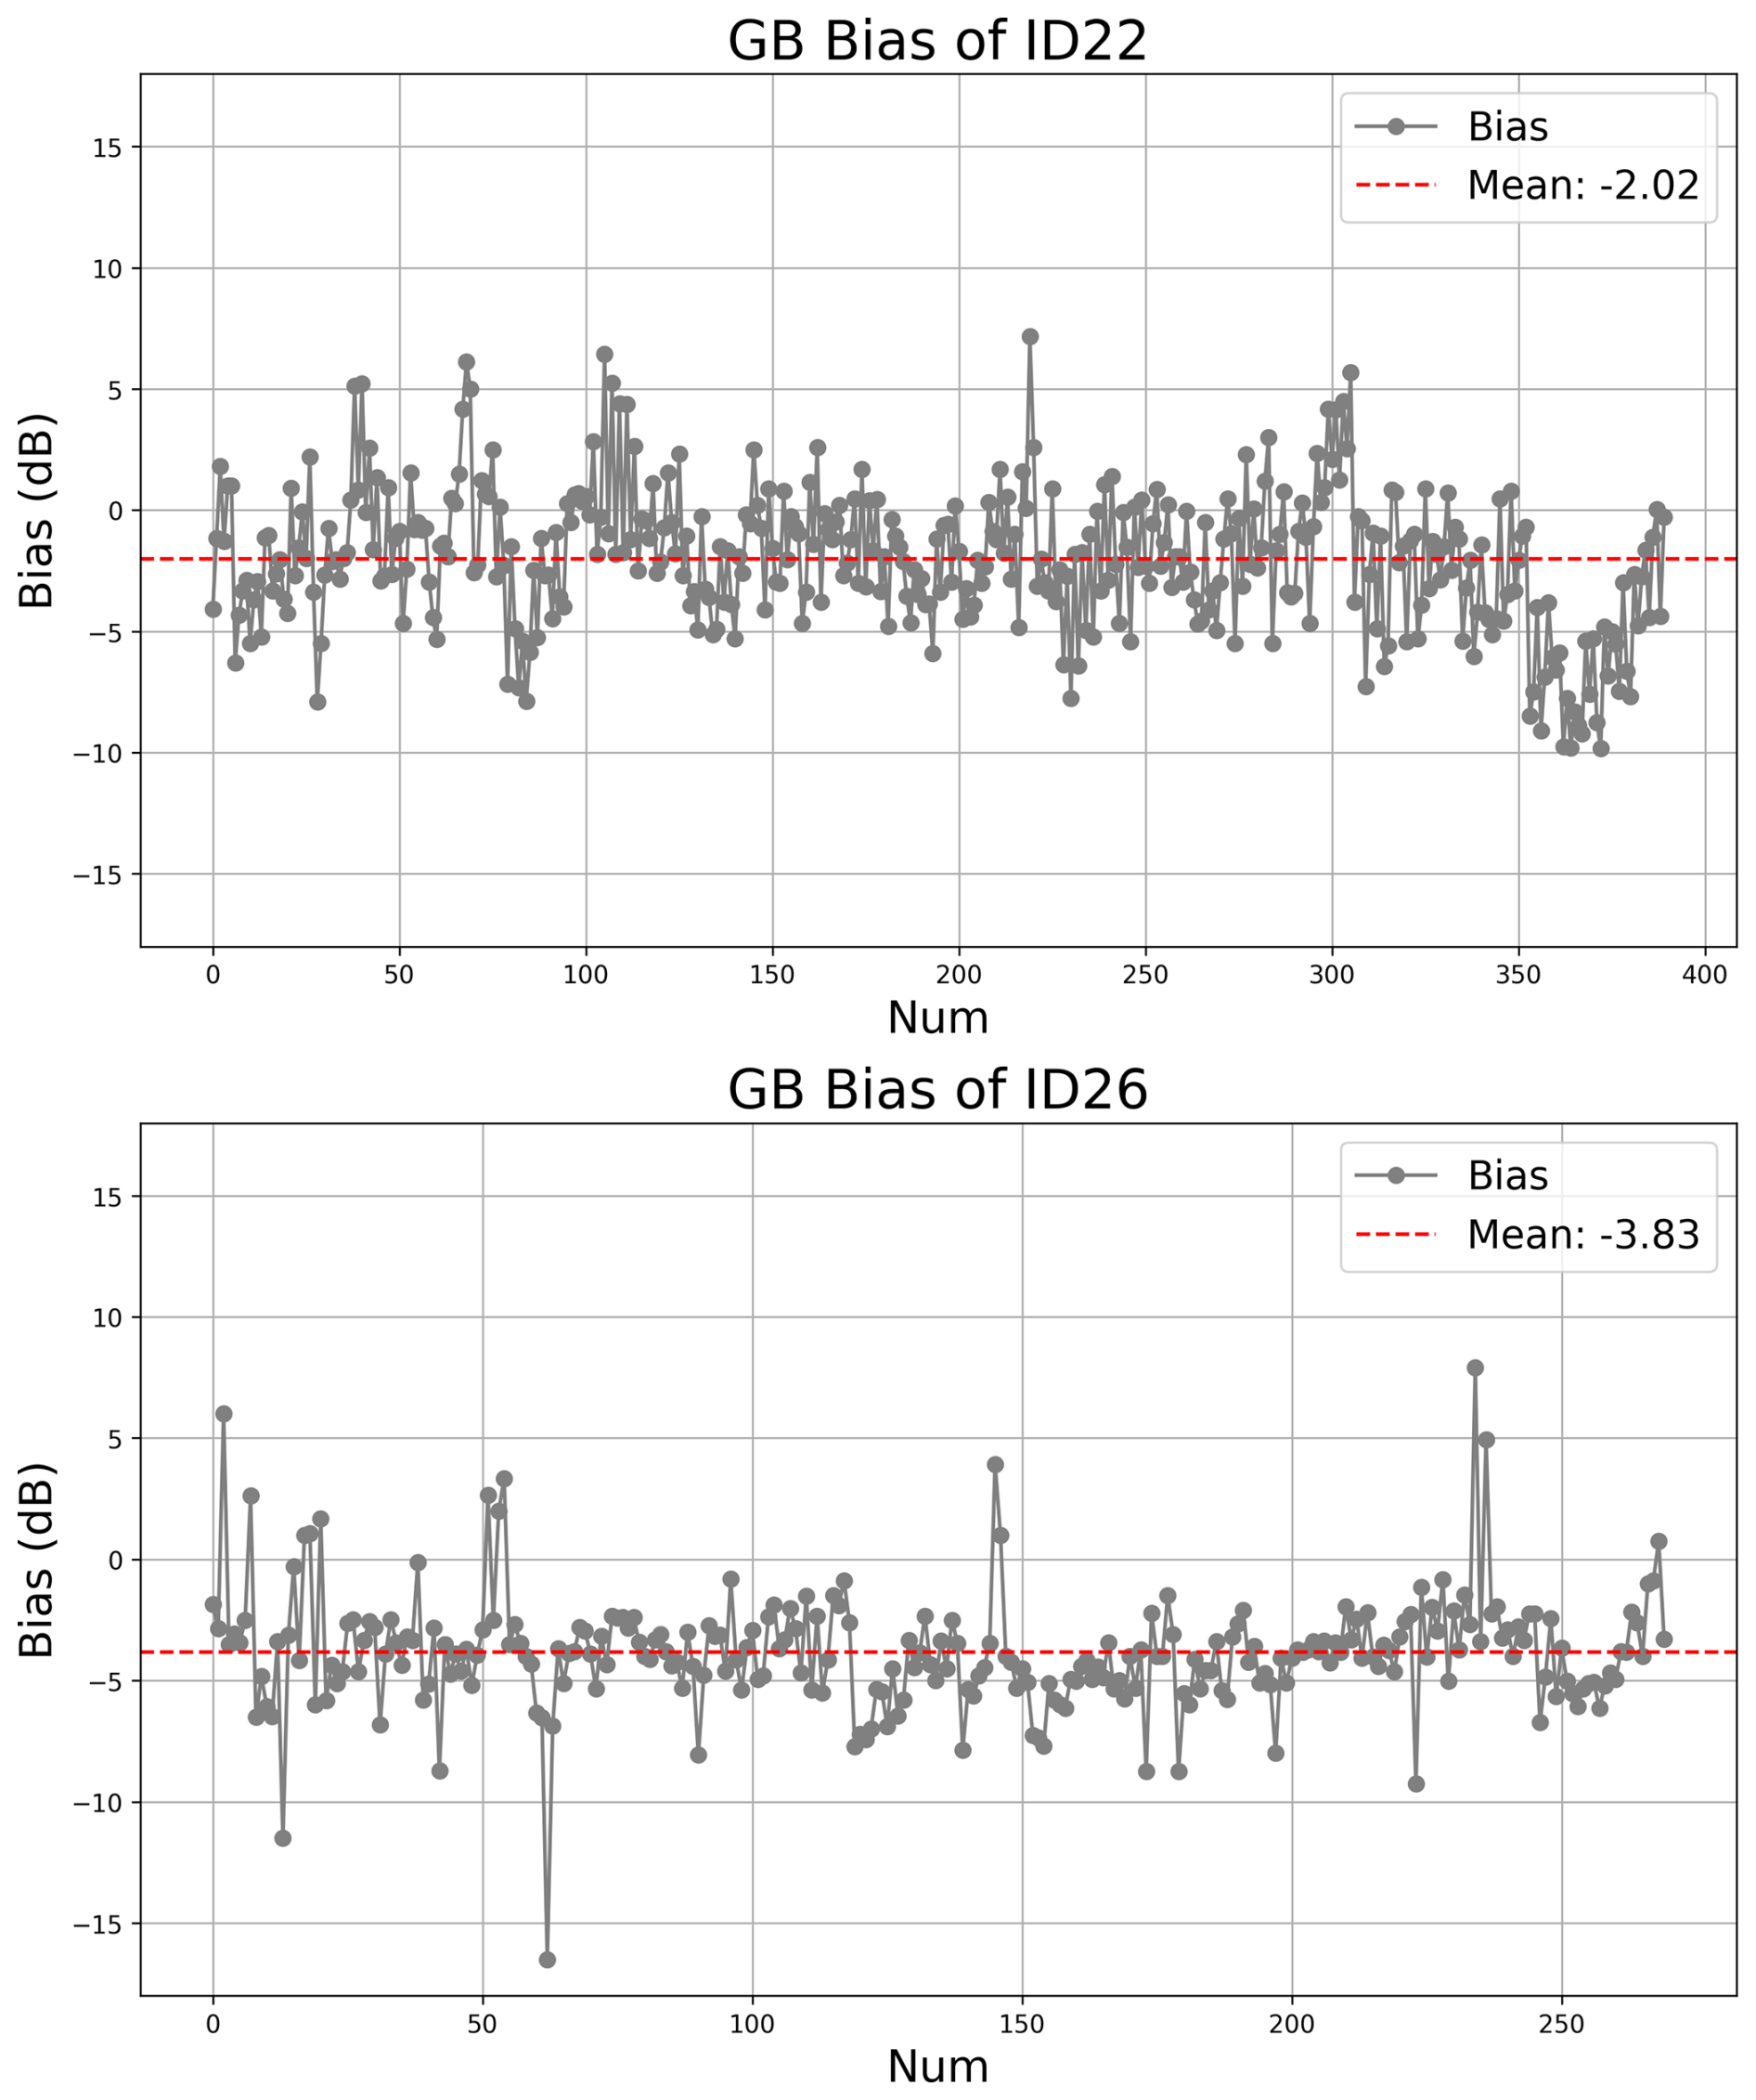
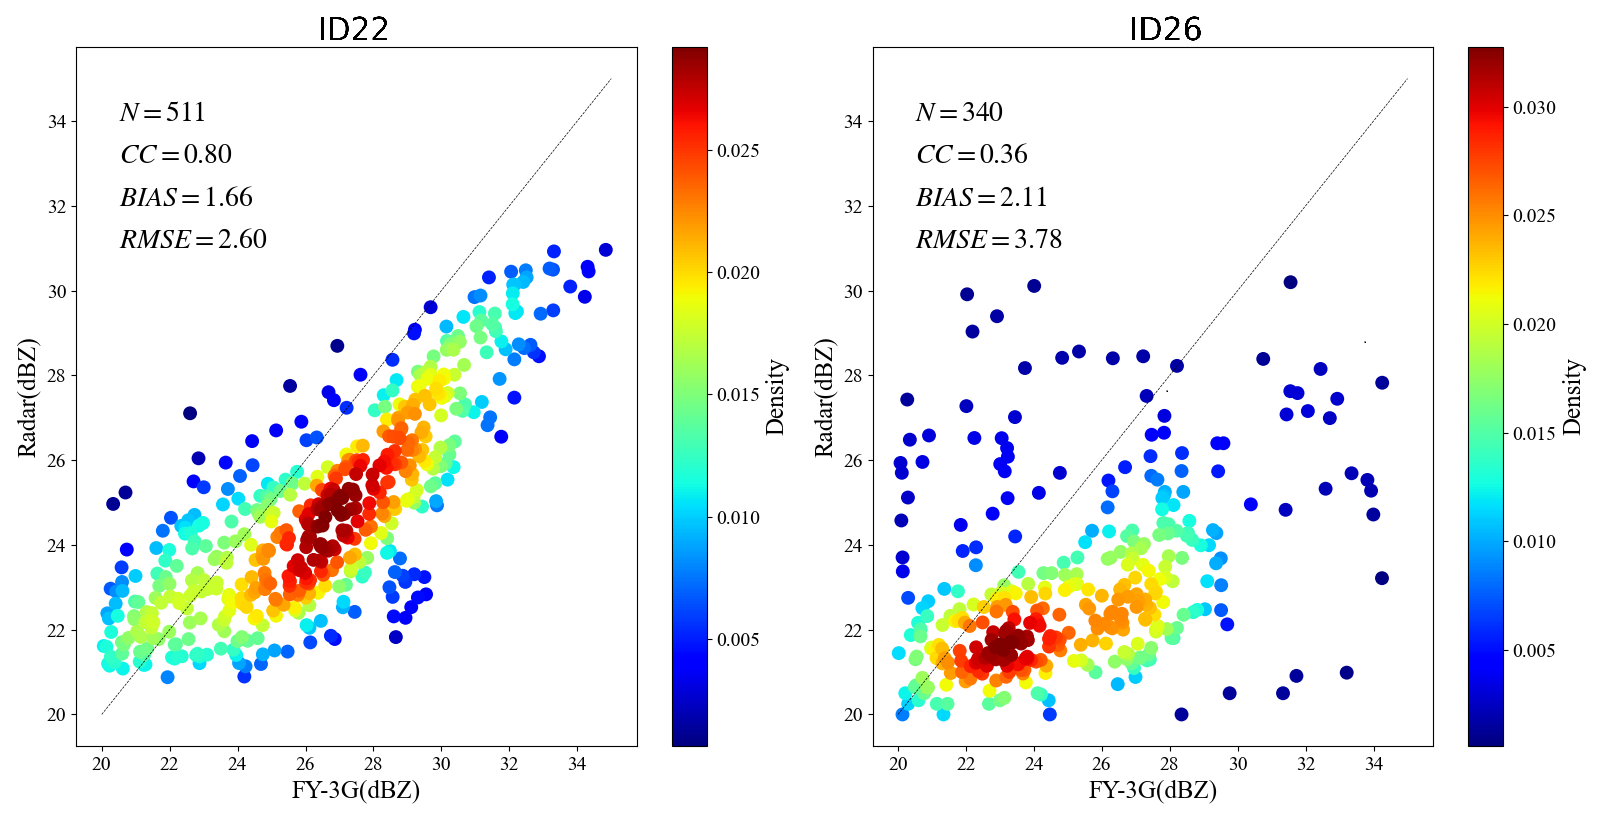
Figure 22 shows the SGRCM analysis results for the two radars. The bias in the figure represents the reflectivity factor of the phased-array radar minus that of FY-3G, with values of 1.66 and 2.11 dB, respectively. This also indicates that the reflectivity factor observed by the X-band phased-array radars is weaker, but the bias results are smaller than the AWRCM analysis results. The SGRCM standard deviation of radar ID22 is smaller than that of radar ID26. From the bias distribution of overlapping observation points, it can be seen that the SGRCM bias of radar ID26 exhibits greater dispersion. A preliminary analysis indicates that the valid SGRCM comparison results for radar ID22 are mainly concentrated in August 2024, whereas those for radar ID26 span June–September. Owing to the longer time window, the precipitation types encountered are more diverse, which may lead to differences in the SGRCM scatter distributions. This conclusion, however, requires further verification and analysis with additional observational data.
From the analysis of radars ID22 and ID26, we observe that although both X-band phased-array radars applied attenuation correction prior to base data generation, the correction performance is not satisfactory. Notable biases remain in the reflectivity factor relative to the adjacent S-band radar. This will increase the complexity of subsequent networked applications of the data; therefore, an additional attenuation-correction step will be introduced before the mosaicking.
In daily operations, the two consistency evaluation methods provide a basis for real-time monitoring of observational biases in ground-based radars. Once a significant change is detected in the consistency evaluation results, we will initiate the subsequent calibration procedures, including Solar Calibration (Holleman et al., 2022) and Metal Sphere Calibration (Peng et al., 2022). To determine whether the results of the above consistency analyses are correct and whether they can provide a basis for calibration, we conducted a rectification experiment using an SC (a model of S-band radar) weather radar located in Sanya City, Hainan Province. Before calibration, the deviation between this radar and surrounding radars and that between satellite and ground measurements both exceeded 2.7 dB. During the system calibration, the system parameters of each radar station were revised and recalibrated. The main adjustment involved modifying the transmission branch feeder loss parameter, changing the single-H transmission feeder loss from 1.59 to 2.50 dB. By calibrating the internal continuous-wave power using the external continuous-wave power, the internal continuous-wave power before the low-noise amplifier was adjusted from 0.30 dBm before rectification to 1.30 dBm.
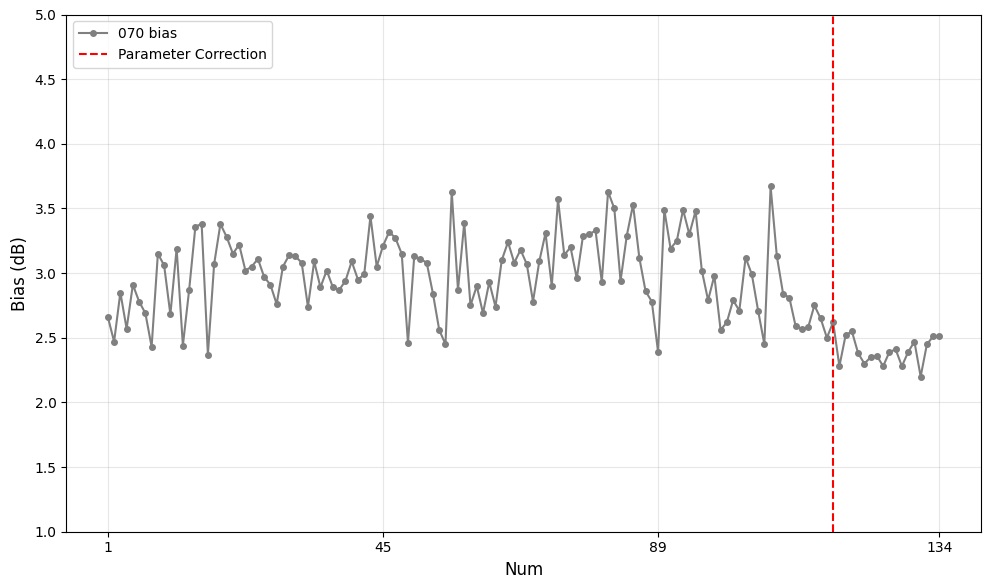
Figure 23AWRCM results of the SC method radar in Sanya City, Hainan Province, before and after rectification. The gray line in the chart represents the variation in deviation, while the red dashed line indicates the rectification time.
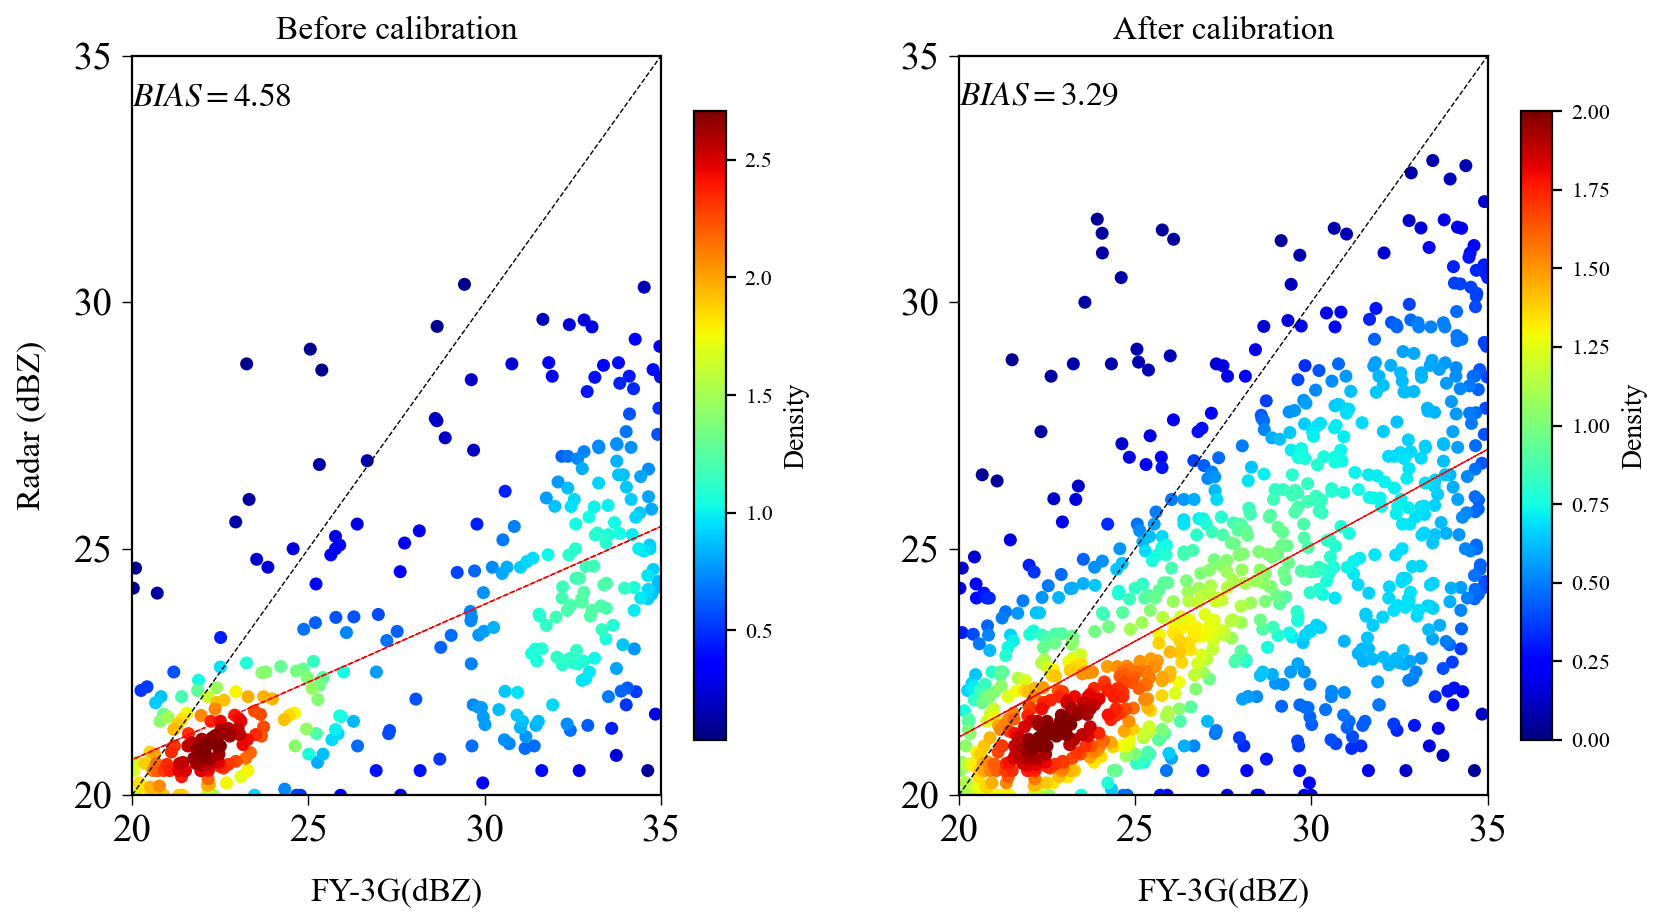
Figure 24SGRCM results of the SC method radar in Sanya City, Hainan Province, before and after rectification: left: before calibration; right: after calibration.
Figures 23–24 present the ground-based consistency results and the satellite–ground consistency results before and after calibration. In Fig. 23, the gray dots represent a complete volume scan, and the red dashed line marks 24 August 2024, the date on which the radar site underwent calibration. It can be seen that the deviation between the Sanya radar and surrounding radars exhibits changes before and after calibration. In Fig. 24, the panel on the left analyzes the satellite–ground consistency results for the Sanya site from 4 May to 20 August 2024, while the panel on the right analyzes the satellite–ground comparison results from 30 August 2024 to 22 July 2025. The satellite–ground comparisons indicate that the bias changed before and after the calibration. However, the stability of the rectification effect still require further verification through the accumulation of long time-series data.
The FY-3G PMR Level 2 products have been available since January 2024. Due to the observational characteristics of polar-orbiting satellites, the orbital data over the South China region are limited. Conversely, the X-band phased-array weather radar provides high-frequency observations; however, due to the limited transmission bandwidth, the raw data frequency of the X-band phased-array radar is compressed from 1 min intervals to 10 min intervals, resulting in a smaller sample size for analysis. By analyzing the comparison results between the national S-band weather radars and the FY-3G PMR, it was found that the satellite's reflectivity factor as shown in Fig. 25 is generally stronger, with a mean bias of 0.44 dB. This bias was not considered in the comparison of the results from the two methods. If the satellite–ground consistency results are to be transferred to ground-based consistency results, then this bias needs to be removed.
In conclusion, the two types of reflectivity factor comparison methods can be used as calibration methods for multi-band weather radars; however, there are also differences between them. Based on the analysis of precipitation events in 2024, it can be observed that the bias range between S-band weather radar and surrounding radars of the same band is relatively large. The absolute bias from satellite-to-ground analysis is smaller than that from ground-based analysis, while the standard deviation from satellite-to-ground analysis is larger than that from ground-based analysis, indicating greater dispersion in the bias between satellite and ground-based radars. The two analytical methods for the X-band phased array weather radar show good consistency and both demonstrate the significant attenuation characteristic of the X-band phased array weather radar. Overall, the metrics from ground-based consistency analysis are greater than those from satellite-to-ground analysis, which may be due to the fact that the former considers data from the entire detection range, whereas the latter is limited by observation distance. This distance limitation eliminates the impact caused by inconsistencies in radar beam pointing calibration in the overlapping distant observation regions. More observational samples are needed for further analysis of this effect.
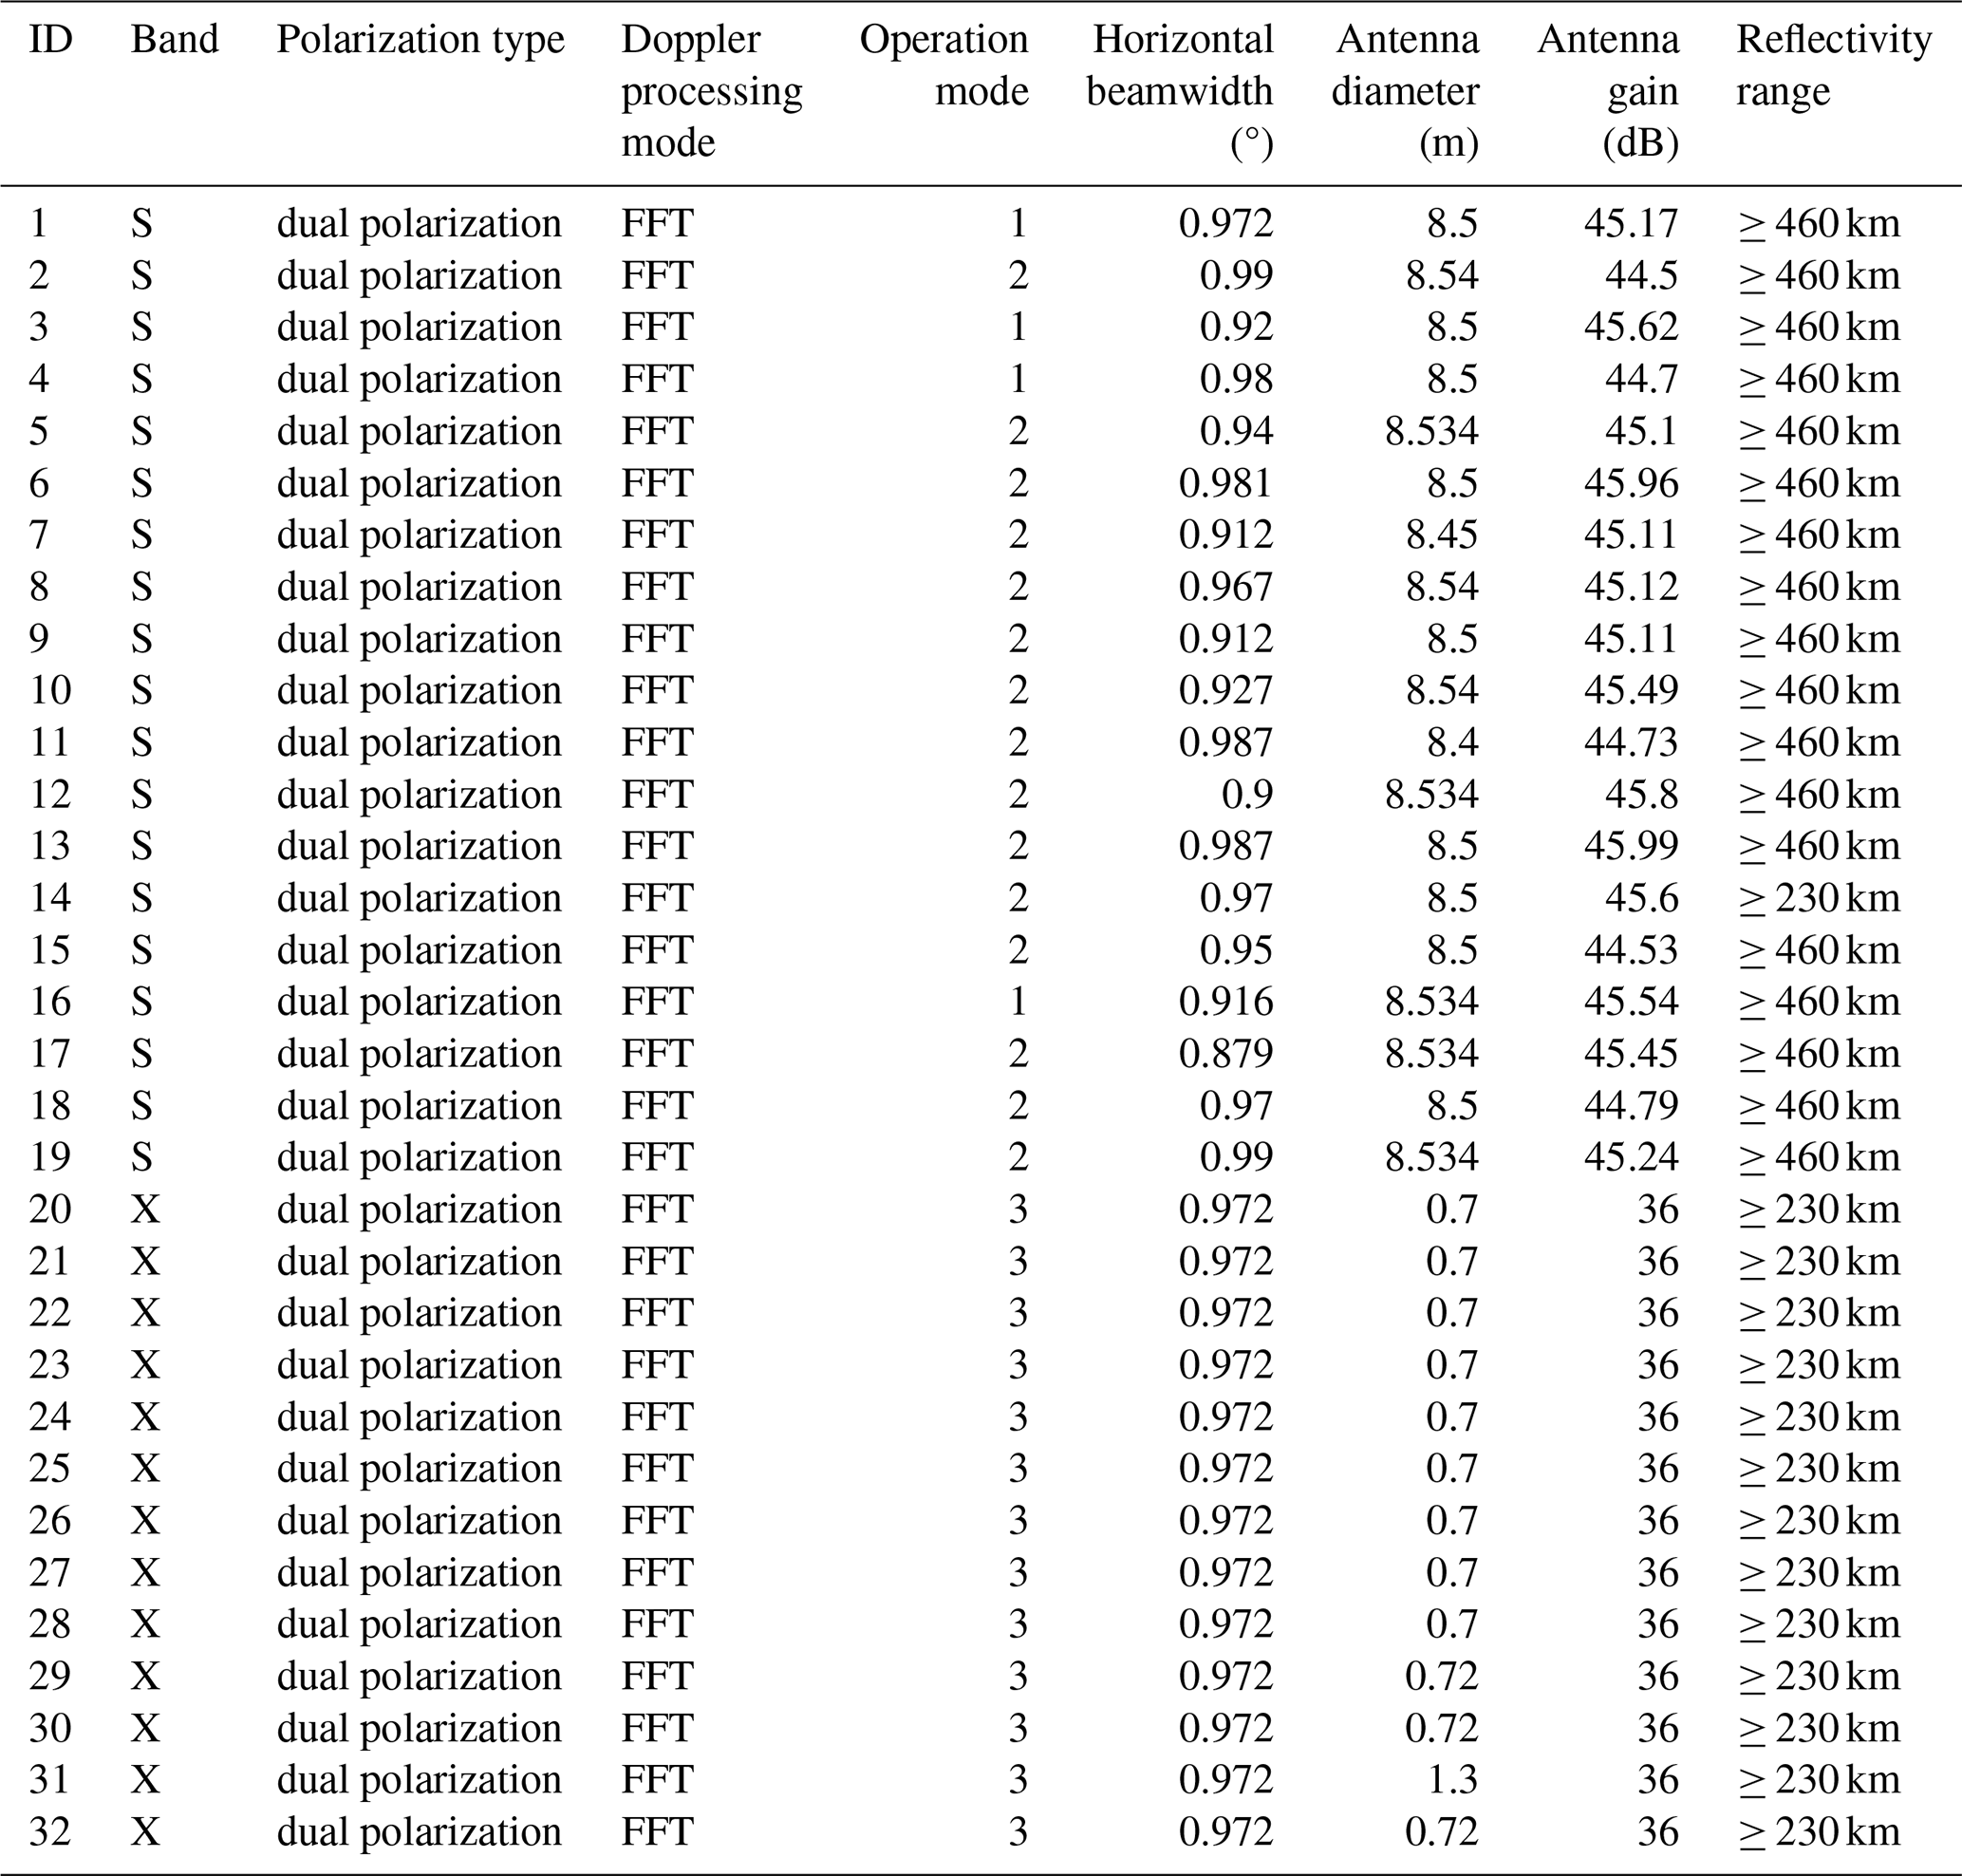
The relevant hardware information for the 19 S-band weather radars and 13 X-band phased array radars used in this study is summarized in the table below. For the “Operation mode” column, we use the following numerical codes: 1 – all-solid-state amplification, 2 – amplification chain where a solid-state amplifier drives a klystron amplifier, 3 – active phased array.
Table A1Weather radar hardware information in the South China Region.
The code is a research prototype and has not been hardened for public release (e.g., hard-coded paths and undocumented configurations). We are unable to commit to security review, comprehensive documentation, or long-term maintenance. In addition, the code developed in this study will be used in applications, and we reserve the right to pursue relevant patent protection.
The China Meteorological Administration (CMA) classifies meteorological observational data by access levels. Weather radar base data are designated as Level 2 and cannot be shared externally. The weather radar and satellite data used in this study are only accessible within the CMA on-premises network, which requires users to sign the relevant usage agreements. Readers who wish to obtain access please contact the National Meteorological Information Center of the CMA.
HH: Conceptualization, Methodology, Formal analysis, Writing – original draft preparation, Writing – review and editing, Supervision. SP: Conceptualization, Validation. LW: Data curation, Funding acquisition. NS: Project administration. CZ: Validation, Investigation. HW: Investigation, Validation. YL: Resources, Supervision.
The contact author has declared that none of the authors has any competing interests.
Publisher's note: Copernicus Publications remains neutral with regard to jurisdictional claims made in the text, published maps, institutional affiliations, or any other geographical representation in this paper. While Copernicus Publications makes every effort to include appropriate place names, the final responsibility lies with the authors. Also, please note that this paper has not received English language copy-editing. Views expressed in the text are those of the authors and do not necessarily reflect the views of the publisher.
We thank all anonymous referees for improvements to the manuscript.
This research has been supported by the China Meteorological Service Association Meteorological Science and Technology Innovation Platform Project (grant no. CMSA2023MB005) and the National Natural Science Foundation of China (grant no. U2342216).
This paper was edited by Gianfranco Vulpiani and reviewed by three anonymous referees.
Bech, J., Codina, B., Lorente, J., and Bebbington, D.: The sensitivity of single polarization weather radar beam blockage correction to variability in the vertical refractivity gradient, J. Atmos. Oceanic Technol., 20, 845–855, https://doi.org/10.1175/1520-0426(2003)020<0845:TSOSPW>2.0.CO;2, 2003.
Biggerstaff, M. and Listemaa, A.: An improved scheme for convective/stratiform echo classification using radar reflectivity, J. Appl. Meteor., 39, 2129–2150, https://doi.org/10.1175/1520-0450(2001)040<2129:AISFCS>2.0.CO;2, 2000.
Bolen, S. and Chandrasekar, V.: Quantitative cross-validation of space-based and ground-based radar observations, Journal of Applied Meteorology, 39, 2071–2079, https://doi.org/10.1175/1520-0450(2001)040<2071:QCVOSB>2.0.CO;2, 2000.
Bringi, V. and Chandrasekar, V.: Polarimetric Doppler Weather Radar: Principles and Applications, Cambridge University Press, Cambridge, UK, 636 pp., https://doi.org/10.1017/CBO9780511541094, 2001.
China Meteorological Administration (CMA): The FY-3G satellite: Advancing precipitation measurement with Ku and Ka band radars, Journal of Satellite Meteorology and Remote Sensing, 12, 123–135, 2023.
Dinku, T., Anagnostou, E., and Borga, M.: Improving radar-based estimation of rainfall over complex terrain, J. Appl. Meteor., 41, 1163–1178, https://doi.org/10.1175/1520-0450(2002)041<1163:IRBEOR>2.0.CO;2, 2002.
Doviak, R. and Zrnić, D.: Doppler Radar and Weather Observations, 2nd edn., Dover Publications, Mineola, N.Y., 22–34, ISBN 0486450600, 2006.
Fabry, F. and Zawadzki, I.: Long-term radar observations of the melting layer of precipitation and their interpretation, Journal of the Atmospheric Sciences, 52, 838–851, https://doi.org/10.1175/1520-0469(1995)052<0838:LTROOT>2.0.CO;2, 1995.
Gourley, J., Kaney, B., and Maddox, R.: Evaluating the calibrations of radars: a software approach, in: Proceedings of the 31st International Conference on Radar Meteorology, American Meteorological Society, Seattle, WA, USA, August 2003, 459–462, 2003.
He, H., Cheng, M., and Zhou, K.: Comparison of data and product obtained by TRMM/PR and Hong Kong radar, Meteor. Mon.,28, 32–36, https://doi.org/10.1108/03074350210767799, 2002.
Holleman, I., Huuskonen, A., and Taylor, B.: Solar Monitoring of the NEXRAD WSR-88D Network Using Operational Scan Data, J. Atmos. Oceanic Technol., 39, 193–205, https://doi.org/10.1175/JTECH-D-20-0204.1, 2022.
Kitchen, M. and Jackson, P.: Weather radar performance at long range – Simulated and observed, J. Atmos. Oceanic Technol., 10, 975–985, https://doi.org/10.1175/1520-0450(1993)032<0975:WRPALR>2.0.CO;2, 1993.
Lakshmanan, V., Hondl, K., Stumpf, G., and Smith, T.: Quality control of weather radar data using texture features and a neural network, Preprints, 31st Radar Conference, Seattle, Washington, USA, August 2003, 522–525, 2003.
Li, Z., Wen, Y., Liao, L., Wolff, D., Meneghini, R., and Schuur, T.: Joint collaboration on comparing NOAA's ground-based weather radar and NASA–JAXA's spaceborne radar, Bulletin of the American Meteorological Society, 104, 1435–1451, https://doi.org/10.1175/BAMS-D-22-0127.1, 2023.
Liu, Y., Li, C., Zhang, L., Wen, H., and Wang, S.: Statistical analysis of terrain blockage impacts on the CINRAD network based on DEM data, Acta Meteorologica Sinica, 78, 705–720, https://doi.org/10.11676/qxxb2020.037, 2020.
Lu, D., Hu, H., Wu, L., Liu, Y., Li, R., Wu, Lin., and Yuan, Y.: Influence factors analysis and improvement of consistency evaluation algorithm between weather radar, Meteor. Mon., 50, 475–487, https://doi.org/10.7519/j.issn.1000-0526.2023.121201, 2024.
Luo, B., Zhai, P., Jia, L., Wu, L., Chi, Q., and Ci, D.: Consistency evaluation for observation and TRMM precipitation estimation in Tibetan Plateau, Meteor. Mon., 41, 1119–1125, https://doi.org/10.7519/j.issn.1000-0526.2015.09.009, 2015.
Maddox, R., Zhang, J., Gourley, J., and Howard, K.: Weather radar coverage over the contiguous United States, Weather and Forecasting, 17, 927–934, https://doi.org/10.1175/1520-0434(2002)017<0927:WRCOTC>2.0.CO;2, 2002.
National Weather Service (NWS): Ground-based weather radar mode-switching trials: An overview of VCP11, VCP21, and VCP31 modes, Journal of Weather Radar Technology and Applications, 18, 45–53, 2025.
Park, S., Jung, S., and Lee, G.: Cross validation of TRMM PR reflectivity profiles using 3D reflectivity composite from the ground-based radar network over the Korean Peninsula, J. Hydrometeor., 16, 668–687, https://doi.org/10.1175/JHM-D-14-0092.1, 2015.
Peng, A., Liu, W., Zuo, Y., and Guo, L.: Calibrator Irregularity Error Compensation for Radar Cross Section Measurement, IEEE Antennas and Wireless Propagation Letters, 21, 1263–1267, https://doi.org/10.1109/LAWP.2022.3163910, 2022.
Protat, A., Louf, V., Soderholm, J., Brook, J., and Ponsonby, W.: Three-way calibration checks using ground-based, ship-based, and spaceborne radars, Atmos. Meas. Tech., 15, 915–926, https://doi.org/10.5194/amt-15-915-2022, 2022.
Ryzhkov, A. and Zrnić, D.: Polarimetric rainfall estimation in the presence of anomalous propagation, J. Atmos. Oceanic Technol., 12, 229–244, https://doi.org/10.1175/1520-0426(1998)015<1320:PREITP>2.0.CO;2, 1998.
Saltikoff, E., Cho, J., Tristant, T., Holleman, A., Allmon, L., Cook, R., Becker, E., and Joe, P.: The threat to weather radars by wireless technology, Bulletin of the American Meteorological Society, 97, 1159–1167, https://doi.org/10.1175/BAMS-D-15-00048.1, 2016.
Schwaller, M. and Morris, K.: A ground validation network for the Global Precipitation Measurement Mission, J. Atmos. Oceanic. Technol., 28, 301–319, https://doi.org/10.1175/2010JTECHA1403.1, 2011.
Skolnik, M.: Radar Handbook, 3rd edn., IEEE Aerospace Electronic Systems Magazine, 23, 41–41, McGraw-Hill Education, https://doi.org/10.1109/MAES.2008.4523916, 2008.
Smith, T., Lakshmanan, V., Stumpf, G., Ortega, K., Hondl, K., Cooper, K., Calhoun, K., Kingfield, D., Manross, K., Toomey, R., and Brogden, J.: Multi-Radar Multi-Sensor (MRMS) severe weather and aviation products: Initial operating capabilities, Bull. Amer. Meteor. Soc., 97, 1617–1630, https://doi.org/10.1175/BAMS-D-14-00173.1, 2016.
Steiner, M., Houze Jr., R., and Yuter, S.: Climatological characterization of three-dimensional storm structure from operational radar and rain gauge data, J. Appl. Meteor. Climatol., 34, 1978–2007, https://doi.org/10.1175/1520-0450(1995)034<1978:CCOTDS>2.0.CO;2, 1995.
Tang, L., Zhang, J., Simpson, M., Arthur, A., Grams, H., Wang, Y., and Langston, C.: Updates on the Radar Data Quality Control in the MRMS Quantitative Precipitation Estimation System, J. Atmos. Oceanic. Technol., 37, 1521–1537, https://doi.org/10.1175/JTECH-D-19-0165.1, 2020.
Testud, J., Le Bouar, E., Obligis, E., and Ali-Mehenni, M.: The rain profiling algorithm applied to polarimetric weather radar, J. Atmos. Oceanic Technol., 17, 332–356, https://doi.org/10.1175/1520-0426(2000)017<0332:TRPAAT>2.0.CO;2, 2000a.
Testud, J., Oury, S., Black, R., Amayenc, P., and Dou, X.: The concept of “normalized” distribution to describe raindrop spectra: A tool for cloud physics and cloud remote sensing, Journal of Applied Meteorology, 39, 1118–1140, https://doi.org/10.1175/1520-0450(2001)040<1118:TCONDT>2.0.CO;2, 2000b.
Vukovic, Z., Young, J., and Donaldson, N.: Inter-radar comparison accounting for partially overlapping volumes, in: Proceedings of the 8st European Conference on Radar in Meteorology and Hydrology, Garmisch-Partenkirchen, Germany, September 2014, 1–7, 2014.
Wang, J. and Wolff, D.: Comparisons of reflectivities from the TRMM precipitation radar and ground-based radars, J. Atmos. Oceanic. Technol., 26, 857–875, https://doi.org/10.1175/2008JTECHA1175.1, 2009.
Wang, Z., Li, S., Dai, J., and Li, N.: Comparative case study on the observations between the space-borne radar and ground-based radar, Plateau Meteor, 34, 804–814, https://doi.org/10.7522/j.issn.1000-0534.2014.00031, 2015.
Warren, R., Protat, A., Siems, S., Ramsay, H., Louf, V., and Manton, M.: Calibrating Ground-Based Radars against TRMM and GPM, J. Atmos. Oceanic. Technol., 35, 323–346, https://doi.org/10.1175/JTECH-D-17-0128.1, 2018.
Wen, H., Zhang, L., Liang, H., and Zhang, Y.: Radial interference echo identification algorithm based on fuzzy logic for weather radar, Acta Meteorologica Sinica, 78, 116–127, https://doi.org/10.11676/qxxb2020.010, 2020.
Wu, C., Liu, L., and Zhang, Z.: Quantitative comparison algorithm between the S-band phased array radar and the CINRAD/SA and its preliminary application, Acta Meteor. Sin., 72, 390–401, https://doi.org/10.11676/qxxb2014.021, 2014.
Wu, Q.: Fengyun-3 (Batch 03) Meteorological Satellite Ground Application System Project G Satellite Precipitation Measurement Radar KuR Product User Manual, National Satellite Meteorological Center, 1–26, 2023.
Wu, Q., Yang, M., Chen, L., Yin, H., Shang, J., and Gu, S.: A frequency correction algorithm for spaceborne precipitation measurement radar and ground-based weather radar, Acta Meteorologica Sinica, 81, 353–360, https://doi.org/10.11676/qxxb2023.20220093, 2023.
Xiao, L., Hu, D., Chen, S., Zhang, H., Tian, C., and Zhang, A.: Study on attenuation correction algorithm of X-band dual polarization phased array radar, Meteor. Mon., 47, 703–716, https://doi.org/10.7519/j.issn.1000-0526.2021.06.006, 2021.
Xiao, Y. and Liu, L.: Study of methods for interpolating data from weather radar network to 3-D grid and mosaics, Acta Meteor. Sin., 64, 647–657, https://doi.org/10.3321/j.issn:0577-6619.2006.05.011, 2006.
Xiao, Y. and Liu, L.: Identification of Stratiform and Convective Cloud Using 3D Radar Reflectivity Data, Chinese Journal of Atmospheric Sciences, 31, 645–654, 2007.
Xiao, Y., Ma, Z., and Li, Z.: Improved algorithms for radar echo top height, vertically integrated liquid water content, and its density, Torrential Rain and Disasters, 28, 210–214, https://doi.org/10.3969/j.issn.1004-9045.2009.03.003, 2009.
Yang, H., Han, W., Wang, H., and Hu, H.: A Reference Positioning Methodology for Computing Geodetic Coordinates of Radar Echo, Meteorological Science and Technology, 51, 22–30, https://doi.org/10.19517/j.1671-6345.20220134, 2023.
Ye, F., Liang, H., Wen, H., Li, H., Zhang, L., and Guo, H.: Research on homogeneity evaluation system of neighboring weather radars based on single-station CAPPI grid data, Meteor. Mon., 46, 50–62, https://doi.org/10.7519/j.issn.1000-0526.2020.01.005, 2020.
Yu, X., Yao, X., Xiong, T., Zhou, X., Wu, H., Deng, B., and Song, Y.: Principles and Operational Applications of Doppler Weather Radar, Meteorological Press, Beijing, China, 48 pp., ISBN 978-7-5029-4111-6, 2007.
Zhang, G.: Weather Radar Polarimetry, CRC Press, Beijing, China, 304 pp., ISBN 978-1-4398-6958-1, 2018.
Zhang, L., Yang, H., Pei, C., and Gao, Y.: Analysis and application of the test method of reflectivity difference between adjacent radars, Meteor. Mon., 44, 268–276, https://doi.org/10.7519/j.issn.1000-0526.2018.02.006, 2018.
Zhang, Z. and Liu, L.: A simulation and analysis of the observation errors of cloud intensity and structure with the S-band phased array radar and the CINRAD/SA, Acta. Meteor. Sin., 69, 729–735, 2011.