the Creative Commons Attribution 4.0 License.
the Creative Commons Attribution 4.0 License.
 | 03 Nov 2025
Impact of water uptake on fluorescence of atmospheric aerosols: insights from Mie–Raman–fluorescence lidar measurements
Igor Veselovskii
Qiaoyun Hu
Philippe Goloub
Thierry Podvin
Gaël Dubois
Alexey Kolgotin
Mikhail Korenskii
This study investigates the impact of water uptake by particles during hygroscopic growth on aerosol fluorescence properties, using multiwavelength Mie–Raman–fluorescence lidar measurements conducted at the ATmospheric Observation at LiLLe (ATOLL) observatory (Laboratoire d'Optique Atmosphérique, University of Lille) between 2021 and 2024. During certain episodes, we observed a systematic height-dependent decrease in the fluorescence backscattering coefficient within the well-mixed planetary boundary layer. This phenomenon begins at relatively low relative humidity (RH ∼ 50 %) simultaneously with a decrease in the particle depolarization ratio. However, the rapid growth of the aerosol backscattering coefficient at high RH is not mirrored by the same rate of fluorescence reduction. This distinct behavior suggests a nonlinear relationship between water uptake and fluorescence suppression, likely indicating that water-induced quenching effects operate independently of bulk hygroscopic growth. Furthermore, we demonstrate the capability to retrieve particle volume and surface area density from single-wavelength extinction coefficients during strong hygroscopic growth episodes, validated against full 3β+2α lidar measurements. The values of the conversion factors for urban aerosol and smoke at 355 and 532 nm, together with associated uncertainties, are presented.
- Article
(2557 KB) - Full-text XML
- BibTeX
- EndNote


Atmospheric aerosols are the subject of intense study due to their role in the planet's radiation balance and their potential impact on the environment. To characterize the vertical distribution of aerosol loading, multiwavelength Mie–Raman and high-spectral-resolution lidars are widely used (e.g., Burton et al., 2012; Floutsi et al., 2023; Haarig et al., 2025, and references therein). Studies conducted over the past 2 decades have demonstrated significant progress in retrieving particle microphysical properties such as volume density, effective radius, and the complex refractive index (RI) from so-called 3β+2α observations, which include three aerosol backscattering, β, and two extinction, α, coefficients (Veselovskii et al., 2002; Kolgotin et al., 2018, 2023, 2025; Chang et al., 2022; Zhou et al., 2024).
The 3β+2α dataset is not always available. However, if the aerosol type is identified, the particle volume and surface area density can be estimated from the aerosol extinction coefficient at a single wavelength, λ, using corresponding extinction-to-volume and extinction-to-surface area conversion factors. This approach was proposed by Mamouri and Ansmann (2016, 2017) and further developed by Ansmann et al. (2021), where optical depths and column-integrated volumes provided by the network of sun photometers (AERONET) were used to determine conversion factors for pollution, smoke, and dust at various locations. Similarly, He et al. (2023) reported conversion factors for dust of different origins. However, the column-integrated values provided by AERONET do not account for the possible presence of different aerosol types at different altitudes. In contrast, multiwavelength lidar measurements allow for the retrieval of vertical profiles of particle volume and surface area density, enabling the calculation of conversion factors within specific height intervals that correspond to distinct aerosol types.
An important factor influencing the physical properties of aerosols is relative humidity (RH). Many aerosol types, such as sulfates, organic carbon, and sea salt, increase in size at high RH, accompanied by a simultaneous decrease in their complex refractive index. Lidars, with their capability to assess particle properties under ambient conditions at RH levels close to saturation, offer unique opportunities for studying the particle hygroscopic growth. Lidar measurements are typically used to determine the dependence of the aerosol backscattering coefficient on RH within well-mixed layers (Feingold and Morley, 2003; Fernández et al., 2015; Granados-Muñoz et al., 2015; Haarig et al., 2017; Navas-Guzmán et al., 2019; Chen et al., 2019; Pérez-Ramírez et al., 2021; Sicard et al., 2022; Miri et al., 2024). The use of aerosol extinction coefficients in hygroscopic growth studies is less common (Veselovskii et al., 2009; Dawson et al., 2020; Haarig et al., 2025) because β can be retrieved from lower altitudes and with greater accuracy compared to α. Multiwavelength lidar measurements further extend hygroscopic growth studies by enabling the analysis of particle volume, surface area, and the refractive index as a function of RH. This, in turn, allows for the evaluation of extinction-to-volume and extinction-to-surface area conversion factors in the presence of hygroscopic growth.
The addition of a fluorescence channel to Mie–Raman lidar (Veselovskii et al., 2020) opens new opportunities for particle characterization. If hygroscopic growth has no impact on aerosol fluorescence properties, fluorescence may serve as a proxy for evaluating the volume of dry aerosol. However, laboratory studies demonstrate that fluorescence can be suppressed (“quenched”) by interactions with other molecules through processes of collision and energy transfer (Lakowicz, 2006), leading to reduction in emission intensity. In particular, water molecules can efficiently quench fluorescence of organic fluorophores as reported by Dobretsov et al. (2014) and Maillard et al. (2021). Meanwhile, the extent to which such quenching occurs in atmospheric aerosols during hygroscopic growth remains an open question (Gast et al., 2025; Reichardt et al., 2025). Fluorescence quenching is expected to depend on aerosol composition, phase state, and the presence of organic coating, highlighting the need to analyze a diverse set of measurement episodes.
The Mie–Raman–fluorescence lidar has been operational at the ATmospheric Observation at LiLLe (ATOLL) instrumentation site at the Laboratoire d'Optique Atmosphérique, University of Lille, since 2020, accumulating a large volume of observations. In this paper, we focus on several episodes of hygroscopic growth within the planetary boundary layer (PBL), investigating potential evidence of fluorescence quenching by water uptake. Additionally, we analyze extinction-to-volume and extinction-to-surface area conversion factors in the presence of hygroscopic growth. We begin with a description of the lidar system and data analysis approach (Sect. 2). In Sect. 3, a numerical simulation is performed to investigate the behavior of particle volume and surface area density as a function of the particle extinction coefficient for different refractive indices and different particle size distribution parameters. In the first results section (Sect. 4), we present case studies demonstrating that, in certain episodes, water uptake leads to fluorescence quenching. In Sect. 5, we analyze the conversion factors in the presence of the particle hygroscopic growth. The paper concludes with a summary of our findings in the conclusion section.
The multiwavelength Mie–Raman–fluorescence lidar LIlle Lidar AtmosphereS (LILAS) operates using a tripled Nd:YAG laser with a 20 Hz repetition rate and a pulse energy of 90 mJ at 355 nm. Backscattered light is collected by a 400 mm aperture Newtonian telescope. Detailed information on the system parameters and data analysis methodology can be found in our previous publications (e.g. Veselovskii et al., 2020). Measurements were performed primarily in the vertical direction. In cases where measurements were taken at an angle, this information is provided in the figure captions. LILAS is designed to detect elastic and Raman backscattering, enabling the so-called data configuration. This includes three particle backscattering coefficients (β355, β532, β1064), two extinction coefficients (α355, α532), and three particle linear depolarization ratios (δ355, δ532, δ1064). Additionally, the water vapor mixing ratio (WVMR) is derived from the water vapor Raman measurements. The lidar also profiles the laser-induced fluorescence of aerosol particles within a spectral interval centered at 466 nm with 44 nm bandwidth. The fluorescence backscattering coefficient, βF, and the fluorescence capacity, , calculated from these measurements facilitate aerosol classification, as described in Veselovskii et al. (2024).
The inversion of the 3β+2α lidar dataset enables the estimation of particle volume, V; surface area, S; and the refractive index, RI. In our study, we used the inversion algorithm described by Veselovskii et al. (2002). The solution search was performed within the following parameter ranges:
-
a particle radius of 0.05 < r < 10 µm;
-
the real part of the refractive index, 1.33 < mR < 1.65;
-
the imaginary part of the refractive index, 0 < mI < 0.02.
The retrieval uncertainty for particle volume and surface density is estimated to be below 15 %, while it is ±0.05 for the real part of the refractive index. The uncertainty for the imaginary part is higher, reaching up to 50 %. Therefore, in the analysis of the presented measurements, only the real part of the refractive index is considered. Retrieved values of V and S along with the 3β+2α set enable the calculation of conversion factors for both aerosol extinction and backscattering coefficients, defined as , , , and . These factors allow for the estimation of V and S from a single extinction coefficient at wavelength λ, when the aerosol type is known.
To assess the effect of water uptake on fluorescence, we selected episodes where the PBL was well mixed, ensuring that aerosol composition and particle number density remained unchanged with height. A well-mixed layer was identified based on stable WVMR and potential temperature. The potential temperature was available from radiosonde measurements at the Herstmonceux (UK) and Beauvechain (Belgium) stations, located 160 and 80 km away from the observation site respectively. The relative humidity profiles were calculated using lidar-derived WVMR and temperature profiles from radiosonde data and from the Global Data Assimilation System (GDAS). Across all episodes analyzed in this work, the difference between RH profiles derived from radiosonde temperatures and temperatures from GDAS remained below 10 %.
Within the well-mixed PBL, relative humidity increases with height, leading to an increase in the aerosol extinction and backscattering coefficients. However, these coefficients respond differently to changes in RH. Water uptake reduces the particle refractive index, but the extinction coefficient is less sensitive to the refractive index changes than backscattering. As a result, during hygroscopic growth, α increases more rapidly with RH than β, causing the extinction-to-backscattering ratio (lidar ratio) to rise (Haarig et al., 2025).
Dependence of backscattering on RH can be either monotonic or deliquescent, when backscattering is unchanged up to a certain RH value, called the deliquescence point, where a phase transition occurs from solid to liquid (Carrico et al., 2003; Randriamiarisoa et al., 2006). For relative humidity exceeding the deliquescence value, the dependence of particle parameters, such as β, mR, and r, on RH can be modeled relative to their values at some reference height, zref. In particular, for the backscattering coefficient, the simplified Hänel parameterization is commonly used (Hänel, 1976; Sheridan et al., 2001; Sicard et al., 2022):
The subscript “ref” denotes the values of the parameters at the reference height zref; γβ is the backscattering hygroscopic growth coefficient. The reference height is usually chosen at altitudes with low RH, where particles can be considered quasi-dry. However, for deliquescent particles, as mentioned, RHref should exceed the corresponding deliquescence point.
The size distribution of atmospheric aerosols is commonly described using a superposition of lognormal distributions, typically corresponding to three distinct modes: nucleation, accumulation, and coarse. Each mode can be characterized by its modal radius, r0; standard deviation, σ; and number concentration, N. The increase in the modal radius with RH, assuming that σ is unchanged, can be parameterized as (Randriamiarisoa et al., 2006)
where ε is the size growth coefficient, which depends on the aerosol chemical composition. The volume of particles in the accumulation mode is predominant for urban aerosol and smoke, which are considered in this study. Thus, the volume of the particle relative to its value, Vref, at the reference height is
The particle volume, modeled with Eq. (3), is hereafter denoted as Vmod. Assuming that total volume, V, is the sum of the volume of the dry particle and water uptake, the real part of the refractive index can be parameterized as (Randriamiarisoa et al., 2006; Raut and Chazette, 2008)
where is the real part of the refractive index of water; the real part of the refractive index, modeled using Eq. (4), is hereafter denoted as . When the vertical profile of particle volume density retrieved from 3β+2α observations, V3+2, is available, the ratio in Eq. (3) can be replaced by , allowing us to calculate the mR without the knowledge of the RH profile:
The real part of the refractive index, calculated using Eq. (5), is denoted as . The volume V3+2 can only be retrieved for altitudes above the complete geometrical overlap height. Therefore, zref must be selected at or above this height. Recall also that Eqs. (3)–(5) are applicable only within a well-mixed layer. The real part of the RI at reference height, in Eqs. (4) and (5), can be selected from the values retrieved from 3β+2α observations, which is denoted as . Further in the text, when calculating Vmod with Eq. (3), we use volume at the reference height as Vref.
If water uptake does not alter the chemical composition and does not cause fluorescence quenching, the fluorescence signal should be proportional to the volume of dry particles. Thus, the variation in the fluorescence backscattering coefficient, βF, relative to its value at the reference height, βF,ref, allows for modeling mR within the layers, where particle number density varies with height, assuming the particle type remains unchanged. If the number density of particles at heights z and zref is N and Nref respectively, their ratio is . The real part of the RI calculated for a single particle is
The real part of the RI, modeled with Eq. (6), is denoted as .
Our approach to assessing the potential effect of water uptake on fluorescence involves analyzing episodes of strong hygroscopic growth within the well-mixed PBL. A decrease in fluorescence backscattering with height may indicate fluorescence quenching. Additionally, we compare the profiles of the real part of the refractive index, retrieved from 3β+2α observations, , with the values , , and obtained from Eqs. (4), (5), and (6) respectively. Agreement between and would support the applicability of the assumption that the total particle volume results from the additive contributions of dry aerosol and water uptake. Consistency between and would further validate the RH profile used in the calculations. And, finally, a significant deviation of from at high RH could suggest the presence of fluorescence quenching.
We begin with a numerical simulation to explore the relationship between particle volume and surface area density, on one hand, and the extinction coefficient, on the other, for different particle sizes and refractive indices. In this simulation, we consider a set of lognormal particle size distributions (PSDs) for the number density n(r):
where N is the total particle number (N=1 in all computations) and σ is the standard deviation. The modal radius, r0, and ln σ varied within the [0.015–6.3] µm and the [0.43–0.936] intervals respectively. The particle extinction coefficient at 532 nm, α532, was computed for spheres with the real and the imaginary parts of the refractive index within the ranges [1.3–1.7] and [0.00–0.03] respectively. In total, more than 105 extinction coefficients were calculated using look-up tables (Kolgotin et al., 2023).
The results of the computations are summarized in Fig. 1, which shows particle volume and surface area density as a function of the extinction coefficient at 532 nm. To provide insight into the particle sizes corresponding to different α532, the upper axis presents approximate values of the effective radius, reff. Among the numerous data points shown in Fig. 1, some of them represent the hygroscopic growth of specific aerosol types. To emphasize these points, we overlay lines depicting the hygroscopic growth of sulfate (SU) and organic carbon (OC) particles from the MERRA-2 model (Chin et al., 2002; Colarco et al., 2010). The particle parameters used in the computations, such as modal radius and the RI, are summarized in Table A1 for different relative humidities. The ln σ in Eq. (7) was set to 0.79 for OC and 0.71 for SU independent of RH.
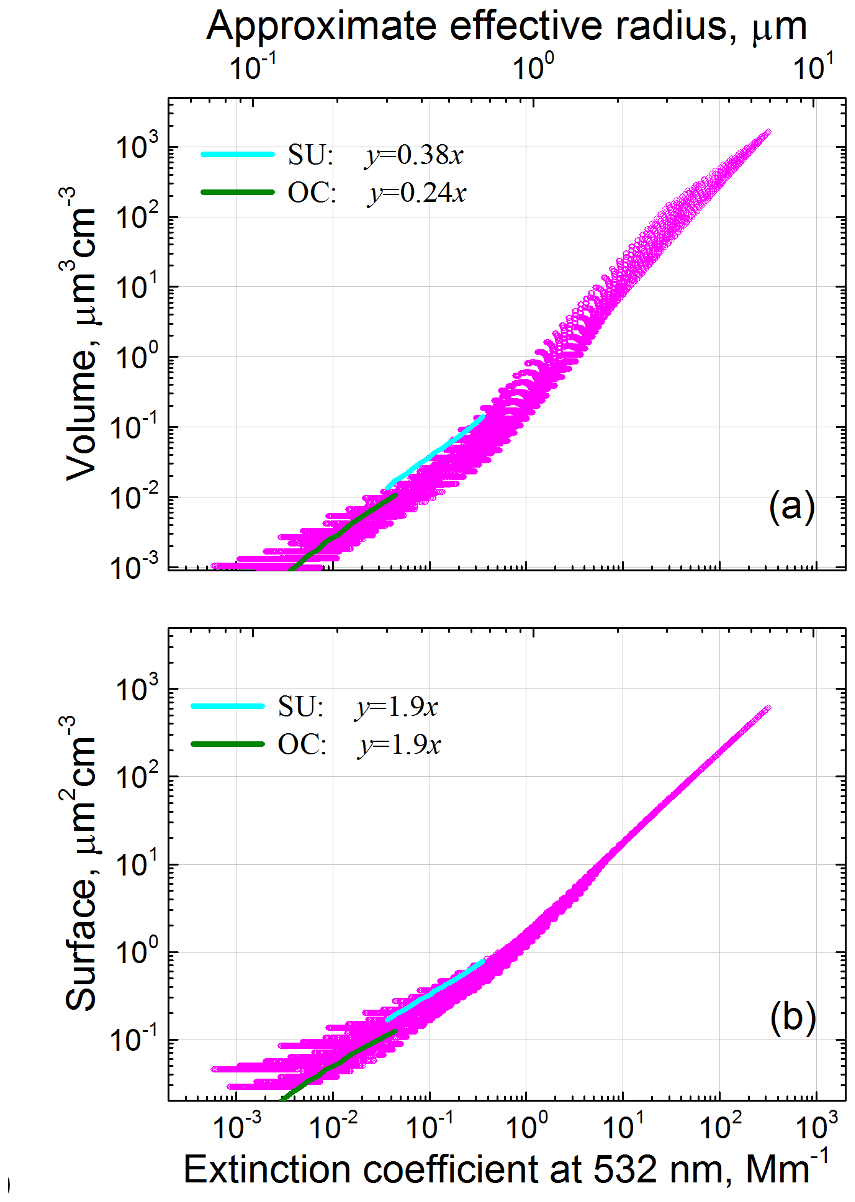
Figure 1Modeled particle (a) volume and (b) surface area density as functions of the extinction coefficient at 532 nm. Cyan and green lines correspond to hygroscopic growth of sulfates (SU) and organic carbon (OC) particles from the MERRA-2 model. The particle parameters used in the computations are described in the text.
The ratio in Fig. 1a exhibits a tendency to increase with particle size, and for a given value of α532 this ratio varies significantly, spanning up to an order of magnitude. However, for specific aerosol types, such as SU and OC, the dependence V(α532), which characterizes particle hygroscopic growth, can be reasonably approximated by a linear fit: V=0.38α532 and V=0.24α532 respectively, where volume is expressed in µm3 cm−3 and the extinction coefficient in Mm−1. These modeling results suggest that, even in the presence of hygroscopic growth, aerosol-type-specific conversion factors can still enable estimation of particle volume from the extinction coefficient. The variation in in Fig. 1b is significantly smaller compared to in Fig. 1a, and it decreases with particle size, allowing for a more accurate estimation of surface area density.
4.1 25 March 2022 – hygroscopic growth within the well-mixed PBL
We begin with the episode on 25 March 2022, when the fluorescence backscattering remained relatively stable within the PBL. For this episode, measurements were performed at a 48° angle to horizon, and the height of complete geometrical overlap of the laser beam and the telescope's field of view is 700 m. As shown in Fig. 2, variations in WVMR within the 650–1750 m height range remain below 0.3 g kg−1, while potential temperature deviations are within 1.5 K. These conditions indicate that the PBL is well mixed. The relative humidity increases with height from 35 % to 75 %, resulting in a 1.5-fold increase in β532. Using parameterization (1), the backscattering growth coefficient, γβ, is estimated to be 0.45 ± 0.1. This result is consistent with observed γβ values for different aerosol types, as reported by Sicard et al. (2022). Specifically, for urban aerosols at 532 nm wavelength, γβ ranges between 0.38 and 0.65, which aligns well with our findings. During hygroscopic growth, the particle depolarization ratio, δ532, decreases with height from 10 % to 5 %, while the extinction Ångström exponent (EAE), calculated from α355 to α532, decreases from 1.4 to 0.9. The lidar ratios at 355 and 532 nm, S355 and S532, during hygroscopic growth increase from 44 ± 7 to 53 ± 8 sr and from 52 ± 8 to 69 ± 10 sr respectively. The fluorescence capacity at 700 m is GF = 0.65 × 10⁻⁴, and according to the classification scheme in Veselovskii et al. (2024), this corresponds to urban aerosol. This classification is further supported by HYSPLIT backward-trajectory analysis, which indicates that the air masses at this altitude originated from Germany.
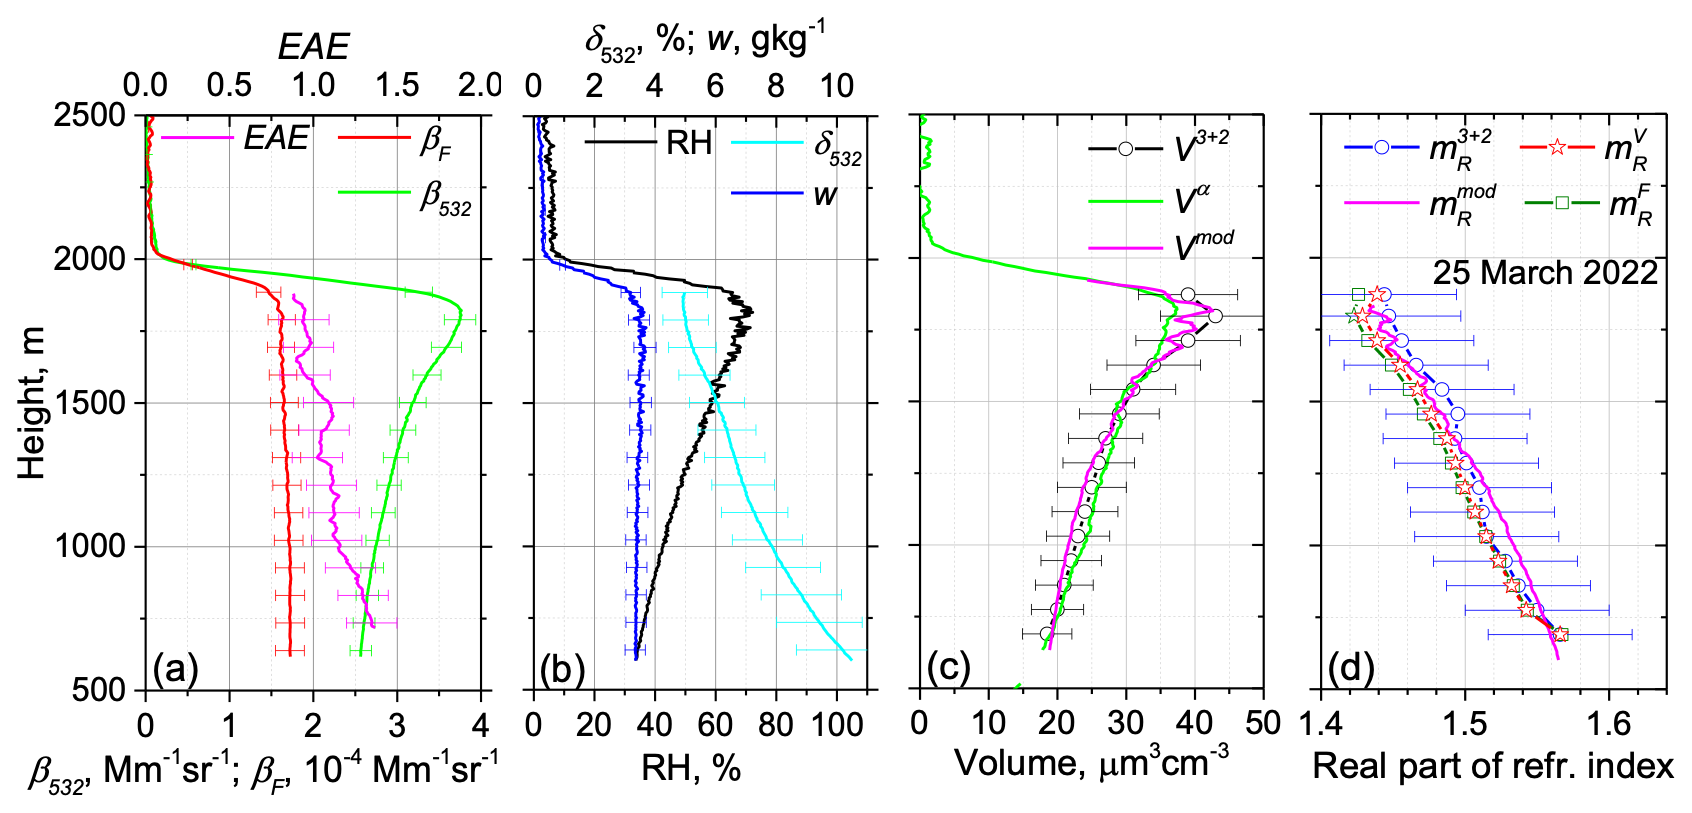
Figure 2Vertical profiles of the particle parameters on 25 March 2022 for the 19:10–21:30 UTC period. (a) The backscattering coefficient, β532; the fluorescence backscattering coefficient, βF; and the Ångström exponent, EAE. (b) The particle depolarization ratio, δ532; the water vapor mixing ratio, w; and the relative humidity, RH. (c) The particle volume, V3+2, retrieved from 3β+2α observations; the volume Vα, calculated from the extinction coefficient α532; and the volume Vmod, modeled with Eq. (3) using ε = 0.33. (d) The real part of the refractive index, , retrieved from 3β+2α observations, along with the values , modeled with Eq. (4), and the values of and calculated from Eqs. (5) and (6) respectively. Measurements were performed at 48° to horizon.
The profile of particle volume, retrieved from 3β+2α observations, V3+2, is presented in Fig. 2c, along with the corresponding conversion factors and , shown in Fig. 3a. The conversion factor remains relatively stable during hygroscopic growth, with a deviation from the mean value of about 10 %. As shown in Fig. 2c, the volume, Vα, calculated from α532 as , aligns well with V3+2, when using a mean conversion factor = 0.15 µm3 cm−3 Mm. On the other hand, the conversion factor exhibits higher variability (up to 20 %), as it is sensitive to changes in the refractive index. Figure 2c also displays the profile of Vmod, modeled using Eq. (3). The value is taken from inversion of 3β+2α measurements at reference height zref = 700 m. The size growth coefficient, ε, reported by Randriamiarisoa et al. (2006) for urban aerosol in Paris, was 0.26. However, for our observations a better fit with V3+2 was achieved when using ε = 0.33.
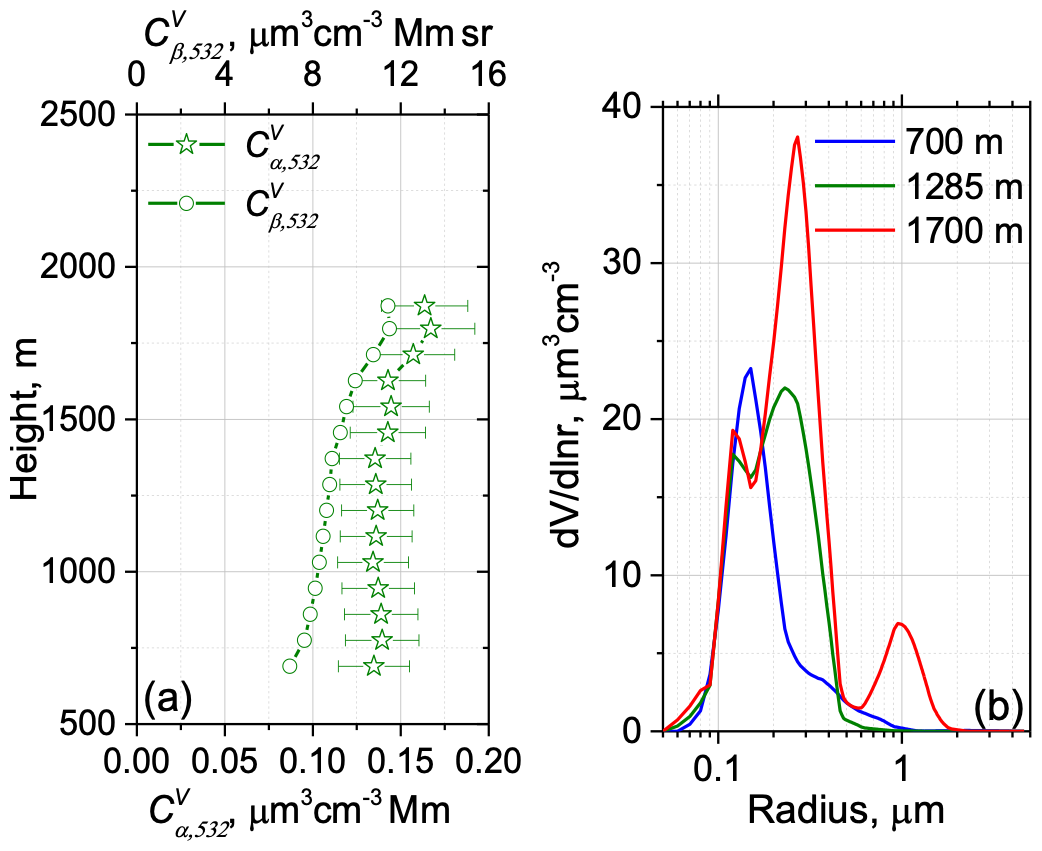
Figure 3(a) Vertical profiles of extinction-to-volume, , and backscattering-to-volume, , conversion factors on 25 March 2022. (b) The particle size distribution at heights 700, 1285, and 1700 m.
The real part of the refractive index, , retrieved from 3β+2α observations, in Fig. 2d decreases with height from 1.57 to 1.44, and it agrees with the Hänel parameterization, , calculated with Eq. (4). The profiles of and , calculated with Eqs. (5) and (6) respectively, align with within the uncertainty of retrieval. Thus, for this specific case, we see no evidence of fluorescence quenching by the water uptake.
The 3β+2α observations enable the estimation of key characteristics of the particle size distribution, at least for fine-mode particles. As the maximum available laser wavelength is 1064 nm, the retrievals exhibit decreasing sensitivity to particles with radii larger than approximately 2 µm (Veselovskii et al., 2009). The evolution of with height is shown in Fig. 3b. At 700 m, the fine mode, with a maximum at r = 0.15 µm, is dominant. By 1700 m the maximum of the PSD shifts to approximately r = 0.25 µm due to hygroscopic growth. A small secondary maximum at r = 1.0 µm also appears; however we cannot conclusively determine whether it is a real feature or merely an artifact of the retrieval process. From this figure, we can conclude that, for the episode considered, the hygroscopic growth primarily affects fine-mode particles.
4.2 30–31 August 2022 – hygroscopic growth within a layer that is not well mixed
On 30–31 August 2022, an episode of pronounced hygroscopic growth was observed. The vertical profiles of the particle parameters, similar to those shown in Fig. 2, are presented in Fig. 4 for 30 August 2022. Complete geometrical overlap occurred at 1250 m; therefore, the extinction profiles and inversion results are available only above this height. The lidar ratios at 1250 m are S355 = 57 ± 8 sr and S532 = 51 ± 8 sr. The WVMR shows significant height variations within the 1250–2500 m range, indicating that this layer is not well mixed. The HYSPLIT backward-trajectory analysis indicates that the air masses below the 1000 m height originated from the north of Germany, while at higher altitudes they arrived from the Atlantic region and may have transported maritime particles. The relative humidity increases steadily with height and peaks at approximately 85 % near 1750 m. Above this level, RH gradually decreases. Within the 1000–2500 m range, aerosol particles undergo hygroscopic growth, and the peak in the backscattering coefficient, β532, is consistent with the RH maximum at 1750 m. In contrast, both the Ångström exponent and the linear depolarization ratio exhibit distinct minima at this height. As previously noted, the aerosol layer is not well mixed, and the backscattering growth coefficient, γβ, can only be derived within specific altitude ranges. For the lower range of 750–1000 m (45 % < RH < 55 %), γβ is estimated as 0.6 ± 0.2. However, at higher altitudes, γβ exhibits an increase. Specifically, within the 1300–1750 m range (65 % < RH < 85 %), the coefficient rises to 1.2 ± 0.3. This increase may be attributed to the presence of maritime aerosol. Additionally, the fluorescence capacity is low (GF = 0.36 ± 0.05 at 750 m), suggesting a low content of organic particles.
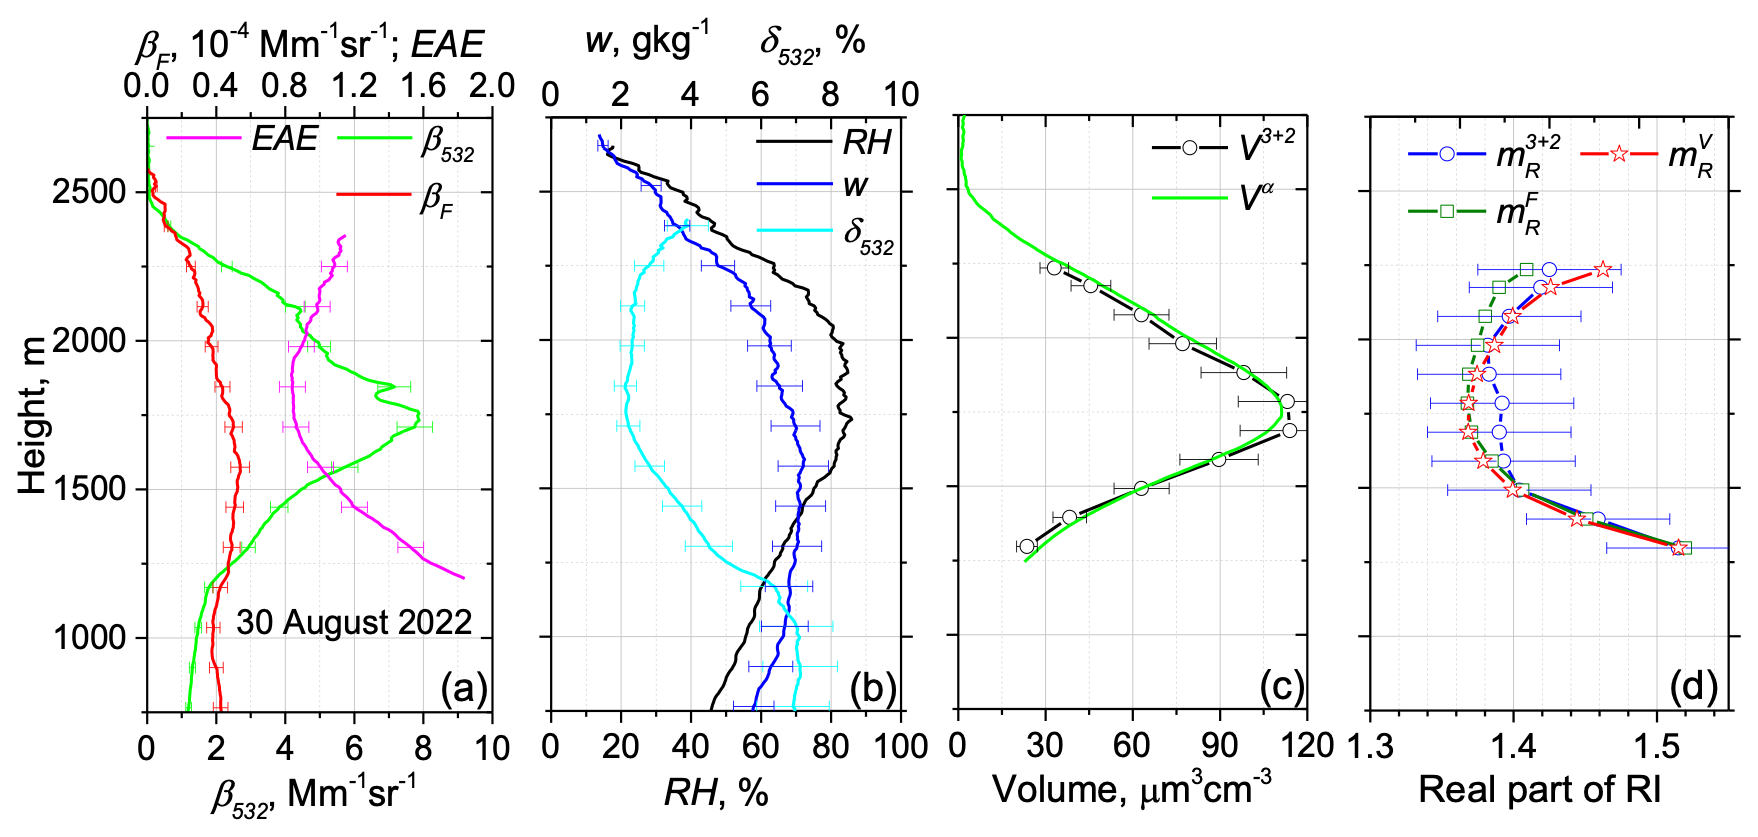
Figure 4Similar to Fig. 2 but for the measurements on 30 August 2022 during the 19:30–20:30 UTC period.
The particle volume was retrieved from 3β+2α observations, allowing calculation of the conversion factors and , as shown in Fig. 5a. The deviation of from its mean value is less than 15 %, while for the deviation is larger, about 30 %. The profile of the particle volume Vα calculated using the mean conversion factor = 0.23 µm3 cm−3 Mm aligns well with V3+2 in Fig. 4c.
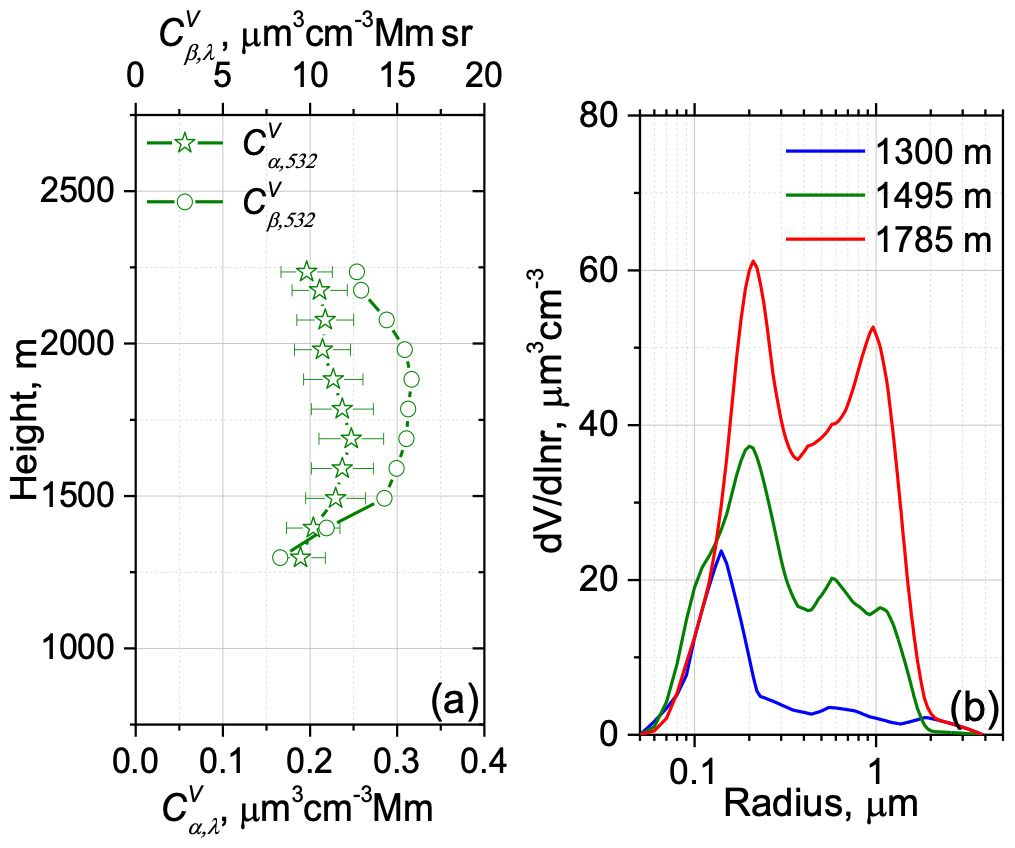
Figure 5Similar to Fig. 3 but for the measurements on 30 August 2022 during the 19:30–20:30 UTC period.
The retrieved decreases with height from 1.52 to 1.39 within the 1250–1750 m range and then begins to increase above this level. The values of and calculated via Eqs. (5) and (6), as shown in Fig. 4d, agree with within the uncertainty of retrieval. Thus, in this episode, once again, water uptake does not exhibit a significant effect on the fluorescence signal.
The modification of the PSD during hygroscopic growth is shown in Fig. 5b. The maximum of the fine mode, within the 1300–1800 m range, shifts with height from r = 0.14 µm to r = 0.2 µm. Simultaneously, the second mode, centered near 1.0 µm, increases with height. This suggests that the aerosol mixture likely contains coarse hygroscopic particles, which could have a maritime origin.
4.3 Possibility of fluorescence quenching by the water uptake
The assumption that fluorescence backscattering is independent of water uptake is crucial when using the fluorescence technique to study aerosol hygroscopic growth (Miri et al., 2024). However, in some episodes we observed a decrease in βF with height within the well-mixed PBL, which may indicate possible fluorescence quenching. Two such episodes, on 11 May and 25 June 2024, are shown in Fig. 6. The complete geometrical overlap was achieved at 1030 and 1300 m respectively, with lidar ratios at these heights measured as follows: S355 = 50 ± 7 sr and S532 = 42 ± 6 sr on 11 May and S355 = 46 ± 7 sr and S532 = 49 ± 7 sr on 25 June 2024. In both cases, the PBL is well mixed, with variations in WVMR remaining below 0.2 g kg−1. The air masses within the 500–2500 m range for both episodes originated from Germany. The fluorescence capacities at 750 m for these cases are 0.86 × 10⁻⁴ and 0.75 × 10⁻⁴ respectively, which are higher than for previous episodes. The backscattering growth coefficients, γβ, on 11 May and 25 June 2024 are estimated as 0.4 ± 0.1 and 0.9 ± 0.2. In contrast to results in Fig. 2a, the fluorescence backscattering, βF, decreases with height along with δ532. This decrease begins at relatively low RH, and the rapid increase in β532 at high RH is not accompanied by a similarly fast decrease in βF.
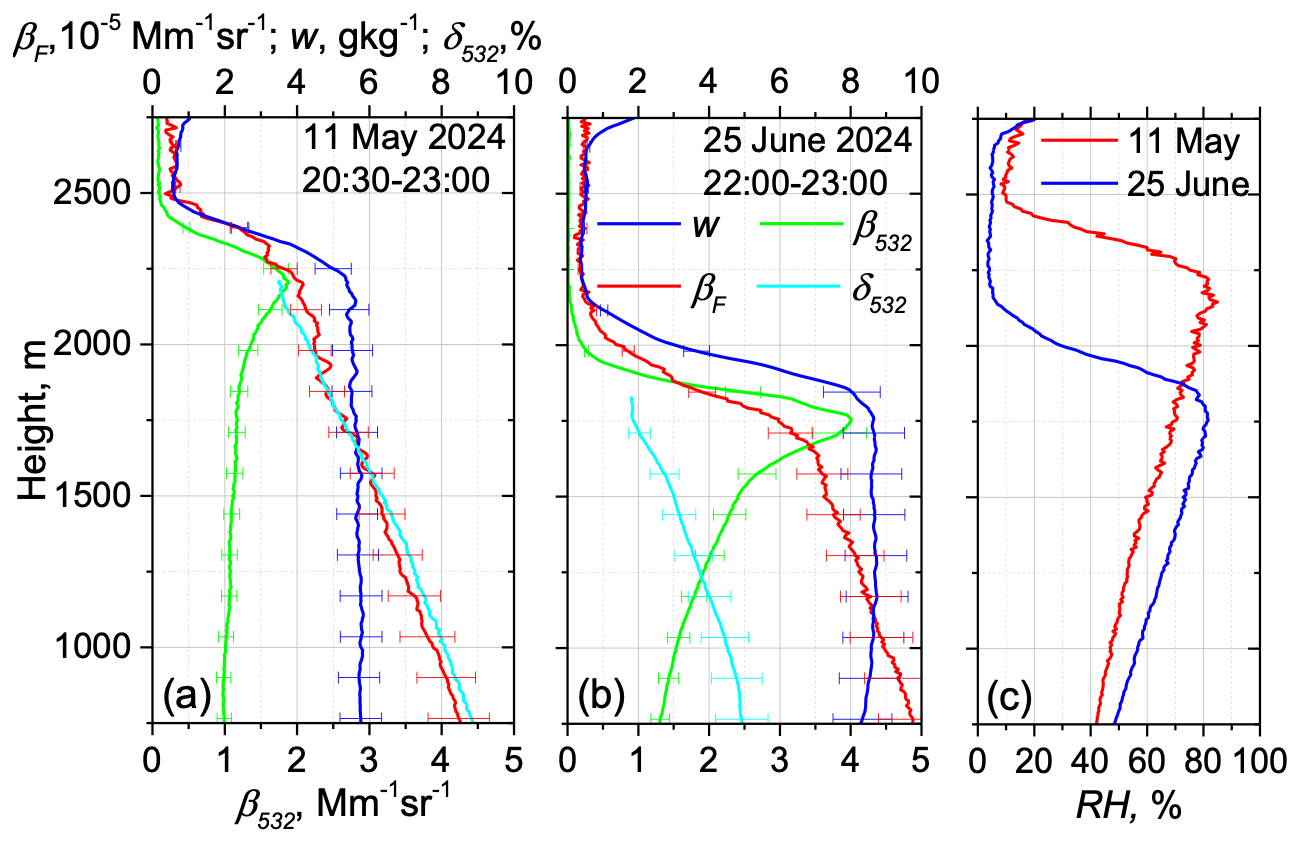
Figure 6Vertical profiles of aerosol and fluorescence backscattering coefficients, β532 and βF, along with the water vapor mixing ratio, w, and the particle depolarization ratio, δ532, measured on (a) 11 May 2024 and (b) 25 June 2024. (c) The relative humidity for the episodes considered.
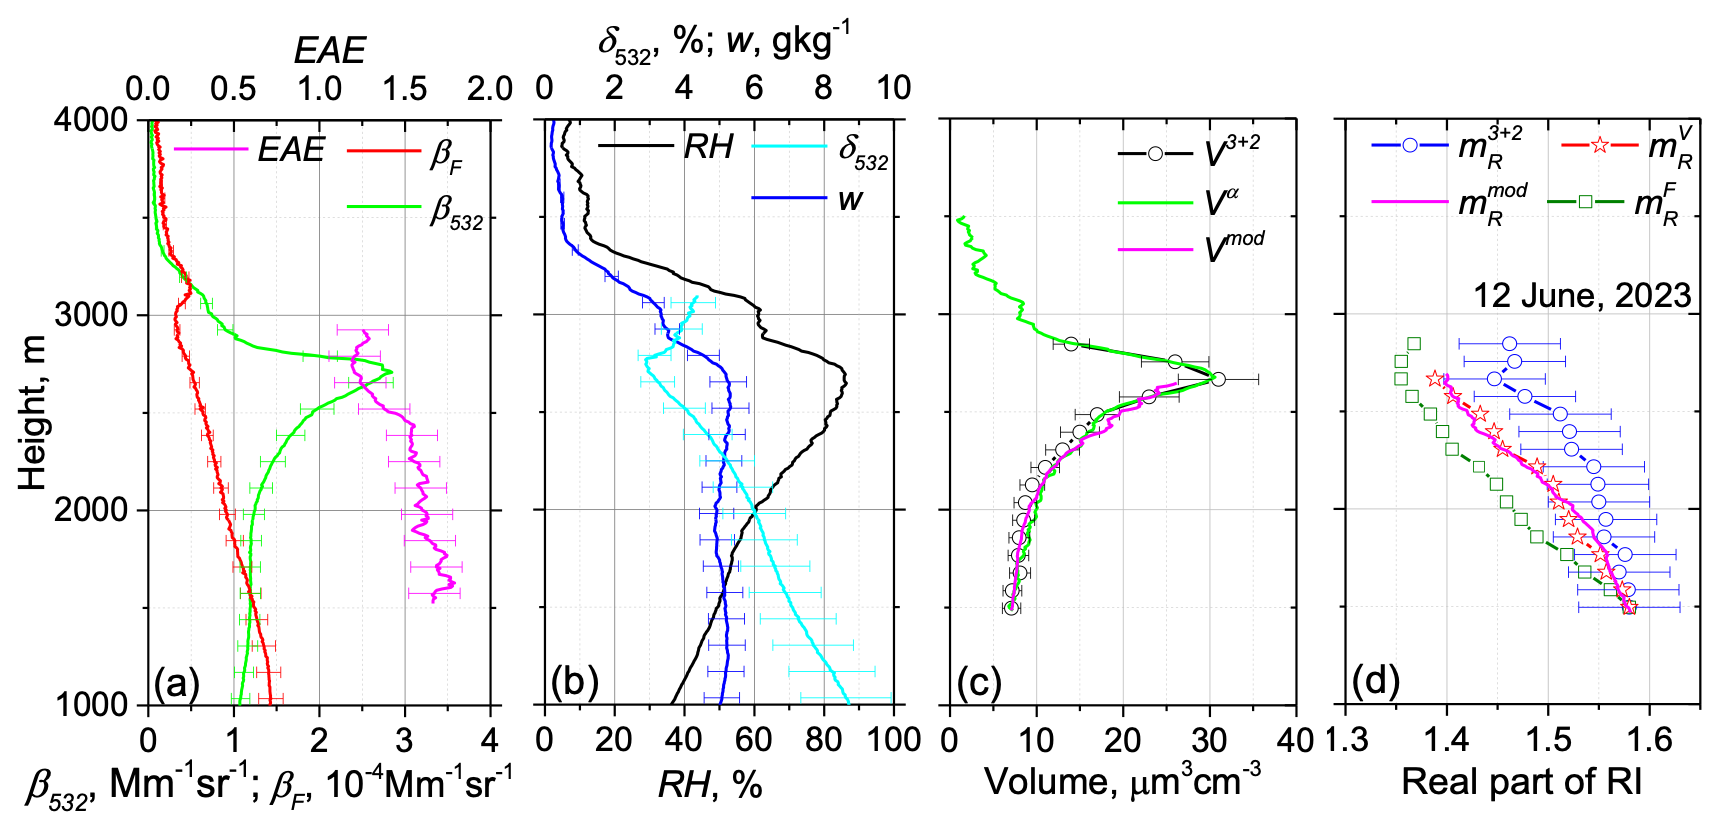
Figure 7Similar to Fig. 2 but for the measurements on 12 June 2023 for the 21:00–22:20 UTC period.
All episodes demonstrating the fluorescence quenching happened when urban aerosols presented within the PBL. Among these episodes, one of the most representative occurred on 12 June 2023. Corresponding profiles of particle parameters are shown in Fig. 7. Variations in WVMR and potential temperature within the 1000–2750 m range are small (below ±0.2 g kg−1 and ±2 K respectively), indicating that the PBL is well mixed. The HYSPLIT backward-trajectory analysis indicates that the air masses within the 1000–3000 m height range originated from eastern Europe. The fluorescence capacity at 750 m is quite high (1.4 × 10⁻⁴), suggesting the presence of organic particles. The height of complete geometrical overlap is 1500 m, and the lidar ratios at this height are S355 = 37 ± 6 sr and S532 = 38 ± 6 sr.
Within the 1000–2700 m altitude range, the backscattering coefficient, β532, shows a consistent positive response to RH, reaching its maximum value at 2700 m where RH peaks. The backscattering growth coefficient, γβ, is determined to be 0.55 ± 0.1. Simultaneously, the observed increase in RH correlates with reduced fluorescence backscattering, suggesting potential fluorescence-quenching effects. The aerosol volume, Vα, derived from α532 measurements shows good agreement with V3+2, when applying a mean conversion factor = 0.15 µm3 cm−3 Mm. The modeled volume profile, Vmod, calculated using Eq. (3) and ε = 0.33, similarly matches V3+2 within the layer, where aerosols are presumed to be well mixed.
The real part of the refractive index, , retrieved from 3β+2α observations, decreases from 1.58 to 1.45, within the 1500–2700 m altitude range. However, this observed decrease occurs at a lower rate compared to both and values, suggesting that the simplified model, which assumes additivity of dry aerosol and water uptake, may not be applicable to this episode. Furthermore, the values , derived using the fluorescence signal in Eq. (6), are systematically lower than both and , providing additional evidence for potential fluorescence-quenching effects. A similar behavior of , , and was observed for the episodes shown in Fig. 6, with corresponding results presented in the Appendix (Figs. A1 and A2).
Figure 8 shows the PSDs for three episodes, discussed in this section. As the particles undergo hygroscopic growth, the fine mode shifts toward larger radii; however, the second mode at r = 1 µm, observed in Fig. 5b, is absent. This suggests that only fine particles undergo hygroscopic growth.
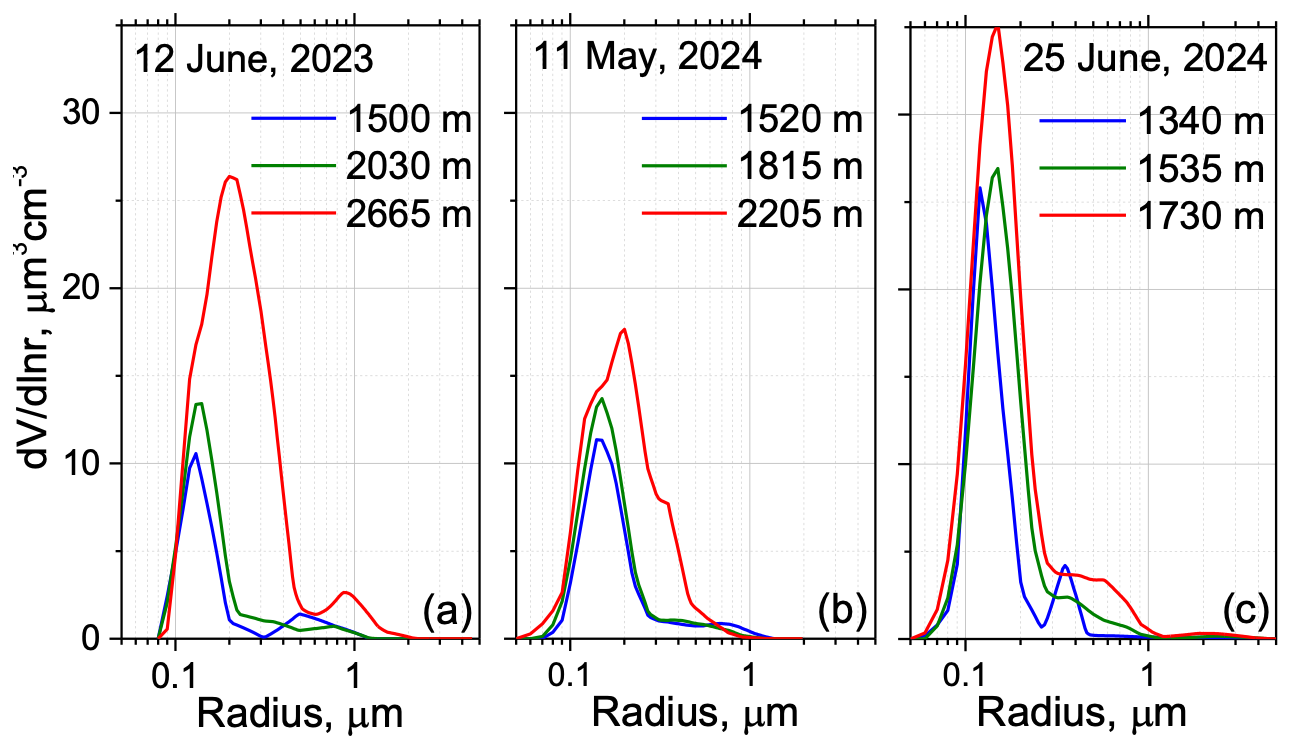
Figure 8The particle size distribution, , at different heights for three case studies showing evidence of fluorescence quenching during hygroscopic growth: (a) 12 June 2023, (b) 11 May 2024, and (c) 25 June 2024.
To quantify fluorescence-quenching effects, we computed the relative reduction in fluorescence backscattering using
Figure 9a displays the normalized β532 and fluorescence reduction ΔβF as a function of RH for three observational periods: 25 March 2022, 12 June 2023, and 11 May 2024. For consistent comparison, β532 values were normalized to the backscattering coefficient at RHref = 50 %, and ΔβF values were calculated for the same RHref. These cases were selected based on two criteria: consistent β532(RH) growth patterns across all events and distinctive variations in ΔβF behavior between cases. As previously noted, the 25 March 2022 case showed no significant RH-dependent increase in ΔβF. In contrast, during the other two episodes (12 June 2023 and 11 May 2024), ΔβF exhibited a steady increase from baseline conditions, reaching a maximum reduction of ∼ 50 % at RH = 85 %. However, the rapid growth of β532 at high RH is not mirrored by the same rate of increase in ΔβF. This decoupling between hygroscopic backscattering growth and fluorescence suppression suggests that water uptake affects aerosol fluorescence through mechanisms beyond simple dilution effects.
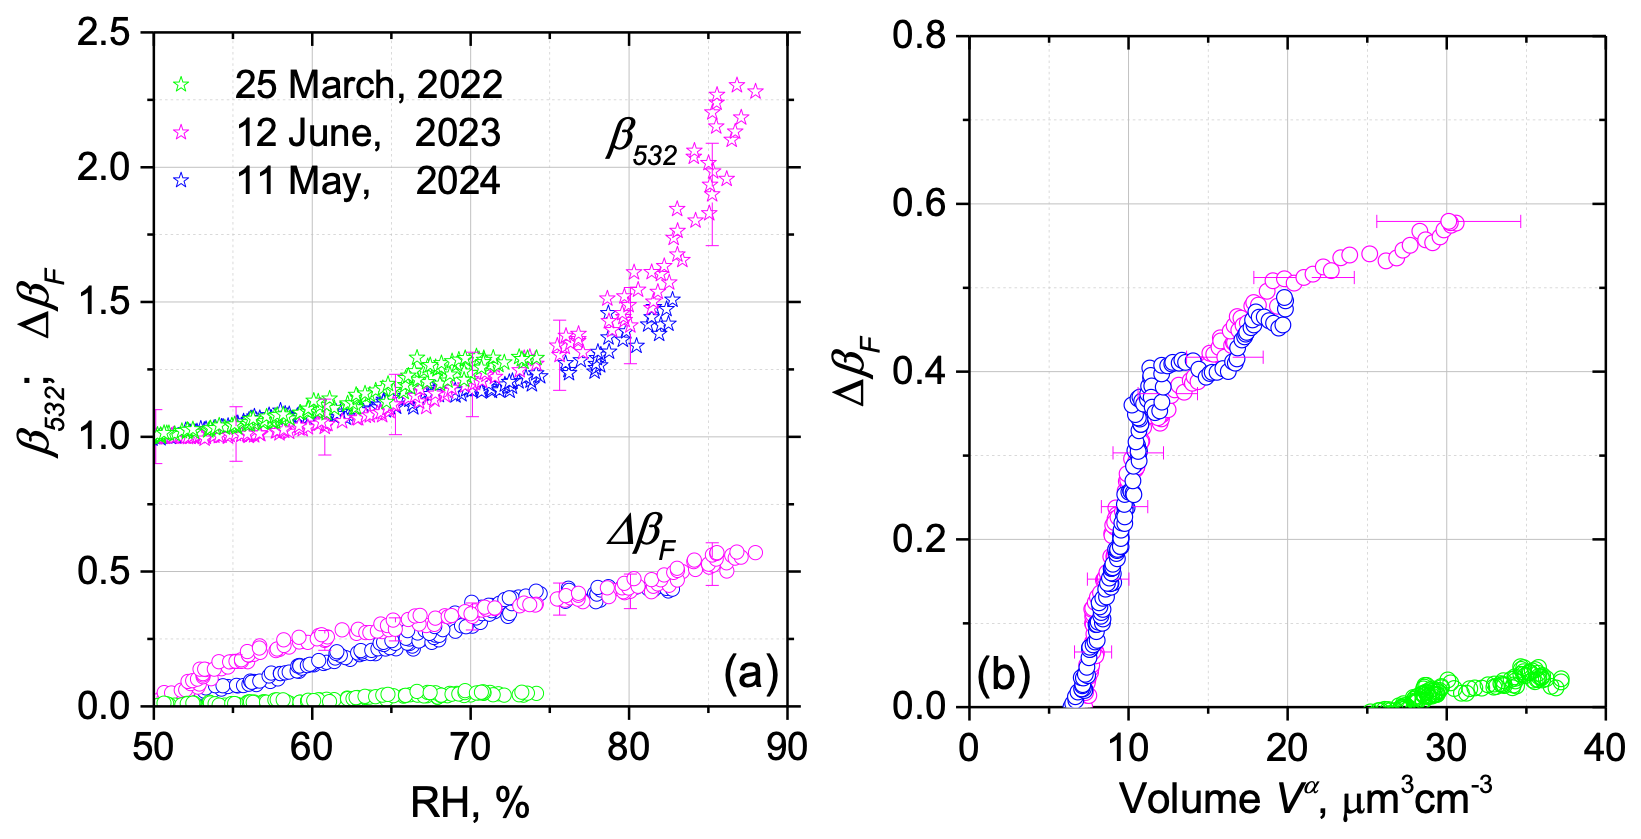
Figure 9(a) The RH dependence of the normalized backscattering coefficient, β532 (stars), and fluorescence reduction, ΔβF (circles), for three case studies: 25 March 2022, 12 June 2023, and 11 May 2024. All values are normalized relative to RH = 50 % baseline conditions. (b) The relationship between fluorescence reduction ΔβF and particle volume Vα, calculated from α532, for the same three episodes.
To further investigate water uptake effects on fluorescence, Fig. 9b presents the relationship between fluorescence reduction ΔβF and particle volume Vα, calculated from α532, for the same three case studies as in Fig. 9a. On 12 June 2023 and 11 May 2024, ΔβF demonstrates a sharp increase within the ∼ 5–12 µm3 cm−3 volume range and a subsequent plateau at higher volumes. These observations reveal two key findings: quenching starts at relatively low RH (before maximum hygroscopic growth), and the ΔβF–volume relationship is nonlinear, disproving simple proportional dependence on water uptake. While aerosol-type dependence is evident, the specific particle composition driving this quenching behavior cannot yet be definitively identified from these measurements.
As demonstrated in the previous section, the volume density of urban aerosol, even in the presence of hygroscopic growth, can be estimated using a single extinction or backscattering coefficient and corresponding conversion factors. However, urban aerosol includes a variety of particle types (e.g. sulfates, soot), causing these conversion factors to vary across episodes. To quantify this variability and assess the resulting uncertainty in V and S calculations, we analyzed multiple episodes of urban aerosol within the PBL exhibiting hygroscopic growth. For each episode, conversion factors at 355 and 532 nm were derived from 3β+2α observations.
In addition to urban aerosols, we also examined smoke episodes. For smoke, hygroscopic growth events were rare, and our focus shifted to the vertical dependence of conversion factors in the lower and middle troposphere. Figure 10 presents the vertical profiles of the conversion factors, and , for 10 urban aerosol episodes involving hygroscopic growth, along with 6 smoke episodes observed between 2020 and 2024.
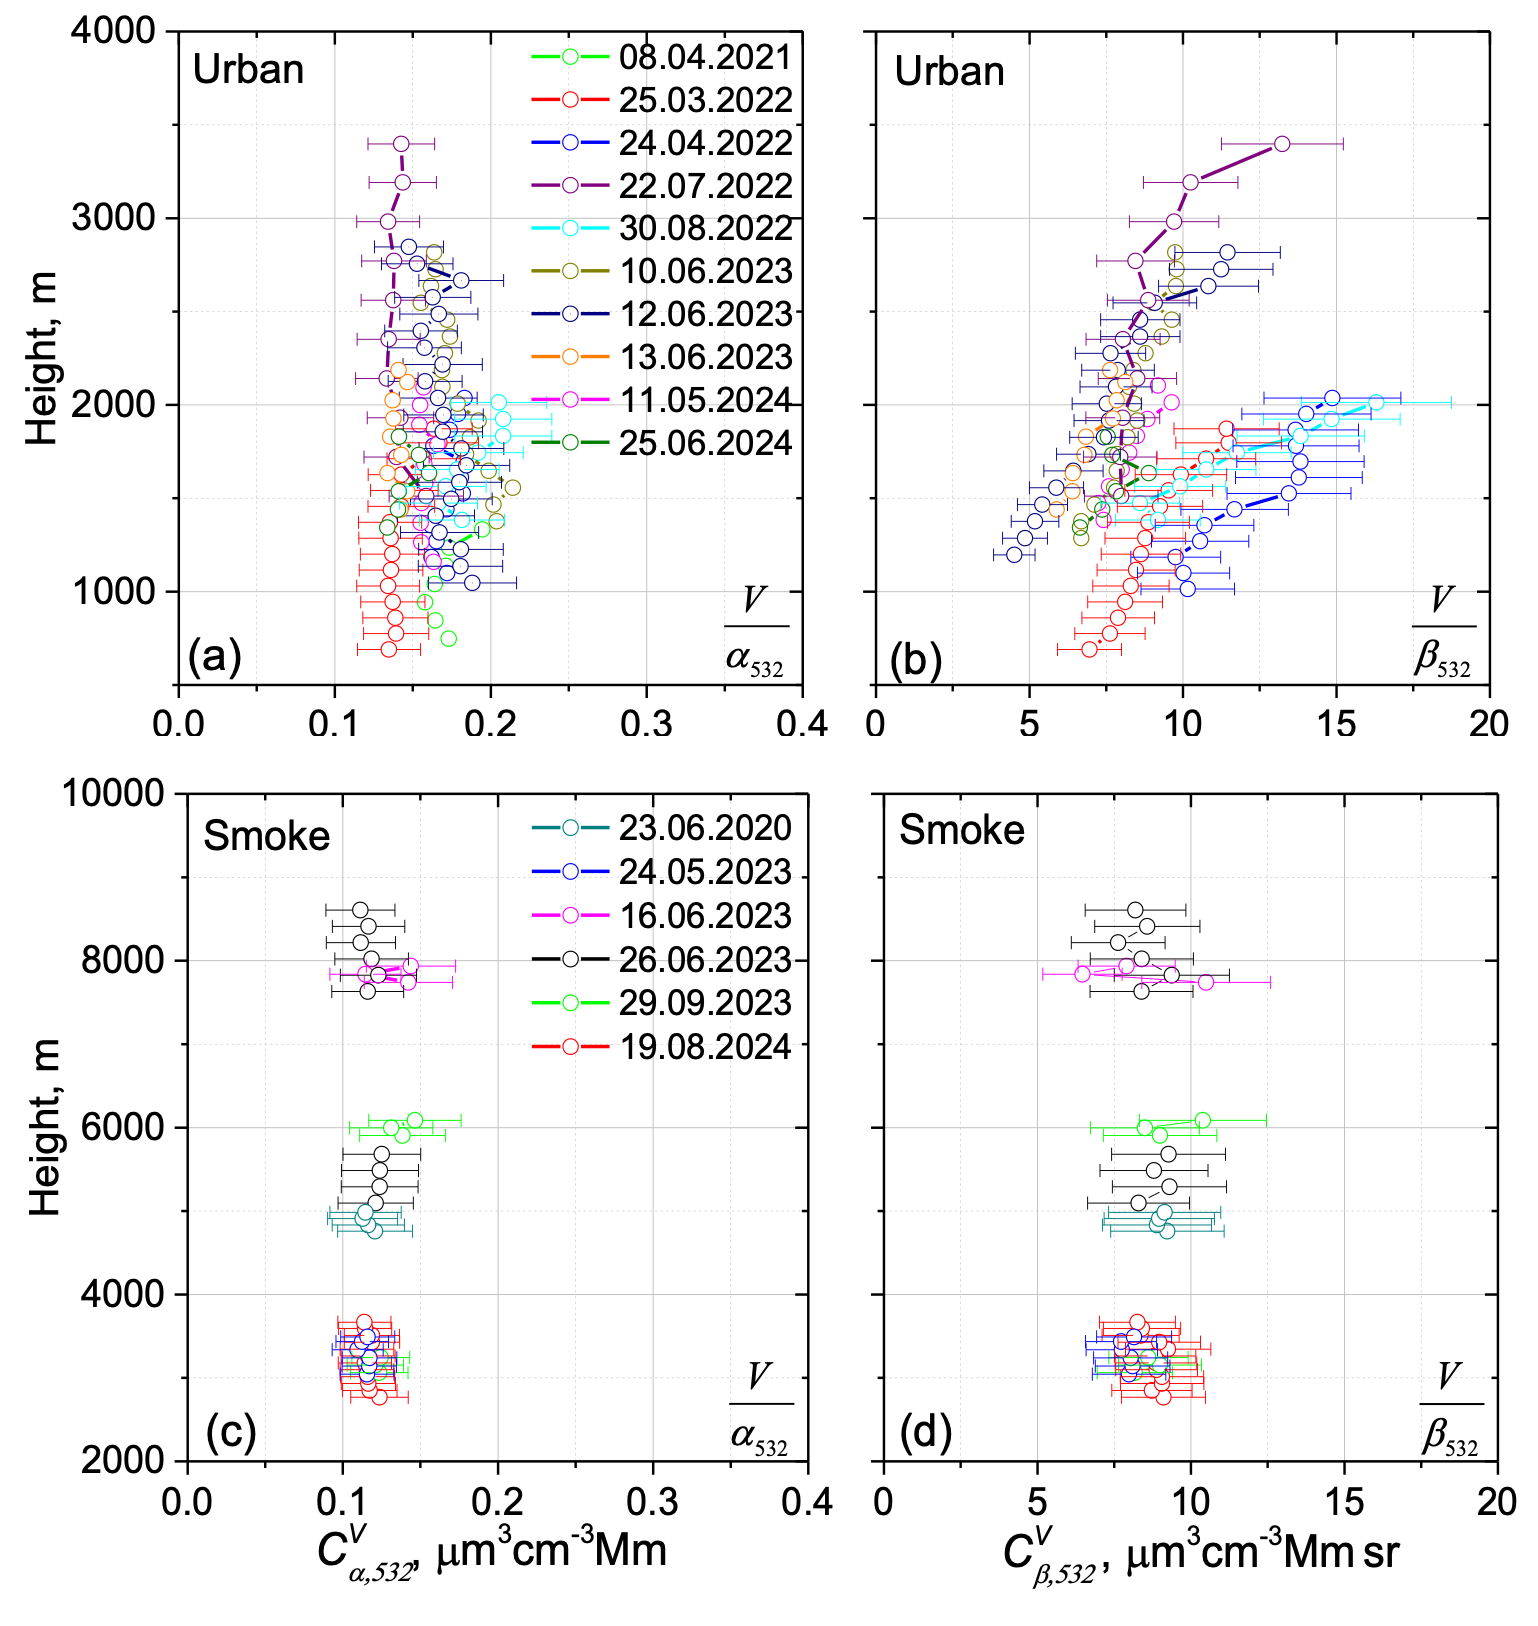
Figure 10Height profiles of the extinction-to-volume, , and backscattering-to-volume, , conversion factors in several measurement sessions for (a, b) urban aerosol and (c, d) smoke.
Table 1Conversion factors for calculation of the volume and surface area of smoke and urban particles from the extinction and backscattering coefficients at 355 and 532 nm wavelengths.
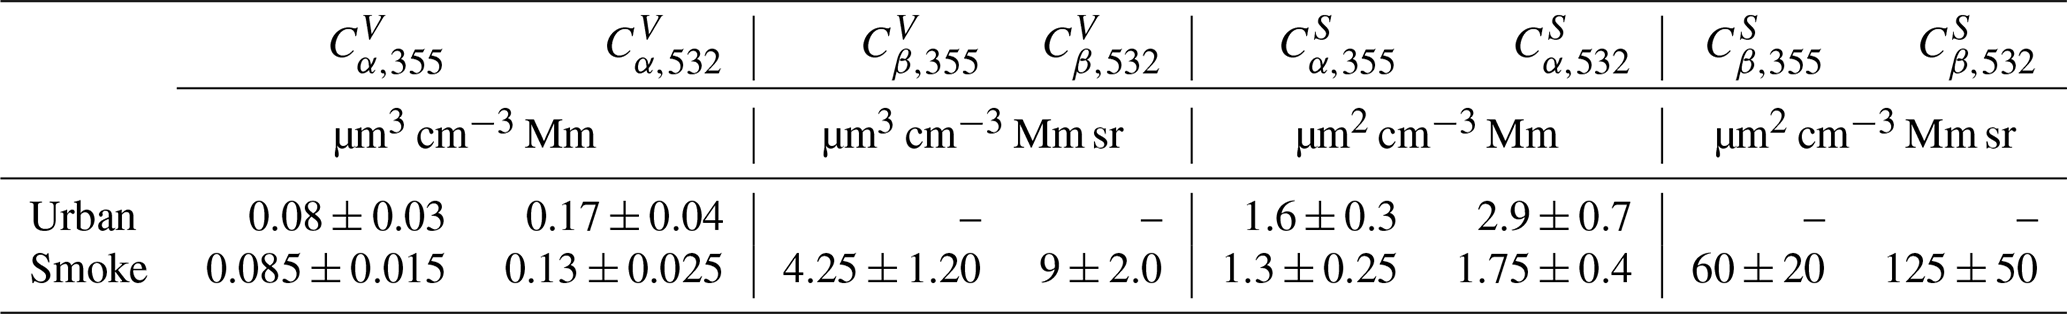
For urban aerosol, the mean value of is estimated to be 0.17 ± 0.04 µm3 cm−3 Mm. This contrasts with the higher value of 0.30 ± 0.08 µm3 cm−3 Mm reported by Mamouri and Ansmann (2017) for continental aerosol in Germany. It is interesting that extinction-to-surface area conversion factors , provided by Mamouri and Ansmann (2016) ( = 1.55 ± 0.46 and = 2.8 ± 0.89 µm2 cm−3 Mm), agree well with values in Table 1. In contrast to the extinction coefficient, the backscattering coefficient exhibits greater sensitivity to changes in the refractive index, leading to significantly stronger variations in compared to (Fig. 10b). The mean value of is 10 ± 6 µm3 cm−3 Mm sr, corresponding to an unacceptably high uncertainty in volume estimation (up to 60 %). Consequently, for urban aerosols, reliable volume density retrievals should be based solely on the extinction coefficient.
For smoke, the mean conversion factor is 0.13 ± 0.02 µm3 cm−3 Mm across all height ranges, which is very close to the value of 0.13 ± 0.08 µm3 cm−3 Mm reported by Ansmann et al. (2021) for aged smoke in AERONET measurements. The composition of smoke is less variable compared to urban aerosol, allowing for reliable volume estimations even based on the backscattering coefficient (Fig. 10d). The mean value of for smoke is 9 ± 1.5 µm3 cm−3 Mm sr, indicating comparable uncertainties in volume estimation from both extinction and backscattering coefficients for the analyzed episodes.
Table 1 summarizes the conversion factors for calculating particle volume and surface area density for the episodes presented in Fig. 10. The conversion factors and for urban aerosol are excluded due to their unacceptably high uncertainties. For aged smoke, we obtain = 1.75 ± 0.4 µm2 cm−3 Mm, which agrees well with the value 1.75 ± 0.25 µm2 cm−3 Mm reported by Ansmann et al. (2021). These findings demonstrate that in numerous cases, both particle volume and surface density of smoke can be retrieved from either a single extinction coefficient or a single backscattering coefficient, which is particularly valuable when complete 3β+2α measurements are unavailable. It should also be noted that the extinction-to-volume conversion factors for sulfate (SU) and organic carbon (OC), derived from Fig. 1a (0.38 and 0.24 µm3 cm−3 Mm respectively), are significantly higher than the corresponding values in Table 1. This discrepancy suggests that using just SU and OC is insufficient for accurately modeling urban aerosol and smoke, as these aerosols consist of complex mixtures of different particle types.
We analyzed Mie–Raman–fluorescence lidar observations during aerosol hygroscopic growth episodes to investigate water uptake effects on fluorescence backscattering, βF. The well-mixed PBL serves as a convenient environment for such studies, since βF should remain constant in the absence of water uptake effects. However, during certain episodes, we observed a systematic height-dependent decrease in βF. This observed βF reduction is difficult to explain solely by changes in aerosol composition and likely indicates fluorescence quenching. Notably, the decrease in βF begins at relatively low RH (less than 50 %), coinciding with a reduction in the depolarization ratio. Interestingly, while β532 shows rapid enhancement at high RH levels, this is not accompanied by an accelerated βF decrease rate.
All fluorescence-quenching episodes have been observed within the well-mixed PBLs of urban aerosols. Fluorescence quenching exhibits strong dependence on aerosol composition, as evidenced by its absence in numerous episodes. However, we cannot yet identify the specific particle type responsible for this quenching effect in this study. It should also be mentioned that when fluorescence measurements are conducted using multiple discrete channels, the ratio of fluorescence backscattering coefficients between these channels remains unaffected by water uptake, even though each individual channel is influenced by it (see Fig. 10 in Veselovskii et al., 2025). This implies that the spectral signatures of fluorescence are preserved during hygroscopic growth.
The particle volume and surface area density, retrieved from 3β+2α measurements during analysis of hygroscopic growth episodes, were used to validate the feasibility of estimating these parameters from a single extinction coefficient. Our analysis shows that for urban aerosols, the uncertainty in V and S determination remains below 25 % when using α532. Smoke particles demonstrate comparable uncertainties in V and S calculation. The conversion factors show a clear dependence on aerosol type, which can be effectively identified through fluorescence lidar measurements. These findings highlight the Mie–Raman–fluorescence lidar as a promising tool for aerosol characterization.
Table A1Particle parameters from the MERRA-2 model. The modal radius of log-normal PSD along with the real and imaginary parts of the RI at 532 nm for sulfates (SU) and organic carbon (OC) for different values of RH.
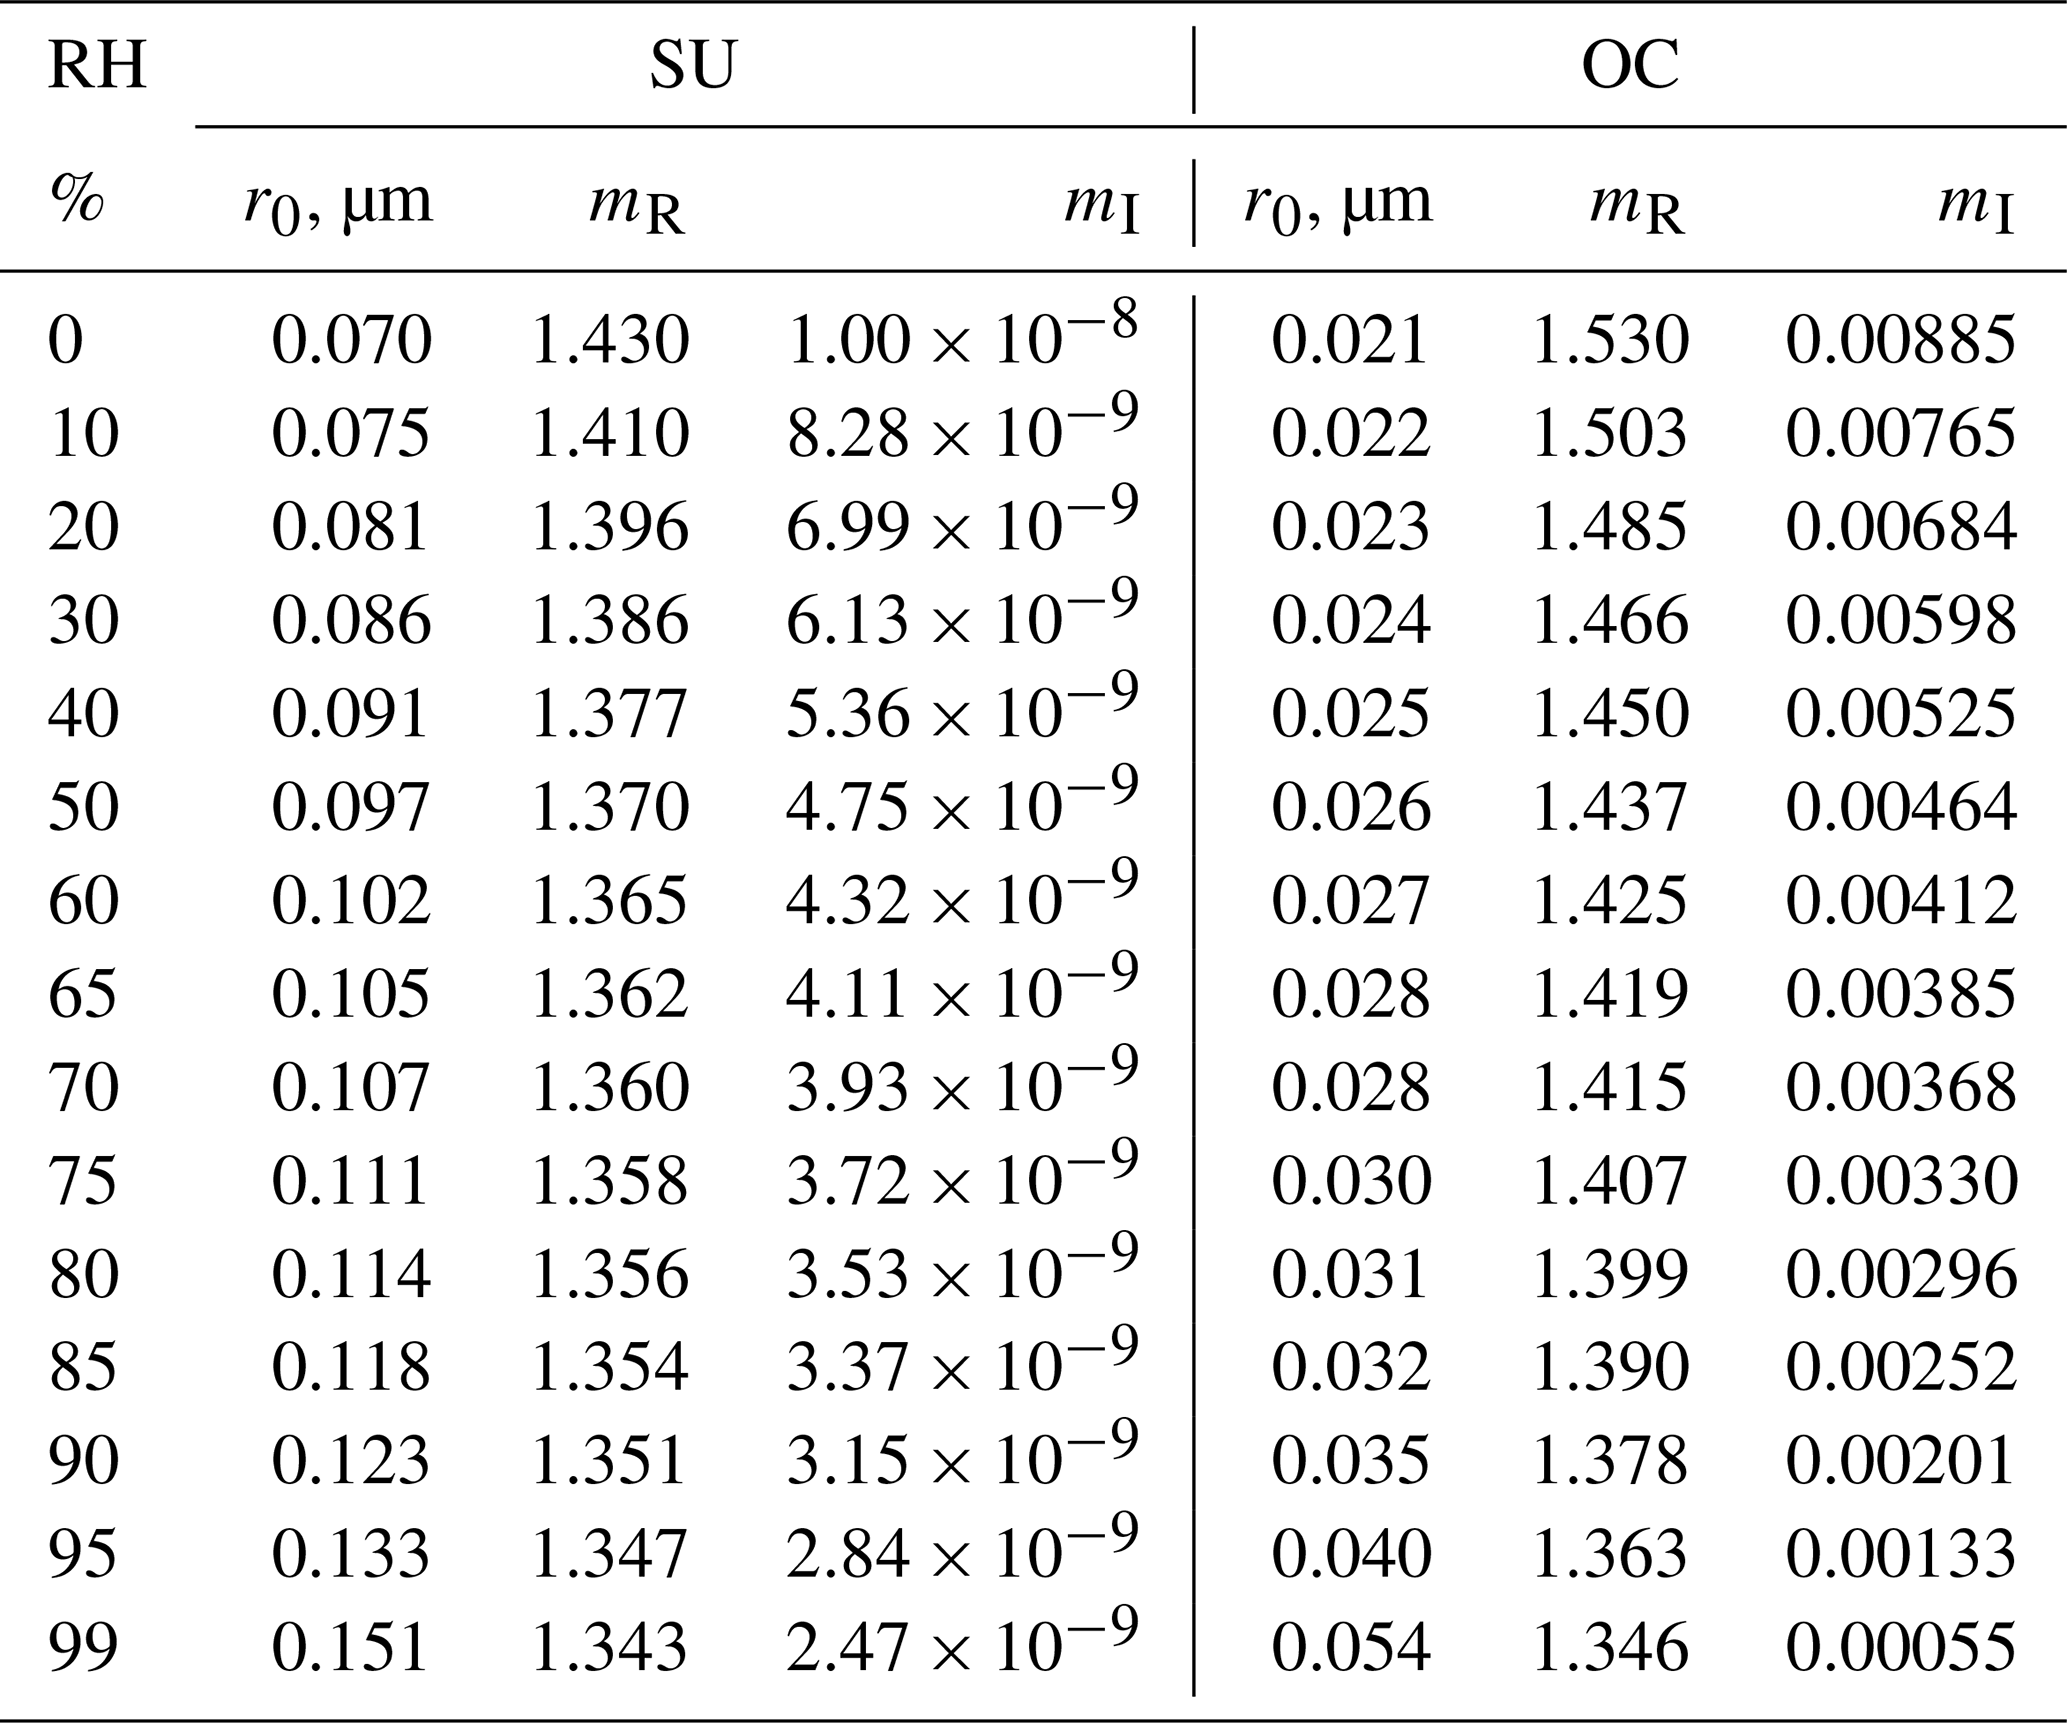
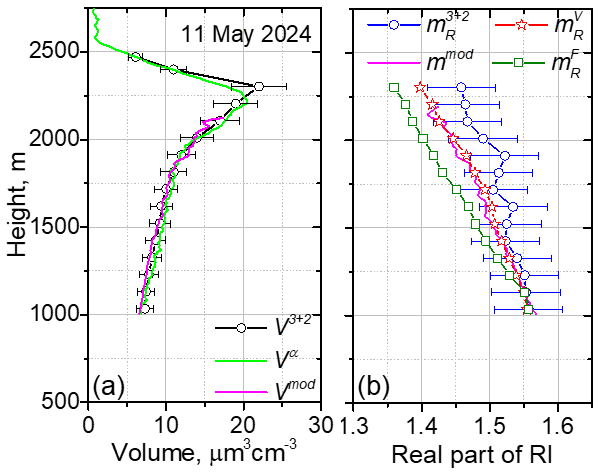
Figure A1Vertical profiles of the particle parameters on 11 May 2024 for the 20:30–23:00 UTC period. (a) The particle volume, V3+2, retrieved from 3β+2α observations; the volume Vα, calculated from the extinction coefficient, α532; and the volume Vmod, modeled with Eq. (3). (b) The real part of the refractive index, , retrieved from 3β+2α observations, along with the values , modeled with Eq. (4), and the values of and , calculated from Eqs. (5) and (6) respectively. Values of Vmod and were calculated for ε=0.33.
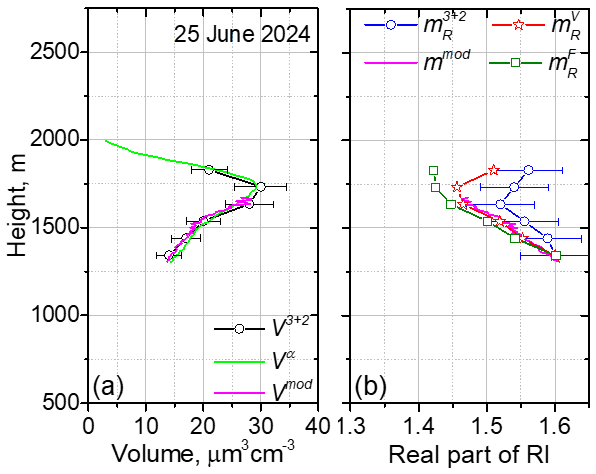
Figure A2Similar to Fig. A1 but for the measurements on 25 June 2024 for the 22:00–23:00 UTC period. Values of Vmod and were calculated for ε = 0.52.
Lidar measurements are available upon request (philippe.goloub@univ-lille.fr).
IV processed the data and wrote the paper. QH performed meteorological analysis. TP and GD performed lidar measurements. PG supervised the project and helped with paper preparation. AK performed numerical simulations, and MK developed the software for data analysis.
The contact author has declared that none of the authors has any competing interests.
Publisher's note: Copernicus Publications remains neutral with regard to jurisdictional claims made in the text, published maps, institutional affiliations, or any other geographical representation in this paper. While Copernicus Publications makes every effort to include appropriate place names, the final responsibility lies with the authors.
This work was supported by the CaPPA project, funded by the French National Research Agency (ANR) through the Programme d'Investissements d'Avenir (PIA) under contract ANR-11-LABX-0005-01, the Hauts-de-France Regional Council (project ECRIN), and the European Regional Development Fund (FEDER). We gratefully acknowledge the ESA/QA4EO program for supporting observation activities at LOA. The contribution of Qiaoyun Hu was supported by the ANR (project ANR-21-ESRE-0013, OBS4CLIM). The Russian Science Foundation is also acknowledged for its support under project 21-17-00114.
This work has benefited from the support of the ACTRIS-FR research infrastructure and the Center for Aerosol Remote Sensing (CARS) within the ACTRIS-EU research infrastructure. Finally, we acknowledge the French government under the France 2030 program and the Initiative of Excellence of the University of Lille for funding and supporting the R-CDP-24-003-AREA project.
This research has been supported by the Agence Nationale de la Recherche (grant no. ANR-11-LABX-0005-01). Publisher's note: the article processing charges for this publication were not paid by a Russian or Belarusian institution.
This paper was edited by Ulla Wandinger and reviewed by two anonymous referees.
Ansmann, A., Ohneiser, K., Mamouri, R.-E., Knopf, D. A., Veselovskii, I., Baars, H., Engelmann, R., Foth, A., Jimenez, C., Seifert, P., and Barja, B.: Tropospheric and stratospheric wildfire smoke profiling with lidar: mass, surface area, CCN, and INP retrieval, Atmos. Chem. Phys., 21, 9779–9807, https://doi.org/10.5194/acp-21-9779-2021, 2021.
Burton, S. P., Ferrare, R. A., Hostetler, C. A., Hair, J. W., Rogers, R. R., Obland, M. D., Butler, C. F., Cook, A. L., Harper, D. B., and Froyd, K. D.: Aerosol classification using airborne High Spectral Resolution Lidar measurements – methodology and examples, Atmos. Meas. Tech., 5, 73–98, https://doi.org/10.5194/amt-5-73-2012, 2012.
Carrico, C. M., Kus, P., Rood, M. J., Quinn, P. K., and Bates, T. S.: Mixtures of pollution, dust, sea salt, and volcanic aerosol during ACE-Asia: Radiative properties as a function of relative humidity, J. Geophys. Res., 108, 8650, https://doi.org/10.1029/2003JD003405, 2003.
Chang, Y., Hu, Q., Goloub, P., Veselovskii, I., and Podvin, T.: Retrieval of Aerosol Microphysical Properties from Multi-Wavelength Mie–Raman Lidar Using Maximum Likelihood Estimation: Algorithm, Performance, and Application, Remote. Sens. 14, 6208, https://doi.org/10.3390/rs14246208, 2022.
Chen, J., Li, Z., Lv, M., Wang, Y., Wang, W., Zhang, Y., Wang, H., Yan, X., Sun, Y., and Cribb, M.: Aerosol hygroscopic growth, contributing factors, and impact on haze events in a severely polluted region in northern China, Atmos. Chem. Phys., 19, 1327–1342, https://doi.org/10.5194/acp-19-1327-2019, 2019.
Chin, M., Ginoux, P., Kinne, S., Torres, O., Holben, B., Duncan, B., Martin, R. V., Logan, J. A., Higurashi, A., and Nakajima, T.: Tropospheric aerosol optical thickness from the GOCART model and comparisons with satellite and Sun photometer measurements, J. Atmos. Sci., 59, 461–483, 2002.
Colarco, P., Da Silva, A., Chin, M., and Diehl, T.: Online simulations of global aerosol distributions in the NASA GEOS-4 model and comparisons to satellite and ground-based aerosol optical depth, J. Geophys. Res., 115, https://doi.org/10.1029/2009JD012820, 2010.
Dawson, K. W., Ferrare, R. A., Moore, R. H., Clayton, M. B., Thorsen, T. J., and Eloranta, E. W.: Ambient Aerosol Hygroscopic Growth From Combined Raman Lidar and HSRL, J. Geophys. Res.-Atmos., 125, e2019JD031708, https://doi.org/10.1029/2019JD031708, 2020.
Dobretsov, G. E., Syrejschikova, T. I., and Smolina, N. V.: On mechanisms of fluorescence quenching by water, Biophysics 59, 183–188, https://doi.org/10.1134/S0006350914020079, 2014.
Feingold, G. and Morley, B.: Aerosol hygroscopic properties as measured by lidar and comparison with in situ measurements, J. Geophys. Res., 108, 4327, https://doi.org/10.1029/2002JD002842, 2003.
Fernández, A. J., Apituley, A., Veselovskii, I., Suvorina, A., Henzing, J., Pujadas, M., and Artíñano, B.: Study of aerosol hygroscopic events over the Cabauw experimental site for atmospheric research (CESAR) using the multiwavelength Raman lidar Caeli, Atmos. Environ., 120, 484–498, https://doi.org/10.1016/j.atmosenv.2015.08.079, 2015.
Floutsi, A. A., Baars, H., Engelmann, R., Althausen, D., Ansmann, A., Bohlmann, S., Heese, B., Hofer, J., Kanitz, T., Haarig, M., Ohneiser, K., Radenz, M., Seifert, P., Skupin, A., Yin, Z., Abdullaev, S. F., Komppula, M., Filioglou, M., Giannakaki, E., Stachlewska, I. S., Janicka, L., Bortoli, D., Marinou, E., Amiridis, V., Gialitaki, A., Mamouri, R.-E., Barja, B., and Wandinger, U.: DeLiAn – a growing collection of depolarization ratio, lidar ratio and Ångström exponent for different aerosol types and mixtures from ground-based lidar observations, Atmos. Meas. Tech., 16, 2353–2379, https://doi.org/10.5194/amt-16-2353-2023, 2023.
Gast, B., Jimenez, C., Ansmann, A., Haarig, M., Engelmann, R., Fritzsch, F., Floutsi, A. A., Griesche, H., Ohneiser, K., Hofer, J., Radenz, M., Baars, H., Seifert, P., and Wandinger, U.: Invisible aerosol layers: improved lidar detection capabilities by means of laser-induced aerosol fluorescence, Atmos. Chem. Phys., 25, 3995–4011, https://doi.org/10.5194/acp-25-3995-2025, 2025.
Granados-Muñoz, M. J., Navas-Guzmán, F., Bravo-Aranda, J. A., Guerrero-Rascado, J. L., Lyamani, H., Valenzuela, A., Titos, G., Fernández-Gálvez, J., and Alados-Arboledas, L.: Hygroscopic growth of atmospheric aerosol particles based on active remote sensing and radiosounding measurements: selected cases in southeastern Spain, Atmos. Meas. Tech., 8, 705–718, https://doi.org/10.5194/amt-8-705-2015, 2015.
Haarig, M., Ansmann, A., Gasteiger, J., Kandler, K., Althausen, D., Baars, H., Radenz, M., and Farrell, D. A.: Dry versus wet marine particle optical properties: RH dependence of depolarization ratio, backscatter, and extinction from multiwavelength lidar measurements during SALTRACE, Atmos. Chem. Phys., 17, 14199–14217, https://doi.org/10.5194/acp-17-14199-2017, 2017.
Haarig, M., Engelmann, R., Baars, H., Gast, B., Althausen, D., and Ansmann, A.: Discussion of the spectral slope of the lidar ratio between 355 and 1064 nm from multiwavelength Raman lidar observations, Atmos. Chem. Phys., 25, 7741–7763, https://doi.org/10.5194/acp-25-7741-2025, 2025.
Hänel, G.: The Properties of Atmospheric Aerosol Particles as Functions of the Relative Humidity at Thermodynamic Equilibrium with the Surrounding Moist Air, Adv. Geophys., 19, 73–188, 1976.
He, Y., Yin, Z., Ansmann, A., Liu, F., Wang, L., Jing, D., and Shen, H.: POLIPHON conversion factors for retrieving dust-related cloud condensation nuclei and ice-nucleating particle concentration profiles at oceanic sites, Atmos. Meas. Tech., 16, 1951–1970, https://doi.org/10.5194/amt-16-1951-2023, 2023.
Kolgotin, A., Müller, D., Chemyakin, E., Romanov, A., and Alehnovich, V.: Improved identification of the solution space of aerosol microphysical properties derived from the inversion of profiles of lidar optical data, part 3: case studies, Appl. Opt., 57, 2499–2513, 2018.
Kolgotin, A., Müller, D., and Romanov, A.: Particle microphysical parameters and the complex refractive index from 3β+2α HSRL/Raman lidar measurements: conditions of accurate retrieval, retrieval uncertainties and constraints to suppress the uncertainties, Atmosphere, 14, 1159, https://doi.org/10.3390/atmos14071159, 2023.
Kolgotin, A., Muller, D., Goloub, P., Hu, Q., Podvin, T., and Wang, X.: Aerosol Typing from Linear estimations for the Analytical Separation (ATLAS) of complex aerosol mixtures and improved identification of microphysical parameters from multiwavelength lidar data, part 2: case studies, JOSA A, 42, 233–253, https://doi.org/10.1364/JOSAA.537287, 2025.
Lakowicz, J. R.: Principles of Fluorescence Spectroscopy, Springer New York, NY, https://doi.org/10.1007/978-0-387-46312-4, 2006.
Maillard, J., Klehs, K., Rumble, C., Vauthey, E., Heilemann, M., and Fürstenberg, A.: Universal quenching of common fluorescent probes by water and alcohols, Chem. Sci.,12, 1352–1362, https://doi.org/10.1039/d0sc05431c, 2021.
Mamouri, R.-E. and Ansmann, A.: Potential of polarization lidar to provide profiles of CCN- and INP-relevant aerosol parameters, Atmos. Chem. Phys., 16, 5905–5931, https://doi.org/10.5194/acp-16-5905-2016, 2016.
Mamouri, R.-E. and Ansmann, A.: Potential of polarization/Raman lidar to separate fine dust, coarse dust, maritime, and anthropogenic aerosol profiles, Atmos. Meas. Tech., 10, 3403–3427, https://doi.org/10.5194/amt-10-3403-2017, 2017.
Miri, R., Pujol, O., Hu, Q., Goloub, P., Veselovskii, I., Podvin, T., and Ducos, F.: Innovative aerosol hygroscopic growth study from Mie–Raman–fluorescence lidar and microwave radiometer synergy, Atmos. Meas. Tech., 17, 3367–3375, https://doi.org/10.5194/amt-17-3367-2024, 2024.
Navas-Guzmán, F., Martucci, G., Collaud Coen, M., Granados-Muñoz, M. J., Hervo, M., Sicard, M., and Haefele, A.: Characterization of aerosol hygroscopicity using Raman lidar measurements at the EARLINET station of Payerne, Atmos. Chem. Phys., 19, 11651–11668, https://doi.org/10.5194/acp-19-11651-2019, 2019.
Pérez-Ramírez, D., Whiteman, D. N., Veselovskii, I., Ferrare, R., Titos, G., Granados-Muñoz, M. J., Sánchez-Hernández, G., and Navas-Guzmán, F.: Spatiotemporal changes in aerosol properties by hygroscopic growth and impacts on radiative forcing and heating rates during DISCOVER-AQ 2011, Atmos. Chem. Phys., 21, 12021–12048, https://doi.org/10.5194/acp-21-12021-2021, 2021.
Randriamiarisoa, H., Chazette, P., Couvert, P., Sanak, J., and Mégie, G.: Relative humidity impact on aerosol parameters in a Paris suburban area, Atmos. Chem. Phys., 6, 1389–1407, https://doi.org/10.5194/acp-6-1389-2006, 2006.
Raut, J.-C. and Chazette, P.: Vertical profiles of urban aerosol complex refractive index in the frame of ESQUIF airborne measurements, Atmos. Chem. Phys., 8, 901–919, https://doi.org/10.5194/acp-8-901-2008, 2008.
Reichardt, J., Lauermann, F., and Behrendt, O.: Fluorescence spectra of atmospheric aerosols, Atmos. Chem. Phys., 25, 5857–5892, https://doi.org/10.5194/acp-25-5857-2025, 2025.
Sheridan, P. J., Delene, D. J., and Ogren, J. A.: Four years of continuous surface aerosol measurements from the Department of Energy's Atmospheric Radiation Measurement Program Southern Great Plains Cloud and Radiation Testbed site, J. Geophys. Res., 106, 20735–20747, https://doi.org/10.1029/2001JD000785, 2001.
Sicard, M., Fortunato dos Santos Oliveira, D. C., Muñoz-Porcar, C., Gil-Díaz, C., Comerón, A., Rodríguez-Gómez, A., and Dios Otín, F.: Measurement report: Spectral and statistical analysis of aerosol hygroscopic growth from multi-wavelength lidar measurements in Barcelona, Spain, Atmos. Chem. Phys., 22, 7681–7697, https://doi.org/10.5194/acp-22-7681-2022, 2022.
Veselovskii, I., Kolgotin, A., Griaznov, V., Müller, D., Wandinger, U., and Whiteman, D.: Inversion with regularization for the retrieval of tropospheric aerosol parameters from multi-wavelength lidar sounding, Appl. Opt. 41, 3685–3699, https://doi.org/10.1364/AO.41.003685, 2002.
Veselovskii, I., Whiteman, D. N., Kolgotin, A., Andrews, E., and Korenskii, M.: Demonstration of Aerosol Property Profiling by Multiwavelength Lidar under Varying Relative Humidity Conditions, J. Atmos. Ocean. Tech., 26, 1543–1557, https://doi.org/10.1175/2009JTECHA1254.1, 2009.
Veselovskii, I., Hu, Q., Goloub, P., Podvin, T., Korenskiy, M., Pujol, O., Dubovik, O., and Lopatin, A.: Combined use of Mie–Raman and fluorescence lidar observations for improving aerosol characterization: feasibility experiment, Atmos. Meas. Tech., 13, 6691–6701, https://doi.org/10.5194/amt-13-6691-2020, 2020.
Veselovskii, I., Barchunov, B., Hu, Q., Goloub, P., Podvin, T., Korenskii, M., Dubois, G., Boissiere, W., and Kasianik, N.: Retrieval and analysis of the composition of an aerosol mixture through Mie–Raman–fluorescence lidar observations, Atmos. Meas. Tech., 17, 4137–4152, https://doi.org/10.5194/amt-17-4137-2024, 2024.
Veselovskii, I., Korenskiy, M., Kasianik, N., Barchunov, B., Hu, Q., Goloub, P., and Podvin, T.: Fluorescence properties of long-range-transported smoke: insights from five-channel lidar observations over Moscow during the 2023 wildfire season, Atmos. Chem. Phys., 25, 1603–1615, https://doi.org/10.5194/acp-25-1603-2025, 2025.
Zhou, Z., Ma, Y., Yin, Z., Hu, Q., Veselovskii, I., Müller, D., and Gong, W.: A Modified Look-Up Table Based Algorithm with a Self-Posed Scheme for Fine-Mode Aerosol Microphysical Properties Inversion by Multi-Wavelength Lidar, Remote Sens., 16, 2265, https://doi.org/10.3390/rs16132265, 2024.
- Abstract
- Introduction
- Instrumentation and methodology
- Numerical simulation of the particle volume and surface density as a function of the extinction coefficient
- Results of observations
- Conversion factors for smoke and urban particles
- Conclusion
- Appendix A
- Data availability
- Author contributions
- Competing interests
- Disclaimer
- Acknowledgements
- Financial support
- Review statement
- References