the Creative Commons Attribution 4.0 License.
the Creative Commons Attribution 4.0 License.
 | 10 Nov 2025
An autonomous cloud detection algorithm using single ground-based infrared radiometer for the Tibetan Plateau
Linjun Pan
Yinan Wang
Yongheng Bi
Accurate cloud detection over the Tibetan Plateau (TP) is crucial for understanding regional weather patterns and global climate dynamics. Yet, it remains challenging due to harsh environmental conditions and sparse observations. While ground-based infrared radiometers offer a promising solution through downwelling infrared brightness temperature (IRBT) measurements, existing algorithms require supplementary meteorological data often unavailable in remote TP regions. This study presents a novel cloud detection algorithm that operates solely on IRBT data from a single ground-based infrared radiometer, addressing the critical need for autonomous cloud monitoring in resource-limited environments. The algorithm integrates spectral and temporal analysis approaches: the spectral test identifies cloud presence by comparing observed IRBT against statistically derived clear-sky diurnal cycles, and the temporal test detects clouds through IRBT variability analysis using sliding standard deviation calculations. A key innovation includes a normalization procedure that effectively mitigates dust contamination effects – a persistent challenge in the arid TP environment that can introduce extremely large errors. Validation against 13 months of radiosonde data demonstrates robust performance with agreement rates exceeding 70 % in most months, with particularly effective performance during the wet season. This work provides a practical and cost-effective solution for autonomous cloud monitoring over the TP, with potential for application in other regions with limited observational data.
- Article
(2444 KB) - Full-text XML
- BibTeX
- EndNote


The Tibetan Plateau (TP) plays a critical role in shaping weather and climate patterns on regional and global scales (Wu and Zhang, 1998; Duan and Wu, 2005; Wu and Chou, 2013; Zhao et al., 2018; Ge et al., 2019; Fu et al., 2020; Wu et al., 2024). These effects are closely linked to clouds, which influence convection systems and radiative forcing over the TP (Duan and Wu, 2006; Ma et al., 2021; Bo et al., 2016; Bao et al., 2019; Wu et al. 2024). The related heating can even modulate East Asian summer monsoon (EASM), such as the onset, duration, and total precipitation of the rainy season in South China (the first stage of the EASM) (Duan et al., 2020). Detecting and understanding cloud properties is therefore essential for studying cloud impacts on the TP's climate.
Cloud observations provide valuable information not only for assessing atmospheric processes but also for improving retrieval accuracy in satellite and ground-based remote sensing. Even clouds with small optical depths can significantly affect the accuracy of retrieved vertical profiles of temperature and humidity, precipitable water vapor, and liquid water (Hewison, 2007; Turner, 2007; Cadeddu and Turner, 2011).
Since the 1980s, meteorological satellites such as CloudSat, CALIPSO, Himawari-8 and FengYun-4A have revealed cloud characteristics over the Tibetan Plateau (Yan and Liu, 2019; Yi, 2019; Wang et al., 2020; Liu et al., 2021). In contrast to these top-down observations, ground-based instruments – including cloud radars, lidars, and all-sky imagers – provide essential bottom-up data for validating satellite products and analyzing cloud properties in greater detail (Song et al., 2017; Huo et al., 2021; Luo et al., 2024; Zhao et al., 2024). However, the TP's harsh climate and complex terrain result in sparse and unevenly distributed observation stations, making it challenging to monitor clouds effectively. As a result, there is a need for simple and cost-effective cloud observation methods.
Ground-based infrared radiometers, which are small, portable, and relatively inexpensive, have been widely deployed for cloud detection. These instruments measure downwelling infrared radiance in the form of infrared brightness temperature (IRBT) within the atmospheric window band. On cloudy days, the detected radiance includes contributions from clouds, the atmosphere between the cloud and the radiometer, and the atmosphere above the cloud. Clouds in the troposphere significantly increase IRBT compared with clear-sky conditions, enabling cloud detection by comparing IRBT values (Brocard et al., 2010; Ahn et al., 2015).
However, this approach has limitations. Strong inversion layers or the presence of thick aerosols and haze can cause clear skies to be misclassified as cloudy (Sutter et al., 2004; Ahn et al., 2015). Conversely, optically thin cirrus clouds often produce IRBT increments that are too weak to reliably distinguish from clear-sky conditions. Brocard et al. (2010) addressed this limitation by using detrended fluctuation analysis to estimate the temporal variability of IRBT for detecting cirrus clouds. Ahn et al. (2015) developed a cloud detection algorithm that combined spectral and temporal tests on IRBT data, using auxiliary data such as historical radiosonde observations and real-time surface atmospheric parameters. While effective, these approaches rely on additional instruments, making them less practical in regions like the TP, where supplementary observations are often unavailable.
This study addresses the need for a cloud detection algorithm that relies solely on IRBT measurements from a ground-based infrared radiometer. The proposed algorithm integrates spectral and temporal tests to identify cloud presence. The spectral test compares observed IRBT with the statistical diurnal cycle of infrared radiance, while the temporal test assesses IRBT variability against a statistical threshold. This method eliminates the dependence on auxiliary data, making it more suitable for remote and resource-limited regions like the TP.
The rest of this paper is organized as follows: Sect. 2 describes the dataset and instrumentation. Section 3 details the new cloud detection algorithm. Section 4 presents the evaluation results, and Sect. 5 summarizes the main findings and discusses the uncertainties and future directions.
2.1 Infrared Brightness Temperature (IRBT) Data
This study utilizes data from an infrared radiometer (model KT19.85), manufactured by Heitronics. The radiometer, mounted atop a ground-based microwave radiometer, functions as an auxiliary instrument for capturing downwelling infrared radiation every 1–2 s as the form of brightness temperature. The temporal resolution of the observed IRBT is processed to 2 s in this study. It has a spectral range of 9.6–11.5 µm, with peak sensitivity concentrated between 10 and 11.5 µm. Other measurement parameters are shown in Table 1.
Table 1The measurement parameters and deployment environment of the infrared radiometer.
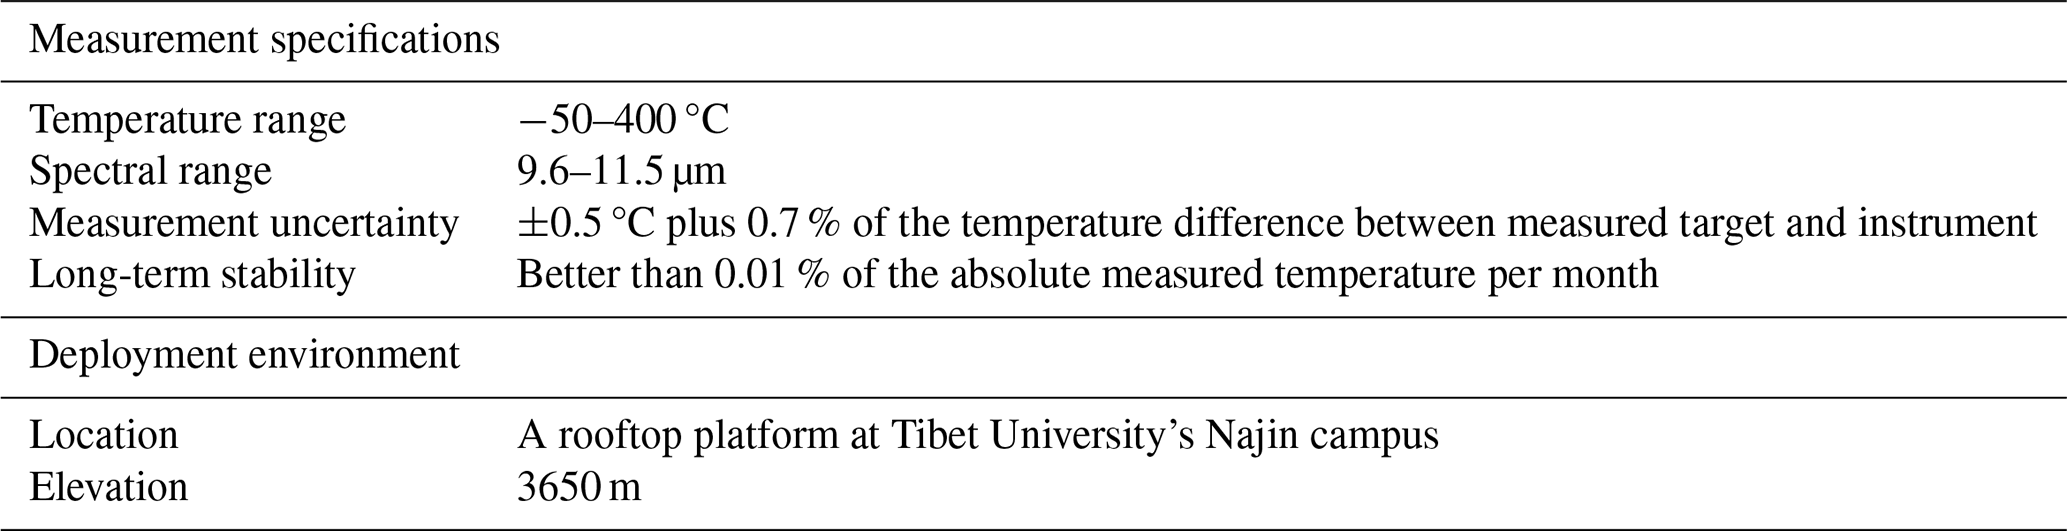
The radiometer was deployed on a rooftop platform at Tibet University's Najin campus, located in Lhasa, Tibet, at 3650 m above sea level. Continuous measurements of IRBT began in June 2021, and a total of 13 months of data have been collected.
2.2 Radiosonde Data
Radiosondes are launched in Lhasa twice daily at 12:00 and 24:00 UTC. Unless otherwise stated, all times in this paper follow UTC. The radiosonde launch site is approximately 4 km from the Najin campus. The corresponding radiosonde data are used to validate the cloud detection algorithm.
The cloud detection algorithm integrates two complementary approaches: a spectral test and a temporal test, combining their strengths to achieve optimal cloud detection. The spectral test evaluates the absolute IRBT values against the statistical clear-sky IRBT diurnal cycle, while the temporal test examines the variability of IRBT over time. Before the algorithm application, quality control procedures are implemented to ensure data reliability by mitigating the effects of noise and environmental contamination.
3.1 Normalization of IRBT
The infrared radiometer used in this study captures total downwelling infrared radiation via a vertically positioned reflective lens. A transparent protective cover surrounds the lens to mitigate contamination from the weather like rain, snow, and dust. Despite this, field observations on the Tibetan Plateau are inevitably contaminated by dust accumulation, a consequence of the arid and windy conditions in this region. This contamination results in a gradual increase in IRBT values, potentially obscuring cloud-related signals and degrading detection accuracy.
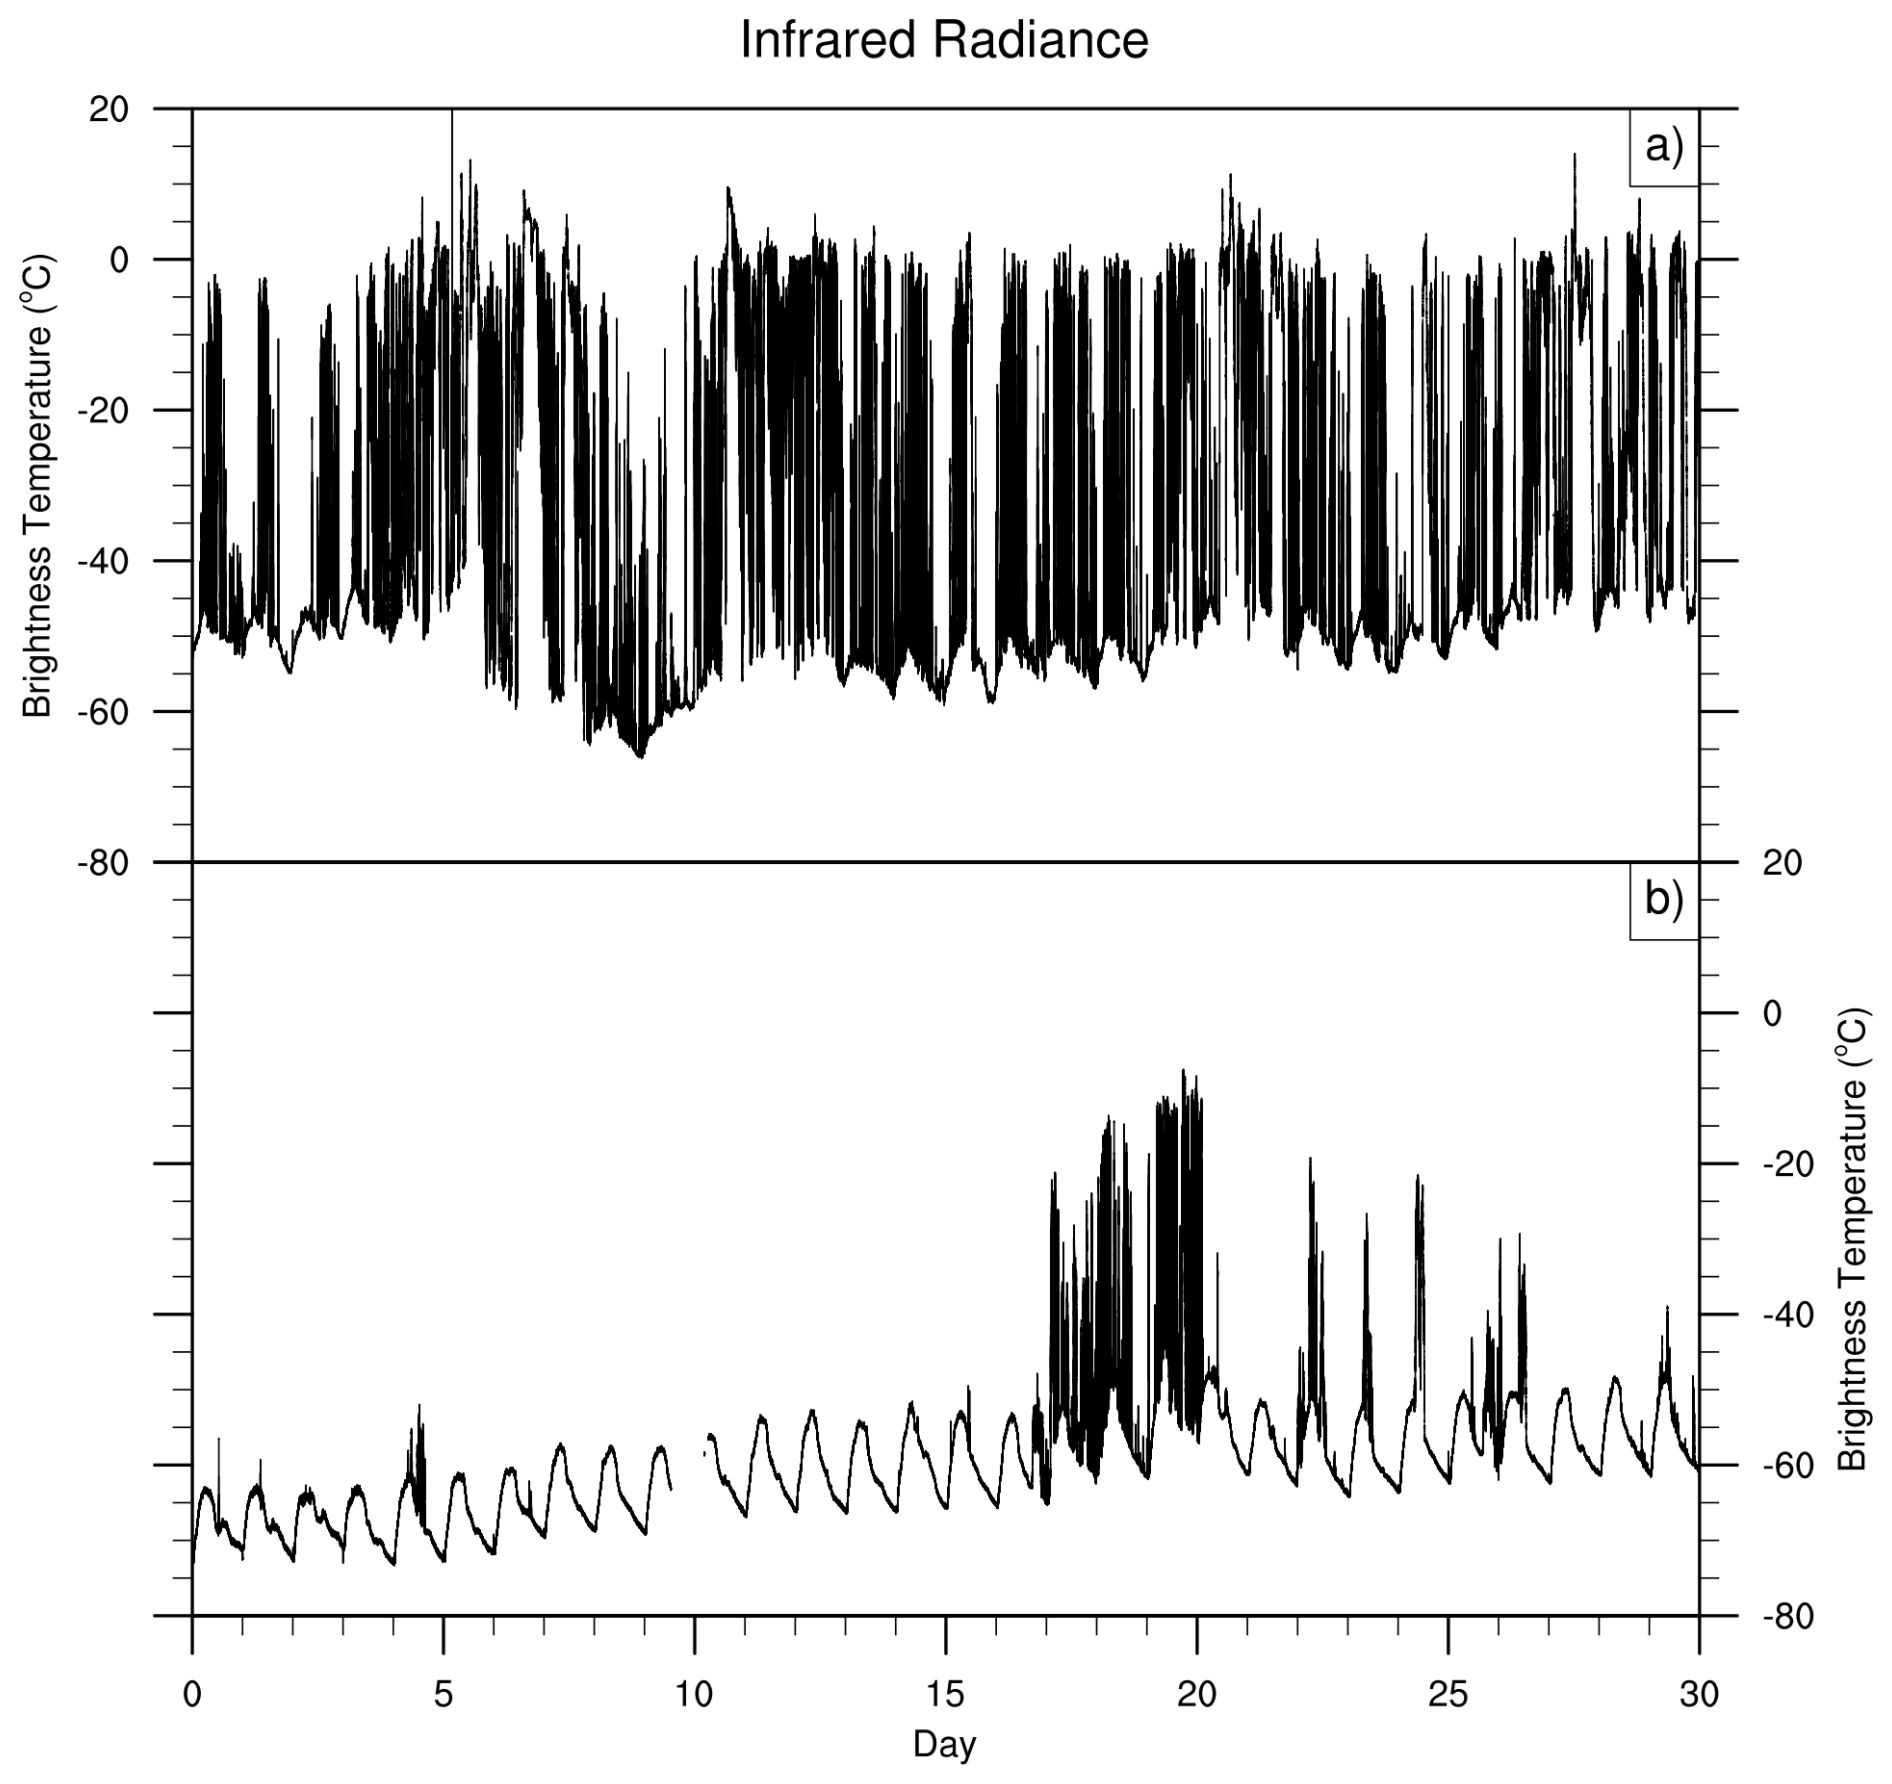
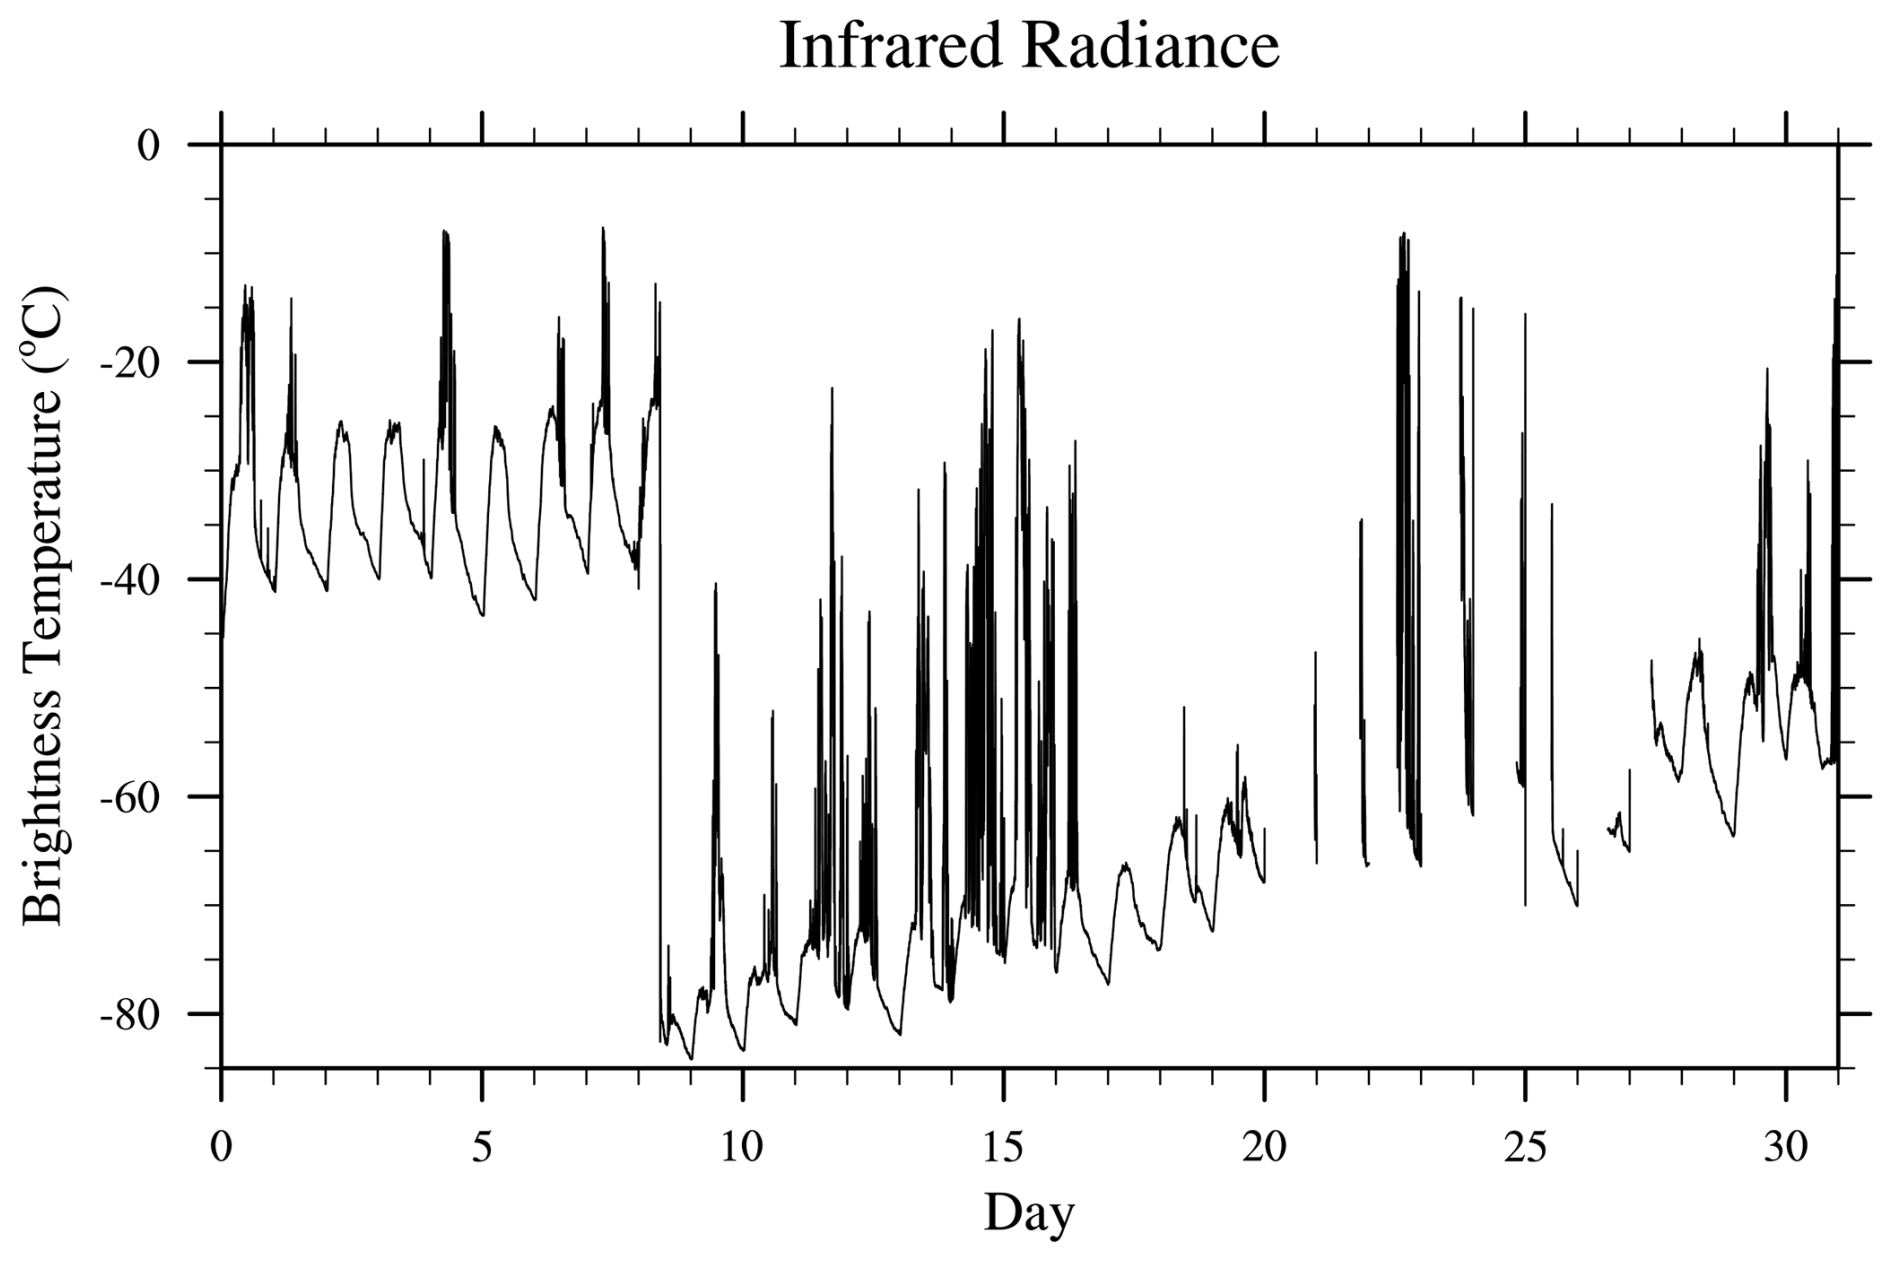
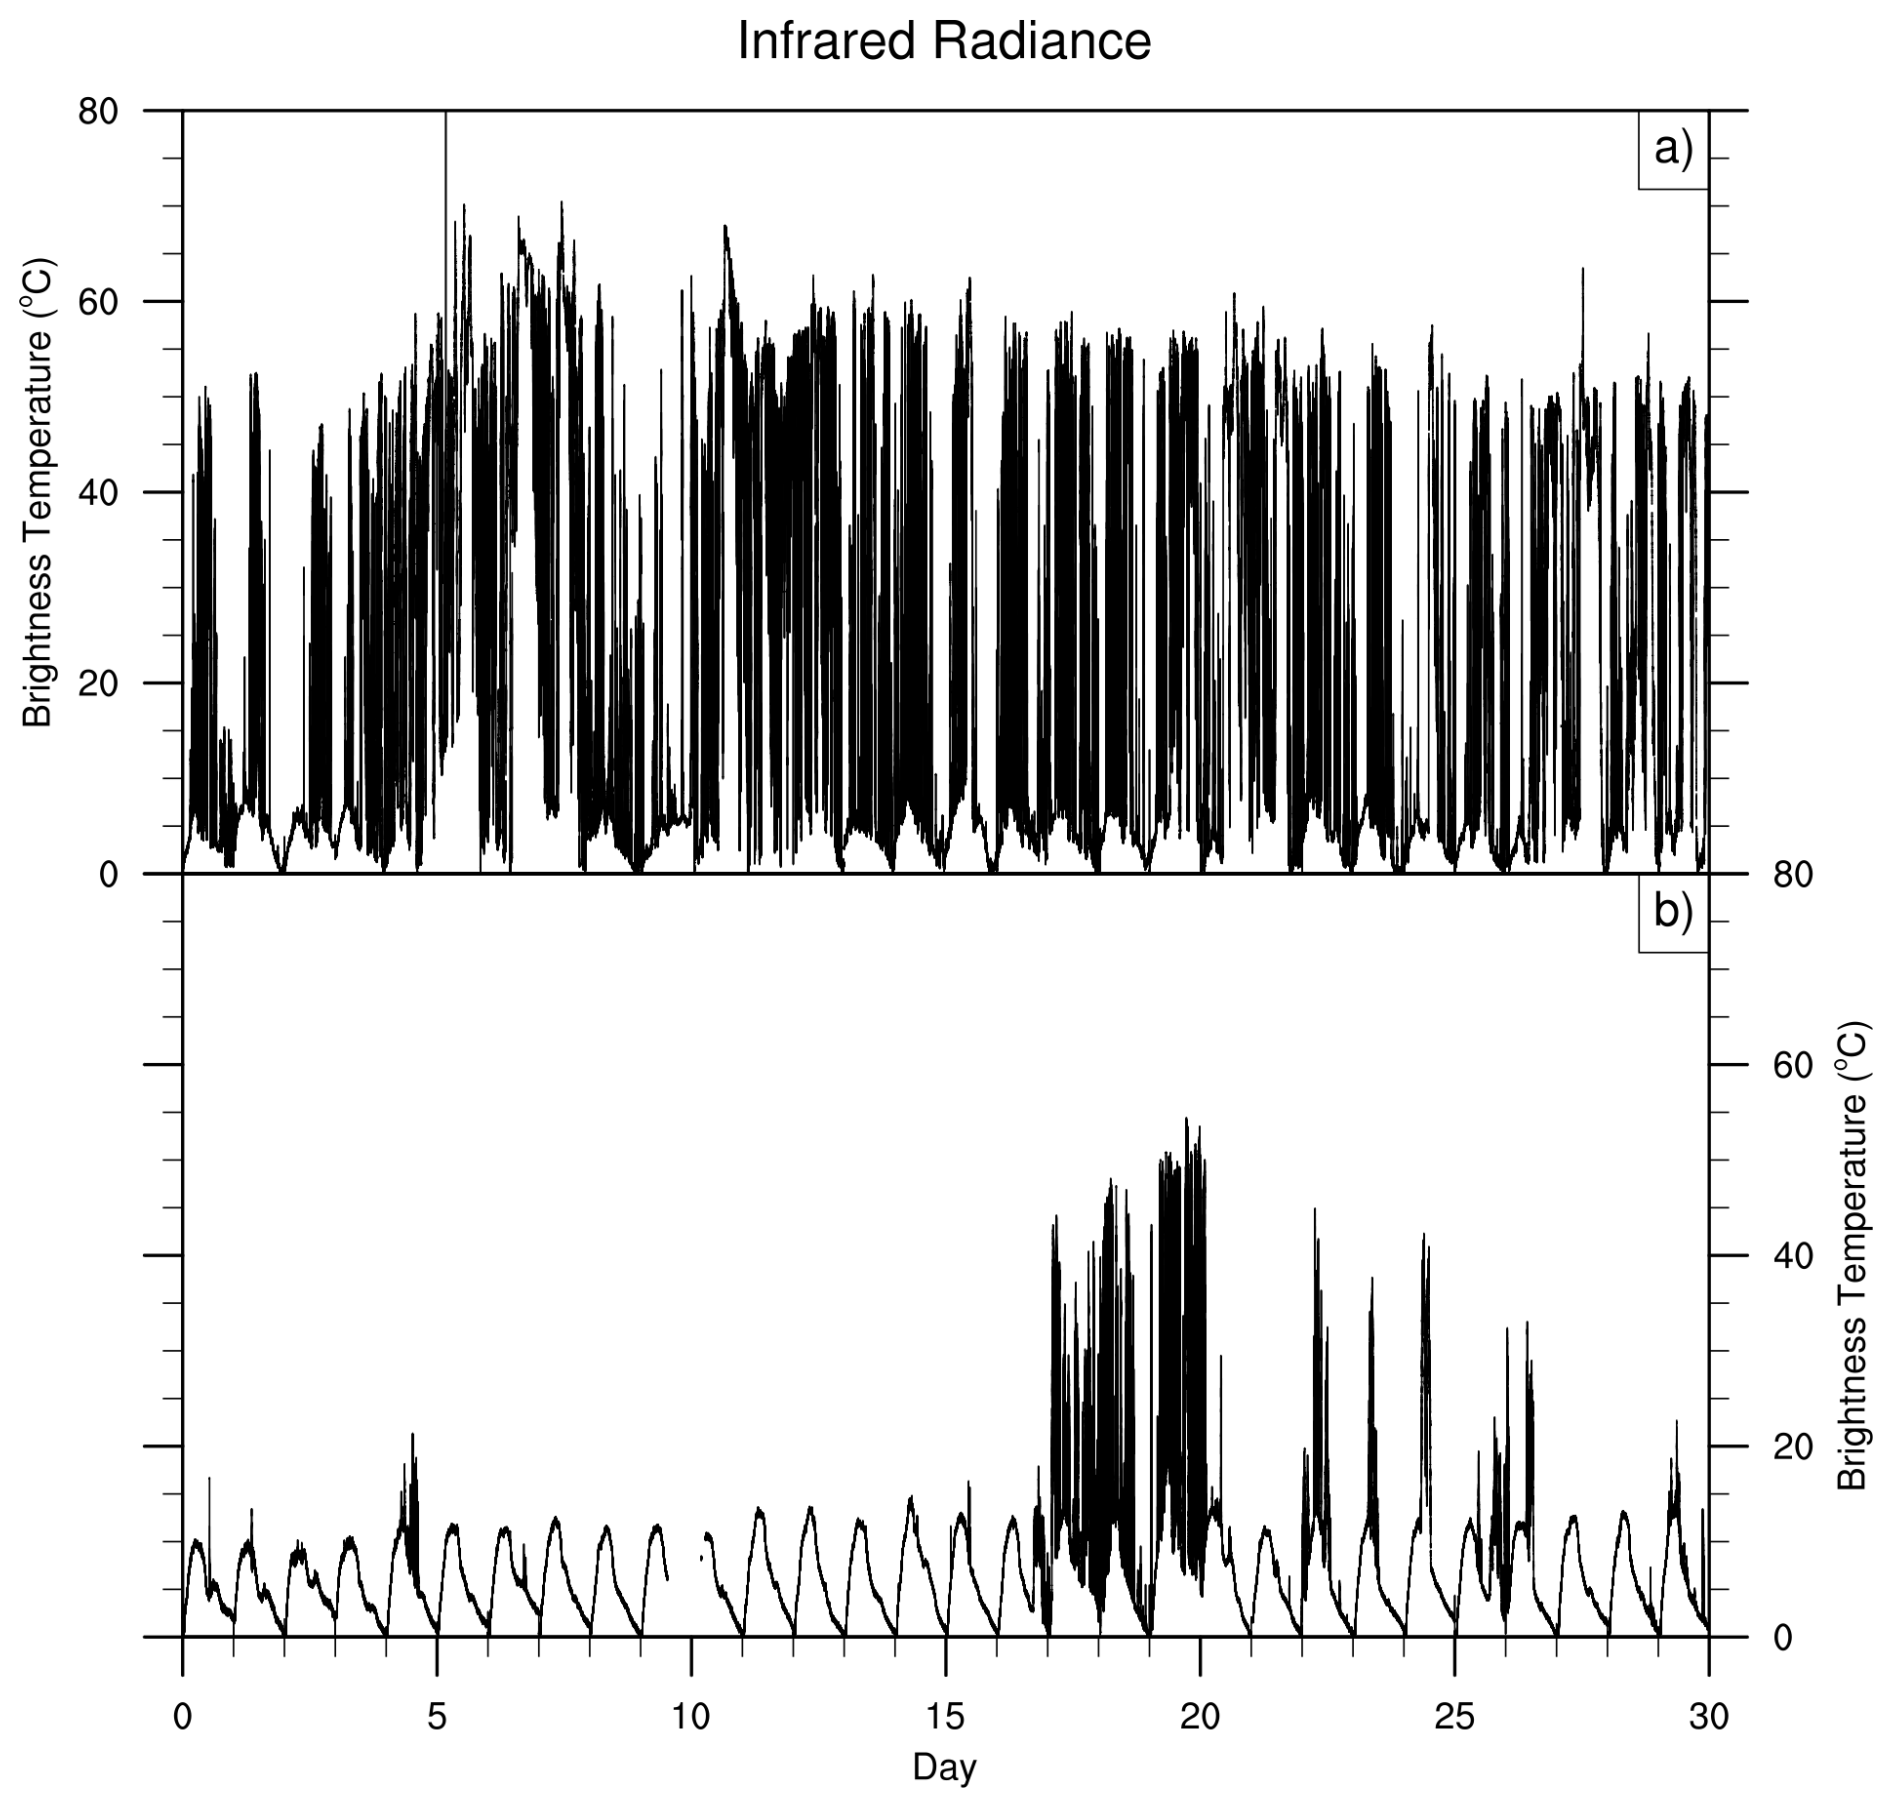
Figures 1 and 2 illustrate examples of IRBT observations. In June and November 2021, the daily minimum IRBT shows a gradual increase over time, which is associated with dust accumulation. The increase can be interrupted by abrupt drops caused by aperiodic manual lens cleaning events (Figs. 1a and 2). In some extreme situations, IRBT noise introduced by dust accumulations can exceed the infrared signals from clouds. In March 2022, a sharp IRBT decrease of ∼ 40 °C on the 9th day after the removal of accumulated dust (Fig. 2). These findings underscore the critical need to correct for dust-induced noise.
To address this, we developed a normalization method that effectively mitigates the impact of dust accumulation on the cloud detection algorithm. The steps are as follows:
-
Daily Segmentation: Separate the observation data into daily intervals.
-
Minimum Extraction: Identify the daily minimum IRBT value.
-
Data Normalization: Subtract the daily minimum IRBT from the corresponding daily dataset.
The normalization approach can significantly reduce dust-induced noise, providing reliable data for subsequent analysis. In Fig. 3, we show the normalized IRBT in June and November 2021 as an example. While normalization improves data quality, it may introduce errors under specific weather conditions, which will be discussed in the following section.
On the other hand, the normalization method has its limitations. It is designed to mitigate the effects from long-term accumulated dust deposition. During extreme dust events such as dust storms, this method is unable to fully eliminate the contamination in observational data caused by intense short-term dust deposition. It is worth noting, however, that such events have become rare in Lhasa. The annual average number of dust days decreased to 5.2 in the 1990s (Zhang and Tang, 2002). The dust events in Lhasa have exhibited a significant decreasing trend since the 1950s due to climate changes and ecological improvements (Zhang and Tang, 2002; Xu et al., 2007).
3.2 Spectral Test
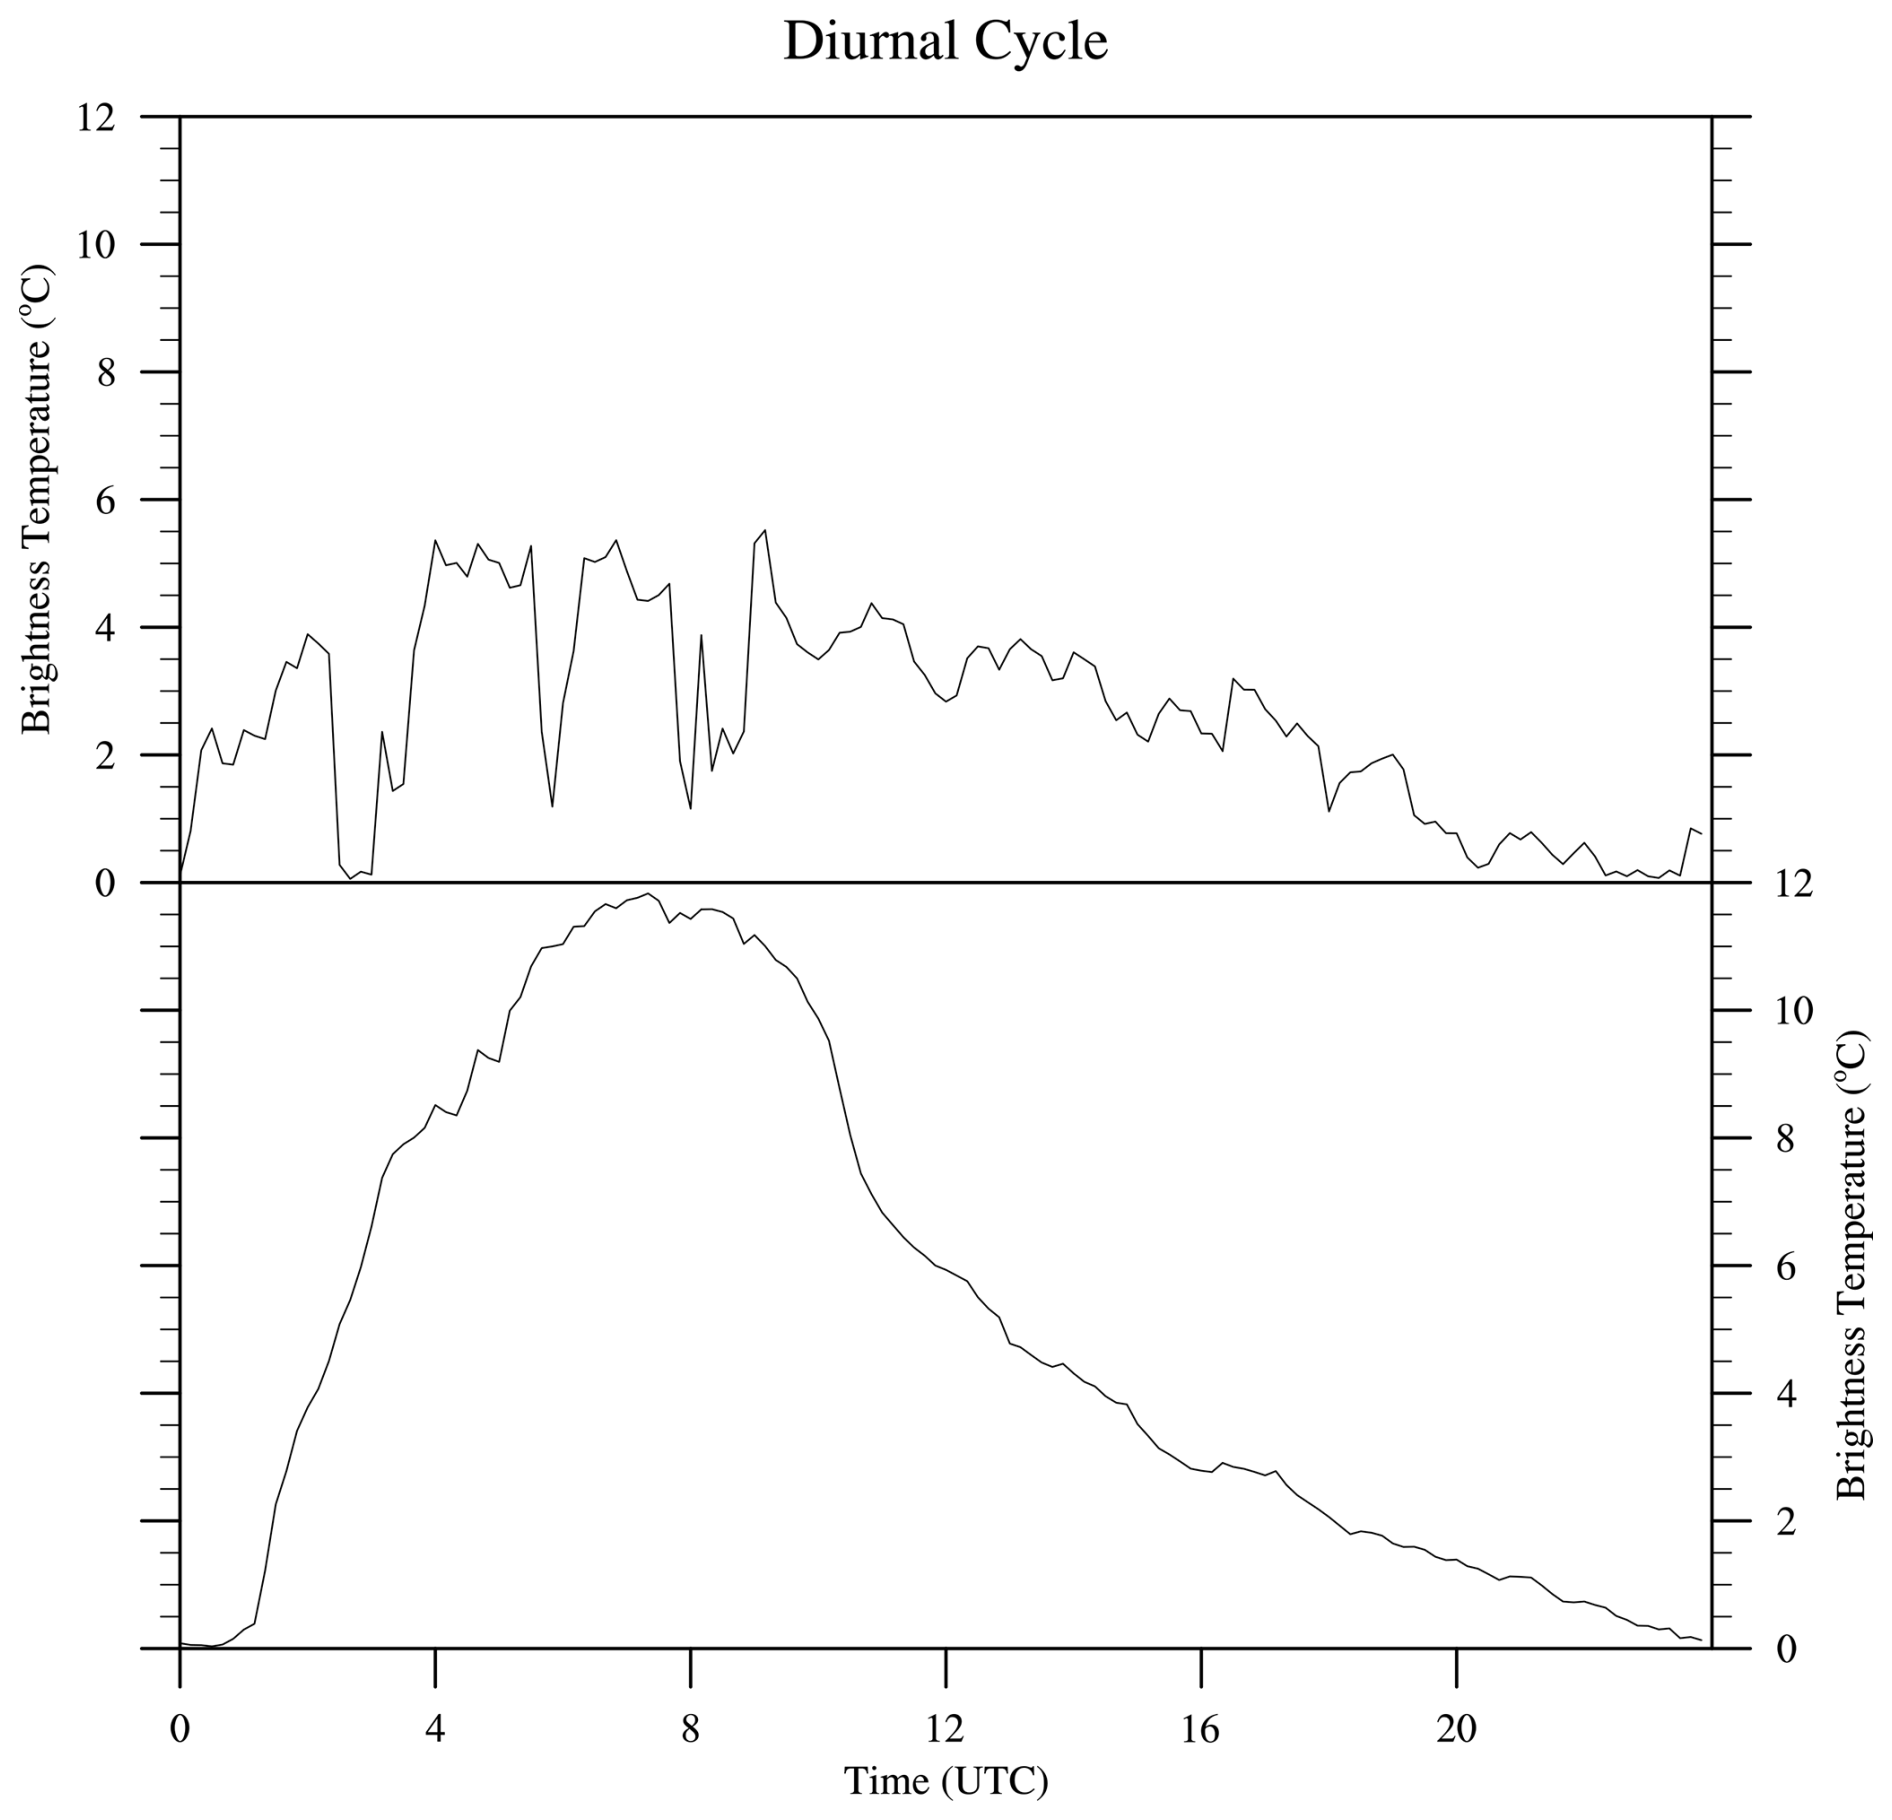
The spectral test utilizes the clear-sky IRBT diurnal cycle to detect cloud presence. During the dry season (e.g., November), distinct diurnal cycles of the IRBT are observed (Fig. 1b). During the wet season (e.g., June), the sky is frequently cloud-covered, resulting in higher IRBT values than those during the dry season, but the diurnal cycles can still be observed (Fig. 1a). The amplitude of the IRBT diurnal cycles during the dry seasons is stronger than those during the wet seasons, primarily driven by former stronger temperature diurnal cycles on clear days. This seasonal difference in IRBT diurnal cycles becomes more obvious after the normalization (Fig. 3).
On clear days, IRBT closely follows the diurnal temperature cycle, which remains relatively stable over short periods (e.g., several days). On cloudy days, observed IRBT includes additional contributions from clouds, deviating from the typical clear-sky diurnal pattern. Thus, detecting deviations from the clear-sky IRBT diurnal cycle is central to the cloud detection algorithm. Calculating the clear-sky IRBT diurnal cycle is the key component in the spectral test.
To address this, we developed a method for extracting the clear-sky IRBT diurnal cycle solely from infrared radiometer observations, without supplementary data. The method accounts for varying seasonal conditions, adjusting the temporal resolution of the clear-sky IRBT diurnal cycle to 20 min during the wet season and 10 min during other months. The steps are as follows:
-
Data Segmentation: For each target time point in the diurnal cycle, extract a corresponding sequence of IRBT observations from adjacent days. During the wet season, the extraction window is doubled to include more clear-sky data due to prolonged cloud cover.
-
Low-Value Selection: From the extracted sequence, select the lowest 5 % of IRBT values and calculate their average as the diurnal cycle value for the target time.
-
Sliding Calculation: Repeat the above process for each time point to construct the complete diurnal cycle.
In the step 2, the lowest 5 % of IRBT-30 values during the wet season, while 15 for other seasons, are selected for the calculation to mitigate cloud contamination. Here the 5 % setting is an empirical value, which cannot be justified under the current conditions without other supplementary observations, but works well in practice.
Figure 4 illustrates the extracted clear-sky IRBT diurnal cycles for 15 June (wet season) and 15 November (dry season). While both exhibit trends consistent with diurnal temperature variations, the winter cycle (November) shows a larger amplitude due to greater daily temperature differences. The summer cycle (June) exhibits fluctuations, likely due to residual cloud signals and potential errors from the normalization process. When the cloud covers throughout the day, the daily minimum IRBT occurs at any time. This may cause a local minimum value in the calculated diurnal cycle. To mitigate these issues, we use the maximum IRBT of the clear-sky diurnal cycle as the reference for the spectral test. This ensures robustness against false signals caused by cloud contamination or normalization errors.
Steps of the Spectral Test:
-
Derive the clear-sky IRBT diurnal cycle using the method described above.
-
Extract the maximum IRBT from the diurnal cycle, which is referred to as Max-IRBT_DC.
-
Detect cloud presence by comparing observed IRBT with the Max-IRBT_DC. When the Max-IRBT_DC exceeds 10 °C, the threshold is set to 15 °C; otherwise, the threshold is set to 150 % of the Max-IRBT_DC. If the observed IRBT exceeds the threshold, the sky is classified as cloudy; otherwise, it is clear-sky. The temporal resolution of the detection result is the same as that of the observed IRBT data, which is 2 s.
To account for special conditions such as fog, the threshold for cloud detection is set above the Max-IRBT_DC. This larger threshold inevitably introduces misjudgment. It may misclassify clouds with low optical depths at night as clear skies. This limitation is addressed by incorporating an additional detection method described in the next section.
3.3 Temporal Test
On cloudy days, variations in cloud properties, such as optical depth and cloud base height, introduce significant changes in ground-based infrared radiance. In contrast, clear-sky conditions result in relatively smooth IRBT curves. Figure 5a illustrates the normalized IRBT in November 2021, where clear-sky periods exhibit smooth fluctuations, while cloudy periods display pronounced variability.
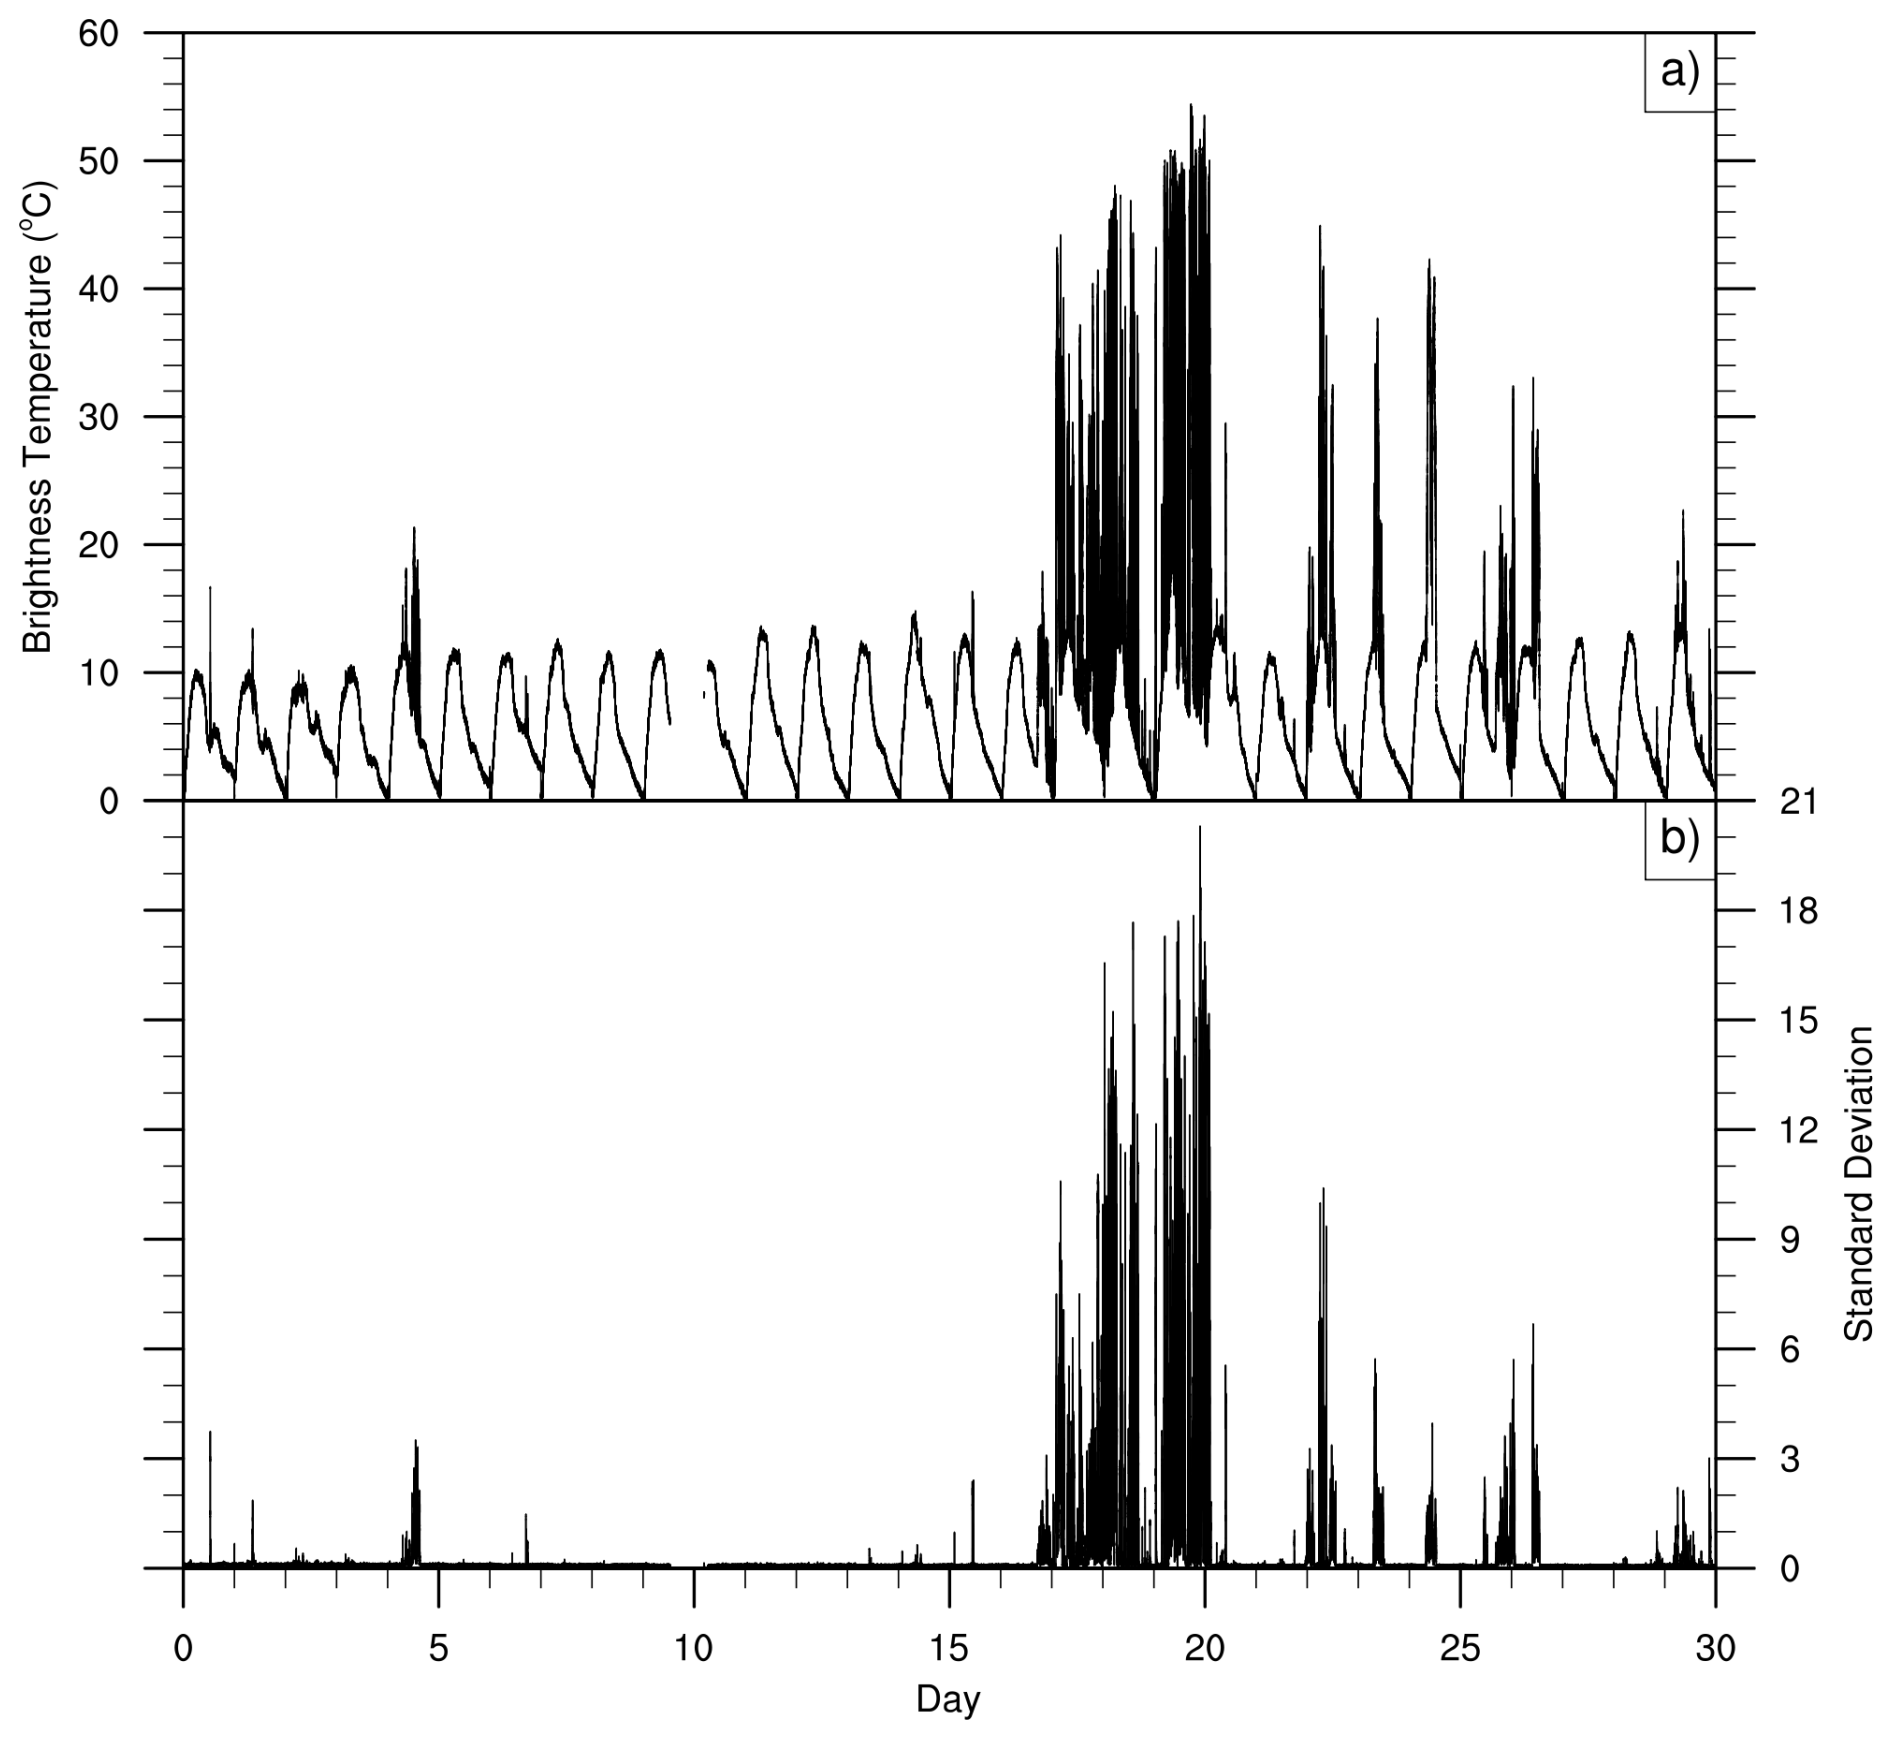
Figure 5The normalized infrared brightness temperatures (a) and the corresponding calculated standard deviations (b) in November 2021.
Based on these characteristics, a temporal variability-based method is developed to detect clouds. This approach uses the standard deviation of normalized IRBT as the criterion for cloud presence. When the standard deviation exceeds a specific threshold, the sky is classified as cloudy.
Figure 5b shows the sliding standard deviation of IRBT in November 2021, which aligns closely with the corresponding IRBT variations. For a more detailed demonstration, Fig. 6 presents normalized IRBT data for 23 November 2021 (Fig. 6a), along with the corresponding standard deviations (Fig. 6b). Under clear-sky conditions, the IRBT standard deviations remain around 0.1, whereas cloudy conditions exhibit significantly higher values, typically exceeding 0.3.
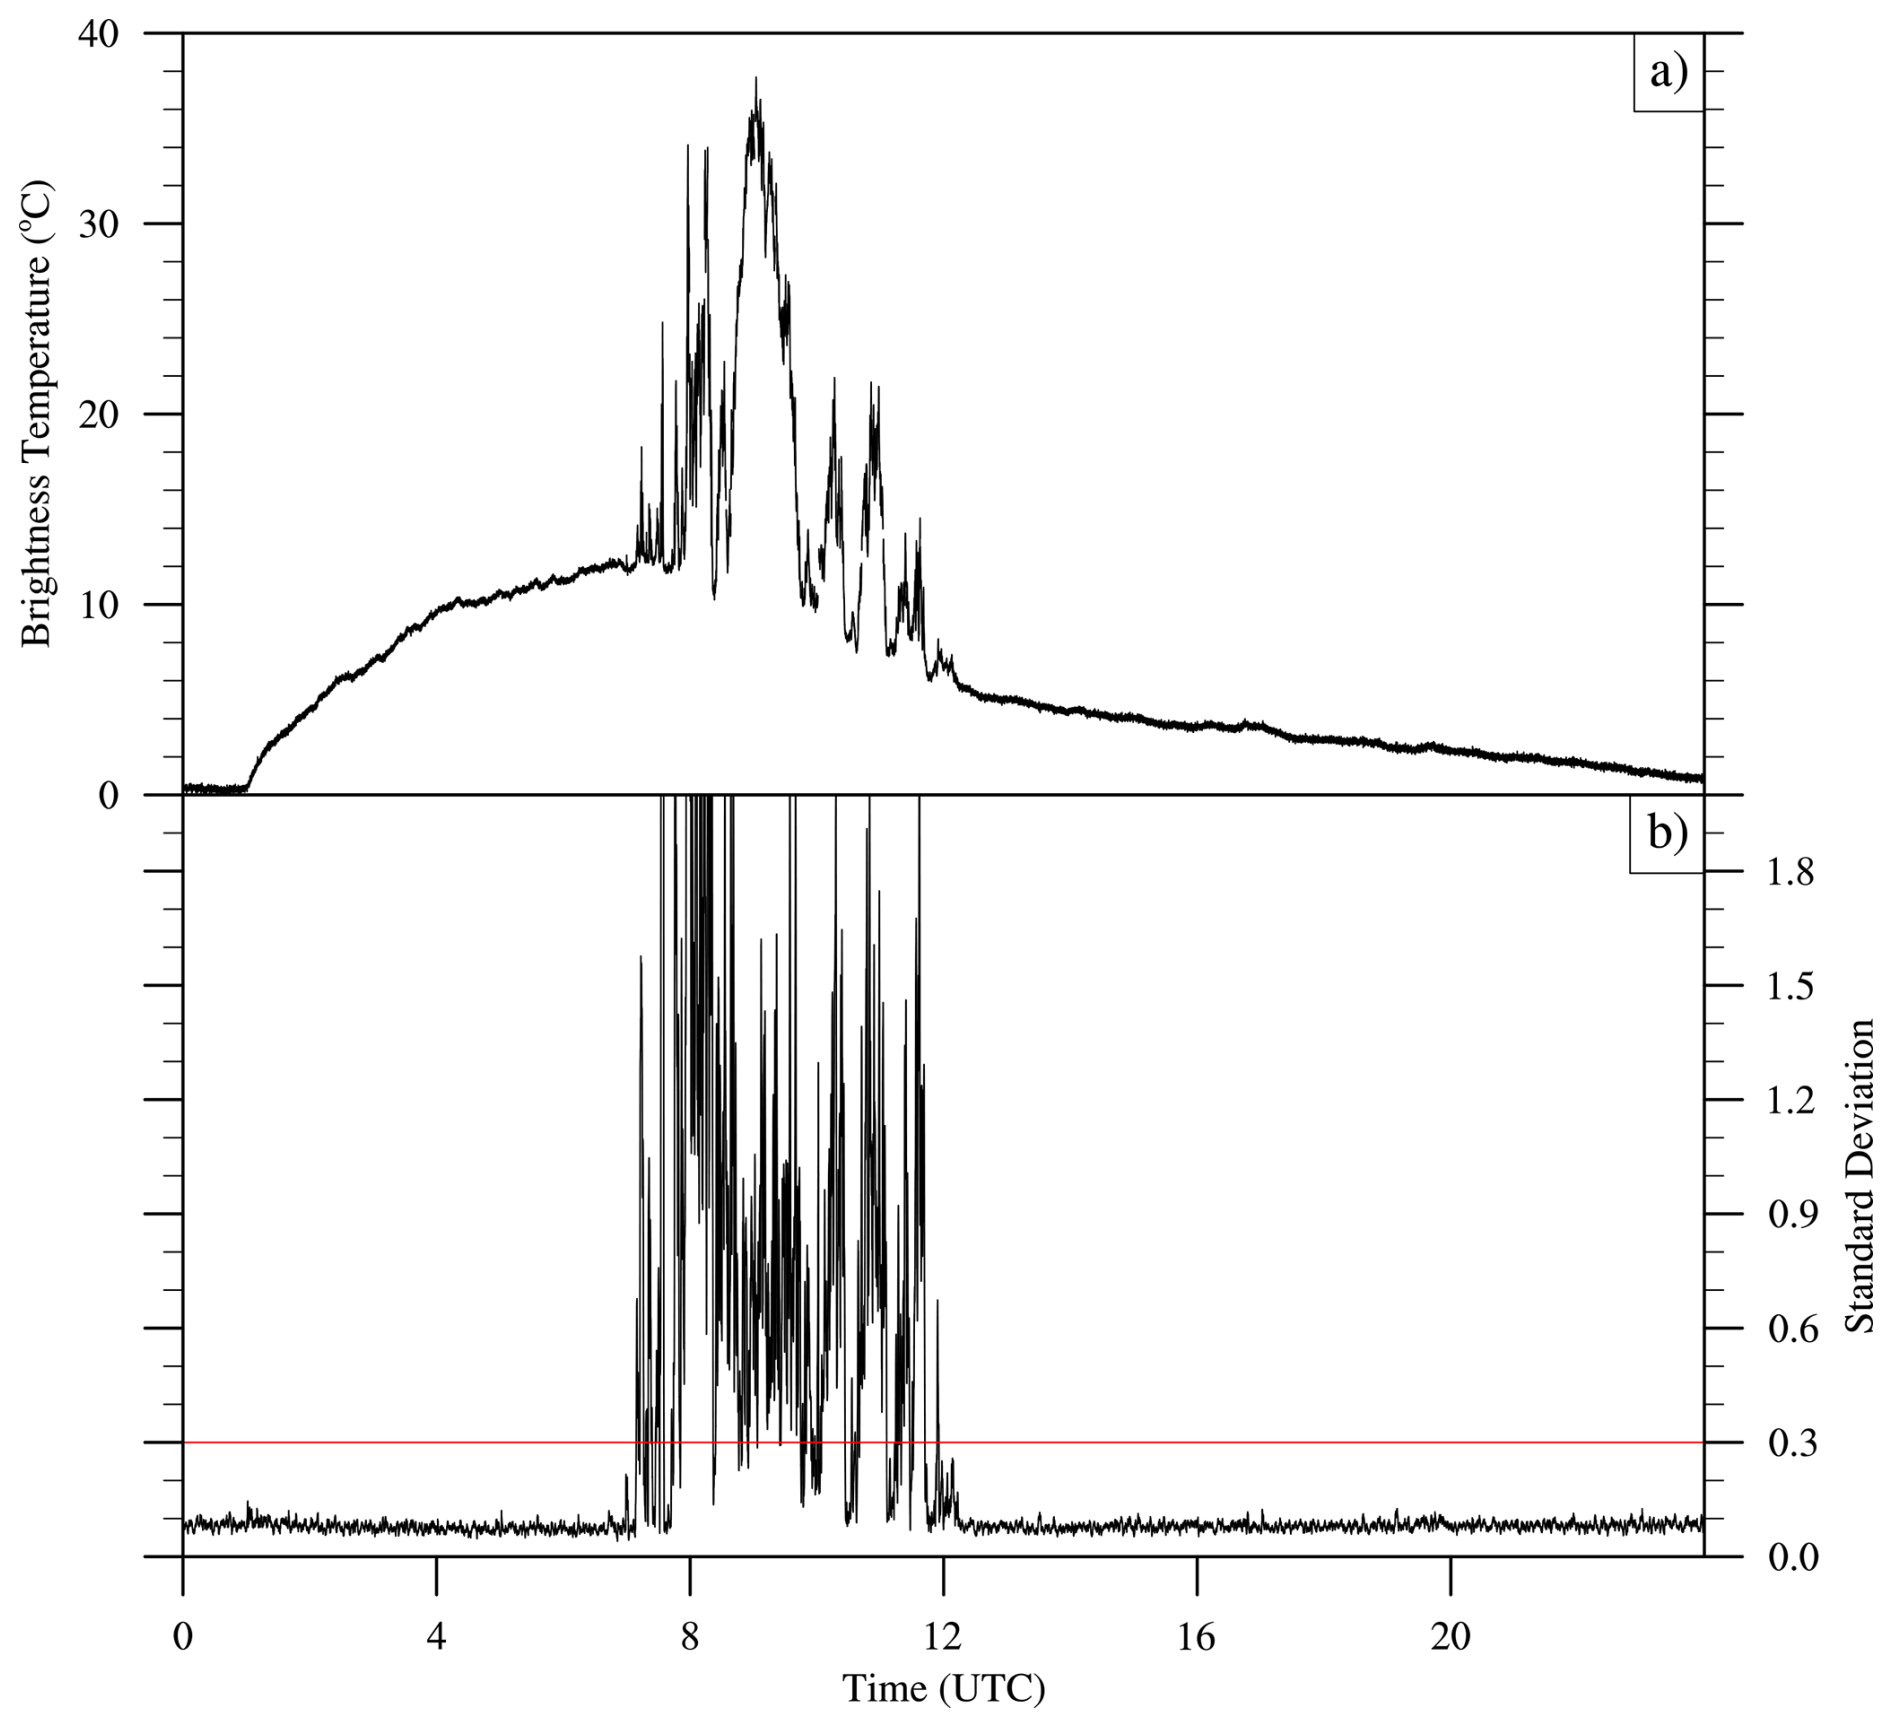
Figure 6The normalized infrared brightness temperatures (a) and the corresponding calculated standard deviations (b) on 23 November 2021.
A sensitivity test on the threshold for the temporal test is conducted. The testing thresholds are set as 0.2, 0.25, and 0.3. It is found that for the wet season, the choice of the three thresholds has little impact on the judgment due to significantly larger standard deviations associated with clouds. For winter, the selection of threshold settings may affect the judgment in only a small fraction of cases. However, due to the lack of other direct cloud observations, we cannot definitively confirm whether these small fluctuations in the standard deviation around 0.2–0.3 were caused by clouds or other factors. Based on the sensitivity analysis, a threshold of 0.3 is selected for cloud detection.
Steps of the Temporal Test:
-
Standard Deviation Calculation: The standard deviation of normalized IRBT is calculated over a sliding 1 min window. The temporal resolution of IRBT is 2 s. Each window contains 30 data points, ensuring sufficient statistical confidence.
-
Cloud Detection: If the calculated standard deviation exceeds 0.3, the sky is classified as cloudy; otherwise, it is classified as clear.
The temporal test is particularly effective in detecting clouds with small optical depths but significant temporal variability – scenarios that may be missed in the spectral test. However, it may misclassify stable clouds with small temporal variations, such as stratus clouds, as clear skies. Combining the temporal and spectral tests enhances the robustness of the overall cloud detection algorithm.
3.4 Overall Flowchart of the Cloud Detection Algorithm
The integrated cloud detection algorithm combines the spectral and temporal tests described in the above two sections. The workflow is summarized in Fig. 7 and involves the following steps:
-
Normalization of IRBT: Process the observation data to obtain normalized IRBT values, reducing the contamination from dust accumulation.
-
Spectral Test: Calculate the clear-sky IRBT diurnal cycle and extract its maximum value (Max-IRBT_DC). Set threshold to 15 °C if Max-IRBT_DC exceeds 10 °C; otherwise, set it to 150 % of Max-IRBT_DC. If the observed IRBT exceeds the threshold, the sky is classified as cloudy; otherwise, it is classified as clear.
-
Temporal Test: Calculate the sliding standard deviation of the normalized IRBT over a 1 min window. If the standard deviation exceeds 0.3, the sky is classified as cloudy; otherwise, it is classified as clear.
-
Final Judgment: Combine the results of the spectral and temporal tests. The sky is classified as clear only if both tests indicate clear-sky conditions. Otherwise, it is classified as cloudy.
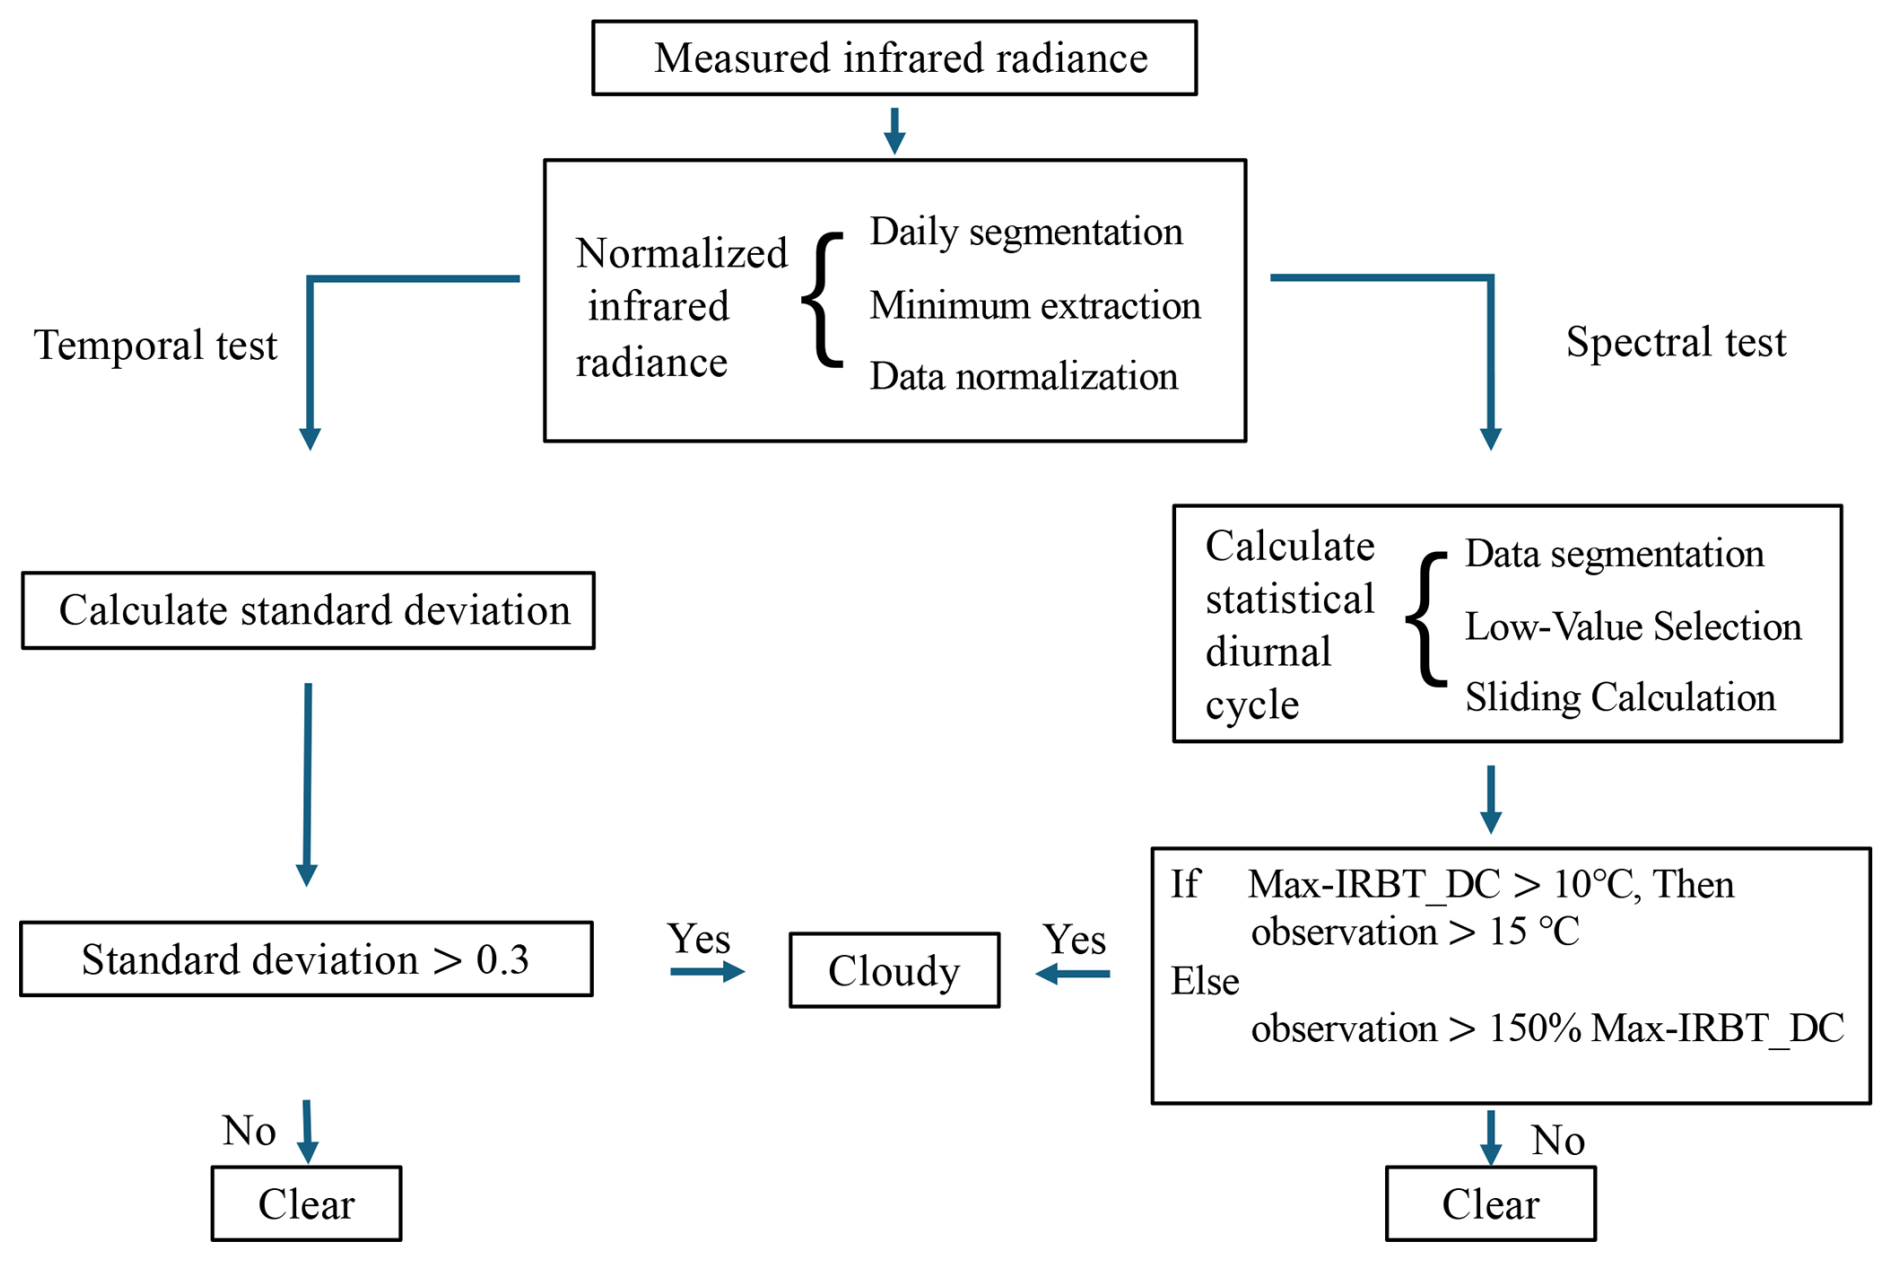
Figure 8 illustrates the application of the algorithm using observational data on 24 November 2021. The observed IRBT (Fig. 8a), normalized IRBT (Fig. 8b), corresponding standard deviations (Fig. 8c), and clear-sky IRBT diurnal cycle (Fig. 8d) are shown. The final detection results are presented in Fig. 9b, where clear-sky and cloudy conditions are represented by blue and red lines, respectively. The results align well with IRBT variations, accurately capturing detailed changes in sky conditions, such as those occurring around 08:00 am. This demonstrates the algorithm's effectiveness in identifying cloud presence under varying conditions.
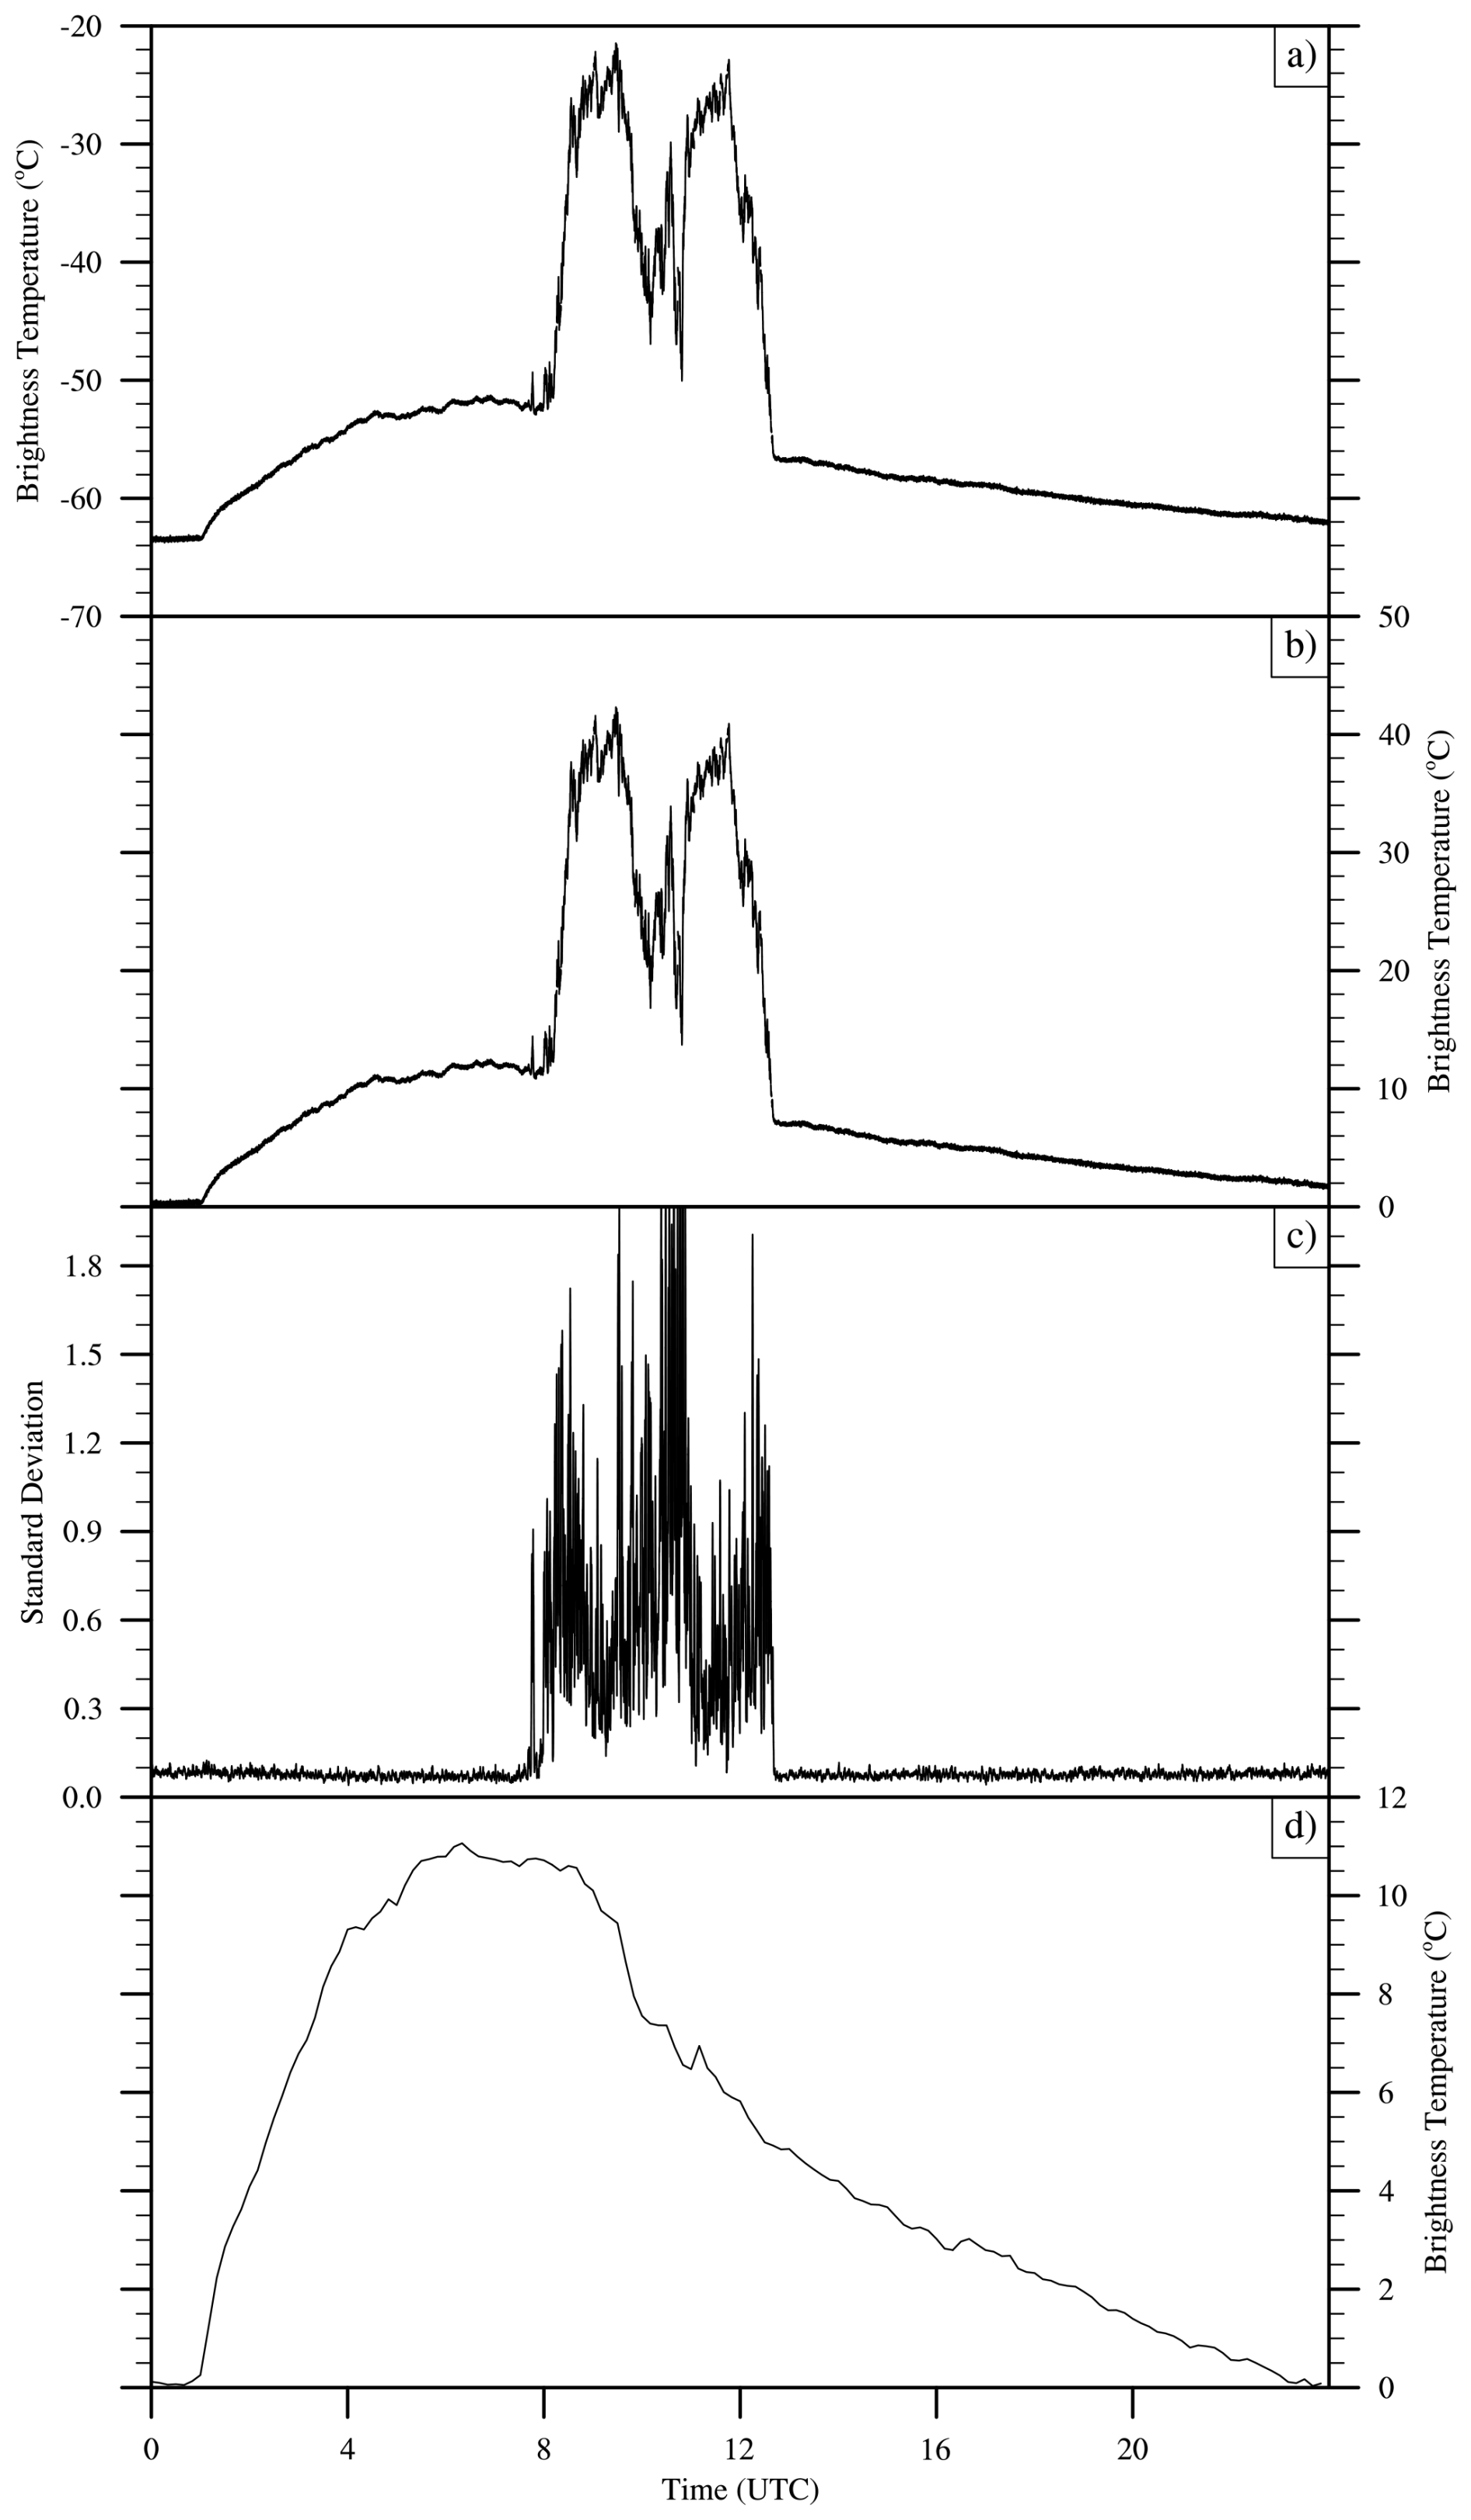
Figure 8The observations of IRBT (a), the normalized infrared brightness temperatures (b), standard deviation (c), and clear-sky IRBT diurnal cycle (d) on 24 November 2021.
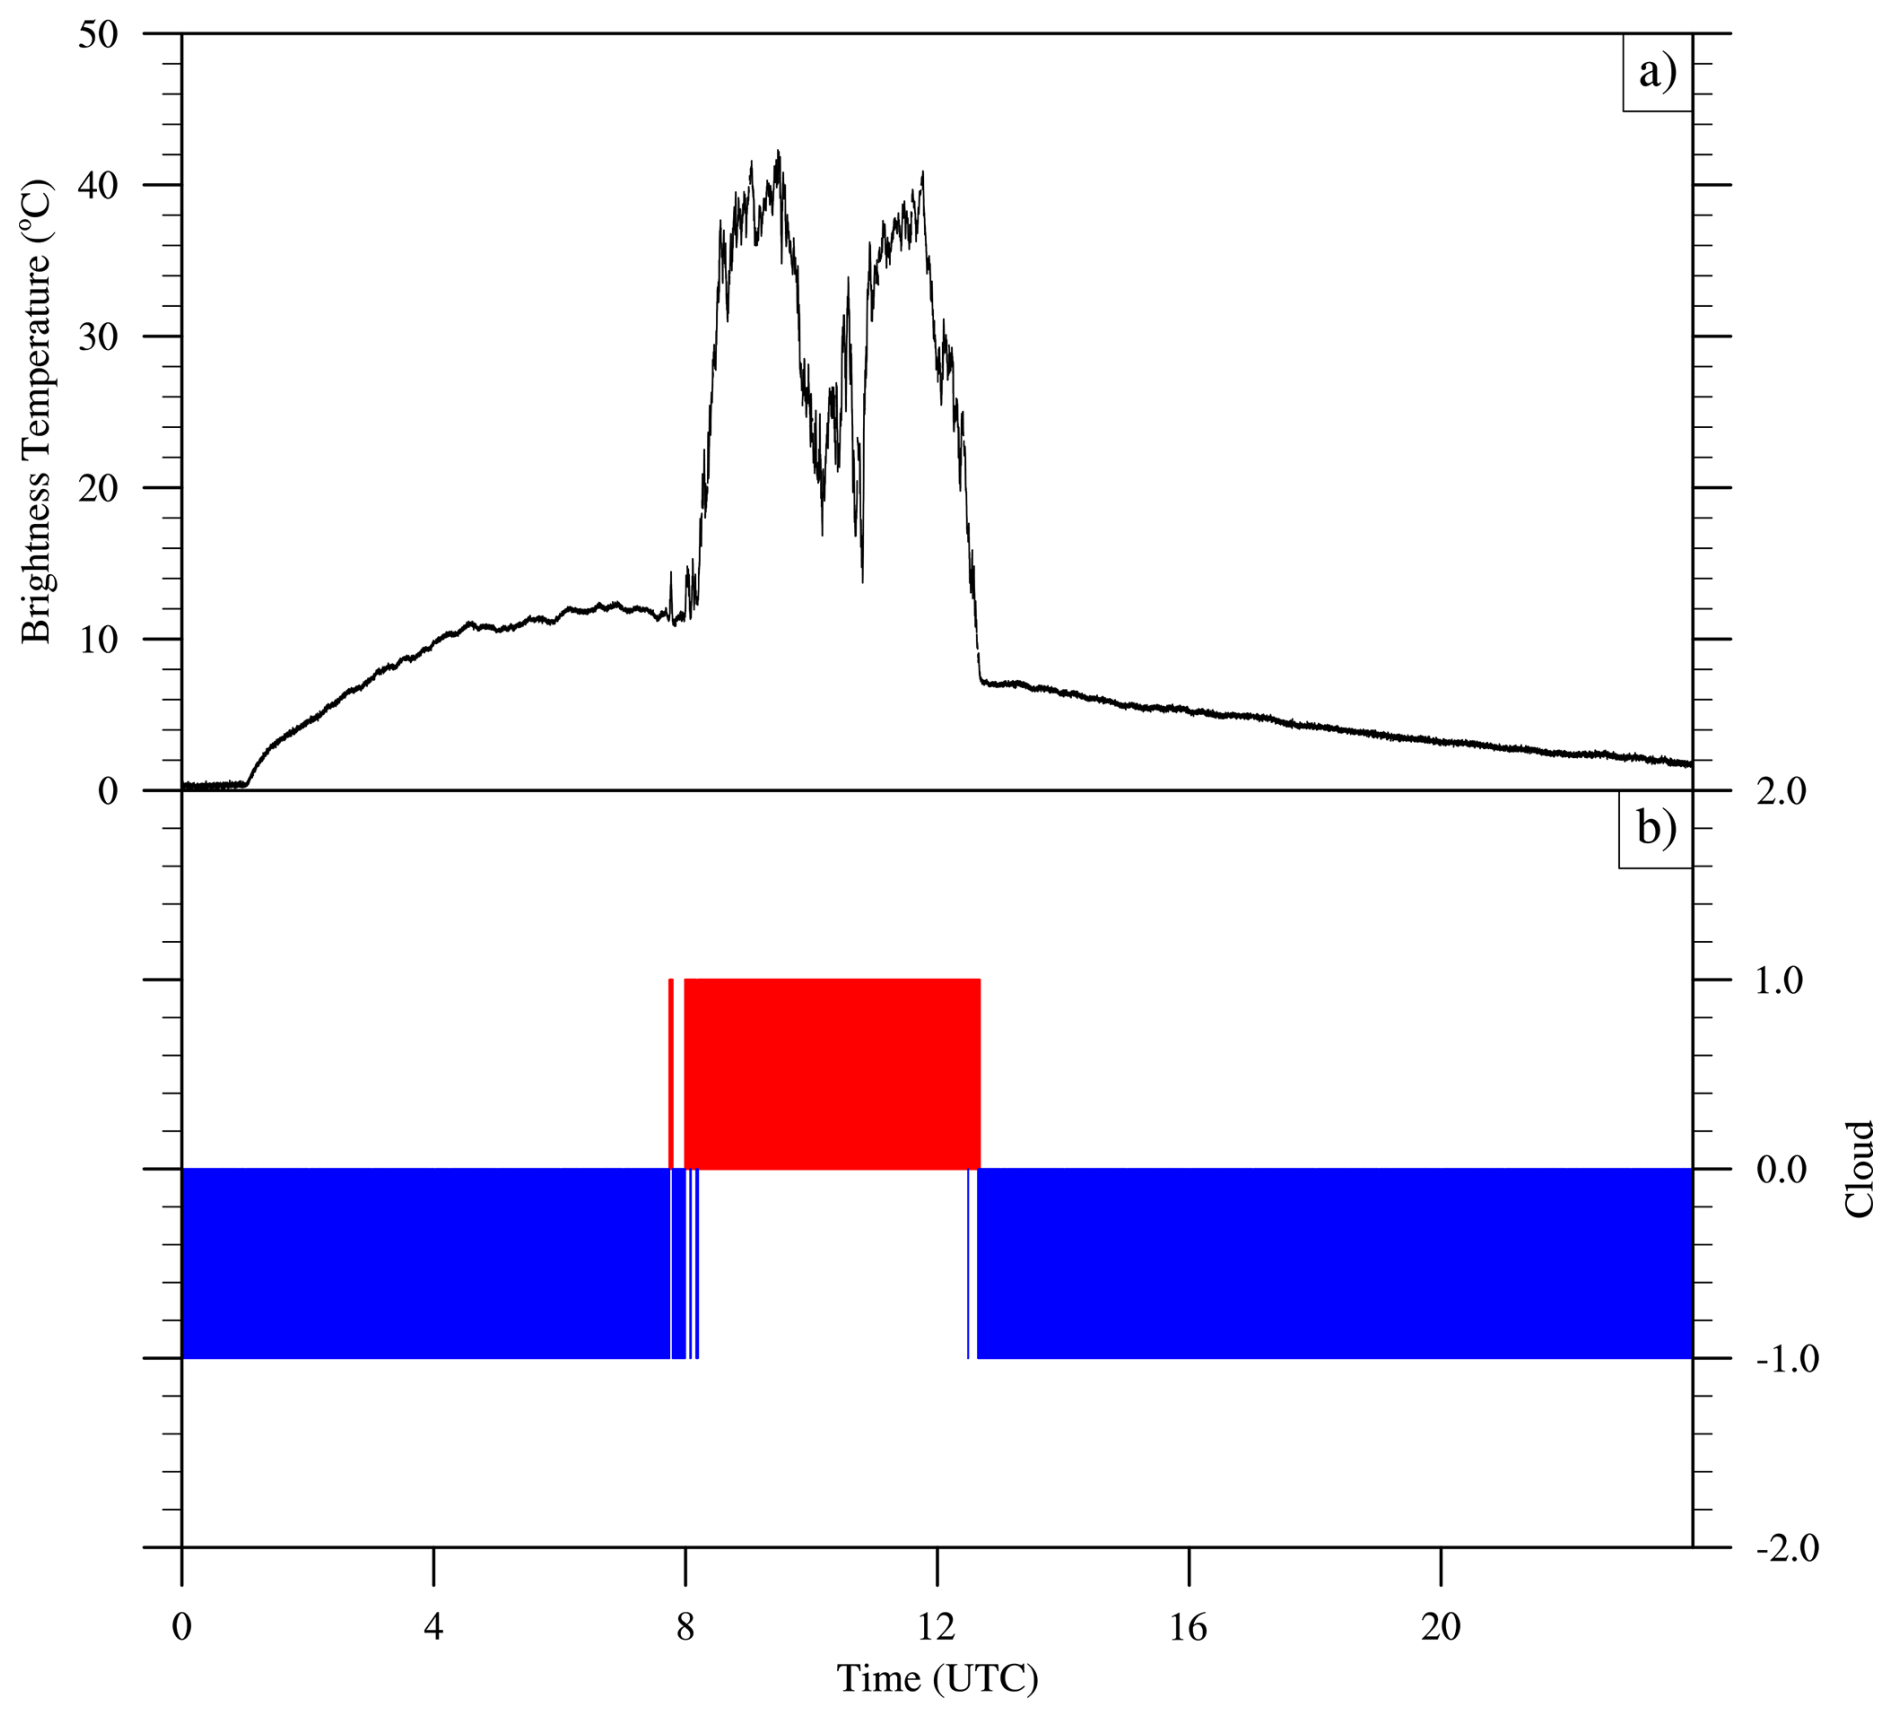
Figure 9The normalized infrared brightness temperatures (a) and the corresponding cloud results (b) on 24 November 2021. Plus one (red line) and minus one (blue line) represent cloudy and clear-sky respectively in panel (b).
Since no other relevant meteorological instruments are deployed in Tibet University, the accuracy of the cloud detection algorithm is assessed by comparing with the radiosonde data provided by the Lhasa Meteorological Bureau. The radiosonde launch site, located 4 km from the infrared radiometer, conducts measurements twice daily at 00:00 and 12:00 UTC.
The high-resolution vertical profile of relative humidity from radiosonde can be used to detect the presence and vertical structure of clouds (Wang et al., 1999; Cai et al., 2014; Li et al., 2021). If the corresponding relative humidity is larger than a certain threshold, it is determined that there are clouds at that height (Wang et al., 1999; Zhou and Ou, 2010). The thresholds were set be larger than 80 % in previous studies (Zhang et al., 2010; Zhou and Ou, 2010; Cai et al., 2014; Li et al., 2021). Due to the different climates, the threshold for cloud detection in different seasons and regions should be selected respectively (Zhang et al., 2010). Considering that the climate in Lhasa is generally drier, the threshold for cloud detection in this paper is chosen as 80 % in wet seasons from June to August, and 70 % for the other times.
In addition to the selection of the threshold value, the following three aspects are also considered in the comparison:
-
The main contribution to ground-based infrared radiation comes from the troposphere. Meanwhile, clouds are mainly concentrated in the troposphere. On the other hand, the sonde balloon drifts with the wind in the rising process, which may be far away from the radiometer. Therefore, the relative humidity below 10 km is selected for the comparison.
-
The sonde balloon needs some time to acquire the atmospheric information. Therefore, the corresponding infrared observation time for the comparison is selected 20 min around the sonde time.
-
Considering the short-term noise and other impacts, the infrared cloud judgment should keep a certain time in the comparison. If the judgment cannot satisfy the time, the sky is judged to be clear for infrared cloud detection. The temporal resolution of the infrared radiometer is 2 s. In the comparison, the cloud judgments must exceed 30 times during the sonde time, which means the cloud exists for more than 1 min.
Figure 10 shows the comparison results over 13 months (June 2021–June 2022). The red and blue boxes represent radiosonde launch times at 00:00 and 12:00 UTC, respectively. The agreement percentage reflects the proportion of consistent cloud detection results between the two methods relative to total valid observations each month.
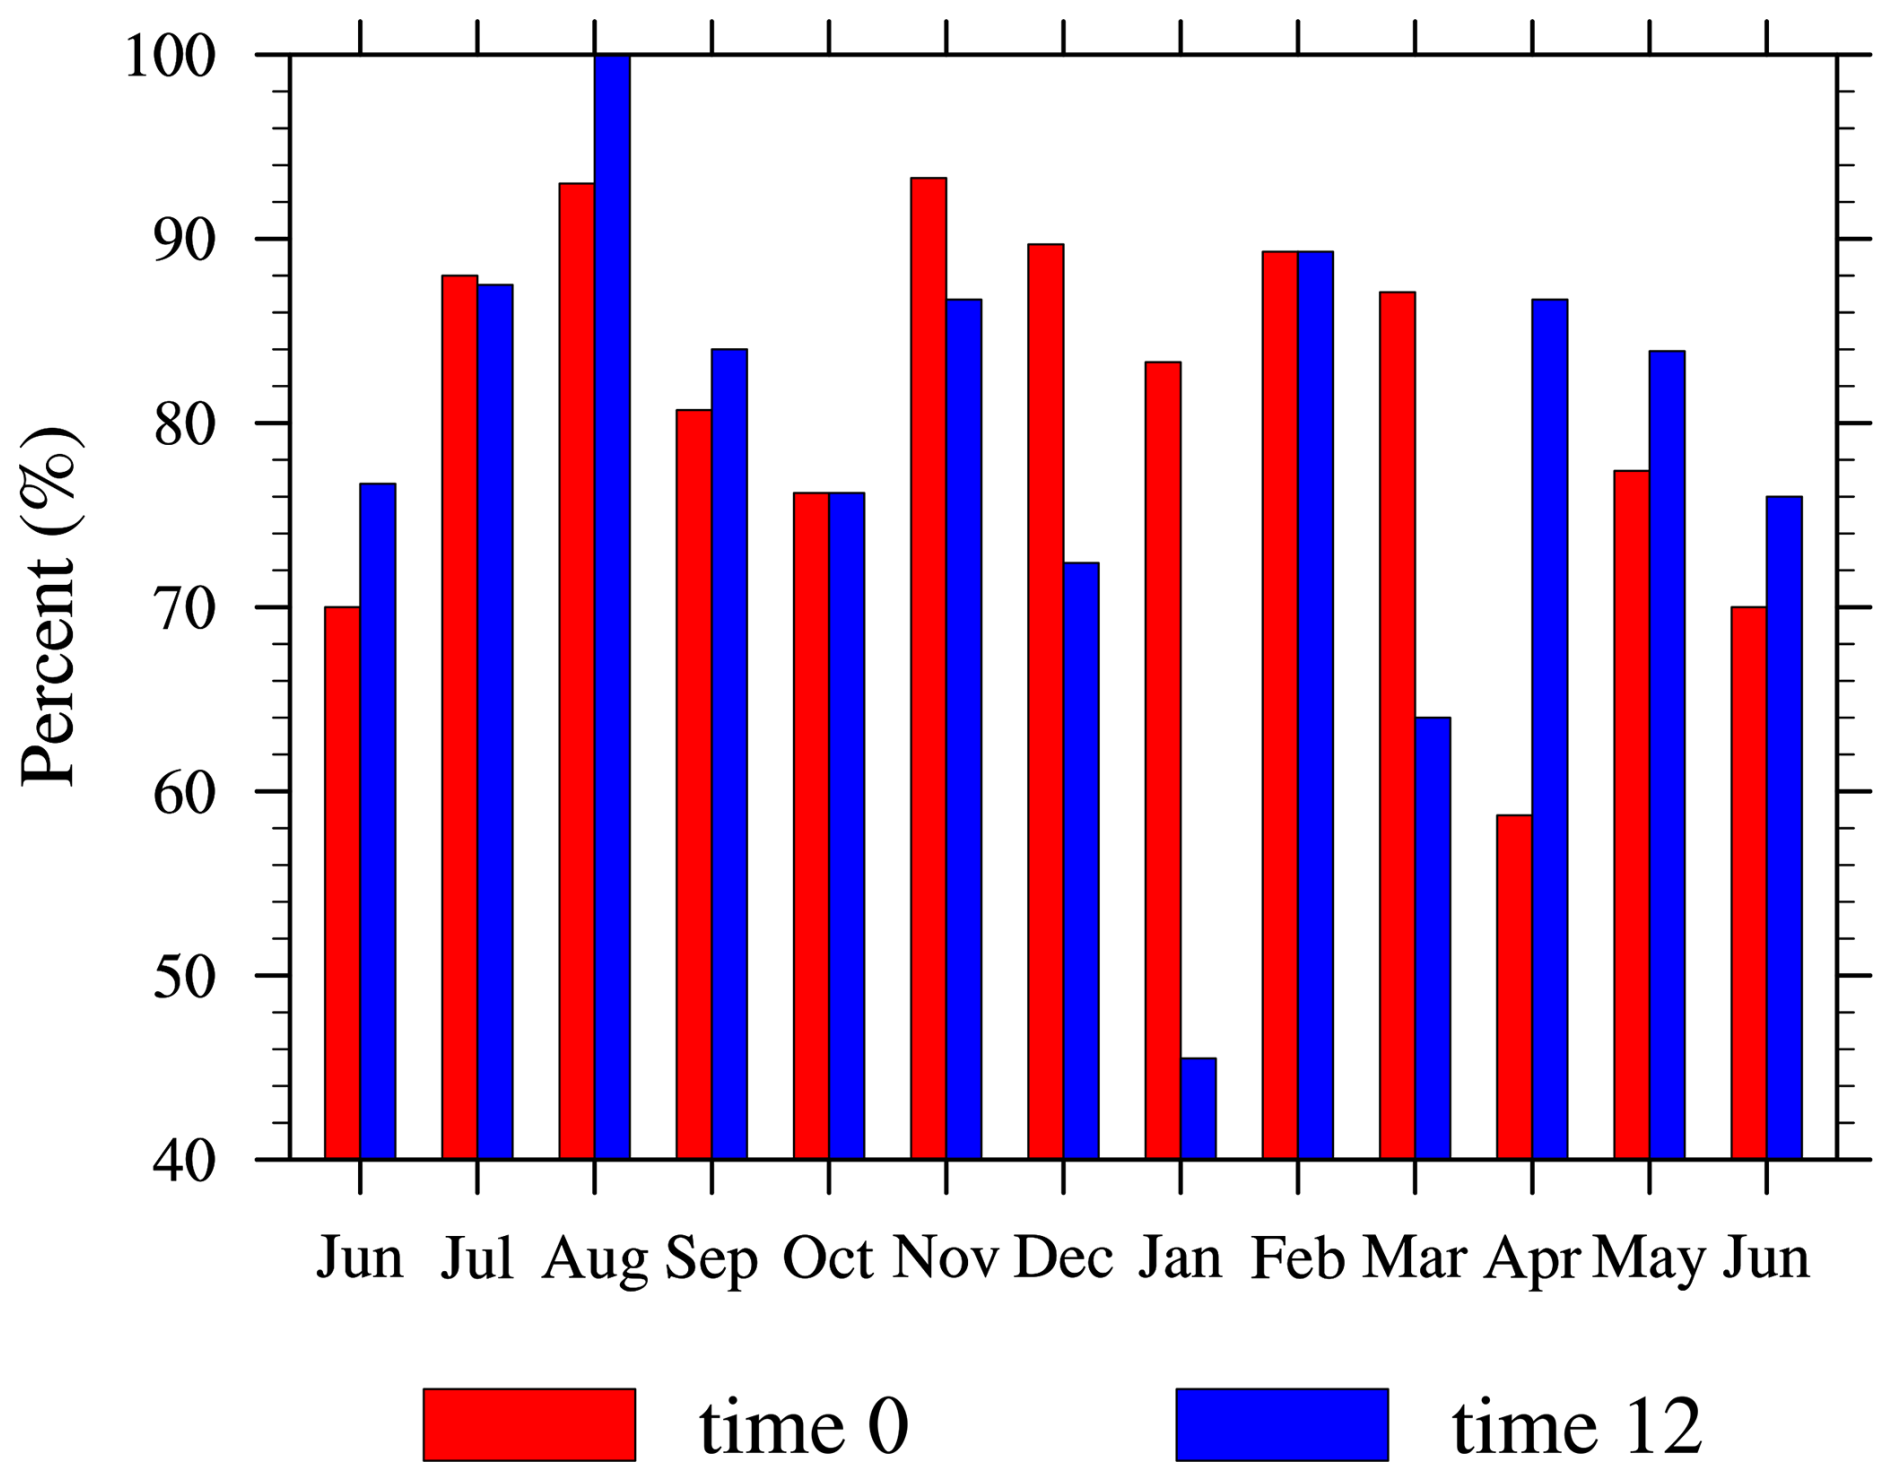
Figure 10The comparison results between infrared radiometer and radiosonde. Red and blue boxes represent the radiosonde launch times 00:00 and 12:00 UTC. The agreement percentage reflects the proportion of consistent cloud detection results between the two methods relative to total valid observations each month.
Overall, the algorithm performs well, achieving agreement rates above 70 % in most months. Some winter times show slightly reduced performance, with agreement rates around 50 %. An analysis of inconsistent results reveals the following primary causes:
-
Spatial Inconsistency: The infrared radiometer observes radiation from the zenith, detecting only clouds within its field of view. Radiosondes, which drift with the wind during ascent, may observe atmospheric profiles outside the radiometer's coverage. Additionally, the 4 km distance between the radiometer and the radiosonde launch site increases the likelihood of discrepancies, particularly for clouds with small horizontal scales.
-
Temporal Inconsistency: The exact radiosonde launch time can vary, and balloon ascent takes time. Rapid cloud dynamics may lead to misalignment between the radiometer and radiosonde observations.
-
Threshold Errors in Radiosonde Detection: No statistical analyses of cloud detection thresholds for relative humidity profiles have been conducted in Lhasa. Seasonal and weather-dependent variations in threshold values could contribute to misjudgments in radiosonde-based cloud detection.
Despite these limitations, the algorithm demonstrates robust performance, particularly during the wet season, underscoring its effectiveness for cloud detection on the Tibetan Plateau.
This study develops an integrated cloud detection algorithm designed for the ground-based infrared radiometer, specifically addressing the challenges of observations on the Tibetan Plateau. The algorithm combines spectral and temporal tests, leveraging their complementary strengths to improve cloud detection accuracy. It is notable for relying solely on infrared radiometer data, eliminating the need for supplementary observational instruments – a significant advancement over previous methods.
A critical contribution of this work is the development of a normalization method to address contamination caused by dust accumulation on the radiometer lens. This issue, exacerbated by the arid and windy climate of the Tibetan Plateau, has been largely overlooked in previous studies. By normalizing the IRBT data on a daily basis, this method effectively mitigates the impact of dust contamination, ensuring reliable inputs for the algorithm.
The spectral test identifies cloud presence by analyzing deviations from the clear-sky IRBT diurnal cycle, while the temporal test evaluates the variability of IRBT over short time scales. Although each test has own limitations, such as misclassifying clouds with thin optical depths or small variability, their integration provides a robust framework for cloud detection. This integration allows the algorithm to overcome individual shortcomings, offering improved performance in capturing cloud signals.
Validation of the algorithm was conducted using radiosonde data from the Lhasa Meteorological Bureau over 13 months. Agreement rates exceeded 70 % in most months, demonstrating the algorithm's effectiveness, particularly during the wet season. However, reduced wintertime performance highlights challenges related to spatial and temporal inconsistencies. For instance, the drift of radiosonde balloons and the fixed zenithal field of view of the radiometer may lead to discrepancies, particularly for clouds with small horizontal scales. Furthermore, the lack of statistical analyses for cloud detection thresholds in Lhasa introduces potential errors in the radiosonde-based comparisons. These limitations underscore the need for improved validation strategies.
The integrated algorithm proposed in this study effectively detects a wide range of cloud signals under most weather conditions. Nevertheless, further evaluations and improvements are still needed. First, misclassifications may occur under rapidly evolving phenomena such as fog or blowing dust. Future work should incorporate more comprehensive meteorological datasets to better assess the algorithm's performance under these conditions. Second, a detailed evaluation across different cloud types should be conducted using high-accuracy cloud observations. Third, the current thresholds are primarily determined empirically, which may introduce misjudgments; validation against accurate cloud measurements will help optimize these settings. Finally, dedicated field experiments comparing this approach with alternative algorithms that employ dynamic thresholds could provide additional insights and further enhance the robustness of the method.
Looking ahead, a new dual millimeter-wavelength cloud radar and infrared imaging detector (MWII), supported by the Ground-based Space Environment Monitoring Network project, has been deployed at the Yangbajing Whole Neutral Atmospheric Observing Station. The MWII, which integrates active radar with a passive infrared radiometer, provides detailed information on cloud vertical structure and optical properties. In addition, the station will be equipped with a suite of atmospheric state observation instruments. These comprehensive observational datasets will support the four directions of future work outlined above, ensuring greater accuracy and broader applicability of the algorithm under diverse atmospheric conditions.
The data shown in the paper is available on request from the corresponding author.
LP and YW led the paper writing, LP and YB made the measurements, LP and YW made the calculations, and all co-authors participated on the writing and commenting the manuscript.
The contact author has declared that none of the authors has any competing interests.
Publisher's note: Copernicus Publications remains neutral with regard to jurisdictional claims made in the text, published maps, institutional affiliations, or any other geographical representation in this paper. While Copernicus Publications makes every effort to include appropriate place names, the final responsibility lies with the authors. Views expressed in the text are those of the authors and do not necessarily reflect the views of the publisher.
We thank Tibet University for the provision of the observation site and maintenance support. We acknowledge the use of data from the Chinese Meridian Project.
This research has been supported by the Strategic Priority Research Program of Chinese Academy of Sciences (grant no. XDA0470301), National Natural Science Foundation of China (grant no. 42175164) and Basic Scientific Research Project of Institute of Atmospheric Physics during the 14th Five-year Plan period.
This paper was edited by Yuanjian Yang and reviewed by two anonymous referees.
Ahn, M.-H., Han, D., Won, H. Y., and Morris, V.: A cloud detection algorithm using the downwelling infrared radiance measured by an infrared pyrometer of the ground-based microwave radiometer, Atmos. Meas. Tech., 8, 553–566, https://doi.org/10.5194/amt-8-553-2015, 2015.
Bao, S., Letu, H., Zhao, J., Shang, H., Lei, Y., Duan A., Chen, B., Bao, Y., He, J., Wang, T., Ji, D., Tana, G., and Shi, J.: Spatiotemporal distributions of cloud parameters and their response to meteorological factors over the Tibetan Plateau during 2003-2015 based on MODIS data, Int. J. Climatol., 39, 532–543, https://doi.org/10.1002/joc.5826, 2019.
Bo, Y., Wang, Y., Li, J., and Wang, C.: Temporal and spatial variation features of cloud water and its relation to precipitation over the Tibetan Plateau, J. Glaciol. Geocryol., 38, 1679–1690, https://doi.org/10.7522/j.issn.1000-0240.2016.0195, 2016.
Brocard, E., Schneebeli, M., and Matzlelr, C.: Detection of cirrus clouds using infrared radiometery, IEEE T. Geosci. Remote, 49, 595–602, https://doi.org/10.1109/TGRS.2010.2063033, 2010
Cadeddu, M. P. and Turner, D. D.: Evaluation of water permittivity models from ground-based observations of cold clouds at frequencies between 23 and 170 GHz, IEEE T. Geosci. Remote, 49, 2999–3008, https://doi.org/10.1109/TGRS.2011.2121074, 2011.
Cai, M., Ou, J., Zhou, Y., Yang, Q., and Cai, Z.: Discriminating cloud area by using L-band sounding data, Chinese Journal of Atmospheric Sciences, 38, 213–222, https://doi.org/10.3878/j.issn.1006-9895.2013.12193, 2014 (in Chinese).
Duan, A. and Wu, G.: Role of the Tibetan Plateau thermal forcing in the summer climate patterns over subtropical Asia, Climate Dynam., 24, 793–807, https://doi.org/10.1007/s00382-004-0488-8, 2005.
Duan, A. and Wu, G.: Change of cloud amount and the climate warming on the Tibetan Plateau, Geophys. Res. Lett., 33, L22704, https://doi.org/10.1029/2006gl027946, 2006.
Duan, A., Hu, D., Hu, W., and Zhang, P.: Precursor Effect of the Tibetan Plateau Heating Anomaly on the Seasonal March of the East Asian Summer Monsoon Precipitation, J. Geophys. Res., 125, e2020JD032948, https://doi.org/10.1029/2020JD032948, 2020.
Fu, Y., Ma. Y., Zhong. L., Yang, Y., Guo, X., Wang, C., Xu, X., Yang, K., Xu, X., Liu, L., Fan, G., Li, Y., and Wang, D.: Land-surface processes and summer-cloud-precipitation characteristics in the Tibetan Plateau and their effects on downstream weather: a review and perspective, Natl. Sci. Rev., 7, 500–515, https://doi.org/10.1093/nsr/nwz226, 2020.
Ge, J., You, Q., and Zhang, Y.: Effect of Tibetan Plateau heating on summer extreme precipitation in eastern China, Atmos. Res., 218, 364–371, https://doi.org/10.1016/j.atmosres.2018.12.018, 2019.
Hewison, T. J.: 1D-VAR retrieval of temperature and humidity profiles from a ground-based microwave radiometer, IEEE T. Geosci. Remote, 45, 2163–2168, https://doi.org/10.1109/TGRS.2007.898091, 2007.
Huo, J., Bi, Y. H., Liu, B., Han, C. Z., and Duan, M. Z.: A dual-frequency cloud radar for observations of precipitation and cloud in Tibet: Description and preliminary measurements, Remote Sensing, 13, 4685, https://doi.org/10.3390/rs13224685, 2021.
Li, Q., Cai, M., Zhou, Y., Tang, Y., and Ou, J.: Characteristics of Cloud Vertical Distribution Based on Cloud Identification by Radiosonde, Chinese Journal of Atmospheric Sciences, 45, 1161–1172, https://doi.org/10.3878/j.issn.1006-9895.2105.19246, 2021 (in Chinese).
Liu, B., Huo, J., Lyu, D., and Wang, X.: Assessment of FY-4A and Himawari-8 cloud top height retrieval through comparison with ground-based millimeter radar at sites in Tibet and Beijing, Adv. Atmos. Sci., 38, 1334–1350, https://doi.org/10.1007/s00376-021-0337-2, 2021.
Luo, J., Pan, Y., Su, D., Zhong, J., Wu, L., Zhao, W., Hu, X., Qi, Z., Lu, D., and Wang, Y.: Innovative cloud quantification: deep learning classification and finite-sector clustering for ground-based all-sky imaging, Atmos. Meas. Tech., 17, 3765–3781, https://doi.org/10.5194/amt-17-3765-2024, 2024.
Ma, Q., You, Q., Ma, Y., Cao, Y., Zhang, J., Niu, M., and Zhang, Y.: Changes in cloud amount over the Tibetan Plateau and impacts of large-scale circulation, Atmos. Res., 249, 105332, https://doi.org/10.1016/j.atmosres.2020.105332 2021
Song, X. Q., Zhai, X. C., Liu, L. P., and Wu, S. H.: Lidar and ceilometer observations and comparisons of atmospheric cloud structure at Nagqu of Tibetan Plateau in 2014 Summer, Atmosphere, 8, 9, https://doi.org/10.3390/atmos8010009, 2017.
Sutter, M., Dürr, B., and Philipona, R.: Comparison of two radiation algorithms for surface-based cloud-free sky detection, J. Geophys. Res., 109, D17202, https://doi.org/10.1029/2004JD004582, 2004.
Turner, D. D.: Improved ground-based liquid water path retrievals using a combined infrared and microwave approach, J. Geophys. Res., 112, D15204, https://doi.org/10.1029/2007JD008530, 2007.
Wang, J., Rossow, W. B., Uttal, T., and Rozendaal, M.: Variability of cloud vertical structure during ASTEX observed from a combination of rawinsonde, radar, ceilometer, and satellite, Mon. Wea. Rev., 127, 2484–2502, https://doi.org/10.1175/1520-0493(1999)127<2484:VOCVSD>2.0.CO;2, 1999.
Wang, Y. J., Zeng, X. B., Xu, X. D., Welty, J., Lenschow, D. H., Zhou, M. Y., and Zhao, Y.: Why are there more summer afternoon low clouds over the Tibetan Plateau compared to eastern China?, Geophys. Res. Lett., 47, e2020GL089665, https://doi.org/10.1029/2020gl089665, 2020.
Wu, C. and Chou, M.: Tibetan Plateau westerly forcing on the cloud amount over Sichuan Basin and the early Asian summer monsoon, J. Geophys. Res.-Atmos., 118, 7558–7568, https://doi.org/10.1002/jgrd.50580, 2013.
Wu, G. and Zhang, Y.: Tibetan Plateau Forcing and the timing of the Monsoon Onset over South Asia and the South China Sea, Mon. Weather Rev., 126, 913–927, https://doi.org/10.1175/1520-0493(1998)126<0913:TPFATT>2.0.CO;2, 1998.
Wu, Y., Gao, J., and Zhao, A.: Cloud properties and dynamics over the Tibetan Plateau – A review, Earth-Sci. Rev., 248, 104633, https://doi.org/10.1016/j.earscirev.2023.104633, 2024.
Xu, J., Hou, S., Qin, D., Kang, S., Ren, J., and Ming, J.: Dust storm activity over the Tibetan Plateau recorded by a shallow ice core from the north slope of Mt. Qomolangma (Everest), Tibet-Himal region, Geophys. Res. Lett., 34, L17504, https://doi.org/10.1029/2007GL030853, 2007.
Yan, Y. F. and Liu, Y. M.: Vertical structures of convective and stratiform clouds in boreal summer over the Tibetan Plateau and its neighboring regions, Adv. Atmos. Sci., 36,1089–1102, https://doi.org/10.1007/s00376-019-8229-4, 2019.
Yi, M. J.: Differences in cloud vertical structures between the Tibetan Platea and Eastern China Plains during rainy season as measured by CloudSat/CALIPSO, Advances in Meteorology, 6292930, https://doi.org/10.1155/2019/6292930,2019.
Zhang, H. and Tang, X.: Variation Trends of Climate and Dust Days in Lhasa and Their Relationship, Tibet Science and Technology, 2002, 51–52, https://doi.org/10.3969/j.issn.1004-3403.2002.12.023, 2002 (in Chinese).
Zhang, J., Chen, H., Li, Z., Fan, X., Peng, L., Yu, Y., and Cribb, M.: Analysis of cloud layer structure in Shouxian, China using RS92 radiosonde aided by 95 GHz cloud radar, J. Geophys. Res., 115, D00K30, https://doi.org/10.1029/2010JD014030, 2010.
Zhao, P., Xu, X., Chen, F., Guo, X., Zheng, X., Liu, L., Hong, Y., Li, Y., La, Z., Peng, H., Zhong, L., Ma, Y., Tang, S., Liu, Y., Liu, H., Li, Y., Zhang, Q., Hu, Z., Sun, J., Zhang, S., Dong, L., Zhang, H., Zhao, Y., Yan, X., Xiao, A., Wan, W., Liu, Y., Chen, J., Liu, G., Zhaxi, Y., and Zhou, X.: The Third Atmospheric Scientific Experiment for Understanding the Earth–Atmosphere Coupled System over the Tibetan Plateau and Its Effects, B. Am. Meteorol. Soc., 99, 757–776, https://doi.org/10.1175/BAMS-D-16-0050.1, 2018.
Zhao, W., Wang, Y., Bi, Y., Wu, X., Tian, Y., 2, Wu, L., Luo, J., Hu, X., Qi, Z., Li, J., Pan, Y., and Lyu, D.: Unveiling cloud vertical structures over the interior Tibetan Plateau through anomaly detection in synergetic lidar and radar observations, Adv. Atmos. Sci., 41, 2381–2398, https://doi.org/10.1007/s00376-024-3221-z, 2024.
Zhou, Y. and Ou, J.: The method of cloud vertical structure analysis using rawinsonde observation and its applied research, Meteor. Mon., 36, 50–58, https://doi.org/10.7519/j.issn.1000-0526.2010.11.008, 2010 (in Chinese).